Embed Size (px)
Citation preview

Company Presentation3Q 2018 Results
31 Oct 2018
Integrated Agribusiness with Leading Brands
2
Click to edit Master title style
11
22
Plantation Highlights Plantation Highlights
33
Financial Highlights Financial Highlights
44
Strategies and ExpansionStrategies and Expansion
AppendixAppendix
Presentation Outline
Integrated Agribusiness with Leading Brands
3
Click to edit Master title style
PlantationHighlights

Integrated Agribusiness with Leading Brands
4
Click to edit Master title stylePlanted Area
Oil Palm Average Age ≈ 16 years
15%2%
50%
33%
Immature 4-6 years 7-20 years > 20 years
247,789 Ha
In Ha30 Sep 2018
31 Dec2017
Indonesia - IntiPlanted Area 298,633 300,387
Planted Oil Palm 247,789 247,630- SIMP 152,453 152,008- Lonsum 95,336 95,622
Planted Other crops 50,844 52,757Rubber 17,519 19,869- SIMP 1,510 3,634- Lonsum 16,009 16,235Sugar cane - SIMP 13,146 12,618Others - timber, cocoa, tea 20,179 20,270
Indonesia - PlasmaOil Palm 86,382 86,182
Brazil Sugar cane - CMAA 83,710 49,204- Vale do Tijuco (UVT) 55,269 49,204- Vale do Pontal (UVP) 28,441 -
* CMAA acquired UVP in July 2018. Of the 83,710 Ha planted sugar cane, 45% owned by CMAA and 55% contracted 3rd party farmers

Integrated Agribusiness with Leading Brands
5
Click to edit Master title styleOil Palm Plantation Highlights
9M18 9M17YoY
Growth 3Q18 3Q17YoY
Growth FY17
PRODUCTION
Mature Area (Ha) 210,825 209,211 210,825 209,211 209,817
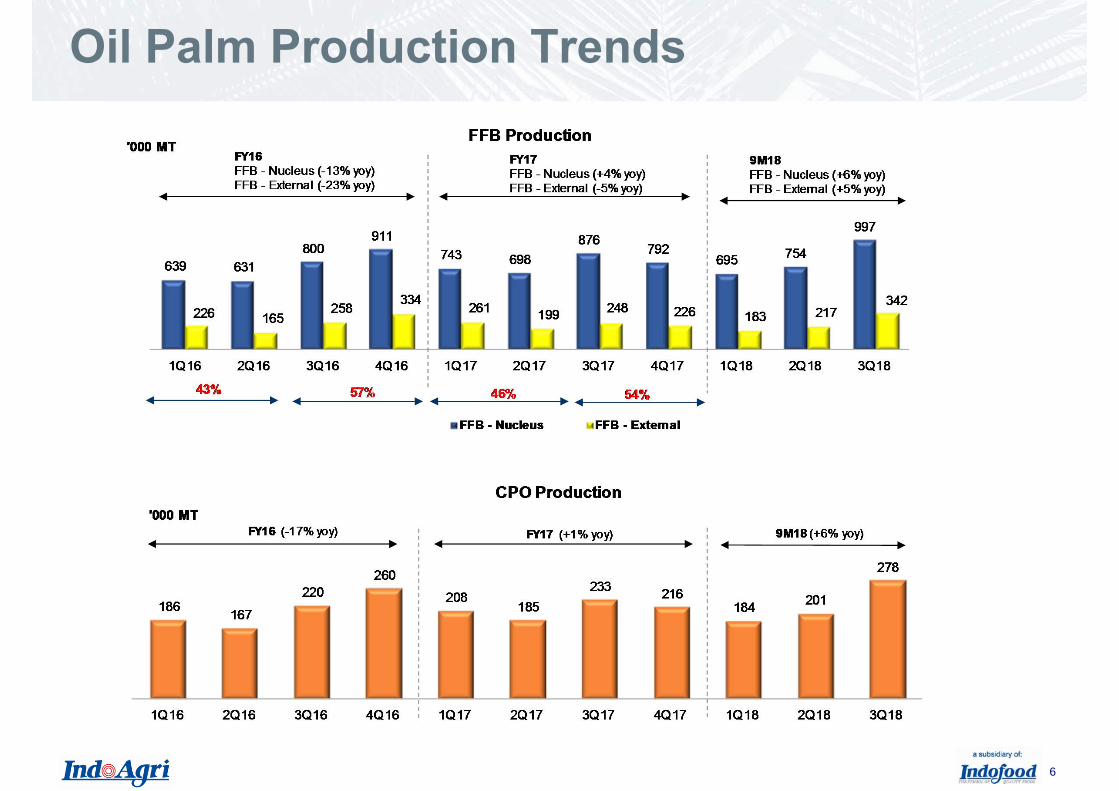
FFB ('000 MT) 3,188 3,025 5% 1,340 1,124 19% 4,043 - Nucleus ('000 MT) 2,446 2,317 6% 997 876 14% 3,109 - External ('000 MT) 742 708 5% 342 248 38% 934
CPO ('000 MT) 663 626 6% 278 233 20% 842
PK ('000 MT) 160 151 6% 67 57 18% 205
PRODUCTIVITY
FFB Yield – Nucleus (MT/Ha) 11.6 11.1 4.7 4.2 14.8
CPO Yield – Nucleus (MT/Ha) 2.6 2.4 1.0 0.9 3.2
CPO Extraction Rate (%) 22.0 21.8 21.9 21.7 21.9
PK Extraction Rate (%) 5.3 5.3 5.3 5.3 5.3
Integrated Agribusiness with Leading Brands
6
Click to edit Master title styleOil Palm Production Trends

Integrated Agribusiness with Leading Brands
7
Click to edit Master title styleSugar Plantation Highlights
(1) Harvested cane related to Komering sugar cane plantation
(2) CMAA acquired UVP in July 2018. Of the 83,710 Ha planted sugar cane, 45% owned by CMAA and 55% contracted 3rd party farmers
INDONESIA 9M18 9M17YoY
Growth 3Q18 3Q17YoY
Growth FY17
Planted Area (Ha) 13,146 11,751 13,146 11,751 12,618Sugar Cane Harvested (‘000 MT)(1) 606 618 (2%) 417 374 12% 639Sugar Production (‘000 MT) 52 51 1% 36 31 15% 54
- South Sumatra Plantation 42 41 2% 31 26 22% 44
- Java (LPI's share) 10 10 0% 4 5 (19%) 10
BRAZILApr 18- Sep 18
Apr 17- Sep 17
YoYGrowth
Planted Area (Ha)(2) 83,710 53,635
Sugar Cane Harvested (‘000 MT) 4,854 3,443 41%
Raw Sugar Production ('000 MT) 247 270 (9%)
Ethanol ('000 M3) 253 120 111%

Integrated Agribusiness with Leading Brands
8 8
FinancialHighlights

Integrated Agribusiness with Leading Brands
9 9
Results Summary
* Earnings before interests and tax expense, depreciation and amortisation, the effects of forex and changes in FV of biological assets
Financial HighlightsRevenue declined in 9M18 on lower sales contributionsfrom Plantation Division. This was partly offset by asolid 3Q sales growth of 24% at EOF Division.
Weak plantation results were due to lower sales volumeof CPO and PK products resulted from timing inshipment and soft commodity prices.
EBITDA declined 8% in 3Q18 and 23% in 9M18 mainlydue to lower contribution from Plantation Division.
The Group incurred net losses in 3Q18 and 9M18mainly due to weak plantation results and foreximpacts.
Operational HighlightsThe Group reported 2nd consecutive quarter of strongproduction recovery with FFB nucleus and CPOincreasing 14% and 20% over 3Q last year.
On year-to-date basis, both FFB nucleus and CPOproduction grew 6% yoy to 2,446,000 tonnes and663,000 tonnes, respectively.
Integrated Agribusiness with Leading Brands
10 10
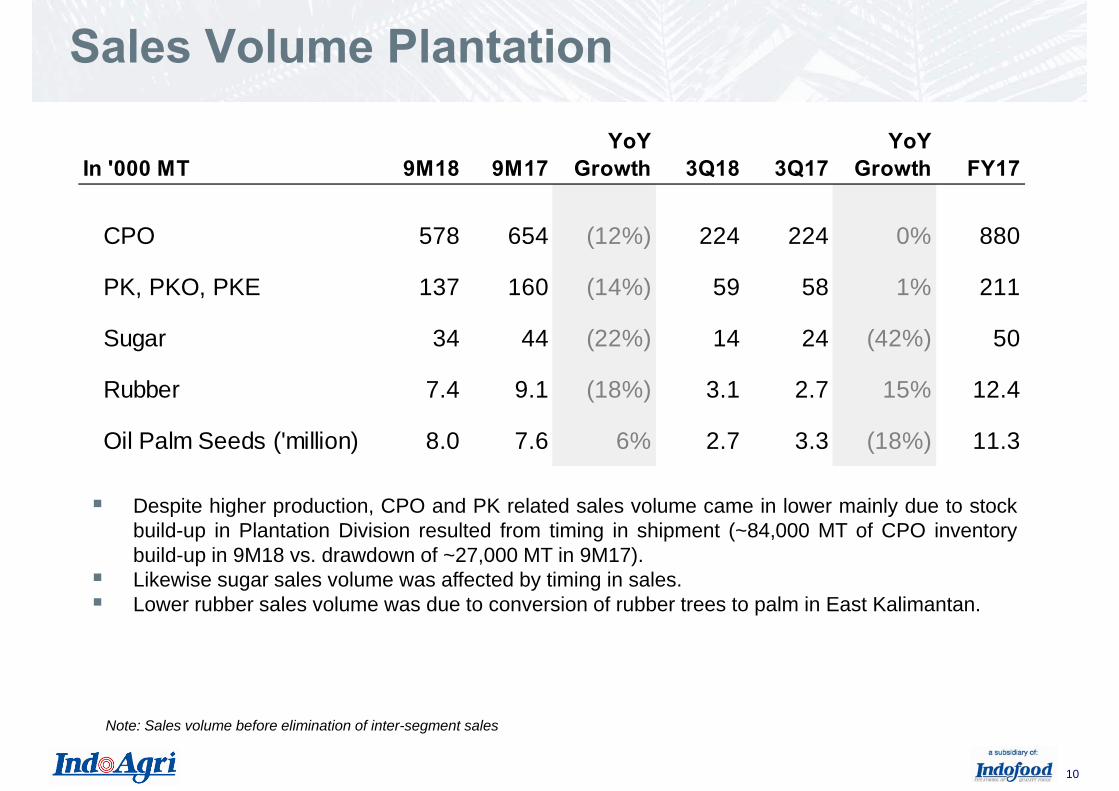
Sales Volume Plantation
Despite higher production, CPO and PK related sales volume came in lower mainly due to stockbuild-up in Plantation Division resulted from timing in shipment (~84,000 MT of CPO inventorybuild-up in 9M18 vs. drawdown of ~27,000 MT in 9M17).Likewise sugar sales volume was affected by timing in sales.Lower rubber sales volume was due to conversion of rubber trees to palm in East Kalimantan.
Note: Sales volume before elimination of inter-segment sales
In '000 MT 9M18 9M17YoY
Growth 3Q18 3Q17YoY
Growth FY17
CPO 578 654 (12%) 224 224 0% 880
PK, PKO, PKE 137 160 (14%) 59 58 1% 211
Sugar 34 44 (22%) 14 24 (42%) 50
Rubber 7.4 9.1 (18%) 3.1 2.7 15% 12.4
Oil Palm Seeds ('million) 8.0 7.6 6% 2.7 3.3 (18%) 11.3

Integrated Agribusiness with Leading Brands
11 11
Average Selling Price (ASP) Trend

Integrated Agribusiness with Leading Brands
12
Click to edit Master title styleFinancial Summary
(1) Earnings before interests and tax expense, depreciation and amortisation, the effects of forex and changes in FV of biological assets.(2) Earnings before the effects of forex, changes in FV of biological assets, changes in amortised cost of plasma receivables and one-off gain.
Revenue down 16% in 9M18 mainly due to timing in CPO stock realization and soft commodityprices (CPO -9%, PK -14%, rubber -19%).Gross profit declined in 3Q18 and 9M18 on the combined effects of lower sales volume and sellingprices of palm products, and higher palm production cost arising from wage inflation and fertiliserapplication.Net losses in 3Q18 and 9M18 were mainly due to soft plantation results. YTD results were furtheraffected by forex impacts. Core profit was Rp96 billion in 9M18, declining 83% over 9M17.
9M18 9M17YoY
Growth 3Q18 3Q17YoY
Growth FY17Sales 10,262 12,160 (16%) 3,706 3,685 1% 15,717Gross Profit 1,801 2,393 (25%) 624 718 (13%) 3,085
EBITDA(1) 1,892 2,454 (23%) 723 788 (8%) 3,088 Net (loss)/profit after tax (65) 522 n/m (18) 114 n/m 653 Core profit (2) 96 572 (83%) 23 102 (77%) 623
Attributable (loss)/profit (10) 370 n/m 9 101 (91%) 447 EPS (fully diluted) - Rp (7) 265 n/m 6 72 (92%) 320
Gross profit margin 18% 20% 17% 19% 20% EBITDA margin 18% 20% 20% 21% 20% Net profit margin (1%) 4% (0%) 3% 4% Attributable profit margin (0%) 3% 0% 3% 3%

Integrated Agribusiness with Leading Brands
13
Click to edit Master title styleSegmental Results
(1) Net effects arising from elimination of unrealised profit of inter-division inventories, SFRS adjustment and regional office costs.
In Rp Bn 9M18 9M17YoY
Growth 3Q18 3Q17YoY
Growth FY17Sales
Plantations 6,080 7,610 (20%) 2,243 2,521 (11%) 10,138
Edible Oil & Fats 7,943 7,736 3% 2,795 2,258 24% 10,305
Elimination & Adjustments (3,761) (3,186) 18% (1,332) (1,095) 22% (4,726)
Total 10,262 12,160 (16%) 3,706 3,685 1% 15,717
EBITDAPlantations 1,468 2,224 (34%) 525 712 (26%) 2,859
EBITDA % 24% 29% 23% 28% 28%Edible Oil & Fats 256 159 61% 128 12 955% 238
EBITDA % 3% 2% 5% 1% 2%Share of results of associate companies & JV 64 101 (36%) 42 68 (37%) 121
Elimination & Adjustments(1) 103 (30) n/m 29 (4) n/m (131)
Sub-total 1,892 2,454 (23%) 723 788 (8%) 3,087
Net Forex Loss (138) (2) n/m (39) (21) 83% (14)
Total 1,754 2,452 (28%) 684 766 (11%) 3,073
Integrated Agribusiness with Leading Brands
14
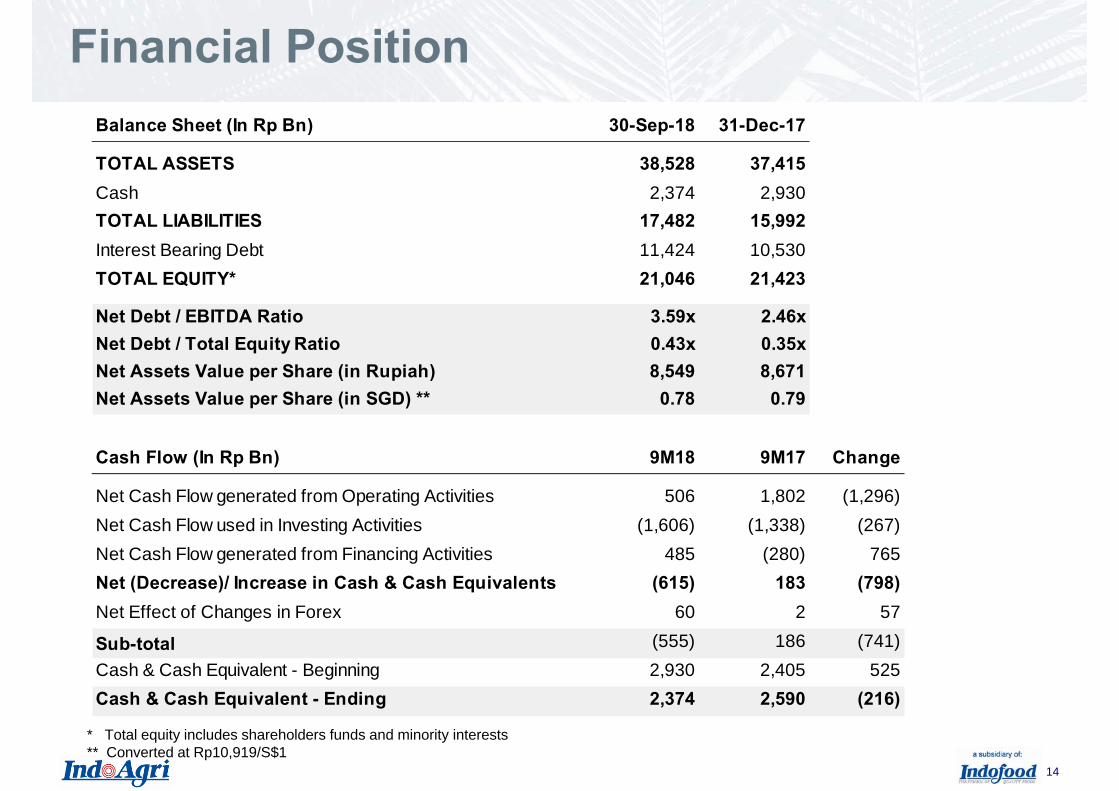
Click to edit Master title styleFinancial Position
* Total equity includes shareholders funds and minority interests** Converted at Rp10,919/S$1
Balance Sheet (In Rp Bn) 30-Sep-18 31-Dec-17
TOTAL ASSETS 38,528 37,415Cash 2,374 2,930TOTAL LIABILITIES 17,482 15,992Interest Bearing Debt 11,424 10,530TOTAL EQUITY* 21,046 21,423
Net Debt / EBITDA Ratio 3.59x 2.46xNet Debt / Total Equity Ratio 0.43x 0.35xNet Assets Value per Share (in Rupiah) 8,549 8,671Net Assets Value per Share (in SGD) ** 0.78 0.79
Cash Flow (In Rp Bn) 9M18 9M17 Change
Net Cash Flow generated from Operating Activities 506 1,802 (1,296)Net Cash Flow used in Investing Activities (1,606) (1,338) (267)Net Cash Flow generated from Financing Activities 485 (280) 765 Net (Decrease)/ Increase in Cash & Cash Equivalents (615) 183 (798)Net Effect of Changes in Forex 60 2 57
Sub-total (555) 186 (741)Cash & Cash Equivalent - Beginning 2,930 2,405 525 Cash & Cash Equivalent - Ending 2,374 2,590 (216)

Integrated Agribusiness with Leading Brands
15 15
Strategies andExpansion

Integrated Agribusiness with Leading Brands
16
Click to edit Master title styleKey Strategies in 2018Plantation
Expansion of milling facilities - target completion of a 45MT FFB/ hour millin Kalimantan in 2019.Replanting of 3,000 ha of older palms in North Sumatra and Riau.Started the construction of the chocolate factory in November 2017, withcommercial production scheduled for 2019.Expansion of sugar operations in Brazil− In Feb 2018 invested in 2nd Canapolis mill with 1.8m MT of cane crushing
capacity, together with 6,048 hectares of land. Target to bring the new mill intooperation in 2020, after completing the necessary cane plantings.
− In July 2018 acquired 3rd UVP mill with 2.5m MT of cane crushing capacity.− The combined annual cane crushing capacity for our 3 sugar and ethanol mills
is 8.3m MT. All mills are located in the state of Minas Gerais and in closeproximity to each other, forming a strong cluster enabling operating andmanagement synergies.
Edible Oils & Fats Expansion of Surabaya refinery has been completed and is operationalnow, increasing CPO refinery capacity by 300,000 MT per annum.

Integrated Agribusiness with Leading Brands
17 17
Appendix

Integrated Agribusiness with Leading Brands
18
Click to edit Master title styleProduction Breakdown9M18 9M17
YoYGrowth 3Q18 3Q17
YoYGrowth FY17
PRODUCTIONMature Area (Ha) 210,825 209,211 210,825 209,211 209,817 - SIMP (Ha) 123,430 123,494 123,430 123,494 124,100 - Lonsum (Ha) 87,395 85,717 87,395 85,717 85,717
FFB ('000 3,188 3,025 5% 1,340 1,124 19% 4,043 - Nucleus ('000 2,446 2,317 6% 997 876 14% 3,109 - SIMP ('000 MT) 1,361 1,370 (1%) 549 515 7% 1,830 - Lonsum ('000 MT) 1,085 946 15% 448 361 24% 1,279
- External ('000 742 708 5% 342 248 39% 934 - SIMP ('000 MT) 414 391 6% 193 140 38% 512 - Lonsum ('000 MT) 331 318 4% 150 108 38% 425
CPO ('000 663 626 6% 278 233 20% 842 - SIMP ('000 MT) 340 338 1% 142 125 13% 452 - Lonsum ('000 MT) 323 288 12% 136 108 26% 389
PK ('000 160 151 6% 67 57 18% 205 - SIMP ('000 MT) 73 72 1% 31 28 11% 99 - Lonsum ('000 MT) 87 79 10% 37 29 26% 106
PRODUCTIVITY
FFB Yield – Nucleus (MT/Ha) 11.6 11.1 4.7 4.2 14.8 - SIMP (MT/Ha) 11.0 11.1 4.4 4.2 14.7 - Lonsum (MT/Ha) 12.4 11.0 5.1 4.2 14.9
CPO Yield – Nucleus (MT/Ha) 2.6 2.4 1.0 0.9 3.2 - SIMP (MT/Ha) 2.3 2.3 0.9 0.9 3.1 - Lonsum (MT/Ha) 2.9 2.5 1.2 1.0 3.4
CPO Extraction Rate (%) 22.0 21.8 21.9 21.7 21.9 - SIMP (%) 21.2 21.0 21.0 20.7 21.0 - Lonsum (%) 23.0 22.8 22.8 23.0 22.9
PK Extraction Rate (%) 5.3 5.3 5.3 5.3 5.3 - SIMP (%) 4.6 4.5 4.5 4.5 4.6 - Lonsum (%) 6.2 6.2 6.1 6.2 6.3
Integrated Agribusiness with Leading Brands
19
Click to edit Master title style
Indofood Agri Resources Ltd.8 Eu Tong Sen Street#16-96/97 The Central
Singapore 059818Tel: +65 6557 2389
Fax: +65 6557 2387
www.indofoodagri.com
This presentation was prepared solely and exclusively for the parties presently being invited for the purpose ofdiscussion. Neither this presentation nor any of its content may be reproduced, disclosed or used without the priorwritten consent of Indofood Agri Resources Ltd.
This presentation may contain statements that convey future oriented expectations which represent the Company’spresent views on the probable future events and financial plans. Such views are presented on the basis of currentassumptions, are exposed to various risks, and are subject to considerable changes at any time. Presentedassumptions are presumed correct at the, and based on the data available on the, date at which this presentation isassembled. The Company warrants no assurance that such outlook will, in part or as a whole, eventually bematerialized. Actual results may diverge significantly from those projected.© Indofood Agri Resources Ltd. All rights reserved.
Contact Us