Embed Size (px)
Citation preview

© 2014 Aspen Technology, Inc. All rights reserved
1
President and CEO
May 15, 2014
Company Overview
Antonio Pietri

© 2014 Aspen Technology, Inc. All rights reserved
2
Safe Harbor Statement
These slides may contain forward-looking statements for purposes of the
safe harbor provisions of the Private Securities Litigation Reform Act of
1995. Actual results may vary significantly from AspenTech’s expectations
based on a number of risks and uncertainties, including, without limitation,
the risk factors described in AspenTech’s most recent Annual Report on Form
10-K and any subsequent quarterly reports on Form 10Q, each as filed with
the U.S. Securities and Exchange Commission. AspenTech cannot guarantee
any future results, levels of activity, performance, or achievements. Further,
AspenTech expressly disclaims any current intention to update any
forward-looking statements after the date hereof.
© 2014 Aspen Technology, Inc. All rights reserved
3
Multi-Billion Dollar TLCV Opportunity
Key Highlights
Market Leadership Position
World-Class Customer Base with Significant Upsell Opportunities
Subscription Model with Long-Term
Contracts
Focus on Driving Shareholder Value
Best-in-Class Profitability and
Cash Flow Generation

© 2014 Aspen Technology, Inc. All rights reserved
4
Global Market
Complex manufacturing processes
High capital costs
High volume production
$10 trillion global industries
Energy Chemicals Engineering & Construction
characteristics industry
Engineering and technology

© 2014 Aspen Technology, Inc. All rights reserved
5
Globalization
Volatility
Changing demographics
Energy Chemicals Engineering & Construction
Environmental and safety regulations
Focus on operational excellence
Industry Dynamics
© 2014 Aspen Technology, Inc. All rights reserved
6
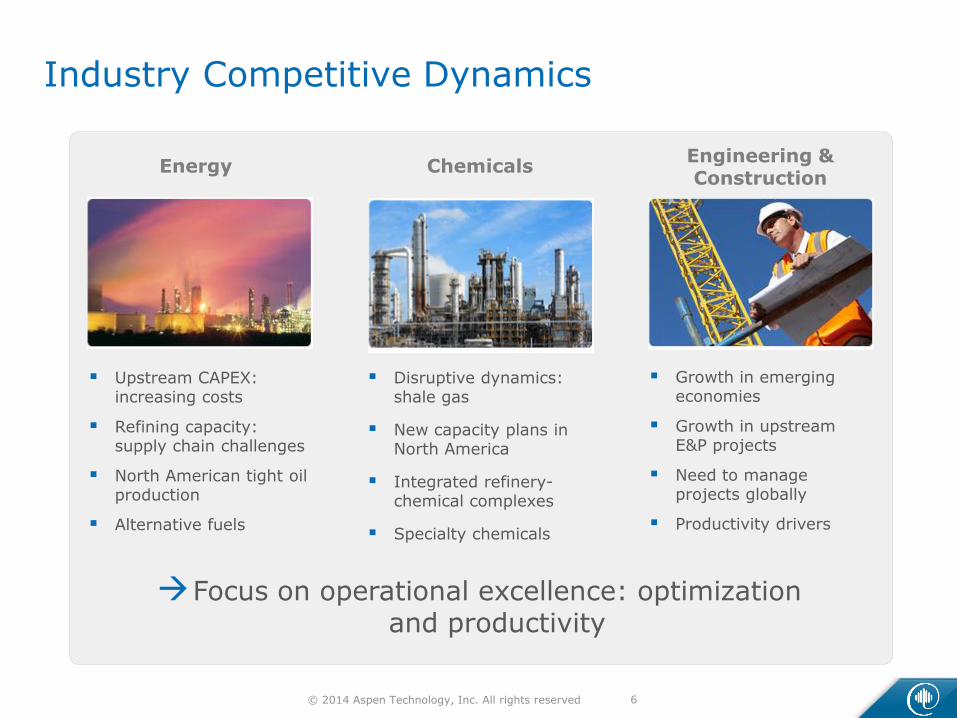
Industry Competitive Dynamics
Upstream CAPEX: increasing costs
Refining capacity: supply chain challenges
North American tight oil production
Alternative fuels
Energy
Disruptive dynamics: shale gas
New capacity plans in North America
Integrated refinery-chemical complexes
Specialty chemicals
Chemicals
Growth in emerging economies
Growth in upstream E&P projects
Need to manage projects globally
Productivity drivers
Engineering & Construction
Focus on operational excellence: optimization and productivity
© 2014 Aspen Technology, Inc. All rights reserved
7
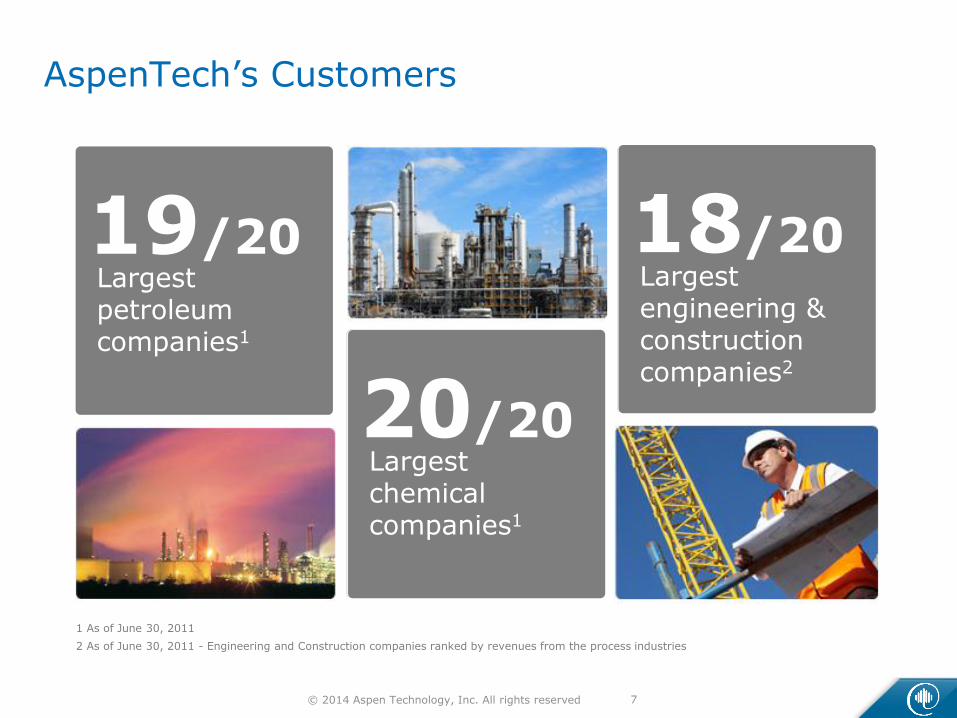
Energy
Largest petroleum companies1
19/20
AspenTech’s Customers
Chemicals
Engineering/ Construction
Largest chemical companies1
20/20
Largest engineering & construction companies2
18/20
1 As of June 30, 2011
2 As of June 30, 2011 - Engineering and Construction companies ranked by revenues from the process industries
© 2014 Aspen Technology, Inc. All rights reserved
8
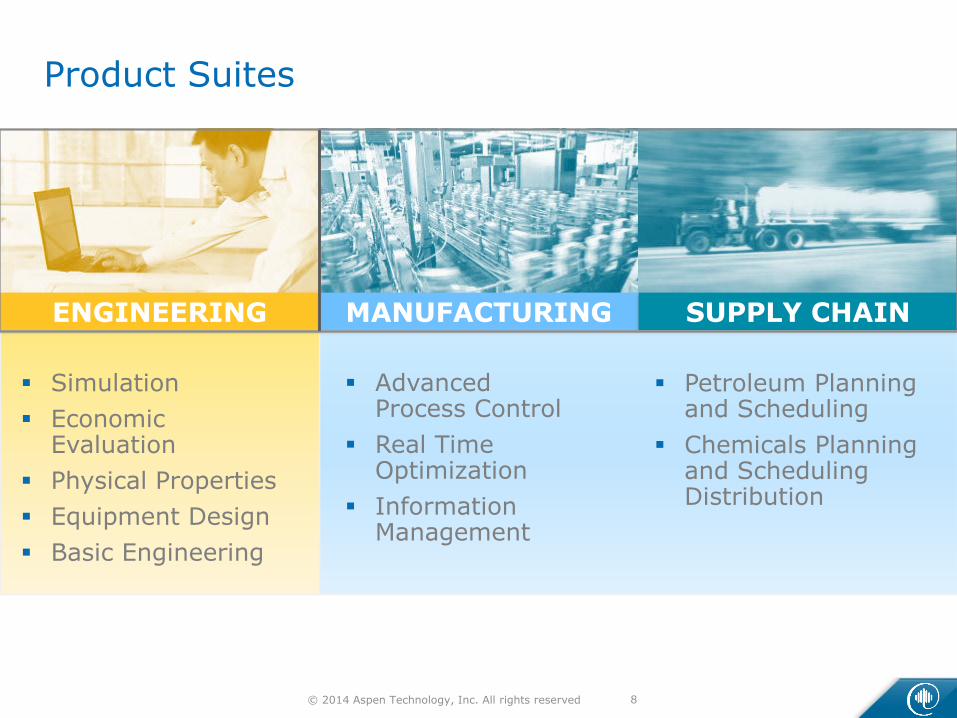
Product Suites
ENGINEERING MANUFACTURING SUPPLY CHAIN
Simulation
Economic Evaluation
Physical Properties
Equipment Design
Basic Engineering
Advanced Process Control
Real Time Optimization
Information Management
Petroleum Planning and Scheduling
Chemicals Planning and Scheduling Distribution
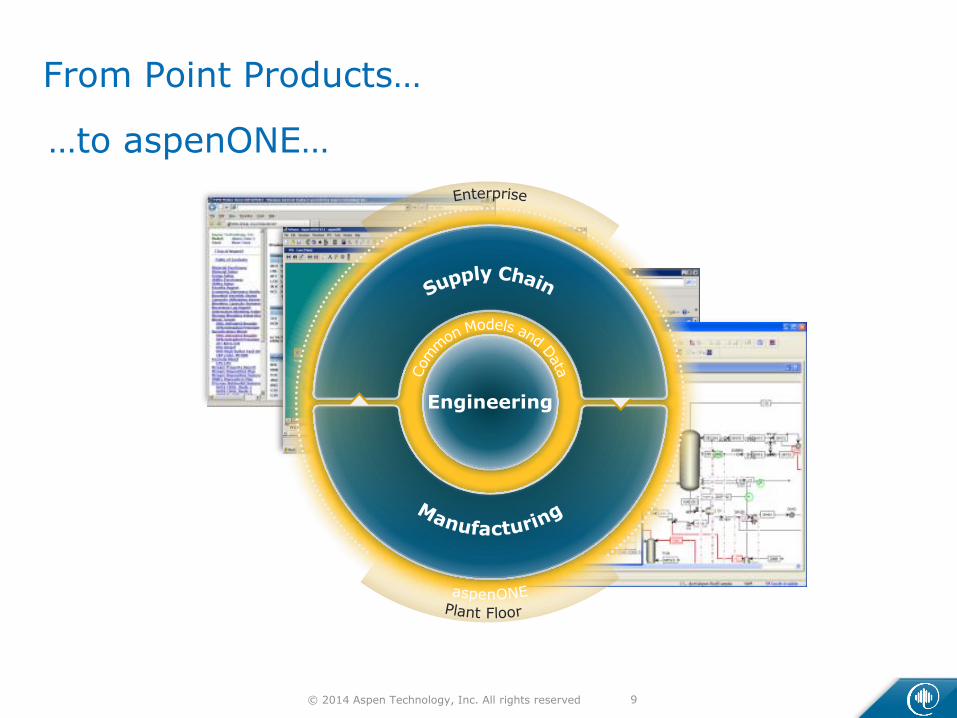
© 2014 Aspen Technology, Inc. All rights reserved
9
From Point Products…
…to aspenONE…
Engineering

© 2014 Aspen Technology, Inc. All rights reserved
10
Produce
Plan
Concept
Operations
Supply
Demand
Integrated Software
ENGINEERING MANUFACTURING SUPPLY CHAIN

© 2014 Aspen Technology, Inc. All rights reserved
11
…to aspenONE Collaboration
Engineering
Plant Planning &
Performance Mgmt
Plant Scheduling
Process Dev &
Conceptual Eng
Primary
Distribution Mgmt
Demand Mgmt
Production Tracking
Detailed Engineering
Basic Engineering
Regional Planning
Secondary
Distribution
Order Mgmt &
Execution
Operations
Plant Ops
& Planning

© 2014 Aspen Technology, Inc. All rights reserved
12
Why AspenTech?
2. Ref: Published article authored by WorleyParsons and AspenTech in Hydrocarbon Engineering Magazine, 2008, AspenTech Case Study, EPC Leader Adopts Integrated Engineering Solution to Drive Growth in Feed Business 2009, Multiple presentations at OPTIMIZE2009, 2010, 2011
4. Ref: Ecopetrol APC Programs: A Close Collaboration Francisco Trespalacios Vergara, Ecopetrol 2010 Aspen Global Conference, Boston, May 2010
3. Ref: ICIS Chemical Business, “Chemical firms lower energy use with new technologies”, 17 August 2009
5. Ref: Kumar KisJay, Essar Oil, based on a paper, Using PIMS-AO to Improve Business Processes, presented at the aspenONE Global Conference, May 3-5, 2010 in Boston, MA
1. Dr. Axel Polt, BASF (2004), “Paradigm Shifts in Process Simulation: SuccessStories in Day-to-Day Business”, presented at AspenWorld 2004
Control optimization for over 10 years
$14M Collaborative APC Rollout across refineries
$1,000M Manufacturing
$12M Improves processes and reduces feedstock cost by 10 c/bbl
Supply Chain
>$100M Engineering Capital and energy savings (10 – 30%)
20% Corporate energy savings

© 2014 Aspen Technology, Inc. All rights reserved
13
Why is AspenTech unique?
#1 global provider of optimization software solutions for the process industries
− Vertical focus
− Deep domain knowledge and expertise on hydrocarbon processes
− Large return on investment
− Mission critical solutions
Solve complex optimization problems
Breadth of solutions
Track record of innovation
Singular focus on software
© 2014 Aspen Technology, Inc. All rights reserved
14
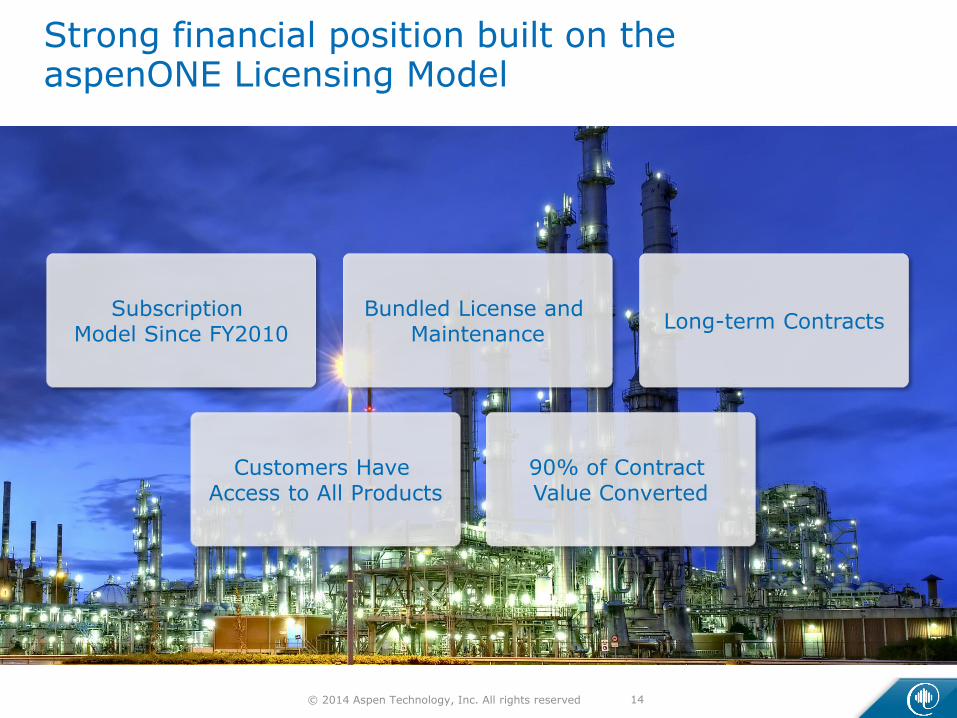
Subscription Model Since FY2010
Strong financial position built on the aspenONE Licensing Model
Bundled License and Maintenance
Long-term Contracts
Customers Have Access to All Products
90% of Contract Value Converted

© 2014 Aspen Technology, Inc. All rights reserved
15
Growth Strategy
Usage and Product Adoption

© 2014 Aspen Technology, Inc. All rights reserved
16
Usage and Product Adoption Strategy
Invest in High Growth Markets
Pursue Acquisitions
Product Innovation
Penetrate Customer
Base
Scale through Digital
Channels
Expand Total Addressable Market

© 2014 Aspen Technology, Inc. All rights reserved
17
Access Anywhere/ Anytime
Faster and Easier Implementation
Product Innovation
Automation of Knowledge Work
Breakthrough Innovations
Modern User Experience

© 2014 Aspen Technology, Inc. All rights reserved
18
Current Usage
− Activation
− Integrated workflow
− Search
− Analytics
− Visualization
− Easier to use
− New functionality
Penetrate Customer Base
Potential Usage

© 2014 Aspen Technology, Inc. All rights reserved
19
China
Latin America
Middle East
Russia
Inside Sales (SME)
− High productivity
− New customers
Invest in High Growth Markets

© 2014 Aspen Technology, Inc. All rights reserved
20
Hundreds of Thousands of Users
− Variety of skills, experience and business needs
Need to Distribute Specific Content to Key Segments
− Map and deliver targeted messages to each segment
Digital Channel Solutions are Scalable and Cost Effective
− Especially among global base of customers
Technology Trends Require Multi Channel Access
− Mobility and Collaboration
Deploying a Comprehensive Digital Strategy
Webinars
Social Media
Community
Blog Article Content
Discussion Forum Content
Resource Library Content
Website

© 2014 Aspen Technology, Inc. All rights reserved
21
market addressable total
Existing Customers
Current Usage

© 2014 Aspen Technology, Inc. All rights reserved
22
An effective way to drive shareholder value
− Four small tuck-in acquisitions in last 24 months
Buy versus make decision
Growth and profitability a key consideration
Continuously evaluating opportunities
Acquisitions
© 2014 Aspen Technology, Inc. All rights reserved
23
Total Addressable Market
AspenTech

© 2014 Aspen Technology, Inc. All rights reserved
24
Methodology
Pro
du
cts
Sites
Focus on top 350 accounts
Calculate whitespace by site and product for each account
Estimate revenue and TLCV potential for each
Total extrapolated to all accounts

© 2014 Aspen Technology, Inc. All rights reserved
25
Industry Growth
− 1-3% for Energy and Chemicals
− Up to 9% for Engineering
Price Increases
− 2% price escalation on average on term contracts
Product Innovations
− Example: Adaptive Process Control, Acid Gas Modeling
Acquisitions
− Examples: Solids Modeling, PSV Plus
Driving Expansion of Total Addressable Market
Existing Customers
Current Usage

© 2014 Aspen Technology, Inc. All rights reserved
26
AspenTech Current Usage
$1.8B
Competitors Current Usage*
$1.8B
$10.1B
market
Total License Contract Value (TLCV) $6.5B (Available TAM)
addressable total Potential
Total License Contract Value (TLCV)
* Estimated by AspenTech from internal white-space methodology on existing customer base

© 2014 Aspen Technology, Inc. All rights reserved
27
Existing Customers
Current Usage
$1.8B
Estimated TLCV from Pressure Relief Valve Sizing and Solids Modeling
− $100 Million
$6.5B
$300M $100M
Estimated TLCV from Adaptive Process Control
− $300 Million
through innovation
expanding TAM
AspenTech
$8.3B
(TLCV)
Examples

© 2014 Aspen Technology, Inc. All rights reserved
28
Usage and Product Adoption
Sales Leverage and Alignment
aspenONE Licensing Model
Large Installed Base Significant White Space
Sales Organization Productivity
High Growth Areas

© 2014 Aspen Technology, Inc. All rights reserved
29
Multi-Billion Dollar Market Opportunity
Conclusion: focus on execution
Market Leadership Position
World-Class Customer Base with Significant Upsell Opportunities
Subscription Model with Long-Term
Contracts
Shareholder Value Driven Focus
Best-in-Class Profitability and
Cash Flow Generation

© 2014 Aspen Technology, Inc. All rights reserved
30
One more point…

© 2014 Aspen Technology, Inc. All rights reserved
31
Announced relocation of headquarters from Burlington to Bedford, MA
− Effective November 1st 2014
Consolidating our Burlington, MA and Nashua, NH operations into one location:
− Co-location benefits in R&D and Product Management
Move to Bedford provides:
− Cost advantage over the life of 10-year lease versus co-location in Burlington location Lease cost (net of tenant allowance) of $8 million
One-time CAPEX costs associated with moving to Bedford impact cash-flow in Fiscal year 2015 of $7 to $8 million
New Corporate Headquarters – A one-time CAPEX event

© 2014 Aspen Technology, Inc. All rights reserved
32
Crosby Corporate Center Bedford, MA
200 Wheeler Rd. Burlington, MA

© 2014 Aspen Technology, Inc. All rights reserved
33
Thank you
© 2014 Aspen Technology, Inc. All rights reserved
1
Chief Financial Officer
May 15, 2014
Financial Review
Mark Sullivan

© 2014 Aspen Technology, Inc. All rights reserved
2
Financial Highlights
Subscription-based revenue model
Towards end of 5th year of a 6 year transition
Multi-year history of growing license contract value
Best in class financials
Growing cash flow and strong balance sheet
Returning capital to shareholders via share repurchase
Strong FY 2014 performance and outlook for FY 2015

© 2014 Aspen Technology, Inc. All rights reserved
3
Revenue Model Transition aspenOne Licensing Model Introduced at Beginning of FY ‘10
$ Millions
* Includes professional services, training and other revenue

© 2014 Aspen Technology, Inc. All rights reserved
4
Revenue Model Transition Coming to Completion
From FY2009 to 2010, GAAP revenue decreased almost 50% as a result of the business model change
From FY2010-2014, GAAP revenue and deferred revenue growth rates significantly exceeded the growth rates of TLCV and Annual Spend
FY2015 is the final year of the 6-year transition
Transition timeframe due to contract durations at end of FY2009
After FY2015, GAAP revenue and deferred growth rates will no longer be impacted by revenue model transition

© 2014 Aspen Technology, Inc. All rights reserved
5
FY ‘14 & ‘15 Revenue Guidance
$ Millions

© 2014 Aspen Technology, Inc. All rights reserved
6
FY ‘14 & ‘15 Revenue Guidance
$ Millions
26%
14%

© 2014 Aspen Technology, Inc. All rights reserved
7
Total Term Contract Value (TCV)
$ Billions
Represents the estimated renewal
value of all active term license
contracts
Provides financial stability and
predictability
• Typically 5-6 year contracts
• Annual escalation
• High renewal rates

© 2014 Aspen Technology, Inc. All rights reserved
8
Term License Contract Value (TLCV) Year over Year Growth

© 2014 Aspen Technology, Inc. All rights reserved
9
Annual Spend(1) Year over Year Growth
(1) Annual spend is a proxy for the annualized subscription and software revenue associated with the term license business. Represents the aggregate annualized license and maintenance invoice value for all active term contracts.

© 2014 Aspen Technology, Inc. All rights reserved
10
Free Cash Flow(1)
$ Millions
FCF Per Share2
$0.61 $0.37 $1.04 $1.50 $1.81-$1.87
YTD Q3 FY’14
¹ Free cash flow is cash flow from operations less (1) purchases of property, equipment and leasehold improvements and (2) capitalized software development costs, plus non-capitalized acquired technology. FY ’13 also includes insurance proceeds. 2 Diluted shares outstanding are estimates for FY 2010 – FY 2012 and FY 2014
143
170 - 175
© 2014 Aspen Technology, Inc. All rights reserved
11
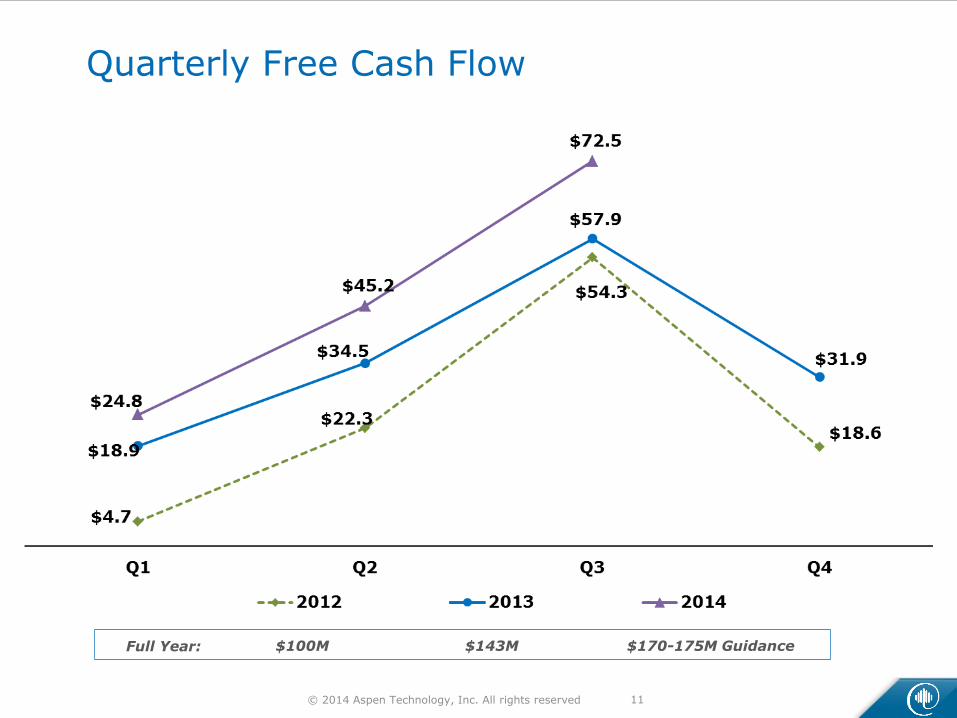
Quarterly Free Cash Flow
$ Millions
$100M $143M $170-175M Guidance Full Year:

© 2014 Aspen Technology, Inc. All rights reserved
12
Stock Repurchase Plan

© 2014 Aspen Technology, Inc. All rights reserved
13
Expense Management GAAP & Non-GAAP Total Costs
$ Millions

© 2014 Aspen Technology, Inc. All rights reserved
14
Expense Trends
$ Millions

© 2014 Aspen Technology, Inc. All rights reserved
15
Target Long Term Operating Model
Current
Revenue 100%
Gross Margin 83-85%
Sales & Marketing 24-26%
Research & Development
14-15%
General & Administrative
12-13%
GAAP Operating Expenses
50-53%
GAAP Operating Margin
30-35%
Non-GAAP Operating Margin
33-38%
GAAP Non-GAAP

© 2014 Aspen Technology, Inc. All rights reserved
16
Target Long Term Operating Model
Current Updated
Revenue 100% 100%
Gross Margin 83-85% 87-90%
Sales & Marketing 24-26% 22-24%
Research & Development
14-15% 14-15%
General & Administrative
12-13% 9-10%
GAAP Operating Expenses
50-53% 47-49%
GAAP Operating Margin
30-35% 40-43%
Non-GAAP Operating Margin
33-38% 42-45%
GAAP Non-GAAP

© 2014 Aspen Technology, Inc. All rights reserved
17
Revenue Model Transition Impact on Taxes
Revenue recognition for GAAP and Tax accounting is comparable
Contributed to pretax losses from FY2010-2012
But losses for tax purposes exceeded GAAP losses due to differences in accounting for stock compensation expense
When stock prices rise, tax expense from stock compensation exceeds GAAP expense
Incremental tax expense/deduction/tax benefit isn’t included on the balance sheet as a deferred tax asset (DTA)
Disclosed annually in the tax footnote as additional paid-in capital (APIC) NOL
We have tax benefits in excess of our balance sheet DTA’s and don’t expect to become US corporate taxpayer until FY2016, based on current projected results

© 2014 Aspen Technology, Inc. All rights reserved
18
APIC NOL Illustrative Example
*
* Stock price as of 5/12/2014

© 2014 Aspen Technology, Inc. All rights reserved
19
APIC NOL Illustrative Example GAAP Cost Basis established on grant date
*
* Stock price as of 5/12/2014
Annual Grant 8/1/10: RSU @ $10.93 Option @ $4.54

© 2014 Aspen Technology, Inc. All rights reserved
20
APIC NOL Illustrative Example Tax Cost Basis established on vest/exercise date
*
* Stock price as of 5/12/2014
12/31/13 Value: $41.80
RSU Vest Option Exercise
Annual Grant 8/1/10: RSU @ $10.93 Option @ $4.54

© 2014 Aspen Technology, Inc. All rights reserved
21
APIC NOL Illustrative Example Calculation
*
* Stock price as of 5/12/2014
Annual Grant 8/1/10: RSU @ $10.93 Option @ $4.54
Calculation RSU Option
12/31/13 Value $41.80 $41.80
Exercise Price ($10.93)
IRS Expense Basis $41.80 $30.87
GAAP Expense Basis ($10.93) ($4.54)
APIC NOL $30.87 $26.33
12/31/13 Value: $41.80 RSU Vest
Option Exercise

© 2014 Aspen Technology, Inc. All rights reserved
22
Tax Attributes
IRS
Net Operating Losses (NOLs)
Foreign Tax Credits
R&D Tax Credits
GAAP
Regular NOLs
Foreign Tax Credits
R&D Tax Credits
APIC NOLs

© 2014 Aspen Technology, Inc. All rights reserved
23
Value of Tax Attributes(1) expected to be utilized As of 3/31/14 (Q3 FY 14)
GAAP
Regular NOLs
Foreign Tax Credits
R&D Tax Credits
APIC NOLs
On Balance Sheet
Off Balance Sheet
$32M
$45M
(1) Tax attributes are presented on a tax-effected basis

© 2014 Aspen Technology, Inc. All rights reserved
24
Regular vs. APIC NOLs Impact on GAAP Cash Flow Statement
ILLUSTRATIVE CASH FLOW STATEMENT
($000's)
Regular NOLs APIC NOLs
Net Income 100,000 100,000
Deferred Income Taxes 30,000 -
Other non-cash operating activities 10,000 10,000
Source/(Use) of Working Capital - -
Cash Flow From Operating Activities 140,000 110,000
Cash Provided by/(Used in) Investing Activities
Purchase of fixed assets (4,000) (4,000)
Software Development Costs (1,000) (1,000)
Cash Provided by/(Used in) Investing Activities (5,000) (5,000)
Cash Provided by/(Used in) Financing Activities
Excess tax benefits from stock-based compensation - 30,000
Cash Provided by/(Used in) Financing Activities 0 30,000
Change in Cash, End of Period 135,000 135,000

© 2014 Aspen Technology, Inc. All rights reserved
25
Tax Status - Recap
Don’t expect to become US corporate cash taxpayer until FY2016, based on current projected results
GAAP requires differentiation between “Regular and APIC” NOLs
GAAP treats the value of the APIC deduction like an issuance of stock
Treated as a financing source of cash on GAAP cash flow statement
Will impact FY2014 to FY2015 GAAP cash flow comparisons
We will report non-GAAP cash flow metrics in FY2015 to show cash flow on historically comparable basis
All tax expenses/benefits, irrespective of source, will flow through operating cash flow

© 2014 Aspen Technology, Inc. All rights reserved
26
FY 15:
Will continue to provide:
TLCV growth guidance
TLCV/TCV and Annual Spend reported quarterly
FY 16 (preliminary):
Will provide:
Annual Spend growth guidance
Annual Spend reported quarterly
TLCV/TCV on milestone basis or at year-end
Non-GAAP Metrics

© 2014 Aspen Technology, Inc. All rights reserved
27
FY 2015 Guidance

© 2014 Aspen Technology, Inc. All rights reserved
28
FY ‘15 Free Cash Flow(1) Guidance
$ Millions
FCF Per Share2
¹ Free cash flow is cash flow from operations less (1) purchases of property, equipment and leasehold improvements and (2) capitalized software development costs, plus non-capitalized acquired technology. FY ’13 also includes insurance proceeds. 2 Diluted shares outstanding are estimates for FY 2010 – FY 2012 and FY 2014 – FY 2015 3 Based on projected results as of 5/15/14
$0.61 $0.37 $1.04 $1.50 $1.81-$1.87 $2.05-$2.10
APIC NOL
($35-40M)3
Includes $7-8M capital expense related to new headquarter
building

© 2014 Aspen Technology, Inc. All rights reserved
29
FY ‘14 & ‘15 Guidance
(1)Guidance assumes 93.7M & 92.8M weighted average diluted shares outstanding for FY ‘14 and FY ‘15 respectively
$Million except per share
License TCV Growth 11% or Better Double digit range
Free Cash Flow 170 - 175 190-195
Total Revenue 385 - 387 430-440
Subscription & Software % of Revenue ~ 90% > 90%
Total GAAP Expense 264 - 267 280 - 285
Operating Income 119 - 121 147 - 157
Operating Margin 31% 35%
Net Income 75 - 77 93 - 100
Net Income per share $.80 - $.82 $1.01 - $1.08
Non-GAAP Operating Income 138 - 141 164 - 174
Non-GAAP Net Income per share $.94 - $.96 $1.12 - $1.19
FY '15 Full Year
Guidance (1)
Proposed
FY '14 Full Year
Guidance (1)

© 2014 Aspen Technology, Inc. All rights reserved
30
Multi-Billion Dollar Market Opportunity
Market Leadership Position
World-Class Customer Base with Significant Upsell Opportunities
Subscription Model with Long-Term Contracts
Shareholder Value Driven Focus
Best-in-Class Profitability and Cash Flow Generation
Conclusion and Q&A