Embed Size (px)
Citation preview

Company Information
Directors’ Review
Condensed Interim Balance Sheet
2
3
4
5
6
7
8
9
10
Auditors’ Report to the Members
Condensed Interim Profi t and Loss Account
Condensed Interim Statement of Comprehensive Income
Condensed Interim Statement of Changes in Equity
Condensed Interim Cash F low Statement
Selected Explanatory Notes to the Financial Information
CONTENTS
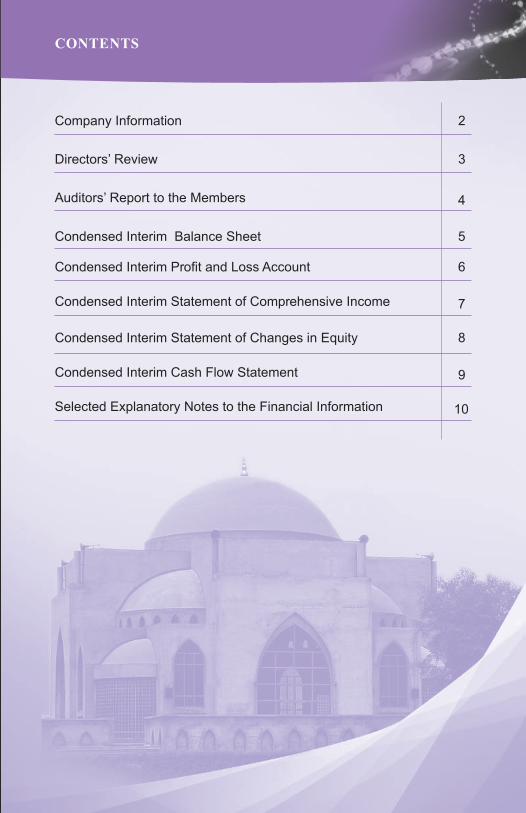
Board of Directors
Chairman Haji Bashir Ahmed Chief Executive Officer Mr. Muhammad Adrees Directors Mr. Imran Ghafoor Mr. Haseeb Ahmed Mr. Muhammad Khalil Mr. Ijaz Hussain Mr. Mazhar Ali Khan
Company Secretary Mr. Mazhar Ali Khan
Chief Financial Offi cer Mr. Anwar-ul-Haq (FCA)
Audit Committee Chairman Mr. Imran Ghafoor Members Mr. Haji Bashir Ahmed Mr. Muhammad Khalil
Head of Internal Audit Mr. Zakir Hussain (ACA) Auditors M/s M.Yousuf Adil Saleem & Co. Chartered Accountants Legal Advisor Mr. Sahibzada Muhammad Arif
Bankers Meezan Bank Limited National Bank of Pakistan Allied Bank Limited United Bank Limited Bank Alfalah Limited Dubai Islamic Bank Pakistan Limited The Bank of Punjab MCB Bank Limited Standard Chartered Bank Pakistan Limited First Habib Bank Modaraba Saudi Pak Industrial and Agricultrual Investment Co. (Pvt.) Limited Al-Baraka Islamic Bank B.S.C. (E.C.) Askari Commercial Bank Limited Faysal Bank Limited Habib Bank Limited Burj Bank Limited Bank Islami Pakistan Limited Barclays Bank PLC Pakistan Pak Oman Investment Company Limited Silk Bank Limited Summit Bank Ltd. (formaly Arif Habib Bank Ltd) Habib Metropolitan Bank Limited Bank Al-Habib Limited Soneri Bank Ltd. Registered Offi ce 601-602 Business Centre, Mumtaz Hasan Road, Karachi- 74000
Factories 28/32 KM, Faisalabad - Sheikupura Road, Faisalabad.
02
COMPANY INFORMATION
03
DIRECTORS’ REVIEW
With the grace of Almighty Allah expectations of our stake holders came true and we pleased to share with you the marvelous performance of your Company by presenting the accounts for the half year ended December 31, 2012 and limited review report issued by our Auditors.
Although sluggish economic growth, deteriorating Pak Rupees VS all major international currencies, inflation, energy crises and worsening law and order situation continued to put challenges to our organization , however, by the great help of Almighty Allah, your Company proved its abilities to cope with uncertain situations through better management, cost controlling and best marketing strategies. Continuity of the efficient stratagem chalked out by the management, collective team efforts of the employees and support of other stake holders whereby every member understands significance of its role are the basic principles we are achieving milestones one after the other.
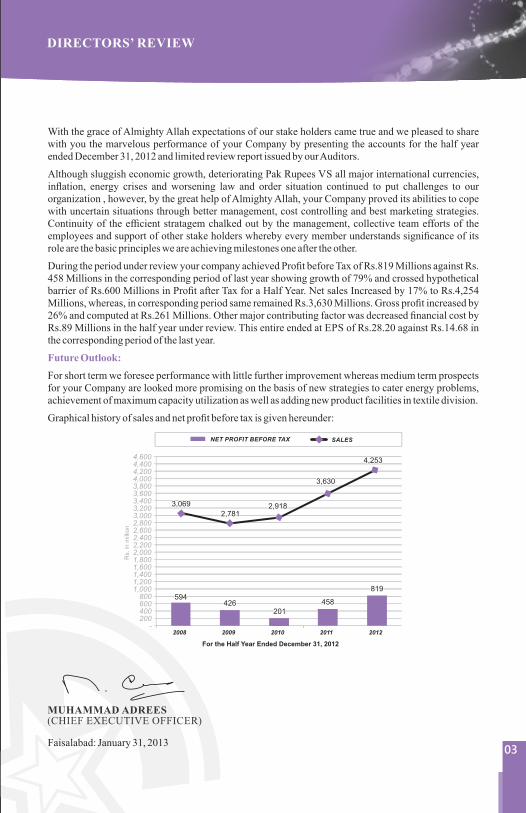
During the period under review your company achieved Profit before Tax of Rs.819 Millions against Rs. 458 Millions in the corresponding period of last year showing growth of 79% and crossed hypothetical barrier of Rs.600 Millions in Profit after Tax for a Half Year. Net sales Increased by 17% to Rs.4,254 Millions, whereas, in corresponding period same remained Rs.3,630 Millions. Gross profit increased by 26% and computed at Rs.261 Millions. Other major contributing factor was decreased financial cost by Rs.89 Millions in the half year under review. This entire ended at EPS of Rs.28.20 against Rs.14.68 in the corresponding period of the last year.
Future Outlook:
For short term we foresee performance with little further improvement whereas medium term prospects for your Company are looked more promising on the basis of new strategies to cater energy problems, achievement of maximum capacity utilization as well as adding new product facilities in textile division.
Graphical history of sales and net profit before tax is given hereunder:
Faisalabad: January 31, 2013
594594594426 426 426
201 201 201
458 458 458
819 819 819
- 200 400 600 800
1,000 1,200 1,400 1,600 1,800 2,000 2,200 2,400 2,600 2,800 3,000 3,200 3,400 3,600 3,800 4,000 4,200 4,400 4,600
2008 2009 2010 2011 2012
Rs. in
mill
ion
For the Half Year Ended December 31, 2012
NET PROFIT BEFORE TAX SALES
3,0693,0693,069
2,7812,7812,7812,9182,9182,918
3,6303,6303,630
4,2534,2534,253
MUHAMMAD ADREES (CHIEF EXECUTIVE OFFICER)

Introduction
We have reviewed the accompanying condensed interim balance sheet of Sitara Chemical Industries Limited as at December 31, 2012, and the related condensed interim profit and loss account, condensed interim statement of comprehensive income, condensed interim cash flow statement, condensed interim statement of changes in equity and notes to the accounts for the six months period then ended (here-in-after referred to as “the interim financial information”). Management is responsible for the preparation and presentation of this interim financial information in accordance with approved accounting standards as applicable in Pakistan for interim financial reporting. Our responsibility is to express a conclusion on this interim financial information based on our review. The figures of the condensed interim profit and loss account and condensed interim statement of comprehensive income for the quarters ended December 31, 2012 and December 31, 2011 have not been reviewed, as we are required to review only the cumulative figures for the six months ended December 31, 2012.
Scope of Review
We conducted our review in accordance with the International Standard on Review Engagements 2410, “Review of Interim Financial Information Performed by the Independent Auditor of the Entity”. A review of interim financial information consists of making inquiries, primarily of the person responsible for financial and accounting matters, and applying analytical and other review procedures. A review is substantially less in scope than an audit conducted in accordance with International Standards on Auditing and consequently does not enable us to obtain assurance that we would become aware of all significant matters that might be identified in an audit. Accordingly, we do not express an audit opinion.
Conclusion
Based on our review, nothing has come to our attention that causes us to believe that the accompanying interim financial information as of and for the six months ended December 31, 2012 is not prepared in all material respects, in accordance with the approved accounting standards as applicable in Pakistan for interim financial reporting.
Chartered Accountants Engagement Partner : Talat Javed
Date: January 31, 2013Lahore
AUDITORS’ REPORT TO THE MEMBERS ON REVIEW OF
FINANCIAL INFORMATION
04

05
NON - CURRENT ASSETS
Property, plant and equipment 4 6,307,670 6,339,937Investment property 5 2,823,189 2,820,036Long-term investments 57,039 67,608Long-term loans and advances 6 837,466 827,493Long-term deposits 110,312 110,297
10,135,676 10,165,371
CURRENT ASSETS
Stores, spare parts and loose tools 365,365 366,962Stock-in-trade 1,116,039 902,721Trade debts 7 1,227,040 796,203Loans and advances 293,307 132,415Trade deposits and short-term prepayments 7,718 6,680Other receivables 8 37,074 9,079Other financial assets 138,180 116,179Advance income tax 167,467 305,188Cash and bank balances 269,942 79,862
3,622,132 2,715,289
13,757,808 12,880,660
SHARE CAPITAL AND RESERVES
Share capital 9 214,294 214,294Reserves 1,359,602 1,338,984Un-appropriated profits 3,324,153 2,849,608
4,898,049 4,402,886
SURPLUS ON REVALUATION OF PROPERTY, PLANT AND EQUIPMENT 1,420,262 1,466,066
NON - CURRENT LIABILITIES
Long-term financing 10 993,126 1,334,776Long-term deposits 12,200 12,200Deferred liabilities 1,600,230 1,385,030
2,605,556 2,732,006
CURRENT LIABILITIES
Trade and other payables 11 2,341,808 1,522,591Profit / financial charges payable 75,071 92,938Short term borrowings 1,651,512 1,544,904Current portion of long term financing 735,800 862,779Sales tax payable 29,750 16,069Income tax - net of advance tax - 240,421
4,833,941 4,279,702
CONTINGENCIES AND COMMITMENTS 12 13,757,808 12,880,660
The annexed selected notes 1 to 21 form an integral part of this condensed interim financial information.
Note December 31,
2012 Un-Audited (Rupees in thousand)
June 30, 2012
Audited
CONDENSED INTERIM BALANCE SHEET (UN-AUDITED)
AS AT DECEMBER 31, 2012
MUHAMMAD ADREES (CHIEF EXECUTIVE OFFICER)
HASEEB AHMED(DIRECTOR)
CONDENSED INTERIM PROFIT AND LOSS ACCOUNT
(UN-AUDITED)
FOR THE SIX MONTHS ENDED DECEMBER 31, 2012
Note
(Rupees in thousand)
December 31, 2012
December 31, 2011
Three months ended
December 31, 2012
December 31, 2011
Six months ended
06 MUHAMMAD ADREES (CHIEF EXECUTIVE OFFICER)
HASEEB AHMED(DIRECTOR)
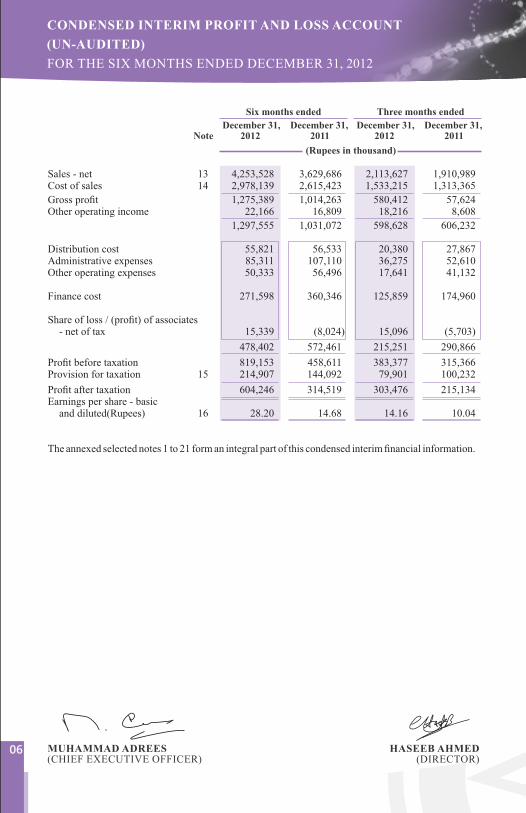
Sales - net 13 4,253,528 3,629,686 2,113,627 1,910,989Cost of sales 14 2,978,139 2,615,423 1,533,215 1,313,365
Gross profit 1,275,389 1,014,263 580,412 57,624Other operating income 22,166 16,809 18,216 8,608
1,297,555 1,031,072 598,628 606,232
Distribution cost 55,821 56,533 20,380 27,867Administrative expenses 85,311 107,110 36,275 52,610Other operating expenses 50,333 56,496 17,641 41,132
Finance cost 271,598 360,346 125,859 174,960
Share of loss / (profit) of associates - net of tax 15,339 (8,024) 15,096 (5,703)
478,402 572,461 215,251 290,866
Profit before taxation 819,153 458,611 383,377 315,366Provision for taxation 15 214,907 144,092 79,901 100,232
Profit after taxation 604,246 314,519 303,476 215,134Earnings per share - basic and diluted(Rupees) 16 28.20 14.68 14.16 10.04
The annexed selected notes 1 to 21 form an integral part of this condensed interim financial information.

07
CONDENSED INTERIM STATEMENT OF
COMPREHENSIVE INCOME (UN-AUDITED)
FOR THE SIX MONTHS ENDED DECEMBER 31, 2012
(Rupees in thousand)
December 31, 2012
December 31, 2011
Three months ended
December 31, 2012
December 31, 2011
Six months ended
MUHAMMAD ADREES (CHIEF EXECUTIVE OFFICER)
HASEEB AHMED(DIRECTOR)
Profit after taxation 604,246 314,519 303,476 215,134
Other comprehensive income for the period - net of tax
Gain on re-measurement of available for sale financial assets 21,291 6,947 21,415 6,814 Gain realized on sale of available for sale financial assets during the period (206) (300) (206) (92)
Share of other comprehensive income of associate (467) (26) (467) (8)
20,618 6,621 20,742 6,714Total comprehensive income for the period 624,864 321,140 324,218 221,848
The annexed selected notes 1 to 21 form an integral part of this condensed interim financial information.

08
Res
erve
sC
apit
al R
even
ue
Sh
are
Cap
ital
S
har
e P
rem
ium
Res
erve
on
re-
mea
sure
men
t of
av
aila
ble
for
sa
le i
nve
stm
ents
Sh
are
of o
ther
co
mp
reh
ensi
ve
inco
me
of
asso
ciat
e
Gen
eral
Res
erve
Un
-A
pp
rop
riat
ed
Pro
fit
Tot
al
Bal
ance
as
at J
uly
01, 2
011
214,
294
97,4
90
9,7
17
5
1,22
5,00
0 2
,239
,905
3,
572,
117
3,78
6,41
1T
otal
com
preh
ensi
ve i
ncom
eP
rofi
t fo
r th
e si
x m
onth
s en
ded
Dec
embe
r 31
, 201
1 -
-
-
-
-
314
,519
3
14,5
19
314
,519
Gai
n on
re-
mea
sure
men
t of
ava
ilab
le f
or
sale
fina
ncia
l as
sets
-
-
6,9
47
-
-
-
6
,947
6
,947
Gai
n r
eali
zed
on s
ale
of a
vail
able
for
sal
e fi
nanc
ial
asse
ts
duri
ng t
he p
erio
d -
-
(
300)
-
-
-
(30
0)
(30
0)S
hare
of
othe
r co
mpr
ehen
sive
inc
ome
of a
ssoc
iate
-
-
-
(26
) -
-
(
26)
(26
)
-
-
6
,647
(
26)
-
3
14,5
19
321
,140
3
21,1
40T
rans
fer
to u
n-ap
prop
riat
ed p
rofi
t on
acc
ount
of
in
crem
enta
l de
prec
iati
on
-
-
-
-
-
24,
945
2
4,94
5
24,
945
Dis
trib
uti
on t
o ow
ner
s
Fin
al d
ivid
end
for
the
year
end
ed J
une
30, 2
011
-
-
-
-
-
(
133,
934)
(
133,
934)
(
133,
934)
Bal
ance
as
at D
ecem
ber
31,
201
1 2
14,2
94
97,
490
1
6,36
4
(21
) 1
,225
,000
2
,445
,435
3
,784
,268
3
,998
,562
Bal
ance
as
at J
uly
01,
201
2
214
,294
9
7,49
0
16,
494
-
1,2
25,0
00
2,8
49,6
08
4,1
88,5
92
4,4
02,8
86
Tot
al c
omp
reh
ensi
ve i
nco
me
P
rofi
t fo
r th
e si
x m
onth
s en
ded
Dec
embe
r 31
, 201
2 -
-
-
-
-
604
,246
6
04,2
46
604
,246
G
ain
on r
e-m
easu
rem
ent
of a
vail
able
for
sal
e
fi
nanc
ial
asse
ts
-
-
21,
291
-
-
-
21,
291
2
1,29
1
Gai
n r
eali
zed
on s
ale
of
avai
labl
e fo
r sa
le fi
nanc
ial
asse
ts d
urin
g th
e pe
riod
-
-
(
206)
-
-
-
(20
6)
(20
6)
Sha
re o
f ot
her
com
preh
ensi
ve i
ncom
e of
ass
ocia
te
-
-
-
(
467)
-
-
(
467)
(
467)
-
-
2
1,08
5
(46
7)
-
6
04,2
46
624
,864
6
24,8
64T
rans
fer
to u
n-ap
prop
riat
ed p
rofi
t on
acc
ount
of
in
crem
enta
l de
prec
iati
on
-
-
-
-
-
41,
734
4
1,73
4
41,
734
Dis
trib
uti
on t
o ow
ner
s
Fin
al d
ivid
end
for
the
year
end
ed J
une
30, 2
012
-
-
-
-
-
(
171,
435)
(
171,
435)
(
171
,435
)
Bal
ance
as
at D
ecem
ber
31,
201
2
214
,294
9
7,49
0
37,
579
(
467)
1
,225
,000
3
,324
,153
4
,683
,755
4
,898
,049
The
ann
exed
sel
ecte
d no
tes
1 to
21
form
an
inte
gral
par
t of
thi
s co
nden
sed
inte
rim
fina
ncia
l in
form
atio
n.
Tot
alR
eser
ves
CONDENSED INTERIM STATEMENT OF CHANGES IN
EQUITY (UN-AUDITED)
FOR THE SIX MONTHS ENDED DECEMBER 31, 2012
MU
HA
MM
AD
AD
RE
ES
(C
HIE
F E
XE
CU
TIV
E O
FF
ICE
R)
HA
SE
EB
AH
ME
D(D
IRE
CT
OR
)

CASH FLOWS FROM OPERATING ACTIVITIES
Operating cash flow before working capital changes 19 1,378,075 1,059,309 Changes in working capital (Increase) / decrease in current assets Stores, spare parts and loose tools 1,597 (79,264) Stock-in-trade (213,318) (176,521) Trade debts (430,837) 7,943 Loans and advances (160,892) (44,560) Trade deposits and short-term prepayments (1,038) (20,650) Other receivables (27,995) (12,817) Other financial assets - 54,951 Decrease in current liabilities Trade and other payables 842,434 469,531
9,951 198,613
Cash generated from operations 1,388,026 1,257,922
Finance cost paid (289,465) (367,581) Employee benefits paid (1,408) (1,173) Taxes paid (117,278) (94,506)
(408,151) (463,260)
Net cash from operating activities 979,875 794,662
CASH FLOWS FROM INVESTING ACTIVITIES
Purchase of property, plant and equipment (251,203) (106,117) Proceeds from disposal of property, plant and equipment 2,441 4,250 Available for sale investments - net 38 1,432 Purchase of investment property (3,153) (2,250) Long-term loans and advances (9,973) (18,790) Long term deposits (15) (134) Interest received - 5,871 Dividend income received 5,526 4,278
Net cash used in investing activities (256,339) (111,460)
CASH FLOWS FROM FINANCING ACTIVITIES
Payment of long-term financing (468,629) (524,080) Short term financing - net 106,608 319,992 Long term deposits - 11,230 Dividend paid (171,435) (42,605)
Net cash used in financing activities (533,456) (235,463)
Net increase in cash and cash equivalents 190,080 447,739
Cash and cash equivalents at beginning of period 79,862 140,777
Cash and cash equivalents at end of the period 269,942 588,516
The annexed selected notes 1 to 21 form an integral part of this condensed interim financial information.
Note December 31,
2012 December 31,
2011 (Rupees in thousand)
CONDENSED INTERIM CASH FLOW STATEMENT
(UN-AUDITED)
FOR THE SIX MONTHS ENDED DECEMBER 31, 2012
Six months ended
MUHAMMAD ADREES (CHIEF EXECUTIVE OFFICER)
HASEEB AHMED(DIRECTOR)
09

Note December 31,
2012 Un-Audited (Rupees in thousand)
June 30, 2012
Audited
SELECTED EXPLANATORY NOTES TO THE CONDENSED
INTERIM FINANCIAL INFORMATION (UN-AUDITED)
FOR THE SIX MONTHS ENDED DECEMBER 31, 2012
10
1 LEGAL STATUS AND OPERATIONS
1.1 Sitara Chemical Industries Limited ("the Company") was incorporated in Pakistan on September 08, 1981 as a public limited company under Companies Act, 1913 (now Companies Ordinance, 1984). The company is currently listed on all Stock Exchanges in Pakistan. The principal activities of the Company are operation of Chlor Alkali plant and yarn spinning unit. The registered office of the Company is situated at 601-602, Business Centre, Mumtaz Hasan Road, Karachi, in the province of Sindh and the manufacturing facilities are located at 28/32 K.M., Faisalabad - Sheikhupura Road, Faisalabad, in the province of Punjab.
The Company is currently organized into two operating divisions and these divisions are the basis on which the Company reports its primary segment information.
Principal business activities are as follows: Chemical Division Manufacturing of caustic soda and allied products Textile Division Manufacturing of yarn
1.2 This condensed interim financial information is presented in Pak Rupee, which is the Company's functional and presentation currency.
2 BASIS OF PREPARATION
2.1 This condensed interim financial information of the Company for the six months period ended December 31, 2012 has been prepared in accordance with the International Accounting Standard - 34 "Interim Financial Reporting" provisions of and directives issued under the Companies Ordinance, 1984. In case where requirements differ, the provisions of or directives issued under the Companies Ordinance, 1984 have been followed.
2.2 This condensed interim financial information should be read in conjunction with annual audited financial statements for the year ended June 30, 2012. Comparative balance sheet is extracted from annual audited financial statements for the year ended June 30, 2012 whereas comparative profit and loss account, comparative statement of changes in equity and comparative cash flow statement are stated from un-audited condensed interim financial information for the six months ended on December 31, 2011.
2.3 This condensed interim financial information is un-audited. However, a limited scope review has been performed by the statutory auditors of the Company in accordance with the clause (xxi) of the Code of Corporate Governance and they have issued their review report thereon.
3 ACCOUNTING POLICIES AND ESTIMATES
3.1 The accounting policies and the methods of computation adopted in the preparation of this condensed interim financial information are the same as those applied in the preparation of the financial statements for the year ended June 30, 2012.
4. PROPERTY, PLANT AND EQUIPMENT Operating assets 4.1 5,990,827 6,061,686 Capital work-in-progress 316,843 278,251
6,307,670 6,339,937
SELECTED EXPLANATORY NOTES TO THE CONDENSED
INTERIM FINANCIAL INFORMATION (UN-AUDITED)
FOR THE SIX MONTHS ENDED DECEMBER 31, 2012
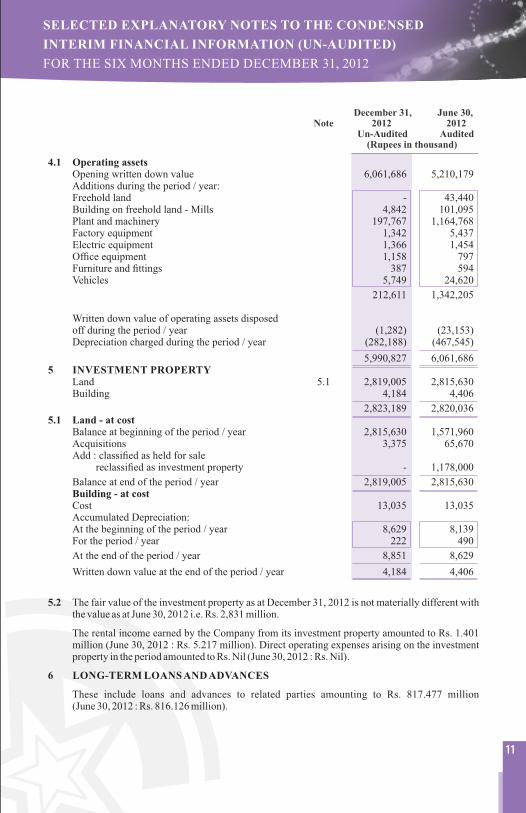
4.1 Operating assets Opening written down value 6,061,686 5,210,179 Additions during the period / year: Freehold land - 43,440 Building on freehold land - Mills 4,842 101,095 Plant and machinery 197,767 1,164,768 Factory equipment 1,342 5,437 Electric equipment 1,366 1,454 Office equipment 1,158 797 Furniture and fittings 387 594 Vehicles 5,749 24,620
212,611 1,342,205 Written down value of operating assets disposed off during the period / year (1,282) (23,153) Depreciation charged during the period / year (282,188) (467,545)
5,990,827 6,061,6865 INVESTMENT PROPERTY Land 5.1 2,819,005 2,815,630 Building 4,184 4,406
2,823,189 2,820,0365.1 Land - at cost Balance at beginning of the period / year 2,815,630 1,571,960 Acquisitions 3,375 65,670 Add : classified as held for sale reclassified as investment property - 1,178,000
Balance at end of the period / year 2,819,005 2,815,630 Building - at cost Cost 13,035 13,035 Accumulated Depreciation: At the beginning of the period / year 8,629 8,139 For the period / year 222 490
At the end of the period / year 8,851 8,629
Written down value at the end of the period / year 4,184 4,406
5.2 The fair value of the investment property as at December 31, 2012 is not materially different with the value as at June 30, 2012 i.e. Rs. 2,831 million.
The rental income earned by the Company from its investment property amounted to Rs. 1.401 million (June 30, 2012 : Rs. 5.217 million). Direct operating expenses arising on the investment property in the period amounted to Rs. Nil (June 30, 2012 : Rs. Nil).
6 LONG-TERM LOANS AND ADVANCES
These include loans and advances to related parties amounting to Rs. 817.477 million (June 30, 2012 : Rs. 816.126 million).
Note December 31,
2012 Un-Audited (Rupees in thousand)
June 30, 2012
Audited
11

SELECTED EXPLANATORY NOTES TO THE CONDENSED
INTERIM FINANCIAL INFORMATION (UN-AUDITED)
FOR THE SIX MONTHS ENDED DECEMBER 31, 2012
December 31, 2012
Un-Audited (Rupees in thousand)
June 30, 2012
Audited
December 31, 2012
Un-Audited No of shares
June 30, 2012
Audited
AuthorizedA class ordinary shares of Rs. 10/- each B class ordinary shares of Rs. 10/- each
Issued, subscribed and paid up "A" class ordinary shares of Rs. 10/- each fully paid- fully paid in cash - issued as fully paid bonus shares - issued as fully paid under scheme of
arrangement for amalgamation
No of shares
December 31, 2012
Un-Audited (Rupees in thousand)
June 30, 2012
Audited
12
7 TRADE DEBTS
These include receivable from related parties amounting to Rs. 51.731 million (June 30, 2012 : Rs. 36.731 million).
8 OTHER RECEIVABLES
These include receivable from related parties amounting to Rs. 19.029 million (June 30, 2012 : Rs. 4.270 million). These related party receivables include a receivable from Sitara Developers (Private) Limited amounting Rs. 15 million (June 30, 2012 : Nil) under mark-up arrangement. Mark-up is charged at the rate of 13.965%.
9. SHARE CAPITAL
40,000,000 40,000,000 400,000 400,000 20,000,000 20,000,000 200,000 200,000
8,640,000 8,640,000 86,400 86,400 10,804,398 10,804,398 108,044 108,044 1,985,009 1,985,009 19,850 19,850
21,429,407 21,429,407 214,294 214,294
9.1 No share is held by any associated Company or related party. 9.2 The Company has no reserved shares under options and sales contracts. 9.3 The reconciliation of "A" class ordinary shares is as follows:
Opening balance 21,429,407 21,429,407 Add: shares issued during the period / year - -
Closing balance 21,429,407 21,429,407
10 LONG-TERM FINANCING Opening balance 2,197,556 2,764,277
Obtained during the period / year - 400,000 2,197,556 3,164,277 Less: paid during the period / year 468,630 966,721 1,728,926 2,197,556 Less: current portion 735,800 862,780
993,126 1,334,776
11 TRADE AND OTHER PAYABLES
11.1 This includes Rs. 16.13 million (June 30, 2012 : Rs. Nil) due to associated undertakings.
11.2 These include Murabaha payable amounting to Rs. 1,154.715 million (June 30, 2012: Rs. 721.655 million). The aggregate un-availed facilities available to the Company from commercial banks amounted to Rs. 846.27 million (June 30, 2012 : Rs. 1,109 million). These are

13
December 31, 2012
Un-Audited (Rupees in thousand)
June 30, 2012
Audited
(Rupees in thousand)
December 31, 2012
December 31, 2011
Three months ended
December 31, 2012
December 31, 2011
Six months ended
subject to profit margin ranging from 11.13% to 12.28% (June 30, 2012 : 12.51% to 14.10%) per annum and are secured against joint pari passu charge over present and future current assets of the chemical division and pledge of stocks and charge over present and future current assets of the textile division.
12 CONTINGENCIES AND COMMITMENTS
12.1 Contingencies
"Sales tax demand not acknowledged in view of pending appeals" 3,398 3,398 "Suppliers' claim not acknowledged in view of pending case in Civil Court" 890 890 Guarantees issued by banks on behalf of the Company 135,551 -
12.2 Commitments
Outstanding letters of credit for raw material and spares 118,798 19,784
13 SALES - NET Local 4,399,928 4,003,066 2,244,391 2,116,696 Export 475,274 182,581 189,645 93,021
4,875,202 4,185,647 2,434,036 2,209,717
Less: Commission and discount 110,792 88,779 58,010 47,445 Sales tax 510,882 467,182 262,399 251,283
621,674 555,961 320,409 298,728
4,253,528 3,629,686 2,113,627 1,910,989
14 COST OF SALES Raw material consumed 861,621 725,951 416,962 383,422 Fuel and power 1,496,440 1,283,929 753,844 744,353 Salaries, wages and benefits 181,305 118,391 99,380 57,773 Factory overheads 502,690 383,542 276,100 201,113
3,042,056 2,511,813 1,546,286 1,386,661 Work-in-process Opening stock 45,909 72,439 45,236 66,027 Closing stock (54,903) (57,714) (54,903) (57,714)
(8,994) 14,725 (9,667) 8,313
Cost of goods manufactured 3,033,062 2,526,538 1,536,619 1,394,974 Finished goods Opening stock 314,401 432,162 365,920 261,668 Purchases 20,703 - 20,703 - Closing stock (390,027) (343,277) (390,027) (343,277)
(54,923) 88,885 (3,404) (81,609)
2,978,139 2,615,423 1,533,215 1,313,365
SELECTED EXPLANATORY NOTES TO THE CONDENSED
INTERIM FINANCIAL INFORMATION (UN-AUDITED)
FOR THE SIX MONTHS ENDED DECEMBER 31, 2012
SELECTED EXPLANATORY NOTES TO THE CONDENSED
INTERIM FINANCIAL INFORMATION (UN-AUDITED)
FOR THE SIX MONTHS ENDED DECEMBER 31, 2012
(Rupees in thousand)
December 31, 2012
December 31, 2011
December 31, 2012
December 31, 2011
Six months ended
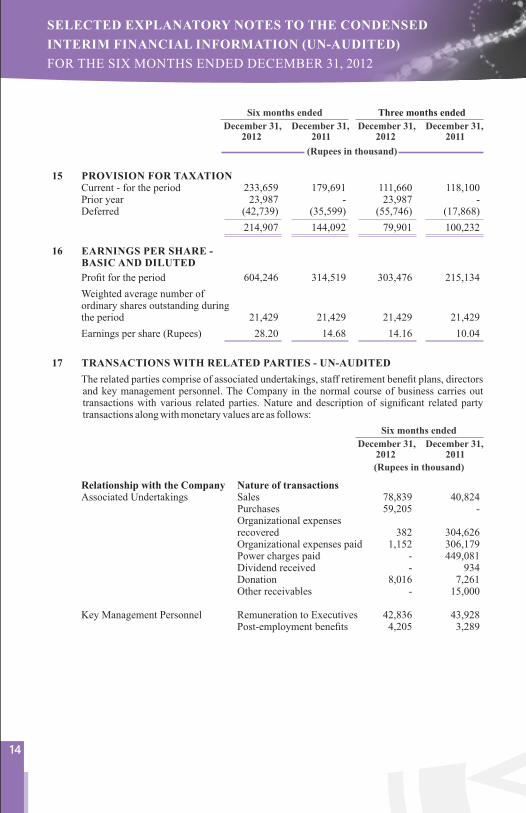
15 PROVISION FOR TAXATION Current - for the period 233,659 179,691 111,660 118,100 Prior year 23,987 - 23,987 - Deferred (42,739) (35,599) (55,746) (17,868)
214,907 144,092 79,901 100,232
16 EARNINGS PER SHARE - BASIC AND DILUTED
Profit for the period 604,246 314,519 303,476 215,134
Weighted average number of ordinary shares outstanding during the period 21,429 21,429 21,429 21,429
Earnings per share (Rupees) 28.20 14.68 14.16 10.04
17 TRANSACTIONS WITH RELATED PARTIES - UN-AUDITED
The related parties comprise of associated undertakings, staff retirement benefit plans, directors and key management personnel. The Company in the normal course of business carries out transactions with various related parties. Nature and description of significant related party transactions along with monetary values are as follows:
Relationship with the Company Nature of transactions Associated Undertakings Sales 78,839 40,824 Purchases 59,205 - Organizational expenses recovered 382 304,626 Organizational expenses paid 1,152 306,179 Power charges paid - 449,081 Dividend received - 934 Donation 8,016 7,261 Other receivables - 15,000
Key Management Personnel Remuneration to Executives 42,836 43,928 Post-employment benefits 4,205 3,289
December 31, 2012
December 31, 2011
Six months ended
(Rupees in thousand)
Three months ended
14

Dec
emb
er 3
1,20
12Ju
ne
30,
2012
Un
-au
dit
edA
ud
ited
Dec
emb
er 3
1,20
12Ju
ne
30,
2012
Un
-au
dit
edA
ud
ited
Dec
emb
er 3
1,20
12Ju
ne
30,
2012
Un
-au
dit
edA
ud
ited
Tot
al
Tot
al
Dec
emb
er 3
1,20
12D
ecem
ber
31,
2012
Dec
emb
er 3
1,20
12D
ecem
ber
31,
2011
Dec
emb
er 3
1,20
11D
ecem
ber
31,
2011
Tot
al
Op
erat
ing
segm
ents
Six
mon
ths
end
ed
Ch
emic
al D
ivis
ion
Tex
tile
Div
isio
n
(Ru
pee
s in
th
ousa
nd
)
15
SELECTED EXPLANATORY NOTES TO THE CONDENSED
INTERIM FINANCIAL INFORMATION (UN-AUDITED)
FOR THE SIX MONTHS ENDED DECEMBER 31, 201218
S
EG
ME
NT
RE
PO
RT
ING
T
he C
ompa
ny h
as t
wo
repo
rtab
le s
egm
ents
, w
hich
off
er d
iffe
rent
pro
duct
s an
d ar
e m
anag
ed s
epar
atel
y. T
he f
ollo
win
g su
mm
ary
desc
ribe
s th
e op
erat
ions
in e
ach
of th
e re
port
able
seg
men
t of t
he C
ompa
ny;
-
Che
mic
al d
ivis
ion
: Man
ufac
turi
ng o
f cau
stic
sod
a an
d al
lied
pro
duct
s
- T
exti
le d
ivis
ion:
Man
ufac
turi
ng o
f ya
rn
18.1
In
form
atio
n a
bou
t op
erat
ing
segm
ents
is
as f
ollo
ws:
R
even
ue f
rom
ext
erna
l cu
stom
ers
- ne
t
3,
576,
454
3,05
7,05
5 67
7,07
4
572,
631
4
,253
,528
3,
629,
686
D
epre
ciat
ion
on p
rope
rty,
pla
nt a
nd e
quip
men
t
25
8,77
4
218
,372
2
3,63
6
15,
994
2
82,4
10
234
,366
S
egm
ent
profi
t
1
,081
,855
8
26,0
62
63,
583
2
5,78
9
1,1
45,4
38
851
,851
C
apit
al e
xpen
ditu
re
20
8,72
0
348
,568
3
,890
8
8,76
9
212
,610
4
37,3
37
S
egm
ent
asse
ts
8,75
8,70
2
9
,144
,843
1
,461
,496
8
5,06
7
10,
220,
198
9,22
9,91
0
S
egm
ent
liab
ilit
ies
1,
052,
052
724
,785
8
0,02
4
21,
149
1
,132
,076
7
45,9
34

18.2 Reconciliations of reportable segments are as follows: Revenue Total revenue for reportable segments 4,253,528 3,629,686
Profit for the period Total profit for reportable segments 1,145,438 851,851 Unallocated corporate income / (expenses) Other operating income 22,166 16,809 Administrative expenses (180) (1,230) Other operating expenses (61,334) (56,497) Finance cost (271,598) (360,346) Share of profit / (loss) of associates - net of tax (15,339) 8,024
Profit before income tax expense 819,153 458,611
Assets Total assets for reportable segments 10,220,198 9,229,910 Other unallocated corporate assets 3,537,610 3,650,750
Entity's assets 13,757,808 12,880,660
Liabilities Total liabilities for reportable segments 1,132,076 745,934 Other unallocated corporate liabilities 12,625,732 12,134,726
Entity's liabilities 13,757,808 12,880,660
18.3 The Company has no reportable geographical segment.
19 OPERATING CASH FLOW BEFORE WORKING CAPITAL CHANGES Profit before taxation 819,153 458,611 Adjustments for: Depreciation on property, plant and equipment 282,188 234,366 Depreciation on investment property 222 246 Impairment (gain) / loss on investment in associated company (5,236) 16,378 Finance cost 271,598 360,346 Share of loss / (profit) of associated companies - net of tax 15,339 (8,024) (Gain) / loss on disposal of property, plant and equipment - net (1,159) 6,222 Gain on sale of available for sale investments (206) (593) Exchange gain - (281) Provision for employee benefits 1,702 1,665 Dividend income (5,526) (3,343) Profit on bank deposits - (6,284) 558,922 600,698
1,378,075 1,059,309
20 DATE OF AUTHORIZATION FOR ISSUE This interim financial information has been approved by the Board of Directors of the Company and
authorized for issue on January 31, 2013.
21 GENERAL Figures have been rounded to the nearest thousand of "Pak" Rupees, unless otherwise stated.
December 31, 2012
December 31, 2011
Six months ended
(Rupees in thousand)
December 31, 2012
Un-Audited (Rupees in thousand)
June 30, 2012
Audited
16
SELECTED EXPLANATORY NOTES TO THE CONDENSED
INTERIM FINANCIAL INFORMATION (UN-AUDITED)
FOR THE SIX MONTHS ENDED DECEMBER 31, 2012
HASEEB AHMED(DIRECTOR)
MUHAMMAD ADREES (CHIEF EXECUTIVE OFFICER)
December 31, 2012
December 31, 2011
Six months ended
(Rupees in thousand)

Designed & Produced by: Astral Hatch INC. 0322-2595026