Embed Size (px)
Citation preview

CARBON
INVENTORY
Corporate Sustainabil i ty & Social Impact Department
January 2019 - December 2019

"COMPANIES THAT PERSIST IN TREATING
CLIMATE CHANGE SOLELY AS A CORPORATE
SOCIAL RESPONSIBILITY ISSUE, RATHER
THAN A BUSINESS PROBLEM, WILL RISK THE
GREATEST CONSEQUENCES."
M I C H A E L E . P O R T E R A N D F O R E S T L . R E I N H A R D T

ACKNOWLEDGEMENT

GLOSSARY ------------------------------------------------------------------------------------
EXCUTIVE SUMMARY ----------------------------------------------------------------------
INTRODUCTION -----------------------------------------------------------------------------
Company Profile ------------------------------------------------------------------------------
Our Commitment ---------------------------------------------------------------------------
CARBON FOOTPRINT CONCEPT --------------------------------------------------------
What is Carbon Footprint? -----------------------------------------------------------------
Why is Carbon Footprint important to Haggar? ----------------------------------
METHODOLOGY FOR CALCULATION -------------------------------------------------
The Greenhouse Gas Protocol -----------------------------------------------------------
Emission/Conversion factors ------------------------------------------------------------
Companies Covered by Carbon Inventory ---------------------------------------
Calculation Scope --------------------------------------------------------------------------
Stages of Carbon Inventory & Management Exercise ----------------------------
HAGGAR GROUP CLIMATE IMPACT 2019 -------------------------------------------
Total Emissions -----------------------------------------------------------------------------
Past Performance Comparison ---------------------------------------------------------
Haggar HMCC -------------------------------------------------------------------------------
Haggar Company Limited ----------------------------------------------------------------
Coldair Engineering Company (CEC) --------------------------------------------------
Pasgianos Food & Beverages (PFB) ----------------------------------------------------
Sudasat ---------------------------------------------------------------------------------------
Dynamic International Oil Well Services ---------------------------------------------
Dolphin Ghana & Dolphin Nigeria -----------------------------------------------------
LESSONS LEARNT & WAY FORWARD -----------------------------------------------
ENVIRONMENTAL METRICS USED IN SUSTAINABILITY INDEX/COMPLETE
RETURNS -----------------------------------------------------------------------------------
REFERENCES ------------------------------------------------------------------------------
ANNEXES -----------------------------------------------------------------------------------
Emission Factors ----------------------------------------------------------------------------
Additional Data -----------------------------------------------------------------------------
Carbon tax ------------------------------------------------------------------------------------
Table of Contents
1
2
3
4
4
5
6
6
6
7
7
7
8
9
10
11
11
13
14
14
15
16
17
17
18
19
20
21
22
22
23
28
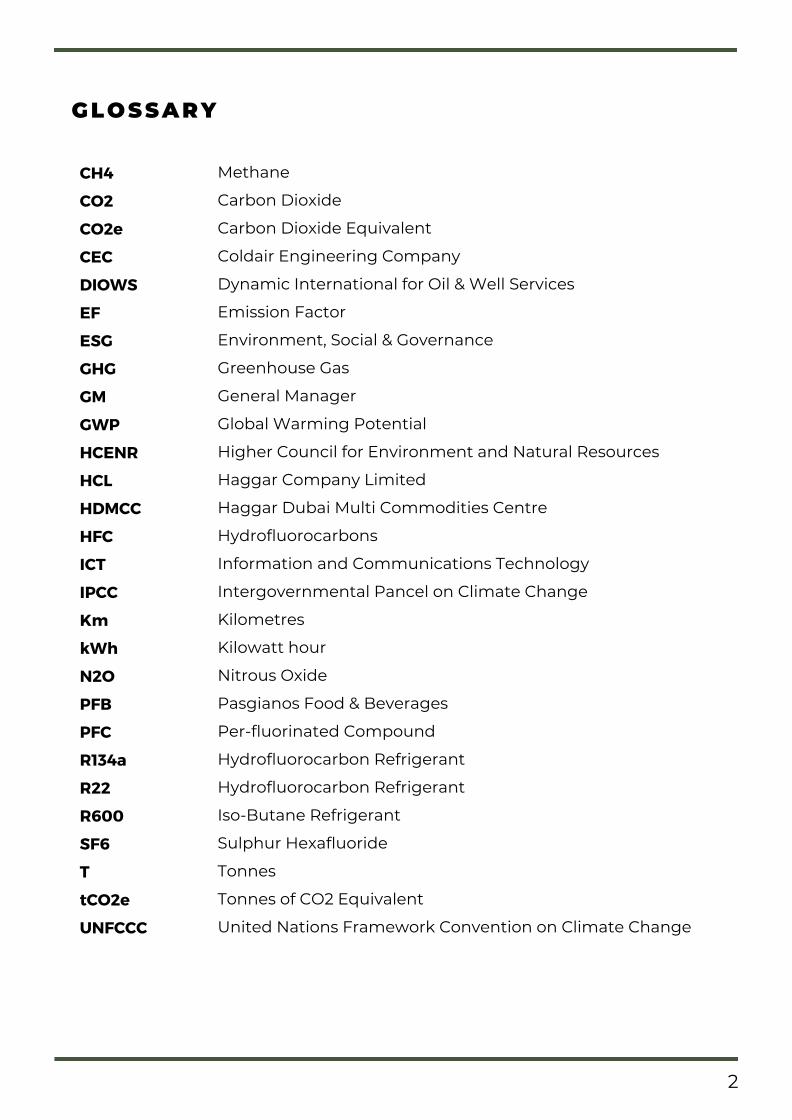
GLOSSARY
CH4
CO2
CO2e
CEC
DIOWS
EF
ESG
GHG
GM
GWP
HCENR
HCL
HDMCC
HFC
ICT
IPCC
Km
kWh
N2O
PFB
PFC
R134a
R22
R600
SF6
T
tCO2e
UNFCCC
Methane
Carbon Dioxide
Carbon Dioxide Equivalent
Coldair Engineering Company
Dynamic International for Oil & Well Services
Emission Factor
Environment, Social & Governance
Greenhouse Gas
General Manager
Global Warming Potential
Higher Council for Environment and Natural Resources
Haggar Company Limited
Haggar Dubai Multi Commodities Centre
Hydrofluorocarbons
Information and Communications Technology
Intergovernmental Pancel on Climate Change
Kilometres
Kilowatt hour
Nitrous Oxide
Pasgianos Food & Beverages
Per-fluorinated Compound
Hydrofluorocarbon Refrigerant
Hydrofluorocarbon Refrigerant
Iso-Butane Refrigerant
Sulphur Hexafluoride
Tonnes
Tonnes of CO2 Equivalent
United Nations Framework Convention on Climate Change
2

We are at the highest point we've been since 2002. Congratulations to everyone!
Under the umbrella of the Corporate Sustainability & Social Impact Department,Haggar group conducts Green House Gases (GHG) inventory of its differentbusiness constituents with the aim to undertake, based on the result of theinventory, internal and external reduction measures in collaboration with therelevant ministries, international organizations and civil society organizations,offsetting its emissions and reducing its carbon footprint.
The Corporate Sustainability & Social Impact Department has calculated HaggarGroup 2019 Carbon Footprint based on the standards defined in the GreenhouseGas Protocol Corporate Accounting and Reporting Standard (GHG Protocol) forthe fiscal year 2019.
The original inventory was first done in 2012 and has been conducted every twoyears since then. As of 2019, and with the support of a renowned consultant in thefield [1], Haggar developed its own calculation tool and started conducting theinventory annually focusing on further improving the accuracy and diligence ofthe process.
This report provides an overview of the results of the accounted emissions.
km driven with a vehicle kwh Electricity number of facilities
3,627,700 3,966,580 32
EXCUTIVE SUMMARY
[1] Olivier Levalois, Founding Director at Hamerkop Climate Impacts Ltd
Net emissions Total Employed Persons Emissions per Employed Person
2019 20,570 tCO2e 656 31.4 tCO2e
The amount corresponds to:
3

Haggar Group was established in South Sudan in 1904 and present today in 6 sectorsacross 5 countries in Africa. The group continues to look for opportunities to createand add value across the continent.
The Group aims to build long-term positions in Agriculture, Energy, and ICT, as it isbelieved these sectors will provide the architecture and foundation for sustainabledevelopment across the continent.
Its guiding principles, from the business’ inception, have taken into consideration theway in which business is done and governed, and the impact that the businesses willhave on all stakeholders, including external communities, the environment andsociety.
Bound by the Group’s ‘Code of Conduct’, Haggar Group is conscious of how businessis done and adheres to its principles, professional standards and by the laws andregulations of the countries it operates in at all times.
COMPANY PROFILE
INTRODUCTION
4
The Code of Conduct guides theGroup’s decision-making process andensures that across its businesses thesame ethical and moral standards arerespected, which share a deepconsciousness towards the livelihoodsof its Employed Persons and fellowcitizens, the marginalized andunderserved as well as towardsenvironmental sustainability.

Being a signatory to the UN Global Compact [2] with a commitment to abide by its10 principles, the Group has launched in 2020 a carbon tax on all its companies. Acarbon tax sets a price on carbon by defining a tax rate on GHG emissions of eachbusiness unit. This aims at encouraging them to manage their operations in a waythat helps in curbing these emissions.
For the carbon tax to be properly applied, the carbon inventory needs to bethoroughly and accurately taken.
[2] https://www.unglobalcompact.org/ 5
OUR COMMITMENT
Supporting a precautionary approach to environmental challenges. Undertaking initiatives to promote greater environmental responsibilityinternally among employed persons and externally with different stakeholders. Encouraging the development and diffusion of environmentally friendlytechnologies.Committing to continuously reducing GHG emissions through calculating theGroup’s carbon footprint internally and offsetting emissions through greeninitiatives externally.
The Corporate Sustainability & Social Impact Department has variouscomplementing guidelines that govern how it manages a set of core subjects,including but not limited to the environment, that should help meet the Group’svision. These include a detailed environmental policy as well as an ESG(Environment, Social & Governance) one which highlights the Group’scommitment to go beyond its environmental legal obligations by anticipatingchange and making necessary adjustments before legislation comes into force.
These guidelines also include:

A carbon footprint is the total greenhouse gas (GHG)emissions caused directly and indirectly by anindividual, organization, event, or product. It iscalculated by summing the emissions resulting fromevery stage of a product or service’s lifetime (materialproduction, manufacturing, use, and end-of-life).
Throughout a product’s lifetime, different greenhousegases GHGs may be emitted, such as carbon dioxide(CO2), methane (CH4), and nitrous oxide (N2O), eachwith a greater or lesser ability to trap heat in theatmosphere. These differences are accounted for bycalculating the global warming potential (GWP) ofeach gas in units of carbon dioxide equivalents (CO2e),giving carbon footprints a single unit for easycomparison (Centre for Sustainable Development,Online).
The carbon footprint is a useful tool to quantify themain emission sources and to have a complete pictureof the impact of an organisation on global aggregatedGHG level into the atmosphere. It is also the first stepto structure and implement a plan to reduce theseemissions.
CARBON FOOTPRINT CONCEPT
WHAT IS CARBON FOOTPRINT?
WHY IS CARBON FOOTPRINT IMPORTANT TO HAGGAR?
Knowing the impact Haggar’s different companies has on the environment.Allowing for stock taking of energy consumption and the main sources of GHGemissions thus leading to better management of energy consumption andidentification of reduction opportunities. Providing stakeholders with transparency and a baseline for the Group’scommitment to sustainable development goals, particularly those related toclimate change.Being a responsible global citizen and on top of environmental regulations andpolicies on climate change before they come into force.
Carrying out the inventory of Haggar Group’s carbon emissions leads to multiplebenefits and decision-making opportunities such as:
6

METHODOLOGY FOR CALCULATION
Distance traveled by cars owned by the company in km
Diesel consumed by generators and machinery in litres
Natural gas consumed in buildings in kwh
Waste generated in tonnes
The carbon accounting has been implemented using best practice standards and
guidelines. Established emissions factors have been derived from reliable references
for each emissions source. The conversion factor provides the values to be used for
each type of emission. These are reviewed and accessed on an annual basis.
For effective and innovative GHG management, Haggar has set operational
boundaries that are comprehensive with respect to direct (resulting directly from a
company’s activities – transportation of produced goods using company’s vehicles)
and indirect emissions (resulting from other sources not owned or controlled by the
company – electricity used in production) which helps Haggar’s different companies
better manage the full spectrum of its GHG emissions.
To take stock of the GHG emissions associated with the Group activities, carbon
emissions are first calculated in terms of activities/activity data such as, but not limited
to the below:
THE GREENHOUSE GASPROTOCOL
The Greenhouse Gas Protocol is the
most widely used international
accounting tool for government and
business leaders to understand,
quantify, and manage greenhouse gas
emissions. It serves as the foundation
for nearly every GHG standard and
program in the world - from the
International Standards Organization
to The Climate Registry - as well as
hundreds of GHG inventories prepared
by individual companies,
(Ghgprotocol.com, Oct 2020).
EMISSION/CONVERSIONFACTORS
An emission factor is a coefficient
which allows to convert activity data
into GHG emissions. It is the average
emission rate of a given source,
relative to units of activity or
process/processes, (https://climfoot-
project.eu, Oct 2020).
For 2019 the UK Government GHG
Conversion Factors for Company
Reporting were used as the reference.
These are factors for use by UK but
also international organisations to
report on greenhouse gas emissions.
7

Haggar DMCC &Haggar Company
LimitedSUDASAT Dynamic International
Oil Well Services
Pasgianos Food andBeverages
Coldair EngineeringCompany
Dolphin (Ghana &Nigeria)
Haggar Group companies that have been included in this exercise and whose
results are covered in this report are:
COMPANIES COVERED BY CARBON INVENTORY
Both Haggar DMCC and Haggar Company Limited are the Group Headquarter
offices where executive management, key managerial and support staff are
located with the latter being the head office for Sudan based companies.
Pasgianos Food and Beverages and Coldair Engineering Company are based in
Sudan and are fully owned by the Group, while Haggar DMCC holds a majority
share in Dynamic International Oil Well Services and minority shares in both
Sudasat and Dolphin Telecom.
8
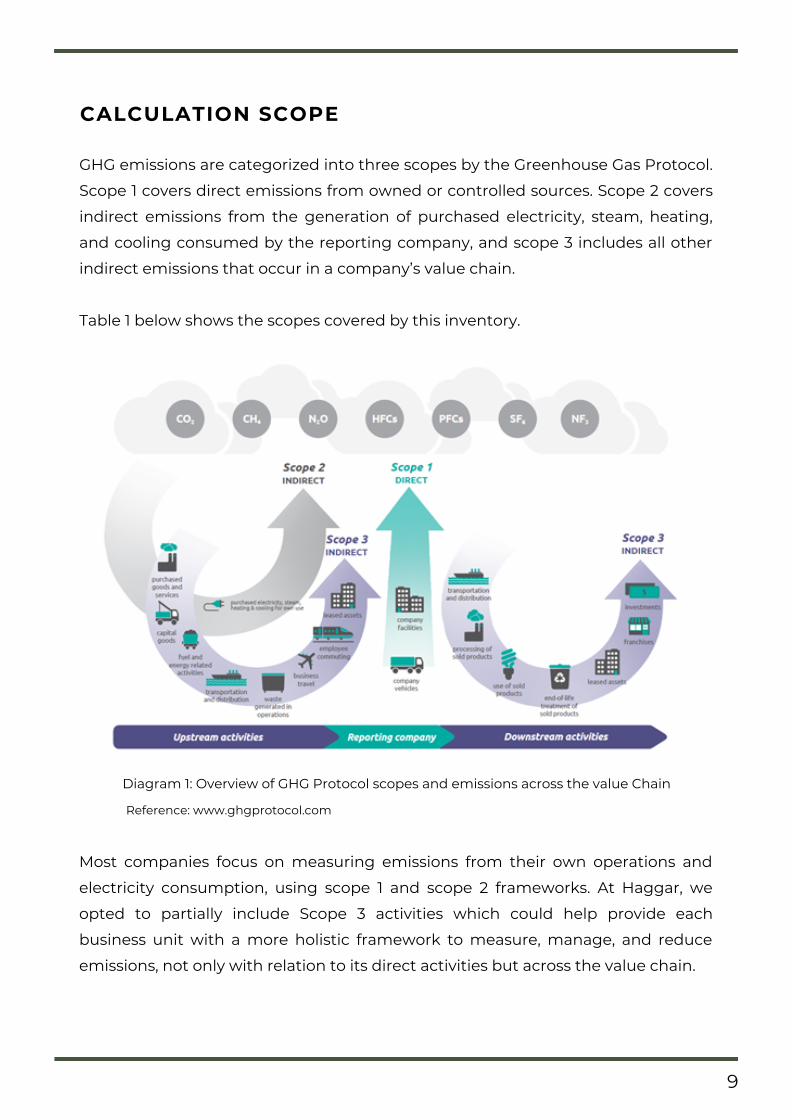
GHG emissions are categorized into three scopes by the Greenhouse Gas Protocol.
Scope 1 covers direct emissions from owned or controlled sources. Scope 2 covers
indirect emissions from the generation of purchased electricity, steam, heating,
and cooling consumed by the reporting company, and scope 3 includes all other
indirect emissions that occur in a company’s value chain.
Table 1 below shows the scopes covered by this inventory.
CALCULATION SCOPE
Diagram 1: Overview of GHG Protocol scopes and emissions across the value Chain
Reference: www.ghgprotocol.com
Most companies focus on measuring emissions from their own operations and
electricity consumption, using scope 1 and scope 2 frameworks. At Haggar, we
opted to partially include Scope 3 activities which could help provide each
business unit with a more holistic framework to measure, manage, and reduce
emissions, not only with relation to its direct activities but across the value chain.
9

Table 1: Scopes covered by this inventory and the data activities within
STAGES OF CARBON INVENTORY & MANAGEMENT EXERCISE
10

In 2019, Haggar Group business activities and operations’ total net GHG emissions
were 10,758.4 tCO2e. Out of these, 3,576.8 tCO2e were direct emissions related to
Scope 1, while Scope 2 contributed to 1,328.6 tCO2e, and Scope 3 resulted in 5,853.0
tCO2e.
With a total footprint of 3,883 tCO2e, Dynamic International Oil Well Services
(DIOWS) is the largest emission contributor to Haggar Group, although these are
Scope 3 emissions resulting from the large number of goods transported through
shipments from the Gulf and China. Pasgianos Food & Beverages comes second
with a total footprint of 3,250 tCO2e and 59% of this amount coming under Scope 1
as a result of diesel consumed by PFB fully owned distribution vehicles.
The electricity used to power the building and the plant operations, under Scope 2
is of significant amounts in both Pasgianos and Coldair. More details on actual
amounts and their impact on the total company emissions are found in the
coming sections of this report.
HAGGAR GROUP CLIMATE IMPACT 2019
TOTAL EMISSIONS
Graph 1: Emissions per Company
11
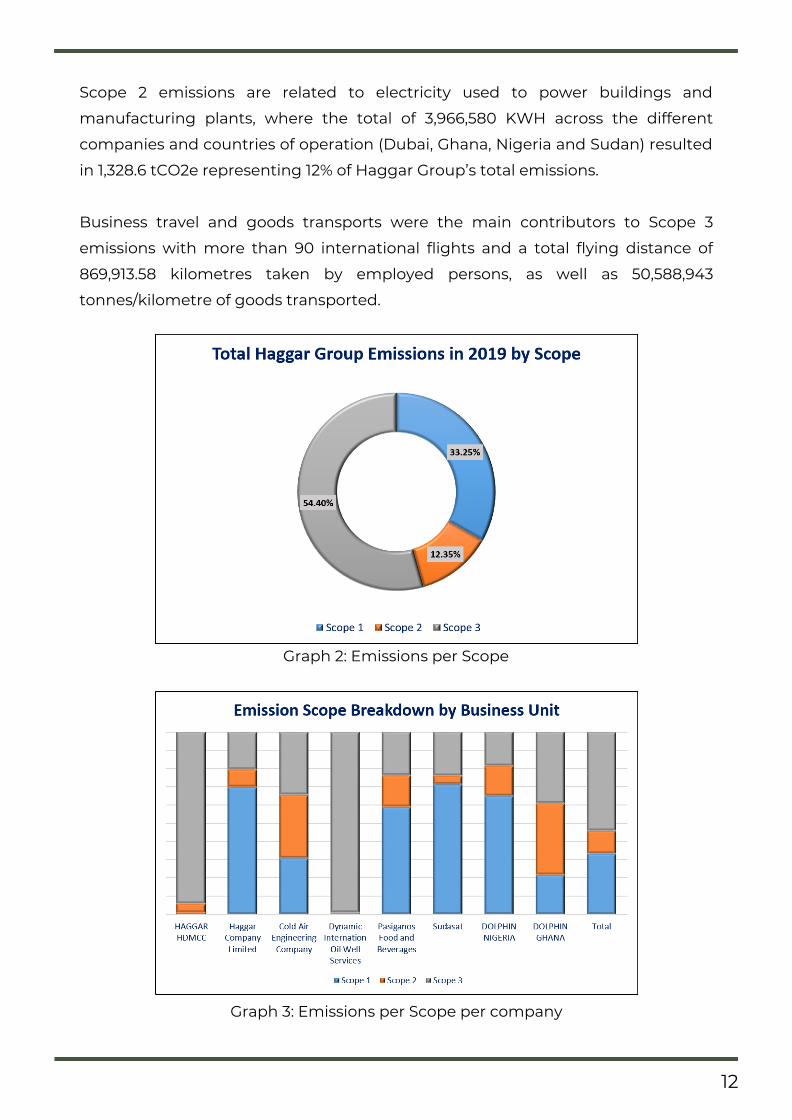
Scope 2 emissions are related to electricity used to power buildings and
manufacturing plants, where the total of 3,966,580 KWH across the different
companies and countries of operation (Dubai, Ghana, Nigeria and Sudan) resulted
in 1,328.6 tCO2e representing 12% of Haggar Group’s total emissions.
Business travel and goods transports were the main contributors to Scope 3
emissions with more than 90 international flights and a total flying distance of
869,913.58 kilometres taken by employed persons, as well as 50,588,943
tonnes/kilometre of goods transported.
Graph 3: Emissions per Scope per company
Graph 2: Emissions per Scope
12
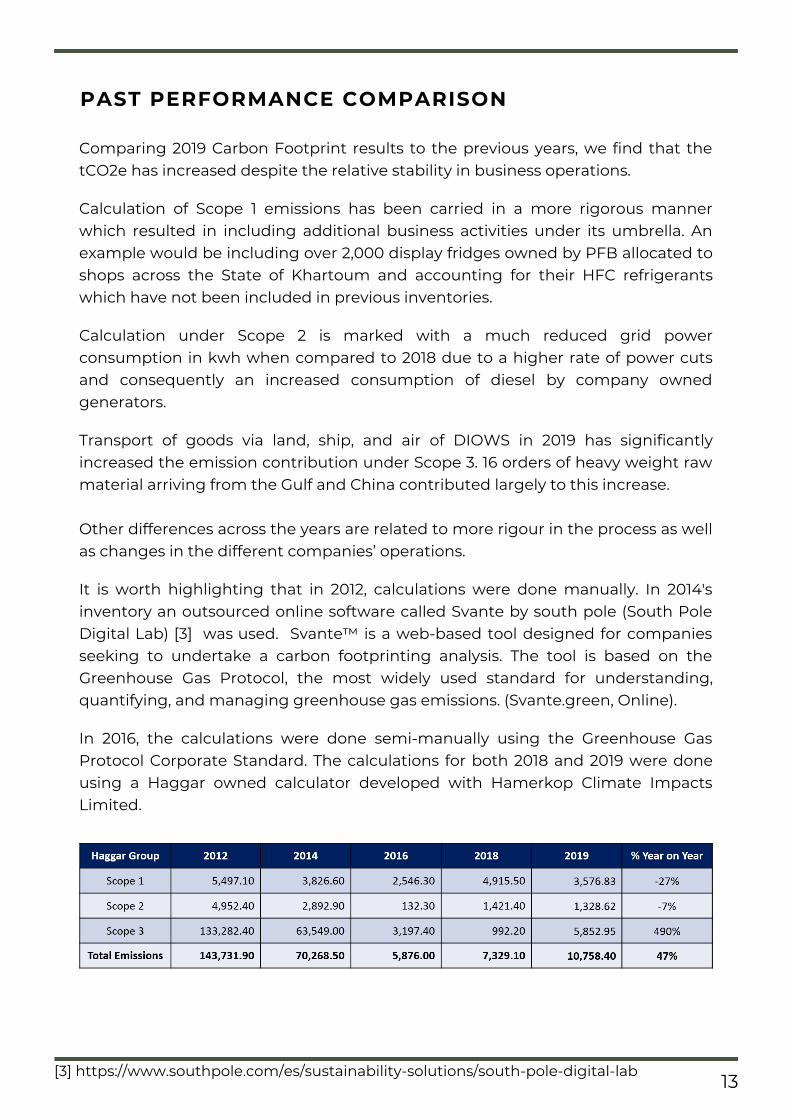
Comparing 2019 Carbon Footprint results to the previous years, we find that thetCO2e has increased despite the relative stability in business operations.
Calculation of Scope 1 emissions has been carried in a more rigorous mannerwhich resulted in including additional business activities under its umbrella. Anexample would be including over 2,000 display fridges owned by PFB allocated toshops across the State of Khartoum and accounting for their HFC refrigerantswhich have not been included in previous inventories.
Calculation under Scope 2 is marked with a much reduced grid powerconsumption in kwh when compared to 2018 due to a higher rate of power cutsand consequently an increased consumption of diesel by company ownedgenerators.
Transport of goods via land, ship, and air of DIOWS in 2019 has significantlyincreased the emission contribution under Scope 3. 16 orders of heavy weight rawmaterial arriving from the Gulf and China contributed largely to this increase.
Other differences across the years are related to more rigour in the process as wellas changes in the different companies’ operations.
It is worth highlighting that in 2012, calculations were done manually. In 2014'sinventory an outsourced online software called Svante by south pole (South PoleDigital Lab) [3] was used. Svante™ is a web-based tool designed for companiesseeking to undertake a carbon footprinting analysis. The tool is based on theGreenhouse Gas Protocol, the most widely used standard for understanding,quantifying, and managing greenhouse gas emissions. (Svante.green, Online).
In 2016, the calculations were done semi-manually using the Greenhouse GasProtocol Corporate Standard. The calculations for both 2018 and 2019 were doneusing a Haggar owned calculator developed with Hamerkop Climate ImpactsLimited.
PAST PERFORMANCE COMPARISON
[3] https://www.southpole.com/es/sustainability-solutions/south-pole-digital-lab 13

Haggar Company Limited (HCL) is the Sudan headquarters for Haggar Group. Ithad an average of 43 employed persons in 2019 with one office building and oneinformation technology service centre housing the main switches. Cars owned bythe company, except for one van, operate only on petrol. Diesel consumption hassignificantly increased from that of the last inventory due to HCL sharing its costwith PFB, owner of the generator sets supplying both companies with electricity.Refrigerants are only used in fire extinguishers for health and safety measures. Asper the nature of HCL operations, no goods or materials were transported andbusiness travel was one of the lowest percentages in the group, while paperconsumption is at par with the other companies. HCL emissions represent only1.3% of the total Group emissions.
Haggar DMCC is the regional headquarters of Haggar Group located in Dubai,United Arab Emirates. Haggar Group was established in South Sudan in 1904 andpresent today in 6 sectors across 5 countries in Africa. HAGGAR DMCC continuesto look for opportunities to invest and develop the private sector across Africa.
Haggar DMCC had a headcount of23 employed persons in 2019housed in one office building. It hasits highest emissions coming underScope 3 as the business unit withthe largest number of internationaltravels conducted across the Group.Haggar DMCC emissions represent2.8% of the total Group emissions.
HAGGAR DMCC
HAGGAR COMPANY LIMITED
Graph 4: HDMCC Emissions per Activity
14

Graph 6: CEC Emissions per Activity
CEC had an average of 229 employed persons during 2019 with one factory, twoservice centres and three office buildings. CEC’s main operation is in theproduction of air conditioners, chest deep freezers and refrigerators. Thus, its useof refrigerants is very high. Nevertheless, leakage during production andinstallation was controlled at a maximum of 1% representing 8.4% of total CECemissions. Refrigerants involved were R600, R22, R134a for air-conditions andrefrigerator manufacturing. CEC’s total emissions represent 10.6% of the totalGroup emissions.
COLDAIR Engineering Company is one of the pillars of Sudanese industry,operating since 1960. The company aims to meet the household needs of everySudanese family. The company leads in refrigeration and its products havebecome a symbol of trust in the heart and mind of Sudanese consumers.
Graph 5: HCL Emissions per Activity
COLDAIR ENGINEERING COMPANY (CEC)
15

PASGIANOS FOOD & BEVERAGES (PFB)
PFB had an average of 180 employed persons in 2019, operating in onemanufacturing plant and in two service centres and three office buildings. Carsowned by the company consumed significantly less fuel than the vans and trucksowned by the company as PFB owns a large number of distribution vehicles thatrun on diesel. Electricity consumption was less than the 2018 inventory as thepower cuts were high. This has however resulted in higher diesel consumption bythe company owned generators.
PFB’s emissions represent 30.2% of the overall Group emissions.
Established in the 1920’s, Pasgianos Food and Beverages was the first soft drink tobe bottled in Sudan. It started in 1937 with Mr. G. D. Pasgianos. In 1999, thecompany was acquired by Haggar Group. Since its acquisition, the Company hasinvested in capacity and continues to provide unique national flavours to thecarbonated soft drink market.
Graph 7: PFB Emissions per Activity
16

DYNAMIC International Oil Well Services is Sudan's leading national oilfieldservices company, supplying solutions and integrated project management thatoptimize drilling and production performance for customers working in the oiland gas industry.
Founded in 2006 by Haggar, the company offers the industry's most complete lineof drilling tools and services, as well as the most advanced technology ofcementing equipment and down hole tools.
DYNAMIC had an average of 88 employed persons in 2019 working in threefacilities including offices and field operation buildings. It had large numbers ofgoods transported during 2019 resulting in 99% of its emissions and making it thecontributor of 36% of the total Group emissions.
Graph 9: Dynamic Emissions per Activity
SUDASAT is the largest provider of VSATservices throughout Sudan, providingvoice and data connectivity toinstitutions, companies, and individualsacross the country.
In 2019, SUDASAT had 41 employedpeople in two offices and one servicecentre that houses data centres andswitches. The highest source ofemissions came from fuel consumptiondue to reliance on diesel for powergeneration. Sudasat's emissionsrepresent 8.8% of the overall Groupemissions.
17
SUDASAT
Graph 8: Sudasat Emissions per Activity
DYNAMIC INTERNATIONAL OIL WELLSERVICES

Graph 11: Dolphin Nigeria Emissions per Activity
Established in 2013 in Dubai – UAE as an African communications carrier, Dolphinspecializes in Wholesale Capacity and Internet Bandwidth for Carriers, ISPs, andEnterprise customers.
Dolphin aims to be a driving force for the business community of West Africafunctioning as a catalyst in extending global reach, high quality and reliable levelsof connectivity. Dolphin offers full right of landing in Dakar, Accra and Lagoscovering 80% of West African market population.
Dolphin Nigeria had a head count of15 employed persons, in two officebuildings and two service centres. Thelargest source of emissions is thediesel used in buildings due tosignificant power cuts in the country.Thus, consumption of grid electricitydid not contribute significantly to thecompany’s emissions as compared toother companies.
Dolphin Ghana had 30 employedpersons in 2019, based in Accra.Operating in two office buildings andthree Service Centres. Grid electricitywas the largest source of emissionsin the company, followed by businesstravel.
It is worth mentioning that Dolphin in Senegal has only one employed person whois accommodated in a partner company. Thus, it was not included in thisinventory.
Dolphin with both its offices in Ghana and Nigeria contributed with 10.2% of thetotal Group emissions.
Graph 10: Dolphin Ghana Emissions per Activity
DOLPHIN GHANA & DOLPHIN NIGERIA
18

Although this is the fifth carbon inventory carried by Haggar Group, every timecomes with new challenges and additional necessary diligence in the process.Challenges are mostly related to coverage of all activity data that should beincluded but nevertheless fall below the radar of the data collectors. An example ismissing to include the display fridges of Pasgianos Food & Beverages in previousinventories although they are owned by the company and are of significantamounts. These gaps are continuously rectified in future inventories by increasingrigour and diligence of the collection and the conversion process.
The scale of coverage from year to year also changes with the first two inventoriesincluding only Sudan based companies and the last three inventories including allGroup companies either fully owned by the Group or having a minimum of 40%shares.
One of the lessons learnt following the 2018 inventory was the need to set tangiblemetrics to measure progress in environmental activities and climate changeinterventions. These are meant to both measure and encourage Group companiesas well as the Corporate Sustainability & Social Impact department to managetheir operations in a way that curb carbon emissions alongside contribution toenvironmental awareness and education.
With renewable energy being one of the strategic focus areas of the Group, a needto measure progress there was also coupled with a metric as shown below.
These metrics are reported on quarterly and, in addition to other metrics derivedfrom the Sustainable Development Goals, are merged with financial metrics of thewhole Group to reflect what the Group refers to as “Complete Returns”.
The Group sees the “Complete Returns” index as a measurement of money gainedor lost in relation to investments made alongside social and environmental valuethe Group has brought about through its investments and operations in thecountries in which it exists.
LESSONS LEARNT & WAY FORWARD
19
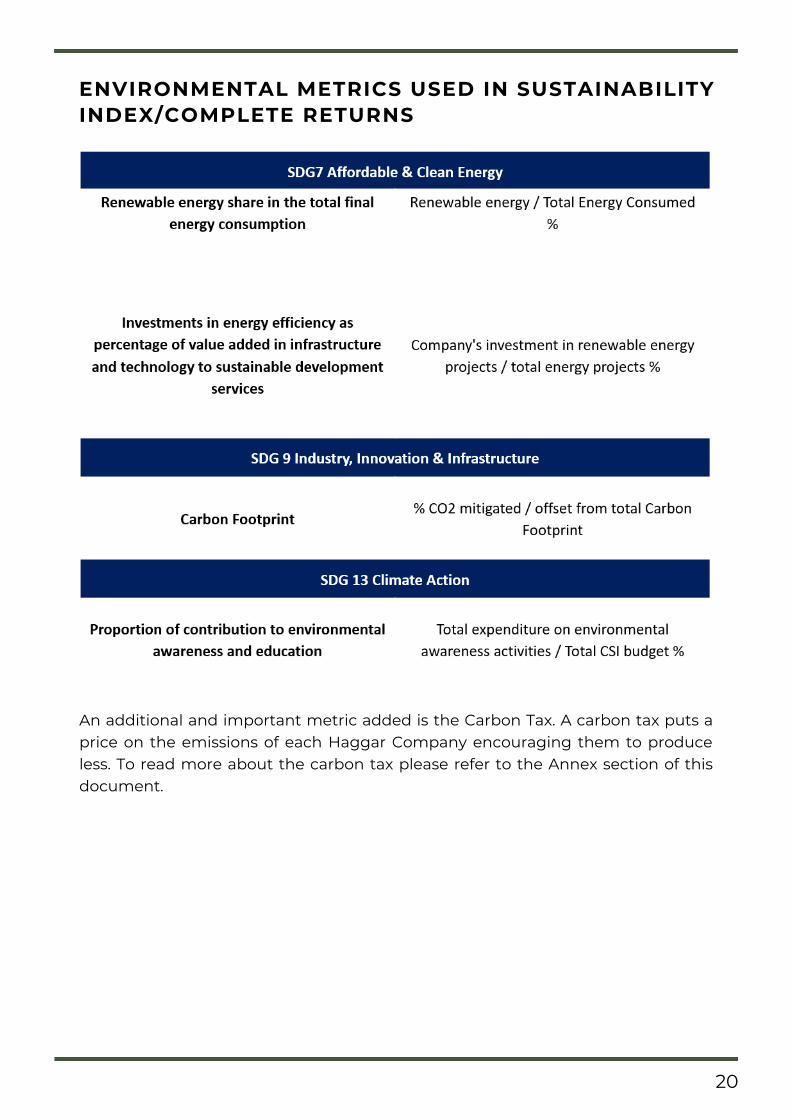
An additional and important metric added is the Carbon Tax. A carbon tax puts aprice on the emissions of each Haggar Company encouraging them to produceless. To read more about the carbon tax please refer to the Annex section of thisdocument.
20
ENVIRONMENTAL METRICS USED IN SUSTAINABILITYINDEX/COMPLETE RETURNS

REFERENCES
Centre for Sustainable Development, (2020) [online], 1.http://css.umich.edu/factsheets/carbon-footprint-factsheet (Accessed October 2020)
2. Corporate Carbon Accounting and Reporting, (2017) [online],https://www.researchgate.net/publication/324727295_Corporate_Carbon_Accounting_and_Reporting_in_Turkey_Analysis_of_Companies_in_the_BIST_Sustainability_Index(Accessed October 2020)
3. LIFE Clim'Foot: Calculate and Reduce Organizations' Carbon Footprint (2018)[online]http://www.climfoot-project.eu/en/what-emission-factor(Accessed October 2020)
4. South Pole Digital Lab (2020) [online]https://www.southpole.com https://svante.green/#/start(Accessed October 2020)
5. The Greenhouse Gas Protocol (2004) [online],https://ghgprotocol.org/about-us(Accessed October 2020)
21

ANNEXES
EMISSION FACTORS
22

ADDIT IONAL DATA
23

Haggar Company Limited Emissions per Activity (tCO2e)
Haggar DMCC Emissions per Activity (tCO2e)
24

Coldair Engineering Company (CEC) Emissions per Activity (tCO2e)
Pasgianos Food & Beverages (PFB) Emissions per Activity (tCO2e)
25

Sudasat Emissions per Activity (tCO2e)
Dynamic International Oil Well Services Emissions per Activity (tCO2e)
26

Dolphin Nigeria Emissions per Activity (tCO2e)
Dolphin Ghana Emissions per Activity (tCO2e)
27
CARBON TAX
Preamble
Under the umbrella of the Corporate Sustainability & Social Impact policy, andbeing a signatory to the UN Global Compact with a commitment to abide by its10 Principles, the Group has launched in 2020 a carbon tax on all of itsCompanies.
A carbon tax sets a price on carbon by defining a tax rate on greenhouse gasemissions. The rate is currently set for 10 USD a tonne, to be reviewed and agreedupon on an annual basis.
All throughout 2020, the carbon tax has been limited to reporting in the monthlyexecutive reports. As of 2021, all Companies/emitters will be paying a tax for eachton of greenhouse gas they emit. This is aimed at encouraging all companiesunder Haggar Group to control their carbon emissions, convert to greener andnew technologies and promote greater environmental responsibility.
Purpose & Audience
The purpose of this document is to give guidance on how the carbon tax isapplied in supporting Haggar’s commitment to go beyond its environmentallegal obligations and make necessary adjustments before legislation comes intoforce.
It targets General Managers of all companies under Haggar and their relevantheads of departments whose operations contribute to the emissions.
GHG Inventory Definition & Methodology
A GHG inventory represents the total emissions of the greenhouse gases (GHG)that includes CO2, N2O, CH4, HFCs, PFCs and SF6 that Haggar Group emits. It isexpressed in mass of CO2 equivalent, caused directly or indirectly by a product,operation, service, or event throughout the company’s life cycle.
The Sustainability & Social Impact Department calculated Haggar Group GHGInventory biennially between the years 2012 and 2018. As of 2019 the inventoryexercise became an annual one. The calculation is based on the standardsdefined in the Greenhouse Gas Protocol Corporate Accounting and ReportingStandard (GHG Protocol).
28

Companies are highly encouraged to exercise diligence and rigour whencollecting the data for the inventory as the data will be converted into CO2 tonnesand consequently taxed.
Calculation Scope
Greenhouse gas emissions are categorized into three scopes by the most widelyused international accounting tool: The Greenhouse Gas (GHG) Protocol as below:
Year 2020: Carbon tax was limited for reporting in DDSYear 2021: Carbon tax will only be applied for Scope 1 and Scope 2 emissions.Year 2022 onwards: Carbon tax will be applied for Scope 1, 2 & 3 emissions.
29
Environmental Research ProjectsClimate Change mitigation & adaptation projects including activities with theHCENR and the Forestry National CorporationProviding grants for students involved in environmental studiesFund green technology transfer for Haggar BU
Payment Methodology
The GHG Inventory report will be initiated in Q2 of each year covering the periodJanuary to December of the former year. The report will be issued end of Q3,following its verification by experts in the Higher Council for Environment andNatural Resources. Once done, the inventory of each Company as well as theamount to be taxed (Scope 1 and Scope 2) will be shared with the GeneralManager. This amount is to be factored for in the budget of the subsequent yearto be paid by the beginning of each quarter to the Group finance department.
The report will also highlight areas of significant emissions where processes couldbe altered, optimised, or managed in a way that would reduce emissions.
The said amounts will be dedicated to the implementation of environmentalinitiatives similar but not limited to the below:
1.2.
3.4.
30


Haggar Group CorporateSustainability & Social Impact
Department
Email: [email protected]
https://www.haggargroup.ae