Embed Size (px)
Citation preview
1
Companhia Vale do Rio Doce
Pursuing long-term
value growth
Pursuing long-term
value growthNew York
May 15, 2007

2
”This presentation may contain statements that express management’s expectations about future events or results rather than historical facts. These forward-looking statements involve risks and uncertainties that could cause actual results to differ materially from those projected in forward-looking statements, and CVRD cannot give assurance that such statements will prove correct. These risks and uncertainties include factors: relating to the Brazilian and Canadian economies and securities markets, which exhibit volatility and can be adversely affected by developments in other countries; relating to the iron ore and nickel businesses and their dependence on the global steel industry, which is cyclical in nature; and relating to the highly competitive industries in which CVRD operates. For additional information on factors that could cause CVRD’s actual results to differ from expectations reflected in forward-looking statements, please see CVRD’s reports filed with the Brazilian Comissão de Valores Mobiliáriosand the U.S. Securities and Exchange Commission.”
Disclaimer

3
Agenda
A multilane road to value creation
Continuous improvement
Growth outlook remains strong

4
A multilane road to value creation
A multilane road to value creation

5
Over the last years we delivered 20 major projects creating new platforms of value creation
1Q02 2Q02 3Q02 4Q02 1Q03 2Q03 3Q03 4Q03 1Q04 2Q04 3Q04 4Q04 1Q05 2Q05 3Q05 4Q05 1Q06 2Q06 3Q06 4Q06 1Q071Q02 2Q02 3Q02 4Q02 1Q03 2Q03 3Q03 4Q03 1Q04 2Q04 3Q04 4Q04 1Q05 2Q05 3Q05 4Q05 1Q06 2Q06 3Q06 4Q06 1Q07
Funil
Alunorte 3
Carajás
70 Mtpa
Sossego
Candonga
Aimorés
Alunorte4&5
São Luís
Trombetas
CapãoXavier
Pier III PDM
Mo I Rana
FábricaNova
Taquari-Vassouras
Capim Branco I
Brucutu
Carajás 85 Mtpa
Carajás100 Mtpa
Capim Branco II
Paragominas

6
Portfolio management has been an important source of value creation
Consolidation Consolidation of of iron iron ore ore leadershipleadership
DivestituresDivestitures of of nonnon--core core assetsassetsUS$ 3.6 US$ 3.6 billionbillion
2000-2006
AcquisitionsAcquisitions: US$ 25.4 : US$ 25.4 billionbillion
Becoming Becoming a a global global leaderleader
in in nickelnickel
Growth Growth plataform plataform in in
coalcoal
-- Unlocking valueUnlocking value
-- Improving capital allocationImproving capital allocation

7
5.47.5
11.1
31.2
35.8
46.8%
54.7%
64.4%
54.3% 53.4%
2003 2004 2005 2006 1T07
Capital invested (US$ billion)
ROIC (%)
The pursuit of discipline in capital allocation pays off: pre-tax ROIC stays above 50%
¹ PP&E + working capital + R&D2 before income taxes3 excludes effect of extraordinary inventory adjustments
Return on capital invested1
2
3333

8
Coal, our newest growth platform
Investment in coal is consistent with our growth and diversification strategy, supported by a strong long-term outlook on coking and thermal coal
Acquisition of AMCI Australia for US$ 656 million provides ongoing operations, experience in coal mining & marketing and diversification into one of the best geographies
Projects
– Moatize, Mozambique – to be approved
– Belvedere, Australia – pre-feasibility
JVs
– Longyu, China – anthracite coal
– Yankuang, China – coke & coking coal

9
Maximizing returns from a world-class iron ore asset
Purchase & usufruct agreements gave CVRD 100%
effective control over MBR for the next 30 years
Exposure to MBR performance increases to 100%
from 89.8%
Estimated NPV of synergies of US$ 500 million
arising from mine/mill, port & corporate activities
integration and sharing of operational best
practices

10
Redefining market boundaries in iron ore
We intend to become a player in the Chinese domestic market
focusing on a new customer segment
Our strategy is supported by:
A massive increase in iron ore capacity to 450 million mtpy
in 2011 from 300 million in 2007, to meet the rising
demand from current clients and the new segment
Distribution centers and blending capacity at Chinese ports
A dedicated Brazil-China shuttle line serviced by very large
ore carriers under long-term contracts of afreightment,
which will contribute to reduce average level and volatility
of freight rates

11
Continuing to develop options for profitable growth
An all-time high capex budget (revised) of US$
7.4 billion for 2007
US$ 5.4 billion allocated to organic growth
US$ 4.9 billion allocated to projects

12
An exciting project portfolio is under development
Iron ore & pellets
Carajás
Fazendão
Itabiritos
Samarco
Bauxite & Alumina
Paragominas II
Alunorte 6 & 7Nickel
Onça Puma
Goro
Vermelho
Voisey’s Bay
Copper
118
Salobo I Coal
Moatize

13
A new execution strategy was developed for Goro
Focus on risk management of political,
environmental, technological and operational
factors
CVRD´s proactive relationship with communities
and pollution control technology transferred to
Goro
Key technical parameters resetted to reduce risks
A new team with a focus on discipline on execution

14
Goro is a long-term growth platform
One of the best nickel deposits in the world:
120 million metric tons of P&P reserves @
1.48% Ni, 0.11% Co
Strategic positioning to meet Asian demand
growth
Low cost incremental production of nickel
Capex of US$ 3.2 billion. Estimated production
of 60,000 mtpy of nickel and 4,600 mtpy of
cobalt to be commissioned in 4Q08

15
Onça Puma, another world-class asset, is being developed smoothly
US$ 1.4 billion project estimated to produce
58,000 mtpy of nickel in ferronickel to be
commissioned in 4Q08
Production supported by a 78 million mt P&P
reserves @ 1.80% Ni (saprolite nickel)
Limonite nickel seam located above the
saprolite nickel deposit. Feasibility in progress
to be concluded by the end of 2008

16
Continuous improvement
Continuous improvement

17
Record year to date sales underpinned by strong demand growth
1Q Records
YoY
1Q07 change
Iron ore 58,626 1.1%
Pellets 7,939 34.7%
Finished nickel 71 10.8%
Copper 66 28.8%
Alumina 700 38.9%
Aluminum 134 19.6%
Potash 161 56.3%
Cobalt (mt) 580 19.3%
Railroad cargo¹ 6,035 4.4%
1 general cargo transportation measured in net ton kilometers (ntk)
000´metric tons

18
One of our priorities: the battle against rising costs. Winning another round
3,0913,020
(72)(73)74
US$ million
4Q06 1Q07
Volume
Cost reduction
ER change
Adjusted COGS1 variation
1 COGS less depreciation charges, excluding inventory adjustment

19
High performance leveraged by asset portfolio diversification
Adjusted EBIT margin
2005 2006¹ 1Q07²
Ferrous minerals 49.7% 47.3% 50.9%
Non-ferrous minerals 23.7% 47.3% 52.2%
Aluminum 31.7% 39.5% 39.1%
Logistics 22.4% 28.9% 28.3%
Total 42.5% 43.7% 49.2%
1 pro forma and excluding extraordinary effect of inventory adjustment² excluding extraordinary effect of inventory adjustment

20
0.81.2
1.81.5 1.6 1.6
2.12.6
2.9
4.04.4
4.85.3
5.6
6.2
7.1
8.8
1Q03 2Q03 3Q03 4Q03 1Q04 2Q04 3Q04 4Q04 1Q05 2Q05 3Q05 4Q05 1Q06 2Q06 3Q06 4Q06¹ 1Q07¹
Net earnings remain on a strong upward trend for the fifth year
¹ excluding extraordinary effect of inventory adjustment
LTM net earnings US$ billion

21
Twenty consecutive quarters of EBITDA growth
12.5
10.1
8.3
7.3 7.2 6.5
5.8
5.0
4.0 3.7 3.3
2.9 2.4
2.1 2.0 1.9 1.8 1.8 1.7 1.6 1.5
1Q02 2Q02 3Q02 4Q02 1Q03 2Q03 3Q03 4Q03 1Q04 2Q04 3Q04 4Q04 1Q05 2Q05 3Q05 4Q05 1Q06 2Q06 3Q06 4Q06¹ 1Q07¹
LTM adjusted EBITDAUS$ billion
1 excluding extraordinary effect of inventory adjustment
Ferrous minerals42.8%
Non-ferrous minerals47.1%
Aluminum7.1%
Logistics2.9%
Composition1Q071

22
Growth outlook remains strongGrowth outlook remains strong

23 Source: IMF and CVRD
4.5%4.5%
5.4%
4.9%
5.3%
4.0%
3.1%
2.5%
4.8%
2.8%
4.2%4.1%
3.6% 3.7%
1995 1996 1997 1998 1999 2000 2001 2002 2003 2004 2005 2006 2007E 2008E
Global GDP growth
The global economy remains on track for continued robust growth in 2007/2008

24
50
51
52
53
54
55
56
57
58
Apr-04 Aug-04 Dec-04 Apr-05 Aug-05 Dec-05 Apr-06 Aug-06 Dec-06 Apr-07
poin
ts
Global PMI
Global manufacturing PMI rebounded to the highest level in seven months
A rising new orders to inventory ratio is signaling an acceleration of global IP growth
Source: JPMorgan

25
92 112 148 208 270 320 380545360 372
389395
400405
410
465
2001 2002 2003 2004 2005 2006 2007E 2011E
China RoW
World ChinaChina RoWCAGR 2001-06 9.9% 28.3%28.3% 2.4%CAGR 2006-11E 6.9% 11.2%11.2% 2.8%
603670
725
1,010
Global seaborne demandmillion metric tons
We revised our medium-term forecast for iron ore seaborne demand: a stronger growth is expected
537484452
790

26
There is a structural change in nickel supply
Current production depends on nickel sulphide
deposits => lower costs, well known technology
Production expansion is dependent on nickel
laterites => higher cost, technological and
operational challenges
New projects ramping up only in 2009-2011
27
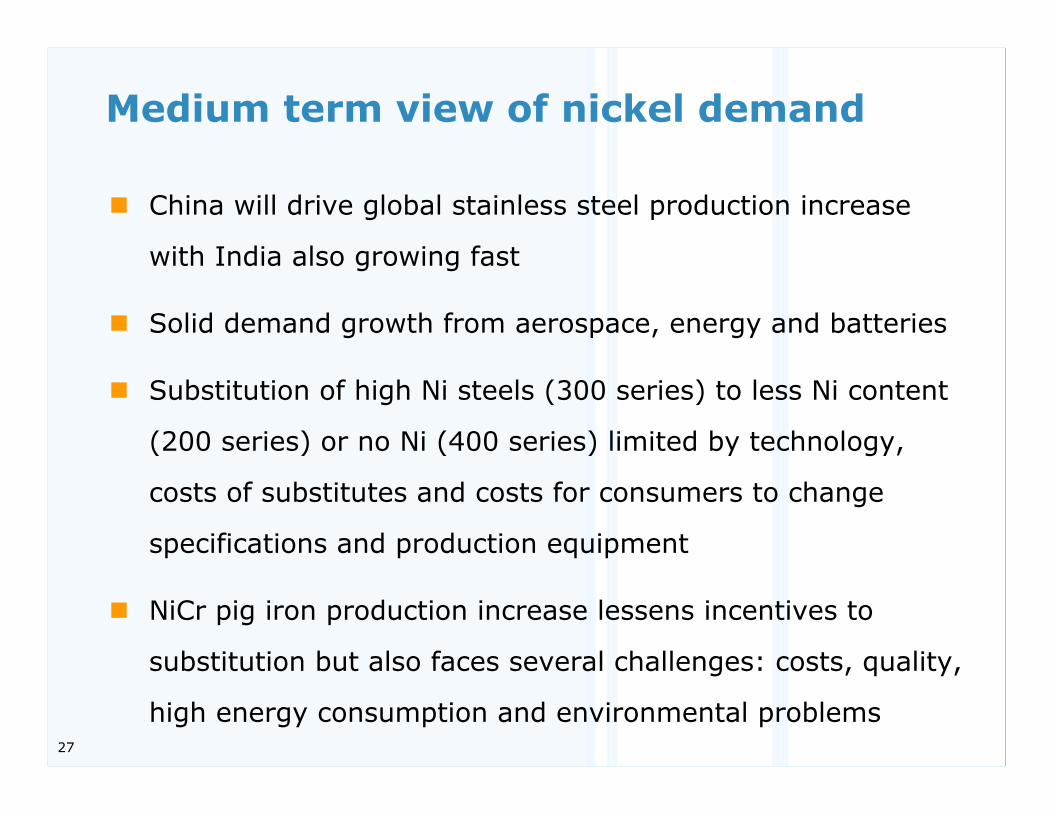
Medium term view of nickel demand
China will drive global stainless steel production increase
with India also growing fast
Solid demand growth from aerospace, energy and batteries
Substitution of high Ni steels (300 series) to less Ni content
(200 series) or no Ni (400 series) limited by technology,
costs of substitutes and costs for consumers to change
specifications and production equipment
NiCr pig iron production increase lessens incentives to
substitution but also faces several challenges: costs, quality,
high energy consumption and environmental problems

28
Tight market conditions for nickel expected to continue in 2007 due to a strong global demand growth even in face of a rising NiCr pig iron output and some substitution
Source: LME
0
5000
10000
15000
20000
25000
30000
35000
40000
2002 2003 2004 2005 2006 2007
mt
0
10000
20000
30000
40000
50000
60000
US
$/m
t
Inventories - LME nickel - 3 month LME

29
Aluminum prices fairly stable supported by strong demand growth. Risk is on the upside given an expected acceleration of global IP growth
0
200
400
600
800
1000
1200
1400
1600
1800
2002 2003 2004 2005 2006 2007
mt
0
500
1,000
1,500
2,000
2,500
3,000
US$/m
t
Aluminum inventories Aluminum price LME 3 months
Source: LME

30
Chinese import resumption reverted the downward trend of copper prices. Multiple supply constraints also contribute to market tightness
Source: LMESource: LME, Comex and SHFE
0
200
400
600
800
1000
1200
1400
1600
2002 2003 2004 2005 2006 2007
mt
0
1000
2000
3000
4000
5000
6000
7000
8000
US
$/m
t
Inventories - LME + Comex + SHFE Copper - LME 3 months