Embed Size (px)
Citation preview

COMP4801 Final Year Project
Mining HKUCS Graduate Student Data: Extraction, Analysis, and
Prediction
Intermediate Report
Supervisor: Dr. Reynold Cheng
Group Member:
Wu You (3035086120)
Xu Fangyuan (3035085530)
Submission Date: 22nd Jan 2017

1
ABSTRACT
Educational Data Mining (EDM) is an emerging field that uses statistical and machine learning algorithms to find patterns in massive educational data sets. It is commonly used to solve problems such as predicting admission outcome and student performance. This project applies educational data mining techniques to the admission data of the graduate programs in the Computer Science Department of the University of Hong Kong (HKUCS). The objective of the project is to build a web application with a user-friendly interface that visualizes and analyses admission data using the following algorithms: Decision Tree algorithm, Association Rule algorithm and Logistic Regression. Based on the admission patterns that are found, the web application suggests a ranked list of candidates for admission decisions. Up to now, user requirements have been gathered and the data have been pre-processed. A prototype with selected data visualizations and data mining algorithms implemented has been built.
ACKNOWLEDGEMENT
The progress of the project and the intermediate report would not have been possible without the kind support and help of different individuals and organizations. We would like to extend our sincere thanks to all of them.
We would like to express our gratitude to Dr. Reynold Cheng, our supervisor, for providing useful guidance for the direction of our project and timely support throughout the project.
We would like to express our thanks to Mr. Jiafeng Hu, who is highly involved in the admission process of the graduate programs in HKUCS, for attending an interview with us and providing us with his in-depth observations on the problem that we are trying to solve.
2
TABLE OF CONTENTS
INTRODUCTION ................................................................................................................... 3
RELATED STUDIES .............................................................................................................. 3
SCOPE ...................................................................................................................................... 4
Extraction Layer ..................................................................................................................... 4
Analysis Layer ........................................................................................................................ 5
Prediction Layer ..................................................................................................................... 5
DELIVERABLE ...................................................................................................................... 5
METHODOLOGY .................................................................................................................. 6
PROJECT PROGRESS .......................................................................................................... 7
Requirements Analysis ........................................................................................................... 7
Data pre-processing ................................................................................................................ 7
Prototype ................................................................................................................................ 8
DIFFICULTIES AND PROPOSED SOLUTIONS ............................................................ 11
FUTURE WORK ................................................................................................................... 11
CONCLUSION ...................................................................................................................... 12
REFERENCE ......................................................................................................................... 12
LIST OF FIGURES
Figure 1: Example of mouse-over to display detailed applicant data.. ............................... 4
Figure 2: Proposed user interface of HKUCS EDM tool ................................................... 6
Figure 3: Visualization of the distribution of applicant’s research interest ........................ 8
Figure 4: Data selection for scatter plots visualization. ...................................................... 9
Figure 5: Scatter plots visualization example ..................................................................... 9
Figure 6: Interface for Decision Tree Classification ........................................................ 10
Figure 7: Association rules generated by the Apriori algorithm ...................................... 11
LIST OF TABLES
Table 1: Attributes of application data ............................................................................... 8
3
INTRODUCTION
Educational data mining (EDM) is a growing research area that aims at studying educational problems by exploring data originating from educational context. [1] It is generally acknowledged that substantial valuable information is embedded in the educational data. Unfortunately, EDM is still not playing a part in the admission decision-making process in the Computer Science department of the University of Hong Kong (HKUCS). Each year, HKUCS attracts hundreds of applications from students all over the world for doing a graduate study. From these applications, numerous data have been collected, including student profiles, academic performance, research interests, scholarships, teachers’ comments and admission decisions. However, these data have not been well utilized due to the complexity of the large range of data to be analyzed. Therefore, the goal of this project is to develop an educational data mining web application, which can make use of the graduate students’ data to conduct data extraction, visualization and analysis. Moreover, based on the analysis, the application ranks applicants by their performance and predict admission results. With these functionalities, the EDM application finds important patterns or trends that provide insights into the admission strategies as well as facilitate the admission process of HKUCS.
This intermediate report proceeds as follows. It first examines the previous studies conducted in the field of Educational Data Mining. It also outlines the objective and deliverable of this project. Then it discusses the methodology and approach used to develop the web application. Furthermore, it provides information about the current progress of the project and the plan for next step.
RELATED STUDIES
In general, the techniques most commonly used in Educational Data Mining include Association Rule, Classifications and Regressions. [1] There are some existing projects that build data mining tools with these techniques and generate satisfying outputs. They are listed as follows with an evaluation of their relevance to this project.
Mashat et al. demonstrated the use of Association Rule in EDM. They applied the Apriori algorithm, one of the association rule mining algorithms, on the university admission to extract relations between different attributes like GPA and courses taken by the students. [2] These relations provide insights to compare the importance of different assessment criteria during the admission process. The use of Apriori algorithm in association rule mining is adaptable in this project.
Feng et al. established a university admissions decision-making model by utilizing the Self Organizing Map neural network, cluster analysis, Association Rule and Fayyad data mining model. [3] Their model astutely takes geographical data into consideration and develops a new reference for admission scheme and propaganda. [3] Their experiment on applying SOM to analyze geographical data draws lessons on how to make use of the origins of the applicants in our project.

4
Fong et al. designed a hybrid web recommender system of Neural Network and Decision Tree Classifier to predict university admission in Macau. They applied back propagation algorithm to train and build a learning model that calculates a weighted importance of different attributes. Then they run Decision Tree Algorithm to build the classifier of the recommender system by adding the most important attribute every time till the error rate of the decision tree built stops to decrease. [4] The hybrid model can be applied to the project to derive the ranked list.
Other methods such as linear and logistic regression will also be considered and studied in the project.
SCOPE
Given the complexity of the problem, there are different perspectives to understand the data. Thus, the scope of the project is divided into three layers.
Extraction Layer
The first layer is to extract data that are identified as useful based on users’ requirements and present them in an understandable way. The web tool visualizes the application data in different graphical forms, such as a tree-map and a bar chart. Unlike the existing charts in the system which focus on one attribute, the web tool generates charts that concern multiple correlated attributes, whose association will be discovered by the data mining algorithms. Users can interact with the visualization by actions such as mouse-over to easily view further information (See Figure 1 as an example).
Apart from that, the web tool provides users with an easy-to-use interface to create customized visualizations. The users can select a set of attributes to be included and the kind of visualization to be used such that there are more flexibilities for them to manipulate the data.
Figure 1: Example of mouse-over to display detailed applicant data.

5
Analysis Layer
With the data extracted, the web tool provides users with different methods to make analysis and discover patterns in the application data. It implements a set of data mining algorithms, including Decision Tree algorithm, Association Rule algorithm and Logistic Regression on the student data. On top of that, it creates a user friendly interface for the users to easily apply the algorithms to conduct analysis.
Given the variety of the potential user groups, the analysis layer is divided into Simple and Advanced mode. In Simple mode, users can get the data mining results without knowing how the analysis is conducted. This mode is targeted at users without prior knowledge to data mining and want a one-click approach to get some insight from the data.
In Advanced mode, users are given more control to conduct customized analysis. The tool provides an interface for them to specify a set of parameters such as the algorithm and threshold value to use (if any) and the attributes to include.
The web tool also visualizes the analysis results, which include a lot of statistics, in different graphical forms such that it can be easily understood by the users and thus presented to a larger range of audience.
Prediction Layer Based on the patterns found, the web tool builds a classifier to process the incoming application data and classifies the applicants into different categories to facilitate the admission decisions. The functions provided are listed as follows:
• Smart filtering. This function allows users to filter the applicants based on one or more constraints, such as applicant’s research interest and GPA.
• Intelligent matching. This function suggests candidates to a specific professor or a research interest group based on their research interests and patterns found in the students previously admitted to this professor or research interest group.
• Outcome prediction. This function makes predictions by generating a numerical value for each applicant. Based on the value, it suggests a ranked list of applicants to users as potential candidates for short-listed interview, potential candidates for a program and potential candidates who will accept an offer.
DELIVERABLE
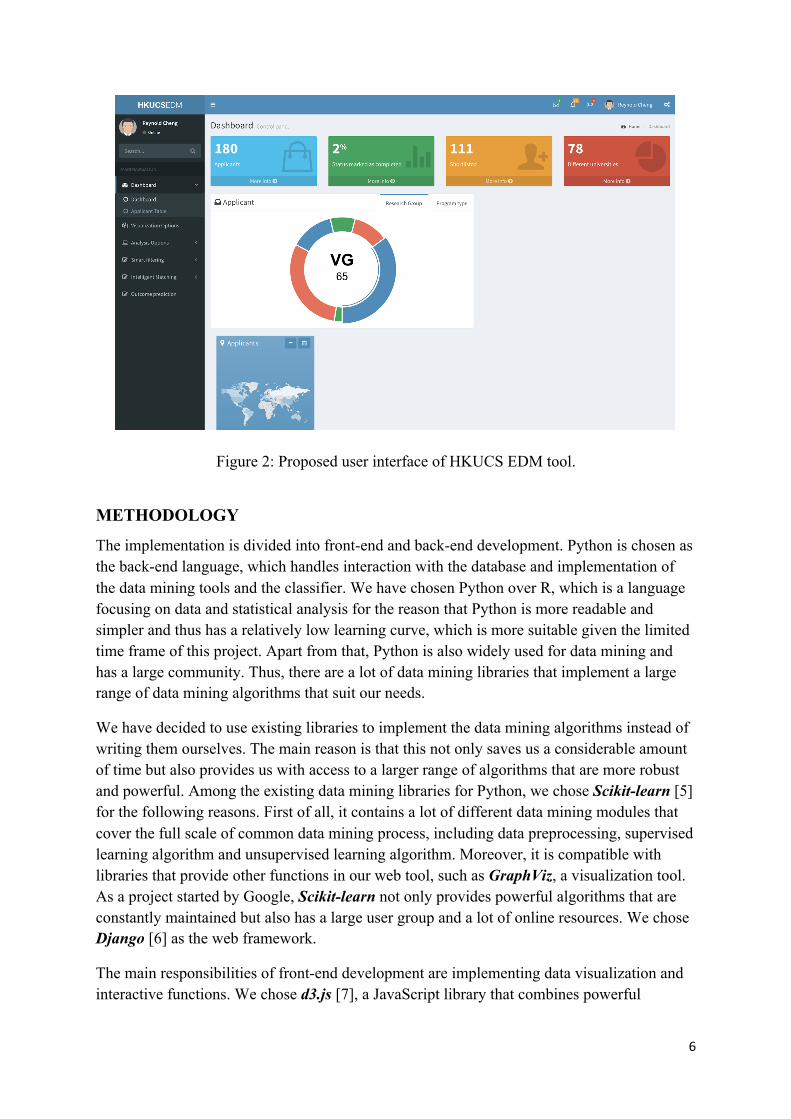
The deliverable of the project is a web tool integrated into the existing web-based admission system for the HKUCS graduate programs. The web tool communicates directly with the database and provides a user-friendly interface (See Figure 2) with a set of functionalities that help make sense of the data. Progress can be checked on the project website: http://i.cs.hku.hk/fyp/2016/fyp16019/
6
Figure 2: Proposed user interface of HKUCS EDM tool.
METHODOLOGY
The implementation is divided into front-end and back-end development. Python is chosen as the back-end language, which handles interaction with the database and implementation of the data mining tools and the classifier. We have chosen Python over R, which is a language focusing on data and statistical analysis for the reason that Python is more readable and simpler and thus has a relatively low learning curve, which is more suitable given the limited time frame of this project. Apart from that, Python is also widely used for data mining and has a large community. Thus, there are a lot of data mining libraries that implement a large range of data mining algorithms that suit our needs.
We have decided to use existing libraries to implement the data mining algorithms instead of writing them ourselves. The main reason is that this not only saves us a considerable amount of time but also provides us with access to a larger range of algorithms that are more robust and powerful. Among the existing data mining libraries for Python, we chose Scikit-learn [5] for the following reasons. First of all, it contains a lot of different data mining modules that cover the full scale of common data mining process, including data preprocessing, supervised learning algorithm and unsupervised learning algorithm. Moreover, it is compatible with libraries that provide other functions in our web tool, such as GraphViz, a visualization tool. As a project started by Google, Scikit-learn not only provides powerful algorithms that are constantly maintained but also has a large user group and a lot of online resources. We chose Django [6] as the web framework.
The main responsibilities of front-end development are implementing data visualization and interactive functions. We chose d3.js [7], a JavaScript library that combines powerful

7
visualization components and a data-driven approach to DOM (the Document Object Model for HTML) for the reason that it not only contains frameworks for different types of visualization but also uses a functional style such that users are able to reuse code and add customized functions to style and manipulate the data.
PROJECT PROGRESS
Requirements Analysis
We gathered user requirements to better understand aspects that are crucial to admission. We conducted interviews with Dr. Reynold Cheng, the head of graduate admission in HKUCS, and Mr. Jiafeng Hu, who is responsible for highlighting important data from applications in early stage of admission process. We found that the evaluation of applications in the initial stage of the admission process is very time-consuming for professors who are already busy with their own schedules. Thus, it will be very helpful if the web application can extract useful information and make sensible recommendations to them. Besides, we identified several criteria considered important for admission apart from those already in the admission database: whether a student has the potential to receive Hong Kong Postgraduate Fellowship and whether a student will accept an offer if given.
Apart from that, we also assessed the usability of the existing system. We found it difficult to evaluate an applicant given all the attributes presented in a paper-like format. Apart from that, we found that the existing graphs in the system only contains comparisons based on one attribute. However, since many of the attributes are inter-correlated and they all contribute to the result together, this kind of graphical presentation fails to provide an in-depth analysis of the data. Thus, we figured out that data visualization would be a useful way to increase efficiency in the admission process. Based on the requirements captured and the problems found, we derived the functions mentioned in Scope and pick out the following questions to analyze:1) Whether an applicant will be admitted or not; 2) Whether an applicant will accept the offer or not; 3) Whether an applicant will receive Hong Kong Postgraduate Fellowship or not; 4) Whether an applicant will be admitted to a specific professor or a research interest group or not.
Data pre-processing
We gathered the existing admission data of 2016, which includes 30 attributes for each applicant (Table 1). We first pre-processed the admission data that contains attributes of different forms and converted them in a uniform format. For numerical data of different scales, such as GPA and QS Ranking for universities, we used standardization methods to convert them into values that are comparable. For categorical attributes such as research interests and awards, we encoded them into numerical values.
To apply the data mining algorithms to the data, we divided the data equally into training set and testing set with Numpy. The training set data is used for building the model and the testing set data is used for verifying the accuracy of the model. The data are stored in a MySQL database and are accessed by MySQL Connector.

8
1. gender 6. gpa_ug
11. major_pg_other 16. Interest2
21. tc (teacher comment) 26. CET6
2. apply_for (program type)
7. gpa_ug_scale 12. gpa_pg 17. Interest3 22. toc
27. shortlisted
3. university_ug 8. rank_ug 13. gpa_pg_scale 18. english_tests 23. status
28. norm_gpa_ug
4. major_ug
9. university_pg 14. rank_pg 19. papers 24. reference_no
29. norm_gpa_pg
5. major_ug_other 10. major_pg 15. Interest1
20. hc (helper comment) 25. toefl
30. QSRanking
Table 1: Attributes of application data.
Prototype
We then built a prototype with selected data visualizations and data mining algorithms implemented. The website is hosted locally and communicates with a local MySQL server.
In the dashboard page of the website, we implemented different forms of interactive data visualization so as to provide users with an overview of the application data. For example, a professor can easily identify the distribution of applicant’s research interests from the pie chart visualization (See Figure 3).
Figure 3: Visualization of the distribution of applicant’s research interest.

9
We also implemented one of the most versatile and useful form, scatter plots. Rather than simply plotting a set of data points on an x and y axis to represent two sets of variables, we added three more representation methods, size, color and label in order to achieve a multidimensional presentation of data with up to five attributes. Users are able to map variables to the appropriate representation method so as to understand the data in an intuitive way. For example, a professor can use different colors to identify applicant’s research interest by dragging the “interest” variable to the field under “COLOR” so that the professor can easily find the groups of applicants that match his or her research area (See Figure 4).
Figure 4: Data selection for scatter plots visualization.
After mapping different attributes to each representation method, the application generates the scatter plots visualization for users to better understand data (See Figure 5).
Figure 5: Scatter plots visualization example
From Figure 5, users can easily find out that John should be one of the most qualified applicants since he has the highest grade point average and has published the most research papers. Moreover, professors in different research areas can easily identify the applicants that share the same research interest by different color.
As for the analysis part, we built the Advanced mode of the following two algorithms: Decision Tree Classification and Association Rule. Users can easily navigate to the analysis

10
part from the selection column. We created a simple interface (see Figure 6), where users can choose the algorithms to apply on the training set data and get the accuracy of model on the testing set data in the Description box.
Figure 6: Interface for Decision Tree Classification.
We implemented Decision Tree Classification with the existing packages in Scikit-learn on the training set data. Users can build a Decision Tree with a specified depth and a selection from the following attributes: GPA, QS Ranking, TOEFL score, number of publications and undergraduate major. The classification can be made on 1) whether the applicant is shortlisted or not and 2) what kind of program the applicant is applying for.
We applied the algorithm to the training data set and had the following findings:
1. The most important attribute that differentiates whether an applicant applies for MPhil or PhD is the number of papers published before.
2. The most important attribute that differentiates whether an applicant has been shortlisted for interview or not is the ranking of undergraduate study.
As for the Association Rule, we implemented Apriori algorithm, one of the most common Association Rule algorithms. The users can select the attributes to be included and more specifically, they can specify a dividing value for numerical values. For example, if the user chose to include normalized grade point average variable “norm_gpa_ug” and a dividing value of 0.88, then “norm_gpa_ug” will be classified into two binary attributes “high-GPA” and “low-GPA” by a dividing value of 0.88. After the dataset transformation, we used a breadth-first search strategy to derive the three most important measures, support, confidence and lift and presented the mining results.

11
Two of the association rules generated by the Apriori Algorithm are shown in Figure 7. It is interesting to find out that the association rule with a higher QS-ranking has a smaller confidence (0.80) than the association rule with a lower QS-ranking (0.91), which implicates that an applicant from a college with lower QS-ranking is more likely to be shortlisted. As both rules have a sufficiently large support value and lift value, they have certain amount of reliability. Since the result contradicts to the common sense, it might indicate that QS-ranking is not an important differentiating factor in admission.
Figure 7: Association rules generated by the Apriori algorithm.
DIFFICULTIES AND PROPOSED SOLUTIONS
One of the difficulty is the paucity of the data available. At this moment, we only have access to partial admission data of 2016, which might create limitation in the model we build. To address the problem, we will first try to obtain access to more admission data in past years. We will also research on suitable algorithms that can be applied on small amount of data and produce satisfactory mining results. Moreover, we will make the system scalable enough to take in new admission data each year such that the models can be easily adjusted to be more robust.
FUTURE WORK
In January, we will request access to the admission data in 2013-2015. We will then implement Generalized Linear Models in the prototype and evaluate its performance on the data. Meanwhile, we will also refine the implementation of Decision Tree Algorithm and Apriori Algorithm by incorporating more attributes and evaluation methods in the Advanced mode.
In February, we will design and build the interface of the Simple mode. We will then focus on the design and implementation of the appropriate visualizations to present the mining results.

12
In March and April, we will concentrate on building the three functions in Prediction layer. Moreover, we will discuss with the users over the interface design and improve the user interface of the EDM application. We will also integrate the EDM application into the existing HKUCS admission system and carry out the final evaluation and testing of the whole application.
CONCLUSION
This project aims at developing an educational data mining web application for the administrators and teachers of HKUCS to analyze the graduate student data so as to facilitate the admission decision-making process and answer questions that can be crucial to the admission strategies of HKUCS. The prototype completed in the previous phase demonstrated a rather satisfying result and thus it suggests that Educational Data Mining can be of great significant to the HKUCS admission process. In the next stage of the project, more functionalities will be built in the tool with the implementation of other data mining algorithms and more data visualizations. We believe that this application will have a real impact on the HKUCS Admission Programme and can be adapted to improve the efficiency of other human resourcing process in the future.
REFERENCE
[1] Romero C, Ventura S. Educational Data Mining: A Review of the State of the Art. IEEE Trans. Syst., Man, Cybern. C. 2010; 40: 601-618.
[2] Mashat AF, M.fouad M, Yu PS, Gharib TF. Discovery of Association Rules from University Admission System Data. IJMECS International Journal of Modern Education and Computer Science. 2013; 5:1-7.
[3] Feng S, Zhou S, Liu Y. Research on Data Mining in University Admissions Decision-making. International Journal of Advancements in Computing Technology IJACT. 2011; 3: 176–186.
[4] Fong S, Si Y-W, Biuk-Aghai RP. Applying a hybrid model of neural network and decision tree classifier for predicting university admission. 2009 7th International Conference on Information, Communications and Signal Processing (ICICS). 2009; .
[5] Scikit-learn [Internet].: machine learning in Python — 0.18 documentation. [cited 2016Oct2]. Available from: http://scikit-learn.org/stable/index.html.
[6] Django [Internet]. The Web framework for perfectionists with deadlines | Django. [cited 2017Jan21]. Available from: https://www.djangoproject.com/.
[7] D3.js - Data-Driven Documents [Internet]. D3.js - Data-Driven Documents. [cited 2016Oct2]. Available from: https://d3js.org/.