Embed Size (px)
Citation preview

rq711__S
COMORIWEALTH OF AUSTRALIA
ATTMIENT OFDIEVELOPMEW
RUM OF ^MIMOUR© a, 0 KT_,CDOW[\IM-2 21CDP -XVO:CO
Record 1971/3
053356
SOIL SURVEY, DIVISION OF WATSON, CANBERRA, A.C.T.1970
by
J.R. Kellett
The information contained in this report has been obtained by the Department of National Developmentas part of the policy of the Commonwealth Government to assist in the exploration and development ofmineral resources. It may not be published in any form or used in a company prospectus or statementwithout the permission in writing of the Director, Bureau of Mineral Resources, Geology & Geophysics.
BMRRecord1971/3
c.3

Record 1971/3
SOIL SURVEY, DIVISION OF WATSON, CANBERRA, A.C.T.1970
by
J.R. Kellett

CONTENTS
Page
SUMMARY
INVESTIGATION^ 1Sampling^ 1Field classification^ 1Sample preparation^ 1Laboratory testing^ 2
RESULTS^ 2
Soil types^ 2Swelling Soils^ 7
REFERENCES^ 8
APPENDICES
1. Bore logs: Soil types 1 to 10^ 10
2. Test results: Soil types 1 to 9^ 113. The Potential Volume Change Meter Description,
test procedure, presentation of results,reference.^12Fig. 1 Drawing of PVC meterFig. 2 Chart showing swell index plotted
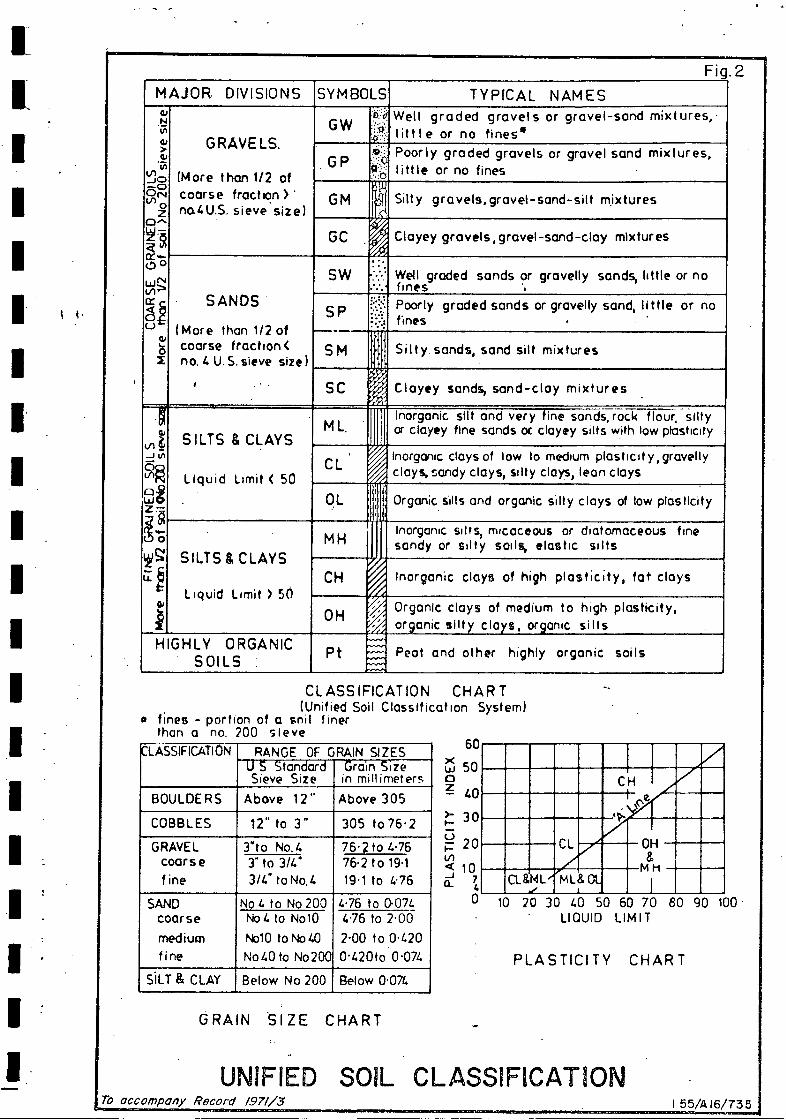
against potential volume change.FIGURE 1 - Locality map and physiographic unitsFIGURE 2 - Unified Soil Classification SystemPLATES
1. Soil map of Watson area, A.C.T. Scale 1 inch:400 feet
2 to 5. Maps showing potential volume change ofWatson soils at differing depths from thesurface: Scale 1 inch: 400 feet
(2) Potential volume change at depth of 1-2 feet(3) Potential volume change at depth of 2-3 feet(4) Potential volume change at depth of 3-4 feet(5) Potential volume change at depth of 4-5 feet
6. Map showing locations of test holesscale 1 inch: 400 feet

SUMMARY
A soil survey of the suburb of Watson in the Australian CapitalTerritory was carried out in 1970 at the request of the CommonwealthDepartment of Works. Its purpose was to make an accurate map of thedifferent soil types in the area and to establish their volume changecharacteristics. Data from the investigation are to be used by the CDWas part of their pilot study of stormwater and groundwater infiltrationinto sewer installations.
Soils which had a similar sequence of identical layers were groupedinto 'soil types'. Field sampling revealed a relationship between soil typesand topography. Parent material ranges from Silurian sediments to Recentcolluvium, but generally the soil is so mature that it no longer depends on thesematerials for its properties. Soil cover ranges in thickness from 2 feet atthe highest elevation in the east to 6 feet on the lowest areas in the south andwest. All the soils show well developed profiles with sharp horizon boundaries,especially those formed in situ from weathering of Silurian sediments.
Estimates of potential volume change in this report are based onswell index properties and should be considered carefully in context withvariations in soil moisture occurring within close proximity to undergroundinstallations. The most potentially expansive clay is the B r, horizon yellowillitic material of the sedentary soils. The most stable sods are the A
qhorizon silts which blanket almost the whole area and range in thicknessfrom 2 to 4 feet.

INVESTIGATION
Sampling: The area was divided into four physiographic units (Fig. 1),using aerial photographs and contour maps. C.S.I.R.O. pedological mapsof areas adjacent to Watson, by Sleeman (1959) and Taylor (1941), werestudied.
Sampling commenced in late March and continued intermittentlyto mid-June. The soils were sampled with a hand auger to a depth of fivefeet or until auger refusal. In all cases the top 6 inches was discarded andborelog measurements were made to the nearest 3 inches.
Sampling was confined to nature strips and recreation areas;residential blocks, which comprise a large proportion of the area, werenot entered. The effects of urban development, especially cut and fillfor roadworks, had to be considered; for example, difficulty was experiencedin sampling the pre-development drainage depressions.
It was necessary to investigate 102 sites before areas of similarsoil types could be delineated with confidence. Soil types of those areaswhich were not entered were interpolated in accordance with an observedrelationship between soil and topography.
Approximately 400 samples were visually classified and represen-tative types were tested in the soil mechanics laboratory. Sample sites areshown in Plate 6.
Field Classification: Soils were grouped in accordance with the 'Unified'Classification system. (Fig. 2).
Many weathered claystones and sandstones were found. Owing tothe disturbed nature of the auger sample, it was impossible to distinguishbetween completely weathered claystone/sandstone and a soil formed insitu from weathering of these rocks. Accordingly, the designation 'completelyweathered' has not been used. The term 'highly weathered' claystone/sandstonerefers to that material in which the texture of the original rock is recognizable,but which will disintegrate in water under hand pressure.
Sample Preparation: Samples were prepared for testing in accordancewith procedures outlined in Australian Standard A89-1966.
Wet preparation of soils containing fragments of weathered claystonesand sandstones was difficult owing to continuing disintegration of the rockparticles in water. Washing for particle size analysis was continued until aclear supernatant liquid was obtained as specified in Australian Standard

WATSON S011_, SURVEYLOCALITY MAP AND PHYSIOGRAPHIC UNITS
To accompany Rec ord 9999/3 155 A16 705
1
Fig. 1
0
o LOWER SLOPES
o DEPRESSIONS
CH
1...
OH
m8,
friCL&ML
-, iML&OL
. I10 20 30 40 50 60 70 80 90 100
LIQUID LIMIT
PLASTICITY CHART
Uia
a-
60
50
40
30
20
10740
Fi .2
MAJOR.^DIVISIONS SYMBOLS TYPICAL^NAMES0,N
.11)
>as
771l'_flo—c)tcilrN
2c::)-.,3w-oo
wiNi.ritx
(-) C,
I
GRAVELS.
(More than 1/2 ofcoarse fraction )na4U.S. sieve size)
G W.‘P.111.•: -.6:...
Well graded gravels or gravel-sand mixtures,..lit t I e or no^fines .
•GP-
.^.::'
0.--'.. :b
Poorly graded gravels or gravel sand mixtures,little or no fines
GM ti. Silty^gravels,gravel-sand-silt mixtures
GC .0,iy.. Clayey gravels, gravel-sand-clay mixtures
SANDS
(More than 1/2 ofcoarse fraction(no. 4 U.S. sieve size)
4
SW .-..%.*.....
Well graded sands or gravelly sands, little or nofines
SP :.!..:-...•...•
Poorly graded sands or gravelly sand, little or nofines
Sm 1 Silt y. sands, sand silt mixtures
•scedi. Clayey sands) sand-cloy mixtures^.
tn Z-L9g
az.—VIF,
WEZ.f)
i
-JillSILTS & CLAYS
Liquid^Limit < 50
.
ML.oIrtl.odrIgaayneiyc fsinilet asannddvseorry ol ianyeeysaz idtss , wrotcnkl ofwlopuirdsstid il ittyy
CL ,Inorganic clays of low to medium plasticit y, gravellyclays, sandy clays, silty clays, lean clays
Qt. „,„- Organic silts and organic silly clays of low plasticity
SILTS & CLAYS
Liquid^Limit ) SO
MHInorganic silts, micaceous^or diatomaceous^finesandy or^silty^soils,^elastic^silts
CH Inorganic^clays of high plasticity, fat clays
OH -:,/
Organic clays of medium to high plasticity,organic silty clays, organic^silts
HIGHLY^ORGANIC-^SOILS Pt Peat and other^highly^organic^soils
CLASSIFICATION CHART(Unified Soil Classification System)
• fines - portion of a snil finerthan a no. 200 sieve
CLASSIFICATIONF RANGE OF GRAIN SIZESU S StandardSieve Size
Grain Sizein millimeters
BOULDERS Above 12” Above 305
COBBLES 12" to 3" 305 to 76.2
GRAVEL 3"to No.4 76.2 to 4.76coarse 3- to 3/4' 76.2 to 19.1fine 3/4" to No.4 19.1 to 4.76
SAND Not, to No 200 4.76 to 0.074coarse Not, to No10 4.76 to 2-00
medium No10 to No40 2.00 to 0.420fine No40 to No200 0 . 420to 0.074
SiLT & CLAY Below No 200 Below 0.074
GRAIN SIZE CHART
UNIFIED SOIL CLASSIFICATIONTo accompany Record 1.971/3 155/A16/735

-2-
A89-1966, Test 7A; hence particle size in situ may be somewhat coarserthan test results indicate.
Laboratory Testing: The. moisture content of every sample was calculated.Plasticity tests and particle size analyses were carried out in accordancewith Australian Standard A89-1966.
No apparatus was available that could accurately measure swellin terms of percentage volume increase; thus it was decided to basevolume change testing on swell pressure characteristics. The 'PotentialVolume Change Meter' developed by Lambe (1960) was used for this purpose.
The apparatus and test procedures are described in Appendix 3.
RESULTS
SOIL TYPES
General: The results of field classification of the soils are shown inAppendix 1 and of laboratory testing in Appendix 2. The terms gravel,sand, silt and clay refer only to the particle size determined by inspectionand not to their mode of origin.
A 23-foot-deep trench near the intersection of Phillip Avenueand the Federal Highway revealed massive, deeply weathered claystonebeneath 6 feet of clayey soil. No bedding or grading was observed in eitherthe claystone or the soil.
Claystone and sandstone from which the overlying soil has beenremoved during roadwork construction was observed in cuts on the Anti11Street extension to the Federal Highway.
In intervening areas a gradation from soil to weathered rocks issuggested by borelogs.
The soils have been classified into ten representative types,* thedistribution of which is shown on Plate 1. In general, clayey soils occupya large proportion of the area, incorporating the upper eastern slopes andlower slopes. The higher middle slopes are composed of much lighterclays with sandy and silty components.
* Characteristic sequences of soil layers. Layer is used in the sense ofdistinct differences in colour, texture, structure and grainsize determinedduring logging.

-3-
Type 1
A shallow residual soil occuring on the upper eastern slopes. Theparent material is Silurian claystone which is encountered at depths of3 to 4 feet. Horizons are clearly defined.
Layer^Averagedepth
1A^6-12 inches
1B^12-18 inches
1C^18-30 inches
Group Symbol*^Description
SM^Grey sand-silt mixture with somegravel-size claystone fragments.
CL^Reddish - brown silty clay.
CH^Mottled red-yellow clay; in manyplaces containing soft claystohelumps.
1D^
30-42 inches^CH^Highly weathered yellowclaystone.
Type 2
A concretionary ironstone gravel capping a ridge in the eastern
Group Symbol^Description
GM Reddish brown silty gravelcontaining hard black iron-stone concretions up to 1,^inches.
corner.
Layer^Averagedepth
2A^
6-24 inches
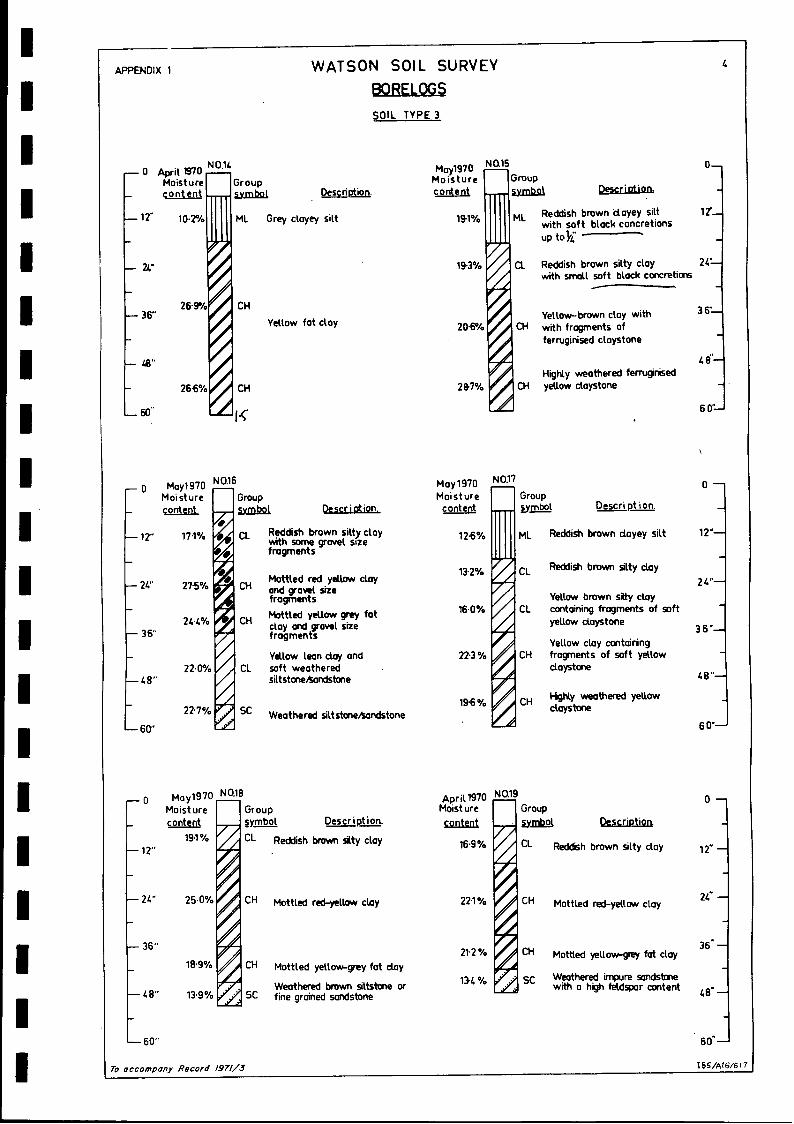
Type 3
A shallow residual soil occuring on the undulating eastern slopes.Parent material is Silurian claystone and fine-grained sandstone. This soilis similar to Type 1, but horizon boundaries are more gradual.
* See Unified Soil Classification (Fig. 2).

Layer^Averagedepth
3A^6-24 inches.
-4-
Group Symbol
CL
Description
Reddish brown silty clay, insome areas with yellowmottling. At some localities6 inches of a reddish brownclayey silt overlies thismaterial. In many placessmall soft black concretions aredotted throughout this layer.
3C^42-51 inches
CH^Yellow fat clay, with grey andred mottling at some sites.Usually friable for the top halfof the layer and becomingmassive with depth. Mineralsidentified by X-Ray diffractionare quartz, illite, and kaolinite.
SC-CH*^Highly weathered sandstone or -claystone; often ferruginized.
3B^24-42 inches
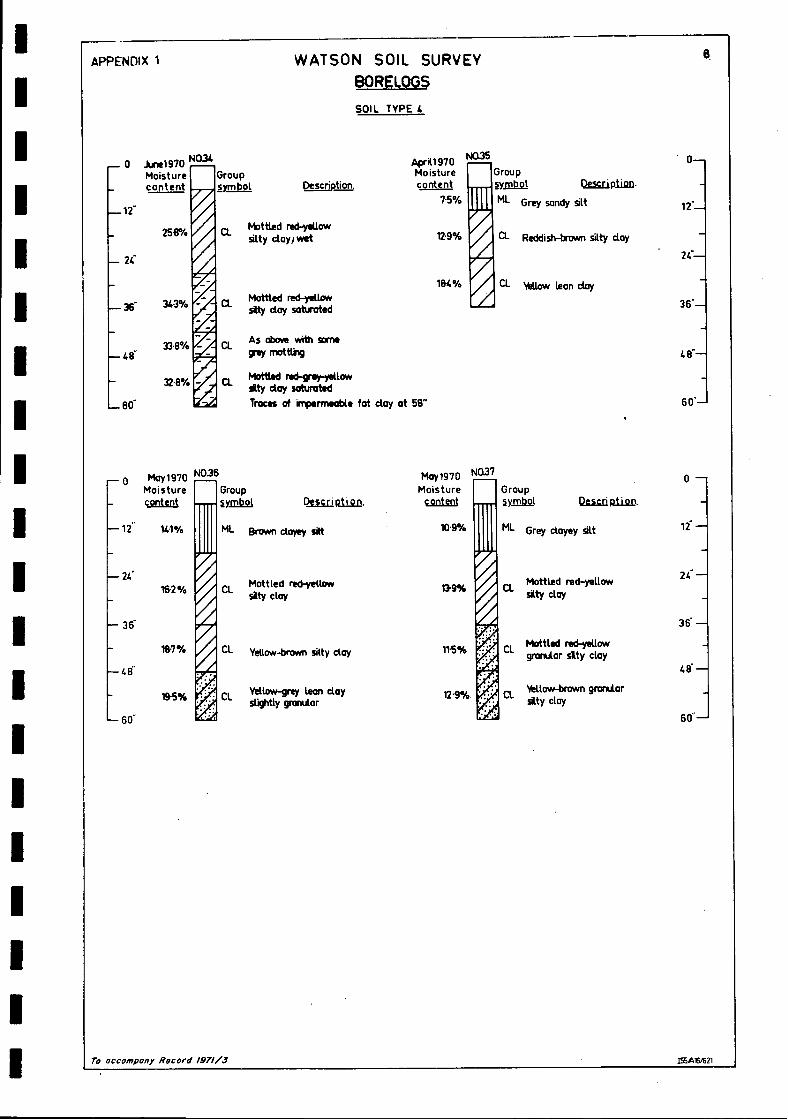
Type 4
A thicker soil skirting the base of the eastern slopes. The silts andclays are granular and friable. Parent material is clayey slopewash.
Layer Averagedepth
Group Symbol
Description
4A
4B
4C
6-18 inches
18-48 inches
48-57 inches
ML
CL
CL
Clayey or sandy silt. Colour isbrown varying from greyish toreddish shades.
Silty clay, usually yellowishbrown. Local red and greymottling.
Silty or lean clay, usually amottled red-grey-yellow colour.More plastic than 4B, but stillfriable.
* SC-C1I, SC or CH

-5-
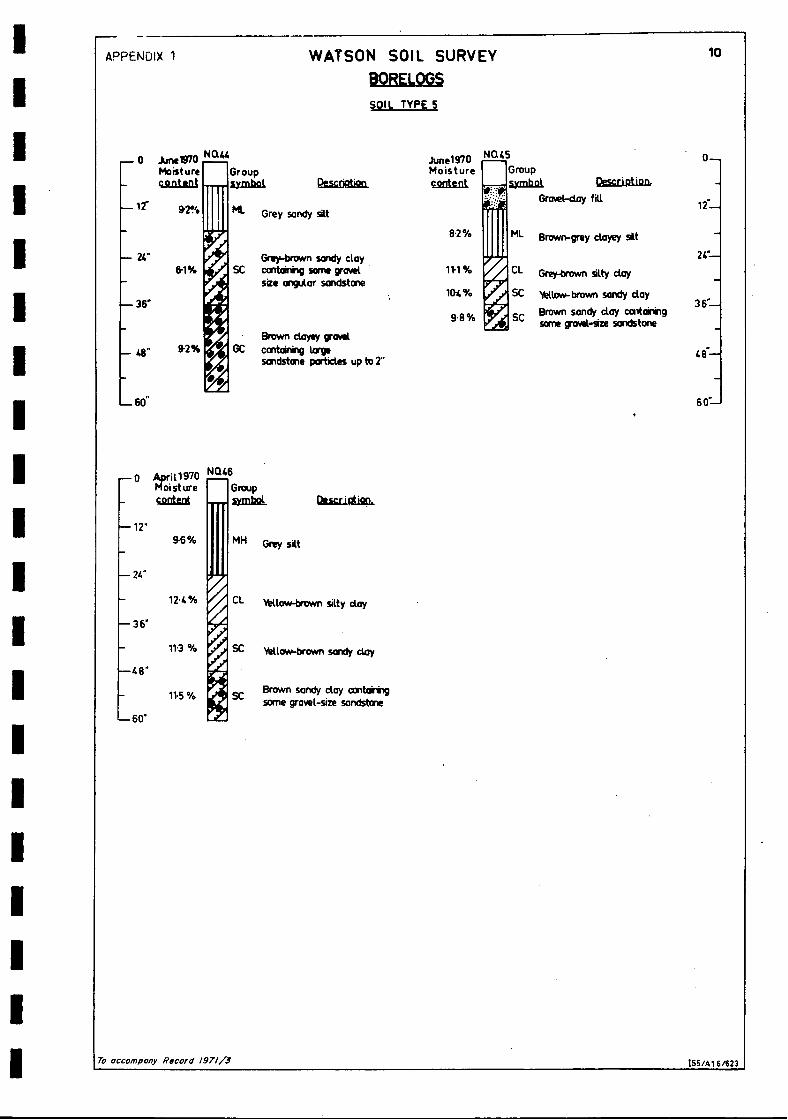
Type 5
A sandy variation of Type 4, occuring at the base of the easternslopes, adjacent to drainage depressions.
Layer
5A
5B
Averagedepth
Group Symbol^Description
6-18 inches
18-33 inches
ML^Grey sandy silt, sometimeswith shades of brown.
SC^Sandy clay or clayey sand.Colour is brown with red,grey and yellow shades.Occasionally silty.
5C^33-54 inches^SC-GC^Clayey sand or gravel-sand-clay mixture, brown withred and yellow shades.
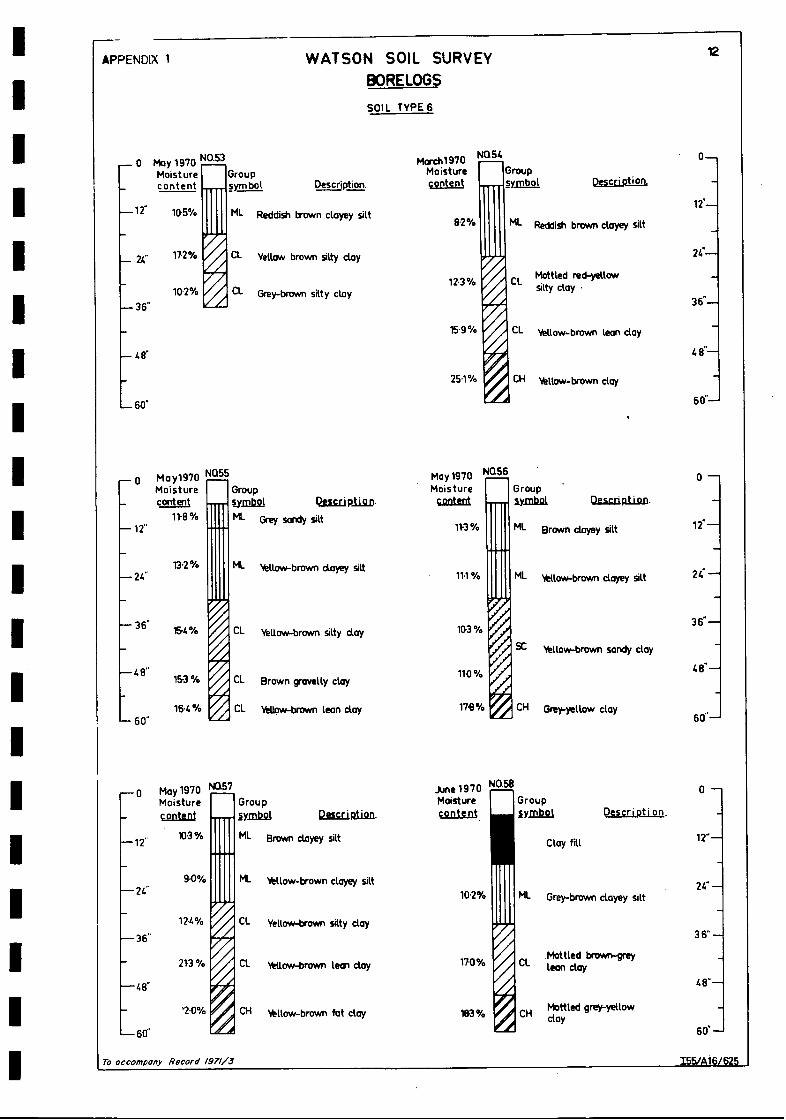
Type 6
This soil occurs on gentle slopes southwest of Types 4 and 5.
Layer
6A
6B
Averagedepth
Group Symbol^Description
6-24 inches
24-39 inches
ML^Clayey silt, usually reddishbrown.
CL^Sandy or silty clay in manyplaces dotted with soft blackconcretions; sometimesgravelly. Colour is brown withoccasional red and yellowmottling.
6C^39-48 inches^CL^Lean clay sometimes silty orsandy but generally moreplastic than 6B. Colour isyellowish brown.
6D^48-57 inches^CH^Heavier clay than 6C but stillfriable. Colour is yellow,sometimes with grey mottling.

-6-
Type 7
This soil occurs on very gentle slopes to almost flat terrainin the southwestern sector.
Layer Average Group Symbol Descriptiondepth
7A 6-27 inches ML Brown clayey silt with grey andred shades.
7B 27-39 inches CL Light brown silty clay.
7C 39-60 inches CH Mottled yellow-grey fat clay,blocky and prism-like.
Type 8
A sandy variation of Type 7, occurring on both sides of the north-west drainage depression. Parent material is indurated fine colluvium.
Layer Average Group Symbol Descriptiondepth
8A 6-12 inches ML Reddish brown clayey silt.
8B 12-21 inches CL Silty or lean clay. Coloursrange from a reddish brownto mottled red and yellow.
8C 21-33 inches CH Heavy clay, usually a mottledred-grey-yellow colour.
8D 33-51 inches SC Sandy clay becoming a clayeysand with depth.
Type 9
The thickest soil in the area, occurring on almost flat terrain, inthe southern corner and running southwest parallel to the Federal Highway.This soil has been developed in situ from weathering of claystone.

-7-
Layer^Average^Group Symbol^Descriptiondepth
9A^6-18 inches^ML^Reddish brown clayey silt.
9B^18-24 inches^CL^Mottled red and yellow siltyor lean clay.
9C^24-39 inches^CH^Mottled red and yellow heavyclay; friable.
9D^39-60 inches^CH^Yellow fat clay, massivestructure. Minerals identifiedby X-ray diffraction are quartz,illite and kaolinite.
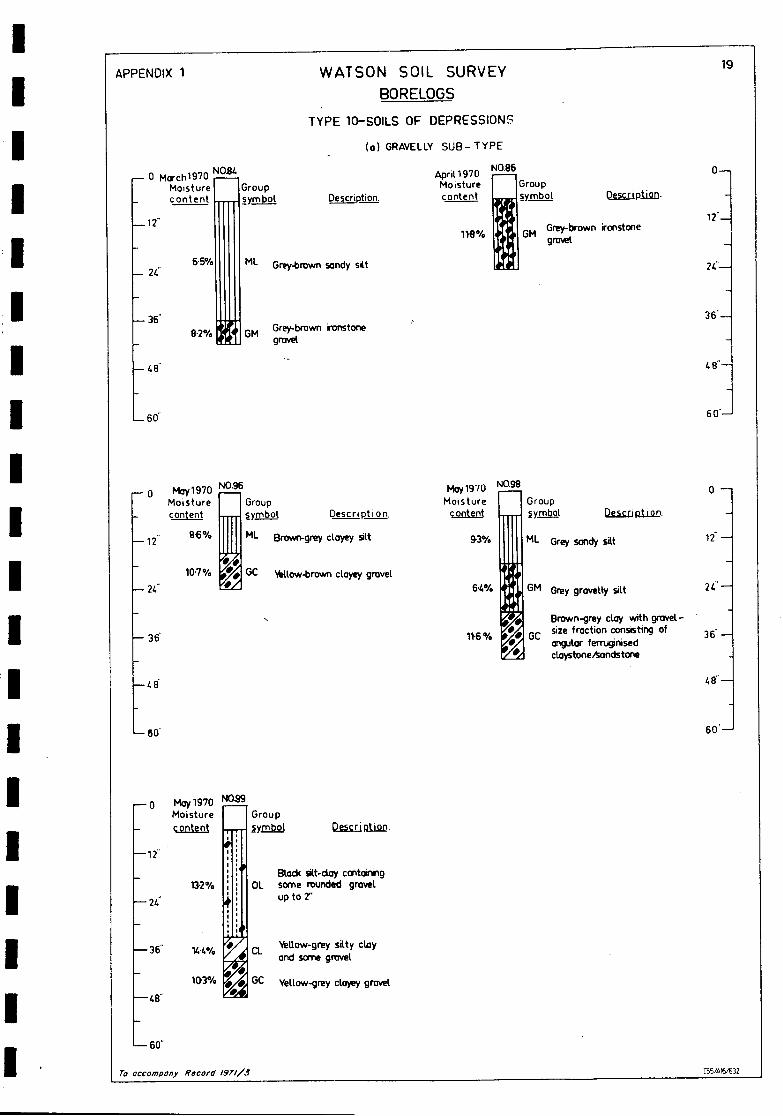
Type 10
Soils occurring in depressions. These soils have been furtherdivided into the following sub-types:
(a) gravelly(b) sandy(c) light to medium clayey(d) heavy clayey
It became obvious in the initial sampling program that a completeinvestigation of these depressions would be time-consuming and complex.Since much of the area occupied by the depressions lies within residentialblocks it was considered that a complete investigation was not practical.
SWELLING SOILS
The degrees of expansiveness of Watson soils were classified asVery High, High, Medium, and Low. The details of these and correspondingindex properties are set out in Table 1. The distribution of potentiallyswelling soils is shown on Plates 2, 3, 4, and 5.
The swelling characteristics should be considered carefully inassessing the causes of disruption of sewer installations in the Watsonarea; they should be considered in context with the variations in soilmoisture occurring within close proximity to the pipeline.

The soil capable of the largest volume change is a massive yellowclay directly overlying Silurian claystone. This clay is located about 2 feetfrom the surface at sites on the upper eastern slopes and on flatter areasalong Phillip Avenue and the Federal Highway. A mottled red-grey-yellowheavy clay usually overlies this material.
The most stable soils are the A2 horizon silts located in the top2 feet of almost the total area and extend to a depth of 4 feet on the highermiddle slopes.
TABLE 1
ESTIMATED DEGREE OF EXPANSIVENESS
Classification Swell Index(1b/sq.ft)
LiquidLimit %
PlasticityIndex %
LinearShrinkage %
Very High >5 000 >60 >35 >15
High >3 500;<5 000 >40<60 >25;<35 >12<15
Medium >2 000<3 500 >30;<40 >20;<25 >10;<15
Low < 2 000 <30 <20 <10
REFERENCES
AS A89 - 1966 - Australian Standard Methods of Testing Soil forEngineering Purposes. Standards Association of Australia, Sydney,N.S.W.
LAMBE, T.W., 1960 - Soil PVC Meter. Technical Studies Report,FHA-701, Federal Housing Administration, Washington, D.C.
SLEEMAN, J.R., 1959 - Preliminary Report on the Soils of the Lyneham -Dickson (A.C.T.) Housing Project. C.S.I.R.O. Divisional Report 10/58.

-9-
TAYLOR J.K., 1941 - Soil Survey of C.S.I.R.O. Experimental Farm,Canberra, A.C.T. C.S.I.R.O. Divisional Report 5/1941.

-10-
APPENDIX 1
Borelogs

APPENDIX 1 WATSON SOIL SURVEYBORELOG$50IL TYPE 1
— 0 Apri L1^NO1970^•^ 46^NQ211970 ^ 0—
^
Moisture'^ Group^ Moisture^Group
^
content^SN.0112.41^Reigifitign.^content ^ 5Y1Iik9J^Description.
^
84%^sm Grey sand-silt some grovelsize fraction of red and^ 12"—yellow claystone.
- 223%^CH Mottled red-yellow clay and^10.1%^CL Reddish-brown silty clay.^-soft claystone lumps.
2CL-
^
14.7%^CH^Highly weathered yellow— 36"^ cloystone.12.7%^CH Highly weathered yell ow^3w.....,
cloystone.
— 46"
6—
r0 April197o Na3Moisture
- content
9.7%— 12"
May1970 NO.4 0 —Group^ Moisture II Groupsualastl^Qual Cam.^csetzth^iymkal^aEll p_tio^-
sm^Grey sand-siltsorne gravel^9.1%1111111 sm Grey sand-sasorne gravelsize fraction of red and size fraction of red and^12"—yellow claystone.^ IliP:1 GM yellow claystone.
6•2%^Grey silty gravel containing^_1161^angular cloystone or fine
grained siltstone up to 27Mottled red-yellow cloy.
2 4"—Mottled red-yellow clay and
CH^soft cloystonc lumps.
Highly weathered yellowclaystone.
— 0 June 1970 NO5
^
Moisture^Group- content ^ 5ym1221
Reddish-brown silty clay
— 12"^12.7%^CL^containing fragments of redand yellow claystone.
256%
—24"
253%
—36"
22•7%
— 4 8"
—60"
2 6.2%
2 5.7%^CH
23•5%^CH
—48"
To accompany Record 1971/3
Mottled red-yellow cloy.
Mottled red-yellow clay andsoft claystone lumps.
Highly weathered yellowclaystone
I55/A16/614
— 36"
3 6"—
48"—
60"—

APPENDIX 1^ WATSON SOIL SURVEY^ 2
BORE LOGSSOIL TYPE 2
— 0 April1970 NO' 6 ^Moisture^Group^content ^Inmbol^Description.
Reddish-brown clayey silt12-^81%^ML with some soft block
III I^concretions up to k
— 24"
9-6%
— 36"
GM
— 49"
— 60"
Apcil 1970 NO 7^o_Moisture^Groupcontent^symb.al^Quarip_tign..
Reddish-brown silty grovelcontaining hard ironstone^12"—
101%^GM concretions up to if'-
24"—
36"--
48"—
60"—
Reddish-browno silty gravelcontaining hard ironstoneconcretions up tosome white mottLlIg
To accompany Record /971/3 135/A16/615

Cu
CH
Yellow-brown cloy withsoft black concretionsLc to b:
Yellow fat day
GroupurnW
Mottled red-yellowCL^silt day
CH fat dayMottled yeU.ow-grey
CH highly weatheredYellow fat day and
cloystone
CH^
Highly weathered yellowciaystone
3 6"—
_
4 9"—
0 moon NO.10MoistureMira_
Group=MA^OLSC.Litaig11.
—12"
Reddish brown silty clayCL^with soft block concretions
up tok
CH^
Highly weathered yellowclaystone
Ferrulifinised weatheredSC^yellow claystone cc fine
grained silt stone
—24"
— 36"
— 4 8"
GroupIY.M122l^poscription,
Mottled red-yellowCL^silty clay
Mottled yellow-greyfat clay
Mottled red-grey-yellowfat clay
Yellow-brown sandy day;appears to be a weatheredfine grained sandstone
CH
CH
SC
t.1 'PENL.X 1 WATSON SOIL SURVEYBORELOG55OIL TYPE 3
may1,370 NO.8
content^Moisture^
GroupEkahiltisu
^164%^ML Brown-grey clayey silt
Moy1970 NC19Moistureuntsni
12.3%
Groupsy.oakal^Qnstiatian,
ML Reddish brown clayey silt
151%
••••••• 0
— 12"
-
— 36"
CL^Light grey silty cloy withfragments of yellow doystone
CL
CH Highly weathered yellowclay stone
Reddish brown silty clay
— 48"
N CI1
0—
12"—
3 6"—
48-
—60"
0 —
12"—
2 4"—
11•%
15-5%
191%
May1970Moisture
c ontent
22-2%
237%
171%
161%
60"—
— 0 April1970Moisturecontent
Nan
Nundctiog.Reddish-brown silty clay
may IanMoistureranted
Groupsymbol
—12"15.9%
CL with small soft blockconcretions
19-6%
—24"
21-7%CH
Yellow fat clay 22.110/
— 36" 29.5%19•2 % CH Highly weathered yellow
cloystone 263%—48"
11504
—60"
NG130 —
12 —
—
36" --
60"--To accompany Record /971/3
155 /A16/61 6
WATSON SOIL SURVEYE3ORELOGSSOIL TYPE 3
4APPENDIX 1
De_KLigics
0 Aprit Ivo NO.14
^
Moisture^Group-^content^unab21
— 12"^10.2%^ML^Grey clayey silt
— 24"
26•9%^CH— 36"
266%V CH
Qessip_tign,
April 1970 NO.19Moisture Groupcontent^5.Y101?-2i
Weathered impure sandstonewith a high feldspar content
21.2%^CH^
Mottled yellow-grey fat clay
114%^SC
_60
- o May1970Moisturecontent
NO.16
—12" 171%
— 24" 27.5%
-24.4%
— 36"
22.0%—48"
22.7%
—60"
Yellow fat clay
Description.
Reddish brown silty claywith some grovel sizefragments
Mottled red yellow clayand gravel sizefragments
Mottled yellow grey fatclay and gravel sizefragments
Yellow lean clay andsoft weatheredsiltstcne/sariistone
Weathered siltstone/sandstone
Mottled red-yellow clay
Mottled yellow-grey fat clay
Weathered brown siltstone orfine grained sandstone
NO.15May1970Moisture^Groupcontent 11 vmbo
Reddish brown clayey siltwith soft black concretionsup tali:
113%
Yellow-brown clay with20.6%^CH with fragments of
ferruginised claystone
Highly weathered ferruginised28.7%^CH yellow daystone
May1970 NO.17Moisture^Group
content^symbol
ML^Reddish brown clayey silt
CL^Reddish brown silty day
Yellow brown sity cloyCL^containing fragments of soft
yellow claystone
Yellow clay containingCH^fragments of soft yellow
daystone
CH Highly weathered yellowclaystone
CL^Reddish brown silty clay
221%^CH^Mottled red-yellow clay
0—
12"—
3 6"—
4
6 0"—
0 --
12"—
2 4"—
3 6"—
48"—
6 0^—'
o —
12" —
2C —
36 —
4r —
60 . —
Issmi6/6/7
—24"^25.0e,
—12"
— 36"
—48"
181%
119%
CH
SC
—60"
TO accompany Record /974/5
May1970 NO.18
Moisture^Groupcontent ^ symbol^Description.
19.1% r^CL^Reddish brown silty clay
Descri Dt ion,
111% IIIIIIML
Cl. Reddish brown silty claywith small soft black concretions
16.0%
116%
112%
213%
116% 1 Description.
16.9%

APPENDIX 1^ WATSON SOIL SURVEY
^5
BORELOGSSOIL TYPE 3
May1970Moisturecontent
NO* 20GroupUm:11201 Description.
May1970Moisturecontent
NQ21GroupUMbial^Description
0—
_ 12" 25-4% CL Reddish brown silty clay 30-4% CL Mottled red-yellowsilty clay
1 r-
— 24" 216% CL Yellow-brown lean clay24-
29-5% CH Yellow fat clay
— 36" 225% CH Mottled yellow greyfat clay Highly weathered
3 6"—
20-6% CH yellow claystone _
22-0% CH Eighty weathered
— 48" yellow claystone 4 8--
60" 6 0—
1
To accompany Record I971/3^ 155/416/618

6WATSON SOIL SURVEYBORELOGSSOIL TYPE 4
— 12"7.6%
0 May 1970 Nan ^Moisture^Group
• content^syrn bo
1 1
• "
^
12-8%^CL
— 48"
CH Mottled red-g-ey yellowcloy
Description
10-3%
Mottled red-grey yellowLean clay
Mottled red-yellowsilty clay
CL
— 36" 187%^CL Mottled red-grey-yellowLean clay
May 1970 NO.25Group^ Moistureinab_at^Qejsi- pj jan^content
ML Grey-brown clayey silt
Sand lens, saturated
181 %^CL Mottled red-grey-yellowLean cloy
9-6%
—48"
— 60"
—0 M a y1970 "324Moisture
- content16.8%
—12"
216%
—24" 10.4%
10.4%
139%
113%
NO.270 April 1970 NO26Moisture^Groupcontent^SYMbig
12"
moy1970
Moisturecontent
110%
113% Ill IIML Reddish brown dayey silt^112%
Mottled red-grey sandy clay/12.5%^SC sand particles are small
hard ironstone concretions36"
Yellow-brown lean clay17-8%^CL with soft black
concretions48"
Yellow-brown fat clay'1% VJI CH with soft black
VJI^concretions60"
24"
Qsasb piiao
To accompany Record /971/3
SMGrey gravelly silt containingangular fine grainedsandstone up to)i
Mottled red-grey-yellowsilty cloy
CL
PligiD
24".—9.5 %^ML Yellow-brown clayey silt
Yellow-brown silty cloy^3 6"—
154%^CL Mottled red-grey-yellowLean clay
6 0"—
5-6%
CL
13-0%
May 1970 NO23Moisture^Groupcontent^symbol
1 !
A
, •
12"—
4 8'•
12.7%
APPENDIX 1
— 36"
Grey gravelly silt contairingSM angulce the grained
sandstone fragments up tali
Yellow-brown silty clayCL with fragnents of
sandstone
Groupsy.rj^Didcrilli/CLD
ML Grey sandy silt
ML Grey-brown dayey silt
ML Yellow-brown clayey silt
CL Yellow-brown silty clay
GC Brown clayey gravel
o —Group5 ymkal^Qescr ptjgnML^Grey-brown clayey silt
12"—CL^Yellow-brown silty clay
24"—SC^Yellow-brown sandy cloy
weathered sandstone_
3 6"—
48"—
60"—
155/A16/619
0 —
12"—
24"—
3 6"—
48"—
60"—

7WATSON SOIL SURVEYAPPENDIX 1
0-NO.29
Descr 'align.I^IGroup
symbol
12"—
2C-
36"—
M. Brown clayey silt
Yellow-brown silty clay
_ 0 June 1970 NO28
BORELOGSSOIL TYPE 4
pDescription.
May 1970Moisturecontent
Moisturecontent
Grousymbol
9.2% ML Gm-brown clayey silt
76% 132%
— 2'CL Brown silty clay
10.2%
— 36"113%
12.0% CL Reddish-brown lean day
— 8"Yellow-grey lean clay
SO% CL containing hard ironstoneconcretions up to 3f:
12.0%
— 60"
— 1 2
14,011970 NO30
Groupsyntlao^DescrialLan.
May1970^.N0.31
•
Group5YE112t^Description
Moisturecontent
Moisturecontent
.14ti•ip
Sand-day fill 16-9% CL^Brown silty clay
—24"•41,
Brown silty day— 36* 19.6% ML^Brown clayey silt (saturated) 15.9% CL^containing small hard
ironstone concretions
— 4 8"
221%Yellow-brown silty clay
CL^contoiring softdaystonehandstone
1111%
217%
Yellow-brown silty clayCL^containing small hard
ironstone concretionsMottled red-yellow lean clay
CL^ccntainirg soft black concretions— 60"
— 0 June 1970 N°32 June1970 NO33
Group GroupMoisture Moisture
content symbol^QAtscription content symbol^Descr icon.
—12"110% ML^Grey-brown clayey silt
162% 111111 ML^Grey-brown clayey silt
p.
—24°145% VA Ci^Reddish-brown silty clay
10-4% Grey silty clay
—36"
92% Grey sandy clay111% CL^Yellow-brown silty clay
—48"
11-1% Mottled red-yellowCLgranular silty clay
—60"
To accompany Record 1971/3
0 —
12* —
24--
36- —
48--
60--
0 —
12" . -
2C —
3 6" —
48'—
155416/620
48--Yellow-brown silty clay
CL containing softdaystone/snndstone
6 0 *—
NO35
I^Grouplymbol^1211E.CiP1i911.
ML Grey sandy silt
Reddish-brown silty day
Yellow lean clay
0—
12-
3C-
may .1 970 NO36
Groupagetai pest r i
May1970^N°37Moisture
contentMoisturecontent
141% ML Brown clayey silt 109%
162% Mottled red-yellowsilty clay
131%
197% CL Yellow-brown silty clay 115%
19.5% CL Yellow-grey lean clayst
.
ghtly granular12-9%
ct. Mottled red-yellowsilty clay
Yellow-brown granularCL silty clay
36 —
Mottled red-yellowCL granular silty clay484—
60--
0 —0
—12"
36'
—49'
— 60-
Group5 milt^
Descriatj_qa
ML Grey clayey silt^12-
24 —
APPENDIX 1 WATSON SOIL SURVEY
— 0
—12-
June1970 NO34Groupsymbol
BORELOGS
970Moisture
SOIL TYPE 4
April
Description,^contentMoisturecontent
7.5%
25.13°/0 a. Mottled red-yellowslty clay; wet 12.9%
— 24-
104%
-—36V.)343 CL Mottted red-yellowsilty day saturated
33.8% CL As above with some
— 49- grey mottling
Mottled red-grey-yellow32.6% silty clay saturatedTraces of impermeable fat clay at 59"
48--
6 0-
To accompany Record 1971/3 155A15/521

APPENDIX 1^ WATSON SOIL SURVEY
^9
BORELOGSSOIL TYPE 5
0——0 March/370
NO'41
Moisture- content
Groupsy.mbs11.^Onaiptism:
— 24"
_60
— 413"
7.3 %
131%
•9%
12"—
24"—
3 6"—
4 8"—
6 0"—
SM Grey sand-sit
Reddish brown sandy claySC^containing some gravel size
partides of ferruginised sandstone
Mottled red-yellow silty clayCL^containing soft block concretions
L) to 1f4"becoming sandy
9.3% UIII SM Reddish brown sand-silt
^
%^
Reddish brown sandy clay
SC
^85 %^
Some gravel sizeferruginised sandstone
^
1t34%^CL silty clayMottled grey-yellow
NQ40March 1970Moisture^Groupcontent^SYMQ.2.k gefisriati2n.
—12"
— 24"
— 60"
— 36"
— 4 8"
moy1970 NO'38
Moisture II Groupcontent^lymtgi
11111
161%
12-4%
15.6%
11.8%
16.7%
ML^Grey-brown clayey silt
CLMottled red-yellow
.silty clay
SC Brown sandy clay
GC^Brown clayey gravel
SC Brown sandy clay
Pescr rakeL.
May 1970^NQ39
Dracriatign,Moisture
contentGroup111.0:1—Ni
180% SM Brown sand silt 12"
13-3% SC Yellow-brown clayey sand2 4"
Mottled red-yellow16.5% SC sandy clay
36"Yellow sandy cloy and
178% SC some gravel size finegrained sandstone
4 8 "
60
Juno 19nMoist urecontent
15.3 0/o
13 . 9%
10.3%
87%
Brown clayey gravel containinglarge sandstoneparticles up to 2"
Mottled grey-yellow clay
Traces of impermeable fat clay at 58"
June1970 NO-42Moisture^Groupcontent^UnAld
^DAssziptisa
CL^Brown gravelly clay
SC Brown sandy cloy
— 36"
11.6%^GC
—48"
CL
—60"
To accompany Record 1971/3
NO.43
Descriplim
0Groupsymbol
ML
11111
Grey sandy silt 12"
Mottled grey-yellow sandySC clay containing some
gravel size angular sandstone24
Brown sandy claycontaining some gravel sizeangular sandstone
36 "
48.
Brown clayey grovel.GC Large sandstone
particles up to 2"• 60
165/A16162Z
— 12"^14.7%
—
—24"181%
—
—
—
—
-
—
10WATSON SOIL SURVEYMUMSSOIL TYPE 5
APPENDIX 1
ML Grey sandy silt
NO.44— 0 June1970
Moisture 111 Group^canital^ty.mbal^klabatisa.
^61%^Sc containng some gravelGrey-brown sandy clay
size angular sandstone
9.2%
4-4
_48-
6 0'——60"
— 36"
NO.45June1970Moisture^Groupcontent^=1121^pescriptian,
Gravet-day fill
82% III IIIL Brown-grey clayey silt
111%VA CL Grey-brown silty clay
^
10.4%^SC Yellow-brown sandy dayBrown sandy day containing
^
9.8^SC some cravel-size sandstone
92%
0—
Brown dam grovelGC containing large^ 4 8"—sandstone particles up to 2"
Aprit1970MoistureUnita
N/:146
iltsairgifta. Group
9.6% MH Grey silt
12.4% CL WAlow-brown silty day
113% SC Yellow-brown sandy day
1•5% SC Brown sandy clay contairingsome gravel-size sandstone
To accompany Record 1971/3^ 155/A1 6/623
— 12" 12"--
24"—
3 6"—
_()
—12"
—24"
—3 6"
—48"
—60"

11
0 —
2C-
3
4 8.—
6 0"---
0 —
2C-
36-
4 8- -
60—
0 —
12" —
24 —
36- —
48" —
-
SO" —
15 5 /A16/62 4
APPENDIX 1 WATSON SOIL SURVEYBORELOGS SOIL TYPES
Groupumlat^NE.rimtign.
NQ47—0 1arch1970Moist ureCOC LIJ W2.1digp,
Groupsymbol
101%^CL Yellow-brown silty day
— 24'
19.0%^CH Mottled red-grey-yellowclay
— 36"
CH yellow-brown fat cloy
— 48W
ML Reddish-brown clayey silt
CL Brown gravelly day
85%
8.8%
—.60"
May1970 N249Moisturecontent
GroupUral&^Quid plias.
May1970Moisture
content
NOSO
Qliariplien.mks!Group
215% ML Reddish-brown clayeysilt (saturated) 14.6% ML Reddish-brown clayey silt
15.2% CLGrey-brown gravellyclay
16.3% CL Reddish-brown silty clay
172% CLYellow-brown siltyday 122% SC Brown sandy clay
272% CH Yellow-brown clay 128% Yellow-brown silty clay
Marth1970^NQ 51
DescriRtiOLI
March 1970Moisturecontent
7.7%
NaS2Groupsy.m1101^Qraziratisui
ML^Brown clayey silt
Moisturecontent
GroupIntel
76% ML Brown-grey clayey silt
6.2% ML Brown sandy siltYellow-brow silty day
131% CL cantering soft blackconcretions up to114"
Yellow-brown silty clay120% CL containing soft block
concretions up to IV
24.8% CH Yellow-brown clay
20.0% CH Yellow-brown clay
To accompany Record 1971/3
— 0
— 12"
—2C
— 3 6"
—4 if
— 0
—it
— 2C
—36"
—48"
— 60"
15.5%
APPENDIX 1^ WATSON SOIL SURVEY
^ 12
BORELOGSSOIL TYPE 6
Moy 1970 NO.53_-0Groupsym bol^Description.
0—
(&,criptim
12"—
NQ54
GroupMoist urecontent
MarMchoisi t9u7recontent
^III
—12-^105% ML^Reddish brown clayey silt
!
symbol
8.2%^ML^Reddish brown clayey silt
172% CL^Yellow brown silty cloy 24"—
Grey-brown silty clay121%
ACL Mottled
siltyred-yellow
clay •3 6"—
102%—36"
15.9 °A CL Yellow-brown lean clay
— 48" 4 8"—
251% CH Yellow-brown day
—60" 6 0"—
May1970 NQ55 May 1970^N0.56 0 ——0Moisture MoistureGroup Groupcontent tYX0112.1^ =tent symb91 Qeuripiim
14-^Grey sandy silt113 % ML
118%— 12" Brown clayey silt^12"—
131%—24"
ML^Yellow-brown clayey silt111 % ML^yegow-brown clayey silt^2^-
— 36'^15.4% CL^Yellow-brown silty clay^103%3 6"—
SC^Yellow-brown sandy cloy
— 4 9"153% 110 %CL^Brown gravelly clay
4 8" —
16.4% CL^yellow-brown lean clay^ 170% CH^Grey-yellow clay— 60" 6 0"—
—0^May 1970 ING57 June 19 7 0Na58
0 —Group GroupMoisture Moisture
content Niss-tRii5111.^content Description.
103 'Ye—12" ML^Brawn clayey silt Cloy fill^ 1r-
9.0%— 24"
ML^Yellow-brown clayey silt102%
2C-ML^Grey-brown clayey silt
12.4% CL^Yellow-brown silty clay—36" 3 6" —
213 % CL^Yetlow-brown lean day 170%Mottled brown-grey
CL^lean clay
—48" 4 8--
Yellow-brown fat clay^ 183%Mottled grey-yellow
CH^clay—60" 60* —
To accompany Record 1971/3 155/416/625

May1970 NOSOIIIMoisture^Group
contentsymbol^Qestipiign.
^9.7% 11111 ML Remsh brown clayey silt
ML Grey-brown sandy silt
SC Brown sandy clay
CL Ntllow-brown silty clay
CH Yellow . fat clay287%
NO.59— 0 May 1970Moisture^Group
- content^symbol
Description.
17.3%^ML Reddsh brown clayey silt
— 24
Reddish brown gravelly clayMottled red-grey-yellowsilty clay
Mottled red-grey-yellowsandy clay
—36"
Yellow fat day-
—60"
308%
APPENDIX 1^ WATSON SOIL SURVEY
^ 13
BORELOGSSOIL TYPE 6
12-
48--
6 0-
—0 June 1970 N°81Moisture^Groupc_ggigni^symtak Descri gtip_g
—12
Gravel-clay fkl
12.5%^Cl. Yellow-brown silty clay
— 36"
134%^CL Yellow-brown lean day
— 60"
To accompany Record 1971/3 155/A16/626

NO.63May 1970Moisture^Groupcontent^symbol
0-N0620 March1970r^Moisture^Groupcontent^Imps! Descriitc.21
106% 12–..
2C-
3 6--
ML Reddish brown clayey silt
9.2% ML Brown clayey silt
— 24'
Yellow fat clayCH blocky consistency
— 36" 11.8% K71 CL Yellow-brown sity clay
181%
— 48"16.4%
18.3%Yellow clay friable^49'—CH consistency
Mottled grey-yellowCH fat clay
6 0"—
10.4 'Ye
195 %
21.2%
April1970 N°.65Moisture
content
83%
7.7%
Groupsyrnbk^Des cri
ML Grey-brown clayey silt
MI- Reddish-brown sandy silt
CL Light brown sky clay
24" —
39
• 0 —
8"—
CH Mottled grey-yellowfat clay
201%
6 0"—
April 19 70 NOS7Moisture^Groupcontent^symb_o_l
^Pescr
10-7% .Light brown clayey silt
92% GP Brown sand-gravel mixture
12-0% SC Yellow-brown sandy clay
GC Brown clayey gra*
181% CH Mottled grey-yellowfat clay
0 —
12"—
24' —
3 6' —
48"—
6 0"—
APPENDIX^
WATSON SOIL SURVEY^ 14
BORELOGSSOIL TYPE 7
— 0 April 1970 N061'Moisture^Groupcontent — symbol
^Description.
— 1 2
Mi. Grey-brown clayey silt
—24"
CL Light brown silty clay
Mottled yellow-greyCHfat day
—60"
— n June 1970 NO95
^
Moisture^GroupHD.=^us
^—12"^
15.5%^CL Lot brown silty day
^
—24'^17.0%^CL Mottled grey-yetlow
lean clay
—36"
—60"
— 36"
—49
content^12.ci align.
To accompany Record I97//3 15 S /A 16/6 2 1

15WATSON SOIL SURVEYBORELOGSSOIL TYPE 7
APPENDIX 1
123%
— 36- 101%
— 48- 1,6%
—60-
— 0 march1970 N°68Moisturea Group
_^content^swami
-
11
131%11 11
—
— 24'
April 1970 NO.76Moisturecontent
91%
Groupsymbol^CSIELip1i911.
MH Grey satML Grey-brown clayey silt
•
0—
12--
-
To accompany Record 197173 .^ 155/A16/628
101%
229%
24"—
CL Light brown silty day^36-
4
_
CFI Mottled grey-yellowfat day •
6 0—
A a Light brown silty clay
GC Brown clayey grovel
Ad
CH Mottled grey-yellowfat clay

—12"84%
—24"
10-5%
—36"
o June 1970 N°.73Moisturecontent
Groupmkt^anal alio.
Grey-brown clayey silt
SC yeaow-brawn sandy clay
Mottled yellow-greySC sandy day
Yallani-brownSC^clayey
sand
11.3%
8.9%
APPENDIX^
WATSON SOIL SURVEY^ 16
BORE LOGSSOIL TYPE 8
0 may1970 N069 NO.70June 1970GroupsymIld^Quaiplign.
0—Moisturecontent
Groupsymbol^De_IC__Citri 10n.
Moisturecontent
_12" 12"—Clay fill
14.6% RReddish-brown granularMLdayey silt
— 21." 24"--21.0% CH^Grey-brawn clay
—36" 183% CL^Mottled red-yellowlean clay
15-9% SC^Grey-brown sandy day 36--
110% SC^Yellow-brown sandy day
— 48" 122% SC^Yellow-brown sandy clay 4 8"—
-128% SC^Yellow-grey clayey sand(wet)
—60" 6 0"—
— o June 1970 N071 May1970 NO.720 —
GroupMoisture Moisture Groupc_qintoi Description.symbig content snob&^DescriaLign.
115% CL^Mottled white-brown gravelly day—12' 775% CL^Grey-brown silty clay 12 —
210% CH^Mottled red-grey-yellow day
—24"178% CH^Mottled red-yellow clay
1116% SC^Mottled yellow-weysandy clay
— 36• —
119% SC^Yellow-brown sandy clay— 4E1 92% SC^Yellow-grey clayey sand 4 8"—
— 60" 60-
March19 70 N°74Moisture^Groupcontent^symbol^Oescripti on.
82%^Mt- Reddish-brown dayey silt
Mottled red-yellow119%^CL^.silty clay
116% Mottled red-grey-yellowCH clay
0 —
12"—
—
3 6" —
4 8"—
60"—
1554116/629
—60
To accompany Record 1971/3
—48"

NO132 March1970Moisture^Groupcontent ^ symbol asriplian.
35—
60"—
48"—
ML Reddish brown dayey silt
CH Mottled red-yellow day
CH Ntilow fat clay
0—
12"—
_
24"—
10.2%
Da%
29.2%
tp,
p
— 0 May 1970 N079Moi sture
- content
—12". 8.5%
239%
—36"
198%
—48"
13.0%
—60"
To occompony Record 1971/3
APPENDIX 1^
WATSON SOIL SURVEY^ 17
BORE LOG SSOIL TYPE 9
Groupsyn_apcil
— 0 Aprit1970 Na79Moisture
- content ^
—
255%
—38
/0
— 48"
Description.
Mottled red-yellow clay
Mottled red-grey-yellowheavy day
1143%^ML Reddish-brown clayey silt
301% CH Yellow fat clay
- 60"
Moy1970Moisturecontent
NO.77
Desc r
June 1970^NO.78
Group5yrolaol^Descrig.thlo
0 —_Group
pia!1YMoisture
content12.4% ML^Reddish-brown clayey silt ML^Reddish-brown clayey silt
11.9% CL Mottled red-yellowsilty clay 158% CL Mottled red-yellow
say clay
24 —
173% CH Mottled red-yellowfriable clay
2143% CH Mottled red-greyyellow clay
36" —
22.2% 45—04 %Mow fat clay 199% CH Yellow fat clay
26.6%
60"—
— 0
—24"
— 36"
—48"
—60"
Groupsymbgl^Qnral91120.
j,,1970 Nae°Groupsynlapj Pescription
Moisturecontent
ML Reddish brown clayey silt 229% CH Mottled red-yellow clay
CH Mottled red-yellow clay
253% CH \Wow fat day
CH YE4Low fat clay
Balls of yellow fat clay and Balls of mottled grey-
CHwhite cloystane
Weathered white claystone193% CH yellow fat clay and
fine sandMothered wtite zggx/
o —
11—
24" —
36" —
4e-
60" —
155/AlEvE30

APPENDIX I^ WATSON SOIL SURVEY
^ 18
BORELOGS
SOIL TYPE 9
0 may1070 NOM
Moist ureconte it
GroupsyrANI
—12 - 103% MI Reddish-brown clayey sitt
24 .19-5% CL Mottled red-yellow
silty clay
243% Ci CH Mottled red-yellowheavy day
—36"
—48" 342% CH Yellow tat day
—6 0"
To accompany Record 1971/3 IS5A16/631
GroupDescription.
ML Brown-grey clayey silt
r— 0Moisture
- content8
—12^6%
Description
NO.98May1970Moisture^Group
content
ML Grey sandy silt
Brown-grey clay with gravel-size fraction consisting ofangular ferruginisedclaystonehandstone
GC—48"
— 50'
48"—
60'—
• •10 .7%op., GC Ntallow-brown clayey grovel
GM Grey gravelly silt
May1970 NO.96 0 —
12 —9.3%
6-4%
APPENDIX 1
_ 0 March 1 970Moisturecontent
NO84
DescriptionGroupsymbol
—12"
6.5% ML Grey-brown sandy silt— 24"
— 36"82%
PjfGM
Grey-brown ironstonegravel
48 .
_60'
WATSON SOIL SURVEYBORELOGS
TYPE 10—SOILS OF DEPRESSIONS
(a) GRAVELLY SUB-TYPE
NO.86April1970Moisture^Groupcontent^symbol^Description.
118%GM Grey-brown ironstone
gravel
36'—
CS"—
'
12"—
0—
0'—
19
-
—24"
— 36 11-6%
—
36" —
— 0
— 12"
—36"^14-4%
May1970 NG '99Moisture
onte nt
132% IiGroupsymbol^
Descr I ption.
Black silt-day contairingOL some rounded gravel
up to 7'
Yellow-grey silty clayand some grovel
CL
GC Yellow-grey clayey gravel
— 60"
ro accompany Record 197//3 Tssrn16/63 2
10-3%
— 48"
••

WATSON SOIL SURVEYBORELOGS
TYPE 10—SOILS OF DEPRESSIONS
(0 SANDY SUB-TYPE
20APPENDIX 7
Pescrkplign.
NO.94June 1970Moisture^Group
Description.^content^symbol
8-4%
105%
Grey-brown clayey silt
Yellow-brown sandy clay
Groupsymbol
118%
0—
12"—
24--
NO91_ 0 April1970Moisturecontent
13-2%
Gravel-clay fill
MH Grey silt
Yellow-brown sandy day
— 24-
36"
— 48-
—60"
— 0 May 1970 NO.97Moisturecontent
Groupsymbol^Description.
—12"174% ML^Brown grey clayey silt
—24"Yellow silty clay containing
19-0% CL^some small soft blackconcretions
— 36' CL^As above with some grey mottling19-2%
143% VASC^Yellow-brown sandy clay
White impure kootinitic clay with—48 19-2% CL some traces of chlorite
124% SC^Yellow-grey sandy clay ;
— 60" weathered sandstone
— 0 May1970 N°96
Groupsymbol^Descr i pt ion.
Moisturec ontent
— 12"8-6% Mt-^Brown-grey clayey silt
107% Yellow-brown dory gravel
—24-• dP,
—36"
— 48"
-
—60"
To accompany Record 1971/3 1A33
4 8-
6 0 ° —
mjuneoisit9u7ro NO.102e
content
13.3%
10.8%
Groups ymt_o o_l^Oescri
OH Organic loam
Dark grey silty clay
Grey-yellow sandy clay
Yellow sandy claySC containing highly
weathered sandstone •
24" —
0 —
1 2- —
36- —
_
40 ° —
60'-

3 6 - -
ML^Yellow-grey clayey silt
2 4" —
CL^Dark grey silty clay
Cl^Grey lean clay
CL^Mottled yellow-grey lean clay
21APPENDIX I WATSON SOIL SURVEY
BORELOGS
TYPE 10-SOILS OF DEPRESSIONS
(c) LIGHT TO MEDIUM CLAYEY SUB TYPE
Groupsymbol DescrkpLan.
0 —NO101•I^Group
symbol^Description.
111111 ML^Grey-brown sandy silt
4 5'
June 1970Moisturecontent
NCLIGG
Descriplja_n.
June1970Moisturecontent
I I Groupsymbol
112% ML Grey sandy silt
7.90677% J^ML Yellow-grey clayey silt
10.1% CL Brown silty clay51%
11.5%13.2% CL mottled red-grey lean day
*llow-grey lean clay9% CL containing hard ironstone
concretions up to It.
120%
To accompany Record 1971/3
Groupsymbol 12e.sw- ption
NO83May1970
Description.
Grey-brnwn clayey silt
June 1970Moisturecontent
Moisturecontent
Groupsymbol
72% ML
52%110% CL Grey-brown silty clay
70%16.4% CL Mottled grey-yellow Leon clay
133%
153%
—
— 36-
48 .
june19 .70 , NO.93
Moisturecontent
o —
12" —
2 4--MH Grey silt
/^Mottlen grey-yellowsilty clay
CH Mottled grey-yellow day
Sand clay fill
ML Grey sandy silt
GM Grey gravelly silt
CL Grey silty clay
CH Mottled grey-yellowheavy ctayA_60'
June1970 NO.90Moisturecontent
— 1 2-
Groups ymbol Description
Reddish-brown clayeysilt (saturated)
Mottled rea-grey siltya_clay (saturrited)
*llow-grey teon clay withCI^some small soft red and
black concrr•ions (saturated)
174%
26.6%
— 36
—48'^179%
—60 -
NO.87 0—
4 8'—
6 0 —
3 5 —
48 —
6 0'—
ML Grey-brown clayey silt
3 6 * —
17.6%
0
— 12'
—36 -
— 60-
12"—
6 0"—
1`,5Altyt,

0 —
2C-166%
196%
22.8%
zo/
May19 70 Na92Moisture
ContentGrouprilts.1^
Pescri
ML Reddish-brown clayey silt
3fiReddish-brown silty clay
CH Mottled grey-yellowheal clay
6 0--
APPE... 1^
WATSON SOIL SURVEY^ 22
BORELOGSTYPE 10-SOILS OF DEPRESSIONS
(d) WAVY CLAYEY SUB - TYPE
_ 0
—12 -
Juie1970 NO*85
• Description.
June197 0Moisturecontent
Moisturecontent
Groupsymbol
-Clay fill
— 24-
127% ML Grey silt173%
3fi
175% CH Grey heavy day 177%
—4 8"
1543% CH Mottled grey-yellowfat clay 20.4%
—60"
4 8"—
0—i
12--
2(-
36._
N088
Groupsymbol^
Description.
Sand-clay fill
CL Reddish-brown silty clay
CL Mottled brown-whitelean clay
Mottled grey-yellowCHfat clay
6 0 •—
0 March1970Moisturecontent
N.L89Groupsy.mb Description.
1.-12 68% 11111 ML Grey-brown clayey silt
- 24"10-4% CL Grey-brown gravely day
re— 36' 14.6% CH Mottled grey-yellow
fat day
—1.8"
134% :A CH Mottled grey-yellow day ;.fnable consistency
—60"
0 June 1970 0.95
Moisture GroupC onte nt symbol^Qzsaiption.
—12" 1&7% ML Brown clayey silt
28.4% Red day
—36"
- 30.0% Mottled red-yellow clay
— 48" 26-0% Mottled red-grey-yello.vclay
18f Mottled red-grey-yellow
—60" clay with some softblack concretions
TO accompany Record 197//3
155A16635

APPENDIX 2
Laboratory Test Results
I

3, (PO 121
WATSON SOIL SURVEY^ 1
TEST RESULTS
APPENDIX 2
5^10^20^30
ELAPSED TIME (minutes)To accompany Record I971/3
40^60^80^100 120
155,A164413
I 00
PARTICLE^SIZE^ANALYSIS
DISTRIBUTION CHART80
70
ATTERBERG LIMIT
FLOW CHART
9060
80 50
a^70 40
60 30
50
`c-2 I.
a40
30
e
a22
20
Is
20
i o9
A _L.1 ■ I " I.0.1^0.2^0.4^06^1^2^4^6^10^20^40 60 7
24^25^26 27PARTICLE^DIAMETER^(mm.) MOISTURE^CONTENT %
POTENTIAL VOLUME CHANGE
r10411164"21911281-221360n14 spik
MCISTOVI00 91%
,
/".•/
/
Ir1 4
8250
7425
6600
5775
9950
2475
650
525
4125
0
3300
SAMPLE No. lA
SOIL TYPE^1
SUMMARY
Lower liquid limit^25
Lower ;Acetic limit^17
Plasticity index
Linear shrinkage
Percent gravel^19
Percent sand^33
Percent silt and Clay^48
Swell index ( lb/sq. ft.)^peg
PVC rating^1.5
PVC category^NON CRRICAt.

PARTICLE SIZE ANALYSIS
DISTRIBUTION CHART100
9
50
40
30
20
L_I I0•1^02^0,4 06^1
__I_
4 6^10^20^40 60
PARTICLE DIAMETER (m.tn,)
SUMMARY
Lower liquid limit^36
Lower plastic limit^15
Plasticity index^21Linear shrinkage^11
Percent gravel^6
Percent sand^26
Percent silt and cloy^se
Swell index ( lb/sq. f 1.1^1350
PVC . rating^1.5
PVC category^Nir Critical
ATTERBERG LIMIT
FLOW CHART.
•
80
70
60
50
34^35^36^37^38MOISTURE CONTENT %
7
40
30
SAMPLE No. 1173
SOIL TYPE^1
I
11
1
APPENDIX 2 WATSON SOIL SURVEY^ 2
TEST RESULTS
POTENTIAL VOLUME CHANGE
,
--- .5r"h^—^ Dry(Wm)
MoistON,,)
2-0%
7-7%
—
■ _
_
)
5
•(= ^
8250
7425
6600
577
495
412
Cr
cc
330
247
65
82
10^20^30
ELAPSED TIME ( minutes I
To accompany Record /97/ /3 U (PI) 121
40^60^80^100 120
ISSA16,684

(14 1)^121
APPENDIX 2 WATSON SOIL SURVEYTEST RESULTS
5^10^20^30
ELAPSED TIME (minutes)To accompany Record /971
u o 60^80^100 120
ATTERBERG LIMIT
FLOW CHART
1
70
so
f-J 50
40
PARTICLE SIZE ANALYSIS
DISTRIBUTION CHART
IS
1 00
90
^1 I ^I^ I__140.2^04 06 1^2^4^6^10^20^40 so
PARTICLE^DIAMETER (rn.rn.)
POTENTIAL VOLUME CHANGE
--
1
- Dry(Wre)
Moist(W.)
tarrnediate
4.0%
11.8
118%
---
_____
.... ... , ... ■ ..
//
/
•
//
/... ..,
_
//
/
/.
,
/
825
742
660
577
4950
c
— 4125
Lir'Z
3300
24 75
16 0
825
69
1554116685
80
70
60
so
40
30
CC
CO
3 5
63^
64^65^66^67^68MOISTURE CONTENT %
SAMPLE No. 1 C
SOIL TYPE^1
SUMMARY
Lower liquid limit^66
Lower plastic limit^28Plasticity index^38Linear shrinkage^16
Percent gravel^2
Percent sand^12
Percent silt and cloy^86
Swell index ( lb/sq. f t.)^4200
PVC rating^5-3
PVC category^Critical

8170 121
1
4APPENDX 2 WATSON SOIL SURVEYTEST RESULTS
2^4^6^100-1^0-2^04 06^1
61^62^63^64MOISTURE CONTENT %
65 66 67PARTICLE DIAMETER (
PARTICLE^SIZE^ANALYSIS
DISTRIBUTION^CHART100 SO
70
90 60
BO 50
4070
60 30
50 9
° 2040
07
302I^15
20
1010
9
1 I^I 1-1 1114
POTENTIAL VOLUME CHANGE
ATTERBERG LIMIT
FLOW CHART
20^40 en
Symbot Moulded Moisture Content
^Dry (Ws)
Moist (Vitt:0i
Intermedi
3.7%
13.2%
te(0.2 [WI 3+9%) 2).5%—• —
—•••—••• Wet (Wg 1^24.5%
//
//
/
/I/
/7 /
7
I^I.
. "
/
8250
7425
6600
5775
4950
4125
a.
3300
2475
1650
025
SAMPLE No. 1 D
SOIL TYPE^1
SUMMARY
Lower liquid limit^64
Lower plastic limit^21
Plasticity index^40
Linear shrinkage^15
Percent grovel^20
Percent sand^18
Percent silt and clay^62
Swell index ( lb/sq. f^4800
PVC rating
PVC category^Very Critical
10^20^30
1To accompany Record 1971/3 ELAPSED TIME ( minutes)
40^60^BO^100 120
155A16/586

5WATSON SOIL SURVEYTEST RESULTS
APPENDIX 2
1700
1•9
Non Critical
Swell index ( lb/sg.f t.)
PVC rating
PVC category
10^20^30
ELAPSED TIME ( minutes)To accompany Record 197/A5
90^60^80^100 120
155A16,687
PARTICLE SIZE ANALYSIS^ ATTERBERG LIMIT
DiSTRIEIUTION CHART^ FLOW CHART80^
60
50
90
30
i 0
9
725^26^27^29
MOISTURE CONTENT %
POTENTIAL VOLUME CHANGE
Symbol
—T-
1Mouldeci^Moisture^content
— Dry (W5) 2.0%
Moist (4,0) 6-5%1
I
)/
//
e250
7425
6600
5775
495
2— 412
7
rn
o.330
247
165
52
40
cr 70
▪ 60
50
‘M'
a
.00
90
BO
30
10
PARTICLE DIAMETER (
SAMPLE No. 2 A
SOIL TYPE^2
SUMMARY
Lower liquid limit^26
Lower plastic limit^17
Plasticity index^9
Linear shrinkage^5
Percent gravel^35
Percent sand^23
Percent silt and cloy^42
16.1 ( P11^171

M WO 121
6WATSON SOIL SURVEYTEST RESULTS
APPENDr 2
3633^34^35MOISTURE CONTENT %
155416/688
40^60^BO^100 (205^1 0^20^30
ELAPSED TIME ( minutes )To accompany Record 1971/3
1
SAMPLE No. 3A
SOIL TYPE^3Symbol^Moulded
— — — Dry (144013.0%
Moist (W oe)13-1 %
Moisture C ant ent
0 • 1 40 60tO^200.2^04 06^1^2
PARTICLE SIZE ANALYSIS
I 00
90
BO
a 70
GO
so
ft
40
30
20
LJU^L___1_ _LJL_L_ L_LL.L___^i^x
PARTICLE DIAMETER (mTn.)
ATTERBERG LIMIT
FLOW CHART
\6
5
4
3
0
0 2
23
POTENTIAL VOLUME CHANGE
SUMMARY
Lower liquid limit^34
Lower plastic limit^14
Plasticity index^20
Linear shrinkage^1 0
Percent gravel^1 4
Percent sand^27
Percent silt and clay^59
Swell index ( lb/sq. f t.)^2200
PVC rating^2.7
PVC category^Marginal1650
ma. •••■ MID
825
8250
7425
6600
5775
4 950
412 5
ft
ftL.1
3300
24 75

DISTRIBUTION CHART^ FLOW CHAR80
40
50
M (PO 121 155/A16/689
40^60^BO^100 12010^20^30
To accompany Record 197//3 ELAPSED TIME (minutes)
•
6-86660^62^64MOISTURE CONTENT %
PART CLE DIAMETER lin.m.)
WATSON SOIL SURVEYTEST RESULTS
PARTICLE SIZE ANALYSIS AT TE RBERG LIMIT
30
20
10
t^t^tit01^02^n4 06
POTENTIAL VOLUME CHANGE
•.. ..
Dry (Wto)
Moist (Wolo)
Intermediate
-
......,....
5.0%
14.4%
C0.2(WL) +9 3 20.9%—.—
/
//
//
-^-
//
//
-
1/"..
•./..
e/
.
//
//
.7-
1•''
7
..•.
/
. /
//
/^•"-
/ /
/
825
742
660
577
495
r.
412:
3300
24 75
650
825
SAMPLE No. 313(i)
SOIL TYPE^3
SUMMARY
Lower liquid limit^62
Lower plastic limit^23
Plasticity index^39
Linear shrinkage^16
Percent gravel^1
Percent sand^6
Percent silt and clay^93
Swell index ( lb/sq. f t )^4950
PVC rating
PVC category^Very Critical
70
60
0
t6 20
.5
10
9
I
4^6^10^0^40 60
58
I11
11
1
1
1
APPENDIX 2

M ( P11 121
1 ^ APFENOIX aWATSON SOIL SURVEYTEST RESULTS
65 66 6761^62^63^64MOISTURE CONTENT %
0 10^20 30^40^60^BO^100 i 20
To accompany Record 1971/3ELAPSED TIME )minute)
PARTICLE SIZE ANALYSIS
DISTRIBUTION CHARTtso
70
60
60
• 0
30
14.° 20
Cr
23^,3
10
9
I^II
4^8^10^20^40^60 7
POTENTIAL VOLUME CHANGE
Symbol Moutded Moisture Contelt
^Dry (Wee) 4.9%
Moist (WiN) 122%
1
e
..,
,..•^'
i.•
825 0
742 5
66 00
5775
4950
412 5
3300
24 75
1650
82
0.1^. 0406 1^2
PARTICLE DIAMETER ( m.m
oo
90
80
• 70
▪ 00
soLI
• 40
30
• 20
1 0
^LL__ L
ATTE RBERG LIMIT
FLOW CHART
SAMPLE No. 3 B(ii)
SOIL TYPE^3
SUMMARY
Lower liquid limit^66
Lower plastic limit^2 ePlasticity index^3 8Linear shrinkage^1 5
Percent gravel^NIL
Percent sand^11
Percent silt and clay^99
Swell index (lb/sq.ftt^5100
PVC rating^6.5
PVC category^Wry Critical
155.4k16/690

WATSON SOIL SURVEYTEST RESULTS
APPENOW. 2 9
Cr
1554160591
10^20^30
ELAPSED TIME ( minutes )
40^60^BO^100 120
To accompany Record /971/3
6I (PC) 121
49 5045^46^47^46MOISTURE CONTENT %
26
2648
Percent gravel
Percent sand
Percent silt and clay
ATTERBERG LIMIT
FLOW CHART
SAMPLE No. 3 C(i)
SOIL TYPE^3
SUMMARY
Lower liquid limit^4 9
Lower plastic limit^2 0
Plasticity index^2 9
Linear shrinkage^1 3
Swell index ( lb/sq. f t.)^2050
PVC rating^2.5PVC category^Marginal
9
7
POTENTIAL VOLUME CHANGE
Symbol Mould@ Moisture^Content
— ---- Dry (Ws')
Moist(W100)
2-0%
5.0%
-- hit et um 1iw le (0-1[wt I s 9%1 3-9%
.--,
//
//
/
//
/
.
7
PARTICLE SIZE ANALYSIS
DISTRIBUTION CHART100
90
BO
cr 70
so
50
((x'
30
20
Co^-
,II^111111 I^I
0.1^02^04 06^1 2^4^6^10 20^40 SO
PARTICLE DIAMETER (mm.)
BO
70
60
50
- 40
30
20
IS
6250
7425
6600
5775
4950
uc.r.
tit
4125
3300
2475
1650
525

4PPEND01. 2 WATSON SOIL SURVEYTEST RESULTS
PARTICLE SIZE ANALYSIS^ ATTERBERG LIMIT
DISTRIBUTION CHART^ FLOW CHART30^
70^
60^
c, 70
▪ 60
1^1. • 1 1^lt
0.1^02^0 4 06 4 5^10^20^40 60
PARTICLE DIAMETER (myn.)55^56^57^58^59^60
MOISTURE CONTENT %
POTENTIAL VOLUME CHANGE
SAMPLE No. 3 C
SOIL TYPE
4950
4125
cl4E'0-
3300
SUMMARY
^ Symbol.^Moulded Moisture C tent
— — ---^
111111II
11111r-
V I
Lower liquid limit^58
Lower plastic limit^23
Plasticity index^35
Linear shrinkage^15
Percent gravel^24
Percent sand^22
Percent silt and clay^54
Swell index ( lb/sq. ft.)^4050
PVC rating^5 1
PVC category^Critical
5^10^20^30^40^60^80^100 120
ELAPSED TIME (minutes)To occompony Record 1)71/3 155A164592

11WATSON SOIL SURVEY
TEST RESULTS
I554\16/693
40^60^80^100 1200^ 10^20^30
ELAPSED TIME ( minutes)To accompany Record 1971/3
PARTICLE SIZE ANALYSIS^ ATTERBERG LIMIT
DISTRIBUTION CHART
^1-LLLI^1^I .1^L^1^I -1.4,
01^04 06 1^2^4 6^10^20^40 60o• I
100
90
BO
70
Co
50
• 0
PARTICLE DIAMETER (mm.)
FLOW CHART
SUMMARY
Lower liquid limit^35
Lower plastic limit^14
Plasticity index^21
Linear shrinkage^9
Percent gravel^12
Percent sand^21Percent silt and clay^67
Swell index (lb/sq. ft)^1650
PVC rating^2-0
PVC category^Non Critical
8 (PM 121
80
70
60
50
40
0
•33^35^37^39^41MOISTURE CONTENT
SAMPLE No. 4B
SOIL TYPE^4
AV-PENDIX 2
POTENTIAL VOLUME CHANGE
Symbol Mout d e1 Moisture Content
I
— Dry (W$) )
Moist( Woo)
2.4%
5.7%
) _____„. ..•I
//
//
•
5^//
9
7
8250
7425
6600
5775
495
— 412
330
247
165
82

U (PO 121
12WATSON SOIL SURVEYTEST RESULTS
APPE,400
565416^19^50^52MOISTURE CONTENT %
02 0 4 06^1^2^0 6^10
PARTICLE DIAMETER ( m.m.)
20^4 0 60
1554,16,994
12^ 5ID^20^30^40^60^80^100 I 20
ELAPSED TIME ( minutesTo accompany Record 1971/3
PARTICLE SIZE ANALYSIS
90
1 00^ ao
70
so
80 50
70 40
0.1
; 60 50
50 9rY, th.
40 - -20
-- cx
30 3^15
20
9
--6-LA__u_LA.^.S ^I^1 1.
POTENTIAL VOLUME CHANGE
8250
74 25
66 00
Symbol Moulded Nioistoro Contort
SAMPLE^No.
SOIL TYPE
4 C(i )
4 ^Dry (WOo) 41%cloMoist (W I VS%
5715
4 950 SUMMARY
Lower^liquid^limit 19
412 5 Lower^plastic^limit 19
Plasticity^index 30
1.17 Linear^shrinkage 150_
3300 - - —
Percent^gravel 2
Percent^sand 22
Percent^silt and clay 7629 75
Swell^index ( lb/sq. f t.) 3000
PVC^rating 343650
PVC^category Marginal
825
ATTERBERG LIMIT
FLOW CHART

WATSON SOIL SURVEY^ 13
TEST RESULTS
PARTICLE^SIZE^ANALYSIS
DISTRIBUTION^CHART80
ATTERBERG^LIMIT
FLOW CHART
10070
90 60
50,80
cr^70 1
GO 50
50
56.
40
occ
co
20
2
30 --D 15
In
o 9
I I II_ I _I_^1-1.4
8
0.1 0.2^0 4^06^1^2^•^6^10 20^40^60 742^44^45^46
PARTICLE^DIAMETER^(mm.) MOISTURE^CONTENT *4
8250
7425
6600
495
— 412
330
247
165
5775
82
POTENTIAL VOLUME CHANGE
Symbol
_
Moulded bLo'biloDry (Wso)
Moist (W40)
Canter;3.7%
125%
_
)
5
/
//
/
o
I/iI
SAMPLE No. 4C(i)
SOIL TYPE
SUMMARY
Lower liquid limit
Lower plastic limit^17
Plasticity index^29
Linear shrinkage^13
Percent grovel
Percent sand^24Percent silt and clay^71
Swell index (lb/sq. ft.)^2600
PVC rating^32
PVC category^Marginal
5^10^20^30
ELAPSED TIME (minutes)To accompany Record 1971/3
40^60^80^100 120
I55/A16/695
8 (PI) 121

4
APPENDIX 2^ WATSON SOIL SURVEY
^ 14
TEST RESULTS
Sc
PARTICLE SIZE ANALYSIS
DISTRIBUTION CHART100
90
80
rr 70
g 60tro
L.)
40
30
20
10
I 4 AL_L-1-.1-44--^1
01^0.2^0 4 0 6^1^2^4^6^10^20^40 60
PARTICLE DIAMETER (men.)
POTENTIAL VOLUME CHANGE
ATTERBERG LIMIT
FLOW CHART
11I
1
1
1
—98
—33^34^35^38
MOISTURE CONTENT %
8250
7925
577
995
412
330
247
6600
165
Symbol MANiteNtel tlaistwo Contri—
^Dry (Viso) 24%
Moist (Wiwi) 54%
-- ^- ^------ -
,
SAMPLE No. 5B
SOIL TYPE^5
SUMMARY
Lower liquid limit^
35
Lower plastic limit^
17
Plasticity index^
18
Linear Shrinkage^
9
Percent grovel^
27
Percent sand^
26
Percent silt and clay^
47
Swell index ( lb/sq. Ill^1250
PVC rating^1'6
PVC category^Non Critical
5^10^ 20^30
ELAPSED TIME ( minutes)
To accompany Record 1971/3
40^60^80^00 1
155A16/696
(N) 121

APPENDIX 2 15WATSON SOIL SURVEYTEST RESULTS
3
0
23
2
0.1^0.2^0•4 06^1^2 4 6^10^20^40 60
33
SAMPLE No. 5C
SOIL TYPE^5
SUMMARY
Lower liquid limit
Lower plastic limit
Plasticity index
Linear shrinkage
Percent gravel
Percent sand
Percent silt and clay
Swell index ( lb/sq. ft.)^14 50
PVC rating
PVC category^Non Critical
16179
36
26
39
10^20^30^40
ELAPSED TIME ( minutes)To accompany Record 1971/3
60^BO^100 120
15545.15/597
PARTICLE SIZE ANALYSIS
PARTICLE DIAMETER (men.)
ATTERBERG LIMIT
FLOW CHART)
r
r
r
o
)
o NN.)ro
_31^32^33^34^35^36
MOISTURE CONTENT %
POTENTIAL VOLUME CHANGE
Symbol Moulded Moisture Content
- Dry (W50)15%Moist( 14 100 ) 61 %
_
I
...-...
6250
7425
6600
5775
2475
1650
8 2
100
90
BO
c, 70
60
50
a- 40
30
20
4950
2
— 4125La
CC0.
3300
t II LI—^1--L-4.1 1 I L.1_
IA (Pt) 121

16WATSON SOIL SURVEYTEST RESULTS
APPENDIX 2
.155A1609
40^60^80^100 1 201 0^20^30
ELAPSED TIME ( minutes Iro accompany Record 1971/3
00
PARTICLE^SIZE^ANALYSIS
DISTRIBUTION^CHARTBO
ATTERBERG^LIMIT
FLOW CHART
70
9060
80 50
rr^70 40 ^
I^60
E 50 9
301-
:=3 2.1)
30z ,5
20
10I S
9
I I^I A_J-LC)^02^0-4^06^1^2^4^6^10^20^•0^60 7
39 40^41^42 43^44PARTICLE^DIAMETER^ro.ro . MOISTURE^CONTENT %
POTENTIAL VOLUME CHANGE
Symbol Moulded Moisture Content
— Dry (Woo) 3.9%
Moist^(Wiaa)^11 . 1%
//
e/
//
//
I
//
/
8250
74 25
66 00
57,5
4950
24 75
1 650
8 2 5
4)25
7
a.
3300
SAMPLE No. 68(i)
SOIL TYPE^6
SUMMARY
Lower liquid limit^42Lower plastic limit^19
Plasticity index^23Linear shrinkage^11
Percent grovel^18
Percent sand^23
Percent silt and cloy^59
Swell index ( lb/sq. f t.)^2950
PVC rating^3.7
PVC category^Marginal
(P71 121
17WATSON SOIL SURVEYTEST RESULTS
APPENDiX 2
39^39^40^41^42MOISTURE CONTENT %PARTICLE DIAMETER (mm.)
155/A16/699
60^80^100 12010^20^30^40
ELAPSED TIME ( minutesTo accompany Record 1971/3
PARTICLE^SIZE^ANALYSIS
DISTRIBUTION CHART80100
70
9060
80 SO
cr^70 40
60 30
:t0
50
2040
Cr
X30 IS
20
101 0
9
1 1 1111 IL 1111.11.1 1^1,
0.1^0.2^04^06^1^2^4^6^10^20^40^60 7
POTENTIAL VOLUME CHANGE
S bat Madded 'store Content
—Dry (Wm)Moist (
38%
) 12.7%
.....-- . -- .^ -- — — . ---
///
./1
//
i/
I
8250
7425
6600
5775
4950
2475
1650
825
3300
ATTERBERG LIMIT
FLOW CHART
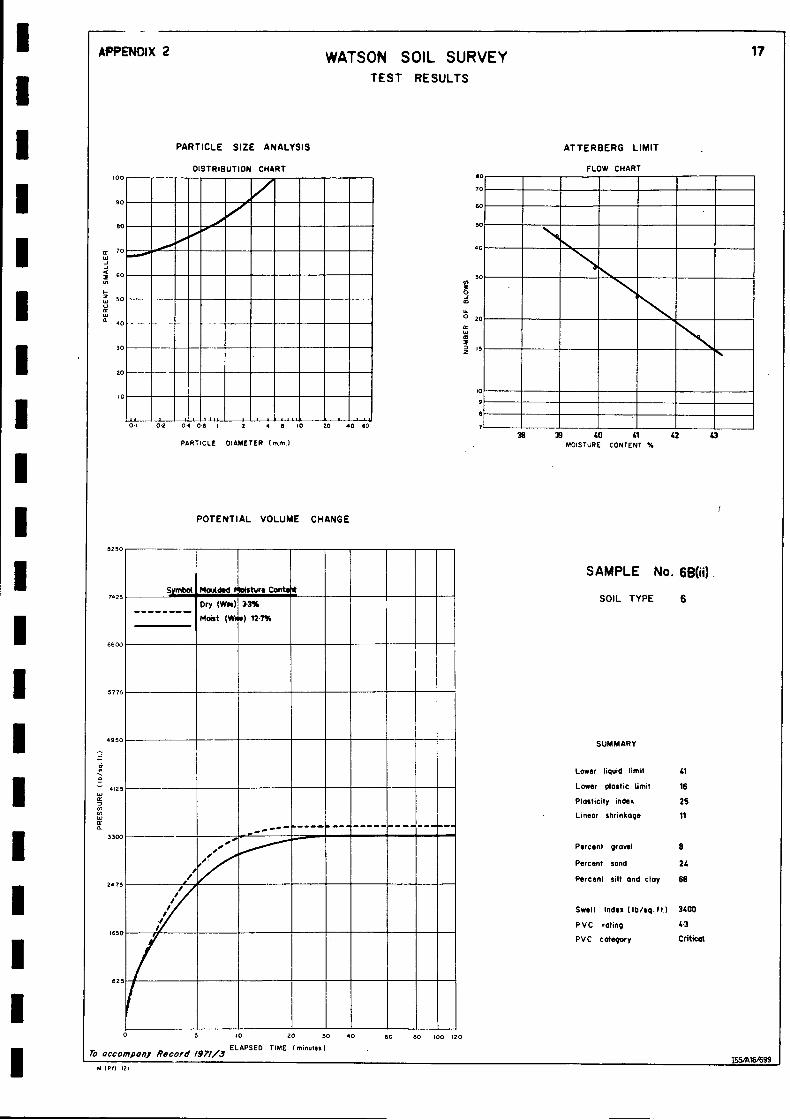
SAMPLE No. 6B(ii)
SOIL TYPE^6
SUMMARY
Lower liquid limit^41
Lower plastic limit^16
Plasticity index^25
Linear shrinkage^11
Percent grovel
Percent sand^24
Percent silt and clay^68
Swell Index^/sq. ft.)^3400PVC rating^4.3
PVC category^Critical
NNNN
M (77) 121

18WATSON SOIL SURVEYTEST RESULTS
APPENDIX 2
3
2
50 5145^47^48^49MOISTURE CONTENT %
5^10^20^30
ELAPSED TIME ( minutestTo accompany Record 1971/3
40^60^80^100 12 0
I55/A16/700
PARTICLE SIZE ANALYSIS
01 0-2^04 06^1^2 • 6^10^20^.40 60
^30 -
20
100
90
IAA^ A.A__
PARTICLE DIAMETER (m.m.)
ATTERBERG LIMIT
FLOW CHART
ti
-
)
-
POTENTIAL VOLUME CHANGE
Symbol Moulded Moisture Content
1
— Dry (Wee)
Moist (Woo)
4.2%
104%1
—
•/
_
•--;;'"e0. •
'°
...." ...
—
i
....^—
..1
_
I
1
/I
•
//
/
//
6250
7425
6600
5775
4950
4125
3300
24 75
1650
829
8
7
6
5
SAMPLE No. 6C
SOIL TYPE^6
SUMMARY
Lower liquid limit^49
Lower plastic limit^22Plasticity index^27Linear shrinkage^13
Percent gravel^25
Percent sand^19
Percent silt ond clay^57
Swell index (lb/sq. f t.)^3550
PVC rating^4-5
PVC category^Critical
54 (PI) 121

8 (PI) 121
19WATSON SOIL SURVEY
TEST RESULTS
APPENDIX 2
10 20^30 40^60^80^100 120
To accompany Record 1971/3ELAPSED TIME ( minutes)
155/A16/701
ATTERBERG LIMIT
FLOW CHART
60
4
50—
0
15
10
8
80
70
53^54^55^56^57^58MOISTURE CONTENT %
SAMPLE No. oilSOIL TYPE^6
SUMMARY
Lower liquid limit^56
Lower plastic limit^19
Plasticity index^37
Linear shrinkage^16
Percent gravel^3
Percent sand^12
Percent silt and clay^85
Swell index (ID/sq. f^4990
PVC rating
PVC category^Very Critical
PARTICLE SIZE ANALYSIS
0-1^02^04 0-6^1^2^4^6^10 20^40 60
0 0
90
80
I 60
50
It
40
30
20
10
1 1II 111I I
PARTICLE DIAMETER ( m.rn.)
POTENTIAL VOLUME CHANGE
Symbol Moulded oisturo Cant t
Dry (Viso)
Moist (W61%1 13.2%
111
iidi IIe
/eo,
/e
-,, 0 •411,,
, A Ill llI%
8250
7425
6600
5775
4950
412
It
330
247
165
62

(PO 121
20WATSON SOIL SURVEYTEST RESULTS
APPENDIX 2
80
70
60
50
40
50
20
IS
PARTICLE DIAMETER (m,,,.)52^51.^. 56^58
MOISTURE CONTENT %
155/A16/702
40^GO^80^100 12010^20^30
ELAPSED TIME ( minutesTo accompany Record /971/3
ATTERBERG LIMIT
FLOW CHART s
NPARTICLE SIZE ANALYSIS
20
io
1111.11111
0.1^02^0.4 0 6^1 2^4 6^0 20^40 60
POTENTIAL VOLUME CHANGE
__
IIIID
, ...,
„ , ,...pr,
,
, , , , , ,
, , , ,
8250
7425
6600
5775
2475
650
525
4950
3300
SAMPLE No. 6D(ii)
SOIL TYPE^6
SUMMARY
Lower^liquid^limit 55
Lower^plastic limit t9
Plasticity^index 36
Linear^shrinkage 15
Percent^gravel 2
Percent^sand 17
Percent^silt and^cloy ei
Swell index ( lb/sq. ft.)^1.500
PVC rating^5•7
PVC category^Critical
100
90
80
• 70
-4 60
50
cr
• 40
30

19 (PI) 121
21WATSON SOIL SURVEYTEST RESULTS
APPENDIX 2
PARTICLE SIZE ANALYSIS ATTERBERG LIMIT
•
•
•
20^205^21^21.5MOISTURE CONTENT %PARTICLE DIAMETER (mm.)
10^20^30^40^60^BO^100 120
ELAPSED TIME ( minutes)To accompany Record 197/A5 155/A16/703
8250
POTENTIAL VOLUME^CHANGE
SAMPLE^No. 7ASymbol. Moulded Moisture Cont
7425 SOIL TYPE 7Moist (Woo) 42%
6600
5775
4950 SUMMARY
Lower^liquid^limit 21
4125 Lower^Plastic^limit
Cs Plasticity^index 5Linear^shrinkage 3
0.
3300
Percent^gravel 2
Percent^sand 33
Percent^silt^and^clay 652475
Swell^index ( lb/sq. ft.) 1000
P VC^rating1650
PVC^category Nan Critical
625
0,1 02I I k
20^40 6004 06^1till! 10
2^4^6^10
FLOW CHART
SO
50
40
30
20
15
100
90
BO
r, 70
; 60cn
50Li
a 40
30
20
to9

22WATSON SOIL SURVEYAPPENDIX 2
30
20
15
0.1^0.2^04 06^1^2^4^6^10 20^40 60
PARTICLE DIAMETER Imp,.)
0 10^20^30 40^60^80^100 120
I55/A16/704
ELAPSED TIME ( mInut*s)To accompany Record /971/3
TEST RESULTS
10
40^41^42^43^44MOISTURE CONTENT %
PARTICLE SIZE ANALYSIS^ ATTERBERG LIMIT
DISTRIBUTION CHART^ FLOW CHART80^
70^
60
40
I^I J
100
90
no
60cn
6 so
‘1'.'^40
30
20
POTENTIAL VOLUME CHANGE
Symbol Moulded Moisture ContI1stpry twosMoist (Woo)
a .3%
1443%
t/
/
e.,
/1
I1
I
I
II
1
I
tti 1P1) 121
13250
.7425
6600
5775
4950
24125
3300
2475
1650
825
SAMPLE No. 78
SOIL TYPE^7
SUMMARY
Lower liquid limit
Lower plastic limit^18
Plasticity index^25Linear shrinkage^13
Percent gravel^7
Percent sand^19Percent silt and cloy^74
Swell index ( lb/sq. f t.)^3350
PVC rating^4.2
PVC category^Critical

23WATSON SOIL SURVEYTEST RESULTS
APPENDIX 2
1 0^20^30
ELAPSED TIME ( minutes)To accompany Record /971/3
40^60^80^100 120
155/A16/705
PARTICLE
DISTRIBUTION
SIZE^ANALYSIS
CHARTI 0O
80
70
90 60
50SO
4070
60 30
950
Lt.° zo40 cc
CO
30 3^15
1010 -
9
7_17--- --1---1— —1 LI I
0.1^0-2^04^06^1^2^4^6^0^0^40^60 7
PARTICLE DIAMETER(mm.)
POTENTIAL VOLUME CHANGE
§
— _ — Dry (Wes
Moist (W4,)
54%
141%
os• .., ...s. ..
.. ...■ ....^.---..--.
.
,
/---./
... ... ......
//
//
/./
/e
//
1,
//
/
/
//
//
IIs
/I
82
SAMPLE No. 7 C
SOIL TYPE^7
ATTERBERG LIMIT
FLOW CHART
69^69^70^7^72MOISTURE CONTENT %
8250
7425
6600
5775
4950
012
CC
330
247
165
SUMMARY
Lower liquid limit^71
Lower plastic limit^2 7
Plasticity index^44
Linear shrinkage^19
Percent gravel^6
Percent sand^7
Percent silt ond clay^97
Swell index ( lb/sq. ft.)^4550
PVC rating^5.9
PVC category^Critical
NNN
8 (Pt) 121

M (PI) 121
24WATSON SOIL SURVEYTEST RESULTS
APPENDIX 2
PARTICLE SIZE ANALYSIS ATTERBERG LIMIT
0^ 5^I 0^20^30
ELAPSED TIME ( minutesTo accompany Record 1971/3
40^60^80^100 120
155/A16/706
POTENTIAL VOLUME CHANGE
Symbol Moutdird Moisture Cent_ Dry WWI VI%Moist (Wts) , 131%
I IIIMI •••..•• --
rr
8250
7425
6600
5775
4950
3300
24 75
165
82
SI50
FLOW CHART
15^16^17^19^19MOISTURE CONTENT %
10
I S a .a../..aa.Al^0.2^0 • 06^1^2^• 6^10^20^40 60
PARTICLE DIAMETER (rn.m.1
100
90
BO
cc
40
30
20
80
70
60
50
• 0
30
° 20
a
22
24125
SAMPLE No. 8 8
SOIL TYPE^8
SUMMARY
Lower liquid limit^49
Lower plastic limit^19
Plasticity index^29
Linear shrinkage^13
Percent grovel^10
Percent sand^34
Percent silt and clay^56
Swell index ( lb/sq. ft.)^3800
PVC rating
PVC category^Critical

M (Pt) 171
25APPENDIX 2 WATSON SOIL SURVEYTEST RESULTS
I55/A16/707
90^60^BO^100 12020^0
ELAPSED TIME I minutes)To accompany Record 197173
PARTICLE SIZE ANALYSIS^ ATTERBERG LIMIT
PARTICLE DIAMETER (m.m.)
POTENTIAL VOLUME CHANGE
Symbol Moulded
Dry (WW1
Moist (Win)
Moisture Cont k^— sa%
121%
_
----......- -..---,.....--,....
.. ../.0
.0
...." ... ,
,/
I/
//
/
I
//
//
///I
24 75
8250
6600
5775
7425
1650
825
4950
— 4125
cn
3300
59^60^61^62^63^64^65MOISTURE CONTENT `Y.
SAMPLE No. SC
SOIL TYPE^8
SUMMARY
Lower liquid limit^62
Lower plastic .limit^23
Plasticity index^39
Linear shrinkage^15
Percent gravel^N IL
Percent sand^15
Percent silt and clay^85
Swell index ( lb/sq. f t.)^1.900
PVC rating
PVC category^Very Critical
DISTRIBUTION CHART^ FLOW CHART100 ^ BO ^
70
60^
0.1^0.2^0-4 0.6^1^2^4^6^10 20^40 60 7
50
90
50
20
15
90
BO
▪ 70
.4
▪
60
E, 50
ce
• 40
30
20

393733^31^35^36MOISTURE CONTENT %
155/A16/709
WATSON SOIL SURVEYTEST RESULTS
26
PARTICLE SIZE ANALYSIS
PARTICLE . DIAMETER (min.)
100
90
60
70
60
,71 50
40
30
20
10
11^1111
0.4 06 1^2^4^6^10^20^40 601
021 I II
0•1
POTENTIAL VOLUME CHANGE
1-
jymbot Moulded Moisture Contek
^ --- Dry (Wst4 1.4%
Moist (Wito) 32%
__. _ _____ _
_
.. ..... •-•-
_ -
8250
7425
6600
5775
0950
— 4125
3300
2475
825
SAMPLE No. 8 D
SOIL TYPE
SUMMARY
Lower liquid limit^36
Lower plastic limit^1
Plasticity index^1 9Linear shrinkage^9
Percent grovel^14
Percent sand^11
Percent silt and clay^45
Swell index lb/sq. f t.)^900PVC rating
PVC category^Non Critical
5
To accompany Record /971/5
(PI) 121
ATTERBERG LIMIT
FLOW CHART
(0^'^20^30
ELAPSED TIME )minutes)
40^60^BO^100 120
AT-I-V.VSIg 2
10
9
BO
ro
60
so
40
50

00
30
APPENDIX 2^
WATSON SOIL SURVEY^ 27
TEST RESULTS
PARTICLE SIZE ANALYSIS^ ATTERBERG LIMIT
DISTRIBUTION CHART^ FLOW CHART80
70^
60
50
40
30
'6. III
215
10
9
0.1^02^04 06^121^25^26^27
PARTICLE DIAMETER ( fn.m.)^ MOISTURE CONTENT °A.
^I^I2^4^6^10 20^•0 60^ 7
6250
7425
6600
5775
4950
412
Cc
cn
0.
330
247
165
82
POTENTIAL VOLUME CHANGE
Symbol Moulded toaisture Canton
^— Dry (Woo) 21%
Moist (W1 75%
_
/5^/
SAMPLE No. 9 A
SOIL TYPE^9
SUMMARY
Lower liquid limit^25
Lower plastic limit^16
Plasticity index^9
Linear shrinkage^4
Percent gravel^2
Percent sand^30
Percent silt and clay^66
Swell index ( lb/sq. ft.)^1450
P VC rating
PVC category^Non Critical
0^ 5^10^ 30
ELAPSED TIME ( rmsutesTo accompany Record 1971/3
40^60^130^100 120
I551A164709

6 (PI) 121
28WATSON SOIL SURVEYTEST RESULTS
APPENDIX 2
ATTERBERG LIMITPARTICLE SIZE ANALYSIS
SAMPLE No. 9 8
SOIL TYPE^9
SUMMARY
Lower liquid limit
Lower plastic limit
Plasticity index
Linear shrinkage
Percent gravel^9
Percent sand^23
Percent silt and clay^89
Swell index ( lb/sq. ft.)^3400
PVC rating^4.3
PVC category^Critical
43
16
2712
155/A16/710
40^60^80^100 12010^20^30
To accompany Record 1971/5 ELAPSED TIME ( rninutn)
POTENTIAL VOLUME CHANGE
S rrt 11 .ol. Moulded Moisture Content--1
^- Dry (WtoMoist (W
1.4%) 133x
..
.. .. ...
.._ ___.
.. ..• .. ..
//
//
/
8250
7025
6600
5775
4950
24 75
1650
025
PARTICLE DIAMETER (m.rn.)
40
ro
50
50
80
15 —
FLOW CHART100
so
80
70
60
20^00 600.2
30
20
lo
0.1
4125
LO'Z
3300

64 (PO 121
29WATSON SOIL SURVEYTEST RESULTS
APPENDIX 2
02^04 0-6^1^2^.•^6^10 20^40 60
PARTICLE DIAMETER (nun.)so^.60^61^62
MOISTURE CONTENT %63^64
B54116/711
40^60^80^100, 1205^10^20^30
ELAPSED TIME (minutes ITo accompany Record 197175
I^I^111111
o .1
PARTICLE SIZE ANALYSIS
POTENTIAL VOLUME CHANGE
•
--•
-- Dry(Wcs)
Moist(Wos)
5%
11-9%
..• ... .... _
/
I,
I/
/
e
//
/1
I
IIIII
IIII1
_
8250
/425
6600
5775
330
2475
165
82
ATTERBERG LIMIT
FLOW CHART
SAMPLE No. 9C
SOIL TYPE^9
SUMMARY
Lower liquid limit^62Lower plastic limit^26Plasticity index^37Linear shrinkage^16
Percent gravel^7
Percent sand^16Percent silt and cloy^77
Swell Index lb/sq. ft.)^4900
PVC rating^62PVC category^Vary Critical
I 00
90
80
c, 70iLL
It
▪
so„,
50
it
40
30
20
10
80
70
60
50
40
30
9
O 29
3
•
Is
i0
9
4950
Fe'r

PA (PO 121
30APPENDIX 2 WATSON SOIL SURVEYTEST RESULTS
II,
70^40 60I^Ili.
0 • 06^1 2^4^6^10
10^20^30ELAPSED TIME (minutes)
To accompany Record 1971/3
40 60 0^100 120
ISSA16/712
PARTICLE SIZE ANALYSIS^ ATTERBERG LIMIT
DISTRIBUTION CHART
PART CLE DIAMETER (min.)
POTENTIAL VOLUME CHANGE
.0"
Symbol. Moulded^oisture ContortPt
2%
//
/
//
— — — — — Dry (Wm)
Moist (WIN 144%
„ Wit(Wp) 274% I/.
/I/
//
II
/
— _ ^
..°.
•.
/
if/
1
ie
• ,.
.. ..
e,1
,o,/
. •.. ".
eo,
e,
.•
.
...••••'.• ..
'
_ —_._
—
100
90
580
4cr 70
g 60
50
CL2'
3
33
,
0.1
23
40
30
20
1IS
90
8253
7425
6600
5775
4950
3300
2475
1650
82
FLOW CHART
)
82^81.^es^eeMOISTURE CONTENT %
SAMPLE No. WOSOIL TYPE^9
SUMMARY
Lower liquid limit^esLower plastic limit^27Plasticity index^59Linear shrinkage^20
Percent grovel
Percent sand^7
Percent silt and cloy^89
Swell index ( lb/sq. f t.)^5050PVC rating^74
PVC category^Very Critical

31WATSON SOIL SURVEYTEST RESULTS
APPENDIX 2
20^40 600.1^0.2^0.4 06^1^2^4^6^10
5 10^20^30 40^60^80^100 12.0
ELAPSED TIME ( minutes )To accompany Record 1971/5 155/A16/713
PARTICLE SIZE ANALYSIS
DISTRIBUTION CHART
..••••*:
1 I I
PART CLE DIAMETER Inn's.)
ATTEREIERG LIMIT
FLOW CHART
_
so^es^go^es^leoMOISTURE CONTENT %
POTENTIAL VOLUME CHANGE
Symbol Moulds . Moisture Content /'I
//
-- — — Dry (WAD
M oist Moe )10•1%
18•35S
/
I...
, ,
Pirr iall
All.
8250
7425
6600
5775
4950
4125
3300
2475
1650
130
70
60
50
40
30
° zo
13323 Is
9
7
100
90
60
• 70
• 60
50
a' 40
30
20
825
SAMPLE No. 900
SOIL TYPE^9
SUMMARY
Lower liquid limit^05
Lower plastic limit^30Plasticity index^50
Linear shrinkage^17
Percent grovel
Percent sand^5
Percent silt and clay^95
Swell index ( lb/sq. ft.)^6750PVC rating^9.1
PVC Category^Very Critical
3.4 (Pt) 121

-12-
APPENDIX 3
Potential Volume Change Meter
I

-13-
APPENDIX 3
The 'Potential Volume Change Meter'
Description
The Potential Volume Change Meter was developed by Lambe(1960) at the request of the U.S. Federal Housing Authority for the purposeof identifying potentially expansive foundation soils.
The apparatus (Figure 1) consists essentially of a consolidometerwhich measures the pressure exerted as the sample swells against theresistance of a proving ring. The proving ring deflects 0.0001 inch per3-4 lb applied force and the dial reads 0.0001 inch per division. Thediameter of the sample , which is that of the consolidometer ring, is 2.750inches and its thickness is 0.625 inches.
Test Procedure
Samples are compacted dynamically in consolidometer rings atthree different relative water content*, for which a correlation betweenswell index and potential volume change has been established. The threerelative water contents at which samples are tested are termed dry, moistand wet and are equal to the following:
Dry (W50) = water content at 50 percent relative humidity
Moist (W100) = water content at 100 percent relative humidity
Wet (Wy) = water content at plastic limit.
The compaction procedures used are shown below, together withthe compactive efforts and their relation to Standard and Modified AASHO**Compaction:
* The relative water content of a sample of soil refers to the relation betweenthe actual water content of the sample and the water contents (which might becalled 'standard water contents) at which the soil exhibits certain well-definedproperties (such as at the liquid limit, the plastic limit, the shrinkage limit, orthe field moisture equivalent) or is in equilibrium with moist air having acertain relative humidity (such as 100 percent relative humidity or 50 percentrelative humidity)
** American Association of State Highway Officials.

-14-
RelativeWater Content
No. ofLayers
No. of Blowsper Layer
Compactive Energy(ft lb/cu.ft)
Dry 3 7 55 000 (Modified AASHO)
Moist 3 4 31 000 (X Modified AASHO)
Wet 1 5 13 000 (Standard AASHO)
The two exposed faces of the compacted soil are covered withporous stones and the enclosed' sample is attached to a base plate. Wateris added until the sample is completely immersed and resultant swellpressures are recorded by the proving ring dial.
Presentation of Results
The pressure computed from the dial reading is termed the 'swellindex: The Swell Index test is essentially a measurement of the pressureexerted by the sample of compacted soil when it swells against the restrain-ing force (proving ring) after being wetted. The value of pressure (1b/sqoft)2 hours after adding the water is the swell index of the soil.
Lambe correlated the swell index with potential volume changethrough his'PVC ratings; this is a numerical rating which provides aqualitative measure of the magnitude of the potential volume changes insoils. It was derived from results of laboratory testing of five soilparameters:-
Heave from air-dried condition (Holtz and Gibbs, 1956)
Plasticity index (Holtz and Gibbs, 1956; Holtz, 1959)
Water content at 85 percent relative humidity (De Bruyn,Collins and Williams, 1956)
Plasticity index and activity (Williams, 1957)
Linear shrinkage - Field moisture equivalent to shrinkagelimit (Altmeyer, 1956).

I1
11
1
• 1
11
-15-
The volume change potential of a soil can be readily assessedby inspection of a plot (Fig. 2) of swell index versus PVC Rating. Fig. 2shows, also, Lambe's four PVC Categories', which represent the severityof the potential volume change as reflected in the damage which has beenobserved in structures founded on soils.
REFERENCES
ALTMEYER, W.T., 1956 - Discussion of Paper 2814. Trans. AmericanSociety of Civil Engineers, Vol. 121, page 666.
DE BRUYN, C.M.A., COLLINS, L.E. and WILLIAMS, A.A.B. 1956 -"The specific surface, water affinity and potential expansivenessof clay", Clay Minerals Bulletin, Vol. 3, No. 17.
HOLTZ W.G. 1959 - "Expansive clays - properties and problems",Quarterly of the Colorado School of Mines, Vol. 54, No. 4, page 89.
HOLTZ W.G. and GIBBS , H.J. 1956 - "Engineering properties of expansiveclays", Trans. American Society of Civil Engineers, Vol. 121, page 641.
LAMBE, T.W. 1960 - Soil PVC Meter., Technical Studies Report, FHA-701,Federal Housing Administration, Washington, D.C.
WILLIAMS, A.A.B. 1957 - Discussion of Jennings and Knight, (1957).South African Institute of Civil Engineers, Symposium on expansiveclays, page 57.

I I I I I I I I I I I I I I I I I I I I
To accompany R.co,d 1971/3
FIG 1
r-+---+---- PROVING RING
~~-------------+----~-----ADJUSTABLE ROD
SOil PVC METER
LUCITE CONTAINER
DURALIUM COVER
COMPACTION RING
SPACER RING
(After, Lambe, 1960)
155/A16/736

I I I I I I I I I I I
II I I I I I I .1 _I
1/
/ 1--+--+6000 ~-+--+--+-+-+---l-+-+--+-+-+-I--t-/-f-V-t-+-+-t---1-+-+-t-I
v I
I 5(OO'~-+~~~-r~~-+~i~/~+-~-r~+-~~
II' ....... I
1/
1 4000 ~-+-+--+--+-r--+-+---+-r::·~~Y-+--+-+---1f--+-+---+--+-+-~--+-+--I _J ~/
1--0, ~I ~-+~~4-1-+-+-~~~~A-4-+-+-~~-+-+~~~4-1-~
J 3000~--+~4-+-~~+D~~-+---+-+-~-+~~+-~-+-r-I ~ V _,
~ \1 IJ
/ /
I I V /
V l/
200 I-- f-""'" 1---l--+---+--O-lJ 1,...0-v
1 ? 10 " ~-+'-r~~N)n+-+-~~-4~P~V~C~~R~at~i~n~~+-~~-4-+-+-+~ ! ritical-~Margin?t-l-sri1 ic H.4--+-+-V-\er -yri ic ~l.~-I--+-+---1
I I
I --.--t---+ --- I--.FoM, ~--.., ... :J--.-I
To accompany Rflcord 1971/3 I After, Lambe, 19601 155/A16/737

E40000 E41000
N31000
N30000
N29000
N28000
KEY TO SOIL TYPES
N27000 TOPOGRAPHIC ENVIRONMENT TYPE SYMBOL-
, E!] SOILS OF UPPER SLOPES SMiCL/CH
2~ c c GRAVELLY SOILS GM
3~ SOILS OF UPPER SLOPES CL/CH-SC
4c=J SOILS OF NEAR UPPER SLOPES ML/CL
5~ SOILS OF NEAR UPPER SLOPES ML/SC-GC
sc:J SOILS OF HIGHER MIDDLE SLOPES ML/CLICH
7c=:J . . . SOILS OF LOWER MIDDLE SLOPES ML/CL/CH
N26000 8[2] SOILS OF LOWER MIDDLE SLOPES ML/CL/CHISC
9r=:J SOILS OF LOWER SLOPES ML/CL/CH
10r=J SOILS OF DEPRESSIONS
.. See lhf,ed Clossif,coticn Chart in text
N25000
E40000 E41000
To accompany Record 1971/3
'/ " ,..,/. .
t ~ I
E42000
E42000
E43000 E44000
\
•
E43000 E44000
E
SOIL TYPES
of
WATSON AREA A.C.t
SCAlE
E46000
SO',o;., ""EE ..... .r. ......... .;:SO;., .. __ .... ..,:o;O ..... _~'5(' METRES
E45000 E46000
PLATE 1
N31IIOO
N30000
N29000
N28000
N27000
N26000
N25000
I55/A16/721
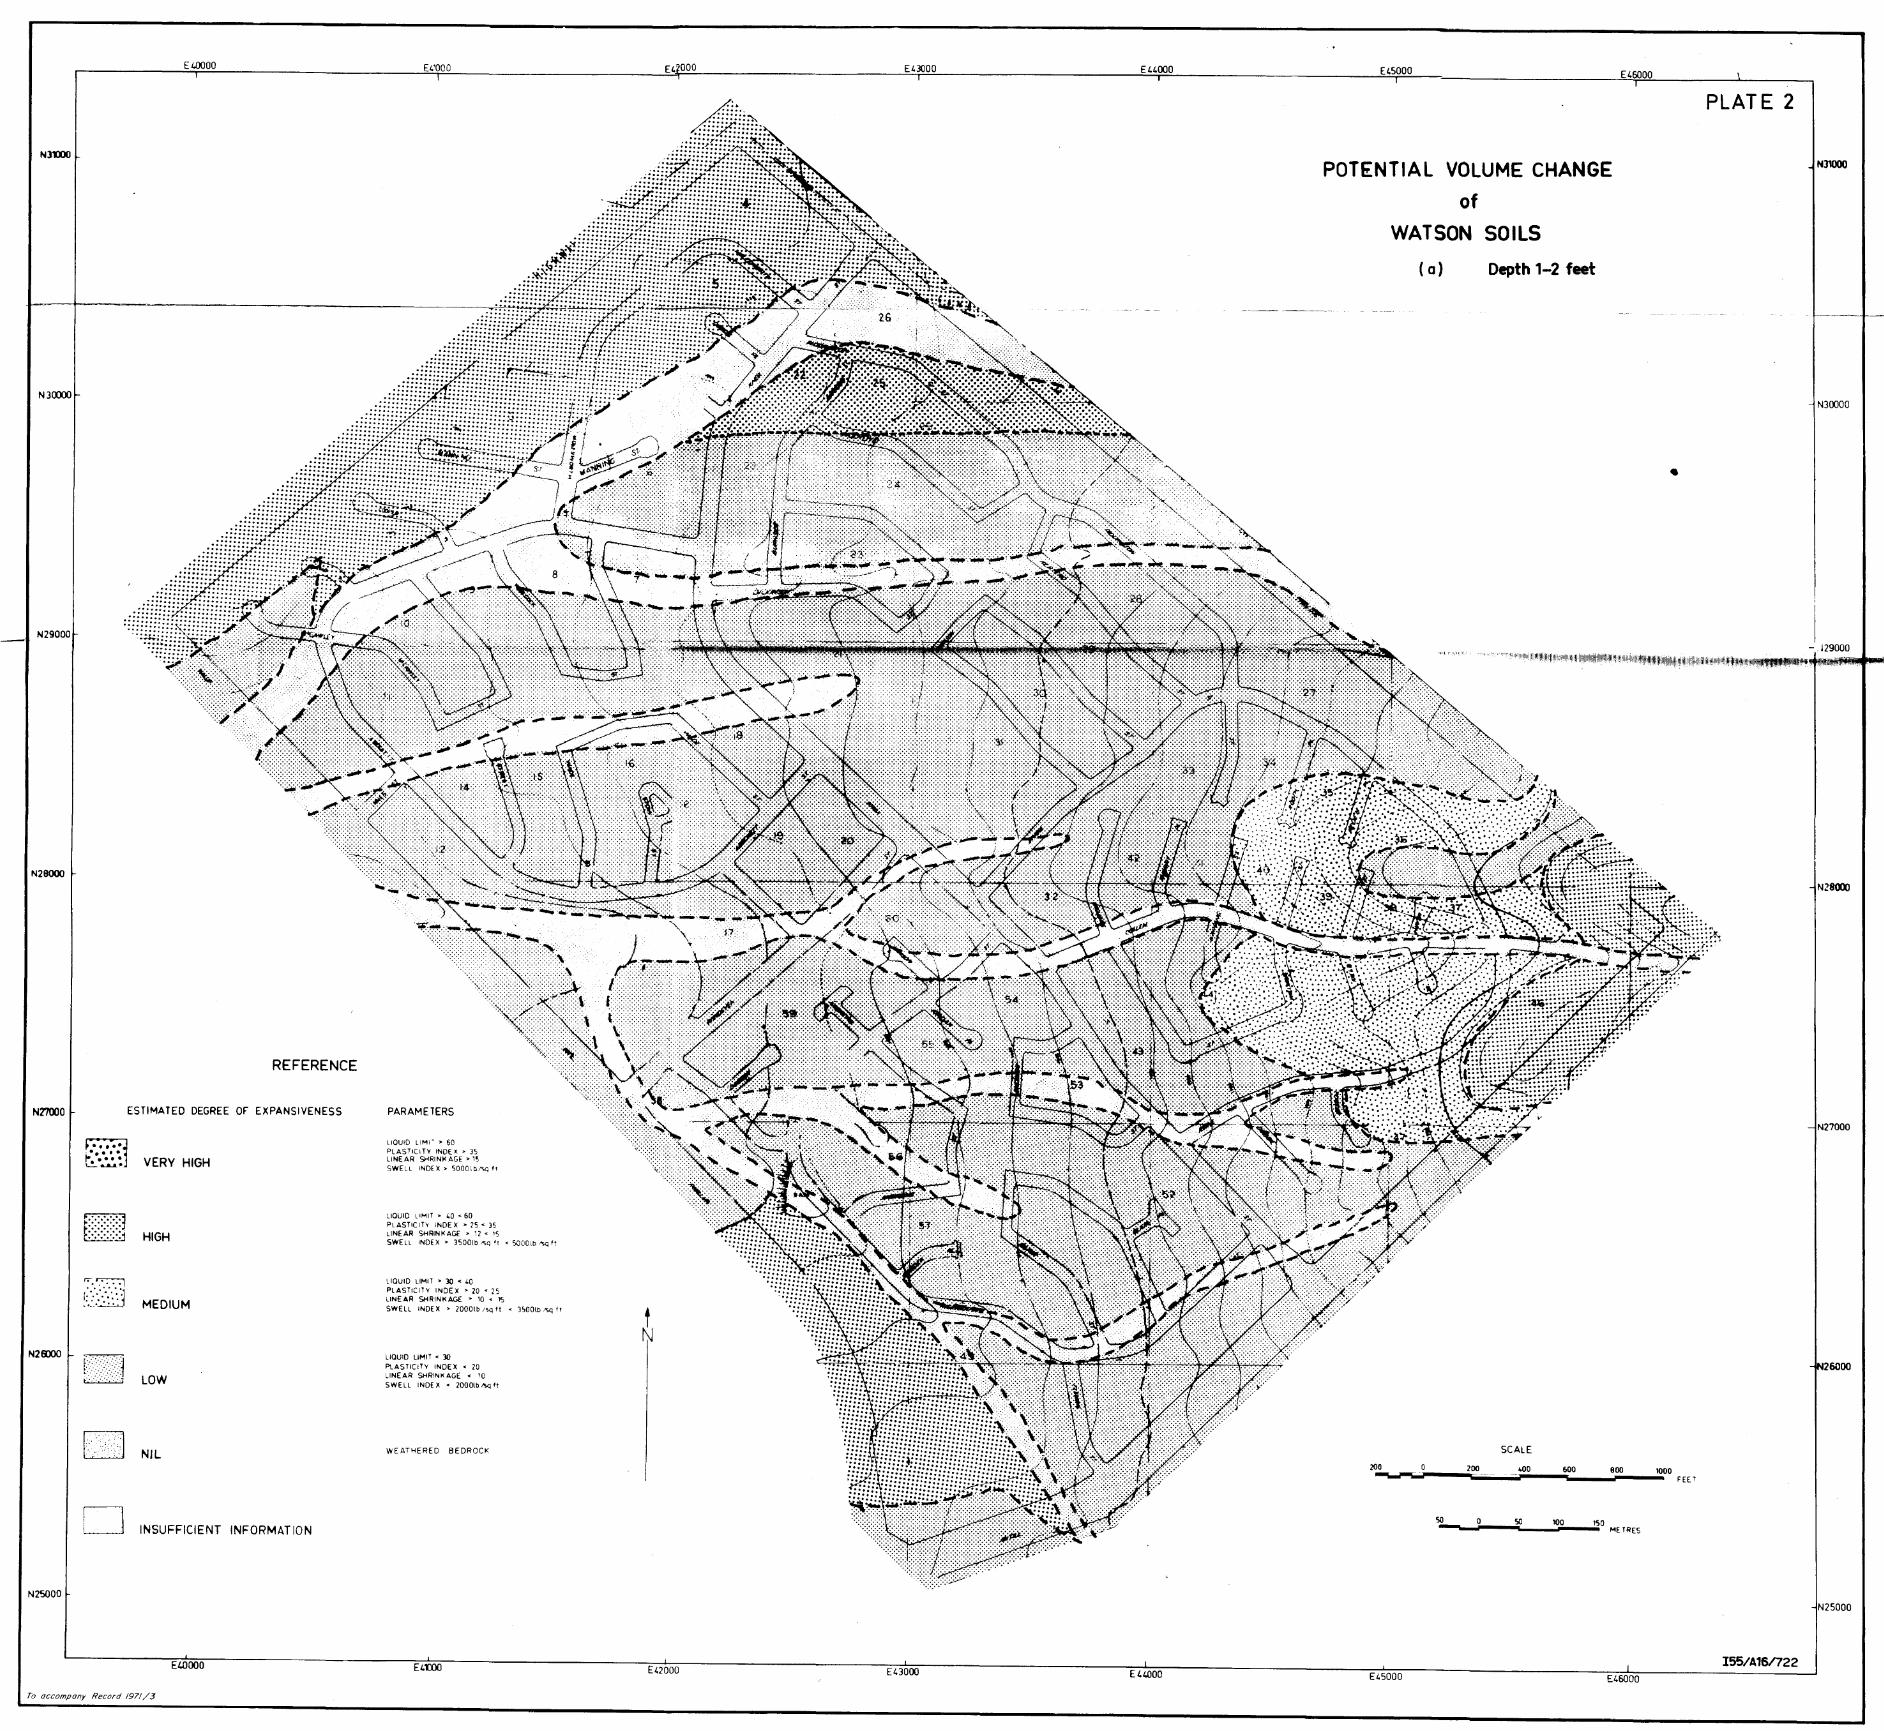
EI.OOOO
N11llO
N3CXXlO
N29000
N29000
REFERENCE
N2'7000 ESTIMATED DEGREE OF EXPANSIVENESS
VERY HIGH
~~I}j HIGH
".~
~;.:::::/J MEDIUM
N2EiOOO
LOW
[2J NIL
D INSUFFICIENT INFORMATION
N25000
El.OooD
To accompany Record /97//3
EI.'OOO
PARAMETERS
LIQUID lIMI" > 60
PLASTICIT¥ INDO> J5 LINEAR SHRINKAGE> I' SWELL INDE X > 500e IOXq "
LlOUID ll~IT >- 40 "" 60 PLASTICITY INDEX::. 25.0; 35 LINEAR SHRINKAGE :> 12 <= 1~
SWELL INDEX:> 3500tb I'SQ 't '"' SGCOlb ~Q ft
LlOUID lIMIl ::. 30 ..: i.0 PLASTICITY INDEX> 10 < 25 LINE AR SHRINKAGE > 10 < ,.,
SWELL IND£ X > 2000lb J'Q It < 15001!J "G "
LIQUID LIMIT < 30 PlASTICITY INDEX < 10 LINEAR SHRINK AGE < '0 SWELL INDO < 100Otb"" It
WE ~THERED BEDROCK
E42DOD
EOOOO I
E1.3000
EUOOO I
E/.I,()OO
E450DO I E4GODO
POTENTIAL VOLUME CHANGE
of
WATSON SOILS
( a) Depth 1-2 feet
SCALE
100 0 100 400 600 800
---~-----
50 100 T~O ME TRES
EI.6000
PLATE 2
Nl1000
N30000
•
I
I J29000
N28(Q)
N27000
26000
1000 FEE T
N25000
ISS/A16/722

E 40000
N1UXl
N30000
N29000
N28000
REFERENCE
N27000 ESTIMATED DEGREE or EXPANSIVENESS
VERY HIGH
[§] HIGH
~':'.;.:--::? .•...••. ·1
...... ..!.....1....~ MEDIUM
N20000
LOW
[2S] f "',. NIL
INSUFFICIENT INFORMATION
N2S000
To accompany Record 1971/3
E40000
E41000
PARAMETERS
lIOUIO LIM T '" 6C PLASTICll" INDEx'" JS lINEA~ 5i"I~INK Aut- > 1'S
SWELL INO£) '" ,)OOOlD.~ ft
LlOUID ~IMIT >.0-60 PlASTl(lTl "DE X > 25 • )5 LINEAR Sl-4~INI(AG£ » , '1 «: 15 SWEll INeE x :.- 35DOltl -\.Q ft
LIQUIO LIMP " lOcI.{) PlASTI(ITV ~DEX > 20 • 25 LINEAR SHRINKAGE > '0 • 15 SWELL INOE X lOOOlb 1"1 "
LIQUID LIMIT « 30
PLASTICiTY INDEX. « 20 LINEAR SH"lINKA.GE . 10 SWEll IND£ X . 200 ()(b "G It
WE ATHEPE C BEDRJCK
E41100
E42000 EI.)(JOO EUOOO E46000
PLATE 3
POTENTIAL VOLUME CHANGE N31oo0
of
WATSON SOILS
( b) Depth 2-3 feet
N30000
N2800)
N27000
« ~OO\b ~H
. 3500", "<l " t N
26000
SCALE
2110 100 400 600 BOO '000 .... .-.~~ FEET
50 50 100 '50 ME TRES
N25000
I55/A161723 E'2000 EI.4000 E'SOOO EI.6000

E 1.0000
NlUJO
N31XXlO
N29000
N28000
REFERENCE
N21OO0 ESTIMATED DEGREE Of EXPANSIVENESS
VERY HIGH
HIGH
~::, I::·.····., ~ MEDIUM
N2EllOO
LOW
NIL
'-J INSUFFICIENT INFORMATION
N2S000
E40000
To acC'ompony Record 1971/3
E41OO0
PARAMETERS
l QUIC ~ M .,. ,.. so PLASTIC '1'"'( IN DE ). • J') l NEAR 'St-fRINKAGE » 1S SWt.L ~OE:)'" ~OOO b.~ ft
IOU 10 ""If ~ i.O '" 60 p 4$TI( "T "'DE)( ~ ~5 " )5 LNEAR SHRII'III<AG[ • 12""c:. SWEll NDE J: .,. )SOOlto,ot.q f! '" SODO I:l "'-G H
LIQuiD ... IM,· .. 30 <I; '-0 PlA~ TI\,.. Y HilDE;.: .,. 10 '" 21) LINE A~ SHRINt< AGE .,. 10 « 11)
SWEll NOE)' ,.. 200ol0 I~ ft '" J'XJDlb "iQ q
lIOUID .... IMI T '" )(I
PlAS" C T¥ I~O()( 0( 20 LINEAR SHRI"'KAGE c '0 SWE"l I~DE)I " 200t).b I\q ft
WE ~~~ERE 0 BEDROCK
(41)00
t N
E42000
E42000
EUIOO E44000
E43000 E44000
E45OO0 E46000
PLATE 4
POTENTIAL VOLUME CHANGE N31000
of
WATSON SOILS
( C) Depth 3-4 feet
N30000
• • N27000
•
26000
SCALE
100 200 .00 600 800 1000 .... .-..---- FE£'
'>U 0 100 1~0 ~ ME. TRES
N2S000
ISS! A 16/72 4 E45000 £46000

NlOXl
N31XXXl
N29000
N28000
N2'7OO0
N21llOO
N25000
EI,()(JOO
REFERENCE
ESTIMATED DEGREE or EXPANSIVENESS
[ ··m········ ............ ........ "."
UJ .. ····:-...... '.::: ::::
fTI'TITITI ~
[J
E1J
VERY HIGH
HIGH
MEDIUM
LOW
NIL
INSUFFICIENT INFORMATION
E"'OOO
To rJccomparty Rsc()rd 197'1/3
£41000
PARAMETERS
lIOUID LIMIT • 60 PlASTICIT~ INDEX> 35 LINEAR SHRINK ACE > IS SWELL INDEX. 50001b"" It
LtOUID LIMIT > 40 < 60 PLASTICITY INDEX> 25 < 35 LINEAR SHRINKAGE> 12 < 15 SWELL INDEX> 35001b"" It < SOOOlb "" It
lIOUID LlMI1 • lO • 40 PLASTtCIT¥ I "IDE X • 20 < 25 LtNE.o.R SHRINK.o.cE • 10 < ~
SWELL INDEX> 20001b/sqlt < 3S00lb"" It
lIOUID UMIT < lO PlASTtCIT¥ INDEX < 20 LINEAR SHRINK.o.CE < 10 SWELL INDEX < 2000lb""ft
WEATHERED BEDROCK
(41)00
E42000
E1.2000
EOlOO E"ooO
E43000 H4000
E45000
POTENTIAL VOLUME CHANGE
of
WATSON SOILS
(d ) Depth 4-5 feet
SCALE
200 0 200 400 600
~--
50 50 100
E45000
ISO
£46000
PLATE 5
N31000
- 129000
N28(XX)
N27000
N26000
800 1000 FEET
METRES
N25000
155/A16/725 E46000

Et.OOOO E4DOO 2000 E43OO0 E44000
Nl1IDO
N30000
N29000
N28000
N2S1OO
N25000
E40oo0 E41)00 E43000 EUOOO
To accompany Record 1971/3
E45000
WATSON SOIL SURVEY
LOCATION OF TEST HOLES
REFERENCE 039 T5t hole
SCALE
46000
PLATE 6
zoo 0 200 .00 600 800 1000 ,,"~"'Io'AJ""'l;;..l'!'! __ ;Po,,"'-~iiiiiiiiii~---~ __ ~;;o...-.iiiji FEEl
o 50 100 ISO METRES
155/A 161726 E45000
-.129000
N2111Dl
N21000
1000
25000
![AMS GIAU YES O AUSAIA YMEOEA III - Queensland Museum/media/Documents/QM/About+Us/Publications/... · AMS GIAU YES O AUSAIA YMEOEA III ^57. a eso [= Gooae] Q ue 1913 a a i i uy. QM](https://img.dokumen.tips/doc/110x75/5aa06ad17f8b9a7f178e0e76/ams-giau-yes-o-ausaia-ymeoea-iii-queensland-mediadocumentsqmaboutuspublicationsams.jpg)


![AMS GIAU YES O AUSAIA YMEOEA II 1 9 Giau 19/media/Documents/QM/About Us/Publications... · AMS GIAU YES O AUSAIA YMEOEA II ^1. rttpnn . Gi ye 9 [G] E i e Ag & Sk Q1" Ca - 1 . 9 (?](https://img.dokumen.tips/doc/110x75/5d33b6e588c993ff1f8d77b4/ams-giau-yes-o-ausaia-ymeoea-ii-1-9-giau-19-mediadocumentsqmabout-uspublications.jpg)


![AMS GIAU YES O AUSAIA YMEOEA III/media/Documents/QM/About+Us/...AMS GIAU YES O AUSAIA YMEOEA III ^57 a eso [= Gooae] Q ue 1913 a a i i uy QM cas o seaae is a sies as oows Ca 1 - 1](https://img.dokumen.tips/doc/110x75/60b3aac0b290a712027ea813/ams-giau-yes-o-ausaia-ymeoea-iii-mediadocumentsqmaboutus-ams-giau-yes-o.jpg)