Embed Size (px)
Citation preview

C O M M U N I T Y S U R V E Y O N P U B L I C S A F E T Y D e v e l o p e d a n d I m p l e m e n t e d b y t h e
S A N F R A N C I S C O S A F E T Y N E T W O R K A n a l y s i s p r o v i d e d b y t h e
N a t i o n a l C o u n c i l o n C r i m e a n d D e l i n q u e n c y
SAFETY NETWORK

San Francisco Safety Network Page 2 of 47
Executive Summary Crime in the United States has significant impacts on the health and well-being of individuals. Adults and children, who
live in unsafe neighborhoods, whether this sense is perceived or actual, are less likely to engage in social activities in their
neighborhoods thus increasing their levels of isolation; they are also less likely to participate in physical activities such as
walking in their neighborhoods or enjoying their parks. Thus it is not surprising to find that communities with high crime
rates also suffer from disproportionate higher rates of premature mortality due to chronic conditions such as obesity, high
blood pressure and diabetes among others. Promoting public safety is an important factor in securing the well-being of
communities.
To understand the extent to which individuals and their families feel safe in their neighborhoods, the San Francisco Safety
Network, a citywide partnership that utilizes district-based Community Organizers to build the capacity of neighborhoods
to reduce crime and increase public safety, organized, and implemented a comprehensive survey of community
perceptions of safety in San Francisco. The survey was implemented in April 2006 by organizers throughout the different
neighborhoods. Additionally, an on-line version of the survey was launched to reach out to the diverse community sectors
throughout San Francisco. A total of 2,379 surveys were completed by individuals throughout San Francisco over a one
month period (March-April 2006).
Public Safety Perception Survey Highlights
- Forty-three percent (43.8%) of survey respondents report feeling somewhat unsafe or unsafe
in their neighborhood.
- About a third of the survey respondents had either experienced or had been exposed to some
type of unsafe event in their neighborhoods including: verbal harassment, robbery, drug use
or sell.
- 58% reported feeling unsafe riding public transportation throughout the City.
- Over two-thirds of the total sample reported feeling unsafe on the streets around their
neighborhood; and
- Over half report feeling unsafe in their local parks.

San Francisco Safety Network Page 3 of 47
Survey participants were asked to list the issues they believe contributed to
their feeling unsafe in their neighborhoods. While these categories varied
across districts in the order they were mentioned, the issues listed below
represent the main issues identified by the respondents as a whole. As the box
below shows, the majority of respondents believe the availability of drugs,
presence of gangs and lack of employment were the three primary issues
contributing to feeling unsafe in San Francisco.
As shown in the table below, respondents’ suggestions as to ways to improve the safety in their neighborhoods were
innovative, emphasized community engagement, and supported youth development strategies.
This survey provides and initial look into individual’s perception of public safety in their neighborhoods. While a great
effort was undertaken to ensure representation of all community sectors, undoubtedly some sectors and neighborhoods are
under-represented. Despite this limitation, this survey offers a clear snapshot of individuals’ fears, but most importantly, it
offers innovative strategies to address these concerns.
Top factors that contribute to the sense of feeling unsafe in the neighborhood (in order of
frequency) Citywide
- Drugs - Gangs - Unemployment - Lack of police - Gun availability - Traffic & speeding cars
Suggestions provided by survey respondents on ways to improve public safety in their neighborhoods
Better Interaction with Police: o Periodic community town hall meetings with police and City officials o Increased police patrolling on bikes, and foot. o Police integration with schools, community centers o ‘Buddy system’ where police officers are mentors to young people in the community o Provision of self-defense classes in community settings o Police patrolling in public transportation
Youth Services: o Cultural and arts programs o Sports programs o Affordable entertainment for youth o Employment training and development o Professional development (vocational and career) o Affordable housing
Improved Physical Environment: o Traffic calming strategies o Cleaner, safer parks o Opportunities for family and community interaction o Wider sidewalks o More bike lanes
Community Services: o Language education o Immigration services o Services for seniors o Promotion of faith groups and services

San Francisco Safety Network Page 4 of 47
Introduction and Background
Crime in the United States has significant impacts on the health of individuals. Evidence from published literature shows
that ‘Fear of crime erodes quality of life and is associated with poorer health.’
A brief review of the published literature shows that:
Feelings of safety in own homes allows residents to sleep better;
Peace of mind at leaving property unattended allows individuals to go to work, exercise, engage in community
activities, visit family, etc.,
More confidence in leaving the house making it easier for people to arrange visits to facilities and services they
need or would like.
For adolescents, the published research suggest that neighborhood safety is important in terms of influencing adolescents;
risk behaviors, educational outcomes, and their integration within their families, schools, and churches.
To address individuals’ and community sense of safety throughout San Francisco, The Safety Network, a coalition of
nine community-based organizations in San Francisco, implemented a community survey on perception of, experiences
with and recommendations to improve public safety. This community survey was implemented in April 2006.
About the Safety Network In 1990, a coalition of twelve community-based organizations in San Francisco came together to respond to the issues of
crime, public safety, substance abuse, and other critical needs in neighborhoods that lacked sufficient civic engagement
and public resources. Out of this process, a partnership was established called Neighborhoods in Transition – A
Multicultural Partnership (NIT-AMP). In 1991, NIT-AMP was awarded a Community Partnership Grant from the Federal
Center for Substance Abuse Prevention (CSAP) to increase community involvement and empower local residents to
organize, plan, and implement strategies to address issues related to substance abuse such as crime and violence. The
success of NIT-AMP led to the Partnership obtaining funding in 1996 from what was then the Mayor’s Criminal Justice
Council (MCJC) to launch Safety Network.
Safety Network (SNet) is a citywide partnership that utilizes district-based Community Organizers to build the capacity of
neighborhoods to reduce crime and increase public safety. The goals of Safety Network are to: 1) Build Capacity; 2)
Advocate for Communities 3) Prevent Violence; and 4) Improve Community Access to Services. Each of these goals are
achieved through strategies such as engaging residents in community coalitions and problem solving activities, increasing
the effectiveness of community policing efforts, and supporting community response networks.
Safety Network is implemented by a coalition of 12 community-based partners, which serve neighborhoods throughout
San Francisco. The members of the Safety Network Partnership include the following:

San Francisco Safety Network Page 5 of 47
Bayview Beacon Center: Bayview District
Bernal Heights Neighborhood Center (BHNC): Ingleside District
Haight Ashbury Free Clinic Inc (HAFCI): Park District
Horizons Unlimited (HU): Mission District
International Institute of San Francisco (IISF): Southern and Tenderloin Districts
Japanese Community Youth Council (JCYC): Fiscal Agent
OMI/Excelsior Beacon Center: Outer Taraval/Ingleside Districts
Richmond Area Multi Services (RAMS): Richmond District
Sunset Neighborhood Beacon Center (SNBC): Taraval District
Telegraph Hill Neighborhood Center (Tel-Hi): Central District
Urban Services YMCA/Western Addition Beacon Center: Northern District
Visitacion Valley Beacon Center: Visitacion Valley/Ingleside District
Each member of the Safety Network Partnership (with the exception of JCYC) employs a Community Organizer who is
dedicated to supporting the public safety/community policing efforts in their designated police districts. Community
Organizers serve as catalysts in organizing and motivating residents, merchants, City departments, and other community
groups to work in partnership with the police to collectively identify and implement public safety strategies in their
respective neighborhoods.
Methods
This report intends to provide an overview of the issues collected in the community assessment on individuals’ safety
experiences and perceptions. The survey was developed by the Safety Network Program organizers and staff. The
National Council on Crime and Delinquency provided feedback on the content and was responsible for the production of
the survey. The survey was translated into three additional languages: Spanish, Chinese (NCCD) and Tagalog (Safety
Network organizer). Additionally, a web-based version was developed by NCCD and hosted by the Japanese Community
Youth Council.
Surveys were either self-administered or read aloud by the organizers throughout community centers and agencies.
Detailed documentation describing implementation procedures are presented in the Appendices. The survey was launched
in March 2006 and surveys were collected through the end of April 2006. The finalized survey was formatted into a
scantron version by NCCD. This technology allows for easier data entry and clean up process. A survey sample is
provided in the appendices.

San Francisco Safety Network Page 6 of 47
All analysis was completed by NCCD staff with guidance from the Safety Network staff. Basic statistical analysis
including frequencies, cross tabulations and re-coding of variables were completed. Analysis is presented for the
aggregate sample as well as by individual districts. The number of respondents included in a cross-tabulation will often be
less than the overall number of respondents who completed the survey as missing values have been excluded from the
data presented to ensure data stability. That is, only those respondents for whom we have information on the variable of
interest are able to be included. For example, if a respondent does not provide his/her age; we could not include this
person in our age cross-tabulation. Data tables with the original data are available from the Safety Network upon request.
Study Limitations As with most community surveys, this study is limited by selection and response biases. Responses across districts varied,
with some having a much larger and therefore more representative sample than others. For districts with a smaller number
of respondents, the data should be reviewed with caution as it may not necessarily be representative of the general
community in the area.
Results Findings from the survey show the sense of feeling unsafe among San Franciscans is quite common. Forty-three percent
(43.8%) of the total sample report feeling somewhat or unsafe in their neighborhood. Furthermore, about a third of the
survey respondents had either experienced or been exposed to an unsafe event in their neighborhood including verbal
harassment, robbery, loitering, drug use or sell. Over two-thirds of the total sample reported feeling unsafe on the streets
and parks around their neighborhood, and an almost equal proportion reported feeling unsafe riding public transportation
throughout the City. Detailed summaries of the survey items follow. The results are presented first for the City as a whole
(aggregate results) and then by individual district.

San Francisco Safety Network Page 7 of 47
How Unsafe do you feel in your Neighborhood?
16.7%
14.8%
14.3%
13.1%
10.9%
9.4%
9.3%
8.1%
8.0%
6.7%
5.1%
3.0%
39.9%37.3%
36.5%31.3%36.2%
34.4%36.9%
36.0%35.8%
33.8%29.1%
32.2%
0.0% 10.0% 20.0% 30.0% 40.0% 50.0% 60.0%
BayviewMission
TenderloinVisitation Valley
SouthernCitywideNorthern
ParkIngleside
CentralRichmond
Taraval
Dis
tric
t
Percent
Unsafe
SomewhatUnsafe
San Francisco
Over forty percent of all survey respondents throughout San Francisco reported feeling somewhat or unsafe in their neighborhood. While the majority of survey respondents feel safe in their own homes, they reported high levels of insecurity
in the streets or in the local parks. The highest area of fear for survey respondents was riding public transportation. Given that over a third of San Franciscans report riding public transportation as their sole means to get to and from work, this is an
area deserving attention.
San Francisco Safety Network Page 8 of 47
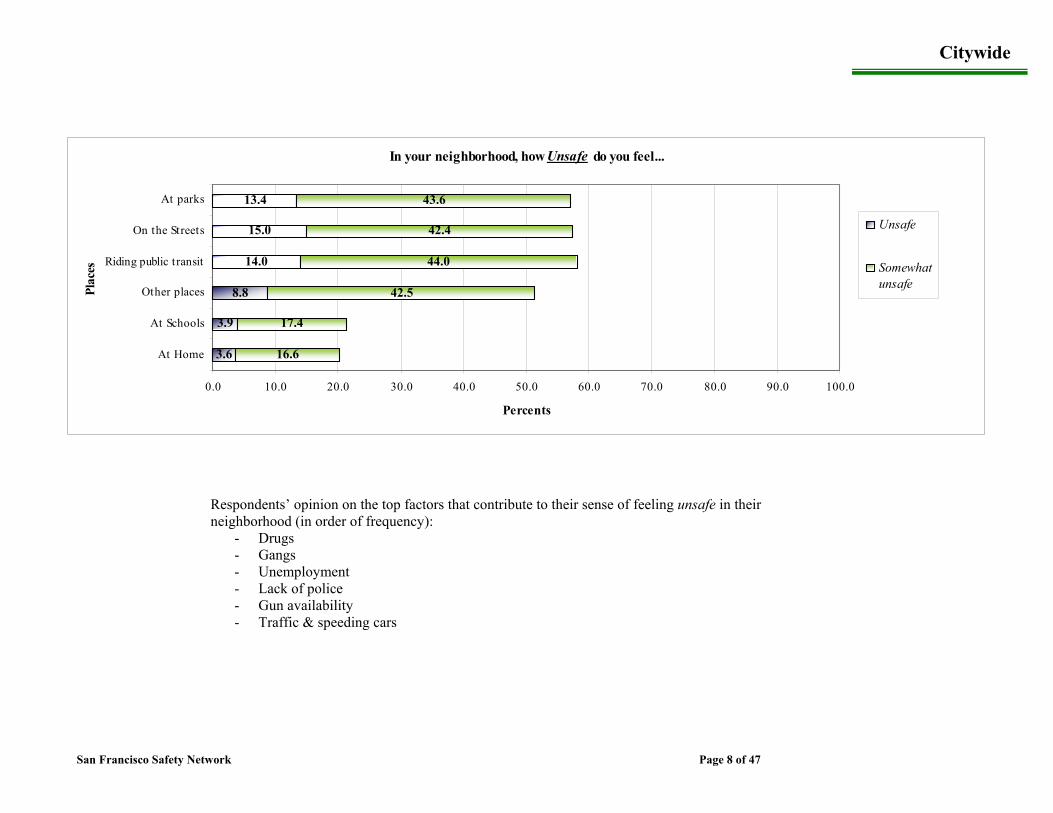
In your neighborhood, how Unsafe do you feel...
3.6
3.9
8.8
14.0
15.0
13.4
16.6
17.4
42.5
44.0
42.4
43.6
0.0 10.0 20.0 30.0 40.0 50.0 60.0 70.0 80.0 90.0 100.0
At Home
At Schools
Other places
Riding public transit
On the Streets
At parks
Plac
es
Percents
Unsafe
Somewhatunsafe
Citywide
Respondents’ opinion on the top factors that contribute to their sense of feeling unsafe in their neighborhood (in order of frequency):
- Drugs - Gangs - Unemployment - Lack of police - Gun availability - Traffic & speeding cars

San Francisco Safety Network Page 9 of 47
%3 7 . 2 %
2 6 . 3 %
3 3 . 9 %
1 9 . 2 %
2 8 . 1 %
1 5 . 0 %
2 2 . 0 %
1 4 . 2 %
1 0 . 1 %
5 . 1 %
1 8 . 9 %
1 1 . 1 %
2 7 . 7 %
1 4 . 2 %
6 1 . 5 %
4 5 . 6 %
1 9 . 8 %
9 . 8 %
2 5 . 8 %
1 5 . 7 %
4 7 . 0 %
3 4 . 6 %
% w h o h a v e w i t n e s s e d / b e e n e x p o s e d t o t h i s e v e n t m o r e t h a n o n e t i m e
% w h o h a v e w i t n e s s e d / b e e n e x p o s e d t o t h i s e v e n t m o r e t h a n o n e t i m e
% w h o h a v e w i t n e s s e d / b e e n e x p o s e d t o t h i s e v e n t m o r e t h a n o n e t i m e
% w h o h a v e w i t n e s s e d / b e e n e x p o s e d t o t h i s e v e n t m o r e t h a n o n e t i m e
D r u g v i o l e n c e
G u n v i o l e n c e
H i t a n d r u n
S p e e d i n g c a r s
P e d e s t r i a n i n j u r e d
D V / S e x u a l A s s a u l t
H a r a s s m e n t
% w h o h a v e w i t n e s s e d / b e e n e x p o s e d t o t h i s e v e n t m o r e t h a n o n e t i m e
% w h o h a v e w i t n e s s e d / b e e n e x p o s e d t o t h i s e v e n t m o r e t h a n o n e t i m e
% w h o h a v e w i t n e s s e d / b e e n e x p o s e d t o t h i s e v e n t m o r e t h a n o n e t i m e
% w h o h a v e w i t n e s s e d / b e e n e x p o s e d t o t h i s e v e n t m o r e t h a n o n e t i m e
R e s p o n d e n t s E x p e r i e n c e s w i t h a n d E x p o s u r e s t o U n s a f e c o n d i t i o n s i n t h e i r N e i g h b o r h o o d s
A s s a u l t a t h o m e
S h o p l i f t i n g
R o b b e r y
A s s a u l t o n s t r e e t
% w h o h a v e w i t n e s s e d / b e e n e x p o s e d t o t h i s e v e n t m o r e t h a n o n e t i m e
% w h o h a v e w i t n e s s e d / b e e n e x p o s e d t o t h i s e v e n t m o r e t h a n o n e t i m e
% w h o h a v e w i t n e s s e d / b e e n e x p o s e d t o t h i s e v e n t m o r e t h a n o n e t i m e
Citywide

San Francisco Safety Network Page 10 of 47
% Race/Ethnicity of Survey Respondents
Asian22%
White39%
Latino14%
Multi-ethnic/API/Other12%
African American13%
Type Frequency %Paper Survey 1,516 63.7
English 1,270 53.4Spanish 130 5.5Chinese 116 4.9
Online Survey 863 36.3Total 2,379 100.0
Survey Source and Languages
While San Francisco’s African American population is only about
7%. The safety survey however, reached out 13% African American respondents, providing the Safety
Network with a broad representation of this group’s issues and needs in
relation to community safety.
The Basics… - A total of 2, 379 surveys were completed by
individuals living, working, studying or recreating throughout San Francisco.
- Of these, 56% were female respondents and 44% were male respondents.
- The largest age group among survey respondents was those aged 40 and over (44%), next, those ages 18 and under made up 30% of the sample, and 26% were ages 21-39.
- Surveys were implemented in two ways. Some were read aloud, as the target population may have been low literacy or monolingual in other language than English. The rest of the surveys were self-administered either via hard paper or via a website.
Citywide

San Francisco Safety Network Page 11 of 47
% Respondent Activity in Neighborhood
4.714.8
38.042.5
1.82.3
6.06.4
7.337.6
38.6
0.0 5.0 10.0 15.0 20.0 25.0 30.0 35.0 40.0 45.0
Medical providerMerchant
Service providerOther business*
HomelessSRO
Other residentAffordable housing
Public housingHomeowner
Renter
Percent*May include students, day laborers, etc.
% Respondents by Districts
2.9 3.8
6.4 6.87.8 8.1 8.5
9.811.6
13.5
20.8
0.0
5.0
10.0
15.0
20.0
25.0
Northern VisitationValley
Tenderloin Southern Park Bayview Central Ingleside Taraval Richmond Mission
Districts
Perc
ent
Although San Francisco is a predominately renter’s City
(65%), an almost equal proportion of renters and
homeowners completed the Safety Survey.
The majority of the survey
respondents reported living, working, doing
business; or recreating
(‘hanging out’) in the Mission District. The
lowest proportion of respondents was
at the Northern and Visitation
Valley Districts
Citywide

San Francisco Safety Network Page 12 of 47
In your neighborhood, how Unsafe do you feel...
10.0
10.1
17.5
20.6
21.0
21.2
26.5
29.6
45.0
40.7
51.0
46.6
5.0 15.0 25.0 35.0 45.0 55.0 65.0 75.0 85.0 95.0
At Home
At Schools
Other places
Riding public transit
On the Streets
At parks
Plac
es
Percents
Unsafe
Somewhatunsafe
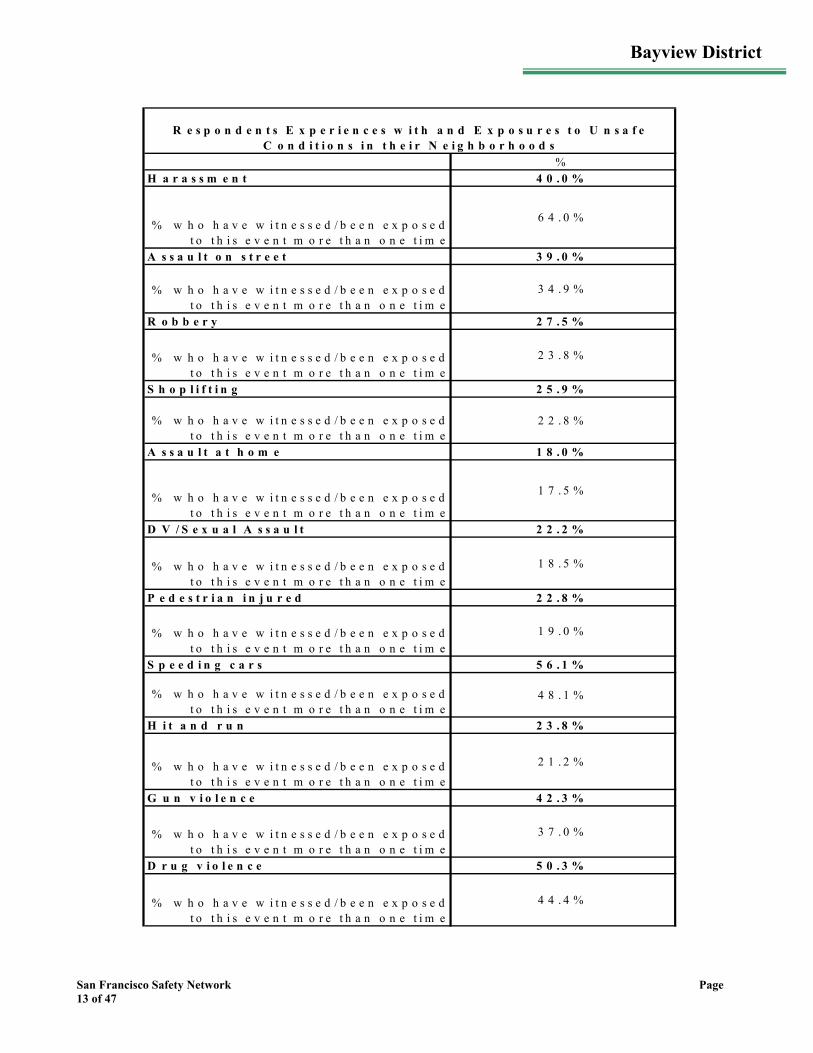
Bayview District Includes the following neighborhoods: Bayview, Potrero Hill, Third Street corridor, Hunter's Point
Respondents’ opinions on the top factors that contribute to their sense of feeling unsafe in their neighborhoods (in order of frequency):
- Drugs and gangs - Unemployment - Lack of community activities for families and youth - Lack of resident participation/sense of community
San Francisco Safety Network Page 13 of 47
%4 0 . 0 %
6 4 . 0 %
3 9 . 0 %
3 4 . 9 %
2 7 . 5 %
2 3 . 8 %
2 5 . 9 %
2 2 . 8 %
1 8 . 0 %
1 7 . 5 %
2 2 . 2 %
1 8 . 5 %
2 2 . 8 %
1 9 . 0 %
5 6 . 1 %
4 8 . 1 %
2 3 . 8 %
2 1 . 2 %
4 2 . 3 %
3 7 . 0 %
5 0 . 3 %
4 4 . 4 %
R e s p o n d e n t s E x p e r i e n c e s w i t h a n d E x p o s u r e s t o U n s a f e C o n d i t i o n s i n t h e i r N e i g h b o r h o o d s
A s s a u l t a t h o m e
S h o p l i f t i n g
R o b b e r y
A s s a u l t o n s t r e e t
% w h o h a v e w i t n e s s e d / b e e n e x p o s e d t o t h i s e v e n t m o r e t h a n o n e t i m e
% w h o h a v e w i t n e s s e d / b e e n e x p o s e d t o t h i s e v e n t m o r e t h a n o n e t i m e
% w h o h a v e w i t n e s s e d / b e e n e x p o s e d t o t h i s e v e n t m o r e t h a n o n e t i m e
S p e e d i n g c a r s
P e d e s t r i a n i n j u r e d
D V / S e x u a l A s s a u l t
H a r a s s m e n t
% w h o h a v e w i t n e s s e d / b e e n e x p o s e d t o t h i s e v e n t m o r e t h a n o n e t i m e
% w h o h a v e w i t n e s s e d / b e e n e x p o s e d t o t h i s e v e n t m o r e t h a n o n e t i m e
% w h o h a v e w i t n e s s e d / b e e n e x p o s e d t o t h i s e v e n t m o r e t h a n o n e t i m e
% w h o h a v e w i t n e s s e d / b e e n e x p o s e d t o t h i s e v e n t m o r e t h a n o n e t i m e
% w h o h a v e w i t n e s s e d / b e e n e x p o s e d t o t h i s e v e n t m o r e t h a n o n e t i m e
% w h o h a v e w i t n e s s e d / b e e n e x p o s e d t o t h i s e v e n t m o r e t h a n o n e t i m e
% w h o h a v e w i t n e s s e d / b e e n e x p o s e d t o t h i s e v e n t m o r e t h a n o n e t i m e
% w h o h a v e w i t n e s s e d / b e e n e x p o s e d t o t h i s e v e n t m o r e t h a n o n e t i m e
D r u g v i o l e n c e
G u n v i o l e n c e
H i t a n d r u n
Bayview District
San Francisco Safety Network Page 14 of 47
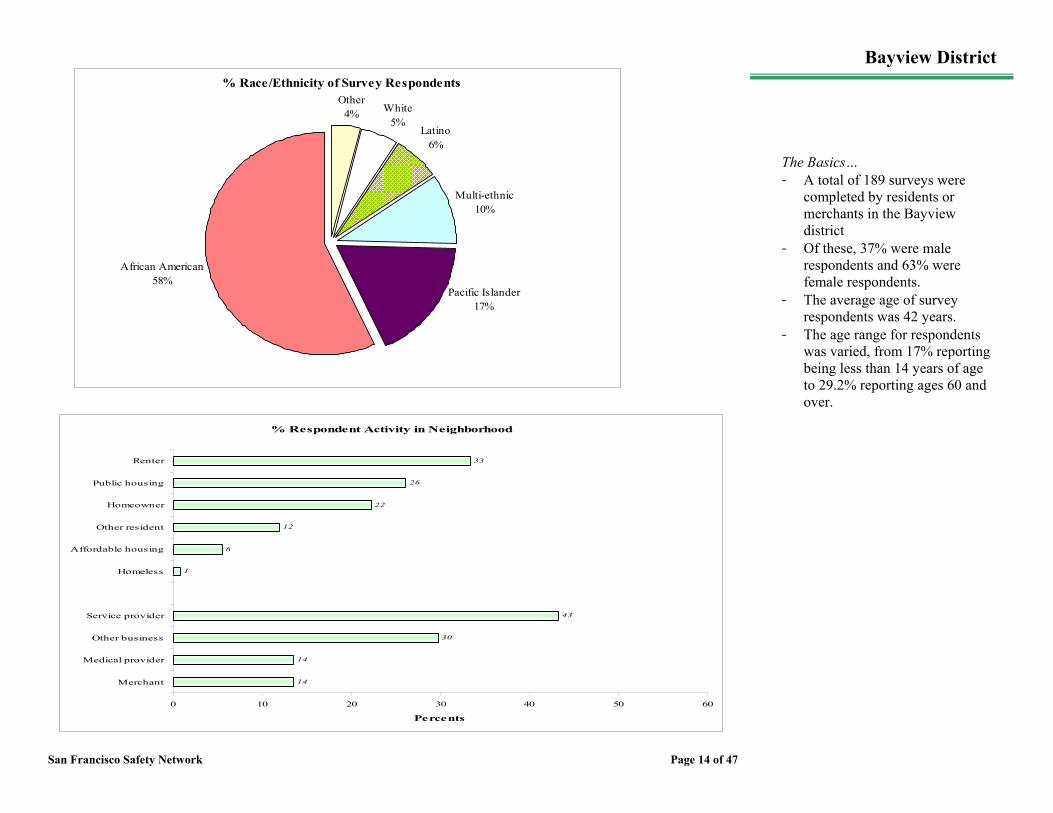
% Race/Ethnicity of Survey RespondentsOther
4% White5%
Latino6%
Multi-ethnic10%
African American58%
Pacific Islander17%
% Respondent Activity in Neighborhood
14
14
30
43
1
6
12
22
26
33
0 10 20 30 40 50 60
Merchant
Medical provider
Other business
Service provider
Homeless
Affordable housing
Other resident
Homeowner
Public housing
Renter
Percents
The Basics… - A total of 189 surveys were
completed by residents or merchants in the Bayview district
- Of these, 37% were male respondents and 63% were female respondents.
- The average age of survey respondents was 42 years.
- The age range for respondents was varied, from 17% reporting being less than 14 years of age to 29.2% reporting ages 60 and over.
Bayview District

San Francisco Safety Network Page 15 of 47
In your neighborhood, how Unsafe do you feel...
1.0
3.0
4.5
14.1
9.6
8.1
14.1
16.7
39.9
41.9
43.9
46.0
0.0 10.0 20.0 30.0 40.0 50.0 60.0 70.0 80.0 90.0 100.0
At Home
At Schools
Other places
Riding public transit
On the Streets
At parks
Plac
es
Percents
Unsafe
Somewhatunsafe
Central District Includes the following neighborhoods: North Beach, Chinatown, Telegraph Hill, Russian Hill
Respondents’ opinions on the top factors that contribute to their sense of feeling unsafe in their neighborhoods (in order of frequency):
- Unemployment - Substance abuse - Homeless - Dirty streets and sidewalks - High speeding traffic

San Francisco Safety Network Page 16 of 47
%3 8 . 0 %
3 8 . 9 %
3 1 . 3 %
2 6 . 8 %
2 6 . 8 %
2 4 . 7 %
2 3 . 7 %
2 1 . 2 %
1 0 . 0 %
9 . 1 %
1 6 . 7 %
1 4 . 1 %
3 1 . 3 %
2 5 . 3 %
6 4 . 6 %
5 7 . 1 %
1 8 . 7 %
1 7 . 2 %
1 5 . 2 %
1 4 . 1 %
4 2 . 2 %
3 6 . 9 %
% w h o h a v e w i t n e s s e d / b e e n e x p o s e d t o t h i s e v e n t a t m o r e t h a n o n e t i m e
% w h o h a v e w i t n e s s e d / b e e n e x p o s e d t o t h i s e v e n t a t m o r e t h a n o n e t i m e
% w h o h a v e w i t n e s s e d / b e e n e x p o s e d t o t h i s e v e n t a t m o r e t h a n o n e t i m e
% w h o h a v e w i t n e s s e d / b e e n e x p o s e d t o t h i s e v e n t a t m o r e t h a n o n e t i m e
D r u g v i o l e n c e
G u n v i o l e n c e
H i t a n d r u n
S p e e d i n g c a r s
P e d e s t r i a n i n j u r e d
D V / S e x u a l A s s a u l t
H a r a s s m e n t
% w h o h a v e w i t n e s s e d / b e e n e x p o s e d t o t h i s e v e n t a t m o r e t h a n o n e t i m e
% w h o h a v e w i t n e s s e d / b e e n e x p o s e d t o t h i s e v e n t a t m o r e t h a n o n e t i m e
% w h o h a v e w i t n e s s e d / b e e n e x p o s e d t o t h i s e v e n t a t m o r e t h a n o n e t i m e
% w h o h a v e w i t n e s s e d / b e e n e x p o s e d t o t h i s e v e n t a t m o r e t h a n o n e t i m e
R e s p o n d e n t s E x p e r i e n c e s w i t h a n d E x p o s u r e s t o U n s a f e C o n d i t i o n s i n t h e i r N e i g h b o r h o o d s
A s s a u l t a t h o m e
S h o p l i f t i n g
R o b b e r y
A s s a u l t o n s t r e e t
% w h o h a v e w i t n e s s e d / b e e n e x p o s e d t o t h i s e v e n t a t m o r e t h a n o n e t i m e
% w h o h a v e w i t n e s s e d / b e e n e x p o s e d t o t h i s e v e n t a t m o r e t h a n o n e t i m e
% w h o h a v e w i t n e s s e d / b e e n e x p o s e d t o t h i s e v e n t a t m o r e t h a n o n e t i m e
Central District

San Francisco Safety Network Page 17 of 47
% Race/Ethnicity of Survey Respondents
White58%
Asian31%
Multi-ethnic4%
Other7%
% Respondent Activity in Neighborhood
3
22
37
38
1
3
5
6
33
52
0 10 20 30 40 50 60
Medical provider
Merchant
Other business*
Service provider
SRO
Public housing
Affordable housing
Other resident
Homeowner
Renter
Percents*Includes students
The Basics… - A total of 198 surveys
were completed by either residents or merchants in the Central district.
- Of these, 44% were male respondents and 56% were female respondents.
- The average age of survey respondents was 47 years.
- The age range for respondents was varied, from 30.6% reporting being less than 21 years of age to 35.5% reporting ages 60 and over.
Central District

San Francisco Safety Network Page 18 of 47
In your neighborhood, how Unsafe do you feel...
1.8
3.5
7.9
10.6
13.7
10.6
15.0
22.9
41.4
48.5
39.6
47.6
0.0 10.0 20.0 30.0 40.0 50.0 60.0 70.0 80.0 90.0 100.0
At Home
At Schools
Other places
Riding public transit
On the Streets
At parks
Plac
es
Percents
Unsafe
Somewhatunsafe
Ingleside District Includes the following neighborhoods: Bernal Heights, Alemany, Excelsior, Vis Valley, OMI, Portola
Respondents’ opinions on the top factors that contribute to their sense of feeling unsafe in their neighborhoods (in order of frequency):
- Lack of services for people with low incomes. - Poor planning on large streets make it unsafe and uninviting for walkers, shoppers & other pedestrians. - Poor street lighting. - Gangs and drugs. - Community isolation.

San Francisco Safety Network Page 19 of 47
%3 2 . 2 %
2 7 . 3 %
3 3 . 9 %
3 0 . 0 %
3 2 . 6 %
2 8 . 2 %
2 9 . 1 %
2 6 . 4 %
1 5 . 0 %
1 5 . 0 %
2 4 . 7 %
2 1 . 6 %
3 1 . 7 %
2 7 . 3 %
6 5 . 6 %
5 4 . 2 %
2 2 . 0 %
1 9 . 4 %
4 2 . 7 %
3 7 . 4 %
5 2 . 4 %
4 3 . 2 %
% w h o h a v e w i t n e s s e d / b e e n e x p o s e d t o t h i s e v e n t m o r e t h a n o n e t i m e
% w h o h a v e w i t n e s s e d / b e e n e x p o s e d t o t h i s e v e n t m o r e t h a n o n e t i m e
% w h o h a v e w i t n e s s e d / b e e n e x p o s e d t o t h i s e v e n t m o r e t h a n o n e t i m e
% w h o h a v e w i t n e s s e d / b e e n e x p o s e d t o t h i s e v e n t m o r e t h a n o n e t i m e
D r u g v i o l e n c e
G u n v i o l e n c e
H i t a n d r u n
S p e e d i n g c a r s
P e d e s t r i a n i n j u r e d
D V / S e x u a l A s s a u l t
H a r a s s m e n t
% w h o h a v e w i t n e s s e d / b e e n e x p o s e d t o t h i s e v e n t m o r e t h a n o n e t i m e
% w h o h a v e w i t n e s s e d / b e e n e x p o s e d t o t h i s e v e n t m o r e t h a n o n e t i m e
% w h o h a v e w i t n e s s e d / b e e n e x p o s e d t o t h i s e v e n t m o r e t h a n o n e t i m e
% w h o h a v e w i t n e s s e d / b e e n e x p o s e d t o t h i s e v e n t m o r e t h a n o n e t i m e
R e s p o n d e n t s E x p e r i e n c e s w i t h a n d E x p o s u r e s t o U n s a f e C o n d i t i o n s i n t h e i r N e i g h b o r h o o d s
A s s a u l t a t h o m e
S h o p l i f t i n g
R o b b e r y
A s s a u l t o n s t r e e t
% w h o h a v e w i t n e s s e d / b e e n e x p o s e d t o t h i s e v e n t m o r e t h a n o n e t i m e
% w h o h a v e w i t n e s s e d / b e e n e x p o s e d t o t h i s e v e n t m o r e t h a n o n e t i m e
% w h o h a v e w i t n e s s e d / b e e n e x p o s e d t o t h i s e v e n t m o r e t h a n o n e t i m e
Ingleside

San Francisco Safety Network Page 20 of 47
% Race/Ethnicity of Survey Respondents
Latino18%
African American25%
Multi-ethnic/Other/API16%White
26%
Asian15%
% Respondent Activity in Neighborhood
1.518.2
34.845.5
0.64.0
10.314.9
33.736.6
0.0 5.0 10.0 15.0 20.0 25.0 30.0 35.0 40.0 45.0 50.0
Medical providerMerchant
Other businessService provider
SROOther resident
Affordable housingPublic housing
HomeownerRenter
Percents
The Basics… - A total of 227 surveys
were completed by individuals living, working and walking in the Ingleside, Ingleside/Taraval Districts.
- Of these, 37.8% were male respondents and 62.2 were female respondents.
- The mean age of respondents was 39 years of age.
- 15% of the survey respondents were ages 14-17.
Ingleside

San Francisco Safety Network Page 21 of 47
In your neighborhood, how Unsafe do you feel...
4.1
6.6
13.8
22.3
22.3
19.8
20.7
18.8
43.8
45.7
46.1
48.8
0.0 10.0 20.0 30.0 40.0 50.0 60.0 70.0 80.0 90.0 100.0
At Home
At Schools
Other places
Riding public transit
On the Streets
At parks
Plac
es
Percents
Unsafe
Somewhatunsafe
Mission District Includes the following neighborhoods: Noe Valley, Mission, Dolores Park, Castro
Respondents’ opinion on the top factors that contribute to their sense of feeling unsafe in their neighborhood (in order of frequency):
- Drugs and gangs - Lack of affordable housing - Lack of living-wage jobs - Abundance of liquor stores - Dark, unclean streets

San Francisco Safety Network Page 22 of 47
%4 3 . 8 %
4 9 . 9 %
4 6 . 1 %
4 2 . 1 %
3 5 . 5 %
3 2 . 9 %
2 4 . 8 %
2 2 . 7 %
9 . 1 %
8 . 3 %
2 0 . 7 %
1 9 . 4 %
3 3 . 9 %
3 0 . 8 %
7 0 . 0 %
6 3 . 0 %
2 6 . 4 %
2 4 . 0 %
3 9 . 0 %
3 4 . 0 %
6 4 . 3 %
5 7 . 4 %
% w h o h a v e w i t n e s s e d / b e e n e x p o s e d t o t h i s e v e n t m o r e t h a n o n e t i m e
% w h o h a v e w i t n e s s e d / b e e n e x p o s e d t o t h i s e v e n t m o r e t h a n o n e t i m e
% w h o h a v e w i t n e s s e d / b e e n e x p o s e d t o t h i s e v e n t m o r e t h a n o n e t i m e
% w h o h a v e w i t n e s s e d / b e e n e x p o s e d t o t h i s e v e n t m o r e t h a n o n e t i m e
D r u g v i o l e n c e
G u n v i o l e n c e
H i t a n d r u n
S p e e d i n g c a r s
P e d e s t r i a n i n j u r e d
D V / S e x u a l A s s a u l t
H a r a s s m e n t
% w h o h a v e w i t n e s s e d / b e e n e x p o s e d t o t h i s e v e n t m o r e t h a n o n e t i m e
% w h o h a v e w i t n e s s e d / b e e n e x p o s e d t o t h i s e v e n t m o r e t h a n o n e t i m e
% w h o h a v e w i t n e s s e d / b e e n e x p o s e d t o t h i s e v e n t m o r e t h a n o n e t i m e
% w h o h a v e w i t n e s s e d / b e e n e x p o s e d t o t h i s e v e n t m o r e t h a n o n e t i m e
R e s p o n d e n t s E x p e r i e n c e s w i t h a n d E x p o s u r e s t o U n s a f e C o n d i t i o n s i n t h e i r N e i g h b o r h o o d s
A s s a u l t a t h o m e
S h o p l i f t i n g
R o b b e r y
A s s a u l t o n s t r e e t
% w h o h a v e w i t n e s s e d / b e e n e x p o s e d t o t h i s e v e n t m o r e t h a n o n e t i m e
% w h o h a v e w i t n e s s e d / b e e n e x p o s e d t o t h i s e v e n t m o r e t h a n o n e t i m e
% w h o h a v e w i t n e s s e d / b e e n e x p o s e d t o t h i s e v e n t m o r e t h a n o n e t i m e
Mission District

San Francisco Safety Network Page 23 of 47
% Race/Ethnicity of Survey Respondents
Other5% African American
5%M ulti-ethnic
10%
White40%
Latino40%
% Respondent Activity in Neighborhood
2.4
12.6
28.5
56.5
2.7
3.6
3.9
5.3
6.0
38.2
40.3
0 10 20 30 40 50 60 70
Medical provider
Merchant
Service provider
Other business*
SRO
Public housing
Other resident
Homeless
Affordable housing
Renter
Homeowner
Percents*Includes office managers, day laborers, students
The Basics… - A total of 484 surveys were
completed residents or merchants in the Mission district.
- Of these, 41% were male respondents and 58% were female respondents.
- The average age of survey respondents was 36 years.
- 32% of the respondents were ages 14-17 and 28% were ages 21-39.
Mission District

San Francisco Safety Network Page 24 of 47
In your neighborhood, how Unsafe do you feel...
4.4
2.9
5.9
19.1
10.3
13.2
23.5
20.6
47.1
41.2
48.5
36.8
0.0 10.0 20.0 30.0 40.0 50.0 60.0 70.0 80.0 90.0 100.0
At Home
At Schools
Other places
Riding public transit
On the Streets
At parks
Plac
es
Percents
Unsafe
Somewhatunsafe
Northern District Includes the following neighborhoods: Western Addition, Hayes Valley, Marina, Japantown, Lower Haight
Respondents’ opinion on the top factors that contribute to their sense of feeling unsafe in their neighborhood (in order of frequency):
- Lack of police presence - Poor street lighting - Dirty streets - Drug use and selling

San Francisco Safety Network Page 25 of 47
%2 6 . 5 %
1 9 . 1 %
2 6 . 5 %
1 9 . 1 %
2 9 . 4 %
1 9 . 1 %
3 2 . 4 %
2 0 . 6 %
1 0 . 3 %
5 . 9 %
2 2 . 1 %
1 4 . 7 %
2 2 . 1 %
1 6 . 2 %
5 5 . 9 %
3 8 . 2 %
1 4 . 7 %
5 . 9 %
3 8 . 2 %
2 3 . 5 %
5 8 . 8 %
4 1 . 0 %
R e s p o n d e n t s E x p e r i e n c e s w i t h a n d E x p o s u r e s t o U n s a f e C o n d i t i o n s i n t h e i r N e i g h b o r h o o d s
A s s a u l t a t h o m e
S h o p l i f t i n g
R o b b e r y
A s s a u l t o n s t r e e t
% w h o h a v e w i t n e s s e d / b e e n e x p o s e d t o t h i s e v e n t m o r e t h a n o n e t i m e
% w h o h a v e w i t n e s s e d / b e e n e x p o s e d t o t h i s e v e n t m o r e t h a n o n e t i m e
% w h o h a v e w i t n e s s e d / b e e n e x p o s e d t o t h i s e v e n t m o r e t h a n o n e t i m e
S p e e d i n g c a r s
P e d e s t r i a n i n j u r e d
D V / S e x u a l A s s a u l t
H a r a s s m e n t
% w h o h a v e w i t n e s s e d / b e e n e x p o s e d t o t h i s e v e n t m o r e t h a n o n e t i m e
% w h o h a v e w i t n e s s e d / b e e n e x p o s e d t o t h i s e v e n t m o r e t h a n o n e t i m e
% w h o h a v e w i t n e s s e d / b e e n e x p o s e d t o t h i s e v e n t m o r e t h a n o n e t i m e
% w h o h a v e w i t n e s s e d / b e e n e x p o s e d t o t h i s e v e n t m o r e t h a n o n e t i m e
% w h o h a v e w i t n e s s e d / b e e n e x p o s e d t o t h i s e v e n t m o r e t h a n o n e t i m e
% w h o h a v e w i t n e s s e d / b e e n e x p o s e d t o t h i s e v e n t m o r e t h a n o n e t i m e
% w h o h a v e w i t n e s s e d / b e e n e x p o s e d t o t h i s e v e n t m o r e t h a n o n e t i m e
% w h o h a v e w i t n e s s e d / b e e n e x p o s e d t o t h i s e v e n t m o r e t h a n o n e t i m e
D r u g v i o l e n c e
G u n v i o l e n c e
H i t a n d r u n
Northern District

San Francisco Safety Network Page 26 of 47
% Race/Ethnicity of Survey Respondents
Multi-ethnic5%
White21%
African American47%
Latino3%
Asian24%
% Respondent Activity in Neighborhood
15
15
35
35
4
4
18
29
45
0 10 20 30 40 50 60
Merchant
Medical provider
Service provider
Other business
Affordable housing
Homeowner
Other resident
Renter
Public housing
Percents
The Basics… - A total of 68 surveys were
completed by residents or merchants in the Northern District.
- Of these, 48% were male respondents and 52% were female respondents.
- The median age of survey respondents was 44 years.
- 13% of the survey respondents were 20 or younger.
Northern District

San Francisco Safety Network Page 27 of 47
In your neighborhood, how Unsafe do you feel...
2.2
2.2
6.0
10.4
18.1
9.9
19.8
9.9
44.5
50.5
41.2
50.0
0.0 10.0 20.0 30.0 40.0 50.0 60.0 70.0 80.0 90.0 100.0
At Home
At Schools
Other places
Riding public transit
On the Streets
At parks
Plac
es
Percents
Unsafe
Somewhatunsafe
Park District Includes the following neighborhoods: Upper Haight, Divisidero Corridor, Twin Peaks, Western Addition
Respondents’ opinions on the top factors that contribute to their sense of feeling unsafe in their neighborhoods (in order of frequency):
- Traffic/High speeding cars - Drugs/gangs - Insufficient activities for youth - Lack of services for homeless

San Francisco Safety Network Page 28 of 47
%5 0 . 0 %
4 7 . 8 %
4 2 . 9 %
4 0 . 7 %
2 5 . 8 %
2 5 . 8 %
2 3 . 6 %
2 4 . 2 %
1 1 . 5 %
1 0 . 4 %
2 0 . 3 %
1 9 . 0 %
3 0 . 2 %
2 9 . 7 %
7 0 . 3 %
6 6 . 5 %
1 8 . 7 %
2 0 . 3 %
2 3 . 1 %
2 1 . 4 %
6 5 . 4 %
5 9 . 3 %
% w h o h a v e w i t n e s s e d / b e e n e x p o s e d t o t h i s e v e n t m o r e t h a n o n e t i m e
% w h o h a v e w i t n e s s e d / b e e n e x p o s e d t o t h i s e v e n t m o r e t h a n o n e t i m e
% w h o h a v e w i t n e s s e d / b e e n e x p o s e d t o t h i s e v e n t m o r e t h a n o n e t i m e
% w h o h a v e w i t n e s s e d / b e e n e x p o s e d t o t h i s e v e n t m o r e t h a n o n e t i m e
D r u g v i o l e n c e
G u n v i o l e n c e
H i t a n d r u n
S p e e d i n g c a r s
P e d e s t r i a n i n j u r e d
D V / S e x u a l A s s a u l t
H a r a s s m e n t
% w h o h a v e w i t n e s s e d / b e e n e x p o s e d t o t h i s e v e n t m o r e t h a n o n e t i m e
% w h o h a v e w i t n e s s e d / b e e n e x p o s e d t o t h i s e v e n t m o r e t h a n o n e t i m e
% w h o h a v e w i t n e s s e d / b e e n e x p o s e d t o t h i s e v e n t m o r e t h a n o n e t i m e
% w h o h a v e w i t n e s s e d / b e e n e x p o s e d t o t h i s e v e n t m o r e t h a n o n e t i m e
R e s p o n d e n t s E x p e r i e n c e s w i t h a n d E x p o s u r e s t o U n s a f e C o n d i t i o n s i n t h e i r N e i g h b o r h o o d s
A s s a u l t a t h o m e
S h o p l i f t i n g
R o b b e r y
A s s a u l t o n s t r e e t
% w h o h a v e w i t n e s s e d / b e e n e x p o s e d t o t h i s e v e n t m o r e t h a n o n e t i m e
% w h o h a v e w i t n e s s e d / b e e n e x p o s e d t o t h i s e v e n t m o r e t h a n o n e t i m e
% w h o h a v e w i t n e s s e d / b e e n e x p o s e d t o t h i s e v e n t m o r e t h a n o n e t i m e
Park District

San Francisco Safety Network Page 29 of 47
% Race/Ethnicity of Survey Respondents
Multi-ethnic7%
White65%
Other5%
African American
12%
Latino5%Asian
6%
% R e s p o n d e n t A c tiv ity in N e ig h b o rh o o d
8
1 7
3 5
4 0
1
2
2
3
6
3 7
5 0
0 1 0 20 3 0 4 0 5 0 6 0
M e d ic a l p ro v id e r
M e rc h a n t
S e rv ic e p ro v id e r
O t h e r b u s in e s s
A ffo rd a b le h o u s in g
S R O
P u b lic h o u s in g
H o m e le s s
O t h e r re s id e n t
R e n t e r
H o m e o w n e r
P e r c e n t s
The Basics… - A total of 182 surveys were
completed by either residents or merchants in the Park district.
- Of these, 51% were male respondents and 49% were female respondents.
- The average age of survey respondents was 42 years.
- The age range for respondents was varied, from 22% reporting being less than 14 years of age to 64.8% reporting ages 21 to 60.
Park District

San Francisco Safety Network Page 30 of 47
In your neighborhood, how Unsafe do you feel...
0.6
1.0
3.8
8.9
4.5
11.5
6.7
13.4
36.9
43.6
35.4
38.5
0.0 10.0 20.0 30.0 40.0 50.0 60.0 70.0 80.0 90.0 100.0
At Home
At Schools
Other places
Riding public transit
On the Streets
At parks
Plac
es
Percents
Unsafe
Somewhatunsafe
Richmond District Includes the following neighborhoods: Inner/Outer Richmond, Laurel Hghts, Presidio Hghts, Seacliff
Respondents’ opinions on the top factors that contribute to their sense of feeling unsafe in their neighborhoods (in order of frequency):
- Traffic & Speeding cars - Lack of community/neighbor interaction - Closed businesses (dark streets at night) - Narrow sidewalks

San Francisco Safety Network Page 31 of 47
%1 8 . 8 %
1 7 . 5 %
1 7 . 5 %
1 5 . 3 %
1 8 . 5 %
8 . 9 %
1 1 . 8 %
1 1 . 1 %
4 . 5 %
4 . 5 %
7 . 6 %
6 . 4 %
1 6 . 6 %
1 4 . 3 %
4 3 . 9 %
3 3 . 1 %
1 3 . 1 %
5 . 1 %
6 . 1 %
3 . 8 %
1 3 . 1 %
9 . 2 %
R e s p o n d e n t s E x p e r i e n c e s w i t h a n d E x p o s u r e s t o U n s a f e C o n d i t i o n s i n t h e i r N e i g h b o r h o o d s
A s s a u l t a t h o m e
S h o p l i f t i n g
R o b b e r y
A s s a u l t o n s t r e e t
% w h o h a v e w i t n e s s e d / b e e n e x p o s e d t o t h i s e v e n t m o r e t h a n o n e t i m e
% w h o h a v e w i t n e s s e d / b e e n e x p o s e d t o t h i s e v e n t m o r e t h a n o n e t i m e
% w h o h a v e w i t n e s s e d / b e e n e x p o s e d t o t h i s e v e n t m o r e t h a n o n e t i m e
S p e e d i n g c a r s
P e d e s t r i a n i n j u r e d
D V / S e x u a l A s s a u l t
H a r a s s m e n t
% w h o h a v e w i t n e s s e d / b e e n e x p o s e d t o t h i s e v e n t m o r e t h a n o n e t i m e
% w h o h a v e w i t n e s s e d / b e e n e x p o s e d t o t h i s e v e n t m o r e t h a n o n e t i m e
% w h o h a v e w i t n e s s e d / b e e n e x p o s e d t o t h i s e v e n t m o r e t h a n o n e t i m e
% w h o h a v e w i t n e s s e d / b e e n e x p o s e d t o t h i s e v e n t m o r e t h a n o n e t i m e
% w h o h a v e w i t n e s s e d / b e e n e x p o s e d t o t h i s e v e n t m o r e t h a n o n e t i m e
% w h o h a v e w i t n e s s e d / b e e n e x p o s e d t o t h i s e v e n t m o r e t h a n o n e t i m e
% w h o h a v e w i t n e s s e d / b e e n e x p o s e d t o t h i s e v e n t m o r e t h a n o n e t i m e
% w h o h a v e w i t n e s s e d / b e e n e x p o s e d t o t h i s e v e n t m o r e t h a n o n e t i m e
D r u g v i o l e n c e
G u n v i o l e n c e
H i t a n d r u n
Richmond District

San Francisco Safety Network Page 32 of 47
% Race/Ethnicity of Survey Respondents
Other9%
Asian57%
White30%
African American4%
% R e s p o n d e n t A c t i v i t y i n N e i g h b o r h o o d
5
1 1
3 9
4 6
0
2
4
6
7
3 4
4 7
0 1 0 2 0 3 0 4 0 5 0 6 0
M e d i c a l p r o v i d e r
M e r c h a n t
S e r v i c e p r o v i d e r
O t h e r b u s i n e s s *
H o m e l e s s
S R O
P u b l i c h o u s i n g
A f f o r d a b l e h o u s i n g
O t h e r r e s i d e n t
H o m e o w n e r
R e n t e r
P e r c e n t s
The Basics… - A total of 314 surveys were
completed by either residents or merchants in the Richmond district.
- Of these, 38% were male respondents and 62% were female respondents.
- The average age of survey respondents was 48 years.
- The age range for respondents was varied, from 15.5% reporting being less than 21 years of age to 64.8% reporting ages 40 and over.
Richmond District

San Francisco Safety Network Page 33 of 47
In your neighborhood, how Unsafe do you feel...
1.9
2.6
8.9
9.5
25.9
16.5
15.2
14.6
48.1
50.0
44.9
44.3
0.0 10.0 20.0 30.0 40.0 50.0 60.0 70.0 80.0 90.0 100.0
At Home
At Schools
Other places
Riding public transit
On the Streets
At parks
Plac
es
Percents
Unsafe
Somewhatunsafe
Southern District Includes the following neighborhoods: SOMA, South Beach, Inner Mission, Yerba Buena, AT & T Park, Embarcadero
Respondents’ opinions on the top factors that contribute to their sense of feeling unsafe in their neighborhoods (in order of frequency):
- Unaffordable housing - Lack of resident participation/sense of community - High, speeding traffic - Drugs and gangs

San Francisco Safety Network Page 34 of 47
%5 8 . 2 %
4 4 . 9 %
4 3 . 0 %
2 7 . 8 %
3 2 . 9 %
2 1 . 5 %
1 9 . 6 %
1 3 . 3 %
6 . 3 %
2 . 5 %
2 4 . 7 %
1 3 . 9 %
2 9 . 7 %
1 6 . 5 %
5 7 . 6 %
4 5 . 6 %
1 2 . 0 %
3 . 8 %
1 3 . 9 %
4 . 4 %
6 3 . 9 %
5 0 . 6 %
% w h o h a v e w i t n e s s e d / b e e n e x p o s e d t o t h i s e v e n t m o r e t h a n o n e t i m e
% w h o h a v e w i t n e s s e d / b e e n e x p o s e d t o t h i s e v e n t m o r e t h a n o n e t i m e
% w h o h a v e w i t n e s s e d / b e e n e x p o s e d t o t h i s e v e n t m o r e t h a n o n e t i m e
% w h o h a v e w i t n e s s e d / b e e n e x p o s e d t o t h i s e v e n t m o r e t h a n o n e t i m e
D r u g v i o l e n c e
G u n v i o l e n c e
H i t a n d r u n
S p e e d i n g c a r s
P e d e s t r i a n i n j u r e d
D V / S e x u a l A s s a u l t
H a r a s s m e n t
% w h o h a v e w i t n e s s e d / b e e n e x p o s e d t o t h i s e v e n t m o r e t h a n o n e t i m e
% w h o h a v e w i t n e s s e d / b e e n e x p o s e d t o t h i s e v e n t m o r e t h a n o n e t i m e
% w h o h a v e w i t n e s s e d / b e e n e x p o s e d t o t h i s e v e n t m o r e t h a n o n e t i m e
% w h o h a v e w i t n e s s e d / b e e n e x p o s e d t o t h i s e v e n t m o r e t h a n o n e t i m e
R e s p o n d e n t s E x p e r i e n c e s w i t h a n d E x p o s u r e s t o U n s a f e C o n d i t i o n s i n t h e i r N e i g h b o r h o o d s
A s s a u l t a t h o m e
S h o p l i f t i n g
R o b b e r y
A s s a u l t o n s t r e e t
% w h o h a v e w i t n e s s e d / b e e n e x p o s e d t o t h i s e v e n t m o r e t h a n o n e t i m e
% w h o h a v e w i t n e s s e d / b e e n e x p o s e d t o t h i s e v e n t m o r e t h a n o n e t i m e
% w h o h a v e w i t n e s s e d / b e e n e x p o s e d t o t h i s e v e n t m o r e t h a n o n e t i m e
Southern District

San Francisco Safety Network Page 35 of 47
% Race/Ethnicity of Survey Respondents
White66%
African American
5%
Other ethnicity5%
Multi-ethnic5%
Asian13%
Latino6%
% R e s p o n d e n t A c t i v i t y i n N e i g h b o r h o o d
9
3 0
5 8
3
7
8
9
2 1
5 1
0 1 0 2 0 3 0 4 0 5 0 6 0 7 0
M e r c h a n t
O t h e r b u s i n e s s
S e r v i c e p r o v i d e r
P u b l i c h o u s i n g
O t h e r r e s i d e n t
S R O
A f f o r d a b l e h o u s i n g
R e n t e r
H o m e o w n e r
P e r c e n t s
The Basics… - A total of 158 surveys were
completed by either residents or merchants in the Southern district.
- Of these, 61% were male respondents and 39% were female respondents.
- The average age of survey respondents was 42 years.
- The age range for respondents was consistently older, with no respondents under 21 years of age and 81.8% reporting ages 40 and over.
Southern District

San Francisco Safety Network Page 36 of 47
In your neighborhood, how Unsafe do you feel...
0.7
0.7
2.6
5.6
4.1
4.1
13.4
12.3
43.5
44.2
34.6
45.0
0.0 10.0 20.0 30.0 40.0 50.0 60.0 70.0 80.0 90.0 100.0
At Home
At Schools
Other places
Riding public transit
On the Streets
At parks
Plac
es
Percents
Unsafe
Somewhatunsafe
Taraval District Includes the following neighborhoods: Outer Sunset, SFSU, Taraval Street corridor, Ocean Beach, Noreiga Street corridor
Respondents’ opinions on the top factors that contribute to their sense of feeling unsafe in their neighborhoods (in order of frequency):
- Lack of enforcement of traffic laws - Limited public space for recreation activities - Gun violence - Poor street lighting - Unemployment

San Francisco Safety Network Page 37 of 47
%2 1 . 6 %
1 4 . 5 %
1 3 . 8 %
6 . 3 %
1 5 . 2 %
7 . 8 %
1 0 . 8 %
8 . 6 %
4 . 8 %
3 . 7 %
6 . 7 %
5 . 2 %
1 8 . 6 %
1 1 . 2 %
6 3 . 6 %
5 0 . 2 %
1 1 . 9 %
6 . 3 %
5 . 9 %
4 . 8 %
2 0 . 1 %
1 4 . 1 %
R e s p o n d e n t s E x p e r i e n c e s w i t h a n d E x p o s u r e s t o U n s a f e C o n d i t i o n s i n t h e i r N e i g h b o r h o o d s
A s s a u l t a t h o m e
S h o p l i f t i n g
R o b b e r y
A s s a u l t o n s t r e e t
% w h o h a v e w i t n e s s e d / b e e n e x p o s e d t o t h i s e v e n t m o r e t h a n o n e t i m e
% w h o h a v e w i t n e s s e d / b e e n e x p o s e d t o t h i s e v e n t m o r e t h a n o n e t i m e
% w h o h a v e w i t n e s s e d / b e e n e x p o s e d t o t h i s e v e n t m o r e t h a n o n e t i m e
S p e e d i n g c a r s
P e d e s t r i a n i n j u r e d
D V / S e x u a l A s s a u l t
H a r a s s m e n t
% w h o h a v e w i t n e s s e d / b e e n e x p o s e d t o t h i s e v e n t m o r e t h a n o n e t i m e
% w h o h a v e w i t n e s s e d / b e e n e x p o s e d t o t h i s e v e n t m o r e t h a n o n e t i m e
% w h o h a v e w i t n e s s e d / b e e n e x p o s e d t o t h i s e v e n t m o r e t h a n o n e t i m e
% w h o h a v e w i t n e s s e d / b e e n e x p o s e d t o t h i s e v e n t m o r e t h a n o n e t i m e
% w h o h a v e w i t n e s s e d / b e e n e x p o s e d t o t h i s e v e n t m o r e t h a n o n e t i m e
% w h o h a v e w i t n e s s e d / b e e n e x p o s e d t o t h i s e v e n t m o r e t h a n o n e t i m e
% w h o h a v e w i t n e s s e d / b e e n e x p o s e d t o t h i s e v e n t m o r e t h a n o n e t i m e
D r u g v i o l e n c e
G u n v i o l e n c e
H i t a n d r u n
Taraval District

San Francisco Safety Network Page 38 of 47
% Race/Ethnicity of Survey Respondents
Other11%
Asian46%
White39%
Multi-ethnic4%
% R e s p o n d e n t A c t i v i t y i n N e i g h b o r h o o d
9
9
4 0
4 3
0
1
2
2
4 2
5 2
0 1 0 2 0 3 0 4 0 5 0 6 0
M e d ic a l p r o v id e r
M e r c h a n t
O t h e r b u s i n e s s
S e r v ic e p r o v id e r
S R O
P u b l ic h o u s in g
O t h e r r e s i d e n t
A f f o r d a b le h o u s in g
R e n t e r
H o m e o w n e r
P e r c e n t s
The Basics… - A total of 269 surveys were
completed by either residents or merchants in the Taraval district.
- Of these, 38% were male respondents and 62% were female respondents.
- The average age of survey respondents was 40 years.
- The age range for respondents was consistently adult, with 78.4% reporting ages 21 to 50.
Taraval District

San Francisco Safety Network Page 39 of 47
In your neighborhood, how Unsafe do you feel...
12.1
4.7
14.1
15.4
24.2
15.4
15.4
23.5
45.0
44.3
47.7
43.0
0.0 10.0 20.0 30.0 40.0 50.0 60.0 70.0 80.0 90.0 100.0
At Home
At Schools
Other places
Riding public transit
On the Streets
At parks
Plac
es
Percents
Unsafe
Somewhatunsafe
Tenderloin Includes the following neighborhoods: Tenderloin, Halladie Plaza, U.N. Plaza
Respondents’ opinion on the top factors that contribute to their sense of feeling unsafe in their neighborhood (in order of frequency):
- Drug use and sales - Police harassment - Lack of employment - Lack of mental health and substance abuse prevention services - Lack of housing/shelters
San Francisco Safety Network Page 40 of 47
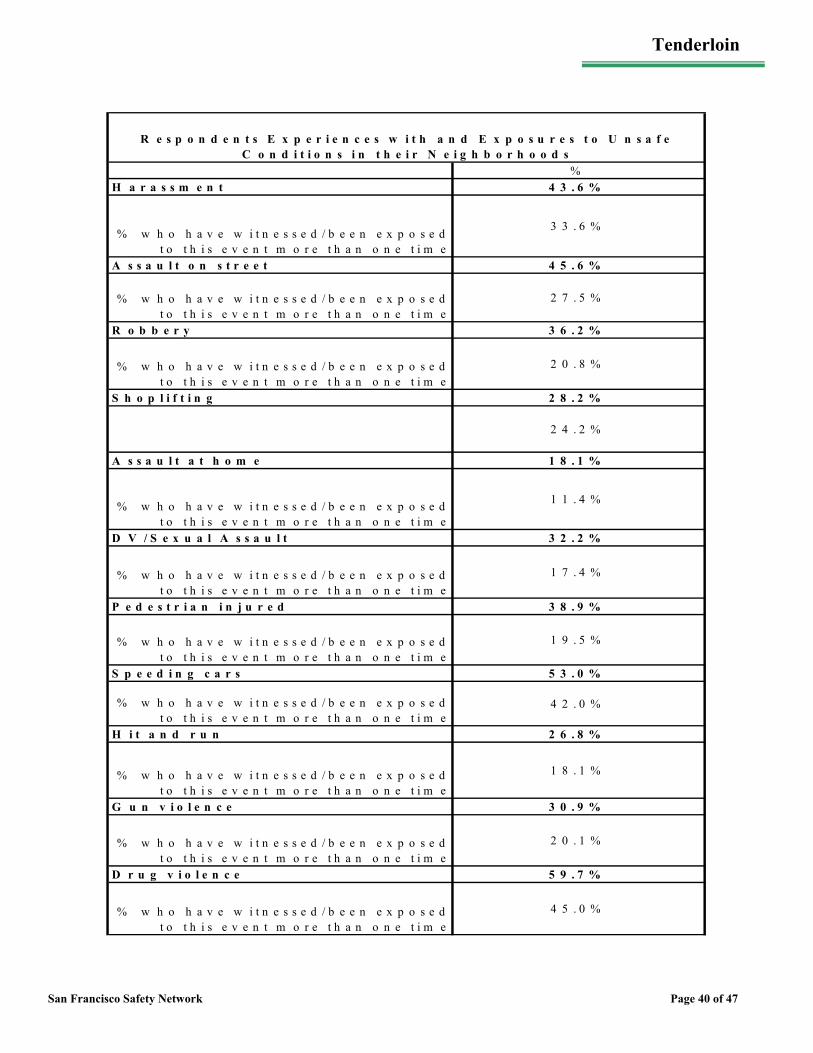
%4 3 . 6 %
3 3 . 6 %
4 5 . 6 %
2 7 . 5 %
3 6 . 2 %
2 0 . 8 %
2 8 . 2 %
2 4 . 2 %
1 8 . 1 %
1 1 . 4 %
3 2 . 2 %
1 7 . 4 %
3 8 . 9 %
1 9 . 5 %
5 3 . 0 %
4 2 . 0 %
2 6 . 8 %
1 8 . 1 %
3 0 . 9 %
2 0 . 1 %
5 9 . 7 %
4 5 . 0 %
% w h o h a v e w i t n e s s e d / b e e n e x p o s e d t o t h i s e v e n t m o r e t h a n o n e t i m e
% w h o h a v e w i t n e s s e d / b e e n e x p o s e d t o t h i s e v e n t m o r e t h a n o n e t i m e
% w h o h a v e w i t n e s s e d / b e e n e x p o s e d t o t h i s e v e n t m o r e t h a n o n e t i m e
% w h o h a v e w i t n e s s e d / b e e n e x p o s e d t o t h i s e v e n t m o r e t h a n o n e t i m e
D r u g v i o l e n c e
G u n v i o l e n c e
H i t a n d r u n
S p e e d i n g c a r s
P e d e s t r i a n i n j u r e d
D V / S e x u a l A s s a u l t
H a r a s s m e n t
% w h o h a v e w i t n e s s e d / b e e n e x p o s e d t o t h i s e v e n t m o r e t h a n o n e t i m e
% w h o h a v e w i t n e s s e d / b e e n e x p o s e d t o t h i s e v e n t m o r e t h a n o n e t i m e
% w h o h a v e w i t n e s s e d / b e e n e x p o s e d t o t h i s e v e n t m o r e t h a n o n e t i m e
R e s p o n d e n t s E x p e r i e n c e s w i t h a n d E x p o s u r e s t o U n s a f e C o n d i t i o n s i n t h e i r N e i g h b o r h o o d s
A s s a u l t a t h o m e
S h o p l i f t i n g
R o b b e r y
A s s a u l t o n s t r e e t
% w h o h a v e w i t n e s s e d / b e e n e x p o s e d t o t h i s e v e n t m o r e t h a n o n e t i m e
% w h o h a v e w i t n e s s e d / b e e n e x p o s e d t o t h i s e v e n t m o r e t h a n o n e t i m e
% w h o h a v e w i t n e s s e d / b e e n e x p o s e d t o t h i s e v e n t m o r e t h a n o n e t i m e
Tenderloin

San Francisco Safety Network Page 41 of 47
% Race/Ethnicity of Survey Respondents
White25%
African American
25%
Asian31%
Multi-ethnic10%
Latino6%
Other3%
% Respondent Activity in Neighborhood
27
36
36
6
7
8
9
13
19
39
0 10 20 30 40 50 60
Other business*
Service provider
M erchant
Homeless
SRO
Other resident
Public Housing
Homeowner
Affordable housing
Renter
Percents
The Basics… - A total of 149 surveys were
completed by either residents or merchants in the Tenderloin district.
- Of these, 61% were male respondents and 39% were female respondents.
- The average age of survey respondents was 41 years of age.
- Only 11% of the respondents were ages 14-17, whereas over 33% reported ages 40 and older
Tenderloin

San Francisco Safety Network Page 42 of 47
In your neighborhood, how Unsafe do you feel...
8.0
6.8
15.9
18.2
13.6
15.9
22.4
14.2
34.1
36.4
43.2
37.5
0.0 10.0 20.0 30.0 40.0 50.0 60.0 70.0 80.0 90.0 100.0
At Home
At Schools
Other places
Riding public transit
On the Streets
At parks
Plac
es
Percents
Unsafe
Somewhatunsafe
Visitation Valley District Includes the following neighborhood: Visitation Valley
Respondents’ opinion on the top factors that contribute to their sense of feeling unsafe in their neighborhood (in order of frequency):
- Alcohol availability - Drug availability and consumption - High, speeding traffic - Lack of jobs

San Francisco Safety Network Page 43 of 47
%4 6 . 6 %
3 1 . 8 %
3 5 . 2 %
1 8 . 2 %
3 8 . 6 %
2 1 . 6 %
3 4 . 1 %
2 1 . 6 %
1 7 . 0 %
1 1 . 4 %
2 9 . 5 %
1 8 . 2 %
2 9 . 5 %
1 5 . 9 %
7 0 . 5 %
4 5 . 5 %
3 0 . 7 %
2 0 . 5 %
4 7 . 7 %
2 6 . 1 %
4 7 . 1 %
2 9 . 5 %
R e s p o n d e n t s E x p e r i e n c e s w i t h a n d E x p o s u r e s t o U n s a f e C o n d i t i o n s i n t h e i r N e i g h b o r h o o d s
A s s a u l t a t h o m e
S h o p l i f t i n g
R o b b e r y
A s s a u l t o n s t r e e t
% w h o h a v e w i t n e s s e d / b e e n e x p o s e d t o t h i s e v e n t m o r e t h a n o n e t i m e
% w h o h a v e w i t n e s s e d / b e e n e x p o s e d t o t h i s e v e n t m o r e t h a n o n e t i m e
% w h o h a v e w i t n e s s e d / b e e n e x p o s e d t o t h i s e v e n t m o r e t h a n o n e t i m e
S p e e d i n g c a r s
P e d e s t r i a n i n j u r e d
D V / S e x u a l A s s a u l t
H a r a s s m e n t
% w h o h a v e w i t n e s s e d / b e e n e x p o s e d t o t h i s e v e n t m o r e t h a n o n e t i m e
% w h o h a v e w i t n e s s e d / b e e n e x p o s e d t o t h i s e v e n t m o r e t h a n o n e t i m e
% w h o h a v e w i t n e s s e d / b e e n e x p o s e d t o t h i s e v e n t m o r e t h a n o n e t i m e
% w h o h a v e w i t n e s s e d / b e e n e x p o s e d t o t h i s e v e n t m o r e t h a n o n e t i m e
% w h o h a v e w i t n e s s e d / b e e n e x p o s e d t o t h i s e v e n t m o r e t h a n o n e t i m e
% w h o h a v e w i t n e s s e d / b e e n e x p o s e d t o t h i s e v e n t m o r e t h a n o n e t i m e
% w h o h a v e w i t n e s s e d / b e e n e x p o s e d t o t h i s e v e n t m o r e t h a n o n e t i m e
D r u g v i o l e n c e
G u n v i o l e n c e
H i t a n d r u n
Visitation Valley District
San Francisco Safety Network Page 44 of 47
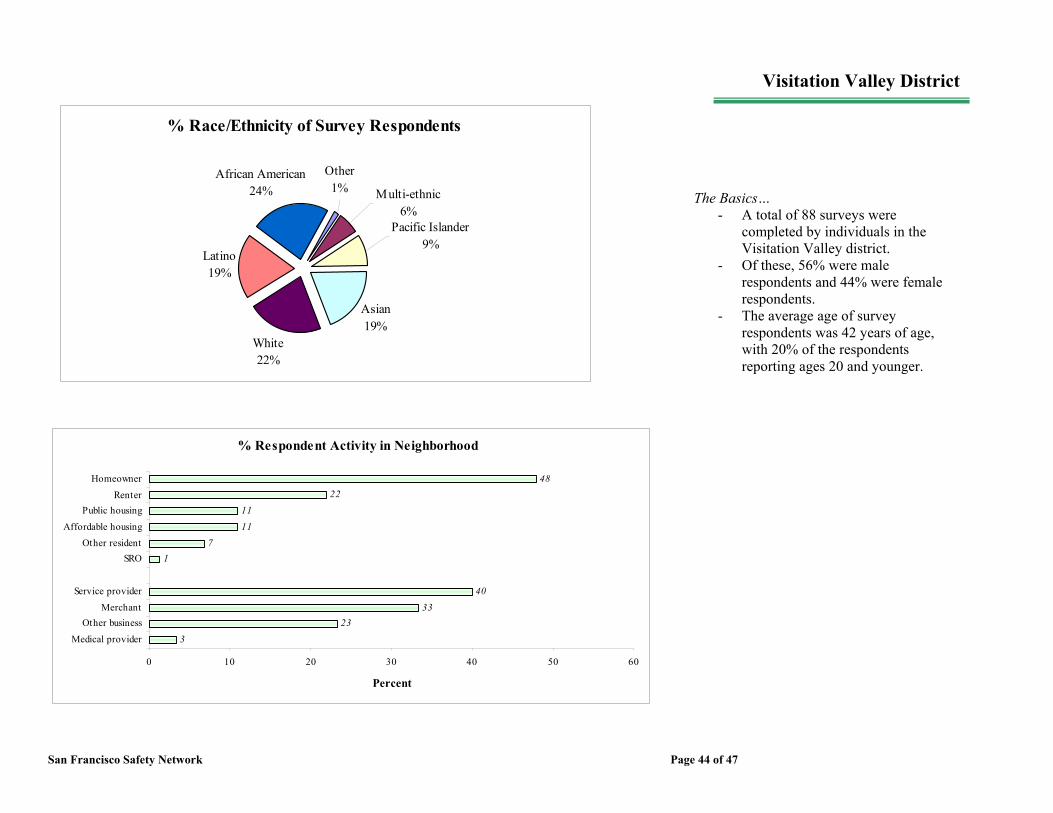
% Race/Ethnicity of Survey Respondents
Asian19%
White22%
Latino19%
African American24%
Pacific Islander9%
Other1% Multi-ethnic
6%
% Respondent Activity in Neighborhood
3
2333
40
17
11
11
2248
0 10 20 30 40 50 60
Medical provider
Other businessMerchant
Service provider
SROOther resident
Affordable housing
Public housingRenter
Homeowner
Percent
The Basics… - A total of 88 surveys were
completed by individuals in the Visitation Valley district.
- Of these, 56% were male respondents and 44% were female respondents.
- The average age of survey respondents was 42 years of age, with 20% of the respondents reporting ages 20 and younger.
Visitation Valley District
San Francisco Safety Network Page 45 of 47
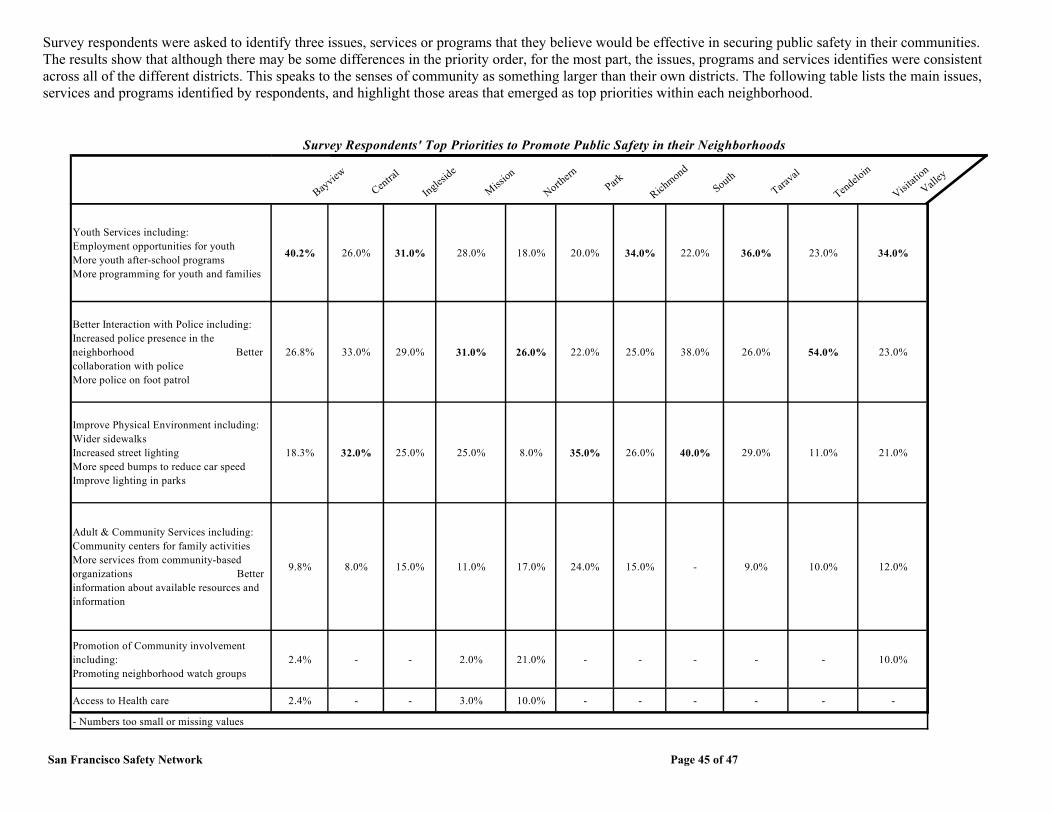
Survey Respondents' Top Priorities to Promote Public Safety in their Neighborhoods
Bayview
Central
Ingleside
Mission
Northern
ParkRich
mond
SouthTara
val
Tendeloin
Visitati
on
Valley
Youth Services including: Employment opportunities for youth More youth after-school programs More programming for youth and families
40.2% 26.0% 31.0% 28.0% 18.0% 20.0% 34.0% 22.0% 36.0% 23.0% 34.0%
Better Interaction with Police including: Increased police presence in the neighborhood Better collaboration with police More police on foot patrol
26.8% 33.0% 29.0% 31.0% 26.0% 22.0% 25.0% 38.0% 26.0% 54.0% 23.0%
Improve Physical Environment including: Wider sidewalks Increased street lighting More speed bumps to reduce car speed Improve lighting in parks
18.3% 32.0% 25.0% 25.0% 8.0% 35.0% 26.0% 40.0% 29.0% 11.0% 21.0%
Adult & Community Services including: Community centers for family activities More services from community-based organizations Better information about available resources and information
9.8% 8.0% 15.0% 11.0% 17.0% 24.0% 15.0% - 9.0% 10.0% 12.0%
Promotion of Community involvement including: Promoting neighborhood watch groups
2.4% - - 2.0% 21.0% - - - - - 10.0%
Access to Health care 2.4% - - 3.0% 10.0% - - - - - -
- Numbers too small or missing values
Survey respondents were asked to identify three issues, services or programs that they believe would be effective in securing public safety in their communities. The results show that although there may be some differences in the priority order, for the most part, the issues, programs and services identifies were consistent across all of the different districts. This speaks to the senses of community as something larger than their own districts. The following table lists the main issues, services and programs identified by respondents, and highlight those areas that emerged as top priorities within each neighborhood.

San Francisco Safety Network Page 46 of 47
Implications & Promising Approaches
Perception of safety is relatively low among the survey participants in San Francisco. Almost half of the respondents
reported feeling unsafe or somewhat unsafe in general. This sense of feeling unsafe is slightly higher than other surveys
on public perception of community safety. One study by the Bureau of Justice Statistics, for example, found that the
proportion of residents in large metropolitan areas, including Los Angeles and San Diego, who reported they were fearful
of crime in their neighborhood ranged from 20% to 48% (USBJS, Perceptions of Community Safety. Accessed at:
http://www.ojp.usdoj.gov/bjs/pub/pdf/cvpcs98.pdf
on May 23, 2006).
The Health Effects of a Safe Community
Healthy, safe, livable, family-oriented neighborhoods require a range of public service including schools, parks, open
space, libraries, and community centers. For example, having a neighborhood elementary school in a safe walking
distance is an essential feature of an environmentally sustainable community. It is also particularly important to families.
For children, the adverse health impacts of commuting to school include the loss of sleep, exposure to vehicle pollution,
and the lost opportunity for exercise. Schools also serve as important centers for social cohesion and community
building.
Parks are places where neighborhood residents can exercise, play and socialize and their safety and maintenance also
carries great health benefits. Light to moderate physical activity reduces the risk of heart disease, reduces the risk of
developing diabetes, reduces the risk of obesity, reduces blood pressure, prevents osteoporosis, relieves symptoms of
depression and anxiety, and prevents falls in the elderly. Even light physical activity provides the opportunity relieves
stress.
Promising Approaches: Survey Respondents Recommendations to Improve Public Safety in their Neighborhoods Survey respondents provided innovative suggestions for promoting public safety:
Better Interaction with Police:
o Periodic community town hall meetings with police and City officials o Increased police patrolling on bikes, and foot. o Police integration with schools, community centers o ‘Buddy system’ where police officers are mentors to young people in the community o Provision of self-defense classes in community settings o Police patrolling in public transportation

San Francisco Safety Network Page 47 of 47
Youth Services:
o Cultural and arts programs o Sports programs o Affordable entertainment for youth o Employment training and development o Professional development (vocational and career) o Affordable housing
Improved Physical Environment:
o Traffic calming strategies o Cleaner, safer parks o Opportunities for family and community interaction o Wider sidewalks o More bike lanes
Community Services:
o Language education o Immigration services o Services for seniors o Promotion of faith groups and services