Embed Size (px)
Citation preview

PUBLIC DISCLOSURE
January 04, 2016
COMMUNITY REINVESTMENT ACT PERFORMANCE EVALUATION
First National Bank of Omaha
Charter Number 209
1620 Dodge Street Omaha, NE 68197
Office of the Comptroller of the Currency
Midsize Bank Supervision 1 South Wacker Drive, Suite 2000
Chicago, IL 60606 NOTE: This document is an evaluation of this institution's record of meeting the credit needs
of its entire community, including low- and moderate-income neighborhoods, consistent with safe and sound operation of the institution. This evaluation is not, and should not be construed as, an assessment of the financial condition of this institution. The rating assigned to this institution does not represent an analysis, conclusion, or opinion of the federal financial supervisory agency concerning the safety and soundness of this financial institution.

Charter Number: 209
i
Table of Contents GENERAL INFORMATION AND OVERALL CRA RATING ..................................................... 2
DEFINITIONS AND COMMON ABBREVIATIONS ................................................................... 4
DESCRIPTION OF INSTITUTION ............................................................................................. 8
SCOPE OF THE EVALUATION .............................................................................................. 10
DISCRIMINATORY OR OTHER ILLEGAL CREDIT PRACTICES ......................................... 16
MULTISTATE METROPOLITAN AREA RATING .................................................................. 18 OMAHA-COUNCIL BLUFFS (NE-IA) MULTISTATE METROPOLITAN AREA .................................................................... 18
STATE RATING ...................................................................................................................... 28 STATE OF COLORADO ............................................................................................................................................ 28 STATE OF ILLINOIS ................................................................................................................................................. 39 STATE OF IOWA ..................................................................................................................................................... 55 STATE OF KANSAS ................................................................................................................................................. 61 STATE OF NEBRASKA ............................................................................................................................................. 69 STATE OF TEXAS ................................................................................................................................................... 85
APPENDIX A: SCOPE OF EXAMINATION ........................................................................... A-1
APPENDIX B: SUMMARY OF MULTISTATE METROPOLITAN AREA AND STATE RATINGS ............................................................................................................................... B-1
APPENDIX C: MARKET PROFILES FOR FULL-SCOPE AREAS ....................................... C-1
APPENDIX D: TABLES OF PERFORMANCE DATA .......................................................... D-1
Charter Number: 209
2
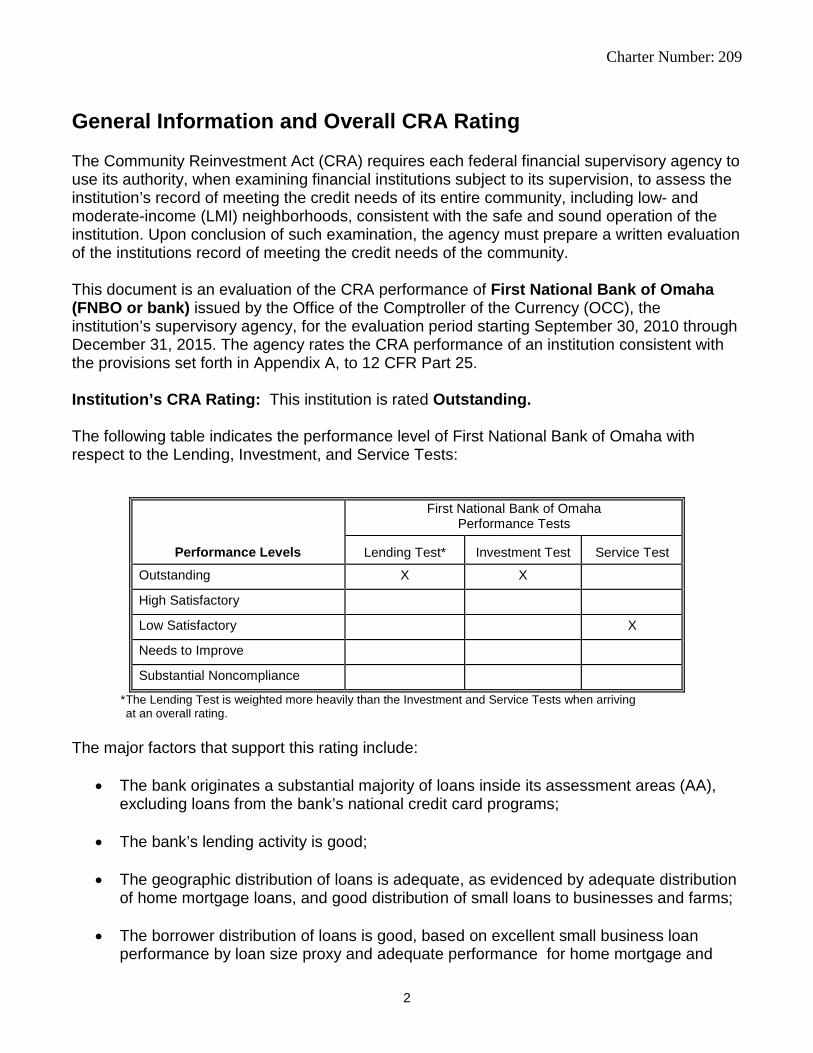
General Information and Overall CRA Rating The Community Reinvestment Act (CRA) requires each federal financial supervisory agency to use its authority, when examining financial institutions subject to its supervision, to assess the institution’s record of meeting the credit needs of its entire community, including low- and moderate-income (LMI) neighborhoods, consistent with the safe and sound operation of the institution. Upon conclusion of such examination, the agency must prepare a written evaluation of the institutions record of meeting the credit needs of the community. This document is an evaluation of the CRA performance of First National Bank of Omaha (FNBO or bank) issued by the Office of the Comptroller of the Currency (OCC), the institution’s supervisory agency, for the evaluation period starting September 30, 2010 through December 31, 2015. The agency rates the CRA performance of an institution consistent with the provisions set forth in Appendix A, to 12 CFR Part 25. Institution’s CRA Rating: This institution is rated Outstanding. The following table indicates the performance level of First National Bank of Omaha with respect to the Lending, Investment, and Service Tests:
Performance Levels
First National Bank of Omaha Performance Tests
Lending Test* Investment Test Service Test
Outstanding X X
High Satisfactory
Low Satisfactory X
Needs to Improve
Substantial Noncompliance
* The Lending Test is weighted more heavily than the Investment and Service Tests when arriving at an overall rating.
The major factors that support this rating include:
• The bank originates a substantial majority of loans inside its assessment areas (AA), excluding loans from the bank’s national credit card programs;
• The bank’s lending activity is good;
• The geographic distribution of loans is adequate, as evidenced by adequate distribution
of home mortgage loans, and good distribution of small loans to businesses and farms; • The borrower distribution of loans is good, based on excellent small business loan
performance by loan size proxy and adequate performance for home mortgage and

Charter Number: 209
3
small loans to farms;
• Flexible and innovative lending had a positive impact on the Lending Test, further enhancing the geographic distribution and borrower distribution of loans performance. The bank originated a significant volume by number and dollar of loans in aggregate and across the bank’s AAs through these programs;
• Community development (CD) lending had a significantly positive impact on the Lending
Test, further enhancing the geographic and borrower distribution of loans performance. Performance had an especially significant positive impact in the following rating areas: Omaha Council Bluffs IA NE MMSA, Colorado, Illinois and Nebraska. These areas represent a majority of bank operations and of bank deposits. CD lending supported or promoted affordable housing, community services targeted to LMI individuals, economic development, and activities that revitalize and stabilize LMI geographies. CD loans the bank originated in the region and nationwide both with and without a purpose, mandate or function to serve one or more of the bank’s AAs were considered in assessing the banks performance;
• The bank has an excellent level of qualified CD investments that are responsive to community needs. A significant majority of the mortgage loan pools were comprised of home loans to LMI borrowers originated during the evaluation period;
• Branches are reasonably accessible to individuals and geographies of different income levels. Hours of operation are generally good with no significant differences between branches located in different income levels. The bank offers an adequate level of services and alternate delivery systems. The bank’s record of opening or closing offices has not adversely affected access to banking services. In the Omaha-Council Bluffs NE-IA MMSA, service delivery systems are readily accessible to essentially all portions of the AA, equivalent with the size and scope of operations of the bank; and reasonably accessible in Colorado, Illinois, Kansas, Nebraska and Texas; and
• FNBO provides an adequate level of CD services.
• The OCC also considered discriminatory or other illegal credit practices, detailed later in this report, in rating the bank’s performance. The CRA performance rating was not lowered as a result of these findings. We considered the nature, extent, and strength of the evidence of the practices; the extent to which the institution has policies and procedures in place to prevent the practices; the extent to which the institution has taken or has committed to take corrective action, including voluntary corrective action resulting from self-assessment; and other relevant information.

Charter Number: 209
4
Definitions and Common Abbreviations The following terms and abbreviations are used throughout this Performance Evaluation, including the CRA tables. The definitions are intended to provide the reader with a general understanding of the terms, not a strict legal definition. Affiliate: Any company that controls, is controlled by, or is under common control with another company. A company is under common control with another company if the same company directly or indirectly controls both companies. A bank subsidiary is controlled by the bank and is, therefore, an affiliate. Aggregate Lending: The number of loans originated and purchased by all reporting lenders in specified income categories as a percentage of the aggregate number of loans originated and purchased by all reporting lenders in the MSA/assessment area. Census Tract (CT) – 2000 Census: A small subdivision of metropolitan and other densely populated counties. Census tract boundaries do not cross county lines; however, they may cross the boundaries of metropolitan areas. Census tracts usually have between 2,500 and 8,000 persons, and their physical size varies widely depending upon population density. Census tracts are designed to be homogeneous with respect to population characteristics, economic status, and living conditions to allow for statistical comparisons. Census Tract (CT) – 2010 Census: Small, relatively permanent statistical subdivisions of a county delineated by local participants as part of the U.S. Census Bureau’s participant Statistical Areas Program. The primary purpose of CTs is to provide a state set of geographic units for the presentation of decennial census data. CTs generally have between 1,500 and 8,000 people, with an optimum size of 4,000 people. Community Development (CD): Affordable housing (including multifamily rental housing) for low- or moderate-income individuals; community services targeted to low- or moderate-income individuals; activities that promote economic development by financing businesses or farms that meet Small Business Administration Development Company or Small Business Investment Company programs size eligibility standards or have gross annual revenues of $1 million or less; activities that revitalize or stabilize low- or moderate-income geographies, distressed or underserved nonmetropolitan middle-income geographies, or designated disaster areas; or loans, investments, and services that support, enable or facilitate projects or activities under HUD Neighborhood Stabilization Program criteria that benefit low-, moderate-, and middle-income individuals and geographies in the bank’s assessment area(s) or outside the assessment area(s) provided the bank has adequately addressed the community development needs of its assessment area(s). Community Reinvestment Act (CRA): the statute that requires the OCC to evaluate a bank’s record of meeting the credit needs of its local community, consistent with the safe and sound operation of the bank, and to take this record into account when evaluating certain corporate applications filed by the bank.

Charter Number: 209
5
Consumer Loan(s): A loan(s) to one or more individuals for household, family, or other personal expenditures. A consumer loan does not include a home mortgage, small business, or small farm loan. This definition includes the following categories: motor vehicle loans, credit card loans, home equity loans, other secured consumer loans, and other unsecured consumer loans. Family: Includes a householder and one or more other persons living in the same household who are related to the householder by birth, marriage, or adoption. The number of family households always equals the number of families; however, a family household may also include non-relatives living with the family. Families are classified by type as either a married-couple family or other family, which is further classified into ‘male householder’ (a family with a male householder’ and no wife present) or ‘female householder’ (a family with a female householder and no husband present). Full Review: Performance under the Lending, Investment, and Service Tests is analyzed considering performance context, quantitative factors (e.g., geographic distribution, borrower distribution, and total number and dollar amount of investments), and qualitative factors (e.g., innovativeness, complexity, and responsiveness). Geography: A census tract delineated by the United States Bureau of the Census in the most recent decennial census. Home Mortgage Disclosure Act (HMDA): The statute that requires certain mortgage lenders that conduct business or have banking offices in a metropolitan statistical area to file annual summary reports of their mortgage lending activity. The reports include such data as the race, gender, and the income of applicants, the amount of loan requested, the disposition of the application (e.g., approved, denied, and withdrawn), loan pricing, the lien status of the collateral, any requests for preapproval, and loans for manufactured housing. Home Mortgage Loans: Such loans include home purchase, home improvement and refinancing, as defined in the HMDA regulation. These include loans for multifamily (five or more families) dwellings, manufactured housing and one-to-four family dwellings other than manufactured housing. Household: Includes all persons occupying a housing unit. Persons not living in households are classified as living in group quarters. In 100 percent tabulations, the count of households always equals the count of occupied housing units. Limited Review: Performance under the Lending, Investment, and Service Tests is analyzed using only quantitative factors (e.g., geographic distribution, borrower distribution, total number and dollar amount of investments, and branch distribution). Low-Income: Individual income that is less than 50 percent of the area median income, or a median family income that is less than 50 percent, in the case of a geography. Market Share: The number of loans originated and purchased by the institution as a percentage of the aggregate number of loans originated and purchased by all reporting lenders in the MA/assessment area.

Charter Number: 209
6
Median Family Income (MFI) – 2000 Census: The median income determined by the U.S. Census Bureau every ten years and used to determine the income level category of geographies. Also, the median income determined by the Department of Housing and Urban Development annually that is used to determine the income level category of individuals. For any given area, the median is the point at which half of the families have income above it and half below it. Median Family Income (MFI) – 2010 Census: The median income derived from the United States Census Bureau’s American Community Survey data every 5 years and used to determine the income level category of geographies. Also, it is the median income determined by the Federal Financial Institutions Examination Council (FFIEC) annually that is used to determine the income level of individuals within a geography. For any given geography, the median is the point at which half of the families have income above it and half below it. Metropolitan Area (MA): Any metropolitan statistical area or metropolitan division, as defined by the Office of Management and Budget, and any other area designated as such by the appropriate federal financial supervisory agency. Metropolitan Division (MD): As defined by Office of Management and Budget, a county or group of counties within a Metropolitan Statistical Area that contains a population of at least 2.5 million. A Metropolitan Division consists of one or more counties that represent an employment center or centers, plus adjacent counties associated with the main county or counties through commuting ties. Metropolitan Statistical Area (MSA): An area, defined by the Office of Management and Budget, as having at least one urbanized area that has a population of at least 50,000. The Metropolitan Statistical Area comprises the central county or counties, plus adjacent outlying counties having a high degree of social and economic integration with the central county as measured through commuting. Middle-Income: Individual income that is at least 80 percent and less than 120 percent of the area median income, or a median family income that is at least 80 percent and less than 120 percent, in the case of a geography Moderate-Income: Individual income that is at least 50 percent and less than 80 percent of the area median income, or a median family income that is at least 50 percent and less than 80 percent, in the case of a geography. Multifamily: Refers to a residential structure that contains five or more units. Other Products: Includes any unreported optional category of loans for which the institution collects and maintains data for consideration during a CRA examination. Examples of such activity include consumer loans and other loan data an institution may provide concerning its lending performance. Owner-Occupied Units: Includes units occupied by the owner or co-owner, even if the unit has not been fully paid for or is mortgaged.

Charter Number: 209
7
Qualified Investment: A qualified investment is defined as any lawful investment, deposit, membership share, or grant that has as its primary purpose community development. Rated Area: A rated area is a state or multi-state metropolitan area. For an institution with domestic branches in only one state, the institution’s CRA rating would be the state rating. If an institution maintains domestic branches in more than one state, the institution will receive a rating for each state in which those branches are located. If an institution maintains domestic branches in two or more states within a multi-state metropolitan area, the institution will receive a rating for the multi-state metropolitan area. Small Loan(s) to Business(es): A loan included in 'loans to small businesses' as defined in the Consolidated Report of Condition and Income (Call Report) and the Thrift Financial Reporting (TFR) instructions. These loans have original amounts of $1 million or less and typically are either secured by nonfarm or nonresidential real estate or are classified as commercial and industrial loans. Small Loan(s) to Farm(s): A loan included in ‘loans to small farms’ as defined in the instructions for preparation of the Consolidated Report of Condition and Income (Call Report). These loans have original amounts of $500,000 or less and are secured by farmland, or are classified as loans to finance agricultural production and other loans to farmers. Tier One Capital: The total of common shareholders’ equity, perpetual preferred shareholders’ equity with non-cumulative dividends, retained earnings and minority interests in the equity accounts of consolidated subsidiaries. Upper-Income: Individual income that is at least 120 percent of the area median income, or a median family income that is at least 120 percent, in the case of a geography.

Charter Number: 209
8
Description of Institution FNBO is a midsize, interstate bank headquartered in Omaha, Nebraska. FNBO is 99.7 percent owned by First National of Nebraska, Inc. (FNNI), an $18 billion holding company headquartered in Omaha, Nebraska. The assessment areas and scope for this examination were adjusted to reflect the bank’s merger activity during the evaluation period. FNBO merged eight affiliate national banks and one affiliate state chartered bank located primarily in Nebraska and adjacent states. The following summarizes the merger activity:
September 30, 2010: • First National Bank headquartered in Fort Collins, Colorado • First National Bank of Kansas headquartered in Overland Park, Kansas • Castle Bank, National Association headquartered in DeKalb, Illinois
March 31, 2014: • Platte Valley State Bank headquartered in Kearney, Nebraska • First National Bank and Trust Company of Columbus headquartered in Columbus,
Nebraska • The Fremont National Bank and Trust Company headquartered in Fremont, Nebraska • First National Bank headquartered in North Platte, Nebraska July 28, 2014: • The First National Bank, South Dakota headquartered in Yankton, South Dakota was
merged into FNBO. The state of South Dakota was not included in this performance evaluation due to the timing of the merger.
For this performance evaluation, FNBO has seven rating areas comprised of: Omaha-Council Bluffs NE-IA Multistate Metropolitan Statistical Area (MMSA) and the states of Colorado, Illinois, Iowa, Kansas, Nebraska and Texas. Refer to the MMSA or State rating sections of this evaluation for details on the bank’s performance by area. FNBO primarily engages in generating deposits and originating loans. According to the June 30, 2014 FDIC Deposit Market Share Report, FNBO had total deposits of $13.9 billon. FNBO is the fourth largest commercial bank operating in the state of Nebraska and the Omaha-Council Bluffs NE-IA MMSA, while ranking first for deposit market share for both areas. As of September 30, 2015, FNBO had $17.6 billion in total assets and tier one capital of $1.7 billion. The bank’s loan-to-deposit ratio was 87.2 percent and total loans represented 73.1 percent of total assets. Commercial and industrial loans made up 32.6 percent of the total loan portfolio. Approximately 44.1 percent of the bank’s loan portfolio was comprised of consumer loans, 11.6 percent agricultural (including agricultural real estate), 8.3 percent residential real estate and 3.4 percent other loans. The loan-to-deposit ratio and loan portfolio mix do not reflect the significant volume of home purchase and refinance mortgage loans originated and sold on the secondary market. There were 23,157 such loans totaling over $3.6 billion during the evaluation period. FNBO is a full-service bank with 102 full-service banking offices and 98 deposit-taking Automated Teller Machines (ATMs) across its footprint. The bank’s geographic focus varies by line of business. The credit card line is national in scope. The retail, mortgage and wealth

Charter Number: 209
9
management services lines primarily focus on clients within the FNBO geographic footprint. FNBO offers a full range of credit products within its assessment areas (AAs) including consumer, commercial, agricultural and real estate loan products. FNBO offers a full range of deposit products to businesses and individuals, including alternative retail services, such as direct deposit and access to electronic banking services (bill payment, mobile banking, telephone banking and electronic statements). Credit card lending is a primary business activity and includes a nationwide customer base. According to the February 2015 Nilson Report, FNBO was the 12th largest credit card issuer in the nation by outstanding balances. Credit card loans comprised 38.7 percent of total loans as of September 30, 2015. FNBO has a community development corporation, First National of Nebraska Community Development Corporation, which was created in November 1998. This community development corporation seeks to support business development, job creation, and other economic endeavors including initiatives focusing on affordable housing. FNBO also had several CD equity investments. First Capital Partners, LLC is an operating subsidiary of FNBO. First Capital Partners, LLC is a licensed Small Business Administration (SBA) Small Business Investment Company (SBIC), which is a direct investor of mezzanine capital and private equity. These subsidiaries were considered when evaluating CD loans, investments, and services. The review included an assessment of the community development corporations and LLC’s ability to lend or invest in FNBO’s assessment areas. Since the previous CRA evaluation in 2011, economic conditions in the bank’s markets have improved and borrowing levels are increasing. The level of recovery from the 2007 recession varies by each State Rating area and within each AA. Appendix D contains tables with data used to evaluate the bank’s performance. There are no known legal, financial, or other factors impeding the bank’s ability to help meet the credit needs of its AAs. The prior FNBO CRA performance was last evaluated on January 3, 2011, at which time the bank received a rating of Satisfactory.

Charter Number: 209
10
Scope of the Evaluation Evaluation Period/Products Evaluated For this evaluation, we analyzed home purchase, home improvement, and home refinance mortgage loans the bank reported under the Home Mortgage Disclosure Act (HMDA) and small loans made to businesses and farms the bank reported under the Community Reinvestment Act (CRA). Due to the merger and branch closure activity, the evaluation period dates varied by AAs as follows:
• September 30, 2010 through December 31, 2014: Omaha-Council Bluffs NE-IA MMSA, Fort Collins-Loveland MSA, Boulder MSA, Denver-Aurora-Lakewood MSA, Greeley MSA, Chicago-Naperville-Arlington Heights MD, Rockford MSA, Kansas City KS MSA, Lincoln MSA, Gage & Butler Counties and Dallas-Plano-Irving MD
• September 30, 2010 through July 26, 2013: Des Moines-West Des Moines MSA • January 01, 2014 through December 31, 2014: Elgin MD • April 01, 2014 through December 31, 2014: NE Non-MSA and Grand Island MSA
Merger and branch closure activity also affected the evaluation period start and end dates for CD loans, the investment test, and the service test as follows:
• September 30, 2010 through December 31, 2015: Omaha-Council Bluffs NE-IA MMSA, Fort Collins-Loveland MSA, Boulder MSA, Denver-Aurora-Lakewood MSA, Greeley MSA, Chicago-Naperville-Arlington Heights MD, Rockford MSA, Kansas City KS MSA, Lincoln MSA, Gage & Butler Counties and Dallas-Plano-Irving MD
• September 30, 2010 through July 26, 2013: Des Moines-West Des Moines MSA • January 01, 2014 through December 31, 2015: Elgin MD • April 01, 2014 through December 31, 2015: NE Non-MSA and Grand Island MSA
Due to changes between the 2000 Census and 2010 Census, we performed separate analyses of 2010 through 2011 data and 2012 through 2014 data to evaluate the Lending Test geographic distribution and borrower income criteria. For some AAs, we performed a separate analysis on 2014 data, due to changes instituted by the 2014 Office of Management and Budget (OMB) MA geographic boundary revisions. Refer to the “Description” section under each Rating Area section for details on those areas impacted by the 2014 OMB changes. Performance Tables 1 through 12 in appendix D include only data covered by the analysis period receiving the greatest weight, primarily 2012 through 2014 for those areas not impacted by the OMB changes, and 2012 through 2013 for all other AAs. Data from 2010 through 2011 and 2014 (for all other AAs impacted by the 2014 OMB changes) is discussed in the applicable narrative sections of the evaluation even when data is not displayed in appendix D. In order to perform a quantitative analysis in an AA, a minimum of 20 loans was needed in each loan product and analysis period. Refer to the applicable Lending Test narratives under each Rating area section for details on loan products that did not have a sufficient volume to perform a quantitative analysis. Additionally, the bank only originated or purchased a sufficient volume of multi-family loans to perform a detailed analysis of geographic and borrower distributions in the Omaha-Council Bluffs NE-IA MMSA and the Chicago MD AAs. Although FNBO did not originate a sufficient volume of multifamily loans in all AAs to perform an

Charter Number: 209
11
analysis, we considered multifamily loans meeting the CD definition as part of the evaluation of CD lending. Data Integrity As part of our ongoing supervision of the bank, we tested the accuracy of the bank’s HMDA and CRA lending data. We also reviewed the appropriateness of CD activities provided for consideration in our evaluation. This included testing of CD loans to determine if they qualify as CD as defined in the CRA regulation. Selection of Areas for Full-Scope Review We completed a full-scope review for at least one AA in each state where the bank has an office. We also completed a full-scope review of performance within the MMSA where the bank is headquartered and operates branches within both states of the MMSA. Full-scope reviews consider quantitative and qualitative factors, as well as performance context factors. We selected AAs that represented a significant portion of the bank’s deposit base and lending business in that state and/or multistate area for full-scope reviews. Other AAs in each state were analyzed using limited-scope evaluation procedures. Limited-scope procedures consider quantitative factors only. Refer to the “Scope” section under each State and MMSA section for details regarding how we selected the areas for review. Ratings The bank’s overall rating is a blend of the MMSA rating and State ratings. The Omaha-Council Bluffs NE-IA MMSA received the greatest emphasis in our evaluation of the overall rating. This AA accounts for 26.5 percent of the branch network, 53.4 percent of total deposits, and 48.8 percent of the reportable loans during the evaluation period. The States of Colorado and Nebraska received the next greatest emphasis in overall ratings. The Colorado MSAs account for 25.5 percent of the branches, 16.9 percent of deposits, and 17.6 percent of total loans. The State of Nebraska has 22.5 percent of branches, 13.6 percent of deposits, and 14.5 percent of total loans. Illinois has the next greatest weight, followed by Kansas. The Texas and Iowa rated areas have the least significance in the overall rating conclusions based on low lending, deposits, and branches. FNBO exited Iowa during this review period. Areas receiving full-scope reviews receive the primary emphasis when establishing the ratings in the state and MMSA rating areas. Refer to the “Scope” section under each State and MMSA rating section for details regarding how we arrived at the respective ratings. Inside/Outside Ratio FNBO originated a substantial majority, 83.7 percent, of loans inside the AAs from September 30, 2010 through December 31, 2014 after excluding the nationwide credit card lending products. HMDA reportable loans originated within the AAs were reported at 85.6 percent. FNBO originated 14.4 percent of CRA reportable small business and farm loans by number within its AAs. This is due to a large volume of commercial credit card loans originated within the nationwide credit card lending program. When the credit card lending is excluded, the percentage of CRA reportable small business and farm loans originated within the AAs increases significantly to 79.7 percent. The Inside/Outside ratio is a bank-wide calculation and
Charter Number: 209
12
not calculated for individual rating areas or AAs. The analysis is limited to bank loan originations and purchases and does not include affiliate data. Other Factors Considered in our Analysis under Each Performance Test Lending Test This evaluation analyzed performance from 2010 through 2011 and 2012 through 2014. We placed more emphasis on performance in the more current timeframe from 2012 through 2014, and 2014 for the AAs impacted by the 2014 OMB changes to reach our performance conclusions. The more recent timeframes are more reflective of the bank’s business strategy, and economic conditions. When evaluating the bank’s performance under the Lending Test, we weighted the distribution of home mortgage loans and small loans to businesses by the level of lending activity in each Rating Area. Home purchase loans received the greatest weight, followed by home refinance loans in our conclusions regarding the bank’s home mortgage loan origination performance. For the analysis of the distribution of loans to geographies with different income levels, more emphasis was placed on the bank’s performance in moderate-income census tracts (CTs) if there was a very limited number of owner-occupied housing units or businesses in the low-income census tracts. The borrower distribution analysis considered the impact of poverty in AAs with relatively high poverty levels as a factor that may limit home mortgage lending opportunities to a portion of the population. For most of FNBO’s AAs, household poverty rates are below national averages and not considered significant barrier to FNBO’s home mortgage lending opportunities. In a few markets, housing stock is old and higher home ownership costs associated with older homes is considered as a potential hurdle to home ownership, especially for low-income individuals and families. For some AAs, the median housing value is high compared with incomes for low-income families and considered a limiting factor for making home mortgage loans to low-income borrowers in those AAs. Throughout the report, CD lending is described in relation to allocated Tier 1 capital. The allocation is based on the percentage of deposits in each AA or rated area. National Commercial Credit Card Lending In evaluating the bank’s performance, we considered the competitive market in which the bank operates regarding small business lending and the impact of the national credit card products offered by FNBO. Annual business revenues were reported on only a small percentage of the commercial credit card loans during the evaluation period. This is because FNBO relied on other analytical tools in the credit evaluation process of small business and small farm credit card loans during the evaluation period. During the evaluation period, approximately 109,523 of the reportable CRA loans (small business and small farm loans) or 89.1 percent were subject to an automated decisioning model where gross annual revenues were not considered. Due to the significant level of loans reported without revenue information, our conclusions for small business and farm lending are based primarily on available data as displayed in appendix D for loans by original amount regardless of business size. Conclusions were based

Charter Number: 209
13
on loan size as a proxy for the distribution analysis for lending to small businesses and lending to small farms. Innovative and Flexible Loan Programs FNBO offers a standard mix of loan products including home mortgage, consumer loans, and products targeting small businesses and farms (i.e. loans, lines of credit, and credit cards) throughout all of its AAs. FNBO also offers flexible home loan programs targeted to LMI borrowers that provided a positive impact under the lending test performance, including FHA, VA, USDA loans, and is a partner with government and state agencies originating loans through other individual homebuyer programs. Specifically, FNBO originates loans sponsored by the Colorado Housing Finance Authority, Illinois Housing Development Authority, Iowa Finance Authority, Nebraska Investment Finance Authority, and Southeast Texas Housing Finance Corporation. The bank also makes available loans through the Federal Home Loan Bank’s Homeownership Set-Aside Program. FNBO originated 5,406 loans totaling $758 million under these programs. Loans originated under these programs are included in the bank’s home mortgage and loans to small businesses and farm data and analyzed under other portions of the Lending Test. Other flexible loan products that provided a positive impact targeting LMI borrowers include:
• Secured Visa Credit Card Loan Program: FNBO offers a secured Visa credit card loan program targeted to LMI customers. The goal of the program is to help LMI customers build a positive credit history. The bank originated 4,280 loans within the full-scope AAs during the evaluation period. Approximately 69 percent of the borrowers are classified low- or moderate-income and 31.9 percent are located in LMI geographies.
• Micro-Lending Consumer Program: FNBO created a small dollar loan program with flexible documentation requirements that is available to applicants in the Omaha AA. During the evaluation period, FNBO originated 77 loans totaling $70,000. The program limits borrower exposure to $250,000 in total loan/line amounts, with a minimum loan amount of $500 for loans and $200 for lines of credit. Loan products include automobile loans, unsecured loans, CD/savings secured loans, and unsecured lines of credit. The maximum loan amount and loan-to-value is tiered based upon the applicant’s credit history and the product selected. Under the program, alternative credit references are acceptable.
Community Development Loans – Broader Regional and Nationwide In addition to qualified loans made within the bank’s AAs and statewide areas, FNBO originated broader regional and nationwide loans during the evaluation period. These loans fell into one of two categories based on the potential to benefit one or more of the bank’s AAs. These are displayed separately in Appendix D tables for CD activities throughout the report:
(1) originated to organizations or used for activities with a purpose, mandate or function (P/M/F) to serve one or more of the bank’s AAs; or
(2) originated to organizations or used for activities without P/M/F to serve one or more of the bank’s AAs.
Charter Number: 209
14
FNBO originated four regional loans totaling $22 million to an entity with the P/M/F to serve one or more of the bank’s AAs. These CD loans were to the First National Nebraska Community Development Corporation (FNNCDC), a FNBO wholly owned subsidiary. FNNCDC engages in various financial activities to support qualified CD activities including affordable housing, economic development and neighborhood revitalization. Two affordable housing CD loans totaling $7.9 million did not have P/M/F to serve the bank’s AAs. FNBO also originated one nationwide $6 million loan for economic development to an entity with no P/M/F to serve one or more of the bank’s AAs. This loan was to First Capital Partners, LLC, which is an affiliate of FNBO. First Capital Partners, LLC is a licensed Small Business Administration (SBA) Small Business Investment Company (SBIC), which is a direct investor of mezzanine capital and private equity. Investment Test Throughout the report, investment performance is described as a portion of Tier 1 capital to help provide the reader context on investment levels. For this report, the allocation is based on the percentage of deposits in each AA or rated area. Nationwide Investment In addition to qualified investments made within the AAs and broader statewide areas, FNBO originated a nationwide investment that included the AAs. This investment fell into one of two categories:
(1) originated to organizations or used for activities with a P/M/F to serve one or more of the bank’s AAs; or
(2) originated to organizations or used for activities without P/M/F to serve one or more of the bank’s AAs.
During the evaluation period, FNBO originated a nationwide investment totaling $14.3 million to a Small Business Investment Company (SBIC) with P/M/F to serve one or more of the AAs. This investment also had $10.2 million in unfunded commitments. Service Test In addition to qualified CD services made within the bank’s AAs and broader statewide areas that include the bank’s AAs, FNBO partnered with organizations that provide CD services in the broader regional area that includes the bank’s AAs. These CD services were considered in the analysis of the overall bank’s service test performance. These include the following:
• A partnership with the Nebraska Housing Developers Association (NHDA) that received grants from the Federal Home Loan Bank Affordable Housing Program to provide subsidies to 260 homebuyers in the states of Colorado, Kansas, Illinois, Iowa and Nebraska. In addition, FNBO secured funding for NHDA that provided financing for 372 homebuyers.
• One employee provided expertise on the Operations and Investment Committee for the Midwest Housing Equity Group providing over 154 hours of service during the evaluation period. The group fosters the Low Income Housing Tax Credit in the states of Iowa, Kansas, and Nebraska. The objective is to raise equity capital to invest in affordable rental housing.

Charter Number: 209
15
Alternative Delivery Systems – Mobile and Online Banking FNBO offers mobile and online banking services as an alternative delivery system. In 2014, the bank started to track the dispersion of users that activated access to these delivery systems in low- and moderate-income geographies compared to the percentage of LMI households in these designated census tracts. FNBO assesses performance by comparing the actual number of LMI users activating their access to mobile and online banking services, to the management's anticipated number of users. The bank determines the anticipated number of households based upon deposit market share within an AA, the number of LMI households in an AA, and the Federal Reserve Board's 2015 survey of consumer mobile and online adoption rates. We considered the bank's analysis of the use of mobile and online banking services in LMI geographies and within households in each AA; however, we did not attribute significant emphasis to the use of these proxies in reaching our accessibility of delivery systems conclusions. We did not include resulting data from the bank analysis in this report.

Charter Number: 209
16
Discriminatory or Other Illegal Credit Practices Pursuant to 12 C.F.R. § 25.28(c) or 12 C.F.R. § 195.28(c), respectively, in determining a national bank’s or Federal savings association’s (collectively, bank) CRA rating, the OCC considers evidence of discriminatory or other illegal credit practices in any geography by the bank, or in any assessment area by an affiliate whose loans have been considered as part of the bank’s lending performance. As part of this evaluation process, the OCC consults with other federal agencies with responsibility for compliance with relevant laws and regulations, including the U.S. Department of Justice, the U.S. Department of Housing and Urban Development, and the Consumer Financial Protection Bureau (CFPB), as applicable. The OCC identified the following public information regarding non-compliance with the statutes and regulations prohibiting discriminatory or other illegal credit practices with respect to this institution:
• The OCC identified unfair practices involving billing for identity theft protection products that the bank and its vendor marketed and sold to credit card customers of FNBO. The bank discontinued marketing these products in 2012, and cooperatively implemented an action plan to strengthen third-party controls and to reimburse harmed consumers for all fees paid for the services not received between December 1997 and July 2013 (including the third-party portion). FNBO agreed to pay $22 million in reimbursement to approximately 214,000 affected customers and a $3 million civil money penalty (CMP). In a related matter, the CFPB also cited the bank for unfair and deceptive practices under sections 1031 and 1036 of the Dodd-Frank Wall Street Reform and Consumer Protection Act. The CFPB required FNBO to pay a $4.5 million CMP and to reimburse $27.7 million to approximately 257,000 harmed customers. Customers reimbursed under the action plan required by the OCC will not receive duplicative restitution under the CFPB order. For further information on the OCC settlement, see OCC Enforcement Action AA EC-2015-71, dated August 18, 2016. For further information about the CFPB action, see CFPB Consent Order 2016-CFPB-0014, filed August 25, 2016.
The OCC also found evidence of violations of the Servicemembers Civil Relief Act. The bank failed to provide full interest rate reductions on loans to eligible servicemembers. The bank refunded interest and fees, in excess of the statutory six-percent rate, totaling $211,884 on 923 affected accounts covering the period from September 1, 2007 through February 28, 2015. The bank also implemented satisfactory policies, procedures, and controls prospectively.
The OCC does not have additional public information regarding non-compliance with statutes and regulations prohibiting discriminatory or other illegal credit practices with respect to this institution. In determining this institution’s overall CRA rating, the OCC has considered information that was made available to the OCC on a confidential basis during its consultations. The CRA performance rating was not lowered as a result of these findings. We considered the nature, extent, and strength of the evidence of the practices; the extent to which the institution has policies and procedures in place to prevent the practices; the extent to which the institution

Charter Number: 209
17
has taken or has committed to take corrective action, including voluntary corrective action resulting from self-assessment; and other relevant information. The OCC will consider any evidence of discriminatory or other illegal credit practices relative to this institution that other regulators may provide to the OCC before the end of the institution’s next performance evaluation in that subsequent evaluation, even if the information provided concerns activities that occurred during the evaluation period addressed in this performance evaluation.

Charter Number: 209
18
Multistate Metropolitan Area Rating Omaha-Council Bluffs (NE-IA) Multistate Metropolitan Area CRA rating for MMSA1: Outstanding The lending test is rated: Outstanding The investment test is rated: High Satisfactory The service test is rated: Outstanding The major factors that support this rating include: • An excellent level of lending for home mortgage loans and small loans to businesses and
farms; • An adequate geographic distribution of loans as evidenced by adequate distribution of
home mortgage loans, and good distribution of small loans to businesses and farms;
• A good distribution of loans based on borrower income level. For home mortgage loans, performance is good, small loans to businesses is excellent, and farms performance is adequate;
• A significantly positive level of CD loans that were responsive to community needs;
• A good level of CD investments and donations addressing the need for economic development and affordable housing targeted to LMI families;
• A branch distribution that is readily accessible to LMI geographies and individuals; and
• An excellent level of CD services that were responsive to community needs. Description of Institution’s Operations in Omaha-Council Bluffs (NE-IA) MMSA The bank’s AA consists of a portion of the Omaha-Council Bluffs (NE-IA) MMSA and includes Douglas and Sarpy Counties in Nebraska, and Mills and Pottawattamie Counties in Iowa. FNBO offers a full range of banking services in the AA through its 27 branches and 34 deposit-taking ATMs. These branches account for 26.5 percent of the bank’s total branch network. FNBO closed three branches during the evaluation period; one was in a moderate-income geography. The bank also opened one branch in a moderate-income geography. Banking in the AA is competitive with 47 deposit-taking financial institutions. Based on June 30, 2014
1 This rating reflects performance within the multistate metropolitan area. The statewide evaluations do
not reflect performance in the parts of those states contained within the multistate metropolitan area.

Charter Number: 209
19
FDIC Deposit Market Share data, FNBO ranks first, with a deposit market share of 29.7 percent. Followed by Mutual of Omaha Bank, Wells Fargo Bank, U. S. Bank, and American National Bank. These five depository institutions account for 72.6 percent of total deposits in the AA. FNBO’s $7.9 billion in deposits in this AA account for 56.7 percent of the bank’s total deposits. Refer to the market profile for the Omaha-Council Bluffs (NE-IA) MMSA in appendix C for detailed demographics and other performance context information for assessment areas that received full-scope reviews. Scope of Evaluation in Omaha-Council Bluffs (NE-IA) MMSA FNBO has one AA in the Omaha-Council Bluffs (NE-IA) MMSA. As a result, we performed a full-scope review of the AA. As part of this performance evaluation, we reviewed two AA economic development organization community contacts conducted within the AA. The contacts cited a need for financial education, business planning assistance, and access to affordable capital for small business owners and entrepreneurs. Additionally, we completed an affordable housing community contact. The contact stated additional affordable rental units for low- and moderate-income families are a need, especially in rural areas. Urban areas are relatively stable in terms of supply and demand for affordable housing to LMI, both rental and homeownership. Refer to the tables in appendix A for more information on the Omaha-Council Bluffs (NE-IA) MMSA AA. LENDING TEST Conclusions for Areas Receiving Full-Scope Reviews The bank’s performance under the lending test in the Omaha-Council Bluffs (NE-IA) MMSA AA is rated “Outstanding.” Based on the full-scope review, the bank’s performance in the Omaha-Council Bluffs (NE-IA) MMSA AA is excellent. Lending Activity Lending activity in the Omaha-Council Bluffs (NE-IA) MMSA AA is excellent, relative to the strong competition for all types of loans in the bank’s AA. The bank’s excellent performance in originating home mortgage loans, and loans to small businesses, and good performance for loans to small farms supports this conclusion. Refer to Table 1 Lending Volume in the Omaha-Council Bluffs (NE-IA) MMSA AA section of appendix D for the facts and data used to evaluate the bank’s lending activity. FNBO had an AA deposit market share of 29.7 percent as of June 30, 2014, and ranked first among 47 depository institutions. Based on 2014 peer mortgage data, competition for home mortgage lending was very strong, with 324 lenders in the AA. FNBO ranked second with a 10.8 percent market share. Home purchase lending competition was strong with 264 lenders in

Charter Number: 209
20
the AA. FNBO ranked second with an 11 percent market share. The bank also ranked second among 98 lenders with a 20.4 percent home improvement lending market share. Home refinance lending is highly competitive with 241 total lenders in the AA. FNBO ranked third in home refinance lending with a 7.8 percent market share. FNBO ranked first among 38 lenders originating or purchasing a multifamily loans with an 8.9 percent market share. Small business lending activity is excellent given the bank’s market share and ranking when compared to its deposit market share and competition for loans to small businesses within the AA. Based on 2014 peer data, in addition to FNBO, the top eight lenders for small business lending activity include the nation’s largest credit card lenders who collectively have 66.6 percent of the market share. FNBO ranked third among 71 lenders, with a market share of 10.1 percent. Small farm lending activity is excellent. FNBO ranked fifth among 22 lenders, with a market share of 5.8 percent. Based on 2014 peer data, the top four lenders collectively have 74 percent of the market share. Individual market shares for these competitors ranged from 9.3 percent to 19.3 percent. Distribution of Loans by Income Level of the Geography FNBO’s geographic distribution of loans in the Omaha-Council Bluffs (NE-IA) MMSA AA is adequate. In performing our analysis, we placed emphasis on home mortgage lending performance and small business lending. These loans represented the majority of the bank’s CRA reportable lending activity. Within the home mortgage loans, more emphasis was given to home purchase and home refinance loans based on the volume of originations during the evaluation period. We placed more emphasis on the bank’s performance in 2012 through 2014 than its performance in 2010 through 2011. Home Mortgage Loans The geographic distribution of home mortgage loans reflects adequate penetration throughout the AA. Refer to Tables 2, 3, 4, and 5 in the Omaha-Council Bluffs (NE-IA) MMSA AA section of appendix D for the facts and data used to evaluate the geographic distribution of the bank’s home mortgage loan originations and purchases. The geographic distribution of home purchase loans is adequate. The geographic distribution of home purchase loans from 2012 through 2014 reflects adequate penetration throughout the assessment area. The percentage of loans in low-income geographies was somewhat lower than the percentage of owner-occupied units in these geographies. The percentage of loans in moderate-income geographies was lower than the percentage of owner-occupied units in these geographies. FNBO’s market share was good. The bank’s market share in both LMI geographies was near to the overall market share. Performance in 2010 through 2011 was consistent with performance noted from 2012 through 2014. The geographic distribution of home improvement loans is adequate. The geographic distribution of home improvement loans from 2012 through 2014 reflects good penetration

Charter Number: 209
21
throughout the assessment area. The percentage of loans in low-income geographies was near to the percentage of owner-occupied units in these geographies. The percentage of loans in moderate-income geographies was somewhat lower than the percentage of owner-occupied units in these geographies. FNBO’s market share was excellent. The bank’s market share in both LMI geographies exceeded the overall market share. The bank’s performance during 2010 through 2011 was weaker than 2012 through 2014 and considered poor. This was due to weaker performance in low-income geographies. The geographic distribution of home refinance loans is adequate. The geographic distribution of home refinance loans from 2012 through 2014 reflects adequate penetration throughout the assessment area. The percentage of loans in low-income geographies was lower than the percentage of owner-occupied units in these geographies. The percentage of loans in moderate-income geographies was somewhat lower than the percentage of owner-occupied units in these geographies. FNBO’s market share was good. The bank’s market share in low-income geographies exceeded and performance in moderate-income geographies was near to the overall market share. The bank’s performance from 2010 through 2011 is weaker than its performance from 2012 through 2014 and considered poor. The geographic distribution of multifamily loans is good. The geographic distribution of multifamily loans from 2012 through 2014 reflects good penetration throughout the assessment area. The percentage of loans in both low- and moderate-income census tracts exceeded the percentage of multifamily units in those geographies. The bank’s market share was adequate. FNBO’s market share during the period was lower than the overall market share in low-income geographies and exceeded its overall market share in moderate-income geographies. The bank did not originate or purchase a sufficient number of loans in 2010 through 2011 for quantitative analysis and this had a neutral impact on conclusions. Small Loans to Businesses Refer to Table 6 in the Omaha-Council Bluffs (NE-IA) MMSA AA section of appendix D for the facts and data used to evaluate the geographic distribution of the bank’s origination/purchase of small loans to businesses. The geographic distribution of small loans to businesses is good. The 2012 through 2014 small loans to businesses geographic distribution reflects good penetration throughout the assessment area. The volume of loans in low-income geographies was near to the percentage of businesses in those geographies. The volume of loans in moderate-income geographies substantially met the percentage of small businesses in these geographies. The bank’s market share in both LMI geographies exceeded the overall market share. The bank’s performance from 2010 through 2011 was stronger than performance noted in 2012 through 2014, and considered excellent in both LMI geographies. Small Loans to Farms Refer to Table 7 in the Omaha-Council Bluffs (NE-IA) MMSA AA section of appendix D for the facts and data used to evaluate the geographic distribution of the bank’s origination/purchase of small loans to farms.

Charter Number: 209
22
The geographic distribution of small loans to farms is good. The bank’s geographic distribution of small loans to farms in 2012 through 2014 reflects excellent penetration throughout the assessment area. The portion of loans in both low- and moderate-income geographies exceeded the percentage of farms in geographies. The bank’s market share was excellent. The bank’s market share in both LMI geographies exceeded the overall market share. The bank’s performance from 2010 through 2011 was weaker than performance noted in 2012 through 2014, and considered adequate. This was due to weaker performance in low-income geographies. Lending Gap Analysis We reviewed summary reports and maps and analyzed FNBO’s home mortgage, small business and small farm lending activity over the evaluation period to identify any gaps in the geographic distribution of loans. We did not identify any unexplained conspicuous gaps. Distribution of Loans by Income Level of the Borrower The overall distribution of lending by income level of the borrower is good. Performance is good for home mortgage loans, excellent for business loans, and adequate for farm loans. Within the home mortgage loans, we gave more emphasis to home purchase loans and home refinance loans based on the volume of originations during the evaluation period. FNBO does not collect revenue information on business credit cards. For small business and small farm loans, the 2012 through 2014 evaluation period loan data on Tables 11 and 12 in appendix D indicate 47.4 percent and 39.7 percent of the reported loans do not include revenue information. The 2010 through 2011 loan data reflects 46.8 percent and 29.2 percent of reported loans without revenue information. Due to the significant level of loans reported without revenue information, our conclusions are based primarily on available data as displayed in appendix D for loans by original amount regardless of business size. Conclusions were based also on loan size as a proxy for the distribution analysis for lending to small businesses and lending to small farms. In addition, we placed more emphasis on the bank’s performance in 2012 through 2014 than performance in 2010 through 2011. Home Mortgage Loans The home mortgage loan borrower distribution is good. The distribution of loans to borrowers of different incomes reflects good penetration among customers of different income levels. Refer to Tables 8, 9, and 10 in the Omaha-Council Bluffs (NE-IA) MMSA AA section of appendix D for the facts and data used to evaluate the borrower distribution of the bank’s home mortgage loan originations and purchases. The borrower distribution of home purchase loans is excellent. The bank’s distribution of home purchase loans from 2012 through 2014 reflects good penetration among retail customers of different income levels. The percentage of home purchase loans to low-income borrowers was lower than the percentage of such families. The portion of loans to moderate-income borrowers exceeded the percentage of moderate-income families. The bank’s market share during the period was excellent. The bank’s market share to both low- and moderate-income

Charter Number: 209
23
borrowers exceeded the overall market share. FNBO’s distribution of home purchase loans from 2010 through 2011 was stronger and considered excellent. The portion of loans to both low- and moderate-income borrowers exceeded the percentage of families during the period. The borrower distribution of home improvement loans is good. The bank’s distribution of home improvement loans from 2012 through 2014 reflects good penetration among retail customers of different income levels. The percentage of home improvement loans to low-income borrowers was lower than the percentage of such families. The portion of loans to moderate-income borrowers exceeded the percentage of such families. The bank’s market share during the period was excellent. The bank’s market share to both low- and moderate-income borrowers exceeded the overall market share. FNBO’s distribution of home improvement loans from 2010 through 2011 was consistent with the performance noted from 2012 through 2014. The borrower distribution of home refinance loans is good. The bank’s distribution of home refinance loans from 2012 through 2014 reflects adequate penetration among borrowers of different income levels. The percentage of home refinance loans to low-income borrowers was significantly lower than the percentage of such families. The portion of loans to moderate-income borrowers exceeded the percentage of such families. The bank’s market share during the period was good. The bank’s market share to low-income borrower was near to the overall market share and the market share to moderate-income borrowers exceeded the overall market share. FNBO’s distribution of home refinance loans from 2010 through 2011 was consistent with the performance noted from 2012 through 2014. Small Loans to Businesses Refer to Table 11 in the Omaha-Council Bluffs (NE-IA) MMSA AA section of appendix D for the facts and data used to evaluate the borrower distribution of the bank’s origination/purchase of small loans to businesses. The distribution of small loans to businesses is excellent. As previously noted, FNBO does not collect revenue information on credit card loans under $100,000 to businesses. FNBO relies on other analytical tools in the credit evaluation process of small business credit card loans. Therefore our analysis focused on loan size as a proxy using loans under $100,000 as small business lending. The percentage of loans with an original amount of $100,000 or less exceeded the percentage of small businesses. The bank’s market share of loans to small businesses was lower than the overall market share, although without accounting for the results of the proxy analysis. The bank’s performance in 2010 through 2011 was consistent with the performance noted from 2012 through 2014. Small Loans to Farms Refer to Table 12 in the Omaha-Council Bluffs (NE-IA) MMSA AA section of appendix D for the facts and data used to evaluate the borrower distribution of the bank’s origination/purchase of small loans to farms. The distribution of small loans to farms is adequate. Similar to our analysis of the distribution of small loans to businesses, FNBO does not collect revenue information on credit card loans less than $100,000 to farms. The percentage of loans to farms with an original amount of

Charter Number: 209
24
$100,000 or less was lower than the percentage of small farms. The bank’s market share of loans to small farms exceeded the overall market share. The bank’s performance in 2010 through 2011 was consistent with the performance noted from 2012 through 2014. Community Development Lending Refer to Table 1 Lending Volume in the Omaha-Council Bluffs (NE-IA) MMSA AA section of appendix D for the facts and data used to evaluate the bank’s level of CD lending. This table includes all CD loans, including multifamily loans that also qualify as CD loans. In addition, Table 5 includes geographic lending data on all multi-family loans, including those that also qualify as CD loans. Table 5 does not separately list CD loans. FNBO’s level of CD lending had a significantly positive impact on its overall lending performance in the Omaha-Council Bluffs (NE-IA) MMSA AA. The bank originated 89 loans totaling $490.9 million. This volume represented 54.4 percent of tier one capital allocated to the AA. These loans exhibited excellent responsiveness to identified needs in the area, specifically revitalization and stabilization of LMI geographies. By purpose, 84.6 percent of the CD loans originated in the AA supported projects slated to revitalize or stabilize areas throughout the AA. We identified 16 high impact loans, totaling $176.4 million, meeting this definition of CD. Here are a few examples of high impact CD loans:
• FNBO originated two loans totaling $43.9 million to fund the construction of a 350-room Marriott hotel located in a low-income census tract in the heart of downtown Omaha. The project helps revitalize the area and provides permanent jobs. This Tax Increment Financing (TIF) loan supports a project included in the Downtown Omaha 2030 city master plan. The city anticipates that the new hotel will create over 1,700 jobs related to construction and future operations of the hotel with the average employee earning approximately $32,000 per year, compared to the 2014 adjusted median family income of $73,000.
• The bank originated five loans totaling $43.6 million used to construct a 346-unit Class A multifamily development in a moderate-income geography in southwest Omaha to help revitalize the area. This is a TIF loan approved by the city and aligned with the city’s redevelopment plan. These funds are a part of a $52.5 million redevelopment of the 15+ acre former Millard Lumber site in downtown Millard, a suburb of Omaha. The redevelopment will include nine buildings and will feature 346 multifamily units, 43,000 square feet of office space, and 15,000 square feet of retail space. The project includes 23,000 square feet of commercial space set aside for use by the Omaha Police Department.
• FNBO originated three loans totaling $35.2 million to fund the construction of an office building and a portion of a parking structure in Aksarben Village, a mixed-use development project in the moderate-income, midtown area of Omaha. The project revitalizes and stabilizes the area and the borrower received TIF financing and the redevelopment project received approval by the city.
• During the evaluation period, the bank originated two renewals of loans, in the amount of $12.1 million, used to fund the operation of a 153-room Hilton Garden Inn hotel located in a moderate-income geography in the Mid America Center area in Council Bluffs, Iowa. The project provides permanent jobs. The project is part of the Council Bluffs Tomorrow: 2030 Comprehensive Plan, which seeks to encourage commercial

Charter Number: 209
25
and hospitality development at the Interstate 80 and 24th street interchange. The hotel provides long-term job opportunities to local residents and currently employs 66 people, classified as low-income, with an average salary of $19,319.
Product Innovation and Flexibility FNBO offers flexible lending products that had a positive impact on the lending test for the AA. FNBO made 2,022 secured Visa Credit Card Loan Program loans within the AA. Approximately 72.2 percent of the borrowers were classified low- or moderate-income and 43 percent were located in LMI geographies. For additional information, refer to the summary of innovative and flexible loan programs in the Other Factors – Lending Test section for a description of products offered bank-wide. INVESTMENT TEST The bank’s performance under the investment test in Omaha-Council Bluffs (NE-IA) MMSA AA is rated “High Satisfactory.” Based on full-scope reviews, the bank’s performance in the Omaha-Council Bluffs (NE-IA) MMSA AA is good. Conclusions for Areas Receiving Full-Scope Reviews Refer to Table 14 in the Omaha-Council Bluffs (NE-IA) MMSA AA section of appendix D for the facts and data used to evaluate the bank’s level of qualified investments. FNBO’s investment performance in the AA is good. FNBO made 118 investments totaling $53.8 million, including three investments from the prior period with a total book value of $13.2 million during the evaluation period. Total investments represent 6 percent of allocated tier one capital for the AA and the level of investment is good. FNBO exhibits good responsiveness to credit and CD needs, and occasionally uses innovative and/or complex investments to support CD initiatives. In terms of total dollar volume, 45.9 percent of the bank’s investments included government sponsored mortgage-backed securities totaling $24.7 million; of which the majority of the underlying mortgages were originations to low- or moderate-income borrowers. A significant majority of the underlying mortgages were originated during the evaluation period. In addition, FNBO’s portfolio of investments also includes three municipal bonds totaling $3 million. The municipality used the proceeds to build new buildings, construct additions, and make improvements on existing buildings in a school district where 73 percent of the students receive free or reduced lunch. FNBO also invested in six Low Income Housing Tax Credit syndications totaling $5.8 million and three equity equivalent investments to two Community Development Financial Institutions (CDFI) totaling $2 million. The balance of the FNBO’s investments in the AA included the bank’s investment in the community development corporation totaling $10 million, investments in financial intermediaries totaling $5.1 million, and 87 donations totaling $3.3 million to community development organizations that provide services to LMI individuals and families in the AA.
Charter Number: 209
26
SERVICE TEST Conclusions for Areas Receiving Full-Scope Reviews The bank’s performance under the service test in Omaha-Council Bluffs (NE-IA) MMSA AA is rated “Outstanding.” Based on full-scope reviews, the bank’s performance in the Omaha-Council Bluffs (NE-IA) MMSA AA is excellent. Retail Banking Services Refer to Table 15 in the Omaha-Council Bluffs (NE-IA) MMSA AA section of appendix D for the facts and data used to evaluate the distribution of the bank’s branch delivery system and branch openings and closings. FNBO’s branch distribution in the AA is excellent. The bank’s branch distribution from September 30, 2010 to December 31, 2015 is excellent. Branches were readily accessible to all portions of the AA. The percentage of FNBO’s branches in low-income geographies was near to the percentage of population living in these geographies. The percentage of FNBO’s branches in moderate-income geographies exceeded the percentage of population living in such geographies. FNBO’s opening and closing of branches has not adversely affected the accessibility of its delivery systems, particularly in low- and moderate-income geographies or to low- and moderate-income individuals. FNBO opened one branch within a moderate-income census tract in 2012. Additionally, there were three branch closings in the Omaha-Council Bluffs (NE-IA) MMSA AA; two were within upper-income census tracts and closed in 2012 and 2015 and one was within a moderate-income census tract and closed in 2015. FNBO closed the branches as a business decision based on growth and earnings performance that were below projections. FNBO’s hours and services offered throughout the AA do not vary in a way that inconvenience portions of the AA, particularly LMI individuals and/or geographies. Services offered and hours of operation are comparable among locations regardless of the income level of the geography. Management complements traditional service delivery methods with certain alternative delivery processes, including online banking, mobile banking, 34 deposit-taking ATMs, and telephone banking. These delivery methods provide increased access to banking services throughout all areas in the AA. The bank maintained metrics regarding utilization rates for online and mobile banking for a portion of the evaluation period; however, we did not attribute significant emphasis to the metrics to measure the effectiveness of these processes in helping to meet the financial needs including credit needs of low- and moderate-income individuals. Refer to the Other Factors section for a discussion of alternative delivery systems. Community Development Services FNBO’s performance in providing CD services in the Omaha - Council Bluffs MMSA AA is good. The institution provides a relatively high level of CD services that are responsive to identified needs in the AA and have a positive impact on the Service Test conclusions.

Charter Number: 209
27
In the Omaha-Council Bluffs (NE-IA) MMSA AA, 104 bank employees provided their expertise to 51 different CD organizations, serving as board or committee members; the bulk of these organizations focused on either community services or affordable housing during the evaluation period. FNBO serviced 518 loans, which serve a CD purpose, for four different entities totaling $5.3 million. More than 94 percent of the loans serviced were to low- or moderate-income borrowers. A variety of entities were provided servicing including a nonprofit that provides homeownership opportunities for low- and moderate-income borrowers. FNBO sponsored two Federal Home Loan Bank of Topeka applications in 2015: one to a housing developer association resulting in home ownership for 372 families, and one for a CDFI that resulted in loans to small businesses.

Charter Number: 209
28
State Rating State of Colorado CRA Rating for Colorado: Outstanding The lending test is rated: Outstanding The investment test is rated: Outstanding The service test is rated: Low Satisfactory The major factors that support this rating include: • An excellent level of lending for home mortgage loans and a good level of small loans to
businesses;
• Overall good geographic distribution that is based on a blend of the individual lending types evaluated. Home mortgage loan distribution performance was good, small loans to businesses was excellent, and small loans to farm performance was good;
• An overall good borrower income distribution, that is influenced by good home mortgage and excellent small loans to business and limited small farm performance;
• A significantly positive level of CD loans that were responsive to community needs in Fort
Collins-Loveland MSA and the Boulder MSA AAs that contributed to the overall lending test rating;
• An excellent level of qualified CD investments and grants that were responsive to CD
needs in all Colorado AAs;
• A branch distribution that was reasonably accessible to LMI individuals and geographies in the Fort Collins-Loveland MSA and Boulder MSA AAs; and
• An adequate level of CD services that was responsive to community needs. Description of Institution’s Operations in Colorado FNBO has four AAs within the State of Colorado. These AAs include the Fort Collins-Loveland MSA AA, comprised of Larimer County; Boulder MSA AA, comprised of Boulder County; Denver-Aurora-Lakewood MSA AA, comprised of Broomfield County and portions of adjacent Adams and Jefferson Counties; and Greeley MSA AA, comprised of Weld County. The bank provides a full range of loan and deposit products to all AAs. FNBO has 25 branches within the state, representing 24.5 percent of the bank’s total branch network. There was one branch closing and one branch opening in the state during the evaluation period. FNBO had 24 deposit-taking ATMs within the state, representing 24.5 percent of the bank’s total ATM network. As of June 30, 2014, the bank ranked eighth in the state in deposits, representing a 2
Charter Number: 209
29
percent market share. FNBO’s statewide deposits totaled $2.2 billion. The Fort Collins-Loveland MSA AA is the bank’s most significant AA in the state, accounting for 10 percent of total bank deposits. The other three AAs account for an additional 5.6 percent of total bank deposits. Fort Collins-Loveland MSA AA The banking industry is competitive in the AA and includes branches of national and regional banks, local community banks, credit unions, and other nonbank financial institutions. As of June 30, 2014, FNBO ranked first in AA deposits with $1.4 billion, representing a 22 percent market share among 29 financial institutions. The five largest competitors in the AA include Wells Fargo Bank, N.A., The Home State Bank, FirstBank, JPMorgan Chase, N.A., and U.S. Bank National Association. In the AA, FNBO had a deposit market share of 21.2 percent, as of the June 30, 2011 FDIC Market Share Report and ranked first in the AA with $1 billion in deposits among 29 depository institutions. Boulder MSA As of June 30, 2014, there were 32 financial service providers with branches in the AA. FNBO ranked eighth in AA deposits of $285.6 million, representing a 3.7 percent market share. The five largest competitors include Wells Fargo Bank, N.A., JP Morgan Chase, N.A., FirstBank, U.S. Bank National Association and Great Western Bank. In 2011, FNBO held a slightly larger share at 4.2 percent market share among 30 competitors, with deposits totaling $281.7 million. Denver-Aurora-Lakewood MSA As of June 30, 2014, there were 31 financial service providers with branches in the AA. FNBO had total deposits of $115.1 million and ranked 17th in AA deposits, representing a 0.7 percent market share. The five largest competitors in the AA include FirstBank, Wells Fargo Bank, N.A., U.S. Bank National Association, JP Morgan Chase, N.A., and Bank of the West. In 2011, FNBO held 0.8 percent market share among 32 competitors, with deposits totaling $108 million. Greeley MSA As of June 30, 2014, FNBO ranked third in AA deposits with $379.4 million, representing an 11.6 percent market share among 24 financial institutions. The five largest competitors in the AA include Bank of Colorado, Wells Fargo Bank, N.A., JP Morgan Chase, N.A., FirstBank and NBH Bank National Association. FNBO had a deposit market share of 9.1 percent, as of the June 30, 2011 FDIC Market Share Report and ranked fourth in the AA with $266.8 million in deposits among 25 depository institutions. Refer to the market profiles for the state of Colorado in appendix C for detailed demographics and other performance context information for AAs that received full-scope reviews. Scope of Evaluation in Colorado For the state of Colorado, we completed a full-scope review of the Fort Collins-Loveland MSA AA. Limited-scope reviews were conducted for the Boulder MSA, Denver-Aurora-Lakewood MSA, and Greeley MSA AAs. The Fort Collins-Loveland MSA AA received a full-scope review due to the high percentage of deposits in the state, at 64 percent. The Fort Collins-Loveland MSA AA also had the largest volume of reportable loans, at approximately 53.6 percent of the

Charter Number: 209
30
rated area loans. The bank’s branch distribution shows that 36 percent of the bank’s branches statewide are located in the Fort Collins-Loveland MSA AA. Ratings are based primarily on results of the full-scope area. The volume of multifamily loans was not significant enough to provide a quantitative analysis. We reviewed one economic development organization community contact conducted in the AA as part of this performance evaluation. The contact cited a need for small business financing. This need was considered in performance conclusions for the AA. Refer to the tables in appendix A for more information on the Colorado AAs. LENDING TEST Conclusions for Areas Receiving Full-Scope Reviews The bank’s performance under the lending test in the state of Colorado is rated “Outstanding.” Based on the full-scope review, the bank’s performance in the Fort Collins-Loveland MSA AA is excellent. Lending Activity The bank’s overall lending activity in the state of Colorado is excellent, considering the strong competition for all types of loans in the bank’s AAs. The bank’s performance is excellent in originating home mortgage loans and good in originating small business loans, and small farm loans. Refer to Table 1 Lending Volume in the state of Colorado section of appendix D for the facts and data used to evaluate the bank’s lending activity. FNBO’s lending activity in the Fort Collins-Loveland MSA AA is excellent. Home mortgage lending activity is excellent and both small business and small farm lending is good, considering competition in the AA. Competition for home purchase lending was very strong, with 321 lenders in the AA based on 2014 peer mortgage data. FNBO ranked eighth in home purchase lending with a 2.5 percent market share. For home improvement lending, the bank was stronger, ranking second with a 12.5 percent market share. Home refinance lending was also highly competitive with 300 lenders in the AA. FNBO ranked sixth in home refinance lending with a 3 percent market share. The small business lending activity is good given the bank’s market share and ranking, compared to lending competition within the AA. Based on 2014 peer data, the top five lenders for small business lending activity are some of the nation’s largest lenders who collectively had 62.6 percent of the market share. FNBO ranked seventh among 74 lenders with a 5.5 percent market share. Individual market shares of these larger lenders ranged from 9.7 to 16 percent. FNBO’s small farm lending was good, with the bank ranking fifth out of 15 lenders in the AA. The bank’s market share of 9.4 percent made it a strong competitor in the market.

Charter Number: 209
31
Distribution of Loans by Income Level of the Geography The geographic distribution of the bank’s lending in the Fort Collins-Loveland MSA AA is good. Excellent small business lending performance was complemented by good home purchase lending and refinance lending performance. Our analysis placed more emphasis on the home mortgage loan performance. In addition, greater emphasis was placed on home purchase and home refinance based on lending volumes. Lastly, greater emphasis was placed on the bank’s lending performance in 2012 through 2014 than its performance in 2010 and 2011. Home Mortgage Loans The geographic distribution of home mortgage loans is good. Refer to Tables 2, 3, 4, and 5 in the state of Colorado section of appendix D for the facts and data used to evaluate the geographic distribution of the bank’s home mortgage loan originations/purchases. The bank had somewhat limited opportunities for home mortgage lending in low-income census tracts. In evaluating geographic distribution of home loans in the Fort Collins-Loveland AA, we took into consideration competition and the fact that low-income census tracts contained only 800 owner-occupied housing units, according to 2010 U.S. Census data and contained only 841 owner-occupied housing units according to 2000 U.S. Census data. The geographic distribution of home purchase loans is good. The bank’s geographic distribution of home purchase loans from 2012 through 2014 was good. The percentage of loans made in the low-income geographies was somewhat lower than the percentage of owner-occupied units in those geographies. The distribution of home purchase loans in the moderate-income geographies was near to the percentage of owner-occupied units in those geographies. FNBO’s market share was adequate. FNBO did not have a reportable market share in the low-income census tracts and was near to the overall market share in the moderate-income census tracts. The geographic distribution of home purchase loans from 2010 through 2011 was consistent with lending in 2012 through 2014. The geographic distribution of home improvement loans is good. The bank’s 2012 through 2014 home improvement loan geographic distribution was good. The percentage of loans made in low-income geographies exceeds the percentage of owner-occupied units in those. The bank’s distribution of home improvement loans in the moderate-income geographies was somewhat lower than in the percentage of owner-occupied units in those geographies. FNBO’s market share is good. FNBO had one hundred percent of the market share in the low-income census tracts, although that only represents 2 loans, and somewhat lower market share in the moderate-income census tracts. The geographic distribution of home improvement loans from 2010 through 2011 was consistent with lending in 2012 through 2014. The geographic distribution of home refinance loans is good. The bank’s geographic distribution of home refinance loans from 2012 through 2014 was good. The percentage of loans made in the low-income census tracts was somewhat lower than the percentage of owner-occupied units in those geographies. The percentage of loans in moderate-income

Charter Number: 209
32
geographies was near to the percentage of owner-occupied units in those geographies. FNBO’s market share in both the low- and moderate-income geographies exceeded the overall market share in those geographies. The bank’s geographic distribution of home refinance loans from 2010 through 2011 was consistent with lending in 2012 through 2014. Small Loans to Businesses Refer to Table 6 in the state of Colorado section of appendix D for the facts and data used to evaluate the geographic distribution of the bank’s origination/purchase of small loans to businesses. The geographic distribution of small loans to businesses is excellent. The FNBO’s geographic distribution of small loans to businesses from 2012 through 2014 was excellent. The percentage of small loans to business made in the low -income geographies exceeded the percentage of businesses in those geographies and is excellent. The percentage in moderate-income geographies was considered essentially equal to the percentage of AA businesses in moderate-income geographies demonstrating good performance. FNBO’s market share was excellent. The bank’s market share in both LMI geographies exceeded the overall market share. The bank’s performance in 2010 through 2011 was consistent with the performance noted from 2012 through 2014. Small Loans to Farms Refer to Table 7 in the state of Colorado section of appendix D for the facts and data used to evaluate the geographic distribution of the bank’s origination/purchase of small loans to farms. The geographic distribution of small loans to farms is good. The bank’s geographic distribution of small loans to farms from 2012 through 2014 was excellent. The percentage of small loans to farms made in the low-income geographies exceeded the percentage of farms in those geographies and the penetration in moderate-income geographies was generally equal to the percentage of AA farms in those geographies. FNBO’s market share was good. The bank’s market share in the low-income census tracts exceeded the overall market share in those geographies, but was somewhat lower than the overall market share in the moderate-income geographies. The bank did not make a sufficient number of small loans to farms in 2010 through 2011 to allow for quantitative analysis. Lending Gap Analysis We reviewed summary reports and maps detailing FNBO’s lending activity over the evaluation period for home mortgage, small businesses, and small farm lending activity identify gaps in the geographic distribution of those loans. We did not identify any unexplained conspicuous gaps. Distribution of Loans by Income Level of the Borrower The borrower distribution of the bank’s lending is good. Home mortgage loan performance was good and loans to small businesses was excellent. We placed more emphasis on the bank’s home mortgage loans, but small business and small farm loan performance was still

Charter Number: 209
33
considered. We additionally placed greater emphasis on home purchase and home refinance than we placed on home improvement loans. Lastly, greater emphasis was placed on the bank’s performance in 2012 through 2014 than its performance in 2010 and 2011. Home Mortgage Loans The borrower distribution of home mortgage loans is good, with excellent market share. Refer to Tables 8, 9 and 10 in the state of Colorado section of appendix D for the facts and data used to evaluate the borrower distribution of the bank’s home mortgage loan originations and purchases. According to 2010 U.S. Census, the median housing value was $257,750, representing a significant increase from 2000 U.S. Census median housing value of $175,967. The relatively high median housing value and the steep increase in housing costs indicate the pool of affordable housing is limited. The borrower distribution of home purchase loans is good. The percentage of home purchase loans to low-income borrowers was lower than the percentage of low-income families from 2012 through 2014. However, the percentage of moderate-income borrowers exceeded the percentage of moderate-income families. The bank’s performance in 2011 through 2012 was stronger than performance noted from 2012 through 2014. The percentage of loans to low-income borrowers was somewhat lower than the percentage of low-income families. The percentage of moderate-income borrowers exceeded the percentage of moderate-income families. The borrower distribution for home improvement loans is good. The percentage of loans to low-income borrowers was lower than the percentage of low-income families from 2012 through 2014; however, the percentage of moderate-income borrowers exceeded the percentage of moderate-income families. The bank’s market share of loans to both low- and moderate-income borrowers exceeded the overall market share and was excellent. The bank’s performance in 2011 through 2012 was consistent with the performance noted from 2012 through 2014. The borrower distribution for refinance loans is good. The percentage of loans to low-income borrowers was lower than the percentage of low-income families from 2012 through 2014. The percentage of loans to moderate-income borrowers exceeded the percentage of moderate-income families. The bank’s market share of loans to low-income borrowers was lower than the overall market share. The bank’s market share of loans exceeded the overall market share of loans to moderate-income borrowers. The bank’s performance in 2011 through 2012 was stronger than the performance from 2012 through 2014. The percentage of loans to low-income borrowers was near to the percentage of low-income families. The percentage of loans to moderate-income borrowers exceeded the percentage of moderate-income families. The bank’s market share was excellent. Market share for low- and moderate-income borrowers exceeded the bank’s overall market share.

Charter Number: 209
34
Small Loans to Businesses Refer to Table 11 in the state of Colorado section of appendix D for the facts and data used to evaluate the borrower distribution of the bank’s origination and purchase of small loans to businesses. In evaluating the bank’s performance, we considered the competitive market in which the bank operates regarding small business lending and the impact of the large volume of commercial credit cards. We noted that revenues were only collected on approximately 57.9 percent of the reportable loans for 2012 through 2014 and 35.8 percent of the reportable loans from 2010 through 2011. As previously noted, FNBO does not collect revenue information on credit card loans under $100,000 to businesses. FNBO relies on other analytical tools in the credit evaluation process of small business credit card loans. Therefore our analysis focused on loan size as a proxy using loans under $100,000 as small business lending. The percentage of loans with an original amount of $100,000 or less exceeded the percentage of small businesses. The borrower distribution of small loans to businesses is excellent. FNBO’s distribution of small loans to businesses in 2012 through 2014 is excellent. The percentage of small loans to businesses with an original amount of $100,000 or less exceeded the percentage of businesses with revenues of $1 million or less in the AA. Due to the significant level of loans reported without revenue information, our conclusions are based primarily on available data as displayed in appendix D for loans by original amount regardless of business size. Conclusions were based also on loan size as a proxy for the distribution analysis for lending to small businesses. The bank’s market share of loans to businesses with revenues of $1 million or less is somewhat lower than the bank’s overall market share for small loans to businesses and considered adequate. The bank’s performance in 2010 through 2011 was consistent with the performance noted from 2012 through 2014. Small Loans to Farms Refer to Table 12 in the state of Colorado section of appendix D for the facts and data used to evaluate the borrower distribution of the bank’s origination and purchase of small loans to farms. The borrower distribution of small loans to farms is adequate. The bank’s borrower distribution of small loans to farms in 2012 through 2014 was adequate, and the percentage of small loans to small farms with an original amount of $100,000 or less was lower than the percentage of small farms. The bank’s reported market share was significantly lower than the overall market share. The bank’s performance in 2010 through 2011 was consistent with the performance noted from 2012 through 2014. Limited revenue information was available for small loans to farms. Community Development Lending In Colorado, FNBO had a significantly positive level of CD loans and exhibited an excellent record of serving the credit needs of the most economically disadvantaged areas of its assessment areas, low-income individuals, and very small businesses, consistent with safe

Charter Number: 209
35
and sound banking practices. CD lending contributed significantly to the overall lending test rating. Refer to Table 1 Lending Volume in the state of Colorado section of appendix D for the facts and data used to evaluate the bank’s level of CD lending. This table includes all CD loans, including multifamily loans that also qualify as CD loans. In addition, Table 5 includes geographic lending data on all multifamily loans, including those that also qualify as CD loans. Table 5 does not separately list CD loans. FNBO’s level of CD lending has a significantly positive impact on its overall lending performance in the Fort Collins-Loveland MSA AA. FNBO originated 28 qualified CD loans totaling $59.1 million in the AA during the evaluation period. This volume represented 30.8 percent of allocated tier one capital for the AA. The bank’s CD loans were highly responsive to AA needs, demonstrated leadership, supported affordable housing initiatives for LMI individuals, promoted economic development in the AA, and revitalized or stabilized LMI geographies in the AA. Specific examples of the CD loans originated during this evaluation period include:
• Ten loans totaling approximately $48.6 million were provided to the state university system to assist in area revitalization. The loans allow for the acquisition of buildings, along with the development and expansion of university facilities into low- or moderate-income areas. Not only will these loans assist in the revitalization of the area, but also once completed, the expansion will provide employment opportunities for those in the surrounding low- or moderate-income areas.
• Eight loans totaling $7.5 million were provided to a city housing authority to assist in providing affordable housing to low- and moderate-income individuals as well as to help in the revitalization of moderate-income geographies.
• Five loans totaling $250,000 used to assist local Boys and Girls Clubs in the AA that provide community services to LMI individuals.
Community Development Loans – CO Statewide In addition to qualified CD loans made within the bank’s AAs, FNBO originated CD loans in the broader statewide area that includes the bank’s AAs.
The bank originated one loan totaling $655,000 in the broader statewide area that had a P/M/F to serve one or more of the bank’s AAs in the state. The loan was used to fund a CDFI that in turn made qualified CD investments. In addition, the bank made two loans totaling $10 million in the broader statewide area that did not have a P/M/F to serve any of the AAs in the state. Product Innovation and Flexibility FNBO offers flexible lending products that had a positive impact on the overall rating for this rated area. FNBO made 721 loans under the secured Visa Credit Card Loan Program in the full-scope area. Approximately 71.6 percent of the borrowers were classified low- or moderate-income and 41.3 percent were located in LMI geographies. For additional information, refer to

Charter Number: 209
36
the summary of innovative and flexible loan programs in the Other Factors – Lending Test section for a description of products offered bank-wide. Conclusions for Areas Receiving Limited-Scope Reviews Based on limited-scope reviews, the bank’s performance under the lending test overall is consistent with the bank’s overall “Outstanding” performance under the lending test in Colorado. In the Boulder MSA AA, the bank’s performance is consistent with than the bank’s overall performance in the state. The bank’s performance in the Greeley MSA and the Denver-Aurora-Lakewood MSA AAs were weaker than the overall performance in the state due to weaker geographic distribution. The weaker performances did not impact on the overall lending test rating conclusion in the state. Refer to the Tables 1 through 12 in the state of Colorado section of appendix D for the facts and data that support these conclusions. INVESTMENT TEST Conclusions for Areas Receiving Full-Scope Reviews The bank’s performance under the Investment Test in the state of Colorado is rated “Outstanding.” Based on a full-scope review, the bank operates with an excellent level of investments in the Fort Collins-Loveland MSA AA with good responsiveness. Refer to Table 14 in the State of Colorado section of appendix D for the facts and data used to evaluate the bank’s level of qualified investments. FNBO made 42 investments in the Fort Collins-Loveland MSA AA, totaling $10.4 million, which consisted of 21 investments ($9.9 million) and 21 donations ($399,000) during the evaluation period. There were two prior period investments outstanding at the end of the evaluation period totaling $1.9 million. Total investments of $12.3 million in the AA represent 6.4 percent of allocated tier one capital, reflecting an excellent level of investments. The bank operates with good responsiveness to the CD needs in the AA. Community contacts identified affordable housing, including rental housing, as a significant credit need in the AA, along with financial education and general financial services for low- and moderate-income borrowers. In terms of total dollar volume, 68.1 percent of the bank’s investments included government mortgage-backed securities, all of which were responsive to identified affordable housing needs in the AA. A significant majority of the mortgage loan pools were comprised of home loans to LMI borrowers originated the during the evaluation period. FNBO additionally provided $485,000 in municipal bonds to a town in the AA designated as a FEMA disaster area due to significant flooding that occurred in 2013. These funds were used to assist with the town’s sewer improvement plan in an attempt to prevent future flooding. While investments were not considered innovative, the bank showed ongoing responsiveness to its AA needs. FNBO also made a total of $399,000 in donations in the AA, including donations of $210,000 to assist with economic development in the AA and $69,000 to assist with affordable housing.

Charter Number: 209
37
Investments – CO Statewide FNBO originated 16 qualifying investments totaling $2.1 million in the broader statewide area that had a P/M/F to serve one or more of the bank’s AAs in the state. These investments received positive consideration in the overall evaluation of performance in Colorado. Ten investments totaling $1.1 million promoted economic development and six investments totaling $1 million provided affordable housing. Investments demonstrate a commitment to support economic development and affordable housing within the state. Conclusions for Area Receiving Limited-Scope Reviews Based on the limited-scope review, the bank’s performance under the Investment Test in the Boulder MSA, Denver-Aurora-Lakewood MSA and Greeley MSA AAs were consistent with the bank’s overall “Outstanding” performance under the investment test in the state of Colorado. Refer to Table 14 in the state of Colorado section of appendix D for the facts and data that supports these conclusions. SERVICE TEST Conclusions for Areas Receiving Full-Scope Reviews FNBO’s performance under the service test in Colorado is rated “Low Satisfactory.” Based on full-scope reviews, the bank’s performance in the Fort Collins – Loveland MSA AA is adequate. Retail Banking Services Refer to Table 15 in the state of Colorado section of appendix D for the facts and data used to evaluate the distribution of the bank’s branch delivery system and branch openings and closings. FNBO’s branch distribution in the AA is good. The bank’s branch distribution from September 30, 2010 through December 31, 2015 was adequate in the low- and moderate-income geographies. The nine branches were reasonably accessible to essentially all portions of geographies and individuals of different income levels in the AA. The bank did not have any branches located in low-income geographies; however, we noted a relatively small population in the low-income geographies. There were three branches located in moderate-income geographies, with the percentage of branches in moderate-income geographies exceeding the percentage of the population in those same geographies. There were no branch openings and closing in the Fort Collins-Loveland MSA AA. Branch hours and services do not vary in a way that would inconvenience portions of the AA, particularly LMI individuals. Services offered and banking hours are comparable among locations regardless of the income level of the geography. In this AA, management complements its traditional service delivery methods with certain alternative delivery processes, including online banking, mobile banking, 15 deposit-taking ATMs and telephone banking. These delivery methods provide increased access to banking

Charter Number: 209
38
services throughout all areas in the AA; however, although the bank maintained metrics regarding utilization rates for online and mobile banking, we did not attribute significant emphasis to the effectiveness of these processes in helping to meet the credit needs of LMI individuals. Refer to the Other Factors section for a discussion of alternative delivery systems. Community Development Services FNBO’s performance in providing CD services was adequate in the Fort Collins-Loveland MSA AA. CD services focused on affordable housing and community services targeted to LMI individuals. Bank employees participated in a variety of organizations and partnerships, most in leadership roles, that benefited LMI individuals, promoted economic development, and provided affordable housing. FNBO employees also provided technical assistance on financial and banking related matters to community groups and to LMI persons and families. FNBO employees provided their expertise to eight different CD organizations that support community service, economic development and affordable housing throughout the evaluation period. This represents an adequate level of activities and responsiveness to identified needs of the community. FNBO employee activities totaled approximately 811 service hours targeting LMI individuals and were responsive to the identified community needs of affordable housing and financial literacy. Eight bank employees provided their expertise to eight different CD organizations. One employee provided financial expertise with the Boys and Girls Club, while two other employees participated with organizations that provided affordable housing. One employee participated with a local food bank while two employees assisted small businesses, including start –ups, with technical and job creation assistance. Two additional employees worked with local government to develop affordable housing and economic development. Conclusions for Areas Receiving Limited-Scope Reviews Based on limited-scope reviews, the bank’s performance under the service test in the Boulder MSA AA was consistent with the bank’s overall “Low Satisfactory” performance under the service test in state of Colorado. The bank’s performance in the Denver-Aurora-Lakewood MSA and Greeley MSA AAs are weaker than the overall performance in the state and are considered poor. Performance differences in the Denver-Aurora-Lakewood MSA and Greeley MSA AAs were based on weaker branch distribution, but were not significant enough to influence the bank’s overall rating. Refer to Table 15 in the state of Colorado section of appendix D for the facts and data that support these conclusions

Charter Number: 209
39
State of Illinois CRA Rating for Illinois: Satisfactory The lending test is rated: High Satisfactory The investment test is rated: Outstanding The service test is rated: Low Satisfactory The major factors that support this rating include: • A good level of lending for home mortgage loans and small loans to businesses; • Overall adequate geographic distribution as evidenced by adequate distribution of home
mortgage loans and small loans to businesses; • An overall good distribution on borrower income level, with good distribution of home
mortgage loans and excellent distribution of small loans to businesses; • A significantly positive level of CD loans that were that were responsive to community
needs in the Chicago MD and Elgin MD AAs that contributed to the overall lending test rating;
• An excellent level of qualified investments that were responsive to community needs, as
evidenced by excellent performance in the Chicago MD AA and augmented by statewide investments;
• A branch distribution that was accessible to limited portions of the bank’s assessment
areas; and
• A good level of CD services that was responsive to community needs. Description of Institution’s Operations in Illinois Refer to the market profiles for the state of Illinois in appendix C for detailed demographics and other performance context information for AAs that received full-scope reviews. For the state of Illinois, we completed full-scope reviews for the Chicago-Naperville-Arlington Heights MD (Chicago MD) and Elgin MD AAs. The Rockford MSA AA, which consists of Boone County, received a limited scope review. In 2014, the Office of Management and Budget changed the geographic boundaries for the Chicago MD and Elgin MD. These changes affected FNBO’s AAs; in particular, the Chicago MD consists of Kendall and McHenry counties and Elgin MD consists of DeKalb and Kane counties. Prior to 2014, DeKalb and Kane counties were a part of the Chicago MD. The bank has 14 branches within the state, representing 13.7 percent of the bank’s total

Charter Number: 209
40
branch network. FNBO closed one branch statewide during the evaluation period. FNBO did not have any deposit-taking ATMs within the state. As of June 30, 2014, the bank ranked 42nd in the state in deposits, representing a 0.2 percent market share. The bank’s statewide deposits totaled $1.1 billion. The Chicago MD is the bank’s most significant AA in the state, accounting for 3.8 percent of total bank deposits. Chicago MD The banking industry is highly competitive in the AA, and the top five banks hold 47.7 percent of the market share based on the June 30, 2014 FDIC Deposit Market Share data. The top three competitors in the AA include BMO Harris Bank, N.A., JPMorgan Chase N.A., and Crystal Lake Bank and Trust Company, N.A. As of June 30, 2014, FNBO had a total of $509 million in deposits and ranked fourth in the AA in deposits, representing a 6.6 percent market share. Elgin MD The banking industry is highly competitive in the AA, and the top five banks hold 45.7 percent of the market share. The five largest competitors in the AA include JPMorgan Chase Bank, Old Second National Bank, BMO Harris Bank, Fifth Third Bank, and St. Charles Bank & Trust Company. As of June 30, 2014, FNBO had a total of $526 million and ranked seventh in the AA in deposits, representing a 4.8 percent market share. Scope of Evaluation in Illinois For the state of Illinois, we completed full-scope reviews of the Chicago MD and Elgin MD AAs. A limited-scope review was conducted for the Rockford MSA AA. As previously mentioned the geographic boundaries for the Chicago and Elgin MDs changed during the evaluation period, producing the highest percentage of deposits in these areas, 48.4 and 50 percent respectively. These AAs also had the largest volume of total reportable loans in the state as follows: Chicago MD AA with 79.8 percent and Elgin MD AA with 17.2 percent. Branch distribution within the state shows the Chicago MD AA has 57.1 percent of total branches, and the Elgin MD AA has 35.7 percent of total branches. The Chicago MD AA received a slightly higher emphasis on final rating because the AA has the largest percent of branches and loans in the state of Illinois. The volume of multifamily loans was not significant enough to provide a quantitative analysis, with the exception of the Chicago MD AA. We reviewed two community contacts in the state of Illinois. The community organization in the Chicago MD cited a need for affordable housing to low- and moderate-income individuals and small business financing. The community contact in the Elgin MD was a business development organization that indicated a need for small business lending. These credit needs were considered in performance conclusions for the respective AAs. Refer to the tables in appendix A for more information on the Illinois AAs.
Charter Number: 209
41
LENDING TEST Conclusions for Areas Receiving Full-Scope Reviews FNBO’s performance under the lending test in Illinois is rated “High Satisfactory.” FNBO’s performance in the Chicago MD and Elgin MD is good. Lending Activity The bank’s overall lending activity in the state of Illinois is good. The bank’s good performance in originating home mortgage loans and small business loans supports this conclusion. Refer to Table 1 Lending Volume in the state of Illinois section of appendix D for the facts and data used to evaluate the bank’s lending activity. Chicago MD FNBO’s lending activity in the Chicago MD is good. Home mortgage lending and small business lending activity is excellent, considering the competition in the AA. Based upon FDIC Deposit Market Share data as of June 30, 2014, FNBO achieved a 6.6 percent market share of deposits, ranking fourth among 38 financial institutions in the AA. Based upon 2014 peer mortgage data, FNBO achieved a 1.3 percent market share of home purchase loans, ranking 17th among 301 reporting lenders within the AA. The bank achieved a 14.4 percent market share of home improvement loans, ranking second among 88 reporting lenders. The bank also achieved a 1.7 percent market share of home refinance loans, ranking 12th among 285 reporting lenders. The small business lending activity is excellent given the bank’s market share and ranking when compared to the deposit market share and competition for loans to small businesses within the AA. Based on 2014 peer data, the top five lenders for small business lending activity consisted of the nation’s largest credit card lenders that collectively have 57 percent of the market share. FNBO ranked ninth among 86 lenders, with a market share of 3.1 percent. Small farm activity is excellent with FNBO ranking first with 31.4 percent in market share. However, the volume of small farm loans did not affect overall conclusions. The FDIC Deposit Market Share as of June 30, 2013, prior to the Office of Management and Budget changes to the geographic boundaries for the Chicago MD, shows FNBO had a deposit market share of 5.3 percent, ranking 5th among 63 financial institutions in the AA. Based upon 2013 peer mortgage data, FNBO achieved a 1.2 percent market share of home purchase loans, ranking 13th among 387 reporting lenders in the AA. For home improvement lending, the bank ranked first among 100 reporting lenders. Home refinance lending is highly competitive with 435 reporting lenders in the AA. FNBO ranked 16th in home refinance lending with a 1.1 percent market share. For multi-family loans, FNBO achieved a 7.1 percent market share and ranked third among 50 lenders. The small business lending activity is excellent given the bank’s market share and ranking when compared to the deposit market share and competition for loans to small businesses within the AA. Based on 2013 peer data, the top six lenders for small business lending activity

Charter Number: 209
42
consists of the nation’s largest credit card lenders that collectively have 57.1 percent of the market share. FNBO ranked ninth among 98 lenders, with a market share of 3.3 percent. Although small farm activity is excellent with FNBO ranking first with 31.4 percent in market share, the volume of loans was low and lending did not impact overall conclusions. Elgin MD FNBO’s lending activity in the Elgin MD is excellent. Home mortgage lending and small business lending activity is excellent, considering the high level of competition in the AA. Based upon FDIC Deposit Market Share data as of June 30, 2014, FNBO achieved a 4.8 percent market share of deposits, ranking seventh among 40 financial institutions in the AA. Based upon 2014 peer mortgage data, FNBO achieved a 1.3 percent market share of home purchase loans, ranking 18th among 325 reporting lenders within the AA. The bank achieved 8.3 percent market share of home improvement loans, ranking second among 83 reporting lenders. The bank also achieved a 1.2 percent market share of home refinance loans, ranking 17th among 306 reporting lenders. The small business lending is excellent given the bank’s market share and ranking compared to the deposit market share and volume of small business lending competition within the AA. Based on 2014 peer data, the top five lenders for small business lending activity consists of the nation’s largest credit card lenders that collectively have 58.4 percent of the market share. FNBO ranked 12th among 103 lenders, with a 2.4 percent market share. For small farm activity, FNBO had a 38.1 percent market share and ranked first among 29 lenders. However, the volume of loans was low in relation to overall reported loans and did not impact overall conclusions. Distribution of Loans by Income Level of the Geography The geographic distribution of the bank’s lending is adequate. Lending performance was adequate for home mortgage and small business lending and poor for small farm lending. In performing our analysis, we placed greater emphasis on the bank’s home mortgage lending as home mortgage loans represented the majority of the bank’s CRA reportable lending activity. Within home mortgage lending, we placed greater emphasis on home refinance loans based on the volume of originations during the evaluation period. In addition, we placed more emphasis on the bank’s 2012 through 2014 performance than its performance in 2010 through 2011. As noted previously, due to Chicago MD and the Elgin MD geographic boundary changes, our analysis was impacted. Specifically, the Elgin MD AA evaluation period consists of January 1, 2014 to December 31, 2014 whereas the Chicago MD AA evaluation period covers January 1, 2012 to December 31, 2013 and January 1, 2014 to December 2014. Home Mortgage Loans The geographic distribution of home mortgage loans is adequate.

Charter Number: 209
43
Refer to Tables 2, 3, 4, and 5 in the state of Illinois section of appendix D for the facts and data used to evaluate the geographic distribution of the bank’s home mortgage loan originations/purchases. Chicago MD AA (2012 – 2013) The geographic distribution of home mortgage loans is adequate. Very few housing units are located in the low-income portion of the AA and that limits the bank’s opportunities to make mortgage loans in these census tracts. According to data obtained from the 2010 and 2000 U.S. Census, low-income census tracts contained 0.3 percent and 0.1 percent of the total owner-occupied housing units in the AA, respectively. Chicago MD AA (2014) The geographic distribution of home mortgage loans is adequate. The Chicago MD AA for 2014 consists of Kendall and McHenry counties, which do not have any low-income census tracts. The tables in appendix D show performance for the 2012-2013 period for this AA. The geographic distribution of home purchase loans is adequate. The bank’s geographic distribution of home purchase loans from 2012 through 2013 reflects adequate penetration throughout the assessment area. While there was only a small number of owner-occupied housing in the low-income census tracts, the percentage of loans in these geographies exceeded the percentage of owner-occupied housing units. The percentage of loans made in moderate-income geographies was lower than the percentage of owner-occupied housing units these census tracts. FNBO’s market share was adequate. The bank’s market share in low-income census tracts exceeded its overall market share for home purchase loans. The market share in moderate-income census tracts was somewhat lower than the overall market share. Performance in 2014 was stronger than performance noted from 2012 through 2013 and considered excellent, but does not impact overall lending performance conclusions significantly given the low portion of housing units in the low- and moderate-income census tracts in this AA. The percentage of loans made in moderate-income geographies exceeded the percentage of owner-occupied housing units. For 2010 through 2011, performance was consistent with performance noted from 2012 through 2013. The geographic distribution of home improvement loans is adequate. The bank’s geographic distribution of home improvement loans from 2012 through 2013 reflects adequate penetration throughout the assessment area. While there was only a small percentage of owner-occupied housing in the low-income census tracts, the percentage of loans in these geographies exceeded the percentage of owner-occupied housing units. The portion of loans made in moderate-income geographies was lower than the percentage of owner-occupied units in these geographies. FNBO did not have a measurable market share in low-income census tracts. The bank’s market share is good in moderate-income census tracts and exceeded its overall market share for home improvement loans. Performance in 2014 was stronger than performance noted from 2012 through 2013 and considered excellent. The percentage of loans made in moderate-income geographies was higher than the percentage of owner-occupied housing units. For 2010 through 2011, performance was weaker than performance noted from 2012 through 2013, and was considered very poor. The percentage of loans made in moderate-income geographies was significantly lower than the percentage of owner-occupied units.

Charter Number: 209
44
The geographic distribution of home refinance loans is adequate. The bank’s geographic distribution of home refinance loans from 2012 through 2013 reflects adequate penetration for the assessment area. The percentage of owner-occupied units in the low-income geographies was less than one percent; however, FNBO’s performance exceeded the percentage of owner-occupied housing units. The portion of loans made in moderate-income census tracts was significantly below the percentage of owner-occupied units in these geographies. FNBO’s market share in low-income census tracts exceeded the overall market share. The bank’s market share in moderate-income census tracts was below its overall market share for home refinance loans. Performance in 2014 was weaker than performance noted from 2012 through 2013. As previously noted, there were no low-income census tracts in the Chicago MD AA. The percentage of loans in moderate-income census tracts was significantly lower than the percentage of owner-occupied housing units. For 2010 through 2011, performance was consistent with performance noted from 2012 through 2013, and considered adequate. The geographic distribution of multi-family loans is good. The bank’s geographic distribution of multi-family loans during 2012 through 2013 reflects good penetration throughout the assessment area. Approximately 12.9 percent of multi-family units were located in low-income census tracts. The portion of loans made in low-income census tracts exceeds the percentage of multi-family units in these geographies. The percentage of loans made in moderate-income geographies was lower than the percentage of moderate-income census tracts. FNBO’s market share was excellent. The bank’s market share for multi-family loans in LMI census tracts exceeded its overall market share. Performance in 2014 was not evaluated as FNBO did not originate or purchase a sufficient number of multi-family loans to perform a quantitative analysis and has a neutral impact on conclusions. For 2010 through 2011, performance was consistent with performance noted from 2012 through 2013. Elgin MD AA The geographic distribution of home mortgage loans is adequate. In evaluating the geographic distribution of home loans in the Elgin MD, it is important to note that according to data obtained in the 2010 U.S. Census, low-income census tracts contained 0.6 percent of the total owner-occupied housing units in the AA. Based on the relatively few housing units are located in the low-income geographies, the bank had somewhat limited opportunities for home mortgage lending in low-income census tracts. The geographic distribution of home purchase loans is adequate, based on 2014 lending. While there was only a small percentage of owner-occupied housing units in the low-income census tracts, the percentage of loans in these geographies exceeded the percentage of owner-occupied housing units and that represents five loans. The percentage of loans made in moderate-income geographies was lower than the percentage of owner-occupied housing units in these census tracts. FNBO’s market share was adequate. The bank’s market share in low-income census tracts exceeded its overall market share for home purchase loans. The market share in moderate-income census tracts was lower than the overall market share and is considered poor. The geographic distribution of home improvement loans is adequate based on 2014 lending. There was only a small percentage of owner-occupied housing in the low-income census tracts, but no home improvement loans were made in these geographies. The percentage of loans made in moderate-income geographies was somewhat lower than the percentage of

Charter Number: 209
45
owner-occupied housing units these geographies. FNBO’s market share was good. The market share in moderate-income census tracts equaled the overall market share. The geographic distribution of home refinance loans is good based on 2014 lending. Only a small percentage of owner-occupied housing units was in the low-income census tracts; the percentage of loans in these geographies exceeded the percentage of owner-occupied housing units. The percentage of loans made in moderate-income geographies was lower than the percentage of owner-occupied housing units these census tracts. FNBO’s market share was excellent. The bank’s market share in LMI census tracts exceeded its overall market share for home refinance loans. The bank did not originate or purchase a sufficient number of multifamily loans in 2014 to provide a quantitative analysis. Small Loans to Businesses The geographic distribution of small loans to businesses is adequate. Refer to Table 6 in the state of Illinois section of appendix D for the facts and data used to evaluate the geographic distribution of the bank’s origination/purchase of small loans to businesses. Chicago MD AA The geographic distribution of small loans to business is adequate. The geographic distribution of small loans to businesses in 2012 through 2013 was adequate. The percentage of small loans to businesses made in low-income geographies exceeded the percentage of businesses in those geographies. The percentage of small loans to businesses made in moderate-income geographies was lower than the percentage of businesses in those geographies. The bank’s market share in low-income geographies exceeded its overall market share for small loans to businesses. The bank’s market share in moderate-income geographies was somewhat lower than its overall market share for small loans to businesses. Performance in 2014 was stronger than the performance in 2012 through 2013 and is considered excellent. The percentage of small loans to businesses in moderate-income census tracts exceeded the percentage of businesses in those geographies. The bank’s performance in 2010 through 2011 was weaker than the performance in 2012 through 2013 and considered poor. The percentage of small loans to businesses in moderate-income census tracts was significantly lower than the percentage of businesses in those geographies. Elgin MD AA The geographic distribution of small loans to businesses is adequate to good based on 2014 lending. The percentage of small loans to businesses made in low-income geographies exceeded the percentage of businesses in those geographies. The percentage of small loans to businesses made in moderate-income geographies was somewhat lower than the percentage of businesses in those geographies and is adequate. The bank’s market share was good. The bank’s market share in low-income geographies exceeded its market share for small loans to businesses. The bank’s market share in moderate-income geographies was somewhat lower than its market share for small loans to businesses. Lending in the moderate-

Charter Number: 209
46
income geographies is emphasized in the conclusion given the much larger number of businesses located in these geographies. Small Loans to Farms The geographic distribution of small loans to farms is poor. This level of performance did not significantly impact the overall conclusion based on lending volumes. Refer to Table 7 in the state of Illinois section of appendix D for the facts and data used to evaluate the geographic distribution of the bank’s origination/purchase of small loans to farms. Chicago MD AA The geographic distribution of small loans to farms is poor. The bank’s geographic distribution of small loans to farms in 2012 through 2013 was poor. No small loans to farms were made in the low- or moderate-income census tracts. Very few farms are located in the low-income census tracts and performance is reasonable. In the Chicago MD AA, the low- and moderate-income census tracts are primarily located in the more urban portions of the Chicago MD AA resulting in limited opportunity for farm lending in the low-income geographies. The bank’s market share was poor. FNBO did not have a measurable market share in low- or moderate-income geographies. The bank’s performance in 2014 was consistent with the performance noted in 2012 through 2013. The bank’s performance in 2010 through 2011 was somewhat stronger than the performance noted in 2012 through 2013, and was considered adequate. While the percentage of small loans to farms made in moderate-income geographies was lower than the percentage of farms in those geographies, the bank’s market share was excellent. Elgin MD AA The geographic distribution of small loans to farms is adequate based on 2014 lending. No loans were made in low-income census tracts. This level of performance is adequate given the following context: the location of the low- and moderate-income census tracts are primarily located in the more urban portion of the Elgin MD AA, resulting in limited farm lending opportunities and the number of farms is relatively low in the low-income census tracts also limiting farm lending opportunities. The percentage of small loans to farms made in moderate-income geographies was somewhat lower than the percentage of farms in those geographies and is adequate. The bank’s market share was excellent. The bank’s market share in the moderate-income geographies exceeded its overall market share for small loans to farms. Lending Gap Analysis We reviewed summary reports and maps, and analyzed FNBO’s home mortgage and small business lending activity over the evaluation period to identify any gaps in the geographic distribution of loans. We did not identify any unexplained conspicuous gaps. Distribution of Loans by Income Level of the Borrower The distribution of lending by income level of the borrower is good. We placed greater emphasis on the bank’s home mortgage lending as home mortgage loans represented the majority of the bank’s CRA reportable lending activity. Within home mortgage lending, we

Charter Number: 209
47
placed greater emphasis on home refinance loans based on the volume of originations during the evaluation period, with small business and small farm lending given equal weight. We considered how housing costs inhibit affordability of housing for low-income borrowers. FNBO’s does not collect revenue information on business credit card customers with loans of $100,000 or less. For the 2012 through 2014 evaluation period, loan data on Tables 11 and 12 indicated that 38.2 percent of small loans to businesses and 10.2 percent of small loans to farms did not include revenue information. For 2010 through 2011, loan data on Tables 11 and 12 indicated that 32.5 percent and 4.1 percent did not include revenue information. Due to the significant level of business loans reported without revenue information, our conclusions are based primarily on available data as displayed in appendix D for loans by original amount regardless of business size. Conclusions were based on loan size as a proxy for the distribution analysis for lending to small businesses and lending to small farms. In addition, we placed more emphasis on the bank’s performance in 2012 through 2014 than its performance in 2010 through 2011. The borrower distribution analysis was impacted by the geographic boundary changes to the Chicago MD and Elgin MD. Specifically the Elgin MD AA evaluation period only includes January 1, 2014 to December 31, 2014 whereas the Chicago MD AA evaluation period covers January 1, 2012 to December 31, 2013 and January 1, 2014 to December 31, 2014. Home Mortgage Loans The borrower distribution of home mortgage loans is good. Distribution of loans to LMI borrowers in both the Chicago MD AA and Elgin MD AA was good. Refer to Tables 8, 9 and 10 in the state of Illinois section of appendix D for the facts and data used to evaluate the borrower distribution of the bank’s home mortgage loan originations and purchases. Chicago MD AA The borrower distribution of home mortgage loans is good. According to the 2010 U.S. Census, the median housing value was $248,948. Based on this value in relation to low-income earning levels, home ownership is not feasible for many low-income individuals and limits lending opportunities. The borrower distribution of home purchase loans was good. The borrower distribution of home purchase loans from 2012 through 2013 was good. The penetration of loans to low-income borrowers was good and near to the percentage of low-income families in the AA. The percentage of loans to moderate-income borrowers exceeded the percentage of families within the respective geographies. The bank’s market share during the period was good. The market share to both low- and moderate-income borrowers slightly exceeded the overall market share of home purchase loans. The bank’s performance in 2014 and 2010 through 2011 was consistent with the bank’s performance noted in 2012 through 2013. The borrower distribution of home improvement loans is good. The borrower distribution of home improvement loans from 2012 through 2013 was good. While the percentage of loans to low-income borrowers was somewhat lower than the percentage of low-income families, the

Charter Number: 209
48
level of performance is considered good based on performance context factors. The percentage of loans made to moderate-income borrowers was slightly lower than the percentage of moderate-income families and is good. The bank’s market share during the period was excellent. FNBO’s market share of loans to low-income borrowers significantly exceeded its overall market share of home improvement loans. The bank’s market share of loans to moderate-income borrowers was near its overall market share of home improvement loans. The bank’s performance in 2010 through 2011 was consistent with the performance noted in 2012 through 2013. The performance in 2014 was stronger than the performance in 2012 through 2013, and was considered excellent. The percentage of loans to low-income borrowers was near to the percentage of respective families and the percentage of loans to moderate-income borrowers exceeded the percentage of moderate-income families. The borrower distribution of home refinance loans is good. The bank’s borrower distribution of home refinance loans from 2012 through 2013 was good. The percentage of home refinance loans to low-income borrowers was lower than the percentage of low-income families and is considered poor. The percentage of loans to moderate-income borrowers exceeded the percentage of moderate-income families. The bank’s market share during the period was excellent. The bank’s market share of loans to low- and moderate-income borrowers slightly exceeded the overall market share of home refinance loans. The performance for 2014 and for 2010 through 2011 was consistent with the performance noted in 2012 through 2013. Elgin MD AA The borrower distribution of home mortgage loans is good. Per the 2010 U.S. Census, the median housing value is $245,260. The relatively high housing values may negatively affect the ability of low-income individuals to qualify for mortgage loans and limits the bank’s lending opportunities for home mortgage products to low-income individuals. The bank’s borrower distribution of home purchase loans in 2014 was good. The percentage of loans to low-income borrowers was lower than the percentage of such families and is considered a poor penetration, although the performance context mitigates performance to some extent. This is offset by strong performance for moderate-income borrowers as the portion of loans to moderate-income borrowers exceeded the percentage of moderate-income families. The bank’s market share during the period was good. The bank’s market share of loans to low- and moderate-income borrowers was near the overall market share of home purchase loans. The borrower distribution of home improvement loans is good based on 2014 lending. The percentage of loans to low-income borrowers was lower than the percentage of low-income families with a poor penetration that is partly mitigated by performance context regarding high housing values in comparison with income levels in the low-income category. The percentage to moderate-income borrowers was near the percentage of such families and represents good performance. The bank’s market share of home improvement loans during the period was good. The bank’s market share of loans to low- and moderate-income borrowers was near the overall market share of home improvement loans. The borrower distribution of home refinance loans is good. The bank’s borrower distribution of home purchase loans in 2014 was good. The percentage of loans to low-income borrowers was adequate although lower than the percentage of low-income families. The percentage of

Charter Number: 209
49
loans to moderate-income borrowers exceeded the percentage of such families and displays excellent performance. The bank’s market share of home refinance loans during the period was excellent. The bank’s market share of loans to low- and moderate-income borrowers exceeded the overall market share of home refinance loans. Small Loans to Businesses The borrower distribution of small loans to businesses is excellent. Distribution of small loans to businesses is excellent in the Chicago MD and the Elgin MD. Refer to Table 11 in the state of Illinois section of appendix D for the facts and data used to evaluate the borrower distribution of the bank’s origination and purchase of small loans to businesses. Chicago MD AA The borrower distribution of small loans to businesses is excellent. In evaluating the distribution of small loans to businesses, we noted that credit card loans represent a significant volume of reportable small loans to businesses and revenue information was not available for the credit card loans. The lack of revenue information inhibits our ability to analyze small loans to business by borrower characteristics. The percentage of small loans to small businesses with an original amount of $100,000 or less exceeded the percentage of small businesses. This performance was enhanced by a good market share. The bank’s market share of loans to small businesses was near to the overall market share of loans to small businesses. The bank’s performance in 2014 was consistent with the performance noted in 2012 through 2103. The bank’s performance in 2010 through 2011 was stronger than the performance noted in 2012 through 2013 and was considered good. The percentage of small loans to small businesses was near to the percentage of small businesses. Elgin MD The borrower distribution of small loans to businesses is excellent. The borrower distribution of small loans to businesses in 2014 was excellent. The percentage of small loans to small businesses with an original amount of $100,000 or less substantially met the percentage of small businesses. The bank’s market share of loans to small businesses was near the overall market share for small loans to businesses. Small Loans to Farms The borrower distribution of small loans to farms is good. Refer to Table 12 in the state of Illinois section of appendix D for the facts and data used to evaluate the borrower distribution of the bank’s origination/purchase of small loans to farms. Chicago MD The borrower distribution of small loans to farms is good. The borrower distribution of small loans to farms in 2012 through 2013 was good. The percentage of small loans to farms with an original amount of $100,000 or less was lower than the percentage of small farms and considered adequate. This performance was enhanced by excellent market share. The bank’s market share of loans to small farms exceeded its overall market share of loans to small farms.

Charter Number: 209
50
The bank’s performance in 2010 through 2011 and 2014 is consistent with the performance in 2012 through 2013. Elgin MD AA The borrower distribution of small loans to farms is adequate based on 2014 lending. The percentage of small loans to farms with an original amount of $100,000 or less was lower than the percentage of small farms. This performance was enhanced by excellent market share. The bank’s market share of loans to small farms exceeds its overall market share of loans to small farms. Community Development Lending
Refer to Table 1 Lending Volume in the state of Illinois section of appendix D for the facts and data used to evaluate the bank’s level of CD lending. This table includes all CD loans, including multifamily loans that also qualify as CD loans. In addition, Table 5 includes geographic lending data on all multi-family loans, including those that also qualify as CD loans. Table 5 does not separately list CD loans, however. FNBO had a significantly positive level of CD loans in Illinois that were responsive to community needs. Chicago MD AA FNBO’s level of CD lending has a significant positive impact on its overall lending performance in the Chicago MD. FNBO originated 12 loans totaling $10.3 million in qualified CD loans in the AA during the evaluation period. This volume represented 10.5 percent of allocated tier one capital. The bank’s CD loans were highly responsive to AA needs. The CD lending demonstrated leadership and supported affordable housing initiatives for LMI individuals, services targeted to LMI individuals, initiatives that promoted economic development in the AA, and activities that revitalized or stabilized LMI geographies. Specific examples of the CD loans originated during this evaluation period include:
• A $3 million loan to support the expansion of a public library located in a moderate-income geography;
• Two lines-of-credit totaling $2.4 million, to an affiliated SBA Small Business Investment Company (SBIC) who invests mezzanine capital and equity capital in privately owned businesses in the middle market providing flexible, long-term capital solutions; and
• One loan totaling $1.1 million to a provider of affordable housing to refinance a senior residence targeted to low- and moderate-income individuals.
Elgin MD AA The level of CD lending has a positive impact on its overall lending performance in the Elgin MD. FNBO originated five loans totaling $9.5 million in qualified CD loans in the AA during the evaluation period. This volume represented 22.8 percent of allocated tier one capital. The CD loans were highly responsive to AA needs. CD lending demonstrated leadership and supported affordable housing initiatives for LMI individuals and activities that revitalized or stabilized LMI geographies in the AA. As an example, FNBO originated two loans, totaling $8.7
Charter Number: 209
51
million to revitalize and stabilize the community by attracting residents to an area operating under an official city government plan. The loan proceeds funded the development of two mixed-use properties that offer residential and commercial space, which is part of the comprehensive city plan to improve the area. Community Development Loans – IL Statewide FNBO originated two qualified CD loans totaling $11.8 million in the broader statewide area that did not have P/M/F to serve any of the bank’s AAs in the state. These loans were originated to an SBIC and demonstrate a commitment to provide CD assistance throughout the state and were considered in the overall lending test performance for the state. Product Innovation and Flexibility FNBO offers flexible lending products that had a positive impact on the overall rating for this rated area. FNBO made 725 loans under the secured Visa Credit Card Loan Program, within the full-scope areas. Approximately 73.4 percent of the borrowers were classified low- or moderate-income and 16.4 percent were located in LMI geographies. For additional information, refer to the summary of innovative and flexible loan programs in the Other Factors – Lending Test section for a description of products offered bank-wide. Conclusions for Areas Receiving Limited-Scope Reviews Based on a limited-scope review, the bank’s performance under the lending test in the Rockford MSA is weaker than the bank’s overall “High Satisfactory” performance under the lending test in Illinois. Refer to the Tables 1 through 12 in the state of Illinois section of appendix D for the facts and data that support these conclusions. INVESTMENT TEST Conclusions for Areas Receiving Full-Scope Reviews Performance under the investment test is rated “Outstanding.” Based on full-scope reviews, the bank’s performance in the Chicago MD AA and the Elgin MD AA is excellent overall and enhanced by statewide investments. It is important to note that prior to 2014, the Chicago MD AA included DeKalb and Kane Counties, but subsequent to 2014, these counties are included in the Elgin MD AA. Under the Investment test, more weight is given to the Chicago MD AA, as it contained a majority of the bank’s deposits prior to the 2014 change. Refer to Table 14 in the state of Illinois section of appendix D for the facts and data used to evaluate the bank’s level of qualified investments. Chicago MD AA FNBO made 30 investments in the Chicago MD AA totaling $7.6 million during the evaluation period. Total investments represent 18.3 percent of allocated tier one capital and the level of investment is excellent. The bank’s responsiveness to CD needs in the AA is adequate. In terms of volume, 98.8 percent of the bank’s investments are mortgage-backed securities. A significant majority of the mortgage loan pools were comprised of home loans to LMI
Charter Number: 209
52
borrowers originated during the evaluation period. The underlying mortgages for these investments were loans originated to low- and moderate-income borrowers. Elgin MD AA FNBO made 25 investments in the Elgin MD AA totaling $2.3 million during the evaluation period. Total investments represent 2.3 percent of allocated tier one capital and the level of investment is adequate. The bank’s responsiveness to CD needs in the AA is adequate. In terms of volume, 95.2 percent of the bank’s investments are mortgage-backed securities. The underlying mortgages were originated to low- and moderate-income borrowers. A significant majority of the mortgage loan pools were comprised of home loans to LMI borrowers originated the during the evaluation period. The remaining 4.7 percent of the bank’s investments were grants to non-profit social service organizations and small business development corporations in support of affordable housing needs and economic development within the AA. Conclusions for Area Receiving Limited-Scope Reviews Performance under the investment test in the Rockford MSA AA is consistent with the bank’s overall “Outstanding” performance under the investment test in Illinois. Refer to the Table 14 in the state of Illinois section of appendix D for the facts and data that support these conclusions. Investments – IL Statewide
Statewide investments received positive consideration in the overall evaluation of performance in Illinois. In addition to qualified investments in the full- and limited-scope AAs during the evaluation period, the bank originated two investments totaling $5.5 million, including an unfunded portion of the investment, in the broader statewide area that has a P/M/F to serve one or more of the bank’s AAs in the state. Investments also include $242,000 in a prior period mortgage backed security. SERVICE TEST Conclusions for Areas Receiving Full-Scope Review The bank’s performance under the service test in Illinois is rated “Low Satisfactory”. The bank’s performance in the Chicago and the Elgin MDs is adequate. Retail Banking Services Refer to Table 15 in the state of Illinois section of appendix D for the facts and data used to evaluate the distribution of the bank’s branch delivery system and branch openings and closings. Chicago MD AA The bank’s branch distribution in the AA is poor. The bank’s branch distribution from September 30, 2010 to December 30, 2015 was poor; however, after overlaying a branch in a middle-income geography in close proximity to a low- or moderate-income census tract, performance improved slightly. Delivery systems were accessible to limited portions of the

Charter Number: 209
53
bank’s AA. There were no branches located in low- or moderate-income census tracts. The AA only includes eight branches and does not allow for quantitative analysis. To the extent changes have been made, FNBO’s opening and closing of branches has generally not adversely affected the accessibility of its delivery systems, particularly in low- and moderate-income geographies and /or low- and moderate-income individuals. One branch opening and one closing occurred during the evaluation period, both in middle-income census tracts. Bank management made the business decision to close the branch because of lower activity at the location in comparison to activity at other close proximity branches. Services and business hours within the full-scope AAs do not vary in a way that inconveniences portions of the AA, particularly low- and moderate-income geographies and individuals. Services offered and banking hours are comparable among locations regardless of the income level of the geography. Bank-wide, management complements its traditional service delivery methods with certain alternative delivery processes, including mobile and online banking services. These delivery methods provide increased access to banking services throughout all areas in the AA. While the bank maintained metrics regarding utilization rates beginning in 2014, we did not attribute significant emphasis to the effectiveness of these processes in measuring the extent the services help meet the financial and credit needs of low- or moderate-income individuals. Refer to the Other Factors section for a discussion of alternative delivery systems. Elgin MD AA The bank’s branch distribution in the AA is adequate. The bank’s branch distribution from 2014 and through 2015 was adequate. In addition, we noted a branch located in a middle-income geography within close proximity to a low- or moderate-income census tract that improved performance slightly and was adequate. Delivery systems were reasonably accessible to essentially all portions of the bank’s AA. There were no branches located in low-income census tracts. The percentage of branches in moderate-income census tracts was lower than the percentage of the population in those geographies. Only five branches are located in the AA and does not allow for quantitative analysis. There were no branch openings or closings in the AA during the evaluation period. Services and business hours within the full-scope AAs do not vary in a way that inconveniences portions of the AA, particularly low- and moderate-income geographies and individuals. Services offered and banking hours are comparable among locations regardless of the income level of the geography. Bank-wide, management complements its traditional service delivery methods with certain alternative delivery processes, including mobile and online banking services. These delivery methods provide increased access to banking services throughout all areas in the AA. While the bank maintained metrics regarding utilization rates during 2014, we did not attribute significant emphasis to the effectiveness of these processes in measuring the extent the services help meet the financial and credit needs of LMI individuals. Refer to the Other Factors section for a discussion of alternative delivery systems.

Charter Number: 209
54
Community Development Services The bank’s performance in providing CD services was good. In the Chicago MD AA, performance is adequate and in the Elgin MD AA performance was excellent. CD services focused on community services and affordable housing services targeted to LMI individuals, and support economic development initiatives. Bank employees participated in activities with a variety of organizations and partnerships benefitting LMI individuals, promoting economic development and affordable housing. Chicago MD AA In the Chicago MD AA, four FNBO employees provided their expertise to two different CD organizations that support community service, economic development, affordable housing, and economic development for a total of 210 volunteer hours throughout the evaluation period. This represents an adequate level of activities and responsiveness to the economic development needs of the community. Elgin MD AA In the Elgin MD AA, nine FNBO employees provided their expertise to twelve different CD organizations that support affordable housing, community services and economic development, for a total of 1,222 hours throughout the evaluation period. This represents an excellent level of activities and responsiveness to the CD needs of the community. In addition, all employees demonstrated their leadership by serving on the Board of Directors or as advisory committee members of all the organizations. One of these organizations was a local community college Small Business Development Company (SBDC certified by the Small Business Administration), offering services to local small businesses to address economic development needs within the AA. Conclusions for Areas Receiving Limited-Scope Reviews The bank’s performance under the service test in the Rockford MSA was stronger than the bank’s overall “Low Satisfactory” performance and is considered excellent. Performance differences in this area were based on stronger branch distribution and were not significant enough to impact the bank’s overall rating given the AA only has one branch that is located in a moderate-income census tract. Refer to Table 15 in the state of Illinois section of appendix D for the facts and data that support these conclusions.

Charter Number: 209
55
State of Iowa CRA Rating for Iowa: Satisfactory The lending test is rated: Low Satisfactory The investment test is rated: High Satisfactory The service test is rated: Low Satisfactory The major factors that support this rating include: • FNBO exited the market in 2013;
• The good geographic distribution of small loans to business reflects adequate penetration
throughout the assessment area, offsetting very poor mortgage loan geographic distributions;
• The borrower distributions reflect excellent performance among businesses of different
sizes and adequate performance to borrowers of different income levels; • No CD lending in the state; • A good level of qualifying investments, grants and donations that were responsive to CD
needs in the statewide area that have a purpose, mandate or function of serving the AA; and
• Delivery systems were reasonably accessible to essentially all portions of the assessment
area. Description of Institution’s Operations in Iowa FNBO had one AA in the state of Iowa, consisting of the Des Moines-West Des Moines MSA comprised of Dallas, Madison and Polk counties. The bank entered this market in June 2008 and operated with one branch and two deposit-taking ATMs in the AA. On July 26, 2013, the branch was closed. The branch closure was due to poor performance and business reasons. During the evaluation period, Iowa generated only less than 0.1 percent of FNBO’s total deposits as of June 30, 2013. FNBO reported $4.5 million in deposits as of June 30, 2013. There were no branch openings and the one branch closing during the review period. The branch closing marked FNBO’s exit from the state of Iowa. According to FDIC deposit market share data as of June 30, 2013, FNBO ranked 45th out of 46 depository financial institutions with a deposit market share of less than 0.1 percent in the AA. The banking industry is highly competitive in the AA and includes branches of national and regional banks, local community banks, and credit unions and other nonbank financial institutions. The five largest competitors in the AA include Wells Fargo Bank, N.A., Principal Bank, Bankers Trust Company, West Bank, and U.S. Bank National Association. Together, these five institutions command 63.3 percent of the deposit market share in the AA.

Charter Number: 209
56
Refer to the market profile for the state of Iowa in appendix C for detailed demographics and other performance context information for assessment areas that received full-scope reviews. Scope of Evaluation in Iowa For the state of Iowa, we completed a full-scope review of the Des Moines-West Des Moines MSA AA, with ratings based exclusively on this AA. Based on CRA reportable lending volumes, small business loans received more weight. For home mortgage loans, FNBO did not make a sufficient volume of home purchase and home improvement loans to allow for quantitative analysis. The volume of small farm and multifamily loans were not significant enough to provide a quantitative analysis. Consequently, these areas were not included in this evaluation. Lastly, greater emphasis was placed on the bank’s performance in 2012 through 2013 than performance in 2010 and 2011. As part of this performance evaluation, we reviewed two community contacts conducted in the AA. One was a small business lending organization and the other was a community development organization. Both contacts indicated a need for small business lending and affordable housing for low- and moderate-income individuals and these needs were considered in overall conclusions. Refer to the tables in appendix A for more information on the Iowa AA. LENDING TEST Conclusions for Areas Receiving Full-Scope Reviews The bank’s performance under the lending test in Iowa is rated “Low Satisfactory”. The bank’s performance in the Des Moines – West Des Moines MSA is adequate. Lending Activity The bank’s overall lending activity in the state of Iowa is good. Refer to Tables 1 Lending Volume in the state of Iowa section of appendix D for the facts and data used to evaluate the bank’s lending activity. FNBO’s lending activity in the Des Moines–West Des Moines MSA AA is good. Home mortgage lending activity and small business lending display reasonable lending levels overall in context of the limited operations in the AA. Although good within context, the levels do not represent a large volume of loans and the bank closed operations in this state which are negative factors when considering the lending activity levels. Lending levels are good for mortgage loans given the bank’s limited operations in this AA with one branch and limited deposits. Based on FDIC Deposit Market Share data as of June 30, 2013, FNBO had less than a 0.1 percent deposit market share and was ranked 45th out of 46 financial institutions. FNBO’s market penetrations for mortgage lending reflects reasonable performance when compared with the deposit market share. Based on 2013 peer mortgage

Charter Number: 209
57
data, competition for home purchase lending was strong, with 272 lenders in the AA. FNBO ranked 109th in home purchase lending with a market share of less than 0.1 percent. For home improvement lending, the bank ranked 86th out of 89 lenders and had a market share of 0.1 percent. Home refinance lending was also competitive in the AA, with 272 lenders in the AA. FNBO ranked 117th and had a market share of less than 0.1 percent. The small business lending activity is good, considering the scale of operations. Based on 2013 peer data, the top five lenders for small business lending activity consist of the nation’s largest lenders who collectively had 57.2 percent of the market share. FNBO ranked 18th among 68 lenders, with a market share of 1.1 percent. Distribution of Loans by Income Level of the Geography The geographic distribution of the bank’s lending in the Des Moines–West Des Moines MSA AA is adequate. Very poor home mortgage lending was offset by good small business lending. In performing our analysis, we placed emphasis on small business lending based on relative volumes. For home mortgage loans, there was an insufficient volume of home purchase and home improvement loans for quantitative analysis. The volume of small farm and multifamily loans were also not significant enough to provide a quantitative analysis. Consequently, these areas were not included in this evaluation. Lastly, greater emphasis was placed on the bank’s performance in 2012 through 2013 than its performance in 2010 and 2011. Home Mortgage Loans The geographic distribution of home mortgage loans is very poor. Refer to Tables 2, 3, 4, and 5 in the state of Iowa section of appendix D for the facts and data used to evaluate the geographic distribution of the bank’s home mortgage loan originations/purchases. The bank’s volume of home purchase and home improvement loans during the periods of 2012 through 2013 and 2010 through 2011 was low; therefore, we were unable to conduct a quantitative analysis based on the distributions. For the 2012-2013 review period, within the low- and moderate-income census tracts for these two products, the bank only extended one home improvement loan. The geographic distribution of home refinance loans is very poor. The bank’s geographic distribution of home refinance loans from 2012 through 2014 was very poor. No loans were made in low- or moderate-income census tracts and the bank had no market share for home refinance loans in these income categories. Small Loans to Businesses The geographic distribution of small loans to businesses is good. Refer to Table 6 in the state of Iowa section of appendix D for the facts and data used to evaluate the geographic distribution of the bank’s origination/purchase of small loans to businesses.

Charter Number: 209
58
The geographic distribution of small loans to businesses is good. The bank’s geographic distribution of small loans to businesses from 2012 through 2013 was good. The percentage of small loans made in low-income geographies was near to the percentage of businesses in those geographies. The percentage of small loans made in moderate-income geographies was somewhat lower than the percentage of businesses in those geographies. In addition, the bank’s market share in both the low- and moderate-income census tracts near to the bank’s market share in those geographies. The bank’s performance in 2010 through 2011 was consistent with 2012 through 2013 performance. Lending Gap Analysis We reviewed summary reports and maps, and analyzed the bank’s home mortgage and small business lending activity over the evaluation period to identify any gaps in the geographic distribution of loans. We did not identify any unexplained conspicuous gaps. Distribution of Loans by Income Level of the Borrower The borrower distribution of the bank’s lending is good. In performing our analysis, we placed less emphasis on home mortgage and more emphasis on small business loans, based on relative volume. For home mortgage loans, FNBO did not originate a sufficient volume of home purchase and home improvement loans to allow for quantitative analysis. The volume of small farm and multifamily loans were also insufficient to provide a quantitative analysis. Consequently, these areas were not included in this evaluation. The lack of revenue information for a large portion of loans to small businesses hinders the meaningfulness of the borrower distribution analysis for that product. Due to the significant level of loans reported without revenue information, our conclusions are based primarily on available data as displayed in appendix D for loans by original amount regardless of business size. Conclusions were based also on loan size as a proxy for the distribution analysis for lending to small businesses and lending to small farms. Greater emphasis was placed on the bank’s performance in 2012 through 2013 rather than its performance in 2010 and 2011. Home Mortgage Loans Refer to Tables 8, 9 and 10 in the state of Iowa section of appendix D for the facts and data used to evaluate the borrower distribution of the bank’s home mortgage loan originations and purchases. The borrower distribution of home mortgage loans is adequate, based on refinance loan performance. For home refinance loans originated in 2012 through 2013, the percentage of loans to low-income borrowers was significantly lower than the percentage of low-income families. The percentage of moderate-income borrowers exceeded the percentage of moderate-income families. The bank’s market share of loans to low-income borrowers exceeded the overall market share and the bank had no measurable moderate-income market share. The bank’s performance in 2011 through 2012 was consistent with the performance noted from 2012 through 2013.

Charter Number: 209
59
Small Loans to Businesses Refer to Table 11 in the state of Iowa section of appendix D for the facts and data used to evaluate the borrower distribution of the bank’s origination and purchase of small loans to businesses. The distribution of small loans to businesses is excellent. In evaluating the distribution of small loans to businesses, we noted that credit card loans represent a significant volume of reportable small loans to businesses. FNBO does not collect revenue information on credit card loans to businesses inhibiting our ability to analyze business lending by borrower characteristic. Revenues were not collected on approximately 71.4 percent of the reportable loans for 2012 through 2013 and 69.2 percent of the reportable loans in 2010 through 2011. The percentage of small loans to businesses with an original amount of $100,000 or less exceeded the percentage of businesses with revenues of $1 million or less in the AA. The bank’s market share for small business loans with revenues less than $1 million was lower than its overall market share for small loans to business. The bank’s performance in 2010 through 2011 was consistent with the performance noted from 2012 through 2013. Community Development Lending FNBO did not make any CD loans during this evaluation period and had a neutral impact on the bank’s overall lending test rating. Product Innovation and Flexibility Refer to the description of innovative and flexible loan programs summarized in the Other Factors – Lending Test section for a description of products offered bank-wide. Flexible lending has a neutral impact for lending conclusions in this AA. INVESTMENT TEST Conclusions for Areas Receiving Full-Scope Reviews The bank’s performance under the investment test in Iowa is “High Satisfactory.” The bank operates with a good level of investments in the Des Moines – West Des Moines MSA. Refer to Table 14 in the state of Iowa section of appendix D for the facts and data used to evaluate the bank’s level of qualified investments. Investments – IA Statewide FNBO made one investment totaling $2 million in the statewide area that includes the bank’s AA, representing 368.3 percent of allocated June 30, 2013 tier one capital for the AA.
The $2 million equity investment is in an Iowa Low-Income Housing Tax Credit Fund syndicated through Midwest Housing Equity Group with a P/M/F to serve the bank’s AA. The fund’s portfolio includes a project in the AA that provides 33-units for low-income elderly tenants.

Charter Number: 209
60
Affordable housing activities are responsive to an identified need in the AA. Our conclusion considered the qualifying investment made in the statewide area. SERVICE TEST Conclusions for Areas Receiving Full-Scope Reviews The bank’s performance under the service test in Iowa is “Low Satisfactory.” Based on a full-scope review, the bank’s performance in the Des Moines-West Des Moines IA AA was adequate. Retail Banking Services Refer to Table 15 in the state of Iowa section of appendix D for the facts and data used to evaluate the distribution of the bank’s branch delivery system and branch openings and closings. Prior to the July 26, 2013 branch closure, the bank’s branch distribution in the AA was adequate. The bank operated one branch in the AA, located in a low- income census tract. The branch location was accessible to geographies and individuals of different income levels within the AA, considering the bank’s limited presence. The bank’s line of products and services were available at this location, with the exception of mortgage loans, which the branch discontinued originating in 2009. FNBO opened the office on June 30, 2008, as the bank’s only physical presence in this market. On July 26, 2013, management closed the branch due to poor performance, which has significantly adversely affected the accessibility of its delivery systems. Management complemented its traditional service delivery methods with certain alternative delivery processes, including online banking, mobile banking, and telephone banking. Refer to the Other Factors section for a discussion of alternative delivery systems. Community Development Services The bank’s performance in providing CD services was very poor. FNBO provided few CD services during the evaluation period.

Charter Number: 209
61
State of Kansas CRA Rating for Kansas: Satisfactory The lending test is rated: Low Satisfactory The investment test is rated: Outstanding The service test is rated: Needs to Improve The major factors that support this rating include: • An adequate level of lending that is based on an adequate level for home mortgage loans
and small loans to businesses;
• Adequate geographic distribution, as shown by an adequate distributions for home mortgage loans and loans to small businesses;
• Good borrower distribution, as evidenced by a combination of good home mortgage
performance and excellent lending to small businesses performance;
• CD lending levels had a neutral impact on the overall lending test performance in the state;
• An excellent level of qualified investments that were responsive to community needs, as evidenced by excellent performance in the full-scope AA and augmented by statewide investments;
• A branch distribution that was accessible to limited portions of the bank’s assessment area;
and
• A limited level of CD services were responsive to community needs.
Description of Institution’s Operations in Kansas FNBO has one AA in the state of Kansas. The AA consists of Johnson County, Kansas, which is a part of the Kansas City MO-KS MMSA. FNBO has six branches within the state, representing 5.9 percent of the bank’s total branch network. FNBO closed one branch in the Kansas City, KS MSA AA in 2011. There were no branch openings in the AA during the evaluation period. FNBO has six deposit-taking ATMs within the state, representing 6.1 percent of the bank’s total ATM network. Strong competition exists for financial services within the Kansas City KS MSA AA. The bank ranked sixth of 62 depository financial institutions in the AA, with a 4.7 percent market share and $741.4 million in deposits in the June 30, 2014 FDIC Deposit Market Share Report. Competition includes large nationwide institutions and several regional banks. The top five competitors, in order of their ranking, are Capitol Federal Savings Bank; U.S. Bank, N.A.; Commerce Bank; Bank of America, N.A.; and Wells Fargo Bank, N.A. These competitors control 42.7 percent of the deposit share within the AA.

Charter Number: 209
62
Refer to the market profile for the state of Kansas in appendix C for detailed demographics and other performance context information for assessment areas that received full-scope reviews. Scope of Evaluation in Kansas For the state of Kansas, we completed a full-scope review of the Kansas City KS MSA AA. We placed equal emphasis on the bank’s home mortgage lending and small business lending. Within mortgage lending, more emphasis was placed on home purchase and home refinance loans based on lending volumes. We reviewed two community contacts conducted in the AA. One contact was with a community development corporation, and indicated a financing need for revitalization of low- and moderate-income areas. The other contact represented a housing organization and indicated a need for financial institutions to participate in affordable housing programs. These identified needs were considered in the evaluation of the Kansas performance. Refer to the tables in appendix A for more information on the Kansas City KS MSA AA. LENDING TEST Conclusions for Areas Receiving Full-Scope Reviews The bank’s performance under the lending test in the state of Kansas is rated “Low Satisfactory.” Based on a full-scope review, the bank’s performance in the Kansas City KS MSA is adequate. Lending Activity FNBO’s lending activity in the Kansas City KS MSA AA is adequate. Home mortgage lending activity is good and small business lending activity is adequate. Refer to Table 1 Lending Volume in the state of Kansas section of appendix D for the facts and data used to evaluate the bank’s lending activity. FNBO had a deposit market share of 4.7 percent and ranked sixth among 62 depository institutions in the AA based upon FDIC Deposit Market Share data as of June 30, 2014. Mortgage lending activity is adequate. Competition for home purchase lending was very strong, with 329 lenders in the AA. FNBO was ranked 28th in home purchase lending with a market share of less than one percent. For home improvement lending, the bank was ranked eighth among 106 lenders with a market share of 3.8 percent. For home refinance lending, the bank was ranked 34th of 278 lenders with a market share of less than one percent. The small business lending activity is adequate given the bank’s market share and ranking when compared to the deposit market share and small business lending competition within the AA. Based on 2014 peer data, the top five lenders for small business lending activity consist of the nation’s largest credit card lenders who collectively have a 59.6 percent market share.

Charter Number: 209
63
FNBO ranked 15th among 101 lenders with a market share of 1.7 percent. Individual market shares of these larger credit card lenders ranged from 5.9 percent to 22.8 percent. Distribution of Loans by Income Level of the Geography The geographic distribution of the bank’s lending is adequate. Home mortgage performance was adequate and small loans to businesses was also adequate. In performing our analysis, we placed equal emphasis on the bank’s home mortgage and small business lending. Within home mortgage lending, we placed greater emphasis on home purchase and home refinance loans based on the amount of originations during the evaluation period. In addition, we placed more emphasis on the bank’s performance in 2012 through 2014 rather than its performance in 2010 through 2011. Home Mortgage Loans Refer to Tables 2, 3, 4, and 5 in the state of Kansas section of appendix D for the facts and data used to evaluate the geographic distribution of the bank’s home mortgage loan originations/purchases. In the Kansas City, KS MSA AA, low-income census tracts contained only 0.3 percent, or 422 units, of the total owner-occupied housing units in the AA based on 2010 U.S. Census data; in addition, there were no low-income census tracts in the AA based on the 2000 U.S. Census. Moderate-income census tracts contained less than 1 percent of the total owner-occupied housing units in the AA, based on the 2000 U.S. Census. That percentage increased to 7.5 percent, or 11,400 units, in 2010 with the increase in the number of moderate-income tracts. Due to competition and the low number of housing units in low-income census tracts throughout the evaluation period, the bank had somewhat limited opportunities for home mortgage lending. The geographic distribution of home purchase loans is adequate. The bank’s geographic distribution of home purchase loans from 2012 through 2014 reflects adequate penetration throughout the assessment area. There were no home purchase loans in low-income census tracts and this is reasonable given competition and the low number of owner-occupied units in this portion of the AA. The percentage of loans in moderate-income geographies was somewhat lower than the percentage of owner-occupied units in these geographies and represents an adequate penetration. The bank’s market share in moderate-income census tracts was somewhat lower than its overall market share for home purchase loans, but is adequate. The bank’s performance in 2010 through 2011 was weaker than the performance noted from 2012 through 2014 and considered poor. No home purchase loans were made in moderate-income geographies, but the low number of housing units in that portion of the AA mitigates the low penetration due to limited lending opportunities for home loans. The geographic distribution of home improvement loans is poor. The bank’s geographic distribution of home improvement loans from 2012 through 2014 was poor. No home improvement loans were originated in low-income census tracts. The percentage of loans in moderate-income geographies was lower than the percentage of owner-occupied units in these geographies. The bank’s market share in moderate-income census tracts was lower than its overall market share for home improvement loans. The bank’s geographic distribution

Charter Number: 209
64
of home improvement loans from 2010 through 2011 was based on a low level of loans; therefore, we were unable to conduct a quantitative analysis. The geographic distribution of home refinance loans is adequate. The bank’s geographic distribution of home refinance loans from 2012 through 2014 was adequate. The percentage of loans in low-income geographies exceeded the percentage of owner-occupied units in these geographies but only represented one loan, while the percentage of loans in moderate-income geographies was somewhat lower than the percentage of owner-occupied units in these geographies. The bank did not have a market share in low-income census tracts for home refinance loans. The bank’s market share in moderate-income census tracts exceeded its overall market share for home refinance loans. The bank’s performance in 2010 through 2011 was consistent than the performance noted from 2012 through 2014. Small Loans to Businesses Refer to Table 6 in the state of Kansas section of appendix D for the facts and data used to evaluate the geographic distribution of the bank’s origination/purchase of small loans to businesses. The geographic distribution of small loans to businesses is adequate. The bank’s geographic distribution of small loans to businesses in 2012 through 2014 was adequate. The bank did not make any loans in the low-income geographies. The percentage of small loans to businesses made in moderate-income geographies was near to the percentage of businesses in those geographies and considered good. In addition, while the bank did not have a market share in low-income census tracts, the bank’s market share in moderate-income census tracts exceeded the overall market share. The bank’s performance in 2010 through 2011 was weaker than the performance noted from 2012 through 2014 and considered poor. The percentage of small loans made in moderate-income geographies was lower than the percentage of businesses in those geographies. In addition, the bank’s market share in moderate-income census tracts was lower than its overall market share. Lending Gap Analysis We reviewed summary reports and maps, and analyzed FNBO’s home mortgage and small business lending activity over the evaluation period to identify any gaps in the geographic distribution of loans. We did not identify any unexplained conspicuous gaps. Distribution of Loans by Income Level of the Borrower The borrower distribution of the bank’s lending is good. Home mortgage performance and small loans to businesses is good. As noted previously, we placed equal emphasis on the bank’s home mortgage and small business lending. Within the home mortgage loans, we gave more emphasis to home purchase loans and home refinance loans based on the volume of originations during the evaluation period. Based on the median housing value, the cost of purchasing a home would be prohibitive based on the maximum low-income family annual income and this was factored into conclusions. In addition, we attributed more emphasis to the bank’s 2012 through 2014 performance rather than 2010 through 2011 performance.

Charter Number: 209
65
Home Mortgage Loans The borrower distribution of home mortgage loans is good. Home ownership can be difficult due to high median housing prices compared to median family incomes for low-income families. According to the 2010 U.S. Census, the median housing value was $224,105, representing a significant increase from the 2000 U.S. Census median housing value of $157,354 and the high cost relative to income indicates limited mortgage lending opportunities to low-income borrowers. Refer to Tables 8, 9 and 10 in the state of Kansas section of appendix D for the facts and data used to evaluate the borrower distribution of the bank’s home mortgage loan originations and purchases. The borrower distribution of home purchase loans is good. The bank’s borrower distribution of home purchase loans from 2012 through 2014 was good. The percentage of loans to low-income borrowers was lower than the percentage of low-income families and is adequate in context of the housing costs impact on low-income borrowers. The percentage of loans made to moderate-income borrowers exceeded the percentage of moderate-income families. The bank’s market share of loans to low-income borrowers was near its overall market share for home purchase loans. The bank’s market share of loans to moderate-income borrowers was somewhat lower than its overall market share for home purchase loans emphasis. The bank’s performance in 2010 through 2011 was consistent with the performance noted from 2012 through 2014. The borrower distribution of home improvement loans is good. The bank’s borrower distribution of home improvement loans from 2012 through 2014 was good. The percentage of loans to low-income borrowers was lower than the percentage of low-income families, but the challenges of home ownership based on housing costs mitigates the penetration level and performance is considered adequate. The percentage of moderate-income borrowers exceeded the percentage of moderate-income families. The bank’s market share of loans to low- and moderate-income borrowers exceeded its overall market share for home improvement loans and is considered excellent. The bank’s borrower distribution of home improvement loans from 2010 through 2011 was based on low lending volumes; therefore, we were unable to conduct a quantitative analysis. The borrower distribution of home refinance loans is adequate. The bank’s borrower distribution of home refinance loans from 2012 through 2014 was adequate. The percentage of loans to low-income borrowers was lower than the percentage of low-income families and is poor even given the mitigating factor of home ownership challenges for low-income borrowers. The percentage of loans made to moderate-income borrowers exceeded the percentage of moderate-income families and is good. The bank did not have a market share of loans to low-income borrowers. The bank’s market share of loans to moderate-income borrowers exceeded its overall market share for home refinance loans. The bank’s performance in 2010 through 2011 was consistent with performance noted from 2012 through 2014.

Charter Number: 209
66
Small Loans to Businesses
Refer to Table 11 in the state of Kansas section of appendix D for the facts and data used to evaluate the borrower distribution of the bank’s origination and purchase of small loans to businesses. The bank does not collect revenue information for business credit cards. Credit cards loans account for a significant portion of the bank’s small loans to businesses activity. The lack of this information inhibits our ability to analyze small loans to businesses and conclusions are based on known data as displayed in appendix D. For the period from 2012 to 2014, the bank reported 53.1 percent of small loans to businesses without revenue information. Similarly, for 2010 to 2011, the bank reported 53.3 percent of small loans to businesses without revenue information. Due to the significant level of loans reported without revenue information, our conclusions are based primarily on available data as displayed in appendix D for loans by original amount regardless of business size. Conclusions were based on loan size as a proxy for the distribution analysis for lending to small businesses and lending to small farms. The borrower distribution of small loans to businesses is excellent. The bank’s borrower distribution of small loans to businesses from 2012 through 2014 was excellent. The percentage of small loans to businesses with an original amount of $100,000 or less significantly exceeded the percentage of small businesses. The bank’s market share of loans to small businesses was somewhat lower than its overall market share of loans to small businesses and is adequate. The bank’s performance in 2010 through 2011 was consistent with the performance noted from 2012 through 2014. Community Development Lending In Kansas, CD lending had a neutral impact on the overall lending test rating. Refer to Table 1 Lending Volume in the state of Kansas section of appendix D for the facts and data used to evaluate the bank’s level of CD lending. The bank originated one loan to a housing coalition for affordable housing totaling $52,000. This volume represented less than 0.1 percent of tier one capital allocated to the AA. Product Innovation and Flexibility FNBO offers flexible lending products that had a positive impact on the overall rating for this rated area. FNBO made 191 loans under the secured Visa Credit Card Loan Program, in the full-scope area. Approximately 63.3 percent of the borrowers were classified low- or moderate-income and 7.3 percent were located in LMI geographies. For additional information, refer to the summary of innovative and flexible loan programs in the Other Factors – Lending Test section for a description of products offered bank-wide. INVESTMENT TEST The bank’s performance under the investment test in the state of Kansas is rated “Outstanding.” Based on our full-scope review, and augmented by statewide investments, the bank’s performance in the Kansas City, KS MSA AA was excellent.

Charter Number: 209
67
Refer to Table 14 in the state of Kansas section of appendix D for the facts and data used to evaluate the bank’s level of qualified investments. Conclusions for Areas Receiving Full-Scope Reviews Based on our full-scope review, the bank’s performance in the Kansas City, KS MSA AA was excellent. FNBO made 25 investments in the AA, totaling $7.9 million during the evaluation period. We considered the ongoing impact that investments made prior to the current evaluation period had within the AA, as well. One prior period investment totaling $625 thousand was in the bank’s AA for economic development. When considering both current and prior period investments, the total of $8.6 million represents 10.4 percent of allocated tier one capital for the AA. The level of investment is excellent. The bank’s responsiveness to the CD needs in the AA is good. In terms of total dollar volume, 89.1 percent of the bank’s investments included government sponsored mortgage-backed securities. FNBO invested $7 million in government sponsored mortgage-backed securities where the underlying mortgages were originated to low- and moderate-income borrowers. A significant majority of the mortgage loan pools were comprised of home loans to LMI borrowers originated the during the evaluation period. FNBO engages in a strategic grant-making process that allows the bank to proactively partner with organizations to implement programs and services that achieve the bank’s community goals. The portfolio of investments also includes 13 grants totaling $204 thousand ranging from $1,200 to $25,000 primarily for community service purposes that are responsive to AA needs. Investments – KS Statewide Two investments were made during the evaluation period that benefited the state of Kansas totaling $4.2 million. Of the $4.2 million, $10 thousand had a P/M/F that benefits the AA. This investment supported economic development through a grant to provide career training to low- and moderate-income individuals. The remaining statewide investment did not have a P/M/F that potentially benefits the AA. This investment supported affordable housing through Low Income Housing Tax Credits. Statewide investments represented 5 percent of the allocated tier one capital to AA. Our conclusion considered the qualifying investment made in the statewide area to have a positive impact on investment test conclusions. SERVICE TEST Conclusions for Areas Receiving Full-Scope Reviews FNBO’s performance under the service test in the state of Kansas is rated “Needs to Improve.” The bank’s performance in the Kansas City KS MSA is poor.

Charter Number: 209
68
Retail Banking Services Refer to Table 15 in the state of Kansas section of appendix D for the facts and data used to evaluate the distribution of the bank’s branch delivery system and branch openings and closings. FNBO’s branch distribution in the AA is poor. The branch distribution from September 30, 2010 to December 31, 2015 is poor. Branches were accessible to limited portions of the bank’s assessment area. There were no branches located in low- or moderate-income geographies, but the percentage of population, or 58,800 individuals, that reside in low- and moderate-income geographies was low at 0.7 and 10.1 percent, respectively. There was one branch located in an upper-income census tract located within a half mile of a moderate-income census tract that was reasonably accessible. This branch provided positive consideration in the overall branch distribution evaluation in the AA. Branch openings and closings have not adversely affected the accessibility of the bank’s delivery systems to low- and moderate-income geographies or individuals. One AA branch was closed in 2011 that was located in an upper-income census tract. The College Boulevard branch was closed due to poor financial performance and because another branch was located in close proximity to the branch. FNBO’s hours and services do not vary in a way that inconvenience portions of the AA, particularly low- and moderate-income individuals, although access may be limited by lack of branches. Services offered and hours of operation are comparable among locations regardless of the income level of the geography. Bank-wide, management complements its traditional service delivery methods with certain alternative delivery processes, including online banking, mobile banking, six deposit-taking ATMs and telephone banking. These delivery methods provide increased access to banking services throughout all areas in the AA. The bank maintained metrics regarding utilization rates starting in 2014; however, we did not attribute significant emphasis to the metrics measuring how well the services help to meet the financial and credit needs of low- or moderate-income individuals. Refer to the Other Factors section for a discussion of alternative delivery systems. Community Development Services FNBO’s CD services performance in the Kansas City KS MSA AA is poor. The institution provided a limited level of CD services that were responsive to identified needs in the AA. Two bank employees provided their expertise by serving as board members to two CD organizations, which focused on economic development and affordable housing in the AA.

Charter Number: 209
69
State of Nebraska CRA Rating for Nebraska: Outstanding The lending test is rated: Outstanding The investment test is rated: Outstanding The service test is rated: High Satisfactory The major factors that support this rating include: • An excellent level of lending for home mortgage loans and small loans to businesses
overall that is based on excellent levels in the non-MSA Counties AA and in the Lincoln MSA AA;
• Overall good geographic distribution, as evidenced by adequate home mortgage loan
performance, adequate small loans to businesses performance and excellent small loans to farms performance in the non-MSA Counties AA;
• Good borrower income distribution, as evidenced by excellent performance for small loans
to small businesses, adequate home mortgage performance along with good lending to small farms performance in the non-MSA Counties AA;
• A significantly positive level of CD loans that were responsive to community needs, in both
the Non-MSA Counties AA and the Lincoln MSA AA; • An excellent level of qualified investments that were responsive to community needs, as
evidenced by excellent performance in the full-scope AAs and augmented by statewide investments;
• A branch distribution that was accessible to LMI individuals and geographies; and • A good level of CD services that was responsive to community needs based on activities
within the full-scope AAs and statewide activities. Description of Institution’s Operations in Nebraska FNBO has four AAs within the State of Nebraska including two MSAs and two rural AAs. These AAs include:
• the Non-MSA Counties AA, comprised of 18 counties: Box Butte, Buffalo, Colfax, Dawes, Dawson, Dodge, Hooker, Kearney, Lincoln, Madison, McPherson, Morrill, Phelps, Platte, Polk, Scotts Bluff, Sheridan and Sioux Counties;
• the Lincoln MSA AA, comprised of Lancaster County; • Gage and Butler Counties AA; and • the Grand Island MSA AA, that includes only Hall County.

Charter Number: 209
70
FNBO provides a full range of loan and deposit products to all AAs. FNBO has 22 branches within the state, representing 21.4 percent of the bank’s total branch network. There was one branch opening and one branch closing in the state during the evaluation period. FNBO had 26 deposit-taking ATMs within the AAs, representing 26.5 percent of the bank’s total ATM network. As of June 30, 2014, the bank ranked second in the state in deposits, representing a 10 percent market share. FNBO’s statewide deposits totaled $1.8 billion. The NE Non-MSA Counties AA is the bank’s most significant AA in the state, accounting for 75.9 percent of the state’s deposits. Non-MSA Counties AA The banking industry is competitive in the AA with 64 financial institutions, comprised of national and regional banks, local community banks, and other nonbank financial institutions. FNBO ranked first in the AA with $1.4 billion in deposits, representing a 15.3 percent market share according to the June 30, 2014 FDIC Market Share Report. The five largest competitors in the AA include Pinnacle Bank, Elkhorn Valley Bank & Trust, Wells Fargo Bank, Great Western Bank and Platte Valley Bank. Lincoln MSA AA The banking industry is competitive in the AA and includes branches of national and regional banks, local community banks, and other nonbank financial institutions. In the AA, FNBO had a deposit market share of 4.3 percent, as of June 30, 2011 FDIC Market Share Report, and ranked eighth among 25 depository institutions. According to June 30, 2014 report, FNBO’s deposit market decreased to 3.4 percent, while remaining the eighth of 24 depository institutions. FNBO had total deposits of $215.3 million, representing 11.9 percent of the total deposits in the state and 1.5 percent of total bank deposits. The five largest competitors in the AA include Union Bank & Trust Company, Wells Fargo Bank, U.S. Bank, Pinnacle Bank and Cornhusker Bank. Gage and Butler Counties AA The banking industry is moderately competitive in the AA with 14 financial service providers with branches in the AA as of June 30, 2014. FNBO ranked second in AA deposits of $154.7 million, representing a 17.5 percent of market share. In 2011, FNBO held 19.3 percent market share, with slightly lower deposits that totaled $149.9 million. The five largest competitors in the AA include Security First Bank, Pinnacle Bank, Bank of the Valley, U.S. Bank, First State Bank of Nebraska. Grand Island MSA AA The banking industry is moderately competitive in the AA with 14 financial service providers with branches in the AA as of June 30, 2014. FNBO had total deposits of $64 million and ranked eighth in AA deposits, representing a 3.6 percent of market share. The five largest competitors in the AA include Five Points Bank, Wells Fargo Bank, Home Federal Savings & Loan Association of Grand Island, Exchange Bank, and Equitable Bank. Refer to the market profiles for the state of Nebraska in appendix C for detailed demographics and other performance context information for assessment areas that received full-scope reviews.

Charter Number: 209
71
Scope of Evaluation in Nebraska We completed a full-scope review of the Non-MSA Counties AA and the Lincoln MSA AA. The Gage and Butler Counties AA and Grand Island MSA received limited-scope reviews. The Non-MSA Counties AA and the Lincoln MSA AA received full-scope reviews due to the high percentage of deposits in these areas with 75.9 percent and 11.9 percent, respectively. These AAs also had the largest volume of total reportable loans in the state as follows: The Non-MSA Counties AA with 48.9 percent and Lincoln MSA AA with 23.7 percent. These two AAs included the majority of the Nebraska branches, and the Non-MSA Counties AA had 63.6 percent (14 branches) and Lincoln MSA AA had 22.7 percent (5 branches). Ratings are based primarily on results of the full-scope areas. The Non-MSA Counties AA received the most emphasis on final ratings because this AA had the largest percent of the bank’s deposits, loans, and branches in Nebraska. The volume of multifamily loans was not significant enough to provide a quantitative analysis. We reviewed two community contacts conducted in the state of Nebraska. The community contact in the Lincoln MSA AA was a local housing agency, which indicated a need for affordable housing for low- and moderate-income individuals. The community contact conducted in the Non-MSA Counties AA was to an agriculture-related agency, which indicated a need for agricultural-related credit, as well as multi-family apartments and affordable housing for low- and moderate-income individuals. These identified needs were considered in the performance analysis. Refer to the tables in appendix A for more information on the Nebraska AAs. LENDING TEST Conclusions for Areas Receiving Full-Scope Reviews The bank’s performance under the lending test in Nebraska is rated “Outstanding”. The bank’s performance in the Non-MSA Counties AA and the Lincoln MSA AA are both excellent. Lending Activity The bank’s lending activity in the state of Nebraska is excellent, considering the competition for all types of loans in the bank’s AAs. FNBO demonstrated excellent responsiveness to credit needs within the Non-MSA Counties AAs and good performance in the Lincoln MSA AA. Refer to Table 1 Lending Volume in the state of Nebraska section of appendix D for the facts and data used to evaluate the bank’s lending activity. Non-MSA Counties AA FNBO’s lending activity in the Non-MSA Counties AA is excellent. Both home mortgage lending activity and small business/small farm lending activity are excellent. Competition for home purchase lending was moderate, with 144 lenders in the AA based on 2014 peer mortgage data. FNBO ranked fifth in home purchase lending with a 6.5 percent

Charter Number: 209
72
market share. For home improvement lending, the bank ranked first with a 23.2 percent market share. Home refinance lending was also competitive with 129 total lenders in the AA. FNBO ranked third in home refinance lending with an 8.5 percent market share. Small business and small farm lending activity were excellent in 2014 given the bank’s market share and ranking compared to the lending competition within the AA. Based on 2014 peer data, the top five small business lenders accounted for 59.3 percent of the market share. FNBO ranked first among 44 small business lenders, with a 16.3 percent market share. In small farm lending, the top five lenders account for 86.6 percent of the market share. FNBO ranked second among 23 small farm lenders, with a 30.8 percent market share. Lincoln MSA AA Lending activity in the Lincoln MSA AA was good. Home mortgage lending and loans to small businesses were all good. Mortgage lending activity for 2014 is good. For home purchase lending in 2014, FNBO ranked 5th with 157 lenders in the AA and had 6.5 percent market share. For home improvement lending, the bank ranked eighth with a 3.3 percent market share. Home refinance lending was also competitive with 144 total lenders in the AA. FNBO ranked 17th with a 1.8 percent market share. Small business lending activity is good, given the bank’s market share and ranking compared to the deposit market share and lending competition within the AA. The top five small business lenders accounted for 58.8 percent of the market share based on 2014 peer data. FNBO ranked tenth among 42 small business lenders, with a 3 percent market share. FNBO did not have a sufficient volume of small farm originations or purchases to allow for a quantitative analysis. Distribution of Loans by Income Level of the Geography The geographic distribution of the bank’s lending is good. Adequate home mortgage and small business lending performance was augmented by excellent performance small farm lending. In performing our analysis, we placed greater emphasis on the bank’s small business and small farm lending as these loans represented the majority of the bank’s CRA reportable lending activity. Within home mortgage lending, we placed greater emphasis on home purchase loans and home refinance loans based on the amount of originations during the evaluation period. In addition, we placed more emphasis on the bank’s performance in 2012 through 2014 than its performance in 2010 through 2011. For the Non-MSA Counties AA, there was a shorter evaluation period from April 1, 2014 through December 31, 2014. Home Mortgage Loans The geographic distribution of home mortgage loans is adequate. Geographic distribution performance in the Non-MSA AA was very poor, while performance in the Lincoln MSA was good. Refer to Tables 2, 3, 4, and 5 in the state of Nebraska section of appendix D for the facts and data used to evaluate the geographic distribution of the bank’s home mortgage loan originations and purchases.

Charter Number: 209
73
Non-MSA Counties AA The geographic distribution of home mortgage loans is adequate. The bank had limited opportunities for home mortgage lending in low- and moderate-income census tracts, considering demographics and competition. The AA had no low-income census tracts and had limited housing units in the moderate-income portion. According to data obtained in the 2010 U.S. Census, moderate-income census tracts contained only 5 percent of total owner-occupied housing, representing approximately 4,200 units. The geographic distribution of home purchase loans was adequate. The percentage of loans in moderate-income geographies was lower than the percentage of owner occupied units in these geographies, but is reasonable. The bank’s market share in moderate-income census tracts was also lower than its overall home purchase loan market share. The geographic distribution of home improvement loans was adequate. The percentage of loans in moderate-income geographies was lower than the percentage of owner-occupied units in these geographies but is a reasonable penetration. The bank’s market share in moderate-income census tracts was lower than its overall home improvement loan market share. The geographic distribution of home refinance loans was poor. The percentage of loans in moderate-income geographies was lower than the percentage of owner-occupied units in these geographies. The bank’s market share in moderate-income census tracts was lower than its overall home refinance loan market share. Lincoln MSA AA The geographic distribution of home mortgage loans was good. In the Lincoln MSA AA, somewhat limited opportunities exist to make mortgage loans in the low-income census tracts due to competition and a low number of owner-occupied housing units. The geographic distribution of home purchase loans was good. The bank’s geographic distribution of home purchase loans from 2012 through 2014 was good. The percentage of loans in low-income and moderate-income geographies was somewhat lower than the percentage of owner-occupied units in these geographies. FNBO’s market share during the period was excellent. The bank’s market share in low- and moderate-income geographies exceeded the overall market share. Performance from 2010 through 2011was stronger than performance noted from 2012 through 2014 and considered excellent. The percentage of loans in low-income geographies exceeded the percentage of owner-occupied units, while the percentage of loans in moderate-income geographies was near to the percentage of owner-occupied units. For home improvement loans, the geographic distribution is poor. The bank’s geographic distribution of home improvement loans from 2012 through 2014 was poor. The percentage of loans in low-income geographies was near to the percentage of owner-occupied units in the AA and represents good performance. The percentage of loans was significantly lower than the percentage of owner occupied units in moderate-income geographies and considered poor. Market share analysis indicates poor performance. FNBO did not have a measurable market share in low-income geographies. The market share in moderate-income geographies was lower than FNBO’s overall market share for home improvement loans. For 2010 through
Charter Number: 209
74
2011, FNBO did not originate a sufficient number of home improvement loans in the AA to perform a quantitative analysis of lending performance and this has a negative impact on conclusions. The geographic distribution of home refinance loans is adequate. This conclusion considers good performance for 2012-2014 combined with very poor performance for 2010-2011. The bank’s geographic distribution of home refinance loans from 2012 through 2014 was good. The percentage of loans in low-income geographies was near to the percentage of owner-occupied units in these geographies. The percentage of loans in moderate-income geographies was somewhat lower than the percentage of owner occupied units in these geographies. The market share in both low-income and moderate-income geographies was excellent, as the market share in these geographies exceeded the bank’s overall market share for home refinance loans. For 2010 through 2011, performance was weaker than performance noted from 2012 through 2014 and considered very poor. Geographic distribution in both low- and moderate-income census tracts was significantly lower than the respective owner-occupied units. Small Loans to Businesses The geographic distribution of small loans to businesses is adequate. Performance in the Non-MSA Counties AA was poor, while performance in the Lincoln MSA AA was good. Refer to Tables 6 in the state of Nebraska section of appendix D for the facts and data used to evaluate the geographic distribution of the bank’s origination/purchase of small loans to businesses. Non-MSA Counties AA The geographic distribution of small loans to businesses is poor. In 2014, the bank’s geographic distribution of small loans to businesses is poor. The percentage of small loans made in moderate-income geographies was lower than the percentage of businesses in those geographies and represents poor performance. In addition, the bank’s market share in moderate-income census tracts was lower than the overall market share. Lincoln MSA AA The geographic distribution of small loans to businesses was good. The bank’s geographic distribution of small loans to businesses in 2012 through 2014 was good. The percentage of loans in low-income geographies was near to the percentage of businesses in those geographies. The percentage of loans in moderate-income geographies exceeded the percentage of small businesses in these geographies. The bank’s market share was good. The bank’s market share in low-income geographies was near to the overall market share and the market share in moderate-income geographies was essentially equal to the overall market share for small loans to business. For 2010 through 2011, performance was consistent with the performance noted from 2012 through 2014.

Charter Number: 209
75
Small Loans to Farms The geographic distribution of small loans to farms is excellent. Performance in the Non-MSA Counties AA was excellent. Farm lending is not a significant product in the Lincoln MSA AA and this rating is based on the Non-MSA Counties AA. Refer to Table 7 in the state of Nebraska section of appendix D for the facts and data used to evaluate geographic distribution of the bank’s origination/purchase of small loans to farms. Non-MSA Counties AA The geographic distribution of small loans to farms is excellent. The percentage of small loans made to moderate-income geographies exceeded the percentage of farms in those geographies. Market share is excellent, as FNBO’s market share in moderate-income geographies significantly exceeded the overall market share. Lincoln MSA AA The volume of small farm loans originated in the AA during both evaluation periods was insufficient to perform a quantitative analysis of lending performance. This has a neutral impact on conclusions. Lending Gap Analysis We reviewed summary reports and maps, and analyzed the bank’s home mortgage, small business, and small farm lending activity over the evaluation period to identify any gaps in the geographic distribution of loans. We did not identify any unexplained conspicuous gaps. Distribution of Loans by Income Level of the Borrower The borrower distribution of the bank’s lending is good. Excellent small loans to businesses performance and good distribution of small loans to farms performance augmented adequate home mortgage performance. We placed greater emphasis on the small business and small farm distribution rather than home mortgage loan distribution, with small business and small farm lending given equal weight. FNBO does not collect revenue information on business credit cards. The analysis identified 41.2 percent of small loans to businesses and 12.4 percent of small loans to farms without revenue information from 2012 through 2014. Loan data for 2010 through 2011 identified 35.5 percent of small loans to businesses and 10.4 percent small loans to farms without revenue information. The lack of revenue data for these loans limits the meaningfulness of the revenue distribution analysis. We attributed more emphasis to the bank’s performance in 2012 through 2014 rather than its performance in 2010 through 2011. Due to the significant level of loans reported without revenue information, our conclusions are based primarily on available data as displayed in appendix D for loans by original amount regardless of business size. Conclusions were based using loan size as a proxy for the distribution analysis for lending to small businesses and lending to small farms. Home Mortgage Loans The borrower distribution of home mortgage loans is adequate. Distribution of loans to LMI borrowers in both the Non-MSA Counties AA and Lincoln MSA AA was adequate.

Charter Number: 209
76
Refer to Tables 8, 9 and 10 in the state of Nebraska section of appendix D for the facts and data used to evaluate the borrower distribution of the bank’s home mortgage loan originations and purchases. Non-MSA Counties AA The borrower distribution of home mortgage loans is adequate. The housing stock is relatively old in this AA with the median age of the housing stock at 48 years, according to the 2010 U.S. Census. Older housing often has higher maintenance costs compared to new housing and may be less energy efficient, resulting in increased homeownership costs. This may reduce the bank’s opportunities to lend for mortgage loans especially for low-income borrowers as the increased costs hampers their ability to afford home ownership. The median housing value is high relative to the low-income category. In addition, 13 percent of households live below poverty in this AA, which may impact their ability to afford home ownership. This limits home lending opportunities for the bank. The borrower distribution of home purchase loans is good. The percentage of loans to low-income borrowers was significantly lower than the percentage of low-income families and is poor. Performance context slightly mitigates the low penetration. The percentage of loans made to moderate-income borrowers exceeded the percentage of moderate-income families and is excellent. The bank’s market share during the period was good. The bank’s market share of loans to both low- and moderate-income borrowers was near to its overall market share for home purchase loans. The borrower distribution of home improvement loans is adequate. The percentage of loans to low-income borrowers was significantly lower than the percentage of low-income families and is poor. The portion of loans to moderate-income borrowers was near to the percentage of such families and is good. The bank’s market share during the period was adequate. FNBO’s market share of home improvement loans to low-income borrowers was lower than its overall market share, while market share to moderate-income borrowers was near the overall market share. The borrower distribution of home refinance loans is poor. The percentage of loans to low-income borrowers was significantly lower than the percentage of low-income families and is poor, while loans to moderate-income borrowers were near to the percentage of moderate-income families and represents good performance. FNBO’s market share during the period was adequate. The bank’s market share of loans to low-income borrowers was lower than its overall market share for home improvement loans. The bank’s market share of loans to moderate-income borrowers was near to its overall market share for home improvement loans. Lincoln MSA AA The borrower distribution of home mortgage loans is adequate. The borrower distribution of home purchase loans was adequate. The bank’s borrower distribution of home purchase loans from 2012 through 2014 was adequate. The percentage of home purchase loans to low-income borrowers was significantly lower than the percentage of such families and was poor. The percentage of loans to moderate-income borrowers exceeded the percentage of moderate-income families and was excellent. The bank’s market share

Charter Number: 209
77
during the period was adequate. The bank’s market share to low-income borrowers was lower than the overall market share. The bank’s market share to moderate-income borrowers was near to the overall market share. For 2010 through 2011, performance was stronger than the performance noted from 2012 through 2014 and considered good. The percentage of loans to low-income borrowers was lower than the percentage of low-income families, while loans to moderate-income borrowers exceeded the level of moderate-income families. The borrower distribution of home improvement loans was poor. The bank’s borrower distribution of home improvement loans from 2012 through 2014 was poor. The percentage of home improvement loans to low-income borrowers was significantly lower than the percentage of such families and was very poor. The percentage of loans to moderate-income borrowers exceeded the percentage of moderate-income families and was good. The bank’s market share during the period was poor. The bank’s market share to both low- and moderate-income borrowers was significantly lower than the overall market share. An analysis of the bank’s borrower distribution of home improvement loans from 2010 through 2011 was not quantitative, as the bank did not originate a significant volume of home improvement loans and that had a negative impact on the conclusion for the borrower distribution for home improvement loans. The borrower distribution of home refinance loans is adequate. The bank’s distribution of home refinance loans for both evaluation periods was adequate. The percentage of refinance loans to low-income borrowers was significantly lower than the percentage of low-income families and was very poor. The percentage of loans to moderate-income families slightly exceeded the percentage of such families and is good. The bank’s market share was also adequate. The bank’s market share to low-income borrowers was lower than the overall market share. The bank’s market share to moderate-income borrowers exceeded the overall market share. For 2010 through 2011, performance was consistent with the performance noted from 2012 through 2014. Small Loans to Businesses The overall borrower distribution of small loans to businesses is excellent. Distribution of small loans to businesses in the Non-MSA Counties AA and the Lincoln MSA AA is excellent. The Non-MSA Counties AA carries more emphasis due to higher lending levels for small loans to businesses. Refer to Table 11 in the state of Nebraska section of appendix D for the facts and data used to evaluate the borrower distribution of the bank’s origination and purchase of small loans to businesses. Non-MSA Counties AA The borrower distribution of small loans to businesses is excellent. In evaluating the distribution of small loans to businesses, we noted that credit card loans represent a significant volume of reportable small loans to businesses. FNBO does not collect revenue information on credit card loans to businesses, which inhibits our ability to analyze small loans to businesses by borrower characteristic. The percentage of small loans to businesses with an original amount of $100,000 or less significantly exceeded the percentage of AA small businesses and

Charter Number: 209
78
represents excellent performance. The bank’s market share of loans to small businesses was excellent and exceeded its overall market share of loans to small businesses. Lincoln MSA AA The borrower distribution of small loans to businesses is excellent. As noted above, we considered the impact that credit card loans to small businesses had on our analysis. The penetration of small loans to businesses with an original amount of $100,000 or less significantly exceeded the percentage of AA small businesses. The market share performance was somewhat lower. For 2010 through 2011, performance was consistent with the performance noted from 2012 through 2014, and considered excellent. Small Loans to Farms The borrower distribution of small loans to farms is good. Dispersion of small loans to farms in the Non-MSA Counties AA is good. Refer to Table 12 in the state of Nebraska section of appendix D for the facts and data used to evaluate the borrower distribution of the bank’s origination/purchase of small loans to farms. Non-MSA Counties AA The bank’s borrower distribution of small loans to farms in 2014 was good. Similar to our analysis of the distribution of small loans to businesses, we considered the fact that FNBO does not collect revenue information on credit cards. The percentage of small loans to farms with an original amount of $100,000 or less was somewhat lower than the percentage of small farms in the AA and was adequate. The bank’s market share of loans to small farms was excellent and exceeded its overall market share of loans to small farms. Lincoln MSA AA The volume of small farm loans originated in the AA during both evaluation periods was insufficient to perform a quantitative analysis. Community Development Lending Refer to Table 1 Lending Volume in the state of Nebraska section of Appendix D for the facts and data used to evaluate the bank’s level of CD lending. This table includes all CD loans, including multifamily loans that also qualify as CD loans. In addition, Table 5 includes geographic lending data on all multifamily loans, including those that also qualify as CD loans. Table 5 does not separately list CD loans, however. CD lending has a significantly positive impact on the lending test conclusion based on performance in both full-scope AAs, and enhanced with statewide activities. In Nebraska, CD lending has a significant positive impact based on the number of loans and their responsiveness. Non-MSA Counties AA CD lending had a significantly positive impact on performance in the Non-MSA Counties AA. During the evaluation period, FNBO originated 27 CD loans totaling $47.7 million, which equaled 27.8 percent of tier one capital allocated to this AA. These loans exhibited excellent

Charter Number: 209
79
responsiveness to identified needs of affordable housing and economic development within the AA. Six loans totaling $41 million were originated for the business expansion and construction of a new facility. The project qualifies to receive equity capital under the New Markets Tax Credit Program. Affordable housing initiatives totaled $2.5 million, primarily contributed to Community Housing Development Organizations. One project was for the purchase and renovation of a 16-unit multifamily complex within a moderate-income geography to provide affordable rental housing. Lincoln MSA AA FNBO’s level of CD lending had a significantly positive impact in the Lincoln MSA AA. FNBO originated 19 CD loans totaling $64.1 million, or 242.5 percent of the tier one capital allocation. These loans demonstrated responsiveness to identified needs in the AA, affordable housing and economic development. Of the total loan dollar amount, 3.2 percent was used to support affordable housing initiatives and 15.5 percent for economic development initiatives. FNBO originated $51.6 million in revitalization and stabilization efforts. One project received TIF funds from the city of Lincoln. FNBO originated a $20.8 million loan for construction of a seven-story, mixed-use complex, located in Lincoln’s Haymarket district. The complex contains retail shops, multi-family apartments, and a 111-room hotel. Another project also received TIF from the city of Lincoln. FNBO originated two loans, totaling $17.2 million, to a special purpose project to develop and manage improvements on a 164-acre site for the Nebraska Innovation Campus in Lincoln. Community Development Loans – NE Statewide In addition to CD loans in the full- and limited-scope AAs, the bank originated 14 loans totaling $165.8 million in the broader statewide area that have no P/M/F to serve the bank’s AAs in the state. These loans further demonstrate a commitment to provide needed CD assistance throughout the state and were considered in the overall lending test performance for the state. Product Innovation and Flexibility FNBO offers flexible lending products that had a positive impact on the overall rating for this rated area. For the secured Visa Credit Card Loan Program, FNBO made 251 loans in the full-scope areas. Approximately 75.3 percent of the borrowers were classified low- or moderate-income and 15.5 percent were located in LMI geographies. For additional information, refer to the summary of innovative and flexible loan programs in the Other Factors – Lending Test section for a description of products offered bank-wide. Conclusions for Areas Receiving Limited-Scope Reviews Based on limited-scope reviews, the bank’s performance under the lending test in the Grand Island MSA is weaker than the overall “Outstanding” performance under the lending test in Nebraska due to weaker geographic distribution. However, performance in the Gage and Butler Counties AA is consistent with the overall “Outstanding” under the lending test since borrower and geographic distributions. Performance in the limited scope AAs was not significant enough to affect the overall lending test rating in the state.
Charter Number: 209
80
INVESTMENT TEST FNBO’s performance under the investment test is rated “Outstanding”. Based on full-scope reviews, performance in the NE Non-MSA Counties AA is excellent and is good in the Lincoln MSA AA. Refer to Table 14 in the state of Nebraska section of appendix D for the facts and data used to evaluate the bank’s level of qualified investments. Non-MSA Counties AA FNBO made 50 investments benefitting the Non-MSA Counties AA totaling $12.8 million during the evaluation period. We also considered the ongoing impact that investments made prior to the current evaluation period had within the AA. The remaining balance on five prior period investments as of the date of our examination was $819,000. When considering both current and prior period investments, the total represents 7.9 percent of allocated tier one capital for the AA and is excellent performance. The bank’s responsiveness to the CD needs in the AA is excellent. In terms of total dollar volume, the majority of investments helped with affordable housing, 74.9 percent of the bank’s investment commitments are dedicated to supporting affordable housing. Here are some highlights of the investments:
• During the evaluation period, FNBO invested $1.2 million in mortgage back securities, where the underlying mortgages were originated to low- or moderate-income borrowers. A significant majority of the mortgage loan pools were comprised of home loans to LMI borrowers originated the during the evaluation period.
• FNBO invested $8.2 million in Low-Income Housing Tax Credit syndications and made $875,000 in grants to support affordable housing initiatives in the AA.
• FNBO made four equity equivalent investments in the Nebraska Enterprise Fund, a CDFI totaling $700,000. This investment promotes economic development, which was identified as a need in the AA.
Lincoln MSA AA FNBO made 19 investments benefitting the Lincoln MSA AA totaling $3.8 million during the evaluation period. We considered the ongoing impact that investments made prior to the current evaluation period had within the AA. The remaining balance on three prior period investments as of the date of our examination was $3.3 million. When considering both current and prior period investments, the total of $7.1 million represents 26.9 percent of the allocated tier one capital for the AA and demonstrates excellent performance. FNBO responsiveness to the CD needs of the AA is good. In terms of total dollar volume, 92.6 percent of the bank’s investment commitments are dedicated to supporting affordable housing. FNBO invested $3.5 million in mortgage backed securities and $2.7 million in a CD mutual fund, which invests in debt securities geographically targeted to support CD through single family affordable housing, multifamily affordable housing, small business lending and job creation. These investments are not innovative; however, the investments address CD needs in the AA.

Charter Number: 209
81
Investments – NE Statewide In addition to the CD investments that benefit the bank’s full- and limited-scope AAs, FNBO made 16 qualifying investments totaling $3.7 million in the statewide area that had a P/M/F to serve one or more of the bank’s AAs in the state. Investments included mortgage-backed securities, Low Income Housing Tax Credits, equity equivalent investments, grants and donations. These investments are responsive to the continuing need for affordable housing and promote economic development statewide. This performance had a significantly positive impact on the overall investment performance in the state. Conclusions for Area Receiving Limited-Scope Reviews Based on limited-scope reviews, FNBO’s performance under the investment test in the Grand Island MSA is consistent with the bank’s overall “Outstanding” performance under the investment test in Nebraska due to an excellent level of investments. In the Gage and Butler Counties AA, performance is weaker than the bank’s overall performance in the state due to a lower level of investments. The performance in the limited-scope AAs was not significant enough to affect the overall conclusions in the state. SERVICE TEST Conclusions for Areas Receiving Full-Scope Reviews FNBO’s performance under the service test in Nebraska is rated “High Satisfactory.” Based on full-scope reviews, the bank’s performance in the Non-MSA Counties AA is good and performance in the Lincoln MSA AA is adequate. Participation in statewide community service initiatives with a P/M/F for CD is deemed positive for the overall enhancement of the service test. Retail Banking Services Refer to Table 15 in the state of Nebraska section of appendix D for the facts and data used to evaluate the distribution of the bank’s branch delivery system and branch openings and closings. Non-MSA Counties AA FNBO’s branch distribution in the AA is good. As of December 31, 2015, branches were readily accessible to all portions of geographies and individuals of different income levels within the assessment area. Only one of the 14 branches within the AA is located in a moderate-income geography. The percentage of branches in moderate-income census tracts is essentially equal to the percentage of the population in moderate-income census tracts, but only represents the one branch. Three branches located in middle-income geographies are located near to moderate-income geographies and accessible to LMI individuals. These branches were given positive consideration in the overall evaluation of branch distribution in the AA. The AA has no low-income geographies. FNBO did not open or close any branches within the AA over the evaluation period.

Charter Number: 209
82
Branch hours and services do not vary in a way that would inconvenience portions of the AA, particularly LMI individuals. Services offered and banking hours are comparable among locations regardless of the income level of the geography. Management complements its traditional service delivery methods with alternative delivery processes, including online banking, mobile banking, 22 deposit-taking ATMs and telephone banking. These delivery methods provide increased access to banking services throughout the AA. The bank maintained metrics regarding utilization rates starting in 2014; however, we did not attribute significant emphasis to the effectiveness of these processes in help measure the extent that these services meet the financial and credit needs of LMI individuals. Refer to the Other Factors section for a discussion of alternative delivery systems. Lincoln MSA AA FNBO’s branch distribution in the AA is good. The bank’s branch distribution in 2012 through 2015 was good. Branches were accessible to essentially all portions of geographies and individuals of different income levels in the assessment area. Of the five branches in the AA, no branches are located in low-income geographies. There were two branches located in moderate-income geographies. The percentage of branches in moderate-income geographies exceeded the percentage of the population in moderate-income geographies. Given the low number of branches, the distribution analysis has limited meaningfulness and having two of five branches in the moderate-income portions of the AA is good. Branch openings and closing have not adversely affected the accessibility of the bank’s delivery systems to LMI geographies or individuals. As recorded in Table 15, FNBO opened one branch during the evaluation period. This branch was opened in a middle- income geography. No branch closures occurred in the AA over the evaluation period. Branch hours and services did not vary in a way that inconveniences portions of the AA, particularly LMI individuals. Services offered and banking hours are comparable among locations regardless of the income level of the geography. Management complements its traditional service delivery methods with certain alternative delivery processes, including online banking, mobile banking, four deposit-taking ATMs and telephone banking. These delivery methods provide increased access to banking services throughout the AA. The bank maintained metrics regarding utilization rates starting in 2014; however, we did not attribute significant emphasis to the effectiveness of these processes in measuring the effectiveness of these services in helping to meet the financial and credit needs of LMI individuals. Refer to the Other Factors section for a discussion of alternative delivery systems. Community Development Services FNBO’s performance in providing CD services is adequate. In the Non-MSA Counties AA performance is good and in the Lincoln MSA AA performance is very poor. CD services focused primarily on affordable housing and community services targeted to low- and moderate-income individuals. Bank employees participated in a variety of organizations and partnerships, predominately in leadership roles, that promoted economic development, encouraged revitalization and stabilization, and provided affordable housing. The FNBO

Charter Number: 209
83
employees also provided financial counseling and financial literacy training to community groups and to low- and moderate-income individuals and families. In order to help meet the needs of low- and moderate-income families in the assessment area, the bank waives government check cashing fees for FNBO’s customers. However, we did not place significant emphasis on these community services, as the bank did not maintain metrics to determine their effectiveness in helping to meet the needs of LMI geographies individuals. In addition to CD services in the full- and limited-scope AAs, the bank collaborated with four organizations to develop affordable housing, foster economic development, and provide community services in the broader statewide area that had a P/M/F to serve the bank’s AAs statewide. FNBO collaborated with two organizations to provide affordable housing at the regional level that incorporated the bank’s AAs in the state of Nebraska. These services further demonstrate a commitment to provide needed CD assistance throughout the state, and were considered positively in the overall service test for the state. Non-MSA Counties AA Community service in the Nebraska Non-MSA Counties AA is at a good level. Nine FNBO employees provided their expertise to eight different CD organizations for a total of 514 hours. This represents an adequate level of activities and responsiveness to the needs of the community. All nine employees demonstrated leadership and served on the Board of Directors or on committees for the organizations. One organization was the Lincoln County Community Development Corporation, which renovates and constructs affordable rental and owner-occupied housing for LMI individuals and families. In addition to serving as Secretary of the Board, FNBO’s employee assists with fundraising activities. Another organization is the Box Butte Development Corporation, which assists with the start-up, expansion, and retention of small businesses within Box Butte County, a designated underserved area in 2014. One employee serves on the Family Selection Committee for the North Platte Area Habitat for Humanity, which serves low-income families. The employee reviews the financial information of the families applying for homeownership. Lincoln MSA AA FNBO’s performance in providing CD services in the Lincoln MSA AA is very poor. One employee shared seven hours of financial expertise through the organization El Centro de las Americas. The employee presented a financial literacy course to LMI women and youth attending the center. Services - NE Statewide In addition to the CD services that benefit the bank’s AAs, FNBO participated with four organizations that promoted affordable housing, community service, and economic development in the greater statewide area. Seven employees provided their expertise to these organizations for a total of 588 hours. One partnership, with the Nebraska Housing Developers Association, secured a subsidy from the FHLB affordable housing program to construct 112 affordable homes for first-time homebuyers within the state of Nebraska. One employee serves on the Advisory Board and Loan Committee for the Nebraska Enterprise Fund. The organization is a CDFI and serves as a statewide intermediary to promote microenterprise development and as a gap financier providing resources to businesses. All four initiatives meet

Charter Number: 209
84
the purpose, mandate, and function test for CD and receive positive consideration in the performance conclusions. Conclusions for Areas Receiving Limited-Scope Reviews Based on limited-scope reviews, the bank’s performance under the service test in both the Gage and Butler Counties AA and Grand Island MSA is weaker than the bank’s overall “High Satisfactory” performance under the service test in the State of Nebraska. While the performance differences for the Grand Island MSA was primarily based on poor branch distribution, the Gage and Butler Counties AA performance differences were impacted by poor branch distribution and branch closure adversely affecting the accessibility of financial and credit services to low- and moderate-income individuals. The differences were not significant enough to affect the bank’s overall rating since few branches are located in these AAs. Refer to Table 15 in the state of Nebraska section of appendix D for the facts and data that support these conclusions.

Charter Number: 209
85
State of Texas CRA Rating for Texas: Satisfactory The lending test is rated: High Satisfactory The investment test is rated: Outstanding The service test is rated: Needs to Improve The major factors that support this rating include: • A good level of lending for home mortgage loans and an excellent level of lending for small
loans to businesses;
• Overall good geographic distribution. Adequate home mortgage loan performance was positively impacted by good small loans to business performance;
• An overall good borrower income distribution, as evidenced by excellent small loans to
business performance and adequate home mortgage loan performance; • A positive level of CD loans that were responsive to community needs; • An excellent level of qualified CD investments and grants that was responsive to CD needs
in the AA and augmented with statewide investment; • A branch distribution that is accessible to limited portions of FNBO’s assessment area; and • FNBO provided no CD services. Description of Institution’s Operations in Texas FNBO has one AA in the state of Texas, consisting of Collin County and a portion of adjacent Denton County within the Dallas-Plano-Irving MD. The bank provides a full range of loan and deposit products in the AA, operating with four branches within the AA that represent 3.9 percent of the bank’s total branch network. There were no branch openings or closings. FNBO has four deposit taking ATMs in the AA, representing 2 percent of the bank’s total deposit-taking ATM network. Based on June 30, 2014 FDIC Deposit Market Share data, FNBO ranked 18th out of 71 depository financial institutions with a deposit market share of 0.9 percent. The largest competitors in the AA include JPMorgan Chase, N.A.; Bank of America, N.A.; Wells Fargo Bank, N.A.; Viewpoint Bank, N.A.; and Capital One, N.A. Together, these institutions command 57.2 of the market share, illustrating that the banking industry is highly competitive in the Dallas-Plano-Irving TX MD AA. Refer to the market profiles for the state of Texas in appendix C for detailed demographics and other performance context information for assessment areas that received full-scope reviews.

Charter Number: 209
86
Scope of Evaluation in Texas FNBO has one AA in the state of Texas. As a result, we completed a full-scope review of the Dallas-Plano-Irving MD AA. All conclusions and ratings are based primarily on results in this full-scope AA. When determining conclusions for the lending test, we weighted home mortgage and small business loans equally. Additionally, greater emphasis was placed on home purchase and home refinance loans than home improvement loans. Lastly, we placed more emphasis on the bank’s lending performance in 2012 and 2014 than its lending performance in 2010 through 2011. The volume of both small farm and multifamily lending was not significant to provide quantitative analysis. As part of this performance evaluation, we reviewed one community contact conducted in the AA. The real estate group indicated that affordable housing for low- and moderate-income individuals is a need in the area. This identified need was considered in our evaluation in Texas. Refer to the tables in appendix A for more information on the Dallas-Plano-Irving MD AA. LENDING TEST Conclusions for Areas Receiving Full-Scope Reviews The bank’s performance under the lending test in Texas is rated “Low Satisfactory”. Based on the full-scope review, the bank’s performance in the Dallas-Plano-Irving MD AA is adequate. Lending Activity The bank’s overall lending activity in the state of Texas is good, considering the strong competition for all types of loans in the bank’s AA and is based on FNBO’s good lending activity in the Dallas-Plano-Irving MD AA. The bank’s good performance in originating small business loans and home mortgage loans supports this conclusion. Refer to Tables 1 Lending Volume in the state of Texas section of appendix D for the facts and data used to evaluate the bank’s lending activity. The level of mortgage lending is good given the highly competitive market. The bank has a good level for home purchase and home improvement loans and an adequate level for home refinance loans. Based on FDIC Deposit Market Share data as of June 30, 2014, FNBO had a 0.9 percent deposit market share and ranked 18th among 71 financial institutions. Based upon 2014 peer mortgage data, competition for home purchase lending was very strong, with 570 lenders in the AA. FNBO ranked 139th in home purchase lending with a market share of 0.1 percent. For home improvement lending, the bank ranked 23rd out of 139 lenders and had a market share of 0.5 percent. Home refinance lending was also highly competitive with 411 lenders in the AA, with FNBO ranked 187th with a market share of less than 0.1 percent. Small business lending activity is excellent, given the bank’s market share and rankings when compared to the deposit market share and high level of competition within the AA. Based on 2014 peer data, the top five lenders for small business lending activity consists of the nation’s

Charter Number: 209
87
largest bank lenders who collective commanded 65.3 percent of the market share. Individual market shares of these larger lenders ranged from 21.9 percent to 8.7 percent. FNBO ranked 22nd among the 138 lenders, with a market share of 0.7 percent. Refer to Table 1 in Appendix D for the facts and data used to evaluate the bank’s lending activity. Distribution of Loans by Income Level of the Geography The geographic distribution of the bank’s lending is good in the Dallas-Plano-Irving MD AA. The bank’s home mortgage lending was adequate and small business lending was good. In performing our analysis, we placed equal emphasis on home mortgage loans and small business lending in the Dallas-Plano-Irving MD. When evaluation home mortgage lending, greater emphasis was placed on home purchase and home refinance loans than home improvement loans. Lastly, greater emphasis was placed on the bank’s lending performance in 2012 through 2014 than its performance in 2010 and 2011. The geographic distribution is not significantly emphasized in overall lending test conclusions for this AA. In the Dallas-Plano-Irving MD AA, there is only one low-income and few moderate-income census tracts, and few owner-occupied units or businesses in the low- and moderate-income geographies in this AA. Home Mortgage Loans The geographic distribution of home mortgage loans is adequate. Refer to Tables 2, 3, and 4 in the state of Texas section of Appendix D for the facts and data used to evaluate the geographic distribution of the bank’s home mortgage loan originations/purchases. The geographic distribution of home mortgage loans is adequate. Very few housing units are located in the low- income census tracts and that, in addition to competition, significantly limits lending opportunities. Low-income census tracts contained less than 0.1 percent, or 98 units, of the total owner-occupied housing units in the AA. Opportunities are somewhat limited in the moderate-income census tracts that contained 3.5 percent, or 8,628, owner-occupied units. According to 2000 Census data, the assessment area did not contain any low-income census tracts and at that time only 1.5 percent of owner-occupied units were in the moderate-income census tracts. Based on these statistics, the bank had somewhat limited opportunities for home mortgage lending in both low- and moderate-income census tracts. We considered these factors when determining the conclusion for geographic distribution of home mortgage loans The geographic distribution of home purchase loans is adequate. The bank’s geographic distribution of home purchase loans from 2012 through 2014 was adequate, given the highly competitive market. While the bank did not make any loans in the low-income geographies, the percentage of owner-occupied housing units in the low-income geographies was less than 0.1 percent. The bank’s distribution of home purchase loans in the moderate-income geographies was near to the percentage of owner-occupied units in these geographies. The bank did not

Charter Number: 209
88
have a reportable market share in the LMI geographies. For 2010 through 2011, the bank did not originate or purchase a sufficient volume of home purchase loans to perform a quantitative analysis. The geographic distribution of home improvement loans is poor. The bank did not make any home improvement loans in low- or moderate-income geographies and did not have a reportable market share in the LMI geographies. The lack of lending is somewhat mitigated by the limited lending opportunities in these AAs. For 2010 through 2011, the bank did not originate or purchase a sufficient volume of home improvement loans to perform a quantitative analysis. The geographic distribution of home refinance loans is adequate based on good performance for 2012-2014 and poor performance for 2010-2011. The bank’s geographic distribution of home refinance loans from 2012 through 2014 was good. While the bank did not make any loans in the low-income geographies, the bank’s distribution of home purchase loans in the moderate-income geographies exceeded the percentage of owner-occupied housing units in those geographies. The bank did not have a reportable market share in either the low- or moderate-income geographies. FNBO’s distribution of home refinance loans was weaker in 2010 through 2011 and considered poor. The bank did not originate any home refinance loans in moderate-income census tracts. Small Loans to Businesses The geographic distribution of small loans to businesses is good. Refer to Table 6 in the state of Texas section of appendix D for the facts and data used to evaluate the geographic distribution of the bank’s origination/purchase of small loans to businesses. The geographic distribution of small loans to business is good. The bank’s geographic distribution of small loans to businesses from 2012 through 2014 was good. While the bank did not make any loans in the low-income census tracts, only 0.1 percent of businesses were located in those geographies and the small number of businesses provides very limited lending opportunities. The percentage of small loans made in the moderate-income geographies exceeded the percentage of businesses in those geographies and is excellent. The bank’s market share in low-income census tracts was lower than the overall market share but exceeded the overall market share in the moderate-income geographies. For 2010 through 2011, performance was consistent with performance noted from 2012 through 2014. Lending Gap Analysis We reviewed summary reports and maps, and analyzed the bank’s home mortgage and small business lending activity over the evaluation period to identify any gaps in the geographic distribution of loans. We did not identify any unexplained conspicuous gaps.

Charter Number: 209
89
Distribution of Loans by Income Level of the Borrower The borrower distribution of the bank’s lending is good. Borrower distribution for home mortgage is adequate and loans to small businesses in the Dallas-Plano-Irving MD AA is excellent. In performing our analysis, we placed equal emphasis on the bank’s home mortgage loans and small business loans. We placed greater emphasis on home purchase and home refinance than we placed on home improvement loans. We also considered the bank’s practice of not collecting revenue information on business cards. For the 2012 through 2014 evaluation, loan data on Table 11 indicated that 66.3 percent of small loans to businesses did not include revenue information. Due to the significant level of loans reported without revenue information, our conclusions are based primarily on available data as displayed in appendix D for loans by original amount regardless of business size. Conclusions were based on loan size as a proxy for the distribution analysis for lending to small businesses. Greater emphasis was placed on the bank’s performance in 2012 through 2014 than its performance in 2010 and 2011. Home Mortgage Loans The borrower distribution of home mortgage loans is adequate. Refer to Tables 8, 9 and 10 in the state of Texas section of Appendix D for the facts and data used to evaluate the borrower distribution of the bank’s home mortgage loan originations and purchases. According to the 2010 U.S. Census, the median housing value was $216,425, representing a significant increase from 2000 U.S. Census median housing value of $164,583. The relatively high and increasing cost of purchasing a home in this AA may negatively affect the ability of low-income individuals to qualify for mortgage loans and limit bank lending opportunities. The cost of housing relative to the median family income would prevent home ownership for many low-income families, given their maximum annual income of approximately $35 thousand. The borrower distribution of home purchase loans is adequate. The bank’s borrower distribution of home purchase loans from 2012 through 2014 was adequate. The bank did not make any home purchase loans to low-income borrowers. The percentage of loans to moderate-income borrowers was near to the percentage of moderate-income families. Market share penetration is essentially equal to the overall home purchase market share for lending to moderate-income borrowers. The bank’s borrower distribution of home purchase loans from 2010 through 2011 was limited by low loan originations; therefore, we were unable to conduct a quantitative analysis. The borrower distribution of home improvement loans is poor. For the years 2012 through 2014, the bank did not make any loans to low-income borrowers. Additionally, the percentage of loans to moderate-income borrowers was lower than the percentage of moderate-income families. Market share penetration is essentially equal to the overall home purchase market share for lending to moderate-income borrowers. For 2010 through 2011, the bank did not originate or purchase a sufficient volume of home improvement loans to perform a quantitative analysis.

Charter Number: 209
90
The overall borrower distribution for home refinance loans is adequate based on poor performance for 2012-2014 and good performance for 2010-2011. The bank’s borrower distribution of home refinance loans from 2012 through 2014 was poor. The percentage of loans to low- and moderate-income borrowers was significantly lower than the percentage of low-income families. Market share penetration was below overall market share for home refinance loans for moderate-income categories. The bank’s borrower distribution of home refinance loans from 2010 through 2011 was stronger and considered good. The percentage of loans to low- and moderate-income borrowers was near to the percentage of low- and moderate-income families. Small Loans to Businesses The borrower distribution of small loans to businesses is excellent. Refer to Table 11 in the state of Texas section of appendix D for the facts and data used to evaluate the borrower distribution of the bank’s origination and purchase of small loans to businesses. In evaluating the bank’s performance, we considered the competitive market in which the bank operates regarding small business lending and the impact of the large volume of commercial credit cards. We noted that revenues were only collected on approximately 33.7 percent of reportable loans for 2012 through 2014 and 46.48 percent of the reportable loans from 2010 through 2011. As previously noted, conclusions were based using loan size as a proxy for the distribution analysis for lending to small businesses. FNBO’s distribution of small loans to businesses in 2012 through 2014 with an original amount of $100,000 or less is excellent. The percentage of small loans to businesses significantly exceeded the percentage of businesses in the AA. The overall market share was higher than the market share for businesses with revenues less than $1 million and was poor. The bank’s performance in 2010 through 2011 was consistent with the performance noted from 2012 through 2014. Community Development Lending Refer to Table 1 Lending Volume in the state of Texas section of Appendix D for the facts and data used to evaluate the bank’s level of CD lending. This table includes all CD loans, including multifamily loans that also qualify as CD loans. FNBO’s level of CD lending had a positive impact on its overall lending performance in the Dallas-Plano-Irving, TX MD AA. FNBO made one loan totaling approximately $4.9 million, representing 24.5 percent of tier one capital allocated to the AA. The SBA 504 certified development company program loan supports economic development through the construction of a 56,000 square foot indoor sporting complex. Community Development Loans – TX Statewide In addition to qualified CD loans made within the bank’s AA, FNBO originated two CD loans in the broader statewide area that did not include the bank’s AA. FNBO originated two loans totaling $27 million to revitalize and stabilize a low-income area of Fort Worth, Texas, commonly referred to as the “Fort Worth near Southside Neighborhood.” Financing will provide

Charter Number: 209
91
a 227-unit 400,000 square foot apartment development situated just south of downtown Fort Worth. The project will receive TIF funds. This project is responsive to identified affordable housing needs, but does not directly benefit the AA. Product Innovation and Flexibility FNBO offers flexible lending products that had a positive impact on the overall rating for this rated area. FNBO made 370 loans under the secured Visa Credit Card Loan Program, in the full-scope area. Approximately 53.5 percent of the borrowers were classified low- or moderate-income and 6.7 percent were located in LMI geographies. For additional information, refer to the summary of innovative and flexible loan programs in the Other Factors – Lending Test section for a description of products offered bank-wide. Refer to the summary of innovative and flexible loan programs in the Other Factors – Lending Test section for a description of products offered bank-wide. Flexible products had a neutral impact on the lending test for this AA. INVESTMENT TEST The bank’s performance under the Investment Test in Texas is rated “Outstanding.” Based on the full-scope review, the bank’s performance in the Dallas-Plano-Irving MD AA is excellent and performance is augmented with a statewide investment. Conclusions for Areas Receiving Full-Scope Reviews The bank’s performance under the Investment Test in Texas is excellent, based on the full-scope review, the bank’s performance in the Dallas-Plano-Irving MD AA is excellent. FNBO’s investment performance in the AA is excellent. FNBO made nine investments totaling $72,500 during the current period and held one investment from the prior period totaling $2.5 million. Total investments represent 12.8 percent of allocated tier one capital for the AA. Current period investments consist of nine donations to organizations providing economic development and community services to low- and moderate-income individuals and families in the AA. The prior period investment originated in 2003 and consists of a share in a mutual fund with a P/M/F to serve the bank’s AA. The fund invests in mortgages to LMI borrowers in the AA and has a continuing impact in the AA. Investments - TX Statewide In addition to the CD investments that benefit the bank’s AA, FNBO made one investment that benefited the state of Texas totaling $234,000. This investment had a P/M/F to serve the AA. This investment supported affordable housing through Low Income Housing Tax Credits. Statewide investments represented 1.2 percent of the allocated tier one capital to the state. Our conclusion considered the qualifying investment made in the statewide area to have a positive impact on overall conclusions for this state.

Charter Number: 209
92
SERVICE TEST Conclusions for Area Receiving Full-Scope Review The bank’s performance under the Service Test in Texas is rated “Needs to Improve.” Based on the full-scope review, the bank’s performance in the Dallas-Plano-Irving MD is poor. Retail Banking Services Refer to Table 15 in Appendix D for the facts and data used to evaluate the distribution of the bank’s branch delivery system and branch openings and closings. The bank’s service delivery systems are accessible to limited geographies and individuals of different income levels throughout the AA. The bank’s branch distribution from September 30, 2010 through December 31, 2015 is adequate. There were no branches located in low- or moderate-income geographies. However, the percentage of population that reside in the low- and moderate-income census tracts, 75,800 individuals, was low at 0.4 percent and 7 percent, respectively. All four branches in the AA are situated within one half mile of a low- or moderate-income census tract and are reasonably accessible to low- and moderate income individuals. FNBO did not open or close any branches in the AA. Branch hours and services do not vary in a way that inconveniences the AA, including LMI areas. Services offered and banking hours are comparable at all AA branches. Management complements its traditional service delivery methods with alternative delivery processes, including online banking, mobile banking, four deposit-taking ATMs and telephone banking. These delivery methods provide increased access to banking services throughout the AA. The bank maintained metrics regarding utilization rates starting in 2014; however, we did not attribute significant emphasis to the effectiveness of these processes to measure the effectiveness of the services in helping to meet the financial and credit needs of LMI individuals. Refer to the Other Factors section for a discussion of alternative delivery systems. Community Development Services The bank’s performance in providing CD services in the Dallas-Plano-Irving MD is very poor. FNBO representatives did not provide any CD services in AA.

Charter Number: 209
Appendix A-1
Appendix A: Scope of Examination The following table identifies the time period covered in this evaluation, affiliate activities that were reviewed, and loan products considered. The table also reflects the metropolitan and nonmetropolitan areas that received comprehensive examination review (designated by the term “full-scope”) and those that received a less comprehensive review (designated by the term “limited-scope”).
Time Period Reviewed
Lending Test (excludes CD loans): 09/30/2010 to 12/31/2014: Omaha-Council Bluffs (NE-IA) MMSA, Fort Collins-Loveland MSA, Boulder MSA, Denver-Aurora-Lakewood MSA, Greeley MSA, Chicago MD, Rockford MSA, Kansas City KS MSA, Lincoln MSA, Gage & Butler Counties AA, Dallas-Plano-Irving MD 01/01/2014 to 12/31/2014: Elgin MD 04/01/2014 to 12/31/2014: NE Non-MSA Counties AA, Grand Island MSA 09/30/2010 to 07/26/2013: Des Moines-West Des Moines MSA Investment and Service Tests and CD Loans: 09/30/2010 to 12/31/2015: Omaha-Council Bluffs (NE-IA) MMSA, Fort Collins-Loveland MSA, Boulder MSA, Denver-Aurora-Lakewood MSA, Greeley MSA, Chicago MD, Rockford MSA, Kansas City KS MSA, Lincoln MSA, Gage & Butler Counties AA, Dallas-Plano-Irving MD 01/01/2014 to 12/31/2015: Elgin MD 04/01/2014 to 12/31/2015: NE Non-MSA Counties AA, Grand Island MSA 09/30/2010 to 07/26/2013: Des Moines-West Des Moines MSA
Financial Institution Products Reviewed
First National Bank of Omaha (FNBO) Omaha, NE
Home Purchase, Home Improvement, Home Refinance, Multifamily, Small Business, Small Farm, CD loans, Qualified Investments, Services
Affiliate(s) Affiliate Relationship Products Reviewed
FNN Community Development Corporation First Capital Partners
Operating Subsidiary Operating Subsidiary
Loans and Investments Loans and Investments

Charter Number: 209
Appendix A-2
List of Assessment Areas and Type of Examination
Assessment Area Type of Exam Other Information Multistate Metropolitan Area: Omaha-Council Bluffs (NE-IA) MMSA Colorado: Fort Collins-Loveland MSA Boulder MSA Denver-Aurora-Lakewood MSA Greeley MSA Illinois: Chicago MD Elgin MD Rockford MSA Iowa: Des Moines–West Des Moines MSA Kansas: Kansas City KS MSA Nebraska: Non-MSA Lincoln MSA Gage & Butler Counties Grand Island MSA Texas: Dallas-Plano-Irving MD
Full-Scope Full-Scope Limited-Scope Limited-Scope Limited-Scope Full-Scope Full-Scope Limited-Scope Full-Scope Full-Scope Full-Scope Full-Scope Limited-Scope Limited-Scope Full-Scope
NE: Douglas and Sarpy Counties IA: Pottawattamie and Mills Counties Larimer County Boulder County Broomfield County; Portions of Adams & Jefferson Counties Weld County DeKalb, Kane, Kendall and McHenry Counties DeKalb and Kane Counties Boone County Dallas, Madison and Polk Counties Johnson County Box Butte, Buffalo, Colfax, Dawes, Dawson, Dodge, Hooker, Kearney, Lincoln, Madison, McPherson, Morrill, Phelps, Platte, Polk, Scotts Bluff, Sheridan and Sioux Counties Lancaster County Gage & Butler Counties Hall County Collin County and Portion of Denton County

Charter Number: 209
Appendix B-1
Appendix B: Summary of Multistate Metropolitan Area and State Ratings
RATINGS FIRST NATIONAL BANK OF OMAHA
Overall Bank:
Lending Test Rating*
Investment Test Rating
Service Test Rating
Overall Bank/State/
Multistate Rating First National Bank of Omaha Outstanding Outstanding Low Satisfactory Satisfactory
Multistate Metropolitan Area or State: Omaha-Council Bluffs, NE-IA MMSA Outstanding High Satisfactory Outstanding Outstanding
Colorado Outstanding Outstanding Low Satisfactory Outstanding
Illinois High Satisfactory Outstanding Low Satisfactory Satisfactory
Iowa Low Satisfactory High Satisfactory Low Satisfactory Satisfactory
Kansas Low Satisfactory Outstanding Needs to Improve Satisfactory
Nebraska Outstanding Outstanding High Satisfactory Outstanding
Texas High Satisfactory Outstanding Needs to Improve Satisfactory (*) The lending test is weighted more heavily than the investment and service tests in the overall rating.

Charter Number: 209
Appendix C- 1
Appendix C: Market Profiles for Full-Scope Areas Omaha-Council Bluffs (NE-IA) MMSA
Demographic Information for Full Scope Area: Omaha-Council Bluffs (NE-IA) MMSA - 2000 Census
Demographic Characteristics
#
Low % of #
Moderate % of #
Middle % of #
Upper % of #
NA* % of #
Geographies (Census Tracts/BNAs) 216 3.24 27.31 44.91 24.54 0.00 Population by Geography 688,431 2.19 26.61 45.90 25.30 0.00 Owner-Occupied Housing by Geography 173,540 1.10 20.73 48.79 29.38 0.00 Business by Geography 70,350 1.64 18.28 45.85 34.23 0.00 Farms by Geography 2,806 0.36 7.52 64.65 27.48 0.00 Family Distribution by Income Level 177,203 17.68 19.16 24.26 38.90 0.00 Distribution of Low and Moderate Income Families throughout AA Geographies
65,270 3.48 40.38 44.98 11.15 0.00
Median Family Income HUD Adjusted Median Family Income for 2011 Households Below Poverty Level
53,955 70,600
8%
Median Housing Value Unemployment Rate (2000 US Census)
104,427 2.02%
(*) The NA category consists of geographies that have not been assigned an income classification. Source: 2000 U.S. Census, and 2011 HUD updated MFI.
Demographic Information for Full Scope Area: Omaha-Council Bluffs (NE-IA) MMSA - 2010 Census
Demographic Characteristics
#
Low % of #
Moderate % of #
Middle % of #
Upper % of #
NA* % of #
Geographies (Census Tracts/BNAs) 234 12.39 22.22 38.46 26.50 0.43 Population by Geography 784,167 9.28 21.78 38.61 30.01 0.33 Owner-Occupied Housing by Geography 199,106 5.77 18.37 42.26 33.60 0.00 Business by Geography 54,343 7.16 18.29 41.97 32.13 0.45 Farms by Geography 2,663 1.95 11.79 57.30 28.95 0.00 Family Distribution by Income Level 194,685 20.93 17.33 22.40 39.34 0.00 Distribution of Low and Moderate Income Families throughout AA Geographies
74,489 16.37 30.98 38.45 14.20 0.00
Median Family Income HUD Adjusted Median Family Income for 2014 Households Below Poverty Level
69,538 73,000
11%
Median Housing Value Unemployment Rate (2010 US Census)
147,450 3.19%
(*) The NA category consists of geographies that have not been assigned an income classification. Source: 2010 U.S. Census and 2014 FFIEC updated MFI. The Omaha-Council Bluffs (NE-IA) MMSA AA includes Douglas and Sarpy Counties in Nebraska and Mills and Pottawattamie Counties in Iowa. The Omaha- Council Bluffs (NE-IA) MMSA is comprised of eight counties, three in Iowa (Harrison, Mills and Pottawattamie) and five in Nebraska (Cass, Douglas, Sarpy, Saunders and Washington). However, FNBO limited their AA to the four counties they were reasonably able to serve. The AA population increased by 95,736, or 13.9 percent between census years 2000 and 2010. The AA includes the city of

Charter Number: 209
Appendix C- 2
Omaha, which is the state of Nebraska’s most populated city. According to the U.S. Census data, the AA consists of 234 census tracts of which, 29 are low-income, 52 are moderate-income, 90 are middle-income, and 62 are upper-income, and one unclassified. The assessment area meets the requirements of the CRA regulation and does not arbitrarily exclude LMI geographies. The 2014 FFIEC Updated MFI was $73,000. This represents a 3.4 percent increase compared to the 2011 MFI of $70,600. There was an overall net increase in the number of low-income families from 2011 to 2014. According to the U.S. Census data, low-income families increased from 17.7 percent in census year 2000 to 20.9 percent in census year 2010, or 18.4 percent. There was a decrease in the number of moderate-income families over the same time-period, from 19.2 percent in census year 2000 to 17.3 percent in census year 2010, or 9.5 percent. Families living below the poverty level increased to 11 percent in the 2010 census year from 8 percent in the 2000 census year. While strong competition to provide financial services exists within the bank’s AA, the June 30, 2014 FDIC Deposit Market Share Report shows FNBO ranked first of 47 depository financial institutions, with a 29.7 percent market share. Competitors include several branches of national, regional, and local community banks operating in the AA. FNBO’s top five competitors, in order of market share rank, are Mutual of Omaha Bank, Wells Fargo Bank, N.A., U.S. Bank N.A, American National Bank, and Great Western Bank. These competitors control 47.8 percent of the deposit market share in the AA. FNBO’s deposits in the AA as of June 30, 2014, totaled $7.9 billion, representing 56.7 percent of total deposits. The competition maintains 248 offices in the AA. As of December 31, 2014, FNBO had 27 branches in the AA. The bank supplemented its branch network with 36 deposit-taking ATMs. Employment and Economic Factors The economic condition of the AA has improved over the evaluation period and is good. According to the U.S. Bureau of Labor Statistics (http://beta.bls.gov), unemployment rates for the AA improved from 4.8 percent as of December 2010 compared to 3.2 percent as of December 2014. As of December 2014, the Nebraska, Iowa, and nationwide unemployment rates were 3.1 percent, 4.3 percent, and 5.6 percent, respectively. According to Moody’s Analytics, employment in the AA is most concentrated within education and health, professional and business services, government, retail trade, and leisure and hospitality services sectors. Major employers include Offutt Air Force Base, CHI Health, Nebraska Medical Center, The Methodist Health System, First Data Corp, University of Nebraska Medical Center, FNBO, Wal-Mart Stores Inc., and Creighton University among others. The AA exhibits market strengths including low business costs, a skilled workforce and a population growth that is attractive to businesses, a stable housing market, above average per capita income, and a high concentration of major companies. Housing There are limited opportunities for home mortgage lending in this AA’s low-income geographies. . The number of housing units is much lower in low-income geographies than middle-and upper-income geographies. According to the 2010 U.S. Census, 5.8 percent of owner-occupied units were located in low-income census tracts, which is higher than 1.1

Charter Number: 209
Appendix C- 3
percent reported in the 2000 U.S. Census. Of the total housing units in low-income geographies, 48.4 percent were occupied rental units and 41.10 percent were in moderate-income geographies. The number of occupied rental units increased when compared to the 2000 U.S. Census data, which showed 52.8 percent occupied rentals in low–income geographies. Occupied rental units decreased when compared to 2000 U.S. Census data. According to the National Association of REALTORS median sales price report of historical median prices for the MSA, the median housing price for the AA was $149,000 at year-end 2014. Median home prices may impact home ownership capacity, especially for low-income individuals given the relatively high median price compared with the high-end for low-income of $36,499. These income levels and the level of families living below poverty, with 11% of households living below poverty, impact the number of low-income individuals and families that can afford owner-occupied housing in this AA. According to the 2010 U.S. Census, the median age of housing stock is higher in low- or moderate-income geographies than middle- and upper-income geographies, contributing to the lower median housing values in low- or moderate-income geographies. Older housing may have lower purchase prices, but often has higher maintenance costs. Per the 2010 U.S. Census, the median age of housing for low- and moderate-income geographies was 63 years and 54 years, respectively. In comparison, the median age of middle- and upper income geographies was much lower at 38 years and 21 years, respectively. Due to the older age of housing stock in low- or moderate-income geographies, we would expect a higher average maintenance cost, and the higher costs impact home ownership affordability this AA fin the low- or moderate-income geographies. Community Contact Three community contacts conducted in the AA were reviewed as part of this performance evaluation. Two contacts were economic development organizations. These contacts cited a need for financial education, business planning assistance, and access to affordable capital for small business owners and entrepreneurs. The third contact was an affordable housing organization. They cited a need for more affordable rental units for low- and moderate-income families, especially in rural areas. The contact stated that urban areas are relatively stable in terms of supply and demand for affordable housing.
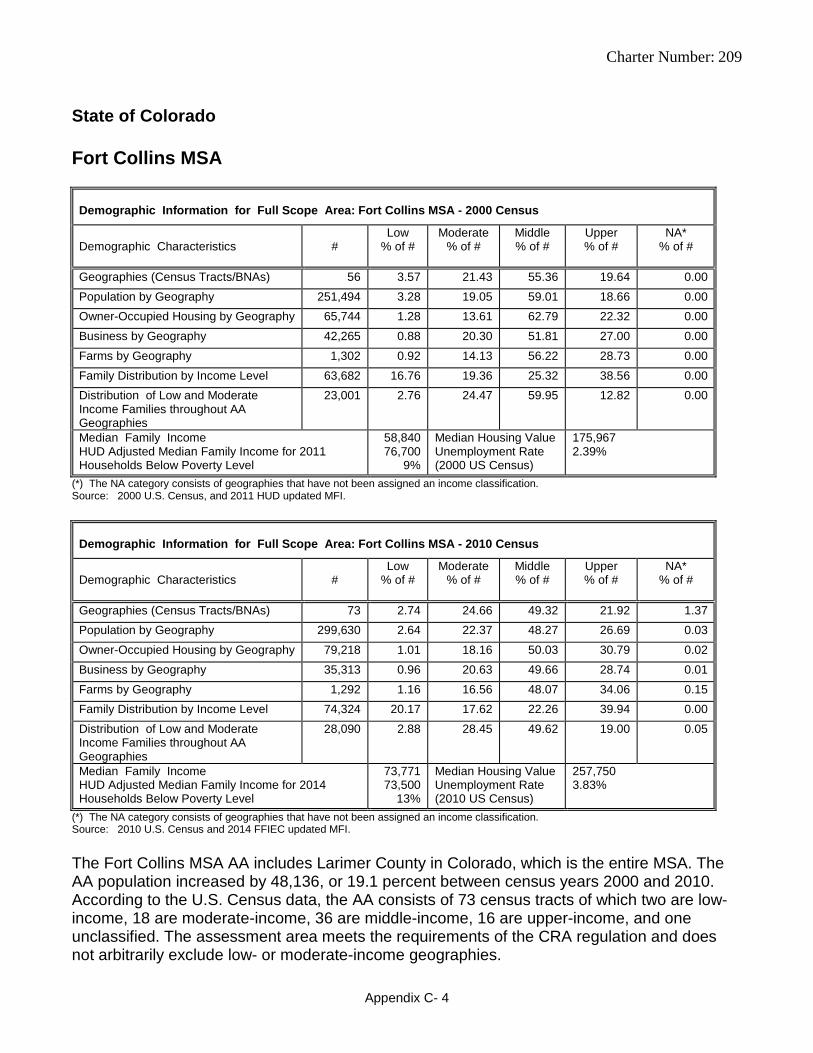
Charter Number: 209
Appendix C- 4
State of Colorado Fort Collins MSA
Demographic Information for Full Scope Area: Fort Collins MSA - 2000 Census
Demographic Characteristics
#
Low % of #
Moderate % of #
Middle % of #
Upper % of #
NA* % of #
Geographies (Census Tracts/BNAs) 56 3.57 21.43 55.36 19.64 0.00 Population by Geography 251,494 3.28 19.05 59.01 18.66 0.00 Owner-Occupied Housing by Geography 65,744 1.28 13.61 62.79 22.32 0.00 Business by Geography 42,265 0.88 20.30 51.81 27.00 0.00 Farms by Geography 1,302 0.92 14.13 56.22 28.73 0.00 Family Distribution by Income Level 63,682 16.76 19.36 25.32 38.56 0.00 Distribution of Low and Moderate Income Families throughout AA Geographies
23,001 2.76 24.47 59.95 12.82 0.00
Median Family Income HUD Adjusted Median Family Income for 2011 Households Below Poverty Level
58,840 76,700
9%
Median Housing Value Unemployment Rate (2000 US Census)
175,967 2.39%
(*) The NA category consists of geographies that have not been assigned an income classification. Source: 2000 U.S. Census, and 2011 HUD updated MFI.
Demographic Information for Full Scope Area: Fort Collins MSA - 2010 Census
Demographic Characteristics
#
Low % of #
Moderate % of #
Middle % of #
Upper % of #
NA* % of #
Geographies (Census Tracts/BNAs) 73 2.74 24.66 49.32 21.92 1.37 Population by Geography 299,630 2.64 22.37 48.27 26.69 0.03 Owner-Occupied Housing by Geography 79,218 1.01 18.16 50.03 30.79 0.02 Business by Geography 35,313 0.96 20.63 49.66 28.74 0.01 Farms by Geography 1,292 1.16 16.56 48.07 34.06 0.15 Family Distribution by Income Level 74,324 20.17 17.62 22.26 39.94 0.00 Distribution of Low and Moderate Income Families throughout AA Geographies
28,090 2.88 28.45 49.62 19.00 0.05
Median Family Income HUD Adjusted Median Family Income for 2014 Households Below Poverty Level
73,771 73,500
13%
Median Housing Value Unemployment Rate (2010 US Census)
257,750 3.83%
(*) The NA category consists of geographies that have not been assigned an income classification. Source: 2010 U.S. Census and 2014 FFIEC updated MFI. The Fort Collins MSA AA includes Larimer County in Colorado, which is the entire MSA. The AA population increased by 48,136, or 19.1 percent between census years 2000 and 2010. According to the U.S. Census data, the AA consists of 73 census tracts of which two are low-income, 18 are moderate-income, 36 are middle-income, 16 are upper-income, and one unclassified. The assessment area meets the requirements of the CRA regulation and does not arbitrarily exclude low- or moderate-income geographies.

Charter Number: 209
Appendix C- 5
The 2014 FFIEC Updated MFI was $73,500. This represents a 4.2 percent decrease compared to the 2011 MFI of $76,700. There was an overall net increase in the number of low- or moderate-income families from 2011 to 2014. According to the U.S. Census data, low-income families increased from 16.8 percent in census year 2000 to 20.2 percent in census year 2010, or 20.3 percent. There was a decrease in the number of moderate-income families over the same time-period, from 19.4 percent in census year 2000 to 17.6 percent in census year 2010, or 9 percent. Families living below the poverty level increased to 13 percent in the 2010 census year from 9.00 percent in the 2000 census year. While strong competition to provide financial services exists within the bank’s AA, the June 30, 2014 FDIC Deposit Market Share Report shows FNBO ranked first of 29 depository financial institutions, with a 22.0 percent market share. Competitors include several branches of national, regional, and local community banks operating in the AA. FNBO’s top five competitors, in order of market share rank, are Wells Fargo Bank, N.A., The Home State Bank, First Bank, JPMorgan Chase Bank, N.A., and U.S. Bank, N.A. These competitors control 47.7 percent of the deposit market share in the AA. FNBO’s deposits in the AA as of June 30, 2014, totaled $1.39 billion, representing 10.1 percent of total deposits. The competition maintains 94 offices in the AA. As of December 31, 2015, FNBO had nine branches in the AA. The bank supplemented its branch network with 15 deposit-taking ATMs. Employment and Economic Factors The economic condition of the AA has improved over the evaluation period and is good. According to the U.S. Bureau of Labor Statistics (http://beta.bls.gov), unemployment rates for the AA improved from 7.7 percent as of December 2010 compared to 3.5 percent as of December 2014. As of December 2014, the Colorado and nationwide unemployment rates were 4.2 percent and 5.6 percent, respectively. According to Moody’s Analytics, employment in the AA is most concentrated within government, professional and business services, leisure and hospitality, retail trade, and education and health sectors. Major employers include Colorado State University, Poudre Valley Health Systems, Center Partners, Columbine Health System, Woodward Governor Co., Wal-Mart Stores Inc., and McKee Medical Center among others. The AA exhibited market strengths including University and technology intensive industries that attract a skilled workforce, lower living and business costs than nearby cities, and a strong population growth. Housing There are limited opportunities for home mortgage lending in this AA’s low-income geographies since the number of housing units is low. In addition, the number of housing units is much lower in low-income geographies than middle-and upper-income geographies. According to the 2010 U.S. Census, 1 percent of owner-occupied units were located in low-income census tracts and that is slightly higher than the 2000 U.S. Census at 1.3 percent. Of the total housing units in low-income geographies, 70.8 percent were occupied rental units and 5.8 percent were vacant units, an increase compared to the 2000 U.S. Census data, which showed 50.6 percent occupied rentals and 4.4 percent vacant units.

Charter Number: 209
Appendix C- 6
The poverty rate for this AA relatively high at 13 percent of households below poverty. People living below poverty are not likely to represent home mortgage loans opportunities and would have difficulty affording home ownership in this AA. According to the 2010 U.S. Census the median housing price for the AA was $257,750. Median home prices are relatively high in the AA when considering a median family income of $73,500. Based on this median family income, low-income families earned at most $36,749. The income levels for people in the low-income category and the relatively high number of households living below poverty would make it difficult to afford owner-occupied housing in this AA for low-income individuals. Community Contact A community contact conducted in the AA was reviewed as part of this performance evaluation. As an economic development entity, the contact noted some difficulty in obtaining small business financing outside of SBA loans and the Colorado Housing Finance Authority. Community banks have been successful at providing financial education and business planning assistance for small business owners and entrepreneurs.

Charter Number: 209
Appendix C- 7
State of Illinois Chicago-Naperville-Arlington Heights MD
Demographic Information for Full Scope Area: Chicago-Naperville-Arlington Heights MD – 2000 Census
Demographic Characteristics
#
Low % of #
Moderate % of #
Middle % of #
Upper % of #
NA* % of #
Geographies (Census Tracts/BNAs) 143 1.40 11.19 56.64 30.07 0.70 Population by Geography 807,709 1.40 8.69 51.27 38.58 0.06 Owner-Occupied Housing by Geography 210,739 0.06 5.21 50.54 44.19 0.00 Business by Geography 77,223 0.50 5.35 48.50 45.63 0.02 Farms by Geography 2,907 0.34 2.06 66.01 31.58 0.00 Family Distribution by Income Level 206,885 13.14 16.01 25.39 45.46 0.00 Distribution of Low and Moderate Income Families throughout AA Geographies
60,314 1.56 14.15 60.12 24.18 0.00
Median Family Income HUD Adjusted Median Family Income for 2011 Households Below Poverty Level
60,166 76,200
6%
Median Housing Value Unemployment Rate (2000 US Census)
162,612 2.29%
(*) The NA category consists of geographies that have not been assigned an income classification. Source: 2000 U.S. Census, and 2011 HUD updated MFI.
Demographic Information for Full Scope Area: Chicago-Naperville-Arlington Heights MD – 2010 Census
Demographic Characteristics
#
Low % of #
Moderate % of #
Middle % of #
Upper % of #
NA* % of #
Geographies (Census Tracts/BNAs) 165 3.03 19.39 43.03 34.55 0.00 Population by Geography 1,043,92
5 2.28 18.10 38.14 41.48 0.00
Owner-Occupied Housing by Geography 276,456 0.33 13.27 41.51 44.88 0.00 Business by Geography 64,923 1.46 10.68 42.76 45.11 0.00 Farms by Geography 2,824 0.50 5.52 59.95 34.03 0.00 Family Distribution by Income Level 260,989 15.85 16.30 21.70 46.15 0.00 Distribution of Low and Moderate Income Families throughout AA Geographies
83,902 2.00 29.41 42.80 25.79 0.00
Median Family Income HUD Adjusted Median Family Income for 2013 Households Below Poverty Level
72,747 73,400
8%
Median Housing Value Unemployment Rate (2010 US Census)
248,978 4.06%
(*) The NA category consists of geographies that have not been assigned an income classification. Source: 2010 U.S. Census and 2013 FFIEC updated MFI. The Chicago-Naperville-Arlington Heights MD AA includes DeKalb, Kane, Kendall, and McHenry Counties in Illinois. Prior to the 2014 Office of Management and Budget (OMB) geographic boundary changes, the Chicago-Naperville-Arlington Heights MD included eight counties (Cook, DeKalb, DuPage, Grundy, Kane, Kendall, McHenry, and Will). However, FNBO limited their AA to the four counties that they are reasonably able to serve. The OMB made geographic boundary revisions to exclude DeKalb and Kane Counties from the Chicago-

Charter Number: 209
Appendix C- 8
Naperville-Arlington Heights MD effective January 1, 2014. While FNBO continues to serve these counties, they are reflected in the Elgin IL MD market profile. The AA population increased by 236,216, or 29.2 percent between census years 2000 and 2010. The AA has 165 census tracts, of which five are low-income, 32 are moderate-income, 71 are middle-income, and 57 upper-income. The assessment area meets the requirements of the CRA regulation and does not arbitrarily exclude low- or moderate-income geographies. The 2013 FFIEC Updated Median Family Income (MFI) was $73,400. This represents a 3.7 percent decrease compared to the 2011 MFI of $76,200. There was an overall net increase in the number of low- or moderate-income families from 2011 to 2013. According to the U.S. Census data, low-income families increased from 13.14 percent in census year 2000 to 15.8 percent in census year 2010, or 20.6 percent. There was also an increase in the number of moderate-income families over the same time-period, from 16 percent in census year 2000 to 16.3 percent in census year 2010, or 1.8 percent. Families living below the poverty level increased from 6 percent in the 2000 Census to 8 percent in the 2010 Census. Strong competition exists for financial services within the AA. Per the June 30, 2013 FDIC Deposit Market Share Report, FNBO ranks fifth of 63 depository financial institutions, with a 5.3 percent market share. Competitors include several branches of national, regional, and local community banks operating in the AA. The top five competitors, in order of their ranking, are BMO Harris Bank N.A., JPMorgan Chase Bank N.A., Old Second National Bank, Fifth Third Bank, and PNC Bank, N.A. These competitors control 40 percent of the deposit market share in the AA. FNBO’s deposits in the AA as of June 30, 2013, totaled $963.9 million, representing 8.7 percent of total deposits. The competition maintains 364 offices within the AA. As of December 31, 2013, FNBO had 12 branches in the AA. Employment and Economic Factors The economic condition of the AA improved slightly over the evaluation period. The AA continues to recover from a downturn in private services, which restrained employment growth. According to the U.S. Bureau of Labor Statistics (http://beta.bls.gov), unemployment rates for the AA improved from 9.5 percent as of December 2010 compared to 8.2 percent as of December 2013. As of December 2013, the Illinois and nationwide unemployment rates were 8.3 percent and 6.7 percent, respectively. According to Moody’s Analytics, employment in the AA is most concentrated within professional and business services, education and health services, and retail trade. Major employers include Advocate Health Care System, University of Chicago, JPMorgan Chase & Company, Northwestern Memorial Healthcare, Walgreen Company, and United Continental Holdings Inc., among others. Housing The number of housing units is much lower in low-income geographies than middle-and upper-income geographies. According to the 2010 U.S. Census, only 0.3 percent of owner-occupied units were located in low-income census tracts, which is higher than the 0.1 percent, reported in the 2000 U.S. Census. Of the total housing units in low-income geographies, 76.3 percent were occupied rental units and 11.9 percent were vacant units. These statistics show an increase in the number of occupied rental units and the number of vacant units when

Charter Number: 209
Appendix C- 9
compared to the 2000 U.S. Census data, which showed 6.9 percent occupied rentals and 2.1 percent vacant units. Home ownership for low-income borrowers may be difficult due to high median housing prices compared to median family incomes. According to the National Association of REALTORS median sales price report of historical median prices for the MSA, the median housing price for the AA was $205,900 as of year-end 2014. .Median home prices are relatively high in the AA when considering a high end income for low-income families of approximately $36,699. Community Contact A community contact conducted in the AA was reviewed as part of this performance evaluation. This contact was part of a group that addresses community needs and helps stabilize the changing economic conditions of the area by providing programs and services promoting arts and culture, education, economic development, environment, housing, and open space within the area. According to the contact, affordable housing for low- and moderate-income individuals, funding for small businesses, and funds for entrepreneurs to start businesses are needs within the AA.

Charter Number: 209
Appendix C- 10
Elgin IL MD
Demographic Information for Full Scope Area: Elgin IL MD – 2010 Census
Demographic Characteristics
#
Low % of #
Moderate % of #
Middle % of #
Upper % of #
NA* % of #
Geographies (Census Tracts/BNAs) 103 4.85 33.98 40.78 20.39 0.00 Population by Geography 620,429 3.84 32.81 36.99 26.36 0.00 Owner-Occupied Housing by Geography
154,912 0.60 26.19 42.37 30.84 0.00
Business by Geography 31,687 2.68 21.59 46.65 29.09 0.00 Farms by Geography 1,322 0.76 13.99 64.52 20.73 0.00 Family Distribution by Income Level 151,028 19.70 18.47 21.56 40.28 0.00 Distribution of Low and Moderate Income Families throughout AA Geographies
57,640 2.99 47.67 36.36 12.98 0.00
Median Family Income HUD Adjusted Median Family Income for 2014 Households Below Poverty Level
76,576 76,300
9%
Median Housing Value Unemployment Rate (2010 US Census)
245,260 4.16%
(*) The NA category consists of geographies that have not been assigned an income classification. Source: 2010 U.S. Census and 2014 FFIEC updated MFI. The Elgin IL MD AA includes DeKalb and Kane Counties in Illinois, which is the entire MD. The Office of Management and Budget made geographic boundary revisions to exclude DeKalb and Kane Counties from the Chicago-Naperville-Arlington Heights MD effective January 1, 2014. FNBO served these counties prior to 2014 and they are detailed in the Chicago-Naperville-Arlington Heights MD profile. According to the U.S. Census data, the AA consists of 103 census tracts of which, five are low-income, 35 are moderate-income, 42 are middle-income, and 21 are upper-income. The assessment area meets the requirements of the CRA regulation and does not arbitrarily exclude low- or moderate-income geographies. The AA population totals 620,429. The 2014 FFIEC Updated MFI was $76,300. According to the U.S. Census data, low-income families represent 19.7 percent of families in the AA. Moderate-income families represent 18.5 percent of families in the AA. In addition, 9 percent of households reported incomes that are below the poverty level. Strong competition exists for financial services within the AA. Per the June 30, 2014 FDIC Deposit Market Share Report, FNBO ranks seventh of 40 depository financial institutions in the AA, with a 4.8 percent market share. Competitors include several branches of national, regional, and local community banks operating in the AA. FNBO’s top five competitors, in order of market share rank, are JPMorgan Chase Bank, N.A., Old Second National Bank, BMO Harris Bank, N.A., Fifth Third Bank, and St. Charles Bank & Trust Company. These competitors control 45.7 percent of the deposit market share in the AA. FNBO’s deposits in the AA as of June 30, 2014, totaled $526.4 million, representing 3.79 percent of total deposits. The competition maintains 206 offices in the AA. As of December 31, 2015 FNBO had five branches in the AA.

Charter Number: 209
Appendix C- 11
Employment and Economic Factors The economic condition of the AA was recovering over the evaluation period. The AA continues to recover from a downturn in private services, which restrained employment growth. According to the U.S. Bureau of Labor Statistics (http://beta.bls.gov), the unemployment rate for the AA was 6 percent as of December 2014. The Illinois and nationwide unemployment rates were 6.2 percent and 5.6 percent, respectively. According to Moody’s Analytics, employment in the AA is most concentrated within professional and business services, education and health services, and retail trade. Major employers include Advocate Health Care System, University of Chicago, JPMorgan Chase & Company, Northwestern Memorial Healthcare, Walgreen Company, and United Continental Holdings Inc. Housing There are limited opportunities for home mortgage lending in this AA’s low-income geographies due to the low number of housing units. The number of housing units is much lower in low-income geographies than middle-and upper-income geographies. According to the 2010 U.S. Census, 0.6 percent of owner-occupied units were located in low-income census tracts. Of the total housing units in low-income geographies, 76.3 percent were occupied rental units and 11.9 percent were vacant units. Home ownership for low-income individuals may be difficult due to high median housing prices compared to median family income. According to the 2010 U.S. Census, the median housing price for the AA was $245,260 at year-end 2014. Median home prices are relatively high in the AA when considering low-income families earned at most $38,149. Community Contact A community contact conducted in the AA was reviewed as part of this performance evaluation. This contact was a business development organization that works with the Small Business Administration and the Department of Commerce and Economic Opportunity to help small business owners and provide financial counseling. According to the contact, additional opportunity for small business lending is needed, particularly for loans less than $100,000.

Charter Number: 209
Appendix C- 12
State of Iowa Des Moines-West Des Moines MSA
Demographic Information for Full Scope Area: Des Moines-West Des Moines MSA - 2000 Census
Demographic Characteristics
#
Low % of #
Moderate % of #
Middle % of #
Upper % of #
NA* % of #
Geographies (Census Tracts/BNAs) 92 6.52 25.00 50.00 18.48 0.00 Population by Geography 429,370 4.75 21.35 49.26 24.65 0.00 Owner-Occupied Housing by Geography 118,679 1.90 19.88 51.88 26.35 0.00 Business by Geography 55,983 9.30 10.72 46.21 33.76 0.00 Farms by Geography 2,165 1.20 6.42 65.59 26.79 0.00 Family Distribution by Income Level 112,355 17.59 18.89 25.11 38.42 0.00 Distribution of Low and Moderate Income Families throughout AA Geographies
40,982 6.92 31.77 48.09 13.21 0.00
Median Family Income HUD Adjusted Median Family Income for 2011 Households Below Poverty Level
55,620 74,500
7%
Median Housing Value Unemployment Rate (2000 US Census)
105,160 2.53%
(*) The NA category consists of geographies that have not been assigned an income classification. Source: 2000 U.S. Census and 2011 HUD updated MFI.
Demographic Information for Full Scope Area: Des Moines- West Des Moines MSA -2010 Census
Demographic Characteristics
#
Low % of #
Moderate % of #
Middle % of #
Upper % of #
NA* % of #
Geographies (Census Tracts/BNAs) 116 6.90 26.72 40.52 25.00 0.86 Population by Geography 512,454 5.13 23.54 40.20 31.13 0.00 Owner-Occupied Housing by Geography 142,420 2.61 20.74 42.84 33.81 0.00 Business by Geography 48,298 10.77 17.61 38.36 33.16 0.11 Farms by Geography 2,260 1.59 8.89 63.85 25.66 0.00 Family Distribution by Income Level 129,647 19.86 17.83 22.59 39.73 0.00 Distribution of Low and Moderate Income Families throughout AA Geographies
48,861 8.56 36.81 38.23 16.40 0.00
Median Family Income HUD Adjusted Median Family Income for 2013 Households Below Poverty Level
71,705 72,900
9%
Median Housing Value Unemployment Rate (2010 US Census)
157,065 2.81%
(*) The NA category consists of geographies that have not been assigned an income classification. Source: 2010 U.S. Census and 2013 FFIEC updated MFI. The Des Moines-West Des Moines AA represents part of the MSA and consists of Dallas, Madison, and Polk Counties in Iowa. The Des Moines-West Des Moines IA MSA consists of Dallas, Guthrie, Madison, Polk, and Warren Counties. However, FNBO limited their AA to the three counties they were reasonably able to serve. FNBO closed its only branch in the AA on July 26, 2013. The AA population increased by 83,084 or 19.3 percent between census years 2000 and 2010. The AA consists of 116 census tracts, of which eight are low-income, 31 are moderate-income,

Charter Number: 209
Appendix C- 13
47 are middle-income, 29 are upper-income, and one is unclassified. The assessment area meets the requirements of the CRA regulation and does not arbitrarily exclude low- or moderate-income geographies. The 2013 FFIEC Updated MFI was $72,900. This represents a 2.1 percent decrease compared to the 2011 MFI of $74,500. There was a slight overall net increase in the number of low- or moderate-income families from 2011 to 2013. According to the U.S. Census data, low-income families increased from 17.6 percent in census year 2000 to 19.9 percent in census year 2010, or 12.9 percent. However, there was a decrease in the number of moderate-income families over the same time-period, from 18.9 percent to 17.8 percent, or 5.6 percent. Households living below the poverty level increased to 9 percent in the 2010 census year from 7.00 percent in the 2000 census year. Historically FNBO’s presence in this market was extremely small. The bank operated one branch within the AA. The branch was located within a low-income census tract within the downtown business district of the city of Des Moines, IA. Competition for financial services within the AA is strong. Per the June 30, 2013 FDIC Deposit Market Share Report, the bank ranked 45th of 46 depository financial institutions in the AA, with less than a 0.1 percent market share. Competitors include several branches of national, regional, and local community banks operating in the AA. The top five competitors, in order of their ranking, were Wells Fargo Bank, N.A, Principal Bank, Bankers Trust Company, West Bank, and U.S. Bank, N.A. These competitors control 64.5 percent of the deposit market share in the AA. The competition maintains 203 offices in the AA. Employment and Economic Factors The economic condition of the AA improved over the evaluation period. According to the U.S. Bureau of Labor Statistics (http://beta.bls.gov), unemployment rates for the AA improved from 5.5 percent as of September 2010 compared to 4.3 percent as of July 2013. The strong agricultural economy kept the state of Iowa unemployment rate lower than the national average. As of July 2013, the Iowa and nationwide unemployment rates were 4.7 percent and 7.3 percent, respectively. According to Moody’s Analytics, employment is concentrated in financial services, professional and business services, healthcare, and retail trade. While generally the financial, insurance, and healthcare businesses were negatively impacted by the downturn in the economy, the agribusiness benefited from record corn and soybean prices. Major employers in the area include Wells Fargo and Company, Hy-Vee Inc., Mercy Medical Center, UnityPoint Health, Principal Financial Group, Nationwide/Allied Insurance, and DuPont Pioneer. Housing There are limited opportunities for home mortgage lending in this AA’s low-income geographies due to the low number of housing units, and the housing stock is much lower in low-income geographies than middle and upper-income geographies. According to the 2010 U.S. Census, 2.6 percent of owner-occupied units were located in low-income census tracts, which is higher than the 1.9 percent, reported in the 2000 U.S. Census. Of the total housing units in low-income geographies, 58.2 percent were occupied rental units and 11.5 percent

Charter Number: 209
Appendix C- 14
were vacant units. These statistics show a decrease in the number of occupied rental units and an increase in the number of vacant units when compared to the 2000 U.S. Census data, which showed 65.1 percent occupied rentals and 10.6 percent vacant units. Home ownership for some low-income individuals may be difficult due to high median housing prices compared to median family incomes. According to the National Association of REALTORS median sales price report of historical median prices for the MSA, the median housing price for the AA was $170,400 as of year-end 2013. Median home prices are relatively high in the AA when considering a maximum income for low-income families of approximately $36,449. Approximately 9 percent of households are living below poverty, and would likely not be able to afford owner occupied housing in this AA. According to the 2010 U.S. Census, the median age of housing stock is high in this AA and is especially high in both low- and moderate-income geographies. Older housing typically has higher maintenance costs. Per the 2010 U.S. Census, the median age of housing for low- and moderate-income geographies was 54 years and 53 years, respectively. In comparison, the median age of middle- and upper income geographies was much lower at 39 years and 21 years, respectively. Due to the older age of housing stock in low- and moderate-income geographies, we would expect a higher average maintenance cost, thus adding to home ownership costs. This may impact homeownership ability more for low- or moderate-income individuals in this AA. Community Contact Two community contacts conducted in the AA were reviewed, as part of this performance evaluation. One was a small business lending organization and the other was a community development organization. They expressed the need for small business lending due to banks tightening credit standards during the economic downturn making it harder for small businesses to qualify for loans. In addition, there is a need for affordable housing, CD in low- or moderate-income areas, and community services in the form of financial literacy and homebuyer education.

Charter Number: 209
Appendix C- 15
State of Kansas Kansas City KS- MSA
Demographic Information for Full Scope Area: Kansas City KS MSA - 2000 Census
Demographic Characteristics
#
Low % of #
Moderate % of #
Middle % of #
Upper % of #
NA* % of #
Geographies (Census Tracts/BNAs) 107 0.00 1.87 38.32 59.81 0.00 Population by Geography 451,086 0.00 1.64 37.21 61.15 0.00 Owner-Occupied Housing by Geography 126,231 0.00 0.97 33.40 65.63 0.00 Business by Geography 64,677 0.00 1.80 27.87 70.33 0.00 Farms by Geography 1,286 0.00 1.56 33.98 64.46 0.00 Family Distribution by Income Level 122,280 8.46 12.92 21.87 56.75 0.00 Distribution of Low and Moderate Income Families throughout AA Geographies
26,143 0.00 3.56 56.46 39.98 0.00
Median Family Income HUD Adjusted Median Family Income for 2011 Households Below Poverty Level
55,031 72,300
4%
Median Housing Value Unemployment Rate (2000 US Census)
157,354 1.29%
(*) The NA category consists of geographies that have not been assigned an income classification. Source: 2000 U.S. Census, and 2011 HUD updated MFI.
Demographic Information for Full Scope Area: Kansas City KS MSA - 2010 Census
Demographic Characteristics
#
Low % of #
Moderate % of #
Middle % of #
Upper % of #
NA* % of #
Geographies (Census Tracts/BNAs) 130 0.77 11.54 29.23 56.15 2.31 Population by Geography 544,179 0.68 10.13 28.43 60.75 0.01 Owner-Occupied Housing by Geography 151,234 0.28 7.54 27.86 64.32 0.00 Business by Geography 49,703 0.53 8.81 23.51 64.16 3.00 Farms by Geography 1,169 0.09 8.13 29.26 62.02 0.51 Family Distribution by Income Level 143,509 10.75 13.05 20.10 56.11 0.00 Distribution of Low and Moderate Income Families throughout AA Geographies
34,148 1.71 21.80 38.63 37.86 0.00
Median Family Income HUD Adjusted Median Family Income for 2014 Households Below Poverty Level
68,846 73,300
5%
Median Housing Value Unemployment Rate (2010 US Census)
224,105 2.55%
(*) The NA category consists of geographies that have not been assigned an income classification. Source: 2010 U.S. Census and 2014 FFIEC updated MFI. The Kansas City KS-MSA AA includes Johnson County in Kansas and is a portion of the Kansas City KS-MO MMSA. The Kansas City KS-MO MMSA is comprised of 15 counties, six in Kansas (Franklin, Johnson, Leavenworth, Linn, Miami, and Wyandotte) and nine in Missouri (Bates, Caldwell, Cass, Clay, Clinton, Jackson, Lafayette, Platte, and Ray). However, FNBO limited their AA to the county that they were reasonably able to serve. The AA population increased by 93,093, or 20.6 percent between census years 2000 and 2010. The AA includes the city of Overland Park, which is Kansas’s second most populated city. Johnson County is the largest populated county in Kansas. According to the U.S. Census data, the AA consists of

Charter Number: 209
Appendix C- 16
130 census tracts of which, one are low-income, 15 are moderate-income, 38 are middle-income, and 73 are upper-income, and three unclassified. The assessment area meets the requirements of the CRA regulation and does not arbitrarily exclude low- or moderate-income geographies. The 2014 FFIEC Updated MFI was $73,300. This represents a 1.38 percent increase compared to the 2011 MFI of $72,300. There was an overall net increase in the number of low- or moderate-income families from 2011 to 2014. According to the U.S. Census data, low-income families increased from 8.46 percent in census year 2000 to 10.75 percent in census year 2010, or 27.07 percent. There was also an increase in the number of moderate-income families over the same time-period, from 12.9 percent in census year 2000 to 13 percent in census year 2010, or 1 percent. Families living below the poverty level increased to 5 percent in the 2010 census year from 4 percent in the 2000 census year. Strong competition exists for financial services within the AA. Per the June 30, 2014 FDIC Deposit Market Share Report, FNBO ranks sixth of 62 depository financial institutions in the AA, with a 4.7 percent market share. Competitors include several branches of national, regional, and local community banks operating in the AA. The top five competitors, in order of their ranking, are Capital Federal Savings Bank, U.S. Bank, N.A., Commerce Bank, Bank of America, N.A., and Wells Fargo Bank, N.A. These competitors control 42.7 percent of the deposit market share in the AA. FNBO’s deposits in the AA as of June 30, 2014 totaled $741.4 million, representing 5.3 percent of total deposits. The competition maintains 229 offices within the AA. As of December 31, 2015, FNBO had six branches in the AA. The bank supplemented its branch network with six deposit-taking ATMs. Employment and Economic Factors The economic condition of the AA has improved over the evaluation period and is strong. According to the U.S. Bureau of Labor Statistics (http://beta.bls.gov), unemployment rates for the AA improved from 8.2 percent as of December 2010 compared to 4.6 percent as of December 2014. As of December 2014, the Kansas and nationwide unemployment rates were 4.2 percent and 5.6 percent, respectively. According to Moody’s Analytics, employment in the AA is most concentrated within professional and business services, government, education and health services, retail trade, and leisure and hospitality. Major employers include Cerner Corporation, HCA Midwest Health System, Saint Luke’s Health System, Sprint Corporation, Children’s Mercy Hospital and Clinics, and Ford Motor Company among others. The AA exhibited market strengths including a well-educated workforce, good transportation infrastructure, and below-average costs of doing business. Housing There are limited opportunities for home mortgage lending in this AA’s low- and moderate-income geographies due to the low number of housing units. The number of housing units is very low in the low-income census tracts. According to the 2010 U.S. Census, 0.3 percent of owner-occupied units were located in low-income census tracts and 7.54 percent in moderate-income, which is higher than no low-income tracts and 1 percent moderate-income tracts, reported in the 2000 U.S. Census. Of the total housing units in low-income geographies, 60.2 percent were occupied rental units and 14.28 percent were vacant. These statistics show an

Charter Number: 209
Appendix C- 17
increase in the number of occupied rental units and the number of vacant units when compared to the 2000 U.S. Census data, as there were no low-income census tracts reported. In moderate-income geographies, 47.8 percent were occupied rental units and 7.3 percent were vacant units, according to 2010 U.S. Census data. These statistics reflect a decrease in occupied rental units and increase vacant rental units when compared to 2000 U.S. Census data, which showed 58.7 percent occupied rentals and 4.9 percent vacant units. Home ownership for low-income individuals may be difficult due to higher median housing prices compared to median family incomes. According to the National Association of REALTORS median sales price report of historical median prices for the MSA, the median housing price for the AA was $158,800 at year-end 2014. Median home prices are relatively high in the AA when considering a median family income of $73,300 means low -income families earned at most $36,650. Community Contact: Two community contacts conducted in the AA were reviewed as part of this performance evaluation. One contact was a non-profit community development corporation dedicated to revitalizing, stabilizing and reinvesting in the AA. The contact noted a need for funding for projects that revitalize low- or moderate-income areas as well as financial education and down payment assistance programs for the AA. The other contact was an affordable housing organization. They cited a need for financial institution participation in the Johnson County Housing Services First Time Homebuyer Program and the HOME rehabilitation program. These programs benefit low- or moderate-income individuals by providing access to affordable housing within the AA. In addition, there is a need for financial literacy, credit repair, and small business planning training.

Charter Number: 209
Appendix C- 18
State of Nebraska Lincoln MSA
Demographic Information for Full Scope Area: Lincoln MSA - 2000 Census
Demographic Characteristics
#
Low % of #
Moderate % of #
Middle % of #
Upper % of #
NA* % of #
Geographies (Census Tracts/BNAs) 59 3.39 25.42 38.98 25.42 6.78 Population by Geography 250,291 3.32 21.12 49.31 24.05 2.20 Owner-Occupied Housing by Geography 59,967 0.63 13.30 55.94 30.13 0.00 Business by Geography 27,754 2.05 23.20 42.12 31.65 0.98 Farms by Geography 1,273 0.16 7.15 67.56 25.06 0.08 Family Distribution by Income Level 61,372 17.18 19.02 26.09 37.71 0.00 Distribution of Low and Moderate Income Families throughout AA Geographies
22,213 4.16 30.54 53.01 12.29 0.00
Median Family Income HUD Adjusted Median Family Income for 2011 Households Below Poverty Level
53,463 69,500
10%
Median Housing Value Unemployment Rate (2000 US Census)
106,015 2.10%
(*) The NA category consists of geographies that have not been assigned an income classification. Source: 2000 U.S. Census and 2011 HUD updated MFI.
Demographic Information for Full Scope Area: Lincoln MSA - 2010 Census
Demographic Characteristics
#
Low % of #
Moderate % of #
Middle % of #
Upper % of #
NA* % of #
Geographies (Census Tracts/BNAs) 74 13.51 20.27 31.08 31.08 4.05 Population by Geography 285,407 11.91 18.93 36.83 31.79 0.53 Owner-Occupied Housing by Geography 69,500 4.96 14.03 40.58 40.43 0.00 Business by Geography 20,971 7.75 22.65 32.23 36.94 0.43 Farms by Geography 1,142 1.58 8.49 20.32 69.61 0.00 Family Distribution by Income Level 69,373 19.40 18.18 23.30 39.12 0.00 Distribution of Low and Moderate Income Families throughout AA Geographies
26,069 15.97 25.94 38.00 20.09 0.00
Median Family Income HUD Adjusted Median Family Income for 2014 Households Below Poverty Level
66,851 67,800
13%
Median Housing Value Unemployment Rate (2010 US Census)
146,648 3.03%
(*) The NA category consists of geographies that have not been assigned an income classification. Source: 2010 U.S. Census and 2014 FFIEC updated MFI. The Lincoln MSA AA includes Lancaster County in Nebraska. While the Lincoln MSA includes both Lancaster and Seward Counties, FNBO limited their AA to the area they were reasonably able to serve. The AA population increased by 35,116, or 14 percent between census years 2000 and 2010. The AA includes the city of Lincoln, which is the county seat of Lancaster County, the capitol of Nebraska, and the second most populated city in Nebraska. According to the U.S. Census data, the AA consists of 74 census tracts of which, 10 are low-income, 15 are moderate-income, 23 are middle-income, and 23 are upper-income, and three unclassified.

Charter Number: 209
Appendix C- 19
The assessment area meets the requirements of the CRA regulation and does not arbitrarily exclude low- or moderate-income geographies. The 2014 FFIEC Updated MFI was $67,800. This represents a 2.45 percent decrease compared to the 2011 MFI of $69,500. There was an overall net increase in the number of low- or moderate-income families from 2011 to 2014. According to the U.S. Census data, low-income families increased from 17.2 percent in census year 2000 to 19.4 percent in census year 2010, or 12.9 percent. There was a decrease in the number of moderate-income families over the same time-period, from 19.02 percent in census year 2000 to 18.2 percent in census year 2010, or 4.4 percent. Families living below the poverty level increased to 13 percent in the 2010 census year from 10 percent in the 2000 census year. Strong competition exists for financial services within the AA. Per the June 30, 2014 FDIC Deposit Market Share Report, FNBO ranks eighth of 24 depository financial institutions in the AA, with a 3.40 percent market share. Competitors include several branches of national, regional, and local community banks operating in the AA. The top five competitors, in order of their ranking, are Union Bank and Trust Company, Wells Fargo Bank, N.A., U.S. Bank, N.A., Pinnacle Bank, and Cornhusker Bank. These competitors control 72 percent of the deposit market share in the AA. FNBO’s deposits in the AA as of June 30, 2014 totaled $215.3 million, representing 1.5 percent of total deposits. The competition maintains 126 offices within the AA. As of December 31, 2015, FNBO had five branches in the AA. The bank supplemented its branch network with four deposit-taking ATMs. Employment and Economic Factors The economic condition of the AA has improved over the evaluation period and is good. According to the U.S. Bureau of Labor Statistics (http://beta.bls.gov), unemployment rates for the AA improved from 3.70 percent as of December 2010 compared to 2.6 percent as of December 2014. As of December 2014, the Nebraska and nationwide unemployment rates were 3.1 percent and 5.6 percent, respectively. According to Moody’s Analytics, employment in the AA is most concentrated within government, education and health services, retail trade, financial services, and leisure and hospitality. Major employers include the University of Nebraska-Lincoln, Bryant GH Medical Center, Saint Elizabeth Health Systems, Hy-Vee Inc., B&R Stores, State Farm Mutual Insurance Company, Madonna Rehabilitation Hospital, BNSF Railway Company, and Kawasaki Motors Manufacturing Corporation, among others. The AA exhibited market strengths including a well-educated and inexpensive workforce, good transportation infrastructure, good industrial diversity, and stable housing prices. Housing There are somewhat limited opportunities for home mortgage lending in this AA’s low-income geographies due to the relatively low number of housing units in low-income geographies. According to the 2010 U.S. Census, 5 percent of owner-occupied units were located in low-income census tracts, which is higher than the 0.6 percent reported in the 2000 U.S. Census. Of the total housing units in low-income geographies, 65.6 percent were occupied rental units and 21.4 percent were vacant units. These statistics show a decrease in the number of occupied rental units and number of vacant units when compared to the 2000 U.S. Census data, which showed 83.8 percent occupied rentals and 8.2 percent vacant units.

Charter Number: 209
Appendix C- 20
While housing costs are relatively affordable in the Lincoln MSA AA, 13 percent of households live below poverty. People living below poverty are not likely to afford home ownership and may limit home lending opportunities, especially for low- or moderate-income people in this AA. Housing stock is relatively old in this AA. According to the 2010 U.S. Census, the median age of housing stock is higher in low- and moderate-income geographies than middle- and upper-income geographies. Older housing typically has higher maintenance costs. Per the 2010 U.S. Census, the median age of housing for low- and moderate-income geographies was 49 and 44 years, respectively. In comparison, the median age of middle- and upper income geographies was lower at 38 and 24 years, respectively. Due to the older age of housing stock in low- or moderate-income geographies, we would expect a higher average maintenance cost, impacting homeownership affordability, especially for low- or moderate-income individuals in this AA. Community Contact A community contact conducted in the AA was reviewed as part of this performance evaluation. As an affordable housing organization, they cited a need for more affordable housing for low- and moderate-income families. They expressed concern with the shortage of housing stock in the area, particularly for multi-family units and single-family lots. The area also experiences high rental rates due to the overall housing stock shortage.

Charter Number: 209
Appendix C- 21
State of Nebraska Non-MSA Counties AA
Demographic Information for Full Scope Area: Non-MSA Counties AA - 2010 Census
Demographic Characteristics
#
Low % of #
Moderate % of #
Middle % of #
Upper % of #
NA* % of #
Geographies (Census Tracts/BNAs) 83 0.00 7.23 77.11 15.66 0.00 Population by Geography 312,675 0.00 6.94 75.92 17.14 0.00 Owner-Occupied Housing by Geography 85,230 0.00 4.99 76.87 18.15 0.00 Business by Geography 24,908 0.00 6.07 76.04 17.89 0.00 Farms by Geography 5,214 0.00 4.60 81.47 13.92 0.00 Family Distribution by Income Level 81,270 17.80 17.85 23.38 40.96 0.00 Distribution of Low and Moderate Income Families throughout AA Geographies
28,977 0.00 9.54 78.55 11.92 0.00
Median Family Income HUD Adjusted Median Family Income for 2014 Households Below Poverty Level
54,221 58,600
13%
Median Housing Value Unemployment Rate (2010 US Census)
103,497 2.59%
(*) The NA category consists of geographies that have not been assigned an income classification. Source: 2010 U.S. Census and 2014 FFIEC updated MFI. The Non-MSA Counties AA includes the 18 counties FNBO is reasonably able to serve within the state of Nebraska. These include Box Butte, Buffalo, Colfax, Dawes, Dawson, Dodge, Hooker, Kearney, Lincoln, Madison, McPherson, Morrill, Phelps, Platte, Polk, Scotts Bluff, Sheridan, and Sioux Counties. Due to merger activity, the evaluation period for this AA is April 4, 2014 through December 31, 2014 thus our analysis is limited to 2010 U.S. Census data. According to the U.S. Census data, the AA consists of 83 census tracts of which, none are low-income, six are moderate-income, 64 are middle-income, and 13 are upper-income. The assessment area meets the requirements of the CRA regulation and does not arbitrarily exclude low- or moderate-income geographies. The AA population totals 312,675. The 2014 FFIEC Updated MFI was $58,600. According to the U.S. Census data, low-income families represent 17.8 percent of families in the AA. Moderate-income families represent 17.8 percent of families in the AA. In addition, 13 percent of households reported incomes that are below the poverty level. While strong competition to provide financial services exists within the bank’s AA, the June 30, 2014 FDIC Deposit Market Share Report shows FNBO ranked first of 64 depository financial institutions, with a 15.3 percent market share. Competitors include several branches of national, regional, and local community banks operating in the AA. FNBO’s top five competitors, in order of market share rank, are Pinnacle Bank, Elkhorn Valley Bank & Trust, Wells Fargo Bank, N.A., Great Western Bank, and Platte Valley Bank. These competitors control 26.5 percent of the deposit market share in the AA. FNBO’s deposits in the AA as of June 30, 2014, totaled $1.4 billion, representing 9.9 percent of total deposits. The competition maintains 198 offices in the AA. As of December 31, 2015, FNBO had 14 branches in the AA. The bank supplemented its branch network with 18 deposit-taking ATMs.

Charter Number: 209
Appendix C- 22
Employment and Economic Factors The economic condition of the AA was strong during the evaluation period. According to the 2010 U.S. Census data, the unemployment rate for the AA was 3.3 percent. During that same time, the Nebraska, and nationwide unemployment rates were 4.5 percent and 9.3 percent, respectively. The AA benefited from a strong agricultural economy. Farmers experienced record high corn and soybean prices in 2012, high yields in 2013, and record high cattle prices in 2014. Employment in the AA is most concentrated within agricultural, education and health, and manufacturing. Major employers include schools, hospitals, agricultural related businesses, and various small businesses among others. The AA exhibits market strengths including low business costs, a skilled workforce, low cost of living, and low unemployment. Housing There are limited opportunities for home mortgage lending in this AA’s moderate-income geographies due to the limited low- or moderate-income designated geographies and the low number of housing units. According to the 2010 U.S. Census, 5 percent of owner-occupied units were located in moderate-income census tracts and no low-income census tracts are located in this AA. Of the total housing units in moderate-income geographies, 42.8 percent were occupied rental units and 13.4 percent were vacant units. While home ownership costs are not prohibitive in this AA, a significant portion of the households live below poverty at 13 percent. Housing stock is relatively old in this AA, especially in the moderate-income geographies. According to the 2010 U.S. Census, the median age of housing stock is higher in moderate-income geographies than middle- and upper-income geographies. Older housing typically has higher maintenance costs. Per the 2010 U.S. Census, the median age of housing for moderate-income geographies was 54 years. In comparison, the median age of middle- and upper-income geographies was lower at 50 years and 33 years, respectively. Due to the older age of housing stock in this AA, we would expect a higher average maintenance cost, thus making it even more difficult to afford owner-occupied housing in this AA for low- or moderate-income individuals. Community Contact One community contact conducted in the AA was reviewed as part of this performance evaluation. They are part of an organization that assists agricultural producers and families. This includes providing education on financial literacy and research on production problems. The contact cited a need for agricultural-related credit. In addition, there is a need for middle-income housing, particularly apartments, and quality housing for low- or moderate-income individuals.

Charter Number: 209
Appendix C- 23
State of Texas Dallas-Plano-Irving MD
Demographic Information for Full Scope Area: Dallas-Plano-Irving MD - 2000 Census
Demographic Characteristics
#
Low % of #
Moderate % of #
Middle % of #
Upper % of #
NA* % of #
Geographies (Census Tracts/BNAs) 94 0.00 3.19 26.60 70.21 0.00 Population by Geography 561,926 0.00 2.82 29.65 67.53 0.00 Owner-Occupied Housing by Geography 142,107 0.00 1.51 25.36 73.14 0.00 Business by Geography 124,440 0.00 3.70 22.27 74.02 0.00 Farms by Geography 2,329 0.00 3.78 35.12 61.10 0.00 Family Distribution by Income Level 151,651 9.68 11.44 18.46 60.43 0.00 Distribution of Low and Moderate Income Families throughout AA Geographies
32,020 0.00 6.74 48.17 45.09 0.00
Median Family Income HUD Adjusted Median Family Income for 2011 Households Below Poverty Level
56,313 69,600
4%
Median Housing Value Unemployment Rate (2000 US Census)
164,583 1.68%
(*) The NA category consists of geographies that have not been assigned an income classification. Source: 2000 U.S. Census and 2011 HUD updated MFI.
Demographic Information for Full Scope Area: Dallas-Plano-Irving MD - 2010 Census
Demographic Characteristics
#
Low % of #
Moderate % of #
Middle % of #
Upper % of #
NA* % of #
Geographies (Census Tracts/BNAs) 204 0.49 7.84 24.51 67.16 0.00 Population by Geography 1,030,90
5 0.39 6.97 25.02 67.62 0.00
Owner-Occupied Housing by Geography 245,116 0.04 3.52 22.27 74.18 0.00 Business by Geography 103,927 0.12 8.25 19.15 72.48 0.00 Farms by Geography 2,078 0.48 7.75 27.29 64.49 0.00 Family Distribution by Income Level 255,174 11.86 11.88 17.44 58.82 0.00 Distribution of Low and Moderate Income Families throughout AA Geographies
60,568 1.16 14.87 36.66 47.32 0.00
Median Family Income HUD Adjusted Median Family Income for 2014 Households Below Poverty Level
67,175 69,100
6%
Median Housing Value Unemployment Rate (2010 US Census)
216,425 2.76%
(*) The NA category consists of geographies that have not been assigned an income classification. Source: 2010 U.S. Census and 2014 FFIEC updated MFI.
The Dallas-Plano-Irving MD AA includes Collin County and the southeast portion of Denton County in Texas. The Dallas-Plano-Irving TX MD includes Collin, Dallas, Denton, Ellis, Hunt, Kaufman and Rockwall Counties. However, FNBO limited their AA to the areas that they are reasonably able to serve. This AA grew significantly. The AA population increased by 468,979, or 83.5 percent between census years 2000 and 2010. The AA has 204 census tracts, of which one is low-income, 16

Charter Number: 209
Appendix C- 24
are moderate-income, 50 are middle-income, and 137 are upper-income. The number of census tracts grew by 117 percent. The assessment area meets the requirements of the CRA regulation and does not arbitrarily exclude low- or moderate-income geographies. The 2014 FFIEC Updated MFI was $69,100. This represents a 0.7 percent decrease compared to the 2011 MFI of $69,600. There was an overall net increase in the number of low- or moderate-income families from 2011 to 2014. According to the U.S. Census data, low-income families increased from 9.7 percent in census year 2000 to 11.9 percent in census year 2010, or 22.5 percent. There was also an increase in the number of moderate-income families over the same time-period, from 11.44 percent in census year 2000 to 11.9 percent in census year 2010, or 3.8 percent. Families living below the poverty level increased from 4 percent in the 2000 Census to 6 percent in the 2010 Census. Strong competition exists for financial services within the AA. Per the June 30, 2014 FDIC Deposit Market Share Report, FNBO ranks 18th of 71 depository financial institutions, with a 0.9 percent market share. Competitors include several branches of national, regional, and local community banks operating in the AA. The top five competitors, in order of their ranking, are JPMorgan Chase Bank N.A., Bank of America N.A., Wells Fargo Bank, N.A., ViewPoint Bank N.A., and Capital One N.A. These competitors control 57.2 percent of the deposit market share in the AA. FNBO’s deposits in the AA as of June 30, 2014, totaled $239.3 million, representing 1.7 percent of total deposits. The competition maintains 404 offices within the AA. As of December 31, 2015, FNBO had four branches in the AA. The bank supplemented its branch network with four deposit-taking ATMs. Employment and Economic Factors The economic condition of the AA improved over the evaluation period and was good. According to the U.S. Bureau of Labor Statistics (http://beta.bls.gov), unemployment rates for the AA improved from 7.60 percent as of December 2010 compared to 4.10 percent as of December 2014. As of December 2014, the Texas and nationwide unemployment rates were 4 percent and 5.6 percent, respectively. According to Moody’s Analytics, employment in the AA is most concentrated within professional and business services, education and health services, government, retail trade, and leisure and hospitality services. Major employers include Wal-Mart Stores Inc., Bank of America Corporation, Carlson Restaurants Worldwide, Texas Health Resources, Baylor Health Care System, AT&T, JPMorgan Chase & Company, and Texas Instruments Inc. among others. The AA exhibited market strengths including stable demand for professional services generated by many corporate headquarters, and being a well-positioned distribution center hub as international trade grows. Housing There are limited opportunities for home mortgage lending in this AA’s low- and moderate-income geographies due to the low number of housing units in these geographies. According to the 2010 U.S. Census, only 0.04 percent of owner-occupied units were located in low-income census tracts and 3.5 percent in moderate-income, which is higher than the 0.00 percent and 1.5 percent, respectively, reported in the 2000 U.S. Census. Of the total housing units in low-income geographies, 76 percent were occupied rental units and 20.2 percent were vacant units. These statistics show an increase in the number of occupied rental units and the

Charter Number: 209
Appendix C- 25
number of vacant units when compared to the 2000 U.S. Census data, as there were no low-income census tracts reported. In moderate-income geographies, 60.9 percent were occupied rental units and 11.1 percent were vacant units, according to 2010 U.S. Census data. These statistics reflect an increase in both occupied rental units and vacant rental units when compared to 2000 U.S. Census data, which showed 53.1 percent occupied rentals and 4.5 percent vacant units. Home ownership for low-income individuals is challenging due to high median housing prices compared to median family incomes. According to the National Association of REALTORS median sales price report of historical median prices for the MSA, the median housing price for the AA was $188,300 at year-end 2014. Median home prices are relatively high in the AA for low-income individuals, when considering a median family income of $69,100 that means the maximum for low-income families is $34,549. Community Contact
A community contact conducted in the AA was reviewed as part of this performance evaluation. The contact was from a real estate group within the AA. According to the contact, affordable housing for low- or moderate-income individuals is a need within the AA. There is a shortage of 3-bedroom, 2-bath homes in the $120,000 to $150,000 price range. A significant portion of the new housing stock is larger and more expensive homes.

Charter Number: 209
Appendix D- 1
Appendix D: Tables of Performance Data Content of Standardized Tables A separate set of tables is provided for each state. All multistate metropolitan areas are presented in one set of tables. References to the “bank” include activities of any affiliates that the bank provided for consideration (refer to appendix A: Scope of the Examination). For purposes of reviewing the lending test tables, the following are applicable: (1) purchased loans are treated as originations/purchases and market share is the number of loans originated and purchased by the bank as a percentage of the aggregate number of reportable loans originated and purchased by all lenders in the MA/assessment area; (2) Partially geocoded loans (loans where no census tract is provided) cannot be broken down by income geographies and, therefore, are only reflected in the Total Loans in Core Tables 2 through 7 and part of Table 13; and (3) Partially geocoded loans are included in the Total Loans and % Bank Loans Column in Core Tables 8 through 12 and part of Table 13. Deposit data are compiled by the FDIC and are available as of June 30 of each year. Tables without data are not included in this PE. The following is a listing and brief description of the tables included in each set: Table 1. Lending Volume - Presents the number and dollar amount of reportable loans originated and purchased by the bank over the evaluation period by MA/assessment area. Community development loans to statewide or regional entities or made outside the bank’s assessment area may receive positive CRA consideration. See Interagency Q&As __.12 (i) - 5 and - 6 for guidance on when a bank may receive positive CRA consideration for such loans. Table 2. Geographic Distribution of Home Purchase Loans - Compares the percentage distribution of the number of loans originated and purchased by the bank in low-, moderate-, middle-, and upper-income geographies to the percentage distribution of owner-occupied housing units throughout those geographies. The table also presents market share information based on the most recent aggregate market data available. Table 3. Geographic Distribution of Home Improvement Loans - See Table 2. Table 4. Geographic Distribution of Home Mortgage Refinance Loans - See Table 2. Table 5. Geographic Distribution of Multifamily Loans - Compares the percentage distribution of the number of multifamily loans originated and purchased by the bank in low-, moderate-, middle-, and upper-income geographies to the percentage distribution of multifamily housing units throughout those geographies. The table also presents market share information based on the most recent aggregate market data available. Table 6. Geographic Distribution of Small Loans to Businesses - The percentage distribution of the number of small loans (less than or equal to $1 million) to businesses originated and purchased by the bank in low-, moderate-, middle-, and upper-income

Charter Number: 209
Appendix D- 2
geographies compared to the percentage distribution of businesses (regardless of revenue size) throughout those geographies. The table also presents market share information based on the most recent aggregate market data available. Because small business data are not available for geographic areas smaller than counties, it may be necessary to use geographic areas larger than the bank’s assessment area. Table 7. Geographic Distribution of Small Loans to Farms - The percentage distribution of the number of small loans (less than or equal to $500,000) to farms originated and purchased by the bank in low-, moderate-, middle-, and upper-income geographies compared to the percentage distribution of farms (regardless of revenue size) throughout those geographies. The table also presents market share information based on the most recent aggregate market data available. Because small farm data are not available for geographic areas smaller than counties, it may be necessary to use geographic areas larger than the bank’s assessment area. Table 8. Borrower Distribution of Home Purchase Loans - Compares the percentage distribution of the number of loans originated and purchased by the bank to low-, moderate-, middle-, and upper-income borrowers to the percentage distribution of families by income level in each MA/assessment area. The table also presents market share information based on the most recent aggregate market data available. Table 9. Borrower Distribution of Home Improvement Loans - See Table 8. Table 10. Borrower Distribution of Refinance Loans - See Table 8. Table 11. Borrower Distribution of Small Loans to Businesses - Compares the percentage distribution of the number of small loans (less than or equal to $1 million) originated and purchased by the bank to businesses with revenues of $1 million or less to the percentage distribution of businesses with revenues of $1 million or less. In addition, the table presents the percentage distribution of the number of loans originated and purchased by the bank by loan size, regardless of the revenue size of the business. Market share information is presented based on the most recent aggregate market data available. Table 12. Borrower Distribution of Small Loans to Farms - Compares the percentage distribution of the number of small loans (less than or equal to $500,000) originated and purchased by the bank to farms with revenues of $1 million or less to the percentage distribution of farms with revenues of $1 million or less. In addition, the table presents the percentage distribution of the number of loans originated and purchased by the bank by loan size, regardless of the revenue size of the farm. Market share information is presented based on the most recent aggregate market data available. Table 13. Geographic and Borrower Distribution of Consumer Loans (OPTIONAL) - For geographic distribution, the table compares the percentage distribution of the number of loans originated and purchased by the bank in low-, moderate-, middle-, and upper-income geographies to the percentage distribution of households within each geography. For borrower distribution, the table compares the percentage distribution of the number of loans originated and purchased by the bank to low-, moderate-, middle-, and upper-income borrowers to the percentage of households by income level in each MA/assessment area.

Charter Number: 209
Appendix D- 3
Table 14. Qualified Investments - Presents the number and dollar amount of qualified investments made by the bank in each MA/AA. The table separately presents investments made in prior evaluation periods that are still outstanding and investments made during the current evaluation period. Prior-period investments are reflected at their book value as of the end of the evaluation period. Current period investments are reflected at their original investment amount even if that amount is greater than the current book value of the investment. The table also presents the number and dollar amount of unfunded qualified investment commitments. In order to be included, an unfunded commitment must be legally binding, tracked, and recorded by the bank’s financial reporting system. A bank may receive positive consideration for qualified investments in statewide/regional entities or made outside of the bank’s assessment area. See Interagency Q&As __.12 (i) - 5 and - 6 for guidance on when a bank may receive positive CRA consideration for such investments. Table 15. Distribution of Branch Delivery System and Branch Openings/Closings - Compares the percentage distribution of the number of the bank’s branches in low-, moderate-, middle-, and upper-income geographies to the percentage of the population within each geography in each MA/AA. The table also presents data on branch openings and closings in each MA/AA.

Charter Number: 209
Appendix D- 4
Tables of Performance Data Tables provided cover the bank’s performance from January 1, 2012 through December 31, 2014. Omaha-Council Bluffs (NE-IA) MMSA State of Colorado State of Illinois State of Iowa State of Kansas State of Nebraska State of Texas

Charter Number: 209
Appendix D-5
Institution ID: First National Bank of Omaha Table 1. Lending Volume
LENDING VOLUME Geography: OMAHA MULTISTATE (NE-IA) MMSA Evaluation Period: JANUARY 1, 2012 TO DECEMBER 31, 2014
Assessment Area
% of Rated Area
Loans (#) in MA/AA*
Home Mortgage
Small Loans to
Businesses
Small Loans to
Farms
Community Development Loans**
Total Reported Loans
% of Rated Area
Deposits in MA/AA***
#
$ (000’s)
# $ (000’s)
#
$ (000’s)
#
$ (000’s)
#
$(000’s)
Full Review: Omaha-Council Bluffs (NE-IA) MMSA
100.00 10,888 1,533,297 4,034 353,449 58 6,551 89 490,906 14,980 1,893,297 100.00
* Loan Data as of December 31, 2014. Rated area refers to either state or multi-state MA rating area. ** The evaluation period for Community Development Loans is from September 30, 2010 to December 31, 2015. *** Deposit Data as of June 30, 2014. Rated Area refers to either the state, multi-state MA, or institution, as appropriate.

Charter Number: 209
Appendix D-6
Institution ID: First National Bank of Omaha Table 2. Geographic Distribution of Home Purchase Loans
Geographic Distribution: HOME PURCHASE Geography: OMAHA MULTISTATE (NE-IA) MMSA Evaluation Period: JANUARY 1, 2012 TO DECEMBER
31, 2014 Assessment Area:
Total Home Purchase Loans
Low-Income Geographies
Moderate-Income Geographies
Middle-Income Geographies
Upper-Income Geographies
Market Share (%) by Geography*
# % of Total**
% Owner Occ
Units***
% BANK Loans****
% Owner Occ
Units***
% BANK Loans
% Owner Occ
Units***
% BANK Loans
% Owner Occ
Units***
% BANK Loans
Overall
Low
Mod
Mid
Upp
Full Review: Omaha-Council Bluffs (NE-IA) MMSA
4,664 100.00 5.77 2.81 18.37 12.89 42.26 39.22 33.60 45.09 10.99 10.87 10.40 10.98 11.18
* Based on 2014 Peer Mortgage Data -- US and PR ** Home purchase loans originated and purchased in the MA/AA as a percentage of all home purchase loans originated and purchased in the rated area. *** Percentage of Owner Occupied Units is the number of owner occupied units in a particular geography divided by the number of owner occupied housing units in the area based on 2010 Census information. **** Data shown includes only One to Four-family and manufactured housing. (Property type of 1 or 2)

Charter Number: 209
Appendix D-7
Institution ID: First National Bank of Omaha Table 3. Geographic Distribution of Home Improvement Loans
Geographic Distribution: HOME IMPROVEMENT Geography: OMAHA MULTISTATE (NE-IA) MMSA Evaluation Period: JANUARY 1, 2012
TO DECEMBER 31, 2014 Assessment Area:
Total Home Improvement
Loans
Low-Income Geographies
Moderate-Income Geographies
Middle-Income Geographies
Upper-Income Geographies
Market Share (%) by Geography*
# % of Total**
% Owner
Occ Units***
% BANK Loans****
% Owner Occ
Units***
% BANK Loans
% Owner Occ
Units***
% BANK Loans
% Owner Occ
Units***
% BANK Loans
Overall
Low
Mod
Mid
Upp
Full Review: Omaha-Council Bluffs (NE-IA) MMSA
1,205 100.00 5.77 5.06 18.37 14.19 42.26 38.26 33.60 42.49 20.42 30.10 21.14 19.06 20.38
* Based on 2014 Peer Mortgage Data -- US and PR ** Home improvement loans originated and purchased in the MA/AA as a percentage of all home improvement loans originated and purchased in the rated area. *** Percentage of Owner Occupied Units is the number of owner occupied units in a particular geography divided by the number of owner occupied housing units in the area based on 2010 Census information. **** Data shown includes only One to Four-family and manufactured housing. (Property type of 1 or 2)

Charter Number: 209
Appendix D-8
Institution ID: First National Bank of Omaha Table 4. Geographic Distribution of Home Mortgage Refinance Loans
Geographic Distribution: HOME MORTGAGE REFINANCE Geography: OMAHA MULTISTATE (NE-IA) MMSA Evaluation Period: JANUARY 1,
2012 TO DECEMBER 31, 2014 Assessment Area:
Total Home Mortgage
Refinance Loans
Low-Income Geographies
Moderate-Income Geographies
Middle-Income Geographies
Upper-Income Geographies
Market Share (%) by Geography*
# % of Total**
% Owner
Occ Units***
% BANK Loans****
% Owner Occ
Units***
% BANK Loans
% Owner Occ
Units***
% BANK Loans
% Owner Occ
Units***
% BANK Loans
Overall
Low
Mod
Mid
Upp
Full Review: Omaha-Council Bluffs (NE-IA) MMSA
4,992 100.00 5.77 2.36 18.37 10.14 42.26 35.82 33.60 51.68 7.86 8.57 7.30 7.31 8.65
* Based on 2014 Peer Mortgage Data -- US and PR ** Home refinance loans originated and purchased in the MA/AA as a percentage of all home refinance loans originated and purchased in the rated area. *** Percentage of Owner Occupied Units is the number of owner occupied units in a particular geography divided by the number of owner occupied housing units in the area based on 2010 Census information. **** Data shown includes only One to Four-family and manufactured housing. (Property type of 1 or 2)

Charter Number: 209
Appendix D-9
Institution ID: First National Bank of Omaha Table 5. Geographic Distribution of Multifamily Loans
Geographic Distribution: MULTIFAMILY Geography: OMAHA MULTISTATE (NE-IA) MMSA Evaluation Period: JANUARY 1, 2012 TO
DECEMBER 31, 2014 Assessment Area:
Total Multifamily Loans
Low-Income Geographies
Moderate-Income Geographies
Middle-Income Geographies
Upper-Income Geographies
Market Share (%) by Geography*
# % of Total**
% of MF Units***
% BANK Loans****
% MF Units***
% BANK Loans
% MF Units***
% BANK Loans
% MF Units***
% BANK Loans
Overall
Low
Mod
Mid
Upp
Full Review: Omaha-Council Bluffs (NE-IA) MMSA
27 100.00 12.80 29.63 30.00 48.15 40.54 18.52 16.66 3.70 8.87 3.33 11.11 9.68 11.11
* Based on 2014 Peer Mortgage Data -- US and PR ** Multi-family loans originated and purchased in the MA/AA as a percentage of all multi-family loans originated and purchased in the rated area. *** Percentage of Multi-Family Units is the number of multifamily units in a particular geography divided by the number of multifamily housing units in the area based on 2010 Census information. **** Multifamily loan distribution includes Home Purchases, Home Improvement and Refinances.

Charter Number: 209
Appendix D-10
Institution ID: First National Bank of Omaha Table 6. Geographic Distribution of Small Loans to Businesses
Geographic Distribution: SMALL LOANS TO BUSINESSES Geography: OMAHA MULTISTATE (NE-IA) MSA Evaluation Period: JANUARY 1,
2012 TO DECEMBER 31, 2014 Assessment Area:
Total Small Business
Loans
Low-Income Geographies
Moderate-Income Geographies
Middle-Income Geographies
Upper-Income Geographies
Market Share (%) by Geography*
# % of Total**
% of Businesses
***
% BANK Loans
% of Businesses
***
% BANK Loans
% of Businesses
***
% BANK Loans
% of Businesses
***
% BANK Loans
Overall
Low
Mod
Mid
Upp
Full Review: Omaha-Council Bluffs (NE-IA) MMSA
4,012 100.00 7.16 6.28 18.29 18.02 41.97 43.32 32.13 32.38 10.13 10.44 11.25 10.23 9.75
* Based on 2014 Peer Small Business Data -- US and PR ** Small loans to businesses originated and purchased in the MA/AA as a percentage of all small loans to businesses originated and purchased in the rated area. *** Source Data - Dun and Bradstreet (2014).

Charter Number: 209
Appendix D-11
Institution ID: First National Bank of Omaha Table 7. Geographic Distribution of Small Loans to Farms
Geographic Distribution: SMALL LOANS TO FARMS Geography: OMAHA MULTISTATE (NE-IA) MMSA Evaluation Period: JANUARY 1,
2012 TO DECEMBER 31, 2014 Assessment Area:
Total Small Farm Loans
Low-Income Geographies
Moderate-Income Geographies
Middle-Income Geographies
Upper-Income Geographies
Market Share (%) by Geography*
# % of Total**
% of Farms**
*
% BANK Loans
% of Farms**
*
% BANK Loans
% of Farms**
*
% BANK Loans
% of Farms*
**
% BANK Loans
Overall
Low
Mod
Mid
Upp
Full Review: Omaha-Council Bluffs (NE-IA) MMSA
57 100.00 1.95 17.54 11.79 17.54 57.30 49.12 28.95 15.79 5.78 71.43 11.43 4.29 3.96
* Based on 2014 Peer Small Business Data -- US and PR ** Small loans to farms originated and purchased in the MA/AA as a percentage of all small loans to farms originated and purchased in the rated area. *** Source Data - Dun and Bradstreet (2014).

Charter Number: 209
Appendix D-12
Institution ID: First National Bank of Omaha Table 8. Borrower Distribution of Home Purchase Loans
Borrower Distribution: HOME PURCHASE Geography: OMAHA MULTISTATE (NE-IA) MMSA Evaluation Period: JANUARY 1, 2012 TO
DECEMBER 31, 2014 Assessment Area:
Total Home Purchase Loans
Low-Income Borrowers
Moderate-Income Borrowers
Middle-Income Borrowers
Upper-Income Borrowers
Market Share*
# % of Total**
% Families
***
% BANK Loans*
***
% Families
2
% BANK Loans*
***
% Families
***
% BANK Loans****
% Families***
% BANK Loans
****
Overall
Low
Mod
Mid
Upp
Full Review: Omaha-Council Bluffs (NE-IA) MMSA
4,664 100.00 20.93 13.63 17.33 27.14 22.40 25.56 39.34 33.68 12.18 13.17 13.15 12.60 10.99
* Based on 2014 Peer Mortgage Data -- US and PR ** Home purchase loans originated and purchased in the MA/AA as a percentage of all home purchase loans originated and purchased in the rated area. *** Percentage of Families is based on the 2010 Census information. **** As a percentage of loans with borrower income information available. No information was available for 10.2% of loans originated and purchased by bank. 2 Data shown includes only One to Four-family and manufactured housing. (Property type of 1 or 2)

Charter Number: 209
Appendix D-13
Institution ID: First National Bank of Omaha Table 9. Borrower Distribution of Home Improvement Loans
Borrower Distribution: HOME IMPROVEMENT Geography: OMAHA MULTISTATE (NE-IA) MMSA Evaluation Period: JANUARY 1, 2012
TO DECEMBER 31, 2014 Assessment Area:
Total Home Improvement
Loans
Low-Income Borrowers
Moderate-Income Borrowers
Middle-Income Borrowers
Upper-Income Borrowers
Market Share*
# % of Total**
% Families
***
% BANK Loans****
% Families
3
% BANK Loans****
% Families
***
% BANK Loans****
% Families
***
% BANK Loans****
Overall
Low
Mod
Mid
Upp
Full Review: Omaha-Council Bluffs (NE-IA) MMSA
1,205 100.00 20.93 10.75 17.33 21.23 22.40 25.58 39.34 42.45 19.70 21.54 20.37 19.88 18.78
* Based on 2014 Peer Mortgage Data -- US and PR ** Home improvement loans originated and purchased in the MA/AA as a percentage of all home improvement loans originated and purchased in the rated area. *** Percentage of Families is based on the 2010 Census information. **** As a percentage of loans with borrower income information available. No information was available for 6.6% of loans originated and purchased by bank. 3 Data shown includes only One to Four-family and manufactured housing. (Property type of 1 or 2)

Charter Number: 209
Appendix D-14
Institution ID: First National Bank of Omaha Table 10. Borrower Distribution of Home Mortgage Refinance Loans
Borrower Distribution: HOME MORTGAGE REFINANCE Geography: OMAHA MULTISTATE (NE-IA) MMSA Evaluation Period: JANUARY 1,
2012 TO DECEMBER 31, 2014 Assessment Area:
Total Home Mortgage Refinance
Loans
Low-Income Borrowers
Moderate-Income Borrowers
Middle-Income Borrowers
Upper-Income Borrowers
Market Share*
# % of Total**
% Families
***
% BANK Loans****
% Families4
% BANK Loans****
% Families
***
% BANK Loans****
% Families
***
% BANK Loans*
***
Overall
Low
Mod
Mid
Upp
Full Review: Omaha-Council Bluffs (NE-IA) MMSA
4,992 100.00 20.93 7.88 17.33 19.01 22.40 25.40 39.34 47.71 8.50 8.42 9.18 9.90 7.40
* Based on 2014 Peer Mortgage Data -- US and PR ** Home refinance loans originated and purchased in the MA/AA as a percentage of all home refinance loans originated and purchased in the rated area. *** Percentage of Families is based on the 2010 Census information. **** As a percentage of loans with borrower income information available. No information was available for 16.9% of loans originated and purchased by bank. 4 Data shown includes only One to Four-family and manufactured housing. (Property type of 1 or 2)

Charter Number: 209
Appendix D-15
Institution ID: First National Bank of Omaha Table 11. Borrower Distribution of Small Loans to Businesses
Borrower Distribution: SMALL LOANS TO BUSINESSES Geography: OMAHA MULTISTATE (NE-IA) MMSA Evaluation Period: JANUARY 1,
2012 TO DECEMBER 31, 2014 Total Small Loans to
Businesses Businesses With
Revenues of $1 million or less
Loans by Original Amount Regardless of Business Size Market Share*
Assessment Area:
# % of Total**
% of Businesses
***
% BANK Loans****
$100,000 or less >$100,000 to $250,000
>$250,000 to $1,000,000
All Rev$ 1 Million or Less
Full Review: Omaha-Council Bluffs (NE-IA) MMSA
4,034 100.00 71.86 30.66 80.94 8.73 10.34 10.13 6.91
* Based on 2014 Peer Small Business Data -- US and PR ** Small loans to businesses originated and purchased in the MA/AA as a percentage of all small loans to businesses originated and purchased in the rated area. *** Businesses with revenues of $1 million or less as a percentage of all businesses (Source D&B - 2014). **** Small loans to businesses with revenues of $1 million or less as a percentage of all loans reported as small loans to businesses. No information was available for 47.42% of small loans to businesses originated and purchased by the bank.

Charter Number: 209
Appendix D-16
Institution ID: First National Bank of Omaha Table 12. Borrower Distribution of Small Loans to Farms
Borrower Distribution: SMALL LOANS TO FARMS Geography: OMAHA MULTISTATE (NE-IA) MMSA Evaluation Period: JANUARY 1, 2012
TO DECEMBER 31, 2014 Assessment Area:
Total Small Loans to Farms
Farms With Revenues of $1 million or less
Loans by Original Amount Regardless of Farm Size Market Share*
# % of Total**
% of Farms***
% BANK Loans****
$100,000 or less >$100,000 to $250,000
>$250,000 to $500,000
All Rev$ 1 Million or Less
Full Review: Omaha-Council Bluffs (NE-IA) MMSA
58 100.00 97.97 53.45 62.07 24.14 13.79 5.78 6.03
* Based on 2014 Peer Small Business Data -- US and PR ** Small loans to farms originated and purchased in the MA/AA as a percentage of all small loans to farms originated and purchased in the rated area. *** Farms with revenues of $1 million or less as a percentage of all farms (Source D&B - 2014). **** Small loans to farms with revenues of $1 million or less as a percentage of all loans reported as small loans to farms. No information was available for 39.66% of small loans to farms originated and purchased by the bank.

Charter Number: 209
Appendix D-17
Institution ID: First National Bank of Omaha Table 14. Qualified Investments
QUALIFIED INVESTMENTS Geography: OMAHA MULTISTATE (NE-IA) MMSA Evaluation Period: SEPTEMBER 30, 2010 TO DECEMBER 31, 2015
Assessment Area:
Prior Period Investments* Current Period Investments Total Investments Unfunded Commitments**
# $(000’s) # $(000’s) # $(000’s) % of Total # $(000’s)
Full Review: Omaha-Council Bluffs (NE-IA) MMSA
3 13,219 115 40,614 118 53,833 100.00 1 820
* 'Prior Period Investments' means investments made in a previous period that are outstanding as of the examination date. ** 'Unfunded Commitments' means legally binding investment commitments that are tracked and recorded by the institution's financial reporting system.

Charter Number: 209
Appendix D-18
Institution ID: First National Bank of Omaha Table 15. Distribution of Branch Delivery System and Branch Openings/Closings
DISTRIBUTION OF BRANCH DELIVERY SYSTEM AND BRANCH OPENINGS/CLOSINGS Geography: OMAHA MULTISTATE(NE-IA) MMSA Evaluation Period: SEPTEMBER 30,2010 TO DECEMBER 31,
2015 MA/Assessment Area:
Deposits
Branches
Branch Openings/Closings
Population
% of Rated Area
Deposits in AA
# of BANK
Branches
% of Rated Area
Branches in AA
Location of Branches by Income of Geographies (%)^5
# of
Branch Openings
# of
Branch Closings
Net change in Location of Branches (+ or - )
% of Population within Each Geography
Low
Mod
Mid
Upp
Low
Mod
Mid
Upp
Low
Mod
Mid
Upp
Full Review: Omaha-Council Bluffs (NE-IA) MMSA
100.00 27 100.00 7.41 29.63 29.63 29.67 1 3 0 0 0 -2 9.28 21.78 38.61 30.01
5 ^Note: The Main Location is situated in an unclassified census tract.

Charter Number: 209
Appendix D-19
Institution ID: First National Bank of Omaha Table 1. Lending Volume
LENDING VOLUME Geography: COLORADO Evaluation Period: JANUARY 1, 2012 TO DECEMBER 31, 2014
Assessment Area (2014):
% of Rated Area
Loans (#) in MA/AA*
Home Mortgage
Small Loans to
Businesses
Small Loans to
Farms
Community Development Loans**
Total Reported Loans
% of Rated Area
Deposits in MA/AA***
#
$ (000’s)
# $ (000’s)
#
$ (000’s)
#
$ (000’s)
#
$(000’s)
Full Review: Ft Collins-Loveland MSA 53.60 1,616 321,386 1,358 143,277 37 3,987 28 59,108 3,011 468,650 64.03 Limited Review: Boulder MSA 13.14 277 65,138 455 36,911 6 59 11 12,143 738 102,108 13.17 Denver-Aurora-Lakewood MSA
7.99 169 59,386 278 21,415 2 37 1 327 449 80,838 5.31
Greeley MSA 25.28 662 132,453 689 60,938 69 8,109 2 626 1,420 201,500 17.49 CO Statewide Loans with P/M/F to serve AA(s)
0.00 0 0 0 0 0 0 1 655 0 0 0.00
CO Statewide Loans with no P/M/F to serve AA(s)
0.00 0 0 0 0 0 0 2 10,000 0 0 0.00
* Loan Data as of December 31, 2014. Rated area refers to either state or multi-state MA rating area. ** The evaluation period for Community Development Loans is from September 30, 2010 to December 31, 2015. *** Deposit Data as of June 30, 2014. Rated Area refers to either the state, multi-state MA, or institution, as appropriate.

Charter Number: 209
Appendix D-20
Institution ID: First National Bank of Omaha Table 2. Geographic Distribution of Home Purchase Loans
Geographic Distribution: HOME PURCHASE Geography: COLORADO Evaluation Period: JANUARY 1, 2012 TO DECEMBER 31, 2014
Assessment Area:
Total Home Purchase Loans
Low-Income Geographies
Moderate-Income Geographies
Middle-Income Geographies
Upper-Income Geographies
Market Share (%) by Geography*
# % of Total**
% Owner Occ
Units***
% BANK Loans****
% Owner Occ
Units***
% BANK Loans
% Owner Occ
Units***
% BANK Loans
% Owner Occ
Units***
% BANK Loans
Overall
Low
Mod
Mid
Upp
Full Review: Ft Collins-Loveland MSA 584 56.53 1.01 0.51 18.16 16.10 50.04 50.34 30.79 33.05 2.51 0.00 2.26 2.98 2.04 Limited Review: Boulder MSA 96 9.29 2.83 7.29 14.95 19.79 45.76 56.25 36.45 16.67 0.64 1.47 0.60 0.85 0.31 Denver-Aurora-Lakewood MSA
63 6.10 1.48 0.00 16.04 11.11 45.93 50.79 36.55 38.10 0.17 0.00 0.15 0.21 0.13
Greeley MSA 290 28.07 5.36 4.14 16.10 13.79 47.84 50.34 30.69 31.72 1.59 3.38 1.74 1.49 1.51
* Based on 2014 Peer Mortgage Data -- US and PR ** Home purchase loans originated and purchased in the MA/AA as a percentage of all home purchase loans originated and purchased in the rated area. *** Percentage of Owner Occupied Units is the number of owner occupied units in a particular geography divided by the number of owner occupied housing units in the area based on 2010 Census information. **** Data shown includes only One to Four-family and manufactured housing. (Property type of 1 or 2)

Charter Number: 209
Appendix D-21
Institution ID: First National Bank of Omaha Table 3. Geographic Distribution of Home Improvement Loans
Geographic Distribution: HOME IMPROVEMENT Geography: COLORADO Evaluation Period: JANUARY 1, 2012 TO DECEMBER 31,
2014 Assessment Area:
Total Home Improvement
Loans
Low-Income Geographies
Moderate-Income Geographies
Middle-Income Geographies
Upper-Income Geographies
Market Share (%) by Geography*
# % of Total**
% Owner Occ
Units***
% BANK Loans****
% Owner Occ
Units***
% BANK Loans
% Owner Occ
Units***
% BANK Loans
% Owner Occ
Units***
% BANK Loans
Overall
Low
Mod
Mid
Upp
Full Review: Ft Collins-Loveland MSA
148 50.17 1.01 1.35 18.16 13.51 50.04 56.08 30.79 29.05 12.58 100.00 8.14 14.85 10.71
Limited Review: Boulder MSA 23 7.80 2.83 0.00 14.95 13.04 45.76 43.48 36.45 43.48 2.40 0.00 1.96 2.61 2.38 Denver-Aurora-Lakewood MSA -
24 8.14 1.48 0.00 16.04 0.00 45.93 70.83 36.55 29.17 0.69 0.00 0.00 1.47 0.00
Greeley MSA 100 33.90 5.36 1.00 16.10 13.00 47.84 63.00 30.69 23.00 11.55 6.67 11.67 14.74 7.57
* Based on 2014 Peer Mortgage Data -- US and PR ** Home improvement loans originated and purchased in the MA/AA as a percentage of all home improvement loans originated and purchased in the rated area. *** Percentage of Owner Occupied Units is the number of owner occupied units in a particular geography divided by the number of owner occupied housing units in the area based on 2010 Census information. **** Data shown includes only One to Four-family and manufactured housing. (Property type of 1 or 2)

Charter Number: 209
Appendix D-22
Institution ID: First National Bank of Omaha Table 4. Geographic Distribution of Home Mortgage Refinance Loans
Geographic Distribution: HOME MORTGAGE REFINANCE Geography: COLORADO Evaluation Period: JANUARY 1, 2012 TO DECEMBER
31, 2014 Assessment Area:
Total Home Mortgage Refinance
Loans
Low-Income Geographies
Moderate-Income Geographies
Middle-Income Geographies
Upper-Income Geographies
Market Share (%) by Geography*
# % of Total**
% Owner Occ
Units***
% BANK Loans****
% Owner Occ
Units***
% BANK Loans
% Owner Occ
Units***
% BANK Loans
% Owner Occ
Units***
% BANK Loans
Overall
Low
Mod
Mid
Upp
Full Review: Ft Collins-Loveland 877 63.60 1.01 0.68 18.16 16.65 50.04 51.77 30.79 30.90 3.01 7.69 3.34 3.27 2.31 Limited Review: Boulder MSA 158 11.46 2.83 3.16 14.95 17.72 45.76 51.27 36.45 27.85 0.82 1.45 1.46 0.96 0.21 Denver-Aurora-Lakewood MSA -
81 5.87 1.48 0.00 16.04 2.47 45.93 41.98 36.55 55.56 0.16 0.00 0.14 0.14 0.20
Greeley MSA 263 19.07 5.36 2.28 16.10 10.27 47.84 52.85 30.69 34.60 1.33 0.81 0.91 1.83 0.86
* Based on 2014 Peer Mortgage Data -- US and PR ** Home refinance loans originated and purchased in the MA/AA as a percentage of all home refinance loans originated and purchased in the rated area. *** Percentage of Owner Occupied Units is the number of owner occupied units in a particular geography divided by the number of owner occupied housing units in the area based on 2010 Census information. **** Data shown includes only One to Four-family and manufactured housing. (Property type of 1 or 2)

Charter Number: 209
Appendix D-23
Institution ID: First National Bank of Omaha Table 5. Geographic Distribution of Multifamily Loans
Geographic Distribution: MULTIFAMILY Geography: COLORADO Evaluation Period: JANUARY 1, 2012 TO DECEMBER 31, 2014
Assessment Area:
Total Multifamily Loans
Low-Income Geographies
Moderate-Income Geographies
Middle-Income Geographies
Upper-Income Geographies
Market Share (%) by Geography*
# % of Total**
% of MF
Units***
% BANK Loans***
*
% MF Units***
% BANK Loans
% MF Units***
% BANK Loans
% MF Units***
% BANK Loans
Overall
Low
Mod
Mid
Upp
Full Review: Ft Collins-Loveland MSA
7 41.18 8.14 0.00 34.63 42.86 44.95 42.86 12.28 14.29 5.56 0.00 0.00 13.33 0.00
Limited Review: Boulder MSA 0 0.00 8.66 0.00 30.19 0.00 46.97 0.00 14.18 0.00 0.00 0.00 0.00 0.00 0.00 Denver-Aurora-Lakewood MSA -
1 5.88 8.84 0.00 38.92 0.00 43.56 100.00 8.68 0.00 3.03 0.00 0.00 10.00 0.00
Greeley MSA 9 52.94 24.01 22.22 39.19 22.22 28.78 55.56 8.01 0.00 24.14 40.00 0.00 38.46 0.00
* Based on 2014 Peer Mortgage Data -- US and PR ** Multi-family loans originated and purchased in the MA/AA as a percentage of all multi-family loans originated and purchased in the rated area. *** Percentage of Multi-Family Units is the number of multi-family units in a particular geography divided by the number of multifamily housing units in the area based on 2010 Census information. **** Multifamily loan distribution includes Home Purchases, Home Improvement and Refinances.

Charter Number: 209
Appendix D-24
Institution ID: First National Bank of Omaha Table 6. Geographic Distribution of Small Loans to Businesses
Geographic Distribution: SMALL LOANS TO BUSINESSES Geography: COLORADO Evaluation Period: JANUARY 1, 2012 TO DECEMBER 31,
2014 Assessment Area:
Total Small Business
Loans
Low-Income Geographies
Moderate-Income Geographies
Middle-Income Geographies
Upper-Income Geographies
Market Share (%) by Geography*
# % of Total**
% of Businesses
***
% BANK Loans
% of Businesses
***
% BANK Loans
% of Businesses
***
% BANK Loans
% of Businesses
***
% BANK Loans
Overall
Low
Mod
Mid
Upp
Full Review: Ft Collins-Loveland MSA
1,358 48.85 0.96 2.80 20.63 21.35 49.66 51.18 28.74 24.67 5.53 11.61 6.44 5.76 4.73
Limited Review: Boulder MSA 455 16.37 3.80 4.18 22.77 29.67 42.12 45.27 31.32 20.88 1.33 1.19 1.59 1.82 0.60 Denver-Aurora-Lakewood MSA -
278 10.00 2.55 5.76 18.00 14.39 41.84 54.68 37.61 25.18 0.63 1.22 0.75 0.75 0.38
Greeley MSA 689 24.78 4.89 4.35 16.61 15.53 42.81 49.20 35.63 30.91 4.46 3.17 4.50 5.68 3.64
* Based on 2014 Peer Small Business Data -- US and PR ** Small loans to businesses originated and purchased in the MA/AA as a percentage of all small loans to businesses originated and purchased in the rated area. *** Source Data - Dun and Bradstreet (2014).

Charter Number: 209
Appendix D-25
Institution ID: First National Bank of Omaha Table 7. Geographic Distribution of Small Loans to Farms
Geographic Distribution: SMALL LOANS TO FARMS Geography: COLORADO Evaluation Period: JANUARY 1, 2012 TO DECEMBER 31,
2014 Assessment Area:
Total Small Farm Loans
Low-Income Geographies
Moderate-Income Geographies
Middle-Income Geographies
Upper-Income Geographies
Market Share (%) by Geography*
# % of Total**
% of Farms***
% BANK Loans
% of Farms***
% BANK Loans
% of Farms***
% BANK Loans
% of Farms***
% BANK Loans
Overall
Low
Mod
Mid
Upp
Full Review: Ft Collins-Loveland MSA
37 32.46 1.16 5.41 16.56 16.22 48.07 59.46 34.06 18.92 9.40 50.00 6.67 11.48 5.41
Limited Review: Boulder MSA 6 5.26 3.72 0.00 17.09 16.67 47.35 83.33 31.85 0.00 3.08 0.00 0.00 5.56 0.00 Denver-Aurora-Lakewood MSA -
2 1.75 1.80 50.00 18.38 0.00 36.22 0.00 43.60 50.00 0.75 0.00 0.00 0.00 1.96
Greeley MSA - 69 60.53 1.51 1.45 11.22 4.35 63.26 69.57 24.01 24.64 5.79 0.00 2.63 5.58 9.09
* Based on 2014 Peer Small Business Data -- US and PR ** Small loans to farms originated and purchased in the MA/AA as a percentage of all small loans to farms originated and purchased in the rated area. *** Source Data - Dun and Bradstreet (2014).

Charter Number: 209
Appendix D-26
Institution ID: First National Bank of Omaha Table 8. Borrower Distribution of Home Purchase Loans
Borrower Distribution: HOME PURCHASE Geography: COLORADO Evaluation Period: JANUARY 1, 2012 TO DECEMBER 31, 2014
Assessment Area:
Total Home Purchase
Loans
Low-Income Borrowers
Moderate-Income Borrowers
Middle-Income Borrowers
Upper-Income Borrowers
Market Share*
# % of Total**
% Families
***
% BANK Loans****
% Families
6
% BANK Loans****
% Families
***
% BANK Loans****
% Families
***
% BANK Loans****
Overall
Low
Mod
Mid
Upp
Full Review: Ft Collins-Loveland MSA
584 56.53 20.17 7.33 17.62 22.53 22.26 25.46 39.94 44.69 2.69 1.77 3.51 2.92 2.33
Limited Review: Boulder MSA 96 9.29 22.09 20.93 16.59 29.07 20.06 20.93 41.26 29.07 0.65 1.25 1.19 0.39 0.40 Denver-Aurora-Lakewood MSA
63 6.10 17.42 7.02 17.10 26.32 22.93 31.58 42.55 35.09 0.18 0.00 0.27 0.16 0.17
Greeley MSA 290 28.07 20.99 8.12 17.16 26.94 21.57 30.26 40.28 34.69 1.75 2.46 2.10 1.66 1.59
* Based on 2014 Peer Mortgage Data -- US and PR ** Home purchase loans originated and purchased in the MA/AA as a percentage of all home purchase loans originated and purchased in the rated area. *** Percentage of Families is based on the 2010 Census information. **** As a percentage of loans with borrower income information available. No information was available for 7.1% of loans originated and purchased by bank. 6 Data shown includes only One to Four-family and manufactured housing. (Property type of 1 or 2)

Charter Number: 209
Appendix D-27
Institution ID: First National Bank of Omaha Table 9. Borrower Distribution of Home Improvement Loans
Borrower Distribution: HOME IMPROVEMENT Geography: COLORADO Evaluation Period: JANUARY 1, 2012 TO DECEMBER 31, 2014
Assessment Area:
Total Home Improvement
Loans
Low-Income Borrowers
Moderate-Income Borrowers
Middle-Income Borrowers
Upper-Income Borrowers
Market Share*
# % of Total**
% Families
***
% BANK Loans****
% Families
7
% BANK Loans****
% Families
***
% BANK Loans****
% Families
***
% BANK Loans****
Overall
Low
Mod
Mid
Upp
Full Review: Ft Collins-Loveland MSA
148 50.17 20.17 9.59 17.62 19.86 22.26 30.82 39.94 39.73 12.85 25.81 13.48 14.41 9.95
Limited Review: Boulder MSA 23 7.80 22.09 4.35 16.59 21.74 20.06 30.43 41.26 43.48 2.77 2.94 5.00 1.45 2.38 Denver-Aurora-Lakewood MSA
24 8.14 17.42 17.65 17.10 17.65 22.93 35.29 42.55 29.41 0.75 1.27 0.70 1.39 0.27
Greeley MSA 100 33.90 20.99 11.58 17.16 21.05 21.57 25.26 40.28 42.11 11.99 14.81 16.67 10.91 11.11
* Based on 2014 Peer Mortgage Data -- US and PR ** Home improvement loans originated and purchased in the MA/AA as a percentage of all home improvement loans originated and purchased in the rated area. *** Percentage of Families is based on the 2010 Census information. **** As a percentage of loans with borrower income information available. No information was available for 4.7% of loans originated and purchased by bank. 7 Data shown includes only One to Four-family and manufactured housing. (Property type of 1 or 2)

Charter Number: 209
Appendix D-28
Institution ID: First National Bank of Omaha Table 10. Borrower Distribution of Home Mortgage Refinance Loans
Borrower Distribution: HOME MORTGAGE REFINANCE Geography: COLORADO Evaluation Period: JANUARY 1, 2012 TO DECEMBER 31,
2014 Assessment Area:
Total Home Mortgage Refinance
Loans
Low-Income Borrowers
Moderate-Income Borrowers
Middle-Income Borrowers
Upper-Income Borrowers
Market Share*
# % of Total**
% Families
***
% BANK Loans****
% Families
8
% BANK Loans****
% Families
***
% BANK Loans****
% Families
***
% BANK Loans****
Overall
Low
Mod
Mid
Upp
Full Review: Ft Collins-Loveland MSA
877 63.60 20.17 8.05 17.62 22.99 22.26 26.31 39.94 42.66 3.30 2.31 3.53 3.96 2.91
Limited Review: Boulder MSA 158 11.46 22.09 9.46 16.59 22.97 20.06 26.35 41.26 41.22 0.89 0.93 0.53 1.29 0.79 Denver-Aurora-Lakewood MSA -
81 5.87 17.42 4.11 17.10 17.81 22.93 15.07 42.55 63.01 0.19 0.18 0.18 0.08 0.26
Greeley MSA 263 19.07 20.99 8.89 17.16 15.11 21.57 20.00 40.28 56.00 1.43 0.67 2.30 0.77 1.56
* Based on 2014 Peer Mortgage Data -- US and PR ** Home refinance loans originated and purchased in the MA/AA as a percentage of all home refinance loans originated and purchased in the rated area. *** Percentage of Families is based on the 2010 Census information. **** As a percentage of loans with borrower income information available. No information was available for 10.9% of loans originated and purchased by bank. 8 Data shown includes only One to Four-family and manufactured housing. (Property type of 1 or 2)

Charter Number: 209
Appendix D-29
Institution ID: First National Bank of Omaha Table 11. Borrower Distribution of Small Loans to Businesses
Borrower Distribution: SMALL LOANS TO BUSINESSES Geography: COLORADO Evaluation Period: JANUARY 1, 2012 TO DECEMBER 31, 2014
Total Small Loans to Businesses
Businesses With Revenues of $1 million
or less
Loans by Original Amount Regardless of Business Size Market Share*
Assessment Area:
# % of Total**
% of Businesses
***
% BANK Loans****
$100,000 or less >$100,000 to $250,000
>$250,000 to $1,000,000
All Rev$ 1 Million or Less
Full Review: Ft Collins-Loveland 1,358 48.85 74.89 34.09 78.50 9.57 11.93 5.53 4.06 Limited Review: Boulder MSA 455 16.37 71.91 32.97 81.98 8.79 9.23 1.33 0.78 Denver-Aurora-Lakewood MSA -
278 10.00 73.30 28.78 81.29 10.43 8.27 0.63 0.36
Greeley MSA 689 24.78 74.93 41.07 81.13 8.85 10.01 4.46 3.87
* Based on 2014 Peer Small Business Data -- US and PR ** Small loans to businesses originated and purchased in the MA/AA as a percentage of all small loans to businesses originated and purchased in the rated area. *** Businesses with revenues of $1 million or less as a percentage of all businesses (Source D&B - 2014). **** Small loans to businesses with revenues of $1 million or less as a percentage of all loans reported as small loans to businesses. No information was available for 42.12% of small loans to businesses originated and purchased by the bank.

Charter Number: 209
Appendix D-30
Institution ID: First National Bank of Omaha Table 12. Borrower Distribution of Small Loans to Farms
Borrower Distribution: SMALL LOANS TO FARMS Geography: COLORADO Evaluation Period: JANUARY 1, 2012 TO DECEMBER
31, 2014 Assessment Area:
Total Small Loans to Farms
Farms With Revenues of $1 million or less
Loans by Original Amount Regardless of Farm Size Market Share*
# % of Total**
% of Farms***
% BANK Loans****
$100,000 or less
>$100,000 to $250,000
>$250,000 to $500,000
All Rev$ 1 Million or Less
Full Review:
Ft Collins-Loveland MSA
37 32.46 97.68 35.14 67.57 13.51 18.92 9.4 3.4
Limited Review: Boulder MSA 6 5.26 96.50 0.00 100.00 0.00 0.00 3.08 0.00 Denver-Aurora-Lakewood MSA
2 1.75 95.86 0.00 100.00 0.00 0.00 0.75 0.00
Greeley MSA 69 60.53 94.77 62.32 57.97 21.74 20.29 5.79 4.98
* Based on 2014 Peer Small Business Data -- US and PR ** Small loans to farms originated and purchased in the MA/AA as a percentage of all small loans to farms originated and purchased in the rated area. *** Farms with revenues of $1 million or less as a percentage of all farms (Source D&B - 2014). **** Small loans to farms with revenues of $1 million or less as a percentage of all loans reported as small loans to farms. No information was available for 41.23% of small loans to farms originated and purchased by the bank.

Charter Number: 209
Appendix D-31
Institution ID: First National Bank of Omaha Table 14. Qualified Investments
QUALIFIED INVESTMENTS Geography: COLORADO Evaluation Period: SEPTEMBER 30, 2010 TO DECEMBER 31, 2015
Assessment Area:
Prior Period Investments* Current Period Investments Total Investments Unfunded Commitments
# $(000’s) # $(000’s) # $(000’s) % of Total # $(000’s)
Full Review: Ft Collins-Loveland MSA
2 1,896 42 10,387 44 12,283 54.31 0 0
Limited Review: Boulder MSA 1 464 25 3,486 26 3,950 17.47 0 0 Denver-Aurora-Lakewood-Aurora-Lakewood MSA -
1 84 8 1,227 9 1,311 5.80 0 0
Greeley MSA 2 397 24 2,597 26 2,994 13.24 0 0 CO Statewide Investments with P/M/F to serve an AA(s)
1 788 15 1,291 16 2,079 9.18 0 0
* 'Prior Period Investments' means investments made in a previous period that are outstanding as of the examination date.

Charter Number: 209
Appendix D-32
Institution ID: First National Bank of Omaha Table 15. Distribution of Branch Delivery System and Branch Openings/Closings
DISTRIBUTION OF BRANCH DELIVERY SYSTEM AND BRANCH OPENINGS/CLOSINGS Geography: COLORADO Evaluation Period:
SEPTEMBER 30, 2010 TO DECEMBER 31, 2015 MA/Assessment Area:
Deposits
Branches
Branch Openings/Closings
Population
% of Rated Area
Deposits in AA
# of BANK
Branches
% of Rated Area
Branches in AA
Location of Branches by Income of Geographies (%)
# of
Branch Openings
# of
Branch Closings
Net change in Location of Branches (+ or - )
% of Population within Each Geography
Low
Mod
Mid
Upp
Low
Mod
Mid
Upp
Low
Mod
Mid
Upp
Full Review: Ft Collins-Loveland MSA
68.77 9 34.62 0.00 33.33 55.56 11.11 0 0 0 0 0 0 2.64 22.37 48.27 26.69
Limited Review: Boulder MSA 12.92 5 19.23 0.00 40.00 40.00 20.00 1 0 0 +1 0 0 6.89 18.39 45.80 28.91
Denver-Aurora-Lakewood MSA -
5.22 5 19.23 0.00 0.00 80.00 20.00 0 0 0 0 0 0 2.89 20.18 45.58 31.34
Greeley MSA 13.09 6 26.92 0.00 0.00 83.33 16.67 0 1 0 -1 0 0 9.68 19.79 43.99 25.80

Charter Number: 209
Appendix D-33
Institution ID: First National Bank of Omaha Table 1. Lending Volume
LENDING VOLUME Geography: ILLINOIS Evaluation Period: JANUARY 1, 2012 TO DECEMBER 31, 2014
Assessment Area (2014):
% of Rated Area
Loans (#) in MA/AA*
Home Mortgage
Small Loans to
Businesses
Small Loans to
Farms
Community Development Loans**
Total Reported Loans
% of Rated Area
Deposits in MA/AA***
#
$ (000’s)
# $ (000’s)
#
$ (000’s)
#
$ (000’s)
#
$(000’s)
Full Review: Chicago-Naperville-Arlington Heights MD∧
79.81 1,369 210,204 983 102,647 348 55,714 12 10,319 2,700 368,565 48.37
Elgin MD∧∧ 17.17 243 40,253 244 29,030 94 17,406 5 9,471 581 86,689 50.01 Limited Review: Rockford MSA 3.02 62 6,495 24 485 16 3,182 0 0 102 10,162 1.62 IL Statewide with no P/M/F to serve an AA(s)
0.00 0 0 0 0 0 0 2 11,579 2 11,579 0.00
* Loan Data as of December 31, 2014. Rated area refers to either state or multi-state MA rating area. ** The evaluation period for Community Development Loans is from September 30, 2010 to December 31, 2015 for the Chicago MD AA and the Rockford MSA AA. The evaluation period is January 01, 2014 to December 31, 2015 for the Elgin MD AA. *** Deposit Data as of June 30, 2014. Rated Area refers to either the state, multi-state MA, or institution, as appropriate. ∧ The evaluation period for the Chicago-Naperville-Arlington Heights IL MD AA is January 01, 2012 to December 31, 2013. ∧∧ The evaluation period for the Elgin MD AA is January 01, 2014 to December 31, 2014.

Charter Number: 209
Appendix D-34
Institution ID: First National Bank of Omaha Table 2. Geographic Distribution of Home Purchase Loans
Geographic Distribution: HOME PURCHASE Geography: ILLINOIS Evaluation Period: JANUARY 1, 2012 TO DECEMBER 31, 2014
Assessment Area:
Total Home Purchase
Loans
Low-Income Geographies
Moderate-Income Geographies
Middle-Income Geographies
Upper-Income Geographies
Market Share (%) by Geography*
# % of Total**
% Owner Occ
Units***
% BANK Loans****
% Owner Occ
Units***
% BANK Loans
% Owner Occ
Units***
% BANK Loans
% Owner Occ
Units***
% BANK Loans
Overall
Low
Mod
Mid
Upp
Full Review: Chicago-Naperville-Arlington Heights MD∧
344 70.49 0.33 2.33 13.27 6.69 41.51 58.43 44.88 32.56 1.19 4.76 0.85 1.90 0.71
Elgin MD∧∧ 125 25.62 0.60 4.00 26.19 11.20 42.37 74.40 30.84 10.40 1.25 10.64 0.69 2.29 0.34 Limited Review: Rockford MSA 19 3.89 0.00 0.00 12.37 5.26 42.94 47.37 44.69 47.37 1.52 0.00 1.15 2.20 1.10
* Based on 2014 Peer Mortgage Data -- US and PR ** Home purchase loans originated and purchased in the MA/AA as a percentage of all home purchase loans originated and purchased in the rated area. *** Percentage of Owner Occupied Units is the number of owner occupied units in a particular geography divided by the number of owner occupied housing units in the area based on 2010 Census information. **** Data shown includes only One to Four-family and manufactured housing. (Property type of 1 or 2) ∧ The evaluation period for the Chicago -Naperville-Arlington Heights IL MD AA is January 01, 2012 to December 31, 2013. ∧∧ The evaluation period for the Elgin MD AA is January 01, 2014 to December 31, 2014.

Charter Number: 209
Appendix D-35
Institution ID: First National Bank of Omaha Table 3. Geographic Distribution of Home Improvement Loans
Geographic Distribution: HOME IMPROVEMENT Geography: ILLINOIS Evaluation Period: JANUARY 1, 2012 TO DECEMBER 31, 2014
Assessment Area:
Total Home Improvement
Loans
Low-Income Geographies
Moderate-Income Geographies
Middle-Income Geographies
Upper-Income Geographies
Market Share (%) by Geography*
# % of Total**
% Owner Occ
Units***
% BANK Loans****
% Owner Occ
Units***
% BANK Loans
% Owner Occ
Units***
% BANK Loans
% Owner Occ
Units***
% BANK Loans
Overall
Low
Mod
Mid
Upp
Full Review: Chicago-Naperville-Arlington Heights MD∧
131 75.72 0.33 1.53 13.27 7.63 41.51 54.96 44.88 35.88 15.92 0.00 16.95 21.26 11.36
Elgin MD∧∧ 33 19.08 0.60 0.00 26.19 18.18 42.37 72.73 30.84 9.09 7.24 0.00 7.23 12.57 1.67 Limited Review: Rockford MSA 9 5.20 0.00 0.00 12.37 55.56 42.94 44.44 44.69 0.00 6.85 0.00 28.57 9.38 0.00
* Based on 2014 Peer Mortgage Data -- US and PR ** Home improvement loans originated and purchased in the MA/AA as a percentage of all home improvement loans originated and purchased in the rated area. *** Percentage of Owner Occupied Units is the number of owner occupied units in a particular geography divided by the number of owner occupied housing units in the area based on 2010 Census information. **** Data shown includes only One to Four-family and manufactured housing. (Property type of 1 or 2) ∧ The evaluation period for the Chicago-Naperville-Arlington Heights IL MD AA is January 01, 2012 to December 31, 2013. ∧∧ The evaluation period for the Elgin MD AA is January 01, 2014 to December 31, 2014.

Charter Number: 209
Appendix D-36
Institution ID: First National Bank of Omaha Table 4. Geographic Distribution of Home Mortgage Refinance Loans
Geographic Distribution: HOME MORTGAGE REFINANCE Geography: ILLINOIS Evaluation Period: JANUARY 1, 2012 TO DECEMBER 31,
2014 Assessment Area:
Total Home Mortgage Refinance
Loans
Low-Income Geographies
Moderate-Income Geographies
Middle-Income Geographies
Upper-Income Geographies
Market Share (%) by Geography*
# % of Total**
% Owner Occ
Units***
% BANK Loans****
% Owner Occ
Units***
% BANK Loans
% Owner Occ
Units***
% BANK Loans
% Owner Occ
Units***
% BANK Loans
Overall
Low
Mod
Mid
Upp
Full Review: Chicago-Naperville-Arlington Heights MD∧
860 89.12 0.33 1.51 13.27 5.12 41.51 57.09 44.88 36.28 1.13 1.98 0.84 1.72 0.76
Elgin MD∧∧ 73 7.56 0.60 1.37 26.19 19.18 42.37 64.38 30.84 15.07 1.18 2.63 1.27 1.88 0.43 Limited Review: Rockford MSA 32 3.32 0.00 0.00 12.37 21.88 42.94 62.50 44.69 15.63 1.31 0.00 0.00 2.38 0.78
* Based on 2014 Peer Mortgage Data -- US and PR ** Home refinance loans originated and purchased in the MA/AA as a percentage of all home refinance loans originated and purchased in the rated area. *** Percentage of Owner Occupied Units is the number of owner occupied units in a particular geography divided by the number of owner occupied housing units in the area based on 2010 Census information. **** Data shown includes only One to Four-family and manufactured housing. (Property type of 1 or 2) ∧ The evaluation period for the Chicago-Naperville-Arlington Heights IL MD AA is January 01, 2012 to December 31, 2013. ∧∧ The evaluation period for the Elgin MD AA is January 01, 2014 to December 31, 2014.

Charter Number: 209
Appendix D-37
Institution ID: First National Bank of Omaha Table 5. Geographic Distribution of Multifamily Loans
Geographic Distribution: MULTIFAMILY Geography: ILLINOIS Evaluation Period: JANUARY 1, 2012 TO DECEMBER 31, 2014
Assessment Area:
Total Multifamily
Loans
Low-Income Geographies
Moderate-Income Geographies
Middle-Income Geographies
Upper-Income Geographies
Market Share (%) by Geography*
# % of Total**
% of MF Units***
% BANK Loans***
*
% MF Units***
% BANK Loans
% MF Units***
% BANK Loans
% MF Units***
% BANK Loans
Overall
Low
Mod
Mid
Upp
Full Review: Chicago-Naperville-Arlington Heights MD∧
34 70.83 12.87 35.29 25.68 14.71 40.54 32.35 20.91 17.65 7.09 14.29 7.41 5.63 4.55
Elgin MD∧∧ 12 25.00 17.62 58.33 39.55 0.00 33.98 41.67 8.85 0.00 11.88 24.14 0.00 12.20 0.00 Limited Review: Rockford MSA 2 4.17 0.00 0.00 21.14 0.00 78.11 100.00 0.75 0.00 50.00 0.00 0.00 66.67 0.00
* Based on 2014 Peer Mortgage Data -- US and PR ** Multi-family loans originated and purchased in the MA/AA as a percentage of all multi-family loans originated and purchased in the rated area. *** Percentage of Multi-Family Units is the number of multi-family units in a particular geography divided by the number of multifamily housing units in the area based on 2010 Census information. **** Multifamily loan distribution includes Home Purchases, Home Improvement and Refinances. ∧ The evaluation period for the Chicago-Naperville-Arlington Heights IL MD AA is January 01, 2012 to December 31, 2013. ∧∧ The evaluation period for the Elgin MD AA is January 01, 2014 to December 31, 2014.

Charter Number: 209
Appendix D-38
Institution ID: First National Bank of Omaha Table 6. Geographic Distribution of Small Loans to Businesses
Geographic Distribution: SMALL LOANS TO BUSINESSES Geography: ILLINOIS Evaluation Period: JANUARY 1, 2012 TO DECEMBER 31,
2014 Assessment Area:
Total Small Business
Loans
Low-Income Geographies
Moderate-Income Geographies
Middle-Income Geographies
Upper-Income Geographies
Market Share (%) by Geography*
# % of Total**
% of Businesses
***
% BANK Loans
% of Businesses
***
% BANK Loans
% of Businesses
***
% BANK Loans
% of Businesses
***
% BANK Loans
Overall
Low
Mod
Mid
Upp
Full Review: Chicago-Naperville-Arlington Heights MD∧
983 78.58 1.46 2.03 10.68 6.61 42.76 56.15 45.11 35.20 3.27 4.60 2.53 4.56 2.46
Elgin MD∧∧ 244 19.50 2.68 2.05 21.59 14.75 46.65 62.30 29.09 20.90 2.39 2.66 1.98 3.44 1.42 Limited Review: Rockford MSA 24 1.92 0.00 0.00 7.00 0.00 57.29 95.83 35.71 4.17 1.56 0.00 0.00 2.64 0.47
* Based on 2014 Peer Small Business Data -- US and PR ** Small loans to businesses originated and purchased in the MA/AA as a percentage of all small loans to businesses originated and purchased in the rated area. *** Source Data - Dun and Bradstreet (2014). ∧ The evaluation period for the Chicago-Naperville-Arlington Heights IL MD AA is January 01, 2012 to December 31, 2013. ∧∧ The evaluation period for the Elgin MD AA is January 01, 2014 to December 31, 2014.
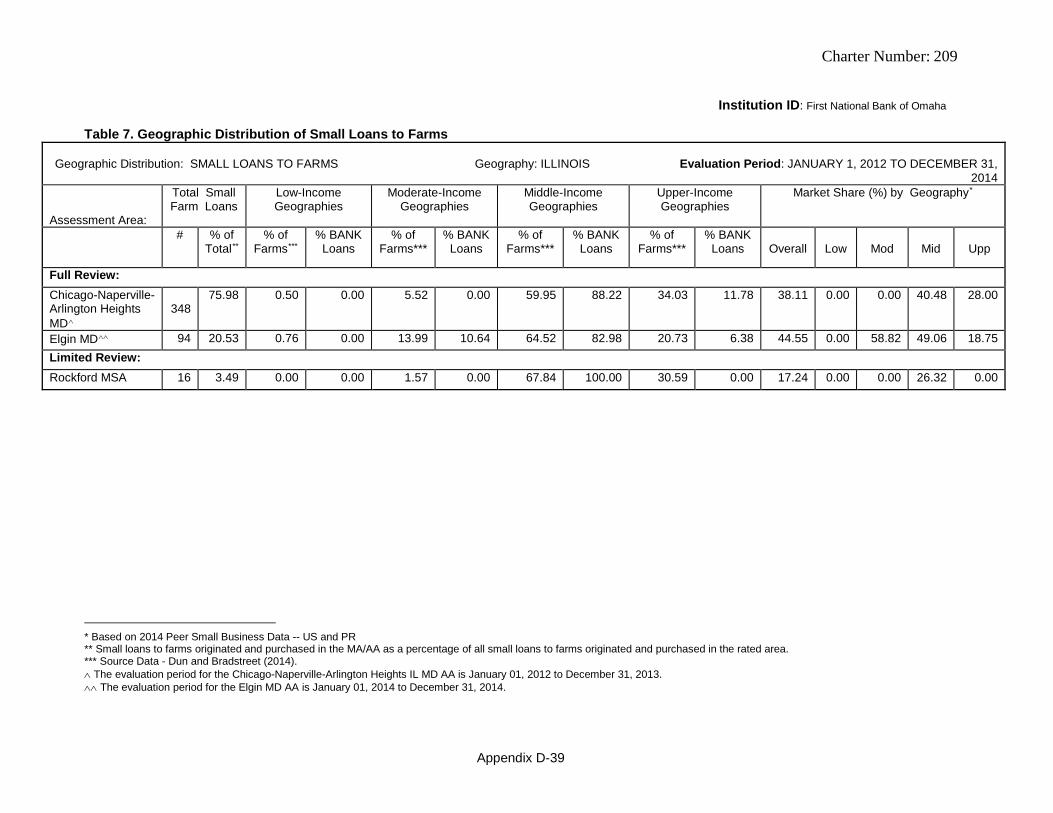
Charter Number: 209
Appendix D-39
Institution ID: First National Bank of Omaha Table 7. Geographic Distribution of Small Loans to Farms
Geographic Distribution: SMALL LOANS TO FARMS Geography: ILLINOIS Evaluation Period: JANUARY 1, 2012 TO DECEMBER 31,
2014 Assessment Area:
Total Small Farm Loans
Low-Income Geographies
Moderate-Income Geographies
Middle-Income Geographies
Upper-Income Geographies
Market Share (%) by Geography*
# % of Total**
% of Farms***
% BANK Loans
% of Farms***
% BANK Loans
% of Farms***
% BANK Loans
% of Farms***
% BANK Loans
Overall
Low
Mod
Mid
Upp
Full Review: Chicago-Naperville-Arlington Heights MD∧
348
75.98 0.50 0.00 5.52 0.00 59.95 88.22 34.03 11.78 38.11 0.00 0.00 40.48 28.00
Elgin MD∧∧ 94 20.53 0.76 0.00 13.99 10.64 64.52 82.98 20.73 6.38 44.55 0.00 58.82 49.06 18.75 Limited Review: Rockford MSA 16 3.49 0.00 0.00 1.57 0.00 67.84 100.00 30.59 0.00 17.24 0.00 0.00 26.32 0.00
* Based on 2014 Peer Small Business Data -- US and PR ** Small loans to farms originated and purchased in the MA/AA as a percentage of all small loans to farms originated and purchased in the rated area. *** Source Data - Dun and Bradstreet (2014). ∧ The evaluation period for the Chicago-Naperville-Arlington Heights IL MD AA is January 01, 2012 to December 31, 2013. ∧∧ The evaluation period for the Elgin MD AA is January 01, 2014 to December 31, 2014.

Charter Number: 209
Appendix D-40
Institution ID: First National Bank of Omaha Table 8. Borrower Distribution of Home Purchase Loans
Borrower Distribution: HOME PURCHASE Geography: ILLINOIS Evaluation Period: JANUARY 1, 2012 TO DECEMBER 31, 2014
Assessment Area:
Total Home Purchase
Loans
Low-Income Borrowers
Moderate-Income Borrowers
Middle-Income Borrowers
Upper-Income Borrowers
Market Share*
# % of Total**
% Families
***
% BANK Loans****
% Families
9
% BANK Loans****
% Families
***
% BANK Loans****
% Families
***
% BANK Loans****
Overall
Low
Mod
Mid
Upp
Full Review: Chicago-Naperville-Arlington Heights MD∧
344 70.59 15.85 13.14 16.30 30.13 21.70 28.53 46.15 28.21 1.20 1.28 1.54 1.35 0.87
Elgin MD∧∧ 125 25.62 19.70 11.11 18.47 23.93 21.56 30.77 40.28 34.19 1.45 1.23 1.43 1.83 1.30 Limited Review: Rockford MSA 19 3.89 16.59 11.11 14.44 27.78 23.32 44.44 45.65 16.67 1.75 2.78 2.59 3.82 0.00
* Based on 2014 Peer Mortgage Data -- US and PR ** Home purchase loans originated and purchased in the MA/AA as a percentage of all home purchase loans originated and purchased in the rated area. *** Percentage of Families is based on the 2010 Census information. **** As a percentage of loans with borrower income information available. No information was available for 8.7% of loans originated and purchased by bank. 9 Data shown includes only One to Four-family and manufactured housing. (Property type of 1 or 2) ∧ The evaluation period for the Chicago-Naperville-Arlington Heights IL MD AA is January 01, 2012 to December 31, 2013. ∧∧ The evaluation period for the Elgin MD AA is January 01, 2014 to December 31, 2014.

Charter Number: 209
Appendix D-41
Institution ID: First National Bank of Omaha Table 9. Borrower Distribution of Home Improvement Loans
Borrower Distribution: HOME IMPROVEMENT Geography: ILLINOIS Evaluation Period: JANUARY 1, 2012 TO DECEMBER 31, 2014
Assessment Area:
Total Home Improvement
Loans
Low-Income Borrowers Moderate-Income Borrowers
Middle-Income Borrowers
Upper-Income Borrowers
Market Share*
# % of Total**
% Families***
% BANK Loans****
% Families10
% BANK Loans****
% Families
***
% BANK Loans****
% Families
***
% BANK Loans****
Overall
Low
Mod
Mid
Upp
Full Review: Chicago-Naperville-Arlington Heights MD∧
131
75.72 15.85 12.60 16.30 13.39 21.70 31.50 46.15 42.52 16.27 26.67 15.38 18.92 13.67
Elgin MD∧∧ 33 19.08 19.70 9.09 18.47 18.18 21.56 30.30 40.28 42.42 10.31 9.68 10.91 11.49 9.52 Limited Review: Rockford MSA 9 5.20 16.59 0.00 14.44 22.22 23.32 44.44 45.65 33.33 7.14 0.00 0.00 11.76 8.33
* Based on 2014 Peer Mortgage Data -- US and PR ** Home improvement loans originated and purchased in the MA/AA as a percentage of all home improvement loans originated and purchased in the rated area. *** Percentage of Families is based on the 2010 Census information. **** As a percentage of loans with borrower income information available. No information was available for 4.1% of loans originated and purchased by bank. 10 Data shown includes only One to Four-family and manufactured housing. (Property type of 1 or 2) ∧ The evaluation period for the Chicago-Naperville-Arlington Heights IL MD AA is January 01, 2012 to December 31, 2013. ∧∧ The evaluation period for the Elgin MD AA is January 01, 2014 to December 31, 2014.

Charter Number: 209
Appendix D-42
Institution ID: First National Bank of Omaha Table 10. Borrower Distribution of Home Mortgage Refinance Loans
Borrower Distribution: HOME MORTGAGE REFINANCE Geography: ILLINOIS Evaluation Period: JANUARY 1, 2012 TO DECEMBER 31, 2014 Assessment Area:
Total Home Mortgage Refinance Loans
Low-Income Borrowers
Moderate-Income Borrowers
Middle-Income Borrowers
Upper-Income Borrowers
Market Share*
# % of Total** % Families
***
% BANK Loans****
% Families
11
% BANK Loans****
% Families
***
% BANK Loans****
% Families
***
% BANK Loans***
*
Overall
Low
Mod
Mid
Upp
Full Review: Chicago-Naperville-Arlington Heights MD∧
860 89.12 15.85 9.52 16.30 19.03 21.70 27.35 46.15 44.10 1.07 1.59 1.34 1.16 0.88
Elgin MD∧∧ 73 7.56 19.70 12.50 18.47 25.00 21.56 21.43 40.28 41.07 1.10 1.47 1.52 1.02 0.91 Limited Review: Rockford MSA 32 3.32 16.59 20.69 14.44 37.93 23.32 20.69 45.65 20.69 1.09 0.00 1.69 2.38 0.49
* Based on 2014 Peer Mortgage Data -- US and PR ** Home refinance loans originated and purchased in the MA/AA as a percentage of all home refinance loans originated and purchased in the rated area. *** Percentage of Families is based on the 2010 Census information. **** As a percentage of loans with borrower income information available. No information was available for 14.5% of loans originated and purchased by bank. 11 Data shown includes only One to Four-family and manufactured housing. (Property type of 1 or 2) ∧ The evaluation period for the Chicago-Naperville-Arlington Heights IL MD AA is January 01, 2012 to December 31, 2013. ∧∧ The evaluation period for the Elgin MD AA is January 01, 2014 to December 31, 2014.

Charter Number: 209
Appendix D-43
Institution ID: First National Bank of Omaha Table 11. Borrower Distribution of Small Loans to Businesses
Borrower Distribution: SMALL LOANS TO BUSINESSES Geography: ILLINOIS Evaluation Period: JANUARY 1, 2012 TO DECEMBER 31,
2014 Total Small Loans to
Businesses Businesses With
Revenues of $1 million or less
Loans by Original Amount Regardless of Business Size Market Share*
Assessment Area:
# % of Total**
% of Businesses
***
% BANK Loans****
$100,000 or less >$100,000 to $250,000
>$250,000 to $1,000,000
All Rev$ 1 Million or Less
Full Review: Chicago-Naperville-Arlington Heights MD∧
983 78.58 73.61 41.71 74.16 13.33 12.51 3.27 3.07
Elgin MD∧∧ 244 19.50 72.51 34.84 70.90 13.11 15.98 2.39 2.07 Limited Review: Rockford MSA 24 1.92 74.69 45.83 95.83 4.17 0.00 1.56 1.42
* Based on 2014 Peer Small Business Data -- US and PR ** Small loans to businesses originated and purchased in the MA/AA as a percentage of all small loans to businesses originated and purchased in the rated area. *** Businesses with revenues of $1 million or less as a percentage of all businesses (Source D&B - 2014). **** Small loans to businesses with revenues of $1 million or less as a percentage of all loans reported as small loans to businesses. No information was available for 38.21% of small loans to businesses originated and purchased by the bank. ∧ The evaluation period for the Chicago -Naperville-Arlington Heights IL MD AA is January 01, 2012 to December 31, 2013. ∧∧ The evaluation period for the Elgin MD AA is January 01, 2014 to December 31, 2014.

Charter Number: 209
Appendix D-44
Institution ID: First National Bank of Omaha Table 12. Borrower Distribution of Small Loans to Farms
Borrower Distribution: SMALL LOANS TO FARMS Geography: ILLINOIS Evaluation Period: JANUARY 1, 2012 TO DECEMBER 31, 2014
Assessment Area:
Total Small Loans to Farms
Farms With Revenues of $1 million or less
Loans by Original Amount Regardless of Farm Size Market Share*
# % of Total**
% of Farms***
% BANK Loans****
$100,000 or less >$100,000 to $250,000
>$250,000 to $500,000
All Rev$ 1 Million or Less
Full Review: Chicago-Naperville-Arlington Heights MD∧
348 75.98 96.49 66.95 47.99 29.02 22.99 38.11 47.16
Elgin MD∧∧ 94 20.53 95.61 54.26 41.49 31.91 26.60 44.55 53.68 Limited Review: Rockford MSA 16 3.49 98.43 93.75 50.00 12.50 37.50 17.24 44.44
* Based on 2014 Peer Small Business Data -- US and PR ** Small loans to farms originated and purchased in the MA/AA as a percentage of all small loans to farms originated and purchased in the rated area. *** Farms with revenues of $1 million or less as a percentage of all farms (Source D&B - 2014). **** Small loans to farms with revenues of $1 million or less as a percentage of all loans reported as small loans to farms. No information was available for 10.19% of small loans to farms originated and purchased by the bank. ∧ The evaluation period for the Chicago-Naperville-Arlington Heights IL MD AA is January 01, 2012 to December 31, 2013. ∧∧ The evaluation period for the Elgin MD AA is January 01, 2014 to December 31, 2014.

Charter Number: 209
Appendix D-45
Institution ID: First National Bank of Omaha Table 14. Qualified Investments
QUALIFIED INVESTMENTS Geography: ILLINOIS Evaluation Period: SEPTEMBER 30, 2010 TO DECEMBER 31, 2015
Assessment Area:
Prior Period Investments* Current Period Investments Total Investments Unfunded Commitments**
# $(000’s) # $(000’s) # $(000’s) % of Total # $(000’s)
Full Review: Chicago-Naperville-Arlington Heights MD∧
0 0 30 7,630 30 7,630 55.82 0 0
Elgin MD∧∧ 0 0 25 2,311 25 2,311 16.90 0 0 Limited Review:
Rockford MSA∧ 0 0 4 381 4 381 2.80 0 0 IL Statewide with P/M/F to serve an AA(s)
1 242 1 3,105 2 3,347 24.48 1 2,433
* 'Prior Period Investments' means investments made in a previous period that are outstanding as of the examination date. ** 'Unfunded Commitments' means legally binding investment commitments that are tracked and recorded by the institution's financial reporting system. ∧ The evaluation period for the Chicago-Naperville-Arlington Heights IL MD AA and the Rockford MSA AA is September 30, 2010 to December 31, 2015. ∧∧ The evaluation period for the Elgin MD AA is January 01, 2014 to December 31, 2015.
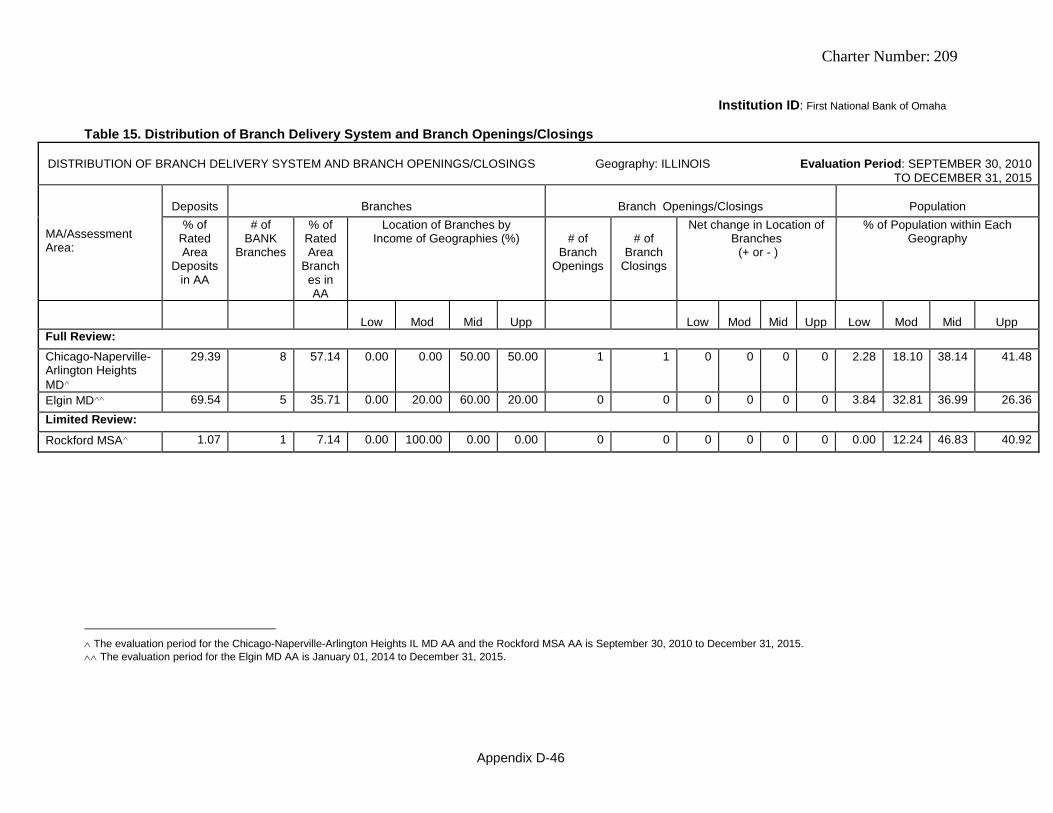
Charter Number: 209
Appendix D-46
Institution ID: First National Bank of Omaha Table 15. Distribution of Branch Delivery System and Branch Openings/Closings
DISTRIBUTION OF BRANCH DELIVERY SYSTEM AND BRANCH OPENINGS/CLOSINGS Geography: ILLINOIS Evaluation Period: SEPTEMBER 30, 2010
TO DECEMBER 31, 2015 MA/Assessment Area:
Deposits
Branches
Branch Openings/Closings
Population
% of Rated Area
Deposits in AA
# of BANK
Branches
% of Rated Area
Branches in AA
Location of Branches by Income of Geographies (%)
# of
Branch Openings
# of
Branch Closings
Net change in Location of Branches (+ or - )
% of Population within Each Geography
Low
Mod
Mid
Upp
Low
Mod
Mid
Upp
Low
Mod
Mid
Upp
Full Review: Chicago-Naperville-Arlington Heights MD∧
29.39 8 57.14 0.00 0.00 50.00 50.00 1 1 0 0 0 0 2.28 18.10 38.14 41.48
Elgin MD∧∧ 69.54 5 35.71 0.00 20.00 60.00 20.00 0 0 0 0 0 0 3.84 32.81 36.99 26.36 Limited Review:
Rockford MSA∧ 1.07 1 7.14 0.00 100.00 0.00 0.00 0 0 0 0 0 0 0.00 12.24 46.83 40.92
∧ The evaluation period for the Chicago-Naperville-Arlington Heights IL MD AA and the Rockford MSA AA is September 30, 2010 to December 31, 2015. ∧∧ The evaluation period for the Elgin MD AA is January 01, 2014 to December 31, 2015.

Charter Number: 209
Appendix D-47
Institution ID: First National Bank of Omaha Table 1. Lending Volume
LENDING VOLUME Geography: IOWA Evaluation Period: JANUARY 1, 2012 TO JULY 26, 2013
Assessment Area (2014):
% of Rated Area
Loans (#) in MA/AA*
Home Mortgage
Small Loans to
Businesses
Small Loans to
Farms
Community Development Loans**
Total Reported Loans
% of Rated Area
Deposits in MA/AA***
#
$ (000’s)
# $ (000’s)
#
$ (000’s)
#
$ (000’s)
#
$(000’s)
Full Review: Des Moines - West Des Moines IA MSA
100.00 61 9,147 234 14,501 7 531 0 0 302 24,179 100.00
* Loan Data as of July 26, 2013. Rated area refers to either state or multi-state MA rating area. ** The evaluation period for Community Development Loans is from September 30, 2010 to July 26, 2013. *** Deposit Data as of June 30, 2013. Rated Area refers to either the state, multi-state MA, or institution, as appropriate.

Charter Number: 209
Appendix D-48
Institution ID: First National Bank of Omaha Table 2. Geographic Distribution of Home Purchase Loans
Geographic Distribution: HOME PURCHASE Geography: IOWA Evaluation Period: JANUARY 1, 2012 TO JULY 26, 2013
Assessment Area:
Total Home Purchase Loans
Low-Income Geographies
Moderate-Income Geographies
Middle-Income Geographies
Upper-Income Geographies
Market Share (%) by Geography*
# % of Total**
% Owner Occ
Units***
% BANK Loans****
% Owner Occ
Units***
% BANK Loans
% Owner Occ
Units***
% BANK Loans
% Owner Occ
Units***
% BANK Loans
Overall
Low
Mod
Mid
Upp
Full Review: Des Moines - West Des Moines IA MSA
17 100.00 2.61 0.00 20.74 5.88 42.84 52.94 33.81 41.18 0.06 0.00 0.00 0.08 0.07
* Based on 2013 Peer Mortgage Data -- US and PR ** Home purchase loans originated and purchased in the MA/AA as a percentage of all home purchase loans originated and purchased in the rated area. *** Percentage of Owner Occupied Units is the number of owner occupied units in a particular geography divided by the number of owner occupied housing units in the area based on 2010 Census information. **** Data shown includes only One to Four-family and manufactured housing. (Property type of 1 or 2)

Charter Number: 209
Appendix D-49
Institution ID: First National Bank of Omaha Table 3. Geographic Distribution of Home Improvement Loans
Geographic Distribution: HOME IMPROVEMENT Geography: IOWA Evaluation Period: JANUARY 1, 2012 TO JULY 26, 2013
Assessment Area:
Total Home Improvement
Loans
Low-Income Geographies
Moderate-Income Geographies
Middle-Income Geographies
Upper-Income Geographies
Market Share (%) by Geography*
# % of Total**
% Owner Occ
Units***
% BANK Loans****
% Owner Occ
Units***
% BANK Loans
% Owner Occ
Units***
% BANK Loans
% Owner Occ
Units***
% BANK Loans
Overall
Low
Mod
Mid
Upp
Full Review: Des Moines - West Des Moines IA MSA
1 100.00 2.61 0.00 20.74 0.00 42.84 0.00 33.81 100.00 0.00 0.00 0.00 0.00 0.00
* Based on 2013 Peer Mortgage Data -- US and PR ** Home improvement loans originated and purchased in the MA/AA as a percentage of all home improvement loans originated and purchased in the rated area. *** Percentage of Owner Occupied Units is the number of owner occupied units in a particular geography divided by the number of owner occupied housing units in the area based on 2010 Census information. **** Data shown includes only One to Four-family and manufactured housing. (Property type of 1 or 2)

Charter Number: 209
Appendix D-50
Institution ID: First National Bank of Omaha Table 4. Geographic Distribution of Home Mortgage Refinance Loans
Geographic Distribution: HOME MORTGAGE REFINANCE Geography: IOWA Evaluation Period: JANUARY 1, 2012 TO JULY 26, 2013
Assessment Area:
Total Home Mortgage Refinance
Loans
Low-Income Geographies
Moderate-Income Geographies
Middle-Income Geographies
Upper-Income Geographies
Market Share (%) by Geography*
# % of Total**
% Owner Occ Units***
% BANK Loans****
% Owner Occ
Units***
% BANK Loans
% Owner Occ
Units***
% BANK Loans
% Owner Occ
Units***
% BANK Loans
Overall
Low
Mod
Mid
Upp
Full Review: Des Moines - West Des Moines IA MSA
43 100.00 2.61 0.00 20.74 0.00 42.84 48.84 33.81 51.16 0.06 0.00 0.00 0.07 0.08
* Based on 2013 Peer Mortgage Data -- US and PR ** Home refinance loans originated and purchased in the MA/AA as a percentage of all home refinance loans originated and purchased in the rated area. *** Percentage of Owner Occupied Units is the number of owner occupied units in a particular geography divided by the number of owner occupied housing units in the area based on 2010 Census information. **** Data shown includes only One to Four-family and manufactured housing. (Property type of 1 or 2)

Charter Number: 209
Appendix D-51
Institution ID: First National Bank of Omaha Table 6. Geographic Distribution of Small Loans to Businesses
Geographic Distribution: SMALL LOANS TO BUSINESSES Geography: IOWA Evaluation Period: JANUARY 1, 2012 TO JULY 26, 2013
Assessment Area:
Total Small Business
Loans
Low-Income Geographies
Moderate-Income Geographies
Middle-Income Geographies
Upper-Income Geographies
Market Share (%) by Geography*
# % of Total**
% of Businesses
***
% BANK Loans
% of Businesses
***
% BANK Loans
% of Businesses
***
% BANK Loans
% of Businesses
***
% BANK Loans
Overall
Low
Mod
Mid
Upp
Full Review: Des Moines - West Des Moines IA MSA
234 100.00 10.77 9.40 17.61 14.53 38.36 39.32 33.16 36.75 1.06 0.98 1.01 1.11 1.10
* Based on 2013 Peer Small Business Data -- US and PR ** Small loans to businesses originated and purchased in the MA/AA as a percentage of all small loans to businesses originated and purchased in the rated area. *** Source Data - Dun and Bradstreet (2013).

Charter Number: 209
Appendix D-52
Institution ID: First National Bank of Omaha Table 7. Geographic Distribution of Small Loans to Farms
Geographic Distribution: SMALL LOANS TO FARMS Geography: IOWA Evaluation Period: JANUARY 1, 2012 TO JULY 26, 2013
Assessment Area:
Total Small Farm Loans
Low-Income Geographies
Moderate-Income Geographies
Middle-Income Geographies
Upper-Income Geographies
Market Share (%) by Geography*
# % of Total**
% of Farms***
% BANK Loans
% of Farms***
% BANK Loans
% of Farms***
% BANK Loans
% of Farms***
% BANK Loans
Overall
Low
Mod
Mid
Upp
Full Review: Des Moines - West Des Moines IA MSA
7 100.00 1.59 28.57 8.89 0.00 63.85 57.14 25.66 14.29 2.14 100.00 0.00 1.70 2.33
* Based on 2013 Peer Small Business Data -- US and PR ** Small loans to farms originated and purchased in the MA/AA as a percentage of all small loans to farms originated and purchased in the rated area. *** Source Data - Dun and Bradstreet (2013).
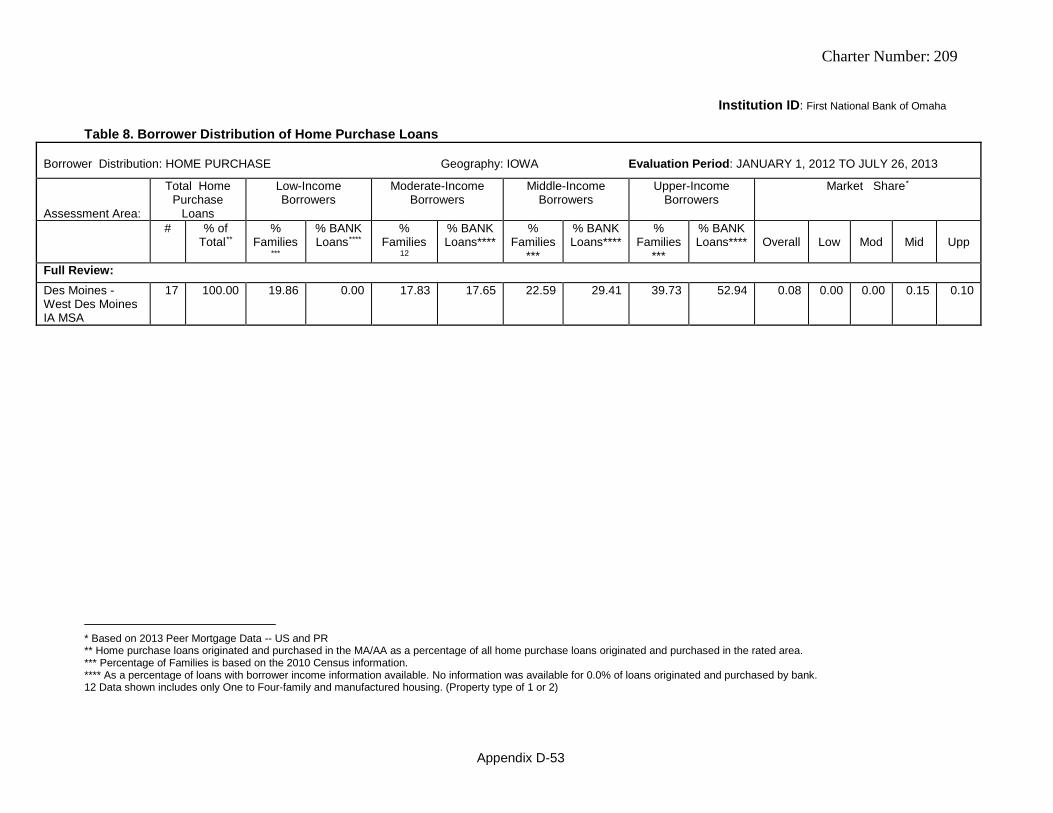
Charter Number: 209
Appendix D-53
Institution ID: First National Bank of Omaha Table 8. Borrower Distribution of Home Purchase Loans
Borrower Distribution: HOME PURCHASE Geography: IOWA Evaluation Period: JANUARY 1, 2012 TO JULY 26, 2013
Assessment Area:
Total Home Purchase
Loans
Low-Income Borrowers
Moderate-Income Borrowers
Middle-Income Borrowers
Upper-Income Borrowers
Market Share*
# % of Total**
% Families
***
% BANK Loans****
% Families
12
% BANK Loans****
% Families
***
% BANK Loans****
% Families
***
% BANK Loans****
Overall
Low
Mod
Mid
Upp
Full Review: Des Moines - West Des Moines IA MSA
17 100.00 19.86 0.00 17.83 17.65 22.59 29.41 39.73 52.94 0.08 0.00 0.00 0.15 0.10
* Based on 2013 Peer Mortgage Data -- US and PR ** Home purchase loans originated and purchased in the MA/AA as a percentage of all home purchase loans originated and purchased in the rated area. *** Percentage of Families is based on the 2010 Census information. **** As a percentage of loans with borrower income information available. No information was available for 0.0% of loans originated and purchased by bank. 12 Data shown includes only One to Four-family and manufactured housing. (Property type of 1 or 2)

Charter Number: 209
Appendix D-54
Institution ID: First National Bank of Omaha Table 9. Borrower Distribution of Home Improvement Loans
Borrower Distribution: HOME IMPROVEMENT Geography: IOWA Evaluation Period: JANUARY 1, 2012 TO JULY 26, 2013
Assessment Area:
Total Home Improvement
Loans
Low-Income Borrowers
Moderate-Income Borrowers
Middle-Income Borrowers
Upper-Income Borrowers
Market Share*
# % of Total**
% Families
***
% BANK Loans****
% Families
13
% BANK Loans****
% Families
***
% BANK Loans****
% Families
***
% BANK Loans****
Overall
Low
Mod
Mid
Upp
Full Review: Des Moines - West Des Moines IA MSA
1 100.00 19.86 0.00 17.83 0.00 22.59 100.00 39.73 0.00 0.00 0.00 0.00 0.00 0.00
* Based on 2013 Peer Mortgage Data -- US and PR ** Home improvement loans originated and purchased in the MA/AA as a percentage of all home improvement loans originated and purchased in the rated area. *** Percentage of Families is based on the 2010 Census information. **** As a percentage of loans with borrower income information available. No information was available for 0.0% of loans originated and purchased by bank. 13 Data shown includes only One to Four-family and manufactured housing. (Property type of 1 or 2)

Charter Number: 209
Appendix D-55
Institution ID: First National Bank of Omaha Table 10. Borrower Distribution of Home Mortgage Refinance Loans
Borrower Distribution: HOME MORTGAGE REFINANCE Geography: IOWA Evaluation Period: JANUARY 1, 2012 TO JULY 26, 2013
Assessment Area:
Total Home Mortgage
Refinance Loans
Low-Income Borrowers
Moderate-Income Borrowers
Middle-Income Borrowers
Upper-Income Borrowers
Market Share*
# % of Total**
% Families
***
% BANK Loans****
% Families
14
% BANK Loans****
% Families
***
% BANK Loans****
% Families
***
% BANK Loans****
Overall
Low
Mod
Mid
Upp
Full Review: Des Moines - West Des Moines IA MSA
43 100.00 19.86 2.78 17.83 22.22 22.59 25.00 39.73 50.00 0.06 0.09 0.00 0.03 0.09
* Based on 2013 Peer Mortgage Data -- US and PR ** Home refinance loans originated and purchased in the MA/AA as a percentage of all home refinance loans originated and purchased in the rated area. *** Percentage of Families is based on the 2010 Census information. **** As a percentage of loans with borrower income information available. No information was available for 16.3% of loans originated and purchased by bank. 14 Data shown includes only One to Four-family and manufactured housing. (Property type of 1 or 2)

Charter Number: 209
Appendix D-56
Institution ID: First National Bank of Omaha Table 11. Borrower Distribution of Small Loans to Businesses
Borrower Distribution: SMALL LOANS TO BUSINESSES Geography: IOWA Evaluation Period: JANUARY 1, 2012 TO JULY 26, 2013
Total Small Loans to Businesses
Businesses With Revenues of $1 million
or less
Loans by Original Amount Regardless of Business Size Market Share*
Assessment Area:
# % of Total**
% of Businesses
***
% BANK Loans****
$100,000 or less >$100,000 to $250,000
>$250,000 to $1,000,000
All Rev$ 1 Million or Less
Full Review: Des Moines - West Des Moines IA MSA
234 100.00 71.55 12.82 89.74 2.56 7.69 1.06 0.32
* Based on 2013 Peer Small Business Data -- US and PR ** Small loans to businesses originated and purchased in the MA/AA as a percentage of all small loans to businesses originated and purchased in the rated area. *** Businesses with revenues of $1 million or less as a percentage of all businesses (Source D&B - 2013). **** Small loans to businesses with revenues of $1 million or less as a percentage of all loans reported as small loans to businesses. No information was available for 71.37% of small loans to businesses originated and purchased by the bank.
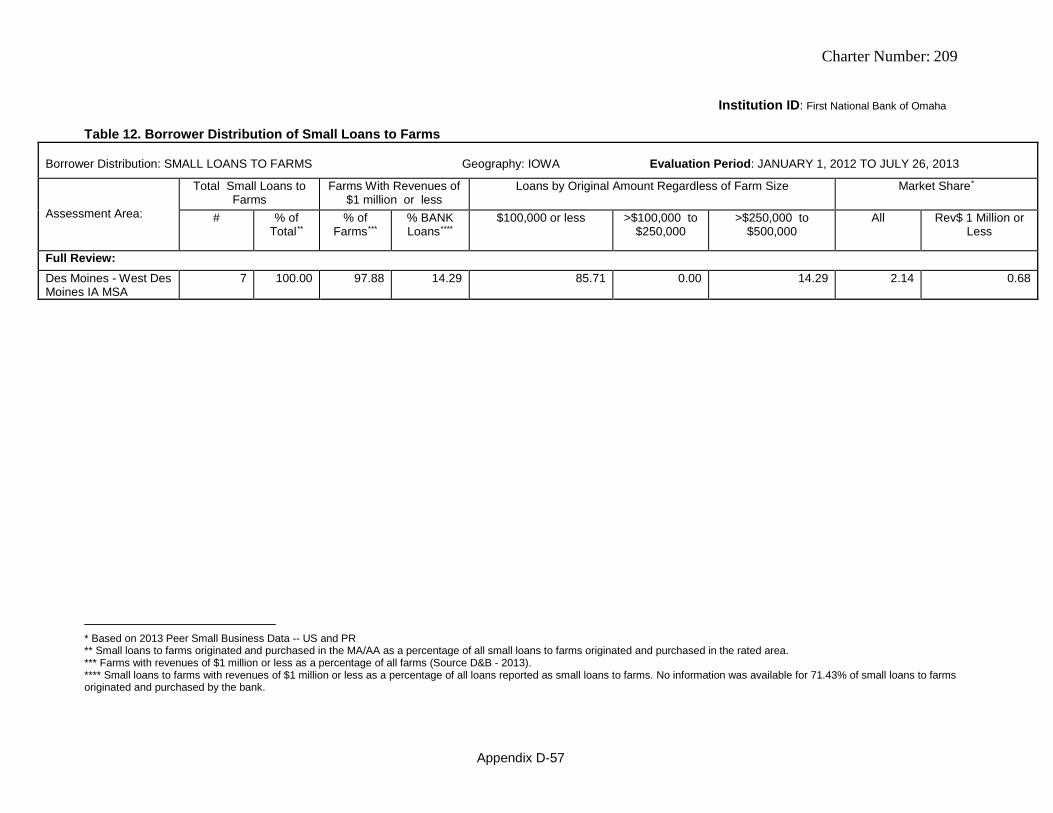
Charter Number: 209
Appendix D-57
Institution ID: First National Bank of Omaha Table 12. Borrower Distribution of Small Loans to Farms
Borrower Distribution: SMALL LOANS TO FARMS Geography: IOWA Evaluation Period: JANUARY 1, 2012 TO JULY 26, 2013
Assessment Area:
Total Small Loans to Farms
Farms With Revenues of $1 million or less
Loans by Original Amount Regardless of Farm Size Market Share*
# % of Total**
% of Farms***
% BANK Loans****
$100,000 or less >$100,000 to $250,000
>$250,000 to $500,000
All Rev$ 1 Million or Less
Full Review: Des Moines - West Des Moines IA MSA
7 100.00 97.88 14.29 85.71 0.00 14.29 2.14 0.68
* Based on 2013 Peer Small Business Data -- US and PR ** Small loans to farms originated and purchased in the MA/AA as a percentage of all small loans to farms originated and purchased in the rated area. *** Farms with revenues of $1 million or less as a percentage of all farms (Source D&B - 2013). **** Small loans to farms with revenues of $1 million or less as a percentage of all loans reported as small loans to farms. No information was available for 71.43% of small loans to farms originated and purchased by the bank.

Charter Number: 209
Appendix D-58
Institution ID: First National Bank of Omaha Table 14. Qualified Investments
QUALIFIED INVESTMENTS Geography: IOWA Evaluation Period: SEPTEMBER 30, 2010 TO JULY 26, 2013
Assessment Area:
Prior Period Investments* Current Period Investments Total Investments Unfunded Commitments**
# $(000’s) # $(000’s) # $(000’s) % of Total # $(000’s)
Full Review: Des Moines - West Des Moines IA MSA
0 0 0 0 0 0 0.00 0 0
IA Statewide Investments with P/M/F
0 0 1 2,000 1 2,000 100.00 0 0
* 'Prior Period Investments' means investments made in a previous period that are outstanding as of the examination date. ** 'Unfunded Commitments' means legally binding investment commitments that are tracked and recorded by the institution's financial reporting system.

Charter Number: 209
Appendix D-59
Institution ID: First National Bank of Omaha Table 15. Distribution of Branch Delivery System and Branch Openings/Closings
DISTRIBUTION OF BRANCH DELIVERY SYSTEM AND BRANCH OPENINGS/CLOSINGS Geography: IOWA Evaluation Period: SEPTEMBER 30, 2010
TO JULY 26, 2013 MA/Assessment Area:
Deposits
Branches
Branch Openings/Closings
Population
% of Rated Area
Deposits in AA
# of BANK
Branches
% of Rated Area
Branches in AA
Location of Branches by Income of Geographies (%)
# of
Branch Openings
# of
Branch Closings
Net change in Location of Branches (+ or - )
% of Population within Each Geography
Low
Mod
Mid
Upp
Low
Mod
Mid
Upp
Low
Mod
Mid
Upp
Full Review:
Des Moines - West Des Moines IA MSA
100.00 1 100.00 100.00 0.00 0.00 0.00 0 1 -1 0 0 0 5.13 23.54 40.20 31.13

Charter Number: 209
Appendix D-60
Institution ID: First National Bank of Omaha Table 1. Lending Volume
LENDING VOLUME Geography: KANSAS Evaluation Period: SEPTEMBER 30, 2010 TO DECEMBER 31, 2014
Assessment Area (2014):
% of Rated Area
Loans (#) in MA/AA*
Home Mortgage
Small Loans to
Businesses
Small Loans to
Farms
Community Development Loans**
Total Reported Loans
% of Rated Area
Deposits in MA/AA***
#
$ (000’s)
# $ (000’s)
#
$ (000’s)
#
$ (000’s)
#
$(000’s)
Full Review: Kansas City KS MSA 100.00 522 131,756 642 46,056 2 205 1 52 1,167 17,801,769 0.00
* Loan Data as of December 31, 2014. Rated area refers to either state or multi-state MA rating area. ** The evaluation period for Community Development Loans is from September 30, 2010 to December 31, 2015. *** Deposit Data as of June 30, 2014. Rated Area refers to either the state, multi-state MA, or institution, as appropriate.

Charter Number: 209
Appendix D-61
Institution ID: First National Bank of Omaha Table 2. Geographic Distribution of Home Purchase Loans
Geographic Distribution: HOME PURCHASE Geography: KANSAS Evaluation Period: JANUARY 1, 2012 TO DECEMBER 31, 2014
Assessment Area:
Total Home Purchase
Loans
Low-Income Geographies
Moderate-Income Geographies
Middle-Income Geographies
Upper-Income Geographies
Market Share (%) by Geography*
# % of Total**
% Owner Occ
Units***
% BANK Loans****
% Owner Occ
Units***
% BANK Loans
% Owner Occ
Units***
% BANK Loans
% Owner Occ
Units***
% BANK Loans
Overall
Low
Mod
Mid
Upp
Full Review: Kansas City KS MSA 189 100.00 0.28 0.00 7.54 4.23 27.86 26.46 64.32 69.31 0.65 0.00 0.49 0.55 0.71
* Based on 2014 Peer Mortgage Data -- US and PR ** Home purchase loans originated and purchased in the MA/AA as a percentage of all home purchase loans originated and purchased in the rated area. *** Percentage of Owner Occupied Units is the number of owner occupied units in a particular geography divided by the number of owner occupied housing units in the area based on 2010 Census information. **** Data shown includes only One to Four-family and manufactured housing. (Property type of 1 or 2)

Charter Number: 209
Appendix D-62
Institution ID: First National Bank of Omaha Table 3. Geographic Distribution of Home Improvement Loans
Geographic Distribution: HOME IMPROVEMENT Geography: KANSAS Evaluation Period: JANUARY 1, 2012 TO DECEMBER 31, 2014
Assessment Area:
Total Home Improvement
Loans
Low-Income Geographies
Moderate-Income Geographies
Middle-Income Geographies
Upper-Income Geographies
Market Share (%) by Geography*
# % of Total**
% Owner Occ
Units***
% BANK Loans****
% Owner Occ
Units***
% BANK Loans
% Owner Occ
Units***
% BANK Loans
% Owner Occ
Units***
% BANK Loans
Overall
Low
Mod
Mid
Upp
Full Review: Kansas City KS MSA 76 100.00 0.28 0.00 7.54 2.63 27.86 23.68 64.32 73.68 3.85 0.00 2.17 3.66 4.06
* Based on 2014 Peer Mortgage Data -- US and PR ** Home improvement loans originated and purchased in the MA/AA as a percentage of all home improvement loans originated and purchased in the rated area. *** Percentage of Owner Occupied Units is the number of owner occupied units in a particular geography divided by the number of owner occupied housing units in the area based on 2010 Census information. **** Data shown includes only One to Four-family and manufactured housing. (Property type of 1 or 2)
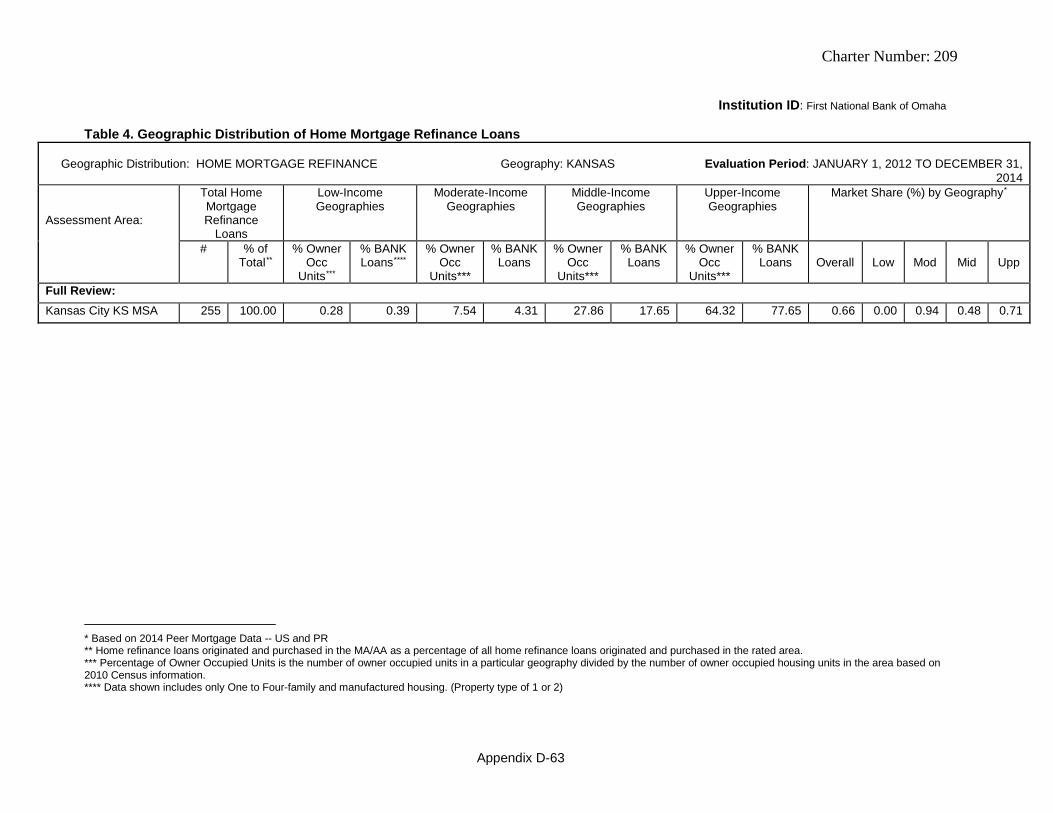
Charter Number: 209
Appendix D-63
Institution ID: First National Bank of Omaha Table 4. Geographic Distribution of Home Mortgage Refinance Loans
Geographic Distribution: HOME MORTGAGE REFINANCE Geography: KANSAS Evaluation Period: JANUARY 1, 2012 TO DECEMBER 31,
2014 Assessment Area:
Total Home Mortgage Refinance
Loans
Low-Income Geographies
Moderate-Income Geographies
Middle-Income Geographies
Upper-Income Geographies
Market Share (%) by Geography*
# % of Total**
% Owner Occ
Units***
% BANK Loans****
% Owner Occ
Units***
% BANK Loans
% Owner Occ
Units***
% BANK Loans
% Owner Occ
Units***
% BANK Loans
Overall
Low
Mod
Mid
Upp
Full Review: Kansas City KS MSA 255 100.00 0.28 0.39 7.54 4.31 27.86 17.65 64.32 77.65 0.66 0.00 0.94 0.48 0.71
* Based on 2014 Peer Mortgage Data -- US and PR ** Home refinance loans originated and purchased in the MA/AA as a percentage of all home refinance loans originated and purchased in the rated area. *** Percentage of Owner Occupied Units is the number of owner occupied units in a particular geography divided by the number of owner occupied housing units in the area based on 2010 Census information. **** Data shown includes only One to Four-family and manufactured housing. (Property type of 1 or 2)

Charter Number: 209
Appendix D-64
Institution ID: First National Bank of Omaha Table 5. Geographic Distribution of Multifamily Loans
Geographic Distribution: MULTIFAMILY Geography: KANSAS Evaluation Period: JANUARY 1, 2012 TO DECEMBER 31, 2014
Assessment Area:
Total Multifamily Loans
Low-Income Geographies
Moderate-Income Geographies
Middle-Income Geographies
Upper-Income Geographies
Market Share (%) by Geography*
# % of Total**
% of MF Units***
% BANK Loans****
% MF Units***
% BANK Loans
% MF Units***
% BANK Loans
% MF Units***
% BANK Loans
Overall
Low
Mod
Mid
Upp
Full Review: Kansas City KS MSA 2 100.00 0.70 0.00 19.50 0.00 35.22 0.00 44.58 100.00 2.50 0.00 0.00 0.00 9.09
* Based on 2014 Peer Mortgage Data -- US and PR ** Multi-family loans originated and purchased in the MA/AA as a percentage of all multi-family loans originated and purchased in the rated area. *** Percentage of Multi-Family Units is the number of multi-family units in a particular geography divided by the number of multifamily housing units in the area based on 2010 Census information. **** Multifamily loan distribution includes Home Purchases, Home Improvement and Refinances.

Charter Number: 209
Appendix D-65
Institution ID: First National Bank of Omaha Table 6. Geographic Distribution of Small Loans to Businesses
Geographic Distribution: SMALL LOANS TO BUSINESSES Geography: KANSAS Evaluation Period: JANUARY 1, 2012 TO DECEMBER 31,
2014 Assessment Area:
Total Small Business
Loans
Low-Income Geographies
Moderate-Income Geographies
Middle-Income Geographies
Upper-Income Geographies
Market Share (%) by Geography*
# % of Total**
% of Businesses
***
% BANK Loans
% of Businesses*
**
% BANK Loans
% of Businesses
***
% BANK Loans
% of Businesses
***
% BANK Loans
Overall
Low
Mod
Mid
Upp
Full Review: Kansas City KS MSA
621 100.00 0.53 0.00 8.81 7.89 23.51 21.90 64.16 70.21 1.72 0.00 1.77 1.52 1.86
* Based on 2014 Peer Small Business Data -- US and PR ** Small loans to businesses originated and purchased in the MA/AA as a percentage of all small loans to businesses originated and purchased in the rated area. *** Source Data - Dun and Bradstreet (2014).

Charter Number: 209
Appendix D-66
Institution ID: First National Bank of Omaha Table 7. Geographic Distribution of Small Loans to Farms
Geographic Distribution: SMALL LOANS TO FARMS Geography: KANSAS Evaluation Period: JANUARY 1, 2012 TO DECEMBER 31,
2014 Assessment Area:
Total Small Farm Loans
Low-Income Geographies
Moderate-Income Geographies
Middle-Income Geographies
Upper-Income Geographies
Market Share (%) by Geography*
# % of Total**
% of Farms***
% BANK Loans
% of Farms***
% BANK Loans
% of Farms***
% BANK Loans
% of Farms***
% BANK Loans
Overall
Low
Mod
Mid
Upp
Full Review: Kansas City KS MSA 2 100.00 0.09 0.00 8.13 0.00 29.26 50.00 62.02 50.00 1.28 0.00 0.00 0.00 2.04
* Based on 2014 Peer Small Business Data -- US and PR ** Small loans to farms originated and purchased in the MA/AA as a percentage of all small loans to farms originated and purchased in the rated area. *** Source Data - Dun and Bradstreet (2014).

Charter Number: 209
Appendix D-67
Institution ID: First National Bank of Omaha Table 8. Borrower Distribution of Home Purchase Loans
Borrower Distribution: HOME PURCHASE Geography: KANSAS Evaluation Period: JANUARY 1, 2012 TO DECEMBER 31, 2014
Assessment Area:
Total Home Purchase
Loans
Low-Income Borrowers
Moderate-Income Borrowers
Middle-Income Borrowers
Upper-Income Borrowers
Market Share*
# % of Total**
% Families
***
% BANK Loans****
% Families
15
% BANK Loans****
% Families
***
% BANK Loans***
*
% Families
***
% BANK Loans****
Overall
Low
Mod
Mid
Upp
Full Review:
Kansas City KS MSA 189 100.00
10.75 4.28 13.05 18.18 20.10 19.79 56.11 57.75 0.77 0.72 0.56 0.56 0.95
* Based on 2014 Peer Mortgage Data -- US and PR ** Home purchase loans originated and purchased in the MA/AA as a percentage of all home purchase loans originated and purchased in the rated area. *** Percentage of Families is based on the 2010 Census information. **** As a percentage of loans with borrower income information available. No information was available for 1.1% of loans originated and purchased by bank. 15 Data shown includes only One to Four-family and manufactured housing. (Property type of 1 or 2)

Charter Number: 209
Appendix D-68
Institution ID: First National Bank of Omaha Table 9. Borrower Distribution of Home Improvement Loans
Borrower Distribution: HOME IMPROVEMENT Geography: KANSAS Evaluation Period: JANUARY 1, 2012 TO DECEMBER 31, 2014
Assessment Area:
Total Home Improvement Loans
Low-Income Borrowers
Moderate-Income Borrowers
Middle-Income Borrowers
Upper-Income Borrowers
Market Share*
# % of Total**
% Families
***
% BANK Loans****
% Families
16
% BANK Loans****
% Families
***
% BANK Loans****
% Families
***
% BANK Loans****
Overall
Low
Mod
Mid
Upp
Full Review: Kansas City KS MSA
76 100.00 10.75 4.05 13.05 14.86 20.10 27.03 56.11 54.05 4.16 4.55 6.32 4.12 3.64
* Based on 2014 Peer Mortgage Data -- US and PR ** Home improvement loans originated and purchased in the MA/AA as a percentage of all home improvement loans originated and purchased in the rated area. *** Percentage of Families is based on the 2010 Census information. **** As a percentage of loans with borrower income information available. No information was available for 2.6% of loans originated and purchased by bank. 16 Data shown includes only One to Four-family and manufactured housing. (Property type of 1 or 2)

Charter Number: 209
Appendix D-69
Institution ID: First National Bank of Omaha Table 10. Borrower Distribution of Home Mortgage Refinance Loans
Borrower Distribution: HOME MORTGAGE REFINANCE Geography: KANSAS Evaluation Period: JANUARY 1, 2012 TO DECEMBER 31,
2014 Assessment Area:
Total Home Mortgage Refinance Loans
Low-Income Borrowers
Moderate-Income Borrowers
Middle-Income Borrowers
Upper-Income Borrowers
Market Share*
# % of Total**
% Families
***
% BANK Loans****
% Families
17
% BANK Loans****
% Families
***
% BANK Loans****
% Families
***
% BANK Loans****
Overall
Low
Mod
Mid
Upp
Full Review: Kansas City KS MSA 255 100.00 10.75 3.11 13.05 13.78 20.10 24.00 56.11 59.11 0.70 0.00 0.77 0.67 0.77
* Based on 2014 Peer Mortgage Data -- US and PR ** Home refinance loans originated and purchased in the MA/AA as a percentage of all home refinance loans originated and purchased in the rated area. *** Percentage of Families is based on the 2010 Census information. **** As a percentage of loans with borrower income information available. No information was available for 11.8% of loans originated and purchased by bank. 17 Data shown includes only One to Four-family and manufactured housing. (Property type of 1 or 2)

Charter Number: 209
Appendix D-70
Institution ID: First National Bank of Omaha Table 11. Borrower Distribution of Small Loans to Businesses
Borrower Distribution: SMALL LOANS TO BUSINESSES Geography: KANSAS Evaluation Period: JANUARY 1, 2012 TO DECEMBER 31, 2014 Total Small Loans
to Businesses Businesses With Revenues of
$1 million or less Loans by Original Amount Regardless of Business Size Market Share*
Assessment Area:
# % of Total**
% of Businesses***
% BANK Loans****
$100,000 or less >$100,000 to $250,000
>$250,000 to $1,000,000
All Rev$ 1 Million or Less
Full Review: Kansas City KS MSA
642 100.00 70.74 27.88 85.36 6.85 7.79 1.72 1.29
* Based on 2014 Peer Small Business Data -- US and PR ** Small loans to businesses originated and purchased in the MA/AA as a percentage of all small loans to businesses originated and purchased in the rated area. *** Businesses with revenues of $1 million or less as a percentage of all businesses (Source D&B - 2014). **** Small loans to businesses with revenues of $1 million or less as a percentage of all loans reported as small loans to businesses. No information was available for 53.12% of small loans to businesses originated and purchased by the bank.

Charter Number: 209
Appendix D-71
Institution ID: First National Bank of Omaha Table 12. Borrower Distribution of Small Loans to Farms
Borrower Distribution: SMALL LOANS TO FARMS Geography: KANSAS Evaluation Period: JANUARY 1, 2012 TO DECEMBER 31, 2014
Assessment Area:
Total Small Loans to Farms
Farms With Revenues of $1 million or less
Loans by Original Amount Regardless of Farm Size Market Share*
# % of Total**
% of Farms***
% BANK Loans****
$100,000 or less >$100,000 to $250,000
>$250,000 to $500,000
All Rev$ 1 Million or Less
Full Review: Kansas City KS MSA 2 100.00 94.44 50.00 50.00 50.00 0.00 1.28 2.70
* Based on 2014 Peer Small Business Data -- US and PR ** Small loans to farms originated and purchased in the MA/AA as a percentage of all small loans to farms originated and purchased in the rated area. *** Farms with revenues of $1 million or less as a percentage of all farms (Source D&B - 2014). **** Small loans to farms with revenues of $1 million or less as a percentage of all loans reported as small loans to farms. No information was available for 50.00% of small loans to farms originated and purchased by the bank.

Charter Number: 209
Appendix D-72
Institution ID: First National Bank of Omaha Table 14. Qualified Investments
QUALIFIED INVESTMENTS Geography: KANSAS Evaluation Period: SEPTEMBER 30, 2010 TO DECEMBER 31, 2015
Assessment Area:
Prior Period Investments* Current Period Investments Total Investments Unfunded Commitments**
# $(000’s) # $(000’s) # $(000’s) % of Total # $(000’s)
Full Review: Kansas City KS MSA 1 625 25 07,941 26 8,566 67.33 0 0 KS Statewide Investments with P/M/F
0 0 1 10 1 10 0.08 0 0
KS Statewide Investments with no P/M/F
0 0 1 4,146 1 4,146 32.59 0 0
* 'Prior Period Investments' means investments made in a previous period that are outstanding as of the examination date. ** 'Unfunded Commitments' means legally binding investment commitments that are tracked and recorded by the institution's financial reporting system.

Charter Number: 209
Appendix D-73
Institution ID: First National Bank of Omaha Table 15. Distribution of Branch Delivery System and Branch Openings/Closings
DISTRIBUTION OF BRANCH DELIVERY SYSTEM AND BRANCH OPENINGS/CLOSINGS Geography: KANSAS Evaluation Period: SEPTEMBER 30, 2010
TO DECEMBER 31, 2015 MA/Assessment Area:
Deposits
Branches
Branch Openings/Closings
Population
% of Rated Area
Deposits in AA
# of BANK
Branches
% of Rated Area
Branches in AA
Location of Branches by Income of Geographies (%)
# of Branch
Openings
# of Branch
Closings
Net change in Location of Branches (+ or - )
% of Population within Each Geography
Low
Mod
Mid
Upp
Low
Mod
Mid
Upp
Low
Mod
Mid
Upp
Full Review: Kansas City KS MSA
100.00 6 100.00 0.000 0.00 16.67 83.33 0 1 0 0 0 -1 0.68 10.13 28.43 60.75

Charter Number: 209
Appendix D-74
Institution ID: First National Bank of Omaha Table 1. Lending Volume
LENDING VOLUME Geography: NEBRASKA Evaluation Period: JANUARY 1, 2012 TO DECEMBER 31, 2014
Assessment Area (2014):
% of Rated Area
Loans (#) in MA/AA*
Home Mortgage
Small Loans to
Businesses
Small Loans to
Farms
Community Development Loans**
Total Reported Loans
% of Rated Area
Deposits in MA/AA***
#
$ (000’s)
# $ (000’s)
#
$ (000’s)
#
$ (000’s)
#
$(000’s)
Full Review: Lincoln MSA 19.85 665 100,140 379 33,689 13 731 19 64,094 1,057 134,560 11.93 Non-MSA Ctys^ 56.36 803 86,229 1,181 83,658 1,017 114,897 27 47,723 3,001 284,784 0.00 Limited Review: Gage-Butler Ctys 18.69 289 24,304 240 14,118 466 48,898 0 0 995 87,320 8.58 Grand Island NE MSA∧ 5.11 54 5,773 182 14,523 36 3,519 1 204 272 23,815 3.55 NE Statewide Loans with no P/M/F to serve AA(s)
0.00 0 0 0 0 0 0 14 165,754 14 165,754 0.00
* Loan Data as of December 31, 2014. Rated area refers to either state or multi-state MA rating area. ** The evaluation period for Community Development Loans is from September 30, 2010 to December 31, 2015. *** Deposit Data as of June 30, 2014. Rated Area refers to either the state, multi-state MA, or institution, as appropriate. ∧ The evaluation period for the Non-MSA Ctys AA and Grand Island MSA AA is April 01, 2014 to December 31, 2014.

Charter Number: 209
Appendix D-75
Institution ID: First National Bank of Omaha Table 2. Geographic Distribution of Home Purchase Loans
Geographic Distribution: HOME PURCHASE Geography: NEBRASKA Evaluation Period: JANUARY 1, 2012 TO DECEMBER 31, 2014
Assessment Area:
Total Home Purchase
Loans
Low-Income Geographies
Moderate-Income Geographies
Middle-Income Geographies
Upper-Income Geographies
Market Share (%) by Geography*
# % of Total**
% Owner Occ
Units***
% BANK Loans****
% Owner Occ
Units***
% BANK Loans
% Owner Occ
Units***
% BANK Loans
% Owner Occ
Units***
% BANK Loans
Overall
Low
Mod
Mid
Upp
Full Review: Lincoln MSA 272 43.31 4.96 3.68 14.03 10.66 40.58 47.43 40.43 38.24 2.19 3.40 2.54 2.43 1.76 Non-MSA Ctys^ 269 42.83 0.00 0.00 4.99 1.49 76.87 69.14 18.15 29.37 6.52 0.00 3.17 5.82 9.48 Limited Review: Gage-Butler Ctys 59 9.39 0.00 0.00 4.39 3.39 82.63 89.83 12.99 6.78 5.65 0.00 14.29 5.78 2.22
Grand Island MSA∧ 28 4.46 0.00 0.00 5.17 0.00 70.79 75.00 24.04 25.00 2.87 0.00 0.00 3.32 2.63
* Based on 2014 Peer Mortgage Data -- US and PR ** Home purchase loans originated and purchased in the MA/AA as a percentage of all home purchase loans originated and purchased in the rated area. *** Percentage of Owner Occupied Units is the number of owner occupied units in a particular geography divided by the number of owner occupied housing units in the area based on 2010 Census information. **** Data shown includes only One to Four-family and manufactured housing. (Property type of 1 or 2) ∧ The evaluation period for the Non-MSA Ctys AA and Grand Island MSA AA is April 01, 2014 to December 31, 2014.

Charter Number: 209
Appendix D-76
Institution ID: First National Bank of Omaha Table 3. Geographic Distribution of Home Improvement Loans
Geographic Distribution: HOME IMPROVEMENT Geography: NEBRASKA Evaluation Period: JANUARY 1, 2012 TO DECEMBER 31,
2014 Assessment Area:
Total Home Improvement
Loans
Low-Income Geographies
Moderate-Income Geographies
Middle-Income Geographies
Upper-Income Geographies
Market Share (%) by Geography*
# % of Total**
% Owner Occ
Units***
% BANK Loans****
% Owner Occ
Units***
% BANK Loans
% Owner Occ
Units***
% BANK Loans
% Owner Occ
Units***
% BANK Loans
Overall
Low
Mod
Mid
Upp
Full Review: Lincoln MSA 46 18.55 4.96 4.35 14.03 6.52 40.58 43.48 40.43 45.65 3.02 0.00 1.10 2.93 4.00 Non-MSA Ctys^ 137 55.24 0.00 0.00 4.99 2.19 76.87 76.64 18.15 21.17 22.75 0.00 16.67 22.81 23.66 Limited Review: Gage-Butler Ctys 55 22.18 0.00 0.00 4.39 3.64 82.63 92.73 12.99 3.64 30.67 0.00 66.67 32.81 0.00
Grand Island MSA∧ 10 4.03 0.00 0.00 5.17 0.00 70.79 80.00 24.04 20.00 6.21 0.00 0.00 6.78 6.45
* Based on 2014 Peer Mortgage Data -- US and PR ** Home improvement loans originated and purchased in the MA/AA as a percentage of all home improvement loans originated and purchased in the rated area. *** Percentage of Owner Occupied Units is the number of owner occupied units in a particular geography divided by the number of owner occupied housing units in the area based on 2010 Census information. **** Data shown includes only One to Four-family and manufactured housing. (Property type of 1 or 2) ∧ The evaluation period for the Non-MSA Ctys AA and Grand Island MSA AA is April 01, 2014 to December 31, 2014.

Charter Number: 209
Appendix D-77
Institution ID: First National Bank of Omaha Table 4. Geographic Distribution of Home Mortgage Refinance Loans
Geographic Distribution: HOME MORTGAGE REFINANCE Geography: NEBRASKA Evaluation Period: JANUARY 1, 2012 TO DECEMBER 31,
2014 Assessment Area:
Total Home Mortgage Refinance
Loans
Low-Income Geographies
Moderate-Income Geographies
Middle-Income Geographies
Upper-Income Geographies
Market Share (%) by Geography*
# % of Total**
% Owner Occ
Units***
% BANK Loans****
% Owner Occ
Units***
% BANK Loans
% Owner Occ
Units***
% BANK Loans
% Owner Occ
Units***
% BANK Loans
Overall
Low
Mod
Mid
Upp
Full Review: Lincoln MSA 342 37.09 4.96 4.39 14.03 11.40 40.58 29.82 40.43 54.39 1.79 4.35 2.45 1.22 1.89 Non-MSA Ctys^ 390 42.30 0.00 0.00 4.99 1.28 76.87 72.05 18.15 26.67 8.40 0.00 4.00 8.57 8.59 Limited Review: Gage-Butler Ctys 174 18.87 0.00 0.00 4.39 2.30 82.63 90.80 12.99 6.90 16.30 0.00 18.75 18.39 2.70
Grand Island MSA∧ 16 1.74 0.00 0.00 5.17 0.00 70.79 75.00 24.04 25.00 1.99 0.00 0.00 2.57 0.90
* Based on 2014 Peer Mortgage Data -- US and PR ** Home refinance loans originated and purchased in the MA/AA as a percentage of all home refinance loans originated and purchased in the rated area. *** Percentage of Owner Occupied Units is the number of owner occupied units in a particular geography divided by the number of owner occupied housing units in the area based on 2010 Census information. **** Data shown includes only One to Four-family and manufactured housing. (Property type of 1 or 2) ∧ The evaluation period for the Non-MSA Ctys AA and Grand Island MSA AA is April 01, 2014 to December 31, 2014.

Charter Number: 209
Appendix D-78
Institution ID: First National Bank of Omaha Table 5. Geographic Distribution of Multifamily Loans
Geographic Distribution: MULTIFAMILY Geography: NEBRASKA Evaluation Period: JANUARY 1, 2012 TO DECEMBER 31, 2014
Assessment Area:
Total Multifamily Loans
Low-Income Geographies
Moderate-Income Geographies
Middle-Income Geographies
Upper-Income Geographies
Market Share (%) by Geography*
# % of Total**
% of MF Units***
% BANK Loans****
% MF Units***
% BANK Loans
% MF Units***
% BANK Loans
% MF Units***
% BANK Loans
Overall
Low
Mod
Mid
Upp
Full Review: Lincoln MSA 5 38.46 24.90 20.00 28.17 60.00 31.76 20.00 15.17 0.00 3.23 0.00 10.71 0.00 0.00 Non-MSA Ctys^ 7 53.85 0.00 0.00 12.42 0.00 65.05 85.71 22.53 14.29 25.93 0.00 0.00 27.27 50.00 Limited Review: Gage-Butler Ctys 1 7.69 0.00 0.00 30.68 0.00 68.92 100.00 0.40 0.00 0.00 0.00 0.00 0.00 0.00
Grand Island MSA∧ 0 0.00 0.00 0.00 14.04 0.00 59.05 0.00 26.91 0.00 0.00 0.00 0.00 0.00 0.00
* Based on 2014 Peer Mortgage Data -- US and PR ** Multi-family loans originated and purchased in the MA/AA as a percentage of all multi-family loans originated and purchased in the rated area. *** Percentage of Multi-Family Units is the number of multi-family units in a particular geography divided by the number of multifamily housing units in the area based on 2010 Census information. **** Multifamily loan distribution includes Home Purchases, Home Improvement and Refinances. ∧ The evaluation period for the Non-MSA Ctys AA and Grand Island NE AA is April 01, 2014 to December 31, 2014.

Charter Number: 209
Appendix D-79
Institution ID: First National Bank of Omaha Table 6. Geographic Distribution of Small Loans to Businesses
Geographic Distribution: SMALL LOANS TO BUSINESSES Geography: NEBRASKA Evaluation Period: JANUARY 1, 2012 TO DECEMBER 31, 2014 Assessment Area:
Total Small Business
Loans
Low-Income Geographies
Moderate-Income Geographies
Middle-Income Geographies
Upper-Income Geographies
Market Share (%) by Geography*
# % of Total**
% of Businesses
***
% BANK Loans
% of Businesses
***
% BANK Loans
% of Businesses
***
% BANK Loans
% of Businesses
***
% BANK Loans
Overall
Low
Mod
Mid
Upp
Full Review: Lincoln MSA 372 18.84 7.75 6.99 22.65 25.00 32.23 26.61 36.94 41.40 2.98 2.61 3.16 2.65 3.28 Non-MSA Ctys^
1,181 59.80 0.00 0.00 6.07 3.39 76.04 75.87 17.89 20.75 16.33 0.00 12.61 17.02 19.10
Limited Review: Gage-Butler Ctys
240 12.15 0.00 0.00 11.78 7.50 75.63 82.50 12.59 10.00 9.63 0.00 4.08 11.61 12.12
Grand Island MSA∧
182 9.22 0.00 0.00 7.63 9.89 66.34 65.93 26.03 24.18 12.21 0.00 18.97 13.01 10.45
* Based on 2014 Peer Small Business Data -- US and PR ** Small loans to businesses originated and purchased in the MA/AA as a percentage of all small loans to businesses originated and purchased in the rated area. *** Source Data - Dun and Bradstreet (2014). ∧ The evaluation period for the Non-MSA Ctys AA and Grand Island MSA AA is April 01, 2014 to December 31, 2014.

Charter Number: 209
Appendix D-80
Institution ID: First National Bank of Omaha Table 7. Geographic Distribution of Small Loans to Farms
Geographic Distribution: SMALL LOANS TO FARMS Geography: NEBRASKA Evaluation Period: JANUARY 1, 2012 TO DECEMBER 31,
2014 Assessment Area:
Total Small Farm Loans
Low-Income Geographies
Moderate-Income Geographies
Middle-Income Geographies
Upper-Income Geographies
Market Share (%) by Geography*
# % of Total**
% of Farms***
% BANK Loans
% of Farms***
% BANK Loans
% of Farms***
% BANK Loans
% of Farms***
% BANK Loans
Overall
Low
Mod
Mid
Upp
Full Review: Lincoln MSA 13 0.85 1.58 0.00 8.49 0.00 20.32 38.46 69.61 61.54 1.48 0.00 0.00 0.00 1.71 Non-MSA Ctys^ 1,0
17 66.38 0.00 0.00 4.60 6.19 81.47 70.89 13.92 22.91 30.76 0.00 60.64 26.95 46.01
Limited Review: Gage-Butler Ctys
466 30.42 0.00 0.00 0.76 0.00 73.06 95.49 26.18 4.51 31.14 0.00 0.00 35.98 9.09
Grand Island MSA∧ 36 2.35 0.00 0.00 2.88 0.00 78.94 88.89 18.18 11.11 22.52 0.00 0.00 22.73 22.22
* Based on 2014 Peer Small Business Data -- US and PR ** Small loans to farms originated and purchased in the MA/AA as a percentage of all small loans to farms originated and purchased in the rated area. *** Source Data - Dun and Bradstreet (2014). ∧ The evaluation period for the Non-MSA Ctys AA and Grand Island MSA AA is April 01, 2014 to December 31, 2014.

Charter Number: 209
Appendix D-81
Institution ID: First National Bank of Omaha Table 8. Borrower Distribution of Home Purchase Loans
Borrower Distribution: HOME PURCHASE Geography: NEBRASKA Evaluation Period: JANUARY 1, 2012 TO DECEMBER 31, 2014
Assessment Area:
Total Home Purchase Loans
Low-Income Borrowers
Moderate-Income Borrowers
Middle-Income Borrowers
Upper-Income Borrowers
Market Share*
# % of Total**
% Families
***
% BANK Loans****
% Families
18
% BANK Loans****
% Families
***
% BANK Loans****
% Families
***
% BANK Loans****
Overall
Low
Mod
Mid
Upp
Full Review: Lincoln MSA 272 43.31 19.40 5.71 18.18 25.71 23.30 25.71 39.12 42.86 2.47 1.58 2.22 2.35 2.95
Non-MSA Ctys^ 269 42.83 17.80 6.36 17.85 23.73 23.38 24.15 40.96 45.76 7.79 7.11 7.71 6.86 8.60
Limited Review: Gage-Butler Ctys 59 9.39 16.86 8.77 18.04 33.33 25.28 29.82 39.82 28.07 6.57 2.63 8.62 3.61 9.47
Grand Island MSA∧ 28 4.46 17.96 0.00 18.60 20.00 24.68 35.00 38.76 45.00 2.68 0.00 2.05 3.08 3.56
* Based on 2014 Peer Mortgage Data -- US and PR ** Home purchase loans originated and purchased in the MA/AA as a percentage of all home purchase loans originated and purchased in the rated area. *** Percentage of Families is based on the 2010 Census information. **** As a percentage of loans with borrower income information available. No information was available for 11.1% of loans originated and purchased by bank. 18 Data shown includes only One to Four-family and manufactured housing. (Property type of 1 or 2) ∧ The evaluation period for the Non-MSA Ctys AA and Grand Island MSA AA is April 01, 2014 to December 31, 2014.

Charter Number: 209
Appendix D-82
Institution ID: First National Bank of Omaha Table 9. Borrower Distribution of Home Improvement Loans
Borrower Distribution: HOME IMPROVEMENT Geography: NEBRASKA Evaluation Period: JANUARY 1, 2012 TO DECEMBER 31, 2014
Assessment Area:
Total Home Improvement
Loans
Low-Income Borrowers
Moderate-Income Borrowers
Middle-Income Borrowers
Upper-Income Borrowers
Market Share*
# % of Total**
% Families
***
% BANK Loans****
% Families
19
% BANK Loans****
% Families
***
% BANK Loans****
% Families
***
% BANK Loans****
Overall
Low
Mod
Mid
Upp
Full Review:
Lincoln NE MSA 46 18.55 19.40 2.27 18.18 22.73 23.30 36.36 39.12 38.64 3.05 0.00 0.92 3.80 4.03
Non-MSA Ctys^ 137 55.24 17.80 5.38 17.85 15.38 23.38 30.00 40.96 49.23 22.57 13.33 20.99 23.62 24.35
Limited Review:
Gage-Butler Ctys 55 22.18 16.86 11.54 18.04 19.23 25.28 32.69 39.82 36.54 31.82 16.67 38.46 31.82 32.00
Grand Island MSA∧
10 4.03 17.96 0.00 18.60 0.00 24.68 55.56 38.76 44.44 6.52 0.00 0.00 16.13 6.45
* Based on 2014 Peer Mortgage Data -- US and PR ** Home improvement loans originated and purchased in the MA/AA as a percentage of all home improvement loans originated and purchased in the rated area. *** Percentage of Families is based on the 2010 Census information. **** As a percentage of loans with borrower income information available. No information was available for 5.2% of loans originated and purchased by bank. 19 Data shown includes only One to Four-family and manufactured housing. (Property type of 1 or 2) ∧ The evaluation period for the Non-MSA Ctys AA and Grand Island MSA AA is April 01, 2014 to December 31, 2014.

Charter Number: 209
Appendix D-83
Institution ID: First National Bank of Omaha Table 10. Borrower Distribution of Home Mortgage Refinance Loans
Borrower Distribution: HOME MORTGAGE REFINANCE Geography: NEBRASKA Evaluation Period: JANUARY 1, 2012 TO DECEMBER 31,
2014 Assessment Area:
Total Home Mortgage
Refinance Loans
Low-Income Borrowers
Moderate-Income Borrowers
Middle-Income Borrowers
Upper-Income Borrowers
Market Share*
# % of Total**
% Families
***
% BANK Loans****
% Families
20
% BANK Loans****
% Families
***
% BANK Loans****
% Families
***
% BANK Loans****
Overall
Low
Mod
Mid
Upp
Full Review: Lincoln MSA 342 37.09 19.40 3.47 18.18 19.10 23.30 26.04 39.12 51.39 1.69 0.41 1.89 2.33 1.49 Non-MSA Ctys^ 390 42.30 17.80 4.98 17.85 16.51 23.38 23.68 40.96 54.83 7.88 4.79 6.92 5.91 10.03 Limited Review: Gage-Butler Ctys 174 18.87 16.86 10.13 18.04 20.25 25.28 20.89 39.82 48.73 17.17 20.00 16.67 22.03 14.00 Grand Island MSA∧
16 1.74 17.96 0.00 18.60 14.29 24.68 21.43 38.76 64.29 2.10 0.00 1.15 1.98 3.27
* Based on 2014 Peer Mortgage Data -- US and PR ** Home refinance loans originated and purchased in the MA/AA as a percentage of all home refinance loans originated and purchased in the rated area. *** Percentage of Families is based on the 2010 Census information. **** As a percentage of loans with borrower income information available. No information was available for 15.3% of loans originated and purchased by bank. 20 Data shown includes only One to Four-family and manufactured housing. (Property type of 1 or 2) ∧ The evaluation period for the Non-MSA Counties AA and Grand Island MSA AA is April 01, 2014 to December 31, 2014.
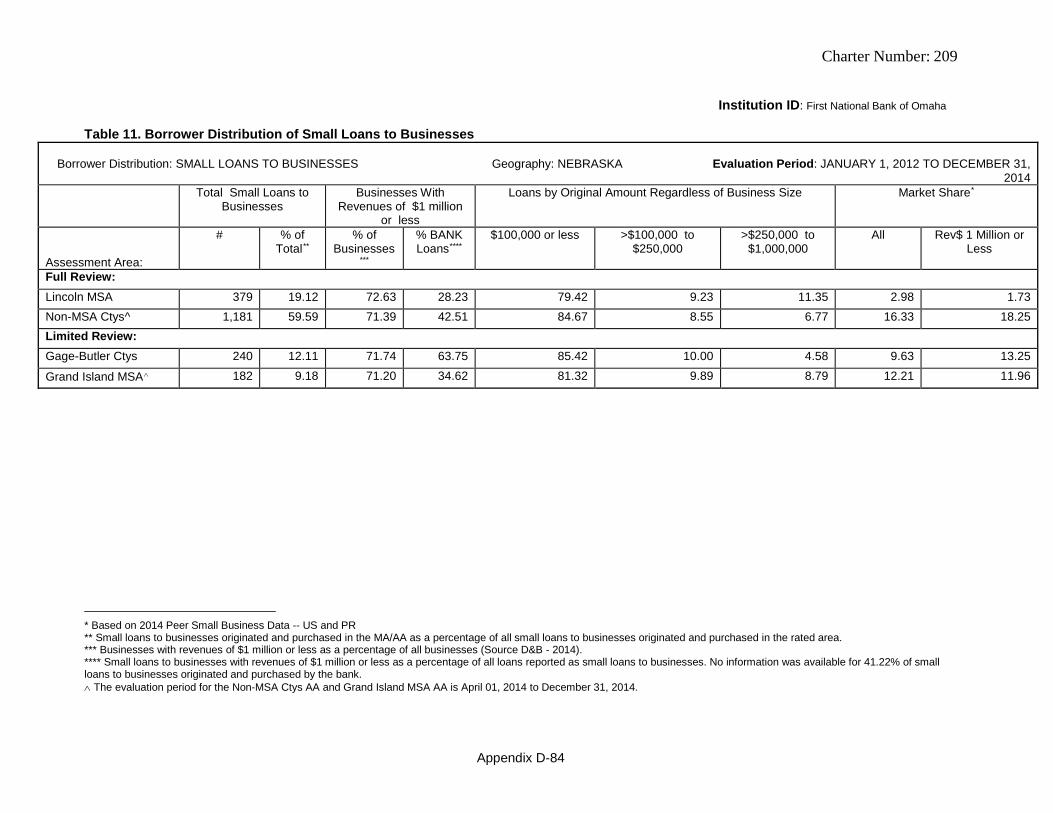
Charter Number: 209
Appendix D-84
Institution ID: First National Bank of Omaha Table 11. Borrower Distribution of Small Loans to Businesses
Borrower Distribution: SMALL LOANS TO BUSINESSES Geography: NEBRASKA Evaluation Period: JANUARY 1, 2012 TO DECEMBER 31,
2014 Total Small Loans to
Businesses Businesses With
Revenues of $1 million or less
Loans by Original Amount Regardless of Business Size Market Share*
Assessment Area:
# % of Total**
% of Businesses
***
% BANK Loans****
$100,000 or less >$100,000 to $250,000
>$250,000 to $1,000,000
All Rev$ 1 Million or Less
Full Review: Lincoln MSA 379 19.12 72.63 28.23 79.42 9.23 11.35 2.98 1.73 Non-MSA Ctys^ 1,181 59.59 71.39 42.51 84.67 8.55 6.77 16.33 18.25 Limited Review: Gage-Butler Ctys 240 12.11 71.74 63.75 85.42 10.00 4.58 9.63 13.25
Grand Island MSA∧ 182 9.18 71.20 34.62 81.32 9.89 8.79 12.21 11.96
* Based on 2014 Peer Small Business Data -- US and PR ** Small loans to businesses originated and purchased in the MA/AA as a percentage of all small loans to businesses originated and purchased in the rated area. *** Businesses with revenues of $1 million or less as a percentage of all businesses (Source D&B - 2014). **** Small loans to businesses with revenues of $1 million or less as a percentage of all loans reported as small loans to businesses. No information was available for 41.22% of small loans to businesses originated and purchased by the bank. ∧ The evaluation period for the Non-MSA Ctys AA and Grand Island MSA AA is April 01, 2014 to December 31, 2014.

Charter Number: 209
Appendix D-85
Institution ID: First National Bank of Omaha Table 12. Borrower Distribution of Small Loans to Farms
Borrower Distribution: SMALL LOANS TO FARMS Geography: NEBRASKA Evaluation Period: JANUARY 1, 2012 TO DECEMBER 31,
2014 Assessment Area:
Total Small Loans to Farms
Farms With Revenues of $1 million or less
Loans by Original Amount Regardless of Farm Size Market Share*
# % of Total**
% of Farms***
% BANK Loans****
$100,000 or less >$100,000 to $250,000
>$250,000 to $500,000
All Rev$ 1 Million or Less
Full Review: Lincoln MSA 13 0.85 98.77 76.92 92.31 7.69 0.00 1.48 1.42 Non-MSA Ctys^ 1,017 66.38 98.10 72.47 65.98 21.53 12.49 30.76 33.66 Limited Review: Gage-Butler Ctys 466 30.42 99.36 87.34 66.09 22.75 11.16 31.14 32.09
Grand Island MSA∧ 36 2.35 98.45 63.89 72.22 16.67 11.11 22.52 24.47
* Based on 2014 Peer Small Business Data -- US and PR ** Small loans to farms originated and purchased in the MA/AA as a percentage of all small loans to farms originated and purchased in the rated area. *** Farms with revenues of $1 million or less as a percentage of all farms (Source D&B - 2014). **** Small loans to farms with revenues of $1 million or less as a percentage of all loans reported as small loans to farms. No information was available for 12.40% of small loans to farms originated and purchased by the bank. ∧ The evaluation period for the Non-MSA Ctys AA and Grand Island MSA AA is April 01, 2014 to December 31, 2014.
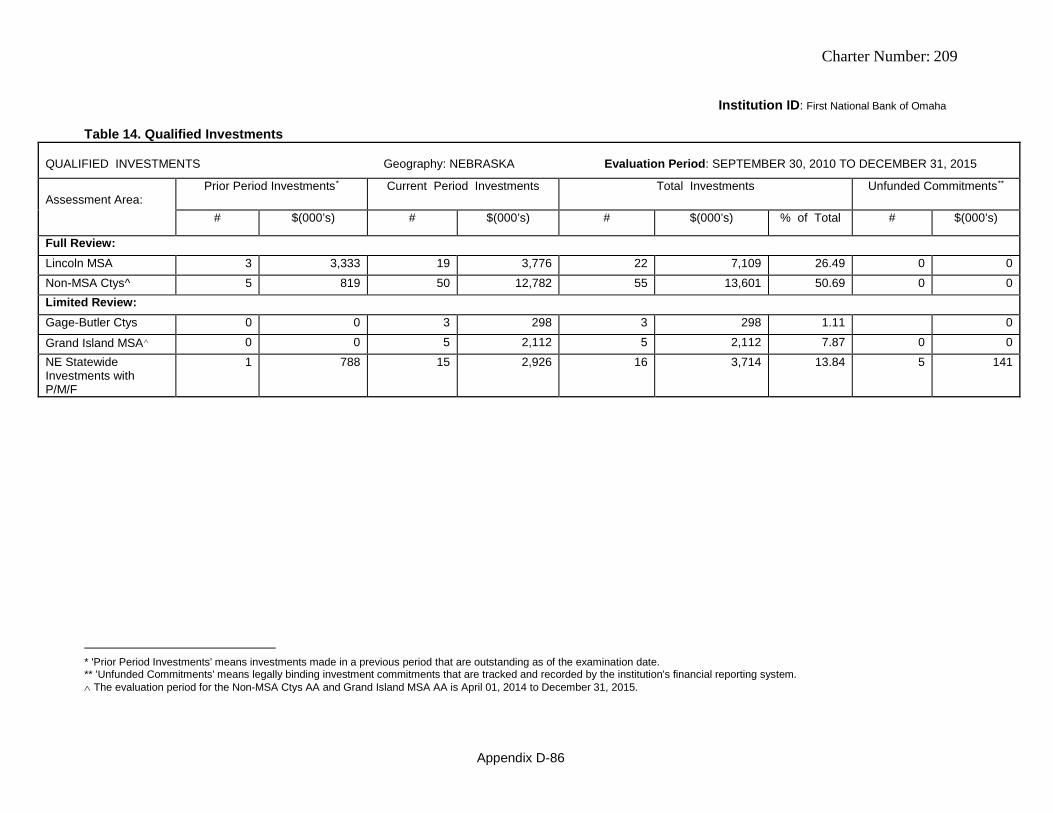
Charter Number: 209
Appendix D-86
Institution ID: First National Bank of Omaha Table 14. Qualified Investments
QUALIFIED INVESTMENTS Geography: NEBRASKA Evaluation Period: SEPTEMBER 30, 2010 TO DECEMBER 31, 2015
Assessment Area:
Prior Period Investments* Current Period Investments Total Investments Unfunded Commitments**
# $(000’s) # $(000’s) # $(000’s) % of Total # $(000’s)
Full Review: Lincoln MSA 3 3,333 19 3,776 22 7,109 26.49 0 0 Non-MSA Ctys^ 5 819 50 12,782 55 13,601 50.69 0 0 Limited Review: Gage-Butler Ctys 0 0 3 298 3 298 1.11 0
Grand Island MSA∧ 0 0 5 2,112 5 2,112 7.87 0 0 NE Statewide Investments with P/M/F
1 788 15 2,926 16 3,714 13.84 5 141
* 'Prior Period Investments' means investments made in a previous period that are outstanding as of the examination date. ** 'Unfunded Commitments' means legally binding investment commitments that are tracked and recorded by the institution's financial reporting system. ∧ The evaluation period for the Non-MSA Ctys AA and Grand Island MSA AA is April 01, 2014 to December 31, 2015.

Charter Number: 209
Appendix D-87
Institution ID: First National Bank of Omaha Table 15. Distribution of Branch Delivery System and Branch Openings/Closings
DISTRIBUTION OF BRANCH DELIVERY SYSTEM AND BRANCH OPENINGS/CLOSINGS Geography: NEBRASKA Evaluation Period: SEPTEMER 30,
2010 TO DECEMBER 31, 2015 MA/Assessment Area:
Deposits
Branches
Branch Openings/Closings
Population
% of Rated Area
Deposits in AA
# of BANK
Branches
% of Rated Area
Branches in AA
Location of Branches by Income of Geographies (%)
# of
Branch Openings
# of
Branch Closings
Net change in Location of Branches (+ or - )
% of Population within Each Geography
Low
Mod
Mid
Upp
Low
Mod
Mid
Upp
Low
Mod
Mid
Upp
Full Review: Lincoln MSA 11.79 5 22.73 0.00 40.00 20.00 40.00 1 0 0 0 +1 0 11.91 18.93 36.83 31.79
Non-MSA Ctys^ 76.59 14 63.64 0.00 7.14 78.57 14.29 0 0 0 0 0 0 0.00 6.94 75.92 17.14
Limited Review: Gage-Butler Ctys 8.29 2 9.09 0.00 0.00 100.0 0.00 0 1 0 -1 0 0 0.00 6.73 81.80 11.47
Grand Island MSA∧
3.33 1 4.54 0.00 0.00 100.0 0.00 0 0 0 0 0 0 0.00 8.60 69.43 21.96
∧ The evaluation period for the Non-MSA Ctys AA and Grand Island MSA AA is April 01, 2014 to December 31, 2015.

Charter Number: 209
Appendix D-88
Institution ID: First National Bank of Omaha Table 1. Lending Volume
LENDING VOLUME Geography: TEXAS Evaluation Period: JANUARY 1, 2012 TO DECEMBER 31, 2014
Assessment Area (2014):
% of Rated Area
Loans (#) in MA/AA*
Home Mortgage
Small Loans to
Businesses
Small Loans to
Farms
Community Development Loans**
Total Reported Loans
% of Rated Area
Deposits in MA/AA***
#
$ (000’s)
# $ (000’s)
#
$ (000’s)
#
$ (000’s)
#
$(000’s)
Full Review: Dallas-Plano-Irving MD 100.00 144 25,832 297 16,439 0 0 1 4,868 441 42,271 100.00 TX Statewide Loans with no P/M/F to serve an AA
0.00 0 0 0 0 0 0 2 27,010 0 0 0.00
* Loan Data as of December 31, 2014. Rated area refers to either state or multi-state MA rating area. ** The evaluation period for Community Development Loans is from September 30, 2010 to December 31, 2015. *** Deposit Data as of June 30, 2014. Rated Area refers to either the state, multi-state MA, or institution, as appropriate.

Charter Number: 209
Appendix D-89
Institution ID: First National Bank of Omaha Table 2. Geographic Distribution of Home Purchase Loans
Geographic Distribution: HOME PURCHASE Geography: TEXAS Evaluation Period: JANUARY 1, 2012 TO DECEMBER 31, 2014
Assessment Area:
Total Home Purchase Loans
Low-Income Geographies
Moderate-Income Geographies
Middle-Income Geographies
Upper-Income Geographies
Market Share (%) by Geography*
# % of Total**
% Owner Occ
Units***
% BANK
Loans***
*
% Owner Occ
Units***
% BANK Loans
% Owner Occ
Units***
% BANK Loans
% Owner Occ
Units***
% BANK Loans
Overall
Low
Mod
Mid
Upp
Full Review: Dallas-Plano-Irving MD 62 100.00 0.04 0.00 3.52 3.23 22.27 14.52 74.18 82.26 0.10 0.00 0.00 0.09 0.10
* Based on 2014 Peer Mortgage Data -- US and PR ** Home purchase loans originated and purchased in the MA/AA as a percentage of all home purchase loans originated and purchased in the rated area. *** Percentage of Owner Occupied Units is the number of owner occupied units in a particular geography divided by the number of owner occupied housing units in the area based on 2010 Census information. **** Data shown includes only One to Four-family and manufactured housing. (Property type of 1 or 2)

Charter Number: 209
Appendix D-90
Institution ID: First National Bank of Omaha Table 3. Geographic Distribution of Home Improvement Loans
Geographic Distribution: HOME IMPROVEMENT Geography: TEXAS Evaluation Period: JANUARY 1, 2012 TO DECEMBER 31, 2014
Assessment Area:
Total Home Improvement
Loans
Low-Income Geographies
Moderate-Income Geographies
Middle-Income Geographies
Upper-Income Geographies
Market Share (%) by Geography*
# % of Total**
% Owner Occ
Units***
% BANK Loans****
% Owner Occ
Units***
% BANK Loans
% Owner Occ
Units***
% BANK Loans
% Owner Occ
Units***
% BANK Loans
Overall
Low
Mod
Mid
Upp
Full Review: Dallas-Plano-Irving MD
31 100.00 0.04 0.00 3.52 0.00 22.27 19.35 74.18 80.65 0.85 0.00 0.00 1.22 0.80
* Based on 2014 Peer Mortgage Data -- US and PR ** Home improvement loans originated and purchased in the MA/AA as a percentage of all home improvement loans originated and purchased in the rated area. *** Percentage of Owner Occupied Units is the number of owner occupied units in a particular geography divided by the number of owner occupied housing units in the area based on 2010 Census information. **** Data shown includes only One to Four-family and manufactured housing. (Property type of 1 or 2)

Charter Number: 209
Appendix D-91
Institution ID: First National Bank of Omaha Table 4. Geographic Distribution of Home Mortgage Refinance Loans
Geographic Distribution: HOME MORTGAGE REFINANCE Geography: TEXAS Evaluation Period: JANUARY 1, 2012 TO DECEMBER 31, 2014
Assessment Area:
Total Home Mortgage Refinance
Loans
Low-Income Geographies
Moderate-Income Geographies
Middle-Income Geographies
Upper-Income Geographies
Market Share (%) by Geography*
# % of Total**
% Owner Occ Units***
% BANK Loans****
% Owner Occ Units***
% BANK Loans
% Owner Occ Units***
% BANK Loans
% Owner Occ Units***
% BANK Loans
Overall
Low
Mod
Mid
Upp
Full Review: Dallas-Plano-Irving MD
51 100.00 0.04 0.00 3.52 3.92 22.27 13.73 74.18 82.35 0.05 0.00 0.00 0.08 0.04
* Based on 2014 Peer Mortgage Data -- US and PR ** Home refinance loans originated and purchased in the MA/AA as a percentage of all home refinance loans originated and purchased in the rated area. *** Percentage of Owner Occupied Units is the number of owner occupied units in a particular geography divided by the number of owner occupied housing units in the area based on 2010 Census information. **** Data shown includes only One to Four-family and manufactured housing. (Property type of 1 or 2)

Charter Number: 209
Appendix D-92
Institution ID: First National Bank of Omaha Table 6. Geographic Distribution of Small Loans to Businesses
Geographic Distribution: SMALL LOANS TO BUSINESSES Geography: TEXAS Evaluation Period: JANUARY 1, 2012 TO DECEMBER 31, 2014
Assessment Area:
Total Small Business Loans
Low-Income Geographies
Moderate-Income Geographies
Middle-Income Geographies
Upper-Income Geographies
Market Share (%) by Geography*
# % of Total**
% of Busines
ses***
% BANK Loans
% of Businesses***
% BANK Loans
% of Businesses***
% BANK Loans
% of Businesses***
% BANK Loans
Overall
Low
Mod
Mid
Upp
Full Review: Dallas-Plano-Irving MD 297 100.00 0.12 0.00 8.25 13.13 19.15 18.18 72.48 68.69 0.42 0.36 0.58 0.42 0.41
* Based on 2014 Peer Small Business Data -- US and PR ** Small loans to businesses originated and purchased in the MA/AA as a percentage of all small loans to businesses originated and purchased in the rated area. *** Source Data - Dun and Bradstreet (2014).

Charter Number: 209
Appendix D-93
Institution ID: First National Bank of Omaha Table 8. Borrower Distribution of Home Purchase Loans
Borrower Distribution: HOME PURCHASE Geography: TEXAS Evaluation Period: JANUARY 1, 2012 TO DECEMBER 31, 2014
Assessment Area:
Total Home Purchase
Loans
Low-Income Borrowers
Moderate-Income Borrowers
Middle-Income Borrowers
Upper-Income Borrowers
Market Share*
# % of Total**
% Families
***
% BANK Loans****
% Families
21
% BANK Loans****
% Families
***
% BANK Loans****
% Families
***
% BANK Loans****
Overall
Low
Mod
Mid
Upp
Full Review: Dallas-Plano-Irving MD 62 100.00 11.86 0.00 11.88 10.53 17.44 22.81 58.82 66.67 0.11 0.00 0.10 0.14 0.11
* Based on 2014 Peer Mortgage Data -- US and PR ** Home purchase loans originated and purchased in the MA/AA as a percentage of all home purchase loans originated and purchased in the rated area. *** Percentage of Families is based on the 2010 Census information. **** As a percentage of loans with borrower income information available. No information was available for 8.1% of loans originated and purchased by bank. 21 Data shown includes only One to Four-family and manufactured housing. (Property type of 1 or 2)

Charter Number: 209
Appendix D-94
Institution ID: First National Bank of Omaha Table 9. Borrower Distribution of Home Improvement Loans
Borrower Distribution: HOME IMPROVEMENT Geography: TEXAS Evaluation Period: JANUARY 1, 2012 TO DECEMBER 31, 2014
Assessment Area:
Total Home Improvement
Loans
Low-Income Borrowers
Moderate-Income Borrowers
Middle-Income Borrowers
Upper-Income Borrowers
Market Share*
# % of Total**
% Families
***
% BANK Loans****
% Families
22
% BANK Loans****
% Families
***
% BANK Loans****
% Families
***
% BANK Loans****
Overall
Low
Mod
Mid
Upp
Full Review: Dallas-Plano-Irving MD
31 100.00 11.86 0.00 11.88 6.67 17.44 16.67 58.82 76.67 0.96 0.00 0.92 1.90 0.86
* Based on 2014 Peer Mortgage Data -- US and PR ** Home improvement loans originated and purchased in the MA/AA as a percentage of all home improvement loans originated and purchased in the rated area. *** Percentage of Families is based on the 2010 Census information. **** As a percentage of loans with borrower income information available. No information was available for 3.2% of loans originated and purchased by bank. 22 Data shown includes only One to Four-family and manufactured housing. (Property type of 1 or 2)

Charter Number: 209
Appendix D-95
Institution ID: First National Bank of Omaha Table 10. Borrower Distribution of Home Mortgage Refinance Loans
Borrower Distribution: HOME MORTGAGE REFINANCE Geography: TEXAS Evaluation Period: JANUARY 1, 2012 TO DECEMBER 31, 2014
Assessment Area:
Total Home Mortgage
Refinance Loans
Low-Income Borrowers
Moderate-Income Borrowers
Middle-Income Borrowers
Upper-Income Borrowers
Market Share*
# % of Total**
% Families
***
% BANK Loans****
% Families
23
% BANK Loans****
% Families
***
% BANK Loans****
% Families
***
% BANK Loans****
Overall
Low
Mod
Mid
Upp
Full Review: Dallas-Plano-Irving MD 51 100.00 11.86 4.44 11.88 4.44 17.44 8.89 58.82 82.22 0.06 0.00 0.10 0.05 0.06
* Based on 2014 Peer Mortgage Data -- US and PR ** Home refinance loans originated and purchased in the MA/AA as a percentage of all home refinance loans originated and purchased in the rated area. *** Percentage of Families is based on the 2010 Census information. **** As a percentage of loans with borrower income information available. No information was available for 11.8% of loans originated and purchased by bank. 23 Data shown includes only One to Four-family and manufactured housing. (Property type of 1 or 2)

Charter Number: 209
Appendix D-96
Institution ID: First National Bank of Omaha Table 11. Borrower Distribution of Small Loans to Businesses
Borrower Distribution: SMALL LOANS TO BUSINESSES Geography: TEXAS Evaluation Period: JANUARY 1, 2012 TO DECEMBER 31, 2014
Total Small Loans to Businesses
Businesses With Revenues of $1 million
or less
Loans by Original Amount Regardless of Business Size Market Share*
Assessment Area:
# % of Total**
% of Businesses
***
% BANK Loans****
$100,000 or less >$100,000 to $250,000
>$250,000 to $1,000,000
All Rev$ 1 Million or Less
Full Review: Dallas-Plano-Irving MD 297 100.00 72.01 20.54 87.54 6.06 6.40 0.42 0.16
* Based on 2014 Peer Small Business Data -- US and PR ** Small loans to businesses originated and purchased in the MA/AA as a percentage of all small loans to businesses originated and purchased in the rated area. *** Businesses with revenues of $1 million or less as a percentage of all businesses (Source D&B - 2014). **** Small loans to businesses with revenues of $1 million or less as a percentage of all loans reported as small loans to businesses. No information was available for 66.33% of small loans to businesses originated and purchased by the bank.

Charter Number: 209
Appendix D-97
Institution ID: First National Bank of Omaha Table 14. Qualified Investments
QUALIFIED INVESTMENTS Geography: TEXAS Evaluation Period: SEPTEMBER 30, 2010 TO DECEMBER 31, 2015
Assessment Area:
Prior Period Investments* Current Period Investments Total Investments Unfunded Commitments**
# $(000’s) # $(000’s) # $(000’s) % of Total # $(000’s)
Full Review: Dallas-Plano-Irving MD 1 2,461 9 73 10 2,534 91.55 0 0 TX Statewide with P/M/F to serve an AA
0 0 1 234 1 234 8.45 0 0
* 'Prior Period Investments' means investments made in a previous period that are outstanding as of the examination date. ** 'Unfunded Commitments' means legally binding investment commitments that are tracked and recorded by the institution's financial reporting system.

Charter Number: 209
Appendix D-98
Institution ID: First National Bank of Omaha Table 15. Distribution of Branch Delivery System and Branch Openings/Closings
DISTRIBUTION OF BRANCH DELIVERY SYSTEM AND BRANCH OPENINGS/CLOSINGS Geography: TEXAS Evaluation Period: SEPTEMBER 30, 2010
TO DECEMBER 31, 2015 MA/Assessment Area:
Deposits
Branches
Branch Openings/Closings
Population
% of Rated Area
Deposits in AA
# of BANK
Branches
% of Rated Area
Branches in AA
Location of Branches by Income of Geographies (%)
# of
Branch Openings
# of
Branch Closings
Net change in Location of Branches (+ or - )
% of Population within Each Geography
Low
Mod
Mid
Upp
Low
Mod
Mid
Upp
Low
Mod
Mid
Upp
Full Review: Dallas-Plano-Irving MD
100.00 4 100.00 0.00 0.00 0.00 100.00 0 0 0 0 0 0 0.39 6.97 25.02 67.62

Charter Number: 209
Appendix D-99
Institution ID: First National Bank of Omaha Table 1. Lending Volume
LENDING VOLUME Geography: REGIONAL & NATIONWIDE Evaluation Period: SEPTEMBER 30, 2010 TO DECEMBER 31, 2015
Assessment Area
% of Rated Area
Loans (#) in MA/AA
Home Mortgage
Small Loans to
Businesses
Small Loans to
Farms
Community Development Loans**
Total Reported Loans
% of Rated Area
Deposits in MA/AA
#
$ (000’s)
# $ (000’s)
#
$ (000’s)
#
$ (000’s)
#
$(000’s)
Regional Activity: Regional with P/M/F to serve an AA(s)
0.00 0 0 0 0 0 0 4 22,000 0 0 0.00
Regional with no P/M/F to serve an AA(s)
0.00 0 0 0 0 0 0 2 7,850 0 0 0.00
Nationwide Activity: Nationwide with no P/M/F to serve an AA(s)
0.00 0 0 0 0 0 0 1 6,000 0 0 0.00
** The evaluation period for Community Development Loans is from September 30, 2010 to December 31, 2015.

Charter Number: 209
Appendix D-100
Institution ID: First National Bank of Omaha Table 14. Qualified Investments
QUALIFIED INVESTMENTS Geography: REGIONAL AND NATIONWIDE Evaluation Period: SEPTEMBER 30, 2010 TO
DECEMBER 31, 2015 Assessment Area:
Prior Period Investments* Current Period Investments Total Investments Unfunded Commitments**
# $(000’s) # $(000’s) # $(000’s) % of Total # $(000’s)
Regional Activity: Regional 0 0 0 0 0 0 0.00 0 0
Nationwide Activity: Nationwide with P/M/F to serve an AA(s)
0 0 1 14,250 1 14,250 0.00 1 10,212
* 'Prior Period Investments' means investments made in a previous period that are outstanding as of the examination date. ** 'Unfunded Commitments' means legally binding investment commitments that are tracked and recorded by the institution's financial reporting system.

Charter Number: 209
Appendix D-101