Embed Size (px)
Citation preview

A Ten Year Strategic Plan to Advance the Well - Being of Older Adults in
Santa Clara County
Community For A
Lifetime
CCOOMMMMUUNNIITTYY FFOORR AA LLIIFFEETTIIMMEE
AA TTeenn--YYeeaarr SSttrraatteeggiicc PPllaann TToo AAddvvaannccee TThhee WWeellll--BBeeiinngg OOff OOllddeerr AAdduullttss
IInn SSaannttaa CCllaarraa CCoouunnttyy
FFEEBBRRUUAARRYY 22000055
JJOOIINNTTLLYY SSPPOONNSSOORREEDD BBYY:: TTHHEE CCIITTYY OOFF SSAANN JJOOSSÉÉ AANNDD TTHHEE CCOOUUNNTTYY OOFF SSAANNTTAA CCLLAARRAA
PPRREEPPAARREEDD IINN CCOOLLLLAABBOORRAATTIIOONN WWIITTHH::
TTHHEE SSTTRRAATTEEGGIICC PPLLAANN AADDVVIISSOORRYY GGRROOUUPP &&
MMGGTT OOFF AAMMEERRIICCAA,, IINNCC..
455 CAPITOL MALL, SUITE 600 • SACRAMENTO, CALIFORNIA 95814 (916) 443-3411
WWW. MGTOFAMERICA.COM


February 1, 2005 Dear Fellow Community Members, We would like to take this opportunity to thank everyone who contributed to the development of the Aging Services Strategic Plan. This project was truly a community effort. Over 1,100 community members shared their time and experiences in the many town hall meetings, focus groups, and surveys that were held to develop the Older Adult Needs Assessment. Volunteers from senior programs and community based organizations provided translation services to gather input from monolingual older adults of many backgrounds. Senior service providers volunteered their time and expertise to serve as focus group participants and facilitators, as well as providing input for the development of the strategies presented in this plan. We would also like to thank the members of the Strategic Plan Advisory Group who gave so freely of their wealth of experience and knowledge to help guide the development of the Strategic Plan. Together they donated over 1,000 volunteer hours to advise the Project, conduct study sessions, hear community input, and review the draft plan. The Strategic Plan, “Community for a Lifetime”, provides a practical vision for meeting the needs of older adults and their families over the next ten years. This vision can be achieved through implementation of the Plan’s strategy recommendations, all of which originated in community input. Implementation of this vision is critical now if we are to be prepared support the needs of our aging population and the community as a whole. Sincerely,
Donald F. Gage Ken Yeager Santa Clara County City of San José Board of Supervisors, District 1 Council Member, District 6

CCIITTYY OOFF SSAANN JJOOSSÉÉ
CCIITTYY CCOOUUNNCCIILL
Mayor Ron Gonzales Linda J. LeZotte, District 1 Ken Yeager, District 6 Forrest Williams, District 2 Terry O. Gregory, District 7 Cindy Chavez, District 3 David D. Cortese, District 8 Chuck Reed, District 4 Judy Chirco, District 9 Nora Campos, District 5 Nancy Pyle, District 10
CCIITTYY AADDMMIINNIISSTTRRAATTIIOONN CCIITTYY AATTTTOORRNNEEYY’’SS OOFFFFIICCEE Del D. Borgsdorf, City Manager Richard Doyle, City Attorney Mark Linder, Assistant City Manager
DDEEPPTT.. OOFF PPAARRKKSS,, RREECCRREEAATTIIOONN AANNDD NNEEIIGGHHBBOORRHHOOOODD SSEERRVVIICCEESS
Sara Hensley, Director Joan Carrico, Deputy Director Albert Balagso, Assistant Director
CCOOUUNNTTYY OOFF SSAANNTTAA CCLLAARRAA
BBOOAARRDD OOFF SSUUPPEERRVVIISSOORRSS
Chair Liz Kniss, District 5
Donald F. Gage, District 1 Pete Mc Hugh, District 3 Blanca Alvarado, District 2 Jim T. Beall, Jr., District 4
CCOOUUNNTTYY EEXXEECCUUTTIIVVEE’’SS OOFFFFIICCEE Peter Kutras, Jr., County Executive
SSOOCCIIAALL SSEERRVVIICCEESS AAGGEENNCCYY DDEEPPAARRTTMMEENNTT OOFF AAGGIINNGG WWiillll LLiigghhttbboouurrnnee,, DDiirreeccttoorr AANNDD AADDUULLTT SSEERRVVIICCEESS BBeettttyy FF.. MMaallkkss,, DDiirreeccttoorr

SSTTRRAATTEEGGIICC PPLLAANN AADDVVIISSOORRYY GGRROOUUPP MMEEMMBBEERRSS CCOO--CCHHAAIIRRSS
County Supervisor Don Gage and City Councilmember Ken Yeager
PPRROOJJEECCTT MMAANNAAGGEEMMEENNTT TTEEAAMM Joan Carrico San José Parks, Recreation, and Neighborhood Services Laura Cunningham Santa Clara County Department of Aging and Adult Services Diane Lindberg San José Parks, Recreation, and Neighborhood Services Betty F. Malks Santa Clara County Department of Aging and Adult Services Cathy Noonan San José Parks, Recreation, and Neighborhood Services
AADDVVIISSOORRYY GGRROOUUPP MMEEMMBBEERRSS Julie Aragon Santa Clara County Department of Aging and Adult Services Georgia Bacil Senior Adults Legal Assistance Deb Bogart San José Parks, Recreation, and Neighborhood Services Sunshine Borelli Office of County Supervisor Jim Beall Alan Briscoe San José Parks, Recreation, and Neighborhood Services Kathryn Brown Economic and Social Opportunities Jamie Buckmaster Santa Clara County Department of Aging and Adult Services Robert Cecil Santa Clara County Department of Aging and Adult Services Connie Corrales Council on Aging of Silicon Valley Marilou Cristina Catholic Charities of Santa Clara County Richard Crosetti Office of Councilmember Ken Yeager Sandi Douglas Housing Authority of Santa Clara County Megan Doyle Office of Councilmember Ken Yeager Christina Gilmore Office of Councilmember Linda LeZotte Mayor Ron Gonzales City of San José Sara Hensley San José Parks, Recreation, and Neighborhood Services Nancy Hikoyeda San José State University Gerontology Program Seema Jaffee San José Senior Citizens Commission Najoo Junck San José Parks, Recreation, and Neighborhood Services Sue LaForge National Council on Aging Lorraine Larson Council on Aging of Silicon Valley Eva Lee San José Parks, Recreation, and Neighborhood Services Councilmember Linda LeZotte City of San José City Council Les Lindop Santa Clara County Department of Aging and Adult Services Avo Makdessian Office of Mayor Ron Gonzales George Miskulin San José Senior Citizens Commission Patricia Brown Moriarty San José Senior Citizens Commission Jim Murphy Santa Clara Valley Health and Hospital System Sandra Nathan Office of the County Executive Chad Payne Office of Mayor Ron Gonzales Ashlee Oh Office of County Supervisor Jim Beall David Peyton San José Parks, Recreation, and Neighborhood Services Jim Ramoni Santa Clara County Department of Aging and Adult Services Alex Sanchez Housing Authority of Santa Clara County Stephen Schmoll Council on Aging of Silicon Valley Ron Schoof Billy De Frank Community Center Jane Schwartz San José Senior Citizens Commission Ron Schwartz San José Senior Citizens Commission Brent Shiramizu San José Parks, Recreation, and Neighborhood Services Betsy Shotwell Office of the City Manager Laura Talavera San José Parks, Recreation, and Neighborhood Services Roland Velasco Office of Supervisor Don Gage Maureen Wadiak Community Services Agency Donice Wagner San José Senior Citizens Commission Jennifer Wells Office of Supervisor Pete McHugh Elissa Young San José Senior Citizens Commission Regina Zamba San José Senior Citizens Commission

COMMUNITY FOR A LIFETIMETEN-YEAR STRATEGIC PLAN
AACCKKNNOOWWLLEEDDGGEEMMEENNTTSS The Project Management Team would like to thank the following individuals for their contributions to this document: Mayor Ron Gonzales, the San José City Council, and the Santa Clara County Board of Supervisors for their commitment to meeting the needs of older adults in Santa Clara County, for funding the Strategic Plan Project, and for their continued support of aging services. Former San José Councilmember Alice Woody, who chaired the first Aging Services Strategic Plan Advisory Group until her term ended in 2000, and who was a tireless champion of aging services in San José. She initiated the idea to update the 1994 Aging Services Master Plan, Planning for the Age Wave, with a Strategic Plan to ensure that the City continued to build on its successes and plan for seniors’ unmet needs. Larry Silva and the Yellow Checker Cab Company for providing free transportation to over 80 seniors attending the two town hall meetings. Many of the seniors who utilized this service remarked upon the patience, caring, and professionalism of the drivers, many of whom took time to personally escort their passengers into the meeting room. To the many volunteers who facilitated, translated, and/or took notes at the town hall meetings including: Leonie Adga, Pat Adga, Maria Elena Aguilar, Marie Alberry-Hawkins, Leonard Antuna, Julie Aragon, Michelle Arimeoanga, Aurelia Bailey, Leona Bishop, Felicia Bland, Janine Bray, Alan Briscoe, Robert Cecil, Celine Chan, Virginia Chan, Lupe Cino, Marilou Cristina, Rachel Ehlers, Michelle Estabillo, Tracey Giglione, Jane Hemeon, Ellen Hertel, Nancy Hikoyeda, Kevin Hirabyashi, Seema Jaffee, Ann John, Estelle Kadis, Mary Lanip, Eva Lee, Les Lindop, Marciano Lleverino, Lupe Maldonado, Jackie Mattison, Judy Mitchem, Carolyn Mosby, Melissa Monsees, Patricia Brown Moriarty, Dong Nguyen, Mary O’Meara, Lina Pan, Kim Peterson, April Rogers, Ron Schwartz, Brent Shiramizu, Laura Talavera, Traci Tokunaga, Rhonda Vargas, Maureen Wadiak, Tina Wong-Erling, Kendra Yarn, Heidi York, Elissa Young, and Sally Zietzke. The staff of the Berryessa Community Center and the Southside Senior Center for hosting the two town hall meetings and assisting with meeting logistics. The staff of Willows Senior Center, Cypress Senior Center, Billy de Frank Community Center, John XXIII Multi-Service Center, Eastside Neighborhood Center, Morgan Hill Senior Center, and all those who helped host the many focus groups held for this project.

ACKNOWLEDGEMENTS
COMMUNITY FOR A LIFETIMETEN-YEAR STRATEGIC PLAN
Elissa Young, Marilou Cristina, Maureen Wadiak , Jim Ramoni, and Julie Aragon who volunteered to set up and facilitate multiple focus groups on older adult needs. Your leadership and enthusiastic commitment to this project helped ensure the participation of community members from many different cultures and backgrounds. To Leonardo Antuna, Patrocinio Agda, Leon Agda, Chau Dinh, Virginia Chan, Nina Pan, Nhi Hua, Marciano Lleverino, and Laura Talavera, and all those who volunteered their time to translate the event flyers, mailings, and phone survey into Spanish, Mandarin, Vietnamese, Cantonese, and Tagalog. Their efforts were instrumental in increasing participation and gathering input from monolingual seniors throughout the County. The staff of the Hayes Mansion and Conference Center, the San José Convention Center, the Martin Luther King, Jr. Library, Leininger Center, and particularly Cathy Noble and the staff of the Shirakawa Community Center for providing meeting space and room set up for the monthly Strategic Plan Advisory Group meetings. The staff of the City of San José Office on Aging, including Najoo Junck, Lupe Maldonaldo, Cristina Redila, Laura Talevera, Tracey Giglione, Judy Mitchem, Sally Zietzke, Eva Lee, Brent Shiramizu, and Marciano Lleverino for all their help with mailings, outreach, translations, meeting coordination, assistance and special events and overall support throughout the project. San José Parks, Recreation and Neighborhood Services staff, including Marie-Alberry Hawkins, Michelle Estabillo, and Kara Capaldo for all their technical assistance and support.
ACKNOWLEDGEMENTS
COMMUNITY FOR A LIFETIMETEN-YEAR STRATEGIC PLAN
The Strategic Plan Advisory Group, the San José Senior Citizen’s Commission and the County Senior Care Commission for their commitment to aging services and the older population, for providing input into the project, and for providing feedback on the draft plan. Karin Bloomer, Maureen Lyon-Grow, and Margaret Lynn Duggar of MGT of America for all their patience, energy, and focus. And lastly, to the over 1,100 seniors, caregivers, family members, program staff, community-based organization staff, City staff, and County staff who gave input on the needs of older adults. This project was a true community effort to address the needs of older adults in Santa Clara County. Thank you one and all, The Project Management Team Joan Carrico Betty F. Malks Deputy Director Director City of San José Santa Clara County Department of Department of Parks, Recreation, Aging and Adult Services And Neighborhood Services Diane Lindberg Laura Cunningham Community Services Supervisor Sr. Management Analyst City of San José Office on Aging Santa Clara County Department of Department of Parks, Recreation, Aging and Adult Services And Neighborhood Services
Cathy Noonan Analyst City of San José Office on Aging Department of Parks, Recreation, And Neighborhood Services
COMMUNITY FOR A LIFETIMETEN-YEAR STRATEGIC PLAN
FFOORREEWWOORRDD In 1994, the City of San José initiated the development of an Aging Services Master Plan, Planning for the Age Wave.” The two-year Master Plan project involved hundreds of community leaders and stakeholders as members of the project’s Advisory Group and provided the formation of the Mayor’s Aging Leadership Council. This council provided information on senior demographics, needs, service levels, and recommendations on strategies. The City of San Jose’s Aging Services Master Plan emphasized the importance of the coming “Age Wave”*, an anticipated doubling of the city’s senior population. Among the most significant achievements of this project was the first major City and County of Santa Clara collaboration on a planning project. City and County collaboration continued from the design and development phase throughout the implementation period, and was one of the key ingredients involved in the successes of the Plan. Following the City Council’s 1994 adoption of the Master Plan as a ten year plan, implementation began by establishing the Mayor’s Aging Leadership Council and five working groups which brought together community members, the County of Santa Clara, the Council on Aging of Silicon Valley, the San José Senior Citizens Commission, the City Office on Aging and other staff to work on specific plan recommendations. The Mayor’s Aging Leadership Council convened a forty-member group of community leaders and stakeholders who represented senior groups from throughout San Jose and the County to guide Master Plan implementation and focus on shared concerns. The Advocacy Working Group brought key decision makers together to address the need for a unified voice of advocacy for aging issues. Members shared information on legislation and policy issues, and worked collaboratively on advocacy actions. The Multicultural Working Group addressed the unmet needs of limited-English speaking seniors by developing and translating hundreds of information fact sheets and other materials on health care, housing and other critically important senior need topics. The Multicultural Working Group developed the Multilingual Senior Services Locator, an informational chart included in Senior Services Directories, which identified the top twelve services available in the most prevalent ten languages spoken by limited-English seniors in San Jose. It also produced two Multicultural Festivals, which showcased the cultures and foods of San Jose’s ethnic seniors, allowing seniors to share in ways that transcended language barriers. The Outreach Working Group addressed the need for information on services by conducting an information campaign and planning for information and outreach events. The
FOREWORD
COMMUNITY FOR A LIFETIMETEN-YEAR STRATEGIC PLAN
Paraprofessional Case Manager Working Group recruited, trained and placed volunteer paraprofessional case managers to work with professional case managers and expand the number of seniors that could be served. The Public – Private Partnership Working Group convened a conference attended by nearly one hundred members from both the business and public sector to develop ways they could work together, particularly in creating additional funding for aging services. In 2000, Councilmember Alice Woody and the Mayor’s Aging Leadership Council recognized the need to update the needs assessment and strategies developed in 1994. To accomplish this goal, San José Mayor Ron Gonzales allocated monies in his June 2001 Budget Message for the development of an updated Aging Services Strategic Plan.
As a result of the collaboration between agencies on the Mayor’s Aging Leadership Council, an opportunity to partner with the Santa Clara County Department of Aging and Adult Services arose. The Santa Clara County Board of Supervisors approved funding to expand the scope of the strategic plan. A project management team consisting of City and County staff was developed to coordinate the Strategic Plan. The project management team then developed a Strategic Plan Advisory Group comprised of key stakeholders including individuals from: community based organizations, County and City Senior Commissions, academia and service providers. City and County aging services have a long history of successful collaboration and this project is another example.
One of the dilemmas faced by the project management team was how to focus the scope of this report. The needs of older adults run the gamut from basic survival needs such as food, shelter and safety to quality of life issues such as continuing education, recreation, and socialization. The team chose to focus on the eleven issues that were most commonly brought up by seniors, caregivers, family members, and aging services experts who participated in the needs assessment: Housing, Information, Language, Health Care, Transportation, In-Home Care, Caregiver Support, Senior Center Programs, Leadership, Coordination, and Funding. Another dilemma faced by the project management team was the absence of key issues which did not surface during the process. Given the fact that this document was a community effort and is a reflection of the individuals interviewed using various modalities, the general consensus among professional staff was that some key areas did not rise to the surface in this process. These issues include: Elder Abuse/Safety issues, Medical/Discharge Planning, Long
FOREWORD
COMMUNITY FOR A LIFETIMETEN-YEAR STRATEGIC PLAN
Term Care, End of Life issues/Hospice, and Mental Health issues/Depression among the elderly. It was widely felt that issues such as these were not raised by the community because of their sensitivity and/or personal nature. However these areas are of paramount importance and in need of future examination. It should be noted that many other issues were cited during the needs assessment; and although they were not among the most prevalent issues chosen for inclusion in this plan, it does not diminish their importance. Lastly, some older adult needs may have gone unreported because current services are meeting the existing need. The Strategic Plan has been developed in an economic context of extreme hardship for local governments and for many of the constituents they serve. Funding for aging services at the federal, state and local levels has been unable to keep pace with the population increase and continues to be a challenge. City and County funding levels have been severely reduced for several years, with additional cuts projected for the coming fiscal year. These budget cuts, compounded by reductions in state and federal funding, have meant less funding available for aging services. At the same time the senior population continues to increase. For this reason, specific funding recommendations were not included in this plan at this time. However, this issue should be addressed as soon as funding becomes available. It is imperative that the current aging services infrastructure of senior centers and programs be preserved at current levels through this difficult period, and services and facilities be increased when additional funding occurs. City and County collaboration and leadership are key in assuring protection of the existing aging services infrastructure and nurturing services growth to meet future needs. Aging - By the Numbers
According to the United States Census Bureau there are approximately 220,600 older adults living in Santa Clara County. This number is projected to nearly double to 428,300 by the year 2020, when older adults will represent 21.3% of the County’s population.

FOREWORD
COMMUNITY FOR A LIFETIMETEN-YEAR STRATEGIC PLAN
Finally, it is important to remember that in order to truly meet the needs of older adults, we must go beyond simply implementing additional senior programs and services. A philosophical change is necessary to ensure that the needs of our
aging population are incorporated into the design and planning of every program, service, and facility to truly embrace the concept of a ‘Community for a Lifetime.’ We have already seen the first ripples of the coming “Age Wave.” The senior population has grown by 18.8% since the first Aging Services Master Plan was written, and the first of the baby boom generation will turn sixty in 2006. The California Strategic Plan on Aging Advisory Committee took the analogy of the “Age Wave” one step further in their May 2004 report Preparing for an Aging California Population stating, “The
confluence of decreased fertility, expanded longevity, falling mortality, and the redefinition of what it means to be older is creating a unique phenomenon, which some have described as an Aging Tsunami.” The time to be strategic about planning for aging services is now. We need to develop comprehensive services, programs, and facilities that support the entire family throughout the aging process. To accomplish this is to ensure that those living in Santa Clara County and its municipalities will truly be part of a ‘Community for a Lifetime.’ ________________________________________________________________ *”Age Wave” is a term coined by Ken Dychtwald, Ph.D., and is used with his permission.
A philosophical change is necessary to ensure that the needs of our aging population are included in the design and planning of every program, service, and facility we provide.

TTAABBLLEE OOFF CCOONNTTEENNTTSS
Executive Summary ...................................................................................... Ex -1 Introduction Planning For Action ...................................................................10 Section 1 Population And Funding TrendsContext For Planning .........2 Section 2 Our Commitment To SeniorsA Framework For Strategic Planning .....................................................................................12 Section 3 Older Adults’ Most Prominent NeedsThe Focus Of Our Community Effort .......................................................................17 Section 4 Taking ActionStrategies For Meeting The Needs Of Older Adults In Santa Clara County..........................................37 Section 5 Strategy Implementation............................................................57
AAPPPPEENNDDIICCEESS
Appendix A Aging Services Provider Survey .............................................A-1 Appendix B Senior Needs Assessment of Santa Clara County Summary Report........................................................................B-1

Executive
Summary

COMMUNITY FOR A LIFETIMETEN-YEAR STRATEGIC PLAN EX - 1
EEXXEECCUUTTIIVVEE SSUUMMMMAARRYY BBAACCKKGGRROOUUNNDD Two years ago, the City of San José, the County of Santa Clara, and community partners from local public and private organizations embarked on a process to develop a long-term strategic plan that supports and advances the well-being of the county’s older adult members. Undoubtedly, the time to plan for aging services is now. Santa Clara County has already begun to experience disproportionate growth in its population of persons aged 60 years and older, and by 2020 this population will have almost doubled and grown at a pace three-to-four times that of the county’s overall population.
At the same time, Santa Clara County and the state as a whole have recently encountered a budget crisis that has forced service providers to reduce program spending. Data shows that program expenditures for senior services within Santa Clara County have been dropping, while service levels and waiting lists have grown. As the population of older adults explodes over the next 10 to 20 years, this erosion of resources for senior services will likely have dramatic impacts on senior members of the community and their families. The purpose of this strategic plan is to help the community of Santa Clara County focus its finite resources on the most prominent needs of its seniors and work in collaboration to build a service infrastructure that can support its burgeoning senior population. MMEETTHHOODDOOLLOOGGYY Over 1,100 community members—comprised of seniors, family members, advocates, elected officials, service providers, and academics—participated in the development of this strategic plan. A 40-member Strategic Plan Advisory Group, representing government and community-based organizations, met monthly to steer the effort. Day-to-day management of the project was led by a team from San José Parks, Recreation, and Neighborhood Services; Santa Clara County Department of Aging and Adult Services; and MGT of America, Inc.—the consultant hired to assist with the process.
The planning process consisted or two primary elements—identifying older adults’ needs and developing strategies for addressing them.
Santa Clara County has already begun to experience disproportionate growth in its population of persons aged 60 years and older
EXECUTIVE SUMMARY
COMMUNITY FOR A LIFETIME EX -2
CCoouunnttyywwiiddee SSeenniioorr NNeeeeddss AAsssseessssmmeenntt Three methods were utilized to identify older adults’ needs in Santa Clara Countya telephone survey, community input events, and expert interviews.
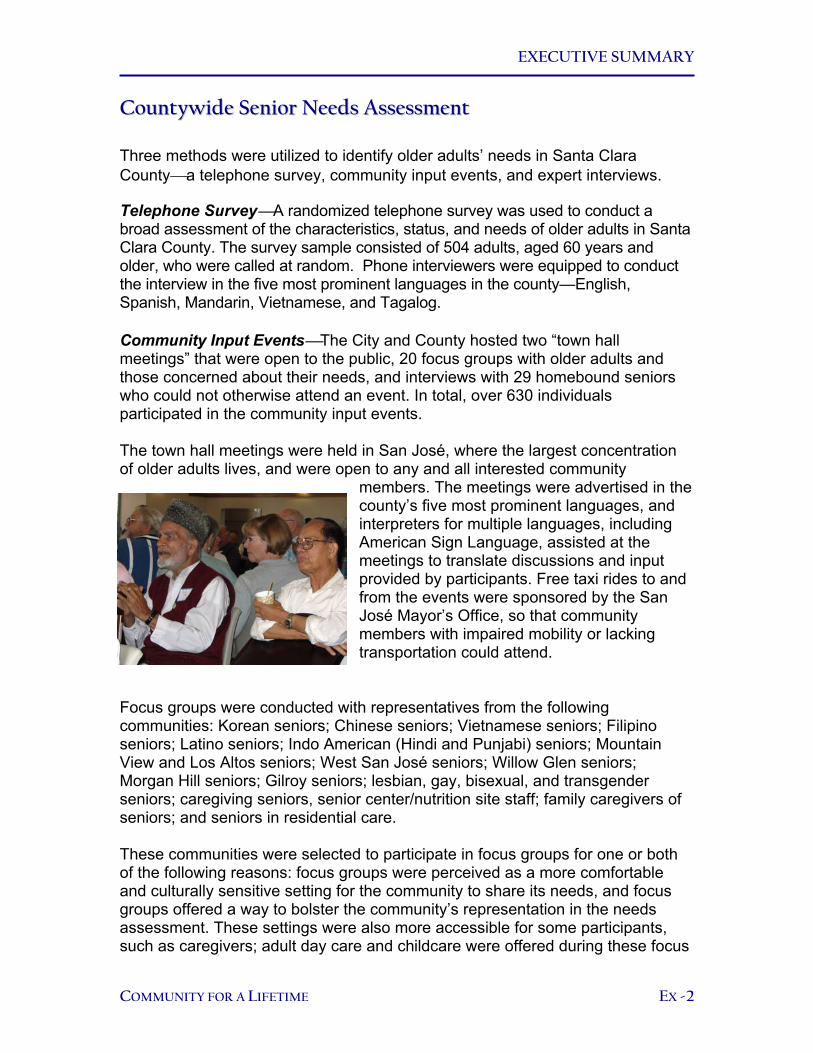
Telephone SurveyA randomized telephone survey was used to conduct a broad assessment of the characteristics, status, and needs of older adults in Santa Clara County. The survey sample consisted of 504 adults, aged 60 years and older, who were called at random. Phone interviewers were equipped to conduct the interview in the five most prominent languages in the county—English, Spanish, Mandarin, Vietnamese, and Tagalog. Community Input EventsThe City and County hosted two “town hall meetings” that were open to the public, 20 focus groups with older adults and those concerned about their needs, and interviews with 29 homebound seniors who could not otherwise attend an event. In total, over 630 individuals participated in the community input events. The town hall meetings were held in San José, where the largest concentration of older adults lives, and were open to any and all interested community
members. The meetings were advertised in the county’s five most prominent languages, and interpreters for multiple languages, including American Sign Language, assisted at the meetings to translate discussions and input provided by participants. Free taxi rides to and from the events were sponsored by the San José Mayor’s Office, so that community members with impaired mobility or lacking transportation could attend.
Focus groups were conducted with representatives from the following communities: Korean seniors; Chinese seniors; Vietnamese seniors; Filipino seniors; Latino seniors; Indo American (Hindi and Punjabi) seniors; Mountain View and Los Altos seniors; West San José seniors; Willow Glen seniors; Morgan Hill seniors; Gilroy seniors; lesbian, gay, bisexual, and transgender seniors; caregiving seniors, senior center/nutrition site staff; family caregivers of seniors; and seniors in residential care. These communities were selected to participate in focus groups for one or both of the following reasons: focus groups were perceived as a more comfortable and culturally sensitive setting for the community to share its needs, and focus groups offered a way to bolster the community’s representation in the needs assessment. These settings were also more accessible for some participants, such as caregivers; adult day care and childcare were offered during these focus

EXECUTIVE SUMMARY
COMMUNITY FOR A LIFETIME EX -3
groups. The needs assessment effort also reached out to seniors who were unable to leave their homes to attend the other community input events. Phone interviews were conducted with a random sample of 29 homebound seniors who participate in the county’s In-Home Supportive Services and Senior Nutrition programs. Expert InterviewsExpert interviews comprised the third arm of the Countywide Senior Needs Assessment. The Strategic Plan Advisory Group identified local experts whose policy and service expertise included that of health, transportation, housing, nutrition, information and referral, in-home care, legal services, recreation, education, and community services. Input from these experts offered a valuable point of reference to older adults’ responses in the phone survey and community input events. Analysis of FindingsResults of the needs assessment were first examined independently to identify the most frequently cited needs from each of the three research methods—telephone survey, community input events, and expert interviews. These findings were then compared across research methods for common themes. When a need was noted with great frequency in two or more research methods, that need was considered significant and one that warranted focus from the community in the strategic plan. SSttrraatteeggiieess ffoorr AAddddrreessssiinngg SSeenniioorrss’’ NNeeeeddss Once the most prevalent needs were identified through the needs assessment, local experts in the relevant service areas were invited to a Strategy Development Session to discuss the findings and develop strategies that local government and community organizations could undertake to meet these needs. Over 60 experts attended the session, broke into service-specific workgroups, and produced strategies that they believed would be feasible and appropriate for local action to address the needs identified in the needs assessment. RReevviieeww ooff tthhee PPllaann Community input was solicited again during the development of the written product. A draft of the strategic plan was shared with three civic bodies for review and input—the Strategic Plan Advisory Group, the San José Senior Citizens Commission, and the Santa Clara County Senior Care Commission. Comments and suggested changes were reviewed by the project management team, assessed for common themes, and—where possible—incorporated in the plan.
EXECUTIVE SUMMARY
COMMUNITY FOR A LIFETIME EX -4
MMEETTHHOODDOOLLOOGGIICCAALL LLIIMMIITTAATTIIOONNSS By undertaking a community-driven approach to strategic planning, the process ensured that the service needs identified reflected pervasive local issues and that the strategies for solving them were realistic and feasible for organizations to undertake in Santa Clara County. This approach also introduced some limitations that are important to note. First, soliciting input from over 1,100 community members meant that myriad service needs were raised through the course of the needs assessment. Not all of these needs could be addressed in the strategic plan. By its nature, a strategic plan needs to focus on select issues that are pervasive in a community. For this reason, only those needs that were common across community input methods were highlighted in the plan. Relying on community members’ input to identify pervasive service needs also meant that needs that are particularly sensitive or difficult for individuals to express were unlikely to present themselves in the needs assessment and, consequently, in the strategic plan. Service needs related to mental health, elder abuse, and end-of-life care, for example, are often uncomfortable topics for discussion and were not commonly noted during the needs assessment. These areas of need warrant assessment through other means and community action to address them. Finally, because the focus of the needs assessment was on identifying unmet needs, services that older adults currently rely upon and receive were unlikely to have been expressed by community members. These existing services should not be jeopardized for the sake of focusing resources on the unmet needs that have been identified through the Countywide Senior Needs Assessment.
EXECUTIVE SUMMARY
COMMUNITY FOR A LIFETIME EX -5
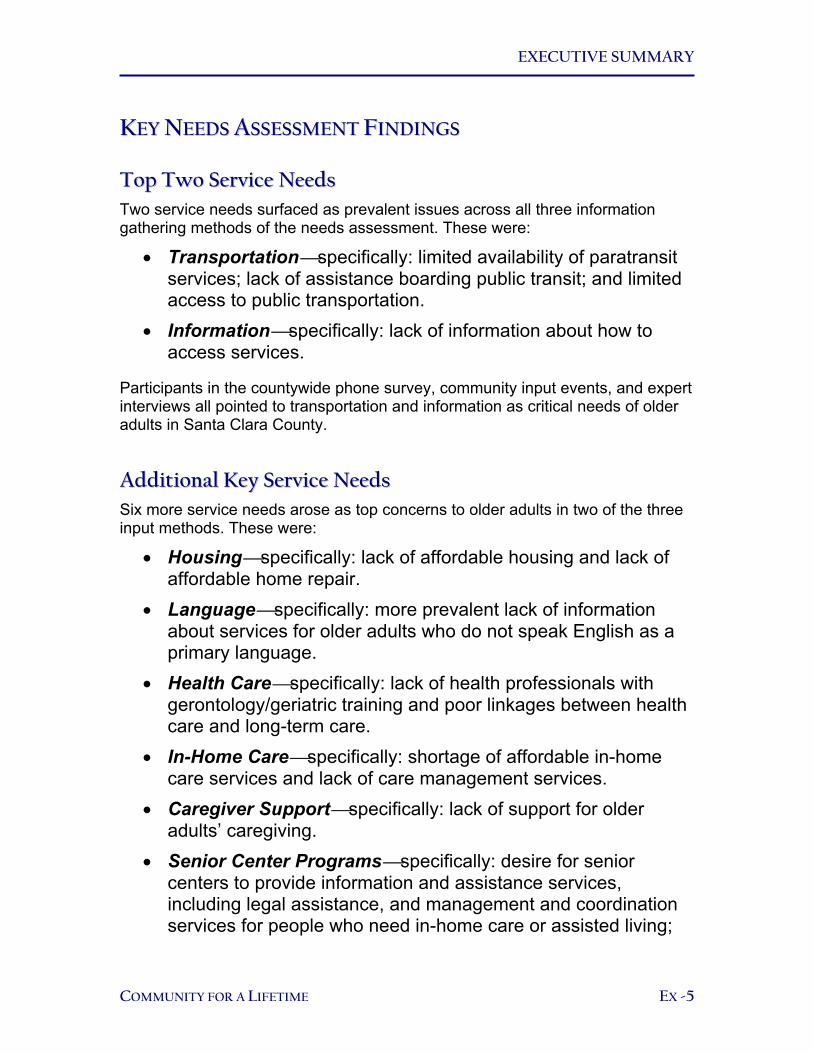
KKEEYY NNEEEEDDSS AASSSSEESSSSMMEENNTT FFIINNDDIINNGGSS TToopp TTwwoo SSeerrvviiccee NNeeeeddss Two service needs surfaced as prevalent issues across all three information gathering methods of the needs assessment. These were:
• Transportationspecifically: limited availability of paratransit services; lack of assistance boarding public transit; and limited access to public transportation.
• Informationspecifically: lack of information about how to access services.
Participants in the countywide phone survey, community input events, and expert interviews all pointed to transportation and information as critical needs of older adults in Santa Clara County.
AAddddiittiioonnaall KKeeyy SSeerrvviiccee NNeeeeddss Six more service needs arose as top concerns to older adults in two of the three input methods. These were:
• Housingspecifically: lack of affordable housing and lack of affordable home repair.
• Languagespecifically: more prevalent lack of information about services for older adults who do not speak English as a primary language.
• Health Carespecifically: lack of health professionals with gerontology/geriatric training and poor linkages between health care and long-term care.
• In-Home Carespecifically: shortage of affordable in-home care services and lack of care management services.
• Caregiver Supportspecifically: lack of support for older adults’ caregiving.
• Senior Center Programsspecifically: desire for senior centers to provide information and assistance services, including legal assistance, and management and coordination services for people who need in-home care or assisted living;
EXECUTIVE SUMMARY
COMMUNITY FOR A LIFETIME EX -6
and need for senior centers to prepare to serve the disparate interests of baby boomers and older seniors.
These key needs are not listed in any priority order, as each was given the same valuation for being one of the most commonly cited needs in two of the three research methods.
KKeeyy RReessoouurrccee NNeeeeddss Only in the expert interviews were participants asked about resource needs for senior services. Experts pointed to two types of resources that they felt were critical to advancing the well-being of older adults in Santa Clara County. These were:
• Leadership and Coordinationspecifically: lack of coordinated leadership and advocacy for aging services.
• Fundingspecifically: stagnating or decreasing funding for services despite increase in need for services.
These ten areas of need—eight service areas and two resource areas—constitute the focus of the objectives and strategies of the strategic plan.
Aging - By the Numbers
In 2000, the average life expectancy in the United States was almost 80 years for women and roughly 74 years for men. By 2050, life expectancy in the United States is a projected to rise to an average age of 87 years for women and 81 years for men.
2000 U.S. Census

EXECUTIVE SUMMARY
COMMUNITY FOR A LIFETIME EX -7
EELLEEMMEENNTTSS OOFF TTHHEE SSTTRRAATTEEGGIICC PPLLAANN The fundamental components of a strategic plan are its vision statement, mission statement, goals, objectives, and strategies. The key elements of this strategic plan are presented below. OOuurr VViissiioonn ffoorr aann EEllddeerr--FFrriieennddllyy SSaannttaa CCllaarraa CCoouunnttyy The vision statement reflects the community’s ultimate goal in supporting older adults in Santa Clara County—our image of the desired future. Though we may never fully attain this vision, it is one that we are committed to strive toward. Our vision is as follows:
Each person living in the City of San José and the County of Santa Clara respects older adults. This community values the contributions, strengths, wisdom, and diversity of its older members and provides an integrated network of services to meet their needs and enhance their quality of life.
OOuurr MMiissssiioonn aass PPuubblliicc aanndd PPrriivvaattee PPaarrttnneerrss SSeerrvviinngg OOllddeerr AAdduullttss The mission statement describes our scope of authority and responsibility in supporting older adults in Santa Clara County. Our mission is as follows:
The government and community organizations of the City of San José and the County of Santa Clara share a strong commitment to advance the well-being of older adults. We demonstrate this commitment to support older adults, their families and caregivers by working together to: • Plan and coordinate services. • Recommend allocation of funding and other resources for services, programs,
and initiatives. • Provide direct services. • Educate the community about older adult needs and available community
resources. • Advocate for public policies that enhance the quality of life of the older
population.

EXECUTIVE SUMMARY
COMMUNITY FOR A LIFETIME EX -8
OOuurr GGooaallss ffoorr SSuuppppoorrttiinngg OOllddeerr AAdduullttss Goals chart the direction we will take to advance the well-being of older adults in the community. Our goals are to:
1. Ensure that older adults’ essential needs are met. 2. Maximize older adults’ independence. 3. Promote older adults’ health and wellness. 4. Encourage older adults’ community engagement. 5. Leverage and optimize efforts and resources that serve older
adults.
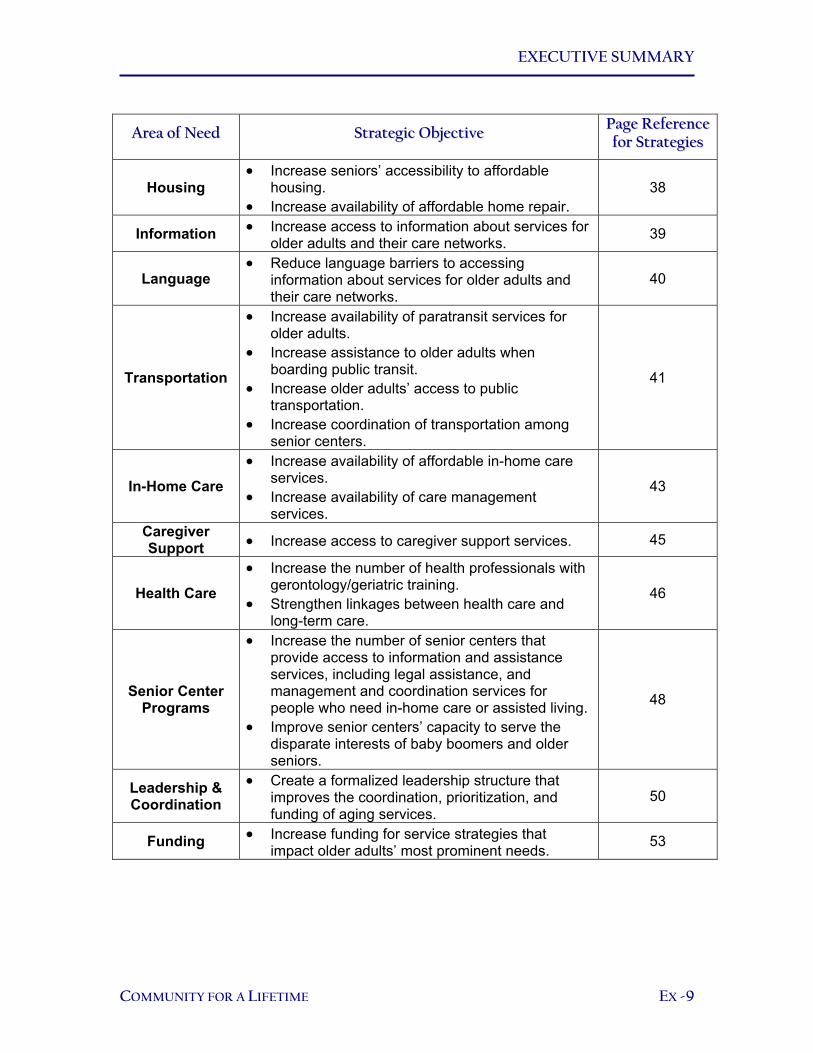
OOuurr OObbjjeeccttiivveess aanndd SSttrraatteeggiieess ffoorr MMeeeettiinngg TThheessee GGooaallss Objectives articulate more specific milestones for measuring progress toward our high-level goals. Strategies describe how a community is going to meet its objectives. For this plan, an objective and a series of strategies were developed to respond to each facet of the ten areas of need that arose in the needs assessment. The table below presents the ten prominent areas of need identified in the needs assessment, the community’s objectives for mitigating those needs, and references to the pages of the plan where strategies for achieving those objectives are located.
EXECUTIVE SUMMARY
COMMUNITY FOR A LIFETIME EX -9
AArreeaa ooff NNeeeedd SSttrraatteeggiicc OObbjjeeccttiivvee PPaaggee RReeffeerreennccee ffoorr SSttrraatteeggiieess
Housing • Increase seniors’ accessibility to affordable
housing. • Increase availability of affordable home repair.
38
Information • Increase access to information about services for older adults and their care networks. 39
Language • Reduce language barriers to accessing
information about services for older adults and their care networks.
40
Transportation
• Increase availability of paratransit services for older adults.
• Increase assistance to older adults when boarding public transit.
• Increase older adults’ access to public transportation.
• Increase coordination of transportation among senior centers.
41
In-Home Care • Increase availability of affordable in-home care
services. • Increase availability of care management
services.
43
Caregiver Support • Increase access to caregiver support services. 45
Health Care • Increase the number of health professionals with
gerontology/geriatric training. • Strengthen linkages between health care and
long-term care.
46
Senior Center Programs
• Increase the number of senior centers that provide access to information and assistance services, including legal assistance, and management and coordination services for people who need in-home care or assisted living.
• Improve senior centers’ capacity to serve the disparate interests of baby boomers and older seniors.
48
Leadership & Coordination
• Create a formalized leadership structure that improves the coordination, prioritization, and funding of aging services.
50
Funding • Increase funding for service strategies that impact older adults’ most prominent needs. 53

EXECUTIVE SUMMARY
COMMUNITY FOR A LIFETIME EX -10
NNEEXXTT SSTTEEPPSS This plan will only add value to the community of Santa Clara County if it is utilized—if it becomes a blueprint for action. To this end, the final section of the plan provides guidance on implementing the strategies for addressing older adults’ needs in Santa Clara County. Specifically, Section 5 suggests the timing for implementing each strategy and the organizations well-suited to take the lead on each effort. As Section 5 indicates, the Leadership and Coordination strategies must be implemented first—these form the infrastructure for coordinated and effective implementation of all other strategies. A small team will need to take responsibility to jump start the process and help to convene a Leadership Group of funders and policy makers, and a Service Coordination and Advocacy Group that represents a broad coalition of organizations that serve older adults and their families in Santa Clara County. This governance and advocacy structure must be coordinated and countywide—one that pulls together the disparate efforts and commissions currently in effect throughout Santa Clara Countyso that service fragmentation is minimized. This structure would make joint funding decisions, advocate a common platform, share information on emerging and existing service needs, and draw in partners to implement the plan’s strategies. Perhaps the most pervasive theme that surfaced from the input of over 1,100 Santa Clara County community members was that the service providers of this county—public and private alike—care deeply about the well-being of their older adult members. Implementing this plan, through a coordinated and collaborative infrastructure, will leverage and optimize that dedication and commitment.

Introduction

COMMUNITY FOR A LIFETIMETEN-YEAR STRATEGIC PLAN 1
IINNTTRROODDUUCCTTIIOONN PPLLAANNNNIINNGG FFOORR AACCTTIIOONN
The time to be strategic about planning for aging services is now. Santa Clara County has already begun to experience disproportionate growth in its population of persons aged 60 years and older. By 2020, this population will have almost doubled and grown at a pace three-to-four times that of the county’s overall population. At the same time, Santa Clara County and the state as a whole have recently encountered a budget crisis that has forced service providers to reduce program spending.
These trends exist in tension with one another and force the question: How will we meet the needs of Santa Clara County’s growing senior population? This strategic plan is the community’s response to that important question.
It calls for public and private organizations alike to build a collaborative service infrastructure over the next ten years that can support the burgeoning population of its older adult members. It is a call to action—a commitment to make Santa Clara County a “community for a lifetime.”
This plan is organized in the following way:
Section 1 presents an overview of population and service funding trends related to older adults in Santa Clara County. This section provides the context for why planning for older adults’ needs is critical.
Section 2 presents a framework for approaching strategic planning for aging services that reflects the service community’s commitment to older adults in Santa Clara County.
Section 3 presents the most prominent needs of older adults in Santa Clara County, as identified in a Countywide Senior Needs Assessment. These needs are the focus for planning.
Section 4 presents community strategies for addressing the most prominent needs of Santa Clara County’s older adults.
Section 5 presents the next steps for implementation, including a high-level implementation plan that identifies key organizations and timeframes for executing the strategies.
Appendices contain the reports on the Countywide Senior Needs Assessment and Service Provider Funding Survey.

Section 1 Population and Funding Trends Context for Planning

COMMUNITY FOR A LIFETIMETEN-YEAR STRATEGIC PLAN 2
SSEECCTTIIOONN 11 PPOOPPUULLAATTIIOONN AANNDD FFUUNNDDIINNGG TTRREENNDDSSCCOONNTTEEXXTT FFOORR PPLLAANNNNIINNGG
This section presents divergent trends related to older adults in Santa Clara County—those of population and funding. These trends serve as the backdrop for this strategic plan and explain the urgency of planning related to aging services.
The population data cited in this section is derived from U.S. Census data. The funding data reflects results of a funding survey conducted during the strategic planning process that asked a sample of service organizations in Santa Clara County about their expenditure and service level trends. Additional results and information about the methodology of the funding survey can be found in Appendix A. In this plan, the terms “older adults” and “seniors” refer to persons aged 60 years and older, unless noted otherwise.
GGRROOWWTTHH IINN TTHHEE OOLLDDEERR AADDUULLTT PPOOPPUULLAATTIIOONN Not only is California predicted to be one of the fastest growing states in the nation over the next 20 years, but California’s older-adult population is expected to grow more than twice as fast as the state’s overall population. Moreover, Santa Clara County is one of 11 counties in California predicted to experience the greatest population growth among its seniors.
AA BBuurrggeeoonniinngg OOllddeerr--AAdduulltt PPooppuullaattiioonn WWiillll OOuuttppaaccee tthhee GGrroowwtthh ooff tthhee GGeenneerraall PPooppuullaattiioonn Between the years 2000 and 2020, the population of older adults in Santa Clara County is expected to almost double, from roughly 220,600 to 428,300. By 2040, the size of this population is predicted to reach approximately 600,000.
Older adults will represent 21.3 percent of the county’s population in 2020, compared to 13 percent in 2000, because the population growth of older adults in Santa Clara County is outpacing that of the total population. The older adult population is expected to peak in 2040, comprising almost 27 percent of the county’s total population. Exhibit 1-1 shows this population growth over time.

SECTION 1
COMMUNITY FOR A LIFETIMETEN-YEAR STRATEGIC PLAN 3
EEXXHHIIBBIITT 11--11 PPRROOJJEECCTTEEDD GGRROOWWTTHH IINN OOLLDDEERR AADDUULLTT ((AAGGEE 6600++)) PPOOPPUULLAATTIIOONN IINN
SSAANNTTAA CCLLAARRAA CCOOUUNNTTYY
0
100,000
200,000
300,000
400,000
500,000
600,000
700,000
2000 2010 2020 2030 2040 2050
Years
Num
ber o
f Old
er A
dults
in S
anta
Cla
ra C
ount
y
This growth in population will greatly impact the general demand for senior services. With twice as many seniors living in Santa Clara County by 2020, this means that if the needs of older adults remain proportional to the population over the next 16 years, this will equate to double the demand for services. For example, roughly 24 percent of older adults in Santa Clara County currently report that they are caregivers. Today, 24 percent of older adults represent just fewer than 53,000 seniors; in 2020, 24 percent of older adults will reflect almost 103,000 seniors.
AAggiinngg BBaabbyy BBoooommeerrss AArree DDrriivviinngg tthhee GGrroowwtthh This doubling of the older-adult population by 2020 is largely driven by an age cohort generally deemed the “baby boomers”—persons born between 1946 and 1964. The oldest of the baby boomers will turn 60 in 2006; the youngest baby boomers will turn 60 in 2024. Consequently, Santa Clara County’s older adult population will experience a surge in the population of its younger seniors through 2020, and then proportional growth in its older senior population in the later years, as baby boomers age further. Exhibit 1-2 depicts the change in age distribution of the senior population over time in Santa Clara County.

SECTION 1
COMMUNITY FOR A LIFETIMETEN-YEAR STRATEGIC PLAN 4
EEXXHHIIBBIITT 11--22 PPRROOJJEECCTTEEDD AAGGEE DDIISSTTRRIIBBUUTTIIOONN OOFF OOLLDDEERR AADDUULLTT ((AAGGEE 6600++)) PPOOPPUULLAATTIIOONN IINN
SSAANNTTAA CCLLAARRAA CCOOUUNNTTYY
0%
5%
10%
15%
20%
25%
30%
35%
2000 2010 2020 2030 2040 2050
Years
Perc
ent o
f Old
er A
dult
Popu
latio
nin
San
ta C
lara
Cou
nty
60-6465-6970-7475-7980-8485+
It is noteworthy that in the out-years of 2030 to 2050, the population of Santa Clara County’s oldest adults—those 85 years and older—will experience steep growth. While this population, as a percentage of older adults, will remain comparatively small, this cohort will experience the greatest growth of all cohorts—more than tripling in size between 2000 and 2050. This population growth of the oldest seniors also reflects a longer life expectancy. For example, in 2000, the average life expectancy in the United States was almost 80 years for women and roughly 74 years for men. By 2050, women in the U.S. are projected to live to an average age of 87 and, for men, to age 81.
These trends in age distribution will likely drive particular service needs: for the younger seniors, these services may include more employment-related needs, greater interest in exercise and fitness, more comfort with the Internet as a tool for information, and a greater demand for caregiving resources and respite. It may also mean a healthier population on average. In the out-years, however, as the population of the oldest seniors increases, the focus of service needs may shift to that of the more frail and elderly, such as in-home support, assisted transportation, medical treatment, and hospice care. In addition, the need for palliative care services will grow increasingly important as more people with advanced chronic disease live longer.
SECTION 1
COMMUNITY FOR A LIFETIMETEN-YEAR STRATEGIC PLAN 5
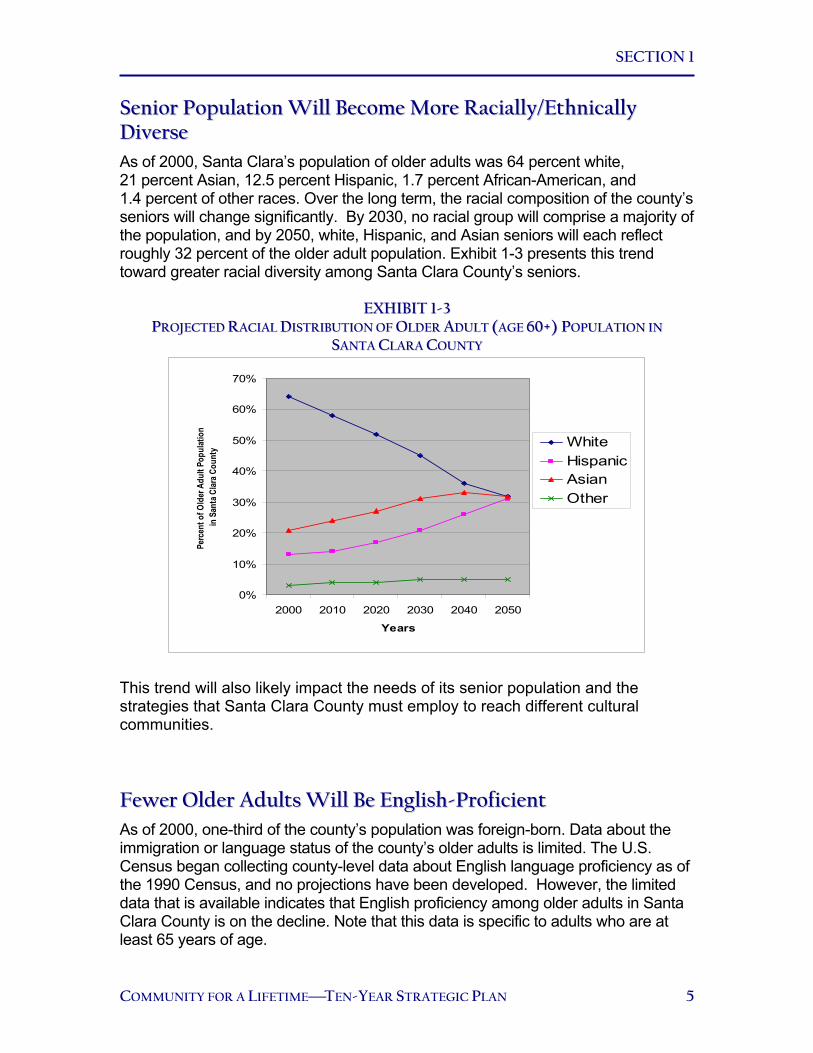
SSeenniioorr PPooppuullaattiioonn WWiillll BBeeccoommee MMoorree RRaacciiaallllyy//EEtthhnniiccaallllyy DDiivveerrssee As of 2000, Santa Clara’s population of older adults was 64 percent white, 21 percent Asian, 12.5 percent Hispanic, 1.7 percent African-American, and 1.4 percent of other races. Over the long term, the racial composition of the county’s seniors will change significantly. By 2030, no racial group will comprise a majority of the population, and by 2050, white, Hispanic, and Asian seniors will each reflect roughly 32 percent of the older adult population. Exhibit 1-3 presents this trend toward greater racial diversity among Santa Clara County’s seniors.
EEXXHHIIBBIITT 11--33 PPRROOJJEECCTTEEDD RRAACCIIAALL DDIISSTTRRIIBBUUTTIIOONN OOFF OOLLDDEERR AADDUULLTT ((AAGGEE 6600++)) PPOOPPUULLAATTIIOONN IINN
SSAANNTTAA CCLLAARRAA CCOOUUNNTTYY
0%
10%
20%
30%
40%
50%
60%
70%
2000 2010 2020 2030 2040 2050
Years
Perc
ent o
f Old
er A
dult
Popu
latio
nin
San
ta C
lara C
ount
y WhiteHispanicAsianOther
This trend will also likely impact the needs of its senior population and the strategies that Santa Clara County must employ to reach different cultural communities.
FFeewweerr OOllddeerr AAdduullttss WWiillll BBee EEnngglliisshh--PPrrooffiicciieenntt As of 2000, one-third of the county’s population was foreign-born. Data about the immigration or language status of the county’s older adults is limited. The U.S. Census began collecting county-level data about English language proficiency as of the 1990 Census, and no projections have been developed. However, the limited data that is available indicates that English proficiency among older adults in Santa Clara County is on the decline. Note that this data is specific to adults who are at least 65 years of age.
SECTION 1
COMMUNITY FOR A LIFETIMETEN-YEAR STRATEGIC PLAN 6
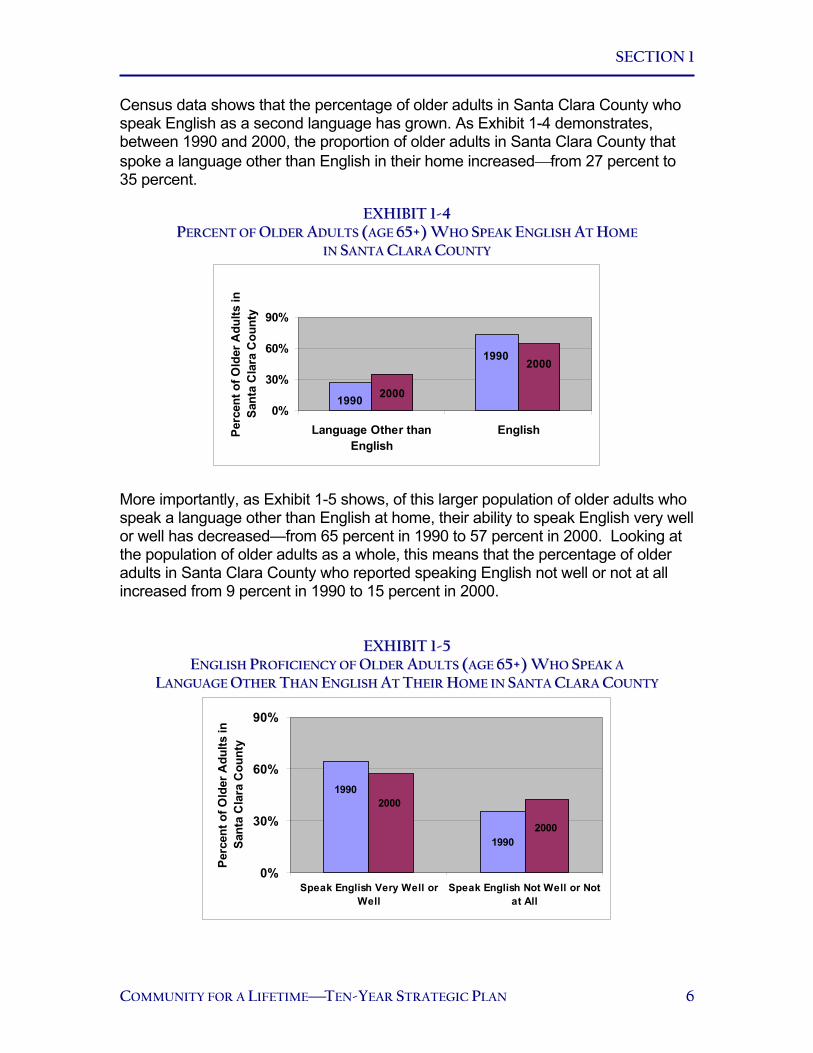
Census data shows that the percentage of older adults in Santa Clara County who speak English as a second language has grown. As Exhibit 1-4 demonstrates, between 1990 and 2000, the proportion of older adults in Santa Clara County that spoke a language other than English in their home increasedfrom 27 percent to 35 percent.
EEXXHHIIBBIITT 11--44 PPEERRCCEENNTT OOFF OOLLDDEERR AADDUULLTTSS ((AAGGEE 6655++)) WWHHOO SSPPEEAAKK EENNGGLLIISSHH AATT HHOOMMEE
IINN SSAANNTTAA CCLLAARRAA CCOOUUNNTTYY
1990
1990
2000
2000
0%
30%
60%
90%
Language Other thanEnglish
EnglishPerc
ent o
f Old
er A
dults
in
Sant
a C
lara
Cou
nty
More importantly, as Exhibit 1-5 shows, of this larger population of older adults who speak a language other than English at home, their ability to speak English very well or well has decreased—from 65 percent in 1990 to 57 percent in 2000. Looking at the population of older adults as a whole, this means that the percentage of older adults in Santa Clara County who reported speaking English not well or not at all increased from 9 percent in 1990 to 15 percent in 2000.
EEXXHHIIBBIITT 11--55 EENNGGLLIISSHH PPRROOFFIICCIIEENNCCYY OOFF OOLLDDEERR AADDUULLTTSS ((AAGGEE 6655++)) WWHHOO SSPPEEAAKK AA
LLAANNGGUUAAGGEE OOTTHHEERR TTHHAANN EENNGGLLIISSHH AATT TTHHEEIIRR HHOOMMEE IINN SSAANNTTAA CCLLAARRAA CCOOUUNNTTYY
1990
1990
2000
2000
0%
30%
60%
90%
Speak English Very Well orWell
Speak English Not Well or Notat All
Perc
ent o
f Old
er A
dults
in
Sant
a C
lara
Cou
nty

SECTION 1
COMMUNITY FOR A LIFETIMETEN-YEAR STRATEGIC PLAN 7
The growing cultural diversity of Santa Clara County’s senior population will also impact the types of needs seniors have and the methods of service delivery that will be effective in reaching seniors and their caregivers. Language barriers are the most evident of these—which affect older adults’ ability to assess which services are available and to communicate their needs to service providers. Cultural differences may impact the types of organizations an older adult seeks out for help or trusts for advice, or the extent to which family members are relied upon for caregiving. Santa Clara County’s service providers will need to look at all of these factors when building strategies to meet older adults’ needs.
FFUUNNDDIINNGG TTRREENNDDSS Like every region in California, Santa Clara County was confronted in recent fiscal years with fewer resources with which to serve its residents. As in every economic downturn, demand for public and community services increased at the same time that organizational budgets were shrinking.
As part of the strategic planning process, data on funding and service level trends was collected from a sample of organizations in Santa Clara County that provide services for adults aged 60 years and older. In all, 18 organizations—or one-third of those surveyed—reported funding data. Services represented in the sample group included:
• Care Management
• Cultural and Recreation
• Education and Employment
• Emergency Services
• Financial Assistance
• Food and Nutrition
• Housing
• In-Home Care
• Health and Wellness
• Mental Health
• Information, Referral, and Assistance
• Legal Assistance
• Transportation

SECTION 1
COMMUNITY FOR A LIFETIMETEN-YEAR STRATEGIC PLAN 8
0%
5%
10%
15%
20%
Percent Changein Expenditures
Percent Changein Number ofSeniors Served
Due to the small sample size of the survey group, the data provided in this section should be considered illustrative and not statistically representative of the funding and service trends for aging services in Santa Clara County. For more detail about the survey, please refer to Appendix A.
FFuunnddiinngg HHaass NNoott KKeepptt PPaaccee wwiitthh DDeemmaanndd ffoorr SSeerrvviicceess Exhibit 1-6 compares the percent change in dollars the surveyed organizations spent on aging services to the number of older adults the organizations served between fiscal years (FY) 2002-03 and 2003-04.
EEXXHHIIBBIITT 11--66 CCOOMMPPAARRIISSOONN OOFF CCHHAANNGGEE IINN AAGGIINNGG SSEERRVVIICCEESS EEXXPPEENNDDIITTUURREESS AANNDD
SSEERRVVIICCEE LLEEVVEELLSS BBEETTWWEEEENN 22000022--0033 AANNDD 22000033--0044
Represents sample group of 18 organizationsNational Council on Aging, India Community Center, Office of the Public Defender, Avenidas Senior Center, Cupertino Senior Center, Korean American Community Services, Inc., Sacred Heart Community Service, Hospice of the Valley, Outreach, Inc., Project Match, Inc., Catholic Charities of Santa Clara County, Community Services Agency of Mountain View and Los Altos, Alzheimer's Activity Center, San José Parks, Recreation and Neighborhood Services, Office on Aging, Vietnamese Voluntary Foundation, Mexican American Community Services, Inc., Senior Adults Legal Assistance, and Santa Clara County Department of Aging and Adult Services.
The graph shows that while aging services expenditures among this sample group increased by 1.3 percent between FY 2002-03 and FY 2003-04, the number of seniors they served grew by over 19 percent.
An increase in funding by one organization in the sample group was largely responsible for the net increase in expenditure levels between FY 2002-03 and FY 2003-04. The Santa Clara County Department of Aging and Adult Services (DAAS) increased its funding for in-home care (specifically the In-Home Supportive Services Program) by roughly 17 percent in FY 2003-04, and because that program’s budget is significantly larger than any other organization’s in the sample, this increase caused a net increase in funding. If

SECTION 1
COMMUNITY FOR A LIFETIMETEN-YEAR STRATEGIC PLAN 9
DAAS is removed from the sample, the difference between dollars spent on aging services and individuals serviced is even more dramatic. Exhibit 1-7 presents this comparison.
EEXXHHIIBBIITT 11--77 CCOOMMPPAARRIISSOONN OOFF CCHHAANNGGEE IINN AAGGIINNGG SSEERRVVIICCEESS EEXXPPEENNDDIITTUURREESS AANNDD
SSEERRVVIICCEE LLEEVVEELLSS BBEETTWWEEEENN 22000022--0033 AANNDD 22000033--0044EEXXCCLLUUDDIINNGG DDAAAASS
Represents sample group of 17 organizationsNational Council on Aging, India Community Center, Office of the Public Defender, Avenidas Senior Center, Cupertino Senior Center, Korean American Community Services, Inc., Sacred Heart Community Service, Hospice of the Valley, Outreach, Inc., Project Match, Inc., Catholic Charities of Santa Clara County, Community Services Agency of Mountain View and Los Altos, Alzheimer's Activity Center, San José Parks, Recreation and Neighborhood Services, Office on Aging, Vietnamese Voluntary Foundation, Mexican American Community Services, Inc., and Senior Adults Legal Assistance.
Based on the sample group that excluded DAAS data, organizations were serving more older adults with fewer dollars—specifically, an increase of 23 percent in the number of older adults served between FY 2002-03 and FY 2003-04, compared to a decrease of 6.9 percent in funding. SSeenniioorrss EExxppeerriieennccee DDeellaayyss iinn SSeerrvviiccee While more seniors have been receiving services in the last fiscal year, some are experiencing delays in obtaining the services they need. Organizations in the sample group were asked how many days their senior clients wait for services after they have requested or applied for them.
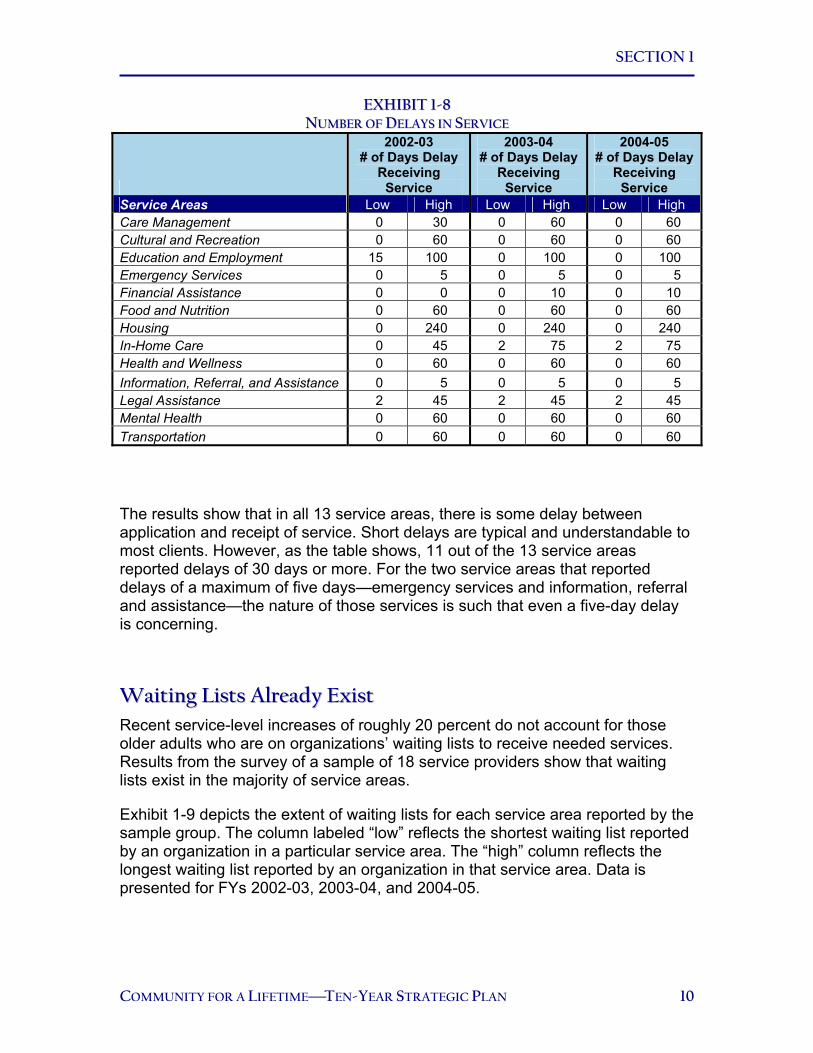
Exhibit 1-8 presents the sample group’s response to this question. The column labeled “low” reflects the fewest number of days between application and service as reported by the sample group. The “high” column reflects the greatest number of days between application and service as reported by the sample group. Data is presented for FYs 2002-03, 2003-04, and 2004-05.
-10%-5%0%5%
10%15%20%25%
Percent Changein Expenditures
Percent Changein Number ofSeniors Served
SECTION 1
COMMUNITY FOR A LIFETIMETEN-YEAR STRATEGIC PLAN 10
EEXXHHIIBBIITT 11--88 NNUUMMBBEERR OOFF DDEELLAAYYSS IINN SSEERRVVIICCEE
2002-03 # of Days Delay
Receiving Service
2003-04 # of Days Delay
Receiving Service
2004-05 # of Days Delay
Receiving Service
Service Areas Low High Low High Low High Care Management 0 30 0 60 0 60 Cultural and Recreation 0 60 0 60 0 60 Education and Employment 15 100 0 100 0 100 Emergency Services 0 5 0 5 0 5 Financial Assistance 0 0 0 10 0 10 Food and Nutrition 0 60 0 60 0 60 Housing 0 240 0 240 0 240 In-Home Care 0 45 2 75 2 75 Health and Wellness 0 60 0 60 0 60 Information, Referral, and Assistance 0 5 0 5 0 5 Legal Assistance 2 45 2 45 2 45 Mental Health 0 60 0 60 0 60 Transportation 0 60 0 60 0 60
The results show that in all 13 service areas, there is some delay between application and receipt of service. Short delays are typical and understandable to most clients. However, as the table shows, 11 out of the 13 service areas reported delays of 30 days or more. For the two service areas that reported delays of a maximum of five days—emergency services and information, referral and assistance—the nature of those services is such that even a five-day delay is concerning.
WWaaiittiinngg LLiissttss AAllrreeaaddyy EExxiisstt Recent service-level increases of roughly 20 percent do not account for those older adults who are on organizations’ waiting lists to receive needed services. Results from the survey of a sample of 18 service providers show that waiting lists exist in the majority of service areas.
Exhibit 1-9 depicts the extent of waiting lists for each service area reported by the sample group. The column labeled “low” reflects the shortest waiting list reported by an organization in a particular service area. The “high” column reflects the longest waiting list reported by an organization in that service area. Data is presented for FYs 2002-03, 2003-04, and 2004-05.

SECTION 1
COMMUNITY FOR A LIFETIMETEN-YEAR STRATEGIC PLAN 11
EEXXHHIIBBIITT 11--99 NNUUMMBBEERR OOFF CCLLIIEENNTTSS OONN WWAAIITTIINNGG LLIISSTTSS
2002-03 # of Clients on
Waiting List
2003-04 # of Clients on
Waiting List
2004-05 # of Clients on
Waiting List Service Areas Low High Low High Low High Care Management 0 350 0 500 0 870 Cultural and Recreation 0 20 0 18 0 23 Education and Employment 0 100 0 100 0 200 Emergency Services 0 0 0 0 0 0 Financial Assistance 0 0 0 10 0 10 Food and Nutrition 0 100 0 120 0 130 Housing 0 20 0 25 0 20 In-Home Care 0 0 0 10 0 15 Health and Wellness 0 50 0 100 0 150 Information, Referral, and Assistance 0 0 0 0 0 0 Legal Assistance 0 150 0 150 0 150 Mental Health 0 20 0 18 0 23 Transportation 0 25 0 30 0 40
As the table shows, in every service area above, at least one organization in the sample group had no waiting list. However, in 11 out of 13 service areas, organizations have experienced waiting lists of some kind in the last three years, the longest of which is reflected in the “high” column above. Only in the areas of Emergency Services and Information, Referral and Assistance did the sample group organizations providing these services report no waiting lists in all three years.
In short, results from this sample group illustrate that seniors’ demand for services already exceeds service capacity. If no action is taken to prepare for the doubling of the senior population over the next 20 years, these waiting lists will swell.

Section 2
Our
Commitment
to Seniors
A Framework for Strategic
Planning
COMMUNITY FOR A LIFETIMETEN-YEAR STRATEGIC PLAN 12
SSEECCTTIIOONN 22 OOUURR CCOOMMMMIITTMMEENNTT TTOO SSEENNIIOORRSS AA FFRRAAMMEEWWOORRKK FFOORR SSTTRRAATTEEGGIICC PPLLAANNNNIINNGG
Our plan for serving older adults in Santa Clara County must be built upon a framework that reflects our commitment to seniors. This section presents the following components of the strategic plan.
• Our Vision for an Elder-Friendly Santa Clara CountyThis vision statement reflects our ultimate goal in supporting older adults in Santa Clara County—our image of the desired future. Though we may never fully attain this vision, it is one that we are committed to strive toward.
• Our Mission As Public and Private Partners Serving Older AdultsThis mission statement describes our scope of authority and responsibility in supporting older adults in Santa Clara County.
• Our Goals For Supporting Older AdultsThese goals chart the direction we will take to advance the well-being of older adults in the community.
• Our Desired Outcomes From Meeting These GoalsThe outcomes delineate the benefits of achieving each goal. They represent conditions of older adults’ well-being that we aim to improve through implementation of the strategic plan.
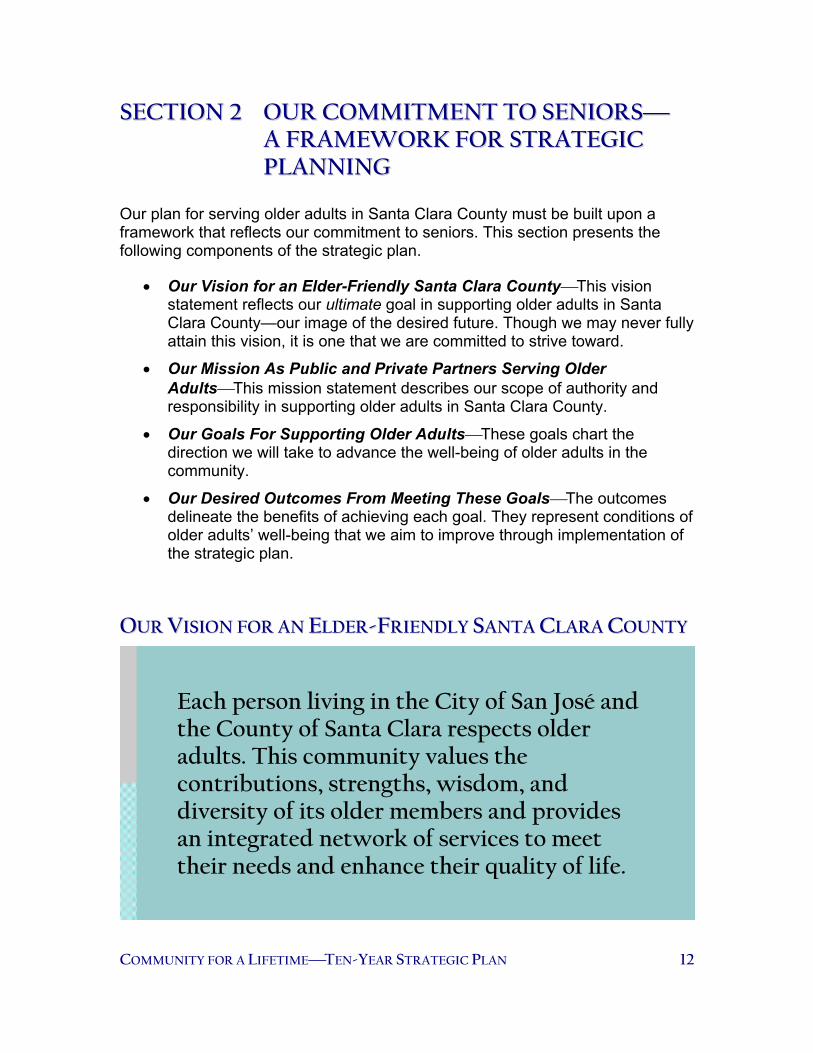
OOUURR VVIISSIIOONN FFOORR AANN EELLDDEERR--FFRRIIEENNDDLLYY SSAANNTTAA CCLLAARRAA CCOOUUNNTTYY
Each person living in the City of San José and the County of Santa Clara respects older adults. This community values the contributions, strengths, wisdom, and diversity of its older members and provides an integrated network of services to meet their needs and enhance their quality of life.
SECTION 2
COMMUNITY FOR A LIFETIMETEN-YEAR STRATEGIC PLAN 13
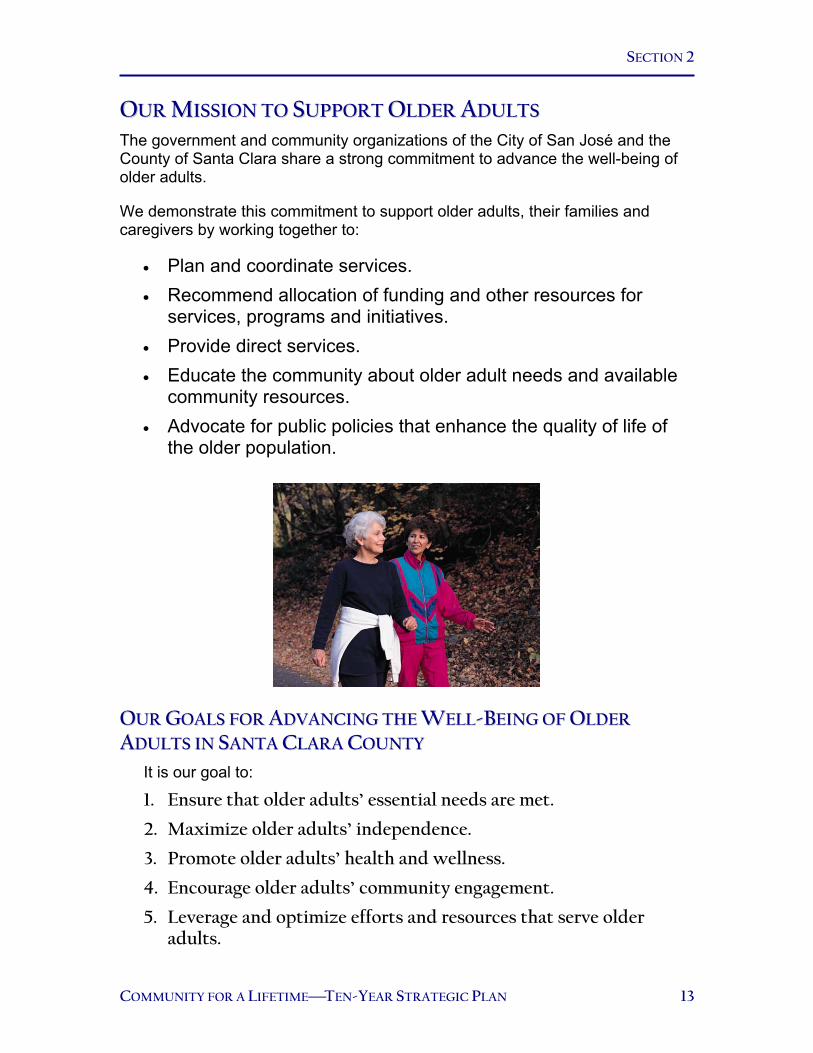
OOUURR MMIISSSSIIOONN TTOO SSUUPPPPOORRTT OOLLDDEERR AADDUULLTTSS The government and community organizations of the City of San José and the County of Santa Clara share a strong commitment to advance the well-being of older adults.
We demonstrate this commitment to support older adults, their families and caregivers by working together to:
• Plan and coordinate services. • Recommend allocation of funding and other resources for
services, programs and initiatives. • Provide direct services. • Educate the community about older adult needs and available
community resources. • Advocate for public policies that enhance the quality of life of
the older population.
OOUURR GGOOAALLSS FFOORR AADDVVAANNCCIINNGG TTHHEE WWEELLLL--BBEEIINNGG OOFF OOLLDDEERR
AADDUULLTTSS IINN SSAANNTTAA CCLLAARRAA CCOOUUNNTTYY It is our goal to:
1. Ensure that older adults’ essential needs are met.
2. Maximize older adults’ independence.
3. Promote older adults’ health and wellness.
4. Encourage older adults’ community engagement.
5. Leverage and optimize efforts and resources that serve older adults.

SECTION 2
COMMUNITY FOR A LIFETIMETEN-YEAR STRATEGIC PLAN 14
OOUURR DDEESSIIRREEDD OOUUTTCCOOMMEESS FFRROOMM MMEEEETTIINNGG TTHHEESSEE GGOOAALLSS
Outcomes: To achieve this goal means that:
• Older adults have enough to eat.
• Older adults are safe and secure in their homes and neighborhoods.
• Older adults are protected from abuse, neglect, and exploitation.
• Older adults have access to affordable housing. • Older adults have the information they need to access services.
Outcomes: To achieve this means that:
• Transportation is affordable and accessible to older adults.
• Older adults living at home who need assistance with activities of daily living receive adequate support.
• Caregivers are supported by the community.
Goal 1: Ensure that older adults’ essential needs are met.
Goal 2: Maximize older adults’ independence.

SECTION 2
COMMUNITY FOR A LIFETIMETEN-YEAR STRATEGIC PLAN 15
Outcomes: To achieve this means that:
• Older adults have access to affordable physical and mental health services.
• Obstacles to medical care are minimized.
• Older adults’ medical providers are trained in geriatrics or gerontology.
Outcomes: To achieve this means that:
• Older adults maintain connections with friends and neighbors.
• Older adults can rely on their community in times of need.
• Opportunities for life-long learning and other personal enrichment experiences are available to older adults.
• Older adults have outlets for recreation and social activities.
Outcomes: To achieve this means that:
• Public and private organizations collaborate to effectively fund, plan, and deliver services for older adults.
• Local government and community organizations demonstrate their commitment to older adults by preserving and augmenting services that seniors need.
Goal 3: Promote older adults’ health and wellness.
Goal 4: Encourage older adults’ community engagement.
Goal 5: Leverage and optimize efforts and resources that serve older adults.

SECTION 2
COMMUNITY FOR A LIFETIMETEN-YEAR STRATEGIC PLAN 16
DDIIAAGGRRAAMM OOFF SSTTRRAATTEEGGIICC PPLLAANNNNIINNGG FFRRAAMMEEWWOORRKK Exhibit 2-1 is a pictorial depiction of these strategic goals and outcomes. Each goal is reflected by a colored circle, and the concepts within each circle represent the needs of older adults for which positive outcomes need to be attained.
EEXXHHIIBBIITT 22--11
SSTTRRAATTEEGGIICC PPLLAANNNNIINNGG FFRRAAMMEEWWOORRKK
UUSSIINNGG TTHHEE FFRRAAMMEEWWOORRKK TTOO IIDDEENNTTIIFFYY TTHHEE FFOOCCUUSS OOFF CCOOMMMMUUNNIITTYY EEFFFFOORRTTSS With this framework in place, we have a way to examine the current well-being of Santa Clara County’s older adults and determine which areas of the framework warrant focused efforts from the community. In the next section of this report, we present a summary of the key findings identified in the Countywide Senior Needs Assessment, which reflect the focal points of action for this strategic plan.
RESOURCESLeadership
CoordinationFunding
INDEPENDENCETransportationIn-Home Care
Caregiver SupportCase Management & Care
Coordination
HEALTH AND WELLNESSHealth Care
Health InsuranceMental Health
Exercise & Fitness
COMMUNITYENGAGEMENTSocial Interaction
Recreation and EnrichmentVolunteerism
ESSENTIAL NEEDSFood
HousingSafety & Protection
InformationLanguage

Section 3
Older Adults’
Most Prominent
Needs
The Focus of Our
Community Effort
COMMUNITY FOR A LIFETIMETEN-YEAR STRATEGIC PLAN 17
SSEECCTTIIOONN 33 OOLLDDEERR AADDUULLTTSS’’ MMOOSSTT PPRROOMMIINNEENNTT NNEEEEDDSSTTHHEE FFOOCCUUSS OOFF OOUURR CCOOMMMMUUNNIITTYY EEFFFFOORRTT
In order to identify those areas within the strategic planning framework that most need the community’s attention over the next ten years, the Strategic Plan Advisory Group undertook a Countywide Senior Needs Assessment in May and June of 2004. More than 1,100 community members, throughout Santa Clara County participated in this needs assessment. The full set of findings from that report can be found in Appendix B. In addition, all survey instruments and raw data from the needs assessment can be obtained, under separate cover, upon request.
In this section of the plan, we present the methodology for conducting the needs assessment and the key findings from the assessment.
RREESSEEAARRCCHH MMEETTHHOODDOOLLOOGGYY Three methods were utilized to identify older adults’ needs in Santa Clara Countya telephone survey, community input events, and expert interviews. Each method employed a different data collection technique, targeted different stakeholders, and compensated for inherent limitations in the other methods.
While the phone survey’s quantitative data provided perspective on the general status of older adults and the prevalence of various needs in Santa Clara County’s senior population, the qualitative data from the community input and expert interviews brought greater focus to and appreciation for those needs. Collectively, the methods maximized participation, ensured comprehensiveness, and helped to pinpoint trends. The following is a description of each research method.
MMeetthhoodd 11TTeelleepphhoonnee SSuurrvveeyy A randomized telephone survey was used to conduct a broad assessment of the characteristics, status, and needs of older adults in Santa Clara County. The survey instrument built upon a Senior Needs Assessment survey conducted in Santa Clara County in 1989 and included questions pertaining to essential needs, health and wellness, independence, and community engagement. The survey instrument was developed in consultation with the Strategic Plan Advisory Group.
Telephone survey interviewers used a method called “random digit dial” to call both listed and unlisted telephone numbers in Santa Clara County. The telephone numbers were generated at random, with no bias toward geography or
SECTION 3
COMMUNITY FOR A LIFETIMETEN-YEAR STRATEGIC PLAN 18
any other demographic factor. Telephone interviewers sought out households that included an adult aged 60 years or older. They made calls during the day, in the evening, and on weekends to avoid bias toward any particular lifestyle. Telephone interviewers were equipped to conduct the interview in the five most predominantly spoken languages in the countyEnglish, Spanish, Mandarin, Vietnamese, and Tagalog. Of those adults that were old enough to qualify for the telephone interview, roughly 50 percent agreed to participate. No data was collected on why individuals refused to participate, or which individuals refused—in terms of demographic make-up. However, two possible reasons may have included concern about sharing information over the phone to someone they do not know or a lack of time to participate.
Telephone calls were made until a sample of 504 older adults completed telephone interviews. This enabled the survey results to be scientifically rigorous—at a 95 percent confidence level. In other words, the sample size ensures 95 percent certainty that the results reflect the larger population of noninstitutionalized older adults in Santa Clara County. In addition, the survey responses have a 4.37 percent margin of error, which means that each response is accurate within a range of +/- 4.37 percentage points. It is important to recognize that each percentage point in the survey translates into roughly 2,200 older adults in Santa Clara County. Therefore, even relatively small percentages reflect the needs or status of a sizeable number of older adults. This research method was advantageous for several reasons: it allowed older adults to participate in the needs assessment without leaving their homes; it reached out to older adults without bias; and it allowed the City and County to get an accurate picture of the needs and status of noninstitutionalized older adults in the county through statistical sampling.
MMeetthhoodd 22CCoommmmuunniittyy IInnppuutt EEvveennttss The City and County hosted two “town hall meetings” that were open to the public, 20 focus groups with older adults and those concerned about their needs, and phone interviews with homebound seniors who could not otherwise attend an event. In total, over 630 individuals participated in these events. The community input events enabled older adults to share their needs and concerns in greater depth than the telephone survey permitted. They also allowed community members who had not been eligible for the phone survey—such as younger caregivers of seniors—to share their perspectives. Finally, the events provided a setting in which some seniors felt more comfortable participating than in the telephone survey. This had the effect of boosting representation by communities within the older adult population—including Asians and Latinos—

SECTION 3
COMMUNITY FOR A LIFETIMETEN-YEAR STRATEGIC PLAN 19
and enriching the City’s and County’s understanding of older adults’ needs in general.
Town Hall MeetingsThe town hall meetings were held at Berryessa Community Center and Southside Community and Senior Centerboth in San José. These locations were selected because the largest concentration of Santa Clara County adults aged 60 years and older resides in San José—roughly 47 percent as of the 2000 Census.
Announcements of these events were published in local papers, broadcast on local radio stations, posted at senior centers around the county, inserted in senior center newsletters, and distributed to older adults by agencies that serve them. The announcements were produced in five languages—English, Spanish, Mandarin, Vietnamese, and Tagalog. To encourage attendance, the Mayor’s Office of San José sponsored free cab rides to and from the events, to ensure that all individualsincluding those with impaired mobility had safe and obtainable transportation. Over 23 percent of the town hall participants utilized this free service.
At each event, participants broke out into smaller discussion groups of 8 to 15 members. Interpreters were available to translate discussions into Spanish, Mandarin, Cantonese, Vietnamese, Tagalog, and sign language. Each group was led by a facilitator who asked the group a list of pre-set questions and a note taker documented the group’s input on a recording worksheet. The discussions centered on the most pressing needs of seniors today and how local government and community-based organizations could help address those needs.
The town hall meetings were an effective method for inviting broad participation by anyone interested in discussing older adults’ needs in Santa Clara County. A total of 365 individuals attended the town hall meetings. The events’ participants were geographically and ethnically diverse—representing almost every region of the county and including those who were Latino, Vietnamese, Chinese, Korean, Punjabi, Filipino, and African-American.
Aging - By the Numbers
To encourage attendance, the Mayor’s Office of San José sponsored free cab rides to and from the events, to ensure that all individualsincluding those with impaired mobility had safe and obtainable transportation. Over 23 percent of the town hall participants utilized this free service.

SECTION 3
COMMUNITY FOR A LIFETIMETEN-YEAR STRATEGIC PLAN 20
Focus GroupsFocus groups offered the most intimate and private setting for older adults and their caregivers to share their service needs and priorities. The Strategic Plan Advisory Group identified 16 communities to invite to focus groups. These were:
• Korean seniors
• Chinese seniors
• Vietnamese seniors
• Filipino seniors
• Latino seniors
• Indo American (Hindi and Punjabi) seniors
• Mountain View and Los Altos seniors
• West San José seniors
• Willow Glen seniors
• Morgan Hill seniors
• Gilroy seniors
• Lesbian, gay, bisexual, and transgender seniors
• Caregiving seniors
• Senior center/nutrition site staff
• Family caregivers of seniors
• Seniors in residential care
In some cases, multiple groups from the same community wished to participate in a focus group. Consequently, a total of 20 focus groups were convened. These communities were selected to participate in focus groups for one or both of the following reasons: focus groups were perceived as a more comfortable and culturally sensitive setting for the community to share its needs; and focus groups offered a way to bolster the community’s representation in the needs assessment. These settings were also more accessible for some participants, such as caregivers. Adult day care and childcare were offered during these focus groups.
A total of 238 individuals participated in the focus groups, with groups ranging in size from 6 to 31 participants. Strategic Plan Advisory Group members volunteered to facilitate the focus groups, or secured staff with the language and cultural competencies needed, using uniform focus group guides and questions.
SECTION 3
COMMUNITY FOR A LIFETIMETEN-YEAR STRATEGIC PLAN 21
Phone Interviews with Homebound SeniorsThe needs assessment effort also reached out to seniors who were unable to leave their homes to attend a community input event. Staff volunteers conducted phone interviews with a randomized sample of 29 participants of the county’s In-Home Supportive Services and Senior Nutrition programs. These seniors were asked questions similar to those asked in the traditional focus groups. Their responses were documented, compiled, and incorporated into the analysis of seniors’ needs.
MMeetthhoodd 33EExxppeerrtt IInntteerrvviieewwss Expert interviews comprised the third arm of the Countywide Senior Needs Assessment. Knowledgeable service providers, policymakers, and community leaders within Santa Clara County were asked to share their insights about the service needs of older adults and the community’s capacity to respond to them. Input from these experts offered a valuable point of reference to older adults’ responses in the phone survey and community input events.
The Strategic Plan Advisory Group identified local experts whose policy and service expertise included that of health, transportation, housing, nutrition, information and referral, in-home supportive services, elder abuse, recreation, education, and community services. In some instances, individuals recommended for interviews could not be reached, despite multiple attempts. In all, 32 interviews were conducted with 40 individuals—either in person, by phone, or by email.
Each expert was asked the same set of questions pertaining to the needs of older adults in Santa Clara County and the county’s service capacity and leadership in addressing those needs.
AANNAALLYYTTIICCAALL MMEETTHHOODDOOLLOOGGYY Results from the needs assessment were first examined independently to identify the most frequently cited needs from each of the three research methods—telephone survey, community input events, and expert interviews. These findings were then compared across research methods for common themes. When a need was noted with great frequency in the results of two or more research methods, that need was considered significant and one that warranted focus from the community in the strategic plan.
MMEETTHHOODDOOLLOOGGIICCAALL LLIIMMIITTAATTIIOONNSS By undertaking a community-driven approach to strategic planning, the process ensured that the service needs identified reflected pervasive local issues and that

SECTION 3
COMMUNITY FOR A LIFETIMETEN-YEAR STRATEGIC PLAN 22
the strategies for solving them were realistic and feasible for organizations to undertake in Santa Clara County. This approach also introduced some limitations that are important to note. The randomized telephone survey could not reach older adults who do not own telephones; it could not reach older adults in institutional settings; and while the methodology for identifying older adults was random, results from the interviews show that there was some bias regarding which older adults were willing to participate in the interviews. Namely, older adults of Asian and Latino descent refused to be interviewed at higher rates than non-Hispanic whites and African-Americans. As a result, these ethnic groups are underrepresented in the phone survey population. Conscious efforts were made to compensate for this limitation in the community input events through targeted outreach to these communities.
Local advocates and services providers who work with ethnic groups of older adults noted that this lack of participation by minorities was not surprising, particularly with respect to Asian seniors. These experts indicated that the Asian seniors they work with are highly reluctant to provide information over the phone to strangers. In addition, researchers have found that members of immigrant groups are reluctant to provide information to the government for fear of negative consequences regarding public benefits and citizenship status. Future needs assessment efforts will need to consider how to compensate for this behavior when attempting to gather statistically valid sample data. In addition, soliciting input from over 1,100 community members meant that myriad service needs were raised through the course of the needs assessment. Not all of these needs could be addressed in the strategic plan. By its nature, a strategic plan needs to focus on select issues that are pervasive in a community. For this reason, only those needs that were common across community input methods were highlighted in the strategic plan. Relying on community members’ input to identify pervasive service needs also meant that needs that are particularly sensitive or difficult for individuals to express were unlikely to present themselves in the needs assessment and, consequently, in the strategic plan. Service needs related to mental health, elder abuse, and end-of-life care, for example, are often uncomfortable topics for discussion and were not commonly noted during the needs assessment. These areas of need warrant assessment through other means and community action to address them. Finally, because the focus of the needs assessment was on identifying unmet needs, services that older adults currently rely upon and receive were unlikely to have been expressed by community members. These existing services should not be jeopardized for the sake of focusing resources on the unmet needs that have been identified through the Countywide Senior Needs Assessment.

SECTION 3
COMMUNITY FOR A LIFETIMETEN-YEAR STRATEGIC PLAN 23
KKEEYY FFIINNDDIINNGGSS FFRROOMM TTHHEE NNEEEEDDSS AASSSSEESSSSMMEENNTT TToopp TTwwoo SSeerrvviiccee NNeeeeddss Two service needs surfaced as prevalent issues across all three research methods of the Countywide Senior Needs Assessment. These were:
• Transportationspecifically: limited availability of paratransit services; lack of assistance boarding public transit; and limited access to public transportation.
• Informationspecifically: lack of information about how to access services.
Participants in the countywide phone survey, community input events, and expert interviews all pointed to transportation and information as critical needs of older adults in Santa Clara County.
AAddddiittiioonnaall KKeeyy SSeerrvviiccee NNeeeeddss Six more service needs arose as top concerns to older adults in two of the three input methods. These were:
• Housingspecifically: lack of access to affordable housing and lack of affordable home repair.
• Languagespecifically: more prevalent lack of information about services for older adults who do not speak English as a primary language.
• Health Carespecifically: lack of health professionals with gerontology/ geriatric training; poor linkages between health care and long-term care.
• In-Home Carespecifically: shortage of affordable in-home care services and lack of care management services.
• Caregiver Supportspecifically: lack of support for older adults’ caregiving.
• Senior Center Programsspecifically: desire for senior centers to provide information and assistance services, including legal assistance, and management and coordination services for people who need in-home care or assisted living;
SECTION 3
COMMUNITY FOR A LIFETIMETEN-YEAR STRATEGIC PLAN 24
and the need for senior centers to prepare to serve the disparate interests of baby boomers and older seniors.
These key needs are not listed in any priority order, as each was given the same valuation for being one of the most commonly cited needs in two of the three research methods.
KKeeyy RReessoouurrccee NNeeeeddss Only in the expert interviews were participants asked about resource needs for senior services. Experts pointed to two types of resources that they felt were critical to advancing the well-being of older adults in Santa Clara County. These were:
• Leadership and Coordinationspecifically: lack of coordinated leadership and advocacy for aging services.
• Fundingspecifically: stagnating or decreasing funding for services despite increase in need for services.
These ten areas of need—eight service areas and two resource areas—constitute the focus of the objectives and strategies of the strategic plan. In the remaining pages of this section, we outline the nature of these needs and the key findings that support them. We also align each need with its relevant goal from the strategic planning framework.

SECTION 3
COMMUNITY FOR A LIFETIMETEN-YEAR STRATEGIC PLAN 25
GGOOAALL 11:: EENNSSUURREE TTHHAATT OOLLDDEERR AADDUULLTTSS’’ EESSSSEENNTTIIAALL NNEEEEDDSS AARREE MMEETT..
FFOOCCUUSS OOFF NNEEEEDD::
• Lack of affordable housing. • Lack of affordable home repair.
SSUUMMMMAARRYY OOFF KKEEYY HHOOUUSSIINNGG FFIINNDDIINNGGSS
• Affordable housing was noted as a serious concern by older adults at community input events and by aging services experts. While the telephone survey showed housing/home repair as a problem facing a small percentage of older adults, it is one that has a critical impact on the well-being of those seniors.
• Affordable housing was the third most common need cited in the community input events and the fifth most common need cited by experts.
• Over 5 percent of phone survey respondents reported that they were not very confident or not at all confident that they could stay in their homes as long as they would like. The most common reasons for this doubt were:
− Financial reasons/money.
− Medical/health reasons.
− Stairs.
• Almost 6 percent of older adults in the survey reported that they did not have enough money sometime in the last year to pay for needed repairs to their home.
ESSENTIAL NEEDS
AARREEAA OOFF NNEEEEDD:: HHOOUUSSIINNGG
SECTION 3
COMMUNITY FOR A LIFETIMETEN-YEAR STRATEGIC PLAN 26
FFOOCCUUSS OOFF NNEEEEDD::
• Lack of information about how to access services.
SSUUMMMMAARRYY OOFF KKEEYY IINNFFOORRMMAATTIIOONN FFIINNDDIINNGGSS
• Information and referral assistance was the fifth most common need raised in the community input events. It was also the second most frequently cited service that older adults stated they rely upon and feel is important to preserve.
• Over 6 percent of older adults reported in the phone survey that they have difficulty or need assistance obtaining information about how to access services they need. Of these, almost 60 percent stated that no one is helping them obtain information.
• Information and referral services were requested by survey respondents more often than any other possible senior center service: 53 percent of older adults would like to see a senior center in their area offer information and referral services.
• For those older adults who reported a need for assistance of some kind but are not receiving it, their most frequent reason for this unmet need was that they do not know who to turn to or where to get the help.
• Family and friends were equally common sources of information across income levels. However, use of other sources differed by socioeconomic status: older adults with household incomes of less than $50,000 were more likely to rely on senior centers for their information than adults with higher incomes. Adults with higher incomes were somewhat more likely to rely on the yellow pages and much more apt to use the Internet for information.
• Just over 58 percent of older adults surveyed reported using the Internet, with 92.2 percent of users having access from a computer at their home. According to the phone survey, older adults who are Asian, Latino, and African-American, as a group were less likely to use the Internet than their non-Hispanic White counterparts: 42.7 percent versus 60.1 percent, respectively.
• Age was also a factor in Internet usage, with older seniors less likely to use the Internet than their younger counterparts: 75.6 percent of 60- to 64- years-olds use it; 64.1 percent of 65- to 74-year-olds use it; and 24.2 percent of adults 85 years and older use it.
AARREEAA OOFF NNEEEEDD:: IINNFFOORRMMAATTIIOONN
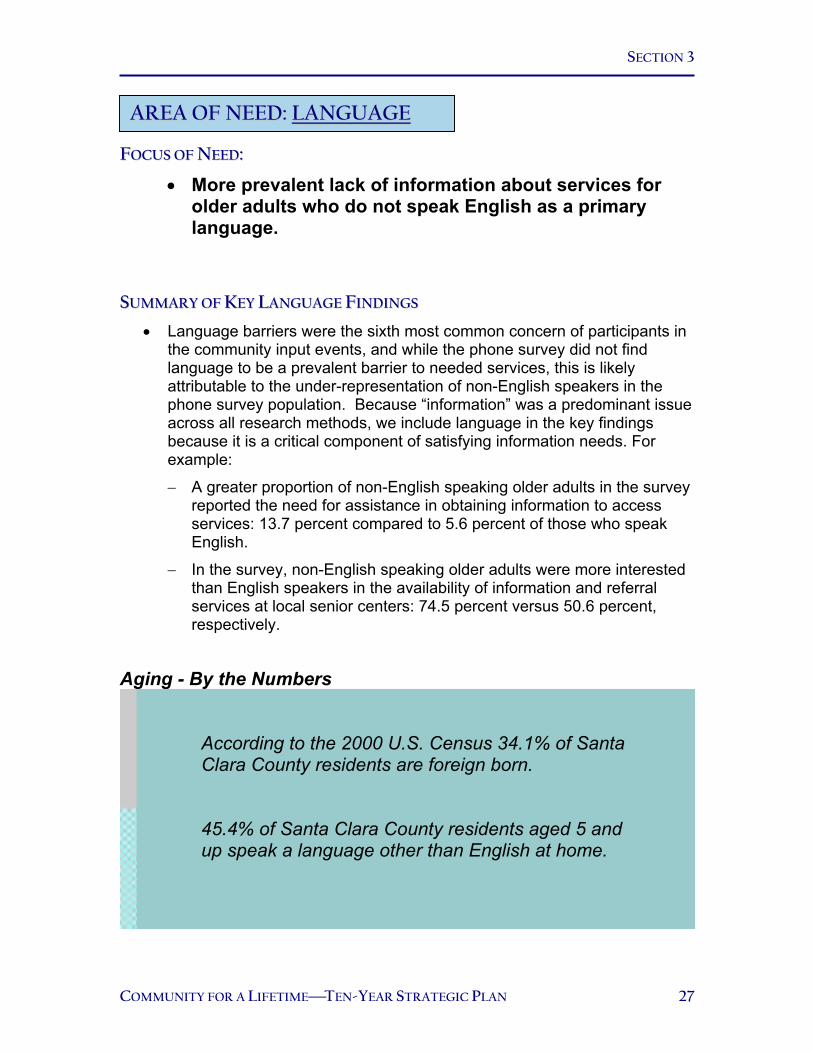
SECTION 3
COMMUNITY FOR A LIFETIMETEN-YEAR STRATEGIC PLAN 27
FFOOCCUUSS OOFF NNEEEEDD::
• More prevalent lack of information about services for older adults who do not speak English as a primary language.
SSUUMMMMAARRYY OOFF KKEEYY LLAANNGGUUAAGGEE FFIINNDDIINNGGSS
• Language barriers were the sixth most common concern of participants in the community input events, and while the phone survey did not find language to be a prevalent barrier to needed services, this is likely attributable to the under-representation of non-English speakers in the phone survey population. Because “information” was a predominant issue across all research methods, we include language in the key findings because it is a critical component of satisfying information needs. For example:
− A greater proportion of non-English speaking older adults in the survey reported the need for assistance in obtaining information to access services: 13.7 percent compared to 5.6 percent of those who speak English.
− In the survey, non-English speaking older adults were more interested than English speakers in the availability of information and referral services at local senior centers: 74.5 percent versus 50.6 percent, respectively.
Aging - By the Numbers
According to the 2000 U.S. Census 34.1% of SantaClara County residents are foreign born. 45.4% of Santa Clara County residents aged 5 and up speak a language other than English at home.
AARREEAA OOFF NNEEEEDD:: LLAANNGGUUAAGGEE

SECTION 3
COMMUNITY FOR A LIFETIMETEN-YEAR STRATEGIC PLAN 28
INDEPENDENCE
GGOOAALL 22:: MMAAXXIIMMIIZZEE OOLLDDEERR AADDUULLTTSS’’ IINNDDEEPPEENNDDEENNCCEE
FFOOCCUUSS OOFF NNEEEEDD::
• Limited availability of paratransit services. • Lack of assistance boarding public transit. • Limited access to public transportation. • Lack of coordinated transportation among senior
centers.
SSUUMMMMAARRYY OOFF KKEEYY TTRRAANNSSPPOORRTTAATTIIOONN FFIINNDDIINNGGSS
• Transportation was the most common issue raised in both the community input events and the expert interviews. Concerns included the cost of transportation, lack of accessible transportation, lack of coordination between bus and light rail schedules and among senior centers, lack of escorted transportation (paratransit) for seniors including those without disabilities, and lack of assistance boarding public transit.
• Transportation was most often cited in the community input events as a service older adults rely upon and feel is important to preserve.
• Assisted transportation was the second most common need raised in interviews with homebound seniors who participate in the In-Home Supportive Services Program. Some participants noted that the county’s current paratransit service—called Outreach, Inc.—is too costly.
• Over 10 percent of surveyed older adults reported that they have difficulty or need assistance using transportation or going outside of the home to shop or visit the doctor. Of these, over 55 percent stated that no one is helping them get around.
AARREEAA OOFF NNEEEEDD:: TTRRAANNSSPPOORRTTAATTIIOONN

SECTION 3
COMMUNITY FOR A LIFETIMETEN-YEAR STRATEGIC PLAN 29
• In the survey, older seniors were more likely to need help getting outside of the home or using transportation than their younger counterparts: 24.2 percent of adults 85 and older reported this need, compared to 14.7 percent of 75- to 84-year-olds, and 6.4 percent of 60- to 74-year-olds.
• In addition, non-English speaking older adults in the survey were more likely than English speakers to need help getting outside of the home or using transportation: 27.4 percent versus 7.6 percent, respectively.
• Non-English speaking older adults in the phone survey were less able to get where they wanted to go than their English-speaking counterparts: 15.7 percent reported that they sometimes, rarely, or almost never get where they wanted to go versus 5.4 percent, respectively.
FFOOCCUUSS OOFF NNEEEEDD::
• Shortage of affordable in-home care services. • Lack of care management services.
SSUUMMMMAARRYY OOFF KKEEYY IINN--HHOOMMEE CCAARREE FFIINNDDIINNGGSS
• Participants of the community input events cited in-home care as one of the top five services they or members of their family feel is important to preserve.
• Over 20 percent of the homebound seniors interviewed reported the need for more service hours from the county’s In-Home Supportive Services Program.
• Experts cited the need for in-home care services more often than any other issue except transportation. Concerns related to the lack of affordable low-cost in-home services, delays in providing the service once applications have been submitted, lack of home-delivered meals, and lack of adequate care management.
• Over 13 percent of older adults in the phone survey reported that they have difficulty or need assistance with some kind of activity of daily living—such as bathing or preparing a meal—or with an instrumental activity of daily living like going shopping. Of the older adults needing this assistance, 41.2 percent stated that they do not currently receive any help.
AARREEAA OOFF NNEEEEDD:: IINN__HHOOMMEE CCAARREE
SECTION 3
COMMUNITY FOR A LIFETIMETEN-YEAR STRATEGIC PLAN 30
• In the survey, a greater proportion of non-English speaking older adults were in need of assistance with personal care than their English-speaking counterparts: 7.8 percent compared to 0.7 percent, respectively.
• A greater proportion of older seniors have disabilities that limit their activities than younger seniors: 36.7 percent of 75- to 84-year-olds and 42.4 percent of those 85 years and older report having disabilities, compared to 22 percent of 60- to 64-year-olds and 27.7 percent of 65- to 74-year-olds.
FFOOCCUUSS OOFF NNEEEEDD::
• Lack of support for older adults’ caregiving.
SSUUMMMMAARRYY OOFF KKEEYY CCAARREEGGIIVVEERR SSUUPPPPOORRTT FFIINNDDIINNGGSS
• Experts raised the issue of caregiver support in 16 out of 32 interviews. Concerns included the need for adult day care; lack of respite for caregivers; the need to provide services in culturally sensitive ways; and lack of information about available services for caregivers.
• According to the phone survey, almost one-quarter of older adults are caregivers—providing or arranging care for someone other than themselves.
• Over 23 percent of senior caregivers reported in the survey that they sometimes, rarely, or never get relief when they need time off from caregiving.
• In the phone survey, non-English speaking older adults were more likely to be caregivers than their English-speaking counterparts: 41.2 percent compared to 22 percent, respectively.
• Just over 88 percent of surveyed senior caregivers provide care for a single generationmost commonly for a spouse or partner (40 percent) or for a parent or in-law (18 percent). However, almost 12 percent care for multiple generationssuch as a child and a spouse, a grandchild and parent or in-law, and so forth.
• In the phone survey, unpaid family or friends were more likely to assist older adults with various activities than paid individuals.
AARREEAA OOFF NNEEEEDD:: CCAARREEGGIIVVEERR SSUUPPPPOORRTT
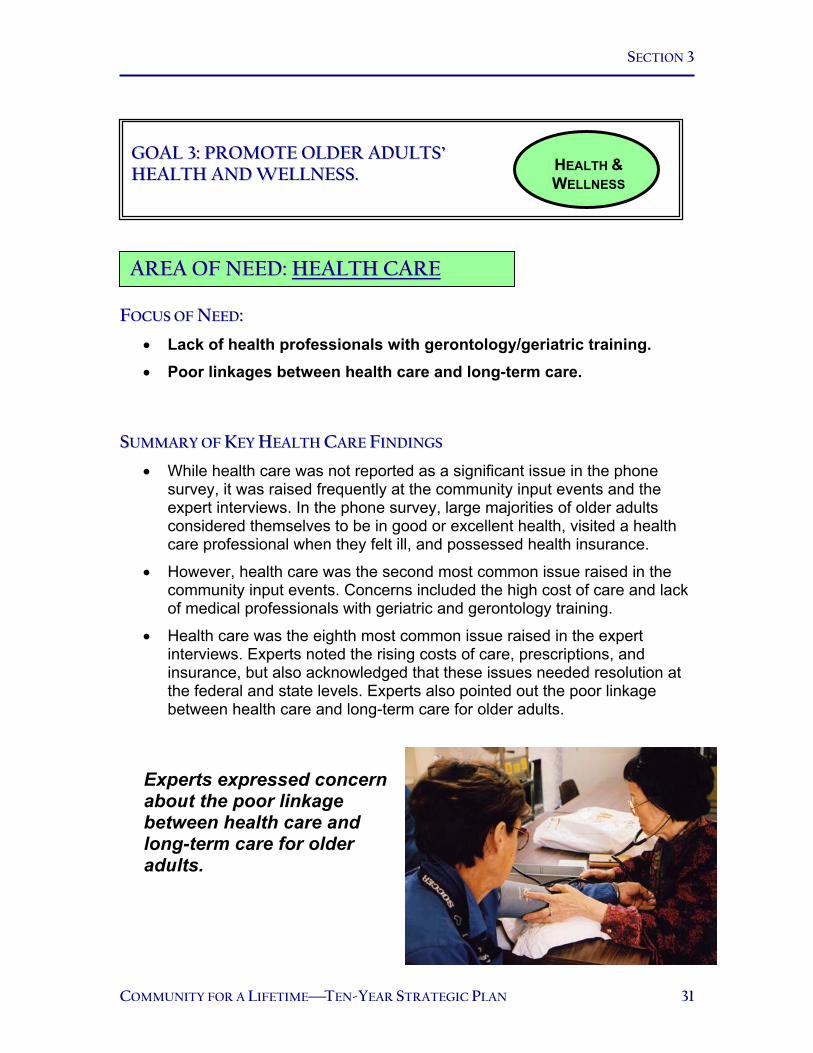
SECTION 3
COMMUNITY FOR A LIFETIMETEN-YEAR STRATEGIC PLAN 31
HEALTH & WELLNESS
FFOOCCUUSS OOFF NNEEEEDD::
• Lack of health professionals with gerontology/geriatric training. • Poor linkages between health care and long-term care.
SSUUMMMMAARRYY OOFF KKEEYY HHEEAALLTTHH CCAARREE FFIINNDDIINNGGSS
• While health care was not reported as a significant issue in the phone survey, it was raised frequently at the community input events and the expert interviews. In the phone survey, large majorities of older adults considered themselves to be in good or excellent health, visited a health care professional when they felt ill, and possessed health insurance.
• However, health care was the second most common issue raised in the community input events. Concerns included the high cost of care and lack of medical professionals with geriatric and gerontology training.
• Health care was the eighth most common issue raised in the expert interviews. Experts noted the rising costs of care, prescriptions, and insurance, but also acknowledged that these issues needed resolution at the federal and state levels. Experts also pointed out the poor linkage between health care and long-term care for older adults.
Experts expressed concern about the poor linkage between health care and long-term care for older adults.
GGOOAALL 33:: PPRROOMMOOTTEE OOLLDDEERR AADDUULLTTSS’’ HHEEAALLTTHH AANNDD WWEELLLLNNEESSSS..
AARREEAA OOFF NNEEEEDD:: HHEEAALLTTHH CCAARREE

COMMUNITY FOR A LIFETIMETEN-YEAR STRATEGIC PLAN 17
COMMUNITY ENGAGEMENT
GGOOAALL 44:: EENNCCOOUURRAAGGEE OOLLDDEERR AADDUULLTTSS’’ CCOOMMMMUUNNIITTYY EENNGGAAGGEEMMEENNTT..
FFOOCCUUSS OOFF NNEEEEDD::
• Desire for senior centers to provide information and referral services, legal assistance, and management and coordination services for people who need in-home services or assisted living.
• Need for senior centers to prepare to serve the disparate interests of baby boomers and older seniors.
SSUUMMMMAARRYY OOFF KKEEYY SSEENNIIOORR CCEENNTTEERR PPRROOGGRRAAMM FFIINNDDIINNGGSS
• Senior centers are an outlet for many older adults’ community engagement. Results from the phone survey reflected appreciable growth in older adults’ attendance at senior centers and a desire to access more community opportunities. At the community input events, preserving and expanding senior center programs was the sixth most common need cited.
• At community input events, participants commonly noted the need to keep senior centers operating; to offer more social opportunities through the senior centers such as trips, clubs, cultural events, etc; and the need to offer a wider variety of programs that stimulate seniors both mentally and physically.
• Senior center programs were one of the five services most frequently cited by community input participants as those that older adults rely upon and feel should be preserved. Meal programs at senior centers were specifically cited as critical to older adults’ well-being.
• According to results from the 1989 and 2004 phone surveys, attendance at senior centers has increased almost 64 percent since 1989, from 18.2 percent to 29.8 percent.
AARREEAA OOFF NNEEEEDD:: SSEENNIIOORR CCEENNTTEERR PPRROOGGRRAAMMSS
SECTION 3
COMMUNITY FOR A LIFETIMETEN-YEAR STRATEGIC PLAN 33
• When asked which programs and activities they would like senior centers
to offer, more than one-half of all older adults in the phone survey selected information and referral services (53 percent), legal assistance (52 percent), and management and coordination services for people who need in-home care or assisted living (57 percent).
• Of the almost 30 percent of older adults who reported visiting a senior center in the last six months, over 52 percent of older adults did so primarily for social or recreational reasons; while over 25 percent did so to access health and human services.
• Of the older adult population, survey respondents aged 60 to 64 years were the most interested in increasing their involvement in recreational and enrichment activities.
• Results from the phone survey showed that the youngest of older adults—those 60 to 64 years of age—are the least likely of older adults to visit a senior center: just fewer than 19 percent visited one in the last six months compared to almost 30 percent of the overall senior population.
Aging - By the Numbers
29.8% of those surveyed in the Santa Clara CountyOlder Adult Needs Assessment had visited a senior center or nutrition site within the last six month. This represents a 64% increase in attendance from the 1989 Older Adult Needs Assessment.

SECTION 3
COMMUNITY FOR A LIFETIMETEN-YEAR STRATEGIC PLAN 34
FFOOCCUUSS OOFF NNEEEEDD::
• Lack of a leadership, coordination, and advocacy for aging services.
SSUUMMMMAARRYY OOFF KKEEYY LLEEAADDEERRSSHHIIPP AANNDD CCOOOORRDDIINNAATTIIOONN FFIINNDDIINNGGSS
• In only one of the research methods—the expert interviews—were participants asked explicitly about their perception of leadership on aging issues in Santa Clara County. Thirty of the 32 group or individual interviews responded to the question of leadership. Of those 30 who commented on the subject, 16 raised concerns and 14 made positive or neutral comments about the extent of leadership on aging in the community. Generally, all 30 of the leadership comments acknowledged key individuals in the community who have demonstrated leadership on aging issues in the county. Concerns raised in 16 of the interviews centered around the need for more coordinated leadership, rather than individual efforts. Examples of perceived leadership weaknesses included:
− Leadership is fragmented.
− Lack of clarity about which organizations are responsible for various aspects of aging services.
− Lack of leadership at the state, county, and city level.
− Lack of senior advocacy.
− Lack of a leadership coalition that prioritizes which services need to be funded/provided and in which order.
GGOOAALL 55:: LLEEVVEERRAAGGEE AANNDD OOPPTTIIMMIIZZEE RREESSOOUURRCCEESS TTHHAATT SSEERRVVEE OOLLDDEERR AADDUULLTTSS..
RESOURCES
AARREEAA OOFF NNEEEEDD:: LLEEAADDEERRSSHHIIPP AANNDD CCOOOORRDDIINNAATTIIOONN

SECTION 3
COMMUNITY FOR A LIFETIMETEN-YEAR STRATEGIC PLAN 35
• The coordination/collaboration issue was raised in 15 of the 32 expert interviews. Common themes that emerged regarding the coordination and/or collaboration of services include:
− Lack of coordination among City, County, and community-based organizations.
− Lack of overall vision in the county.
− Fragmentation.
− Lack of information sharing.
− Need to eliminate the duplication of services and turf wars.
Aging - By the Numbers
58.1% of those surveyed in the Santa Clara CountyOlder Adult Needs Assessment reported using the Internet. This is number is significantly higher than the national average of 18% reported in the 2000 Census.

SECTION 3
COMMUNITY FOR A LIFETIMETEN-YEAR STRATEGIC PLAN 36
FFOOCCUUSS OOFF NNEEEEDD::
• Stagnating or decreasing funding for services despite increase in need for services.
SSUUMMMMAARRYY OOFF KKEEYY FFUUNNDDIINNGG FFIINNDDIINNGGSS
• Funding was an issue raised in 15 interviews. There was great concern expressed regarding the “tidal wave” in the aging population (including baby boomers and frail elderly persons), resulting in the need for increased services. Concern was also raised regarding the frequent funding cuts that services experience. Common themes that emerged regarding funding include:
− Inconsistent federal, state, and local funding streams.
− Decrease in funding for services while the number of older adults is increasing.
− Cutbacks in funding threaten the safety-net services that have a successful track record.
− Absence of secure funding.
− Lack of local control and the existence of too much top-down funding.
− Lack of adequate funding to keep community-based organizations functioning to meet the needs of at-risk seniors.
− Concern that City programs are moving to a fee-based model.
− Possibility of impending staff layoffs related to funding cuts that would result in further reduced services.
AARREEAA OOFF NNEEEEDD:: FFUUNNDDIINNGG
There was great concern expressed regarding the “tidal wave” in the aging population (including baby boomers and frail elderly persons), resulting in the need for increased services.

COMMUNITY FOR A LIFETIMETEN-YEAR STRATEGIC PLAN 37
Section 4 Taking Action Strategies for Meeting the Needs of Older Adults in Santa Clara County
COMMUNITY FOR A LIFETIMETEN-YEAR STRATEGIC PLAN 37
SSEECCTTIIOONN 44 TTAAKKIINNGG AACCTTIIOONNSSTTRRAATTEEGGIIEESS FFOORR MMEEEETTIINNGG TTHHEE NNEEEEDDSS OOFF OOLLDDEERR AADDUULLTTSS IINN SSAANNTTAA CCLLAARRAA CCOOUUNNTTYY
In this section of the plan, we present our proposed strategies for addressing the ten most prominent needs of older adults in Santa Clara County, as identified in the Countywide Senior Needs Assessment.
The strategies presented here were developed primarily by 60 experts from Santa Clara County during a Strategy Development Session in the fall of 2004. Experts from relevant policy and service areas convened in workgroups to brainstorm and develop methods for addressing the needs identified in the Countywide Senior Needs Assessment. Some strategies were expanded upon during follow-up contact with workgroup representatives. Other strategies were developed from research on promising practices in the field of older adult services.
To be effective, these strategies will require partnerships among local government agencies and community-based organizations. The types of organizations needed to coordinate and lead the implementation of particular strategies are named in the subsequent section of this plan.
Below, we present the strategies by linking them to their related goals of the strategic plan, the needs they have been developed to address, and the objectives they aim to achieve.

SECTION 4
COMMUNITY FOR A LIFETIMETEN-YEAR STRATEGIC PLAN 38
FFOOCCUUSS OOFF NNEEEEDD:: Lack of affordable housing
OOBBJJEECCTTIIVVEE HH11:: Increase seniors’ accessibility to affordable housing.
SSEERRVVIICCEE SSTTRRAATTEEGGIIEESS::
HH 11..11 Introduce a rental subsidy program for the county’s most economically vulnerable older adults—those with annual incomes of $12,000 or less—so that these seniors pay no more than 30 percent of their monthly income on rent. Administer the subsidy program through a private nonprofit organization, such as the Housing Trust of Santa Clara County.
HH 11..22 Designate a portion of public land for the development of subsidized rental housing units for very low-income seniors—those with annual incomes of $12,000 or less.
FFOOCCUUSS OOFF NNEEEEDD:: Lack of affordable home repair.
OOBBJJEECCTTIIVVEE HH22:: Increase availability of affordable home repair.
SSEERRVVIICCEE SSTTRRAATTEEGGYY::
HH 22..11 Institute a senior home repair consortium that offers a single point of entry for clients to access a variety of home repair-related services. Service partners might include organizations such as Youth Build, Rebuilding Together, the Housing Industry Foundation, Tri-County Apartment Industry, city and county government programs, and other community-based organizations. Offer a sliding-scale fee-for-service model.
ESSENTIAL NEEDS
AARREEAA OOFF NNEEEEDD:: HHOOUUSSIINNGG
GGOOAALL 11:: EENNSSUURREE TTHHAATT OOLLDDEERR AADDUULLTTSS’’ EESSSSEENNTTIIAALL NNEEEEDDSS AARREE MMEETT..

SECTION 4
COMMUNITY FOR A LIFETIMETEN-YEAR STRATEGIC PLAN 39
FFOOCCUUSS OOFF NNEEEEDD:: Lack of information about how to access services.
OOBBJJEECCTTIIVVEE II 11:: Increase access to information about services for older adults and their care networks.
SSEERRVVIICCEE SSTTRRAATTEEGGIIEESS::
II 11..11 Support the United Way’s development of a “2-1-1” phone service—modeled, in part, after “4-1-1” and “9-1-1.” Ensure that the service provides a single point of contact for information, referral, and assistance regarding services for older adults and their care networks in Santa Clara County. Trained staff are equipped to respond to calls by assessing callers’ needs, identifying appropriate next steps for resolving the need, and connecting the caller to service organizations or other relevant resources. Inform Santa Clara County’s development process by researching 2-1-1 models already operating in other states.
II 11..22 Conduct an education campaign about information and assistance resources for seniors in Santa Clara County. Train volunteer teams to disseminate the information to community leaders and organizations that interact with seniors and their care networks.
II 11..33 Increase distribution of the Senior Services Directory. Currently, seniors can obtain the directory by purchasing it from the Council on Aging of Silicon Valley at its office or through its Web site. Develop a more proactive approach to distribution that brings the directory to seniors rather than relying on seniors to seek out the directory. Consider alternative strategies—and their costs—such as delivering the directory to homes of seniors, advertising it to informal caregivers of seniors, or selling the directory at locations where seniors or their caregivers are likely to visit—such as at pharmacies. Develop agreements with pharmacies to place the directory at their counters for high visibility.
II 11..44 Promote the use of the “networkofcare.org” Web site through the media, staff and volunteer training, dedicated kiosks at senior centers, etc.
II 11..55 Include a page on the Web site of each city government in Santa Clara County that explains city-sponsored resources available to seniors and their caregivers, as well as links to
AARREEAA OOFF NNEEEEDD:: IINNFFOORRMMAATTIIOONN

SECTION 4
COMMUNITY FOR A LIFETIMETEN-YEAR STRATEGIC PLAN 40
other relevant Web sites, such as the “networkofcare.org” Web site that offers a countywide directory of senior-related services. As the phone survey showed, today’s younger older adults use the Internet at much higher rates than older seniors. These younger seniors will carry this comfort with technology into their later years, and the Internet will become a more common tool for seniors’ communication and information.
FFOOCCUUSS OOFF NNEEEEDD:: More prevalent lack of information about services for older adults who do not speak English as a primary language.
OOBBJJEECCTTIIVVEE LL11:: Reduce language barriers to accessing information about
services for older adults and their care networks.
SSEERRVVIICCEE SSTTRRAATTEEGGIIEESS::
LL 11..11 Conduct a collaborative and culturally competent information campaign that informs seniors who are not English proficient about resources that are available to them. In the first year, pilot the strategy in three or four ethnic communities in Santa Clara County by training community leaders and organizations to conduct outreach to their senior populations about available resources and translate resource materials.
L 1.2 Develop culturally competent public service announcements in languages other than English that introduce senior-relevant resources and services to different ethnic and language-specific communities. Disseminate messages through targeted media outlets—including community newspapers, radio stations, and television stations.
AARREEAA OOFF NNEEEEDD:: LLAANNGGUUAAGGEE
The Internet will become a more common tool for seniors’ communication and information.

SECTION 4
COMMUNITY FOR A LIFETIMETEN-YEAR STRATEGIC PLAN 41
INDEPENDENCE
FFOOCCUUSS OOFF NNEEEEDD:: Limited availability of paratransit services.
OOBBJJEECCTTIIVVEE TT11:: Increase availability of paratransit services for older adults.
SSEERRVVIICCEE SSTTRRAATTEEGGIIEESS::
TT 11..11 Institute a subsidized taxi service similar to those offered in many cities across the country. City governments contract with taxi companies to provide discounted rides to adults 60 years of age and older. Consider offering greater taxi discounts to lower-income seniors, as is done in some cities. Methods of payment by senior riders could include cash-per-trip, use of taxi scrips, and prepaid debit cards for taxi service.
TT 11..22 Implement a program that coordinates volunteer or paid drivers to transport older adults to medical appointments, shopping, and other errands. Best practice research suggests potential service models such as the Transportation Reimbursement and Information Program in Riverside, California or West Austin Caregivers of Austin, Texas.
TT 11..33 Examine the feasibility of broadening the eligibility criteria and easing the enrollment process for participation in the Valley Transportation Authority’s paratransit program. According to some sources, roughly 60 percent of applicants have been declined since new eligibility criteria were established.
TT 11..44 Advocate that California apply for State Coordination Grants through the new federal “United We Ride” Initiative. The Federal Department of Transportation—in partnership with the Department of Health and Human Services, Department of Labor, and Department of Education—kicked off the initiative in February 2004. State Coordination Grants provide funding to states to help break down barriers between transit and human services programs and set the stage for local partnerships that generate transit solutions.
GGOOAALL 22:: MMAAXXIIMMIIZZEE OOLLDDEERR AADDUULLTTSS’’ IINNDDEEPPEENNDDEENNCCEE..
AARREEAA OOFF NNEEEEDD:: TTRRAANNSSPPOORRTTAATTIIOONN

SECTION 4
COMMUNITY FOR A LIFETIMETEN-YEAR STRATEGIC PLAN 42
FFOOCCUUSS OOFF NNEEEEDD:: Lack of assistance boarding public transit.
OOBBJJEECCTTIIVVEE TT22:: Increase assistance to older adults when boarding public transit.
SSEERRVVIICCEE SSTTRRAATTEEGGIIEESS::
TT 22..11 Implement a “bus buddy” volunteer program in which volunteers assist seniors getting on and off the bus.
TT 22..22 Institute a policy on public buses that drivers assist riders on and off the bus when needed. Conduct sensitivity training for bus drivers to better detect the need for assistance entering and departing from the bus and other needs of senior riders.
TT 22..33 Examine and institute technology and vehicle design changes that would assist seniors in boarding and exiting buses.
FFOOCCUUSS OOFF NNEEEEDD:: Limited access to public transportation.
OOBBJJEECCTTIIVVEE TT33:: Increase older adults’ access to public transportation.
SSEERRVVIICCEE SSTTRRAATTEEGGIIEESS::
TT 33..11 Provide multi-lingual training to older adults about public transit, such as how to read schedules, plan a trip, where to catch the bus, how to pay the fare, how to use transfers, and how to use special features like lifts and kneelers. In many cities, these programs are provided by volunteers. Best practice research suggests potential service models such as that used by the Napa County Transportation Planning Agency, which coordinates a team of volunteer “Transit Ambassadors” who provide this training.
TT 33..22 Institute a shuttle program or taxi service that connects seniors to central transit systems.
TT 33..33 Place bus stops in strategic locations within close proximity of senior centers as a convenient point of entry for seniors in need of public transportation.

SECTION 4
COMMUNITY FOR A LIFETIMETEN-YEAR STRATEGIC PLAN 43
FFOOCCUUSS OOFF NNEEEEDD:: Lack of coordinated transportation among senior centers.
OOBBJJEECCTTIIVVEE TT44:: Increase coordination of transportation among senior centers.
SSEERRVVIICCEE SSTTRRAATTEEGGIIEESS::
TT 44..11 Develop shuttle services that transport older adults between senior centers and from senior centers to local destinations for shopping, medical appointments, and other errands.
TT 44..22 Conduct a targeted review of seniors’ desires and needs pertaining to coordinated transportation among senior centers to determine the exact nature of the transportation problems related to travel to and between senior centers and the most responsive strategies for meeting those needs.
FFOOCCUUSS OOFF NNEEEEDD:: Shortage of affordable in-home care services.
OOBBJJEECCTTIIVVEE IICC11:: Increase availability of affordable in-home care services.
SSEERRVVIICCEE SSTTRRAATTEEGGIIEESS::
IICC 11..11 Expand eligibility criteria of Santa Clara County’s In-Home Supportive Services (IHSS) program by advocating to raise the income threshold allowable under the program.
AARREEAA OOFF NNEEEEDD:: IINN--HHOOMMEE CCAARREE
SECTION 4
COMMUNITY FOR A LIFETIMETEN-YEAR STRATEGIC PLAN 44
IICC 11..22 Expand access to in-home care services to adults with moderate incomes by developing a program that is modeled after IHSS and that partially offsets program costs by requiring participants to pay a fee for services, using a sliding scale.
FFOOCCUUSS OOFF NNEEEEDD:: Lack of care management services.
OOBBJJEECCTTIIVVEE IICC22:: Increase availability of care management services.
SSEERRVVIICCEE SSTTRRAATTEEGGIIEESS::
IICC 22..11 Utilize senior centers as resource centers that promote self-managed care. Through literature and informed staff, educate seniors and their families about how to function as their own care coordinators. Information could include how to choose an in-home service provider, the services that comprise personal care programs, and how to prevent unscrupulous individuals from exploiting seniors.
IICC 22..22 Conduct a performance review of personal care programs and care management programs to identify efficiencies that could be gained and used to deliver services to more seniors in need.
IICC 22..33 Produce a report card about personal care programs, which could have the dual purpose of helping consumers make more informed choices and incentivizing programs to provide high-quality and cost-efficient care.
Aging - By the Numbers
Only 1.56 million (4.5%) of the 65-plus population in the United States lived in nursing homes in 2000. While this number is relatively small, the percentage rises steeply with age (1.1 percent for persons 65-74, 4.7 percent for persons 75-84 and 18.2 percent for persons 85 and older).
2000 U.S. Census

SECTION 4
COMMUNITY FOR A LIFETIMETEN-YEAR STRATEGIC PLAN 45
FFOOCCUUSS OOFF NNEEEEDD:: Lack of support for older adults’ caregiving.
OOBBJJEECCTTIIVVEE CCSS11:: Increase access to caregiver support services.
SSEERRVVIICCEE SSTTRRAATTEEGGIIEESS::
CCSS 11..11 Increase working adults’ awareness of caregiver support opportunities through education campaigns targeted to workplaces. As baby boomers age over the next 10 to 20 years, they will feel the pressures of working and caring for loved ones and will, themselves, require more care from working family members and friends. Institute periodic seminars by aging service organizations to workplaces in Santa Clara County. Best practice research suggests potential service models such as that of the “Caring Workplace” employed by St. Andrew’s At-Home Services in Saint Louis, Missouri. The program works with business councils and business sponsors to educate employees about caregiver and elder care resources.
CCSS 11..22 Examine the geographic distribution and cultural competencies of adult day care centers in Santa Clara County to identify appropriate locations and underserved ethnic communities for expansion of adult day care services.
CCSS 11..33 Equip senior centers to be an “information and referral” resource where caregivers can learn about support and respite services in Santa Clara County.
CCSS 11..44 Ensure that information about caregiver support and respite services is included in the 2-1-1 information, referral, and assistance phone line for older adult services (see Strategy I 1.1).
CCSS 11..55 Support family caregivers through training on caregiving techniques and skills. Consider applying a “train-the-trainer” model in which master trainers teach volunteer health care and social service professionals to train groups of family caregivers in the community about needed caregiving and coping tools and resources. Best practice research suggests potential service models such as one employed by Mather Lifeways—a community-based organization in Evanston, Illinois that developed and implemented a caregiving train-the-trainer curriculum recognized by the Federal Administration on Aging.
AARREEAA OOFF NNEEEEDD:: CCAARREEGGIIVVEERR SSUUPPPPOORRTT

SECTION 4
COMMUNITY FOR A LIFETIMETEN-YEAR STRATEGIC PLAN 46
FFOOCCUUSS OOFF NNEEEEDD:: Lack of health professionals with gerontology/ geriatric training.
OOBBJJEECCTTIIVVEE HHCC11:: Increase the number of health professionals with gerontology/geriatric training.
SSEERRVVIICCEE SSTTRRAATTEEGGIIEESS::
HHCC 11..11 Evaluate the feasibility of specialized geriatrics training programs for physicians through a geriatric center in the South Bay Area, similar to the Geriatric Research, Education and Clinical Center (GRECC) model used at the Veterans Administration Hospital in Palo Alto. Ensure that the training incorporates clinical and social services content and emphasizes community and outpatient services and information in balance with the knowledge and skills that relate to inpatient services.
HHCC 11..22 Evaluate the feasibility of specialized gerontology training programs for all health care professionals through the geriatric center in the South Bay Area.
HHCC 11..33 Develop collaborations between local hospitals and area universities and colleges that train advanced practice nurses who specialize in care for older adults in the full continuum of health care settings and with programs providing training on epidemiologic trends in elder populations and effective public health interventions.
HHCC 11..44 Increase interest in geriatrics among clinicians as well as other health professionalssuch as nurses and social workersto encourage new professionals to pursue this specialty option. Specifically, through the geriatric center cited in Strategy HC 1.1, provide an active program of continuing medical education (CME) for physicians and other health professionals on issues and care for elders.
GGOOAALL 33:: PPRROOMMOOTTEE OOLLDDEERR AADDUULLTTSS’’ HHEEAALLTTHH AANNDD WWEELLLLNNEESSSS..
HEALTH & WELLNESS
AARREEAA OOFF NNEEEEDD:: HHEEAALLTTHH CCAARREE

SECTION 4
COMMUNITY FOR A LIFETIMETEN-YEAR STRATEGIC PLAN 47
HHCC 11..55 Attract more professionals to geriatrics by increasing the visibility of Santa Clara County’s existing geriatric specialists. Specifically, highlight their work at area hospitals and clinics through advertising campaigns and news spotlights.
HHCC 11..66 Use the resources of the City of San José and Santa Clara County to promote private giving to support expansion and development of additional programs in area colleges and universities to train health professionals specializing in meeting the health and social service needs of elders.
HHCC 11..77 Support efforts at the state and federal levels to expand public funding for training of health professionals specializing in the needs of elders.
FFOOCCUUSS OOFF NNEEEEDD:: Poor linkages between health care and long-term care.
OOBBJJEECCTTIIVVEE HHCC22:: Strengthen linkages between health care and long-term care.
SSEERRVVIICCEE SSTTRRAATTEEGGIIEESS::
HHCC 22..11 Encourage collaboration among service and resource providers to enhance the coordination and effectiveness of discharge planning so that older adults receive appropriate care in the community upon discharge from area hospitals.
HHCC 22..22 Assess the feasibility of developing expanded outreach and enrollment for low-income seniors that may be dual-eligible but not enrolled in Medicare and Medi-Cal.
HHCC 22..33 Encourage private sector employers to offer long-term care insurance, not necessarily as a paid benefit, but to raise awareness about preparing for the care of aging family members.
HHCC 22..44 Increase community-based long-term care services—as already noted in other strategies—such as increased adult day care centers and expanded eligibility to in-home care programs modeled after the In-Home Supportive Services Program.

SECTION 4
COMMUNITY FOR A LIFETIMETEN-YEAR STRATEGIC PLAN 48
COMMUNITY ENGAGEMENT
FFOOCCUUSS OOFF NNEEEEDD:: Desire for senior centers to provide access to information and assistance services, including legal assistance, and management and coordination services for people who need in-home care or assisted living.
OOBBJJEECCTTIIVVEE SSCC11:: Increase the number of senior centers that provide access to information and assistance services, including legal assistance, and management and coordination services for people who need in-home care or assisted living.
SSEERRVVIICCEE SSTTRRAATTEEGGIIEESS::
SSCC 11..11 Restore full-time staff at senior centers including those who provide information and assistance, legal assistance, and management and coordination of programs services. These programs were severely impacted by the budget reductions most cities had to take in fiscal years 2002-03 and 2003-04. Most centers lost highly trained paid staff who provided most of the “linkages” to needed services.
SSCC 11..22 Develop competency standards and training for senior center volunteers. Faced with serious budget reductions, many centers have turned to volunteers to provide services once handled by paid staff. Unfortunately, volunteers rarely receive the same level of training as staff and vary widely in their ability to provide services such as information and referral.
SSCC 11..33 Ensure that services offered at senior centers are included in the 2-1-1 information, referral, and assistance phone line (see Strategy I 1.1).
GGOOAALL 44:: EENNCCOOUURRAAGGEE OOLLDDEERR AADDUULLTTSS’’ CCOOMMMMUUNNIITTYY EENNGGAAGGEEMMEENNTT..
AARREEAA OOFF NNEEEEDD:: SSEENNIIOORR CCEENNTTEERR PPRROOGGRRAAMMSS

SECTION 4
COMMUNITY FOR A LIFETIMETEN-YEAR STRATEGIC PLAN 49
FFOOCCUUSS OOFF NNEEEEDD:: Need for senior centers to prepare to serve the disparate interests of baby boomers and older seniors.
OOBBJJEECCTTIIVVEE SSCC22:: Improve senior centers’ capacity to serve the disparate interests of baby boomers and older seniors.
SSEERRVVIICCEE SSTTRRAATTEEGGIIEESS::
SSCC 22..11 Conduct a baby boomer interest assessment to help prepare senior centers and senior services for baby boomers’ entrance into “senior status” over the next ten years. Identify the ways in which this generation’s needs and interests will be similar to and different from today’s youngest seniors.
SSCC 22..22 Incorporate “universal design concepts” into new city government, county government, and senior center facilities to assist adults as they age. Examples of these designs include wider walkways, increased lighting, larger print signs, grab bars in hallways and restrooms, ramps, and automatic doors. Some, but not all, of these features are required by the Americans with Disabilities Act.
SSCC 22..33 Provide a “bundling of services” near senior center locations that appeal to a broad continuum of older adults. For example, create “one-stop” destinations that include ATMs, coffee shops, public transit information, fitness centers, adult day care centers, libraries, community services, as well as senior center programs.
SSCC 22..44 Expand and market services at senior centers to attract and appeal to younger seniors’ discrete interests and levels of activity. The phone survey and other studies have shown that computer classes, fitness, and travel programs are among the top priorities of younger seniors.
Studies have shown that computer classes, fitness, and travel programs are among the top priorities of younger seniors

SECTION 4
COMMUNITY FOR A LIFETIMETEN-YEAR STRATEGIC PLAN 50
RESOURCES
FFOOCCUUSS OOFF NNEEEEDD:: Lack of coordinated leadership and advocacy for aging services.
OOBBJJEECCTTIIVVEE LLCC11:: Create a formalized leadership structure that improves the coordination, prioritization, and funding of aging services.
SSEERRVVIICCEE SSTTRRAATTEEGGIIEESS::
LLCC 11..11 Develop and convene a team of public and private partner organizations to ensure that steps are taken to present the strategic plan and jumpstart its implementation upon approval of the plan by the San José City Council and Santa Clara County Board of Supervisors. Steps would include but not be limited to: organizing and underwriting a community-wide event to announce the plan, sharing responsibility for early implementation strategies, ensuring that the plan’s strategies build momentum from the impetus of the plan’s approval and announcement, and securing funding for a staff person to coordinate the full implementation of the plan.
LLCC 11..22 The team cited in Service Strategy LC 1.1 will facilitate the process of establishing a permanent Leadership Group, comprised of executives of major private and public funders of aging programs and services. Responsibilities of the Leadership Group will include ensuring implementation of the recommendations of the strategic plan, recommending and implementing strategies for expanded community leadership and visibility of issues of aging, and improving coordination of services and funding. Particular attention will be given to the recommendations of the Service Coordination and Advocacy Group (see Strategy LC 1.5).
GGOOAALL 55:: LLEEVVEERRAAGGEE AANNDD OOPPTTIIMMIIZZEE RREESSOOUURRCCEESS TTHHAATT SSEERRVVEE OOLLDDEERR AADDUULLTTSS..
AARREEAA OOFF NNEEEEDD:: LLEEAADDEERRSSHHIIPP AANNDD CCOOOORRDDIINNAATTIIOONN

SECTION 4
COMMUNITY FOR A LIFETIMETEN-YEAR STRATEGIC PLAN 51
LLCC 11..33 The Leadership Group will demonstrate their coordination responsibilities by unifying the funding applications, expectations for outcomes, and funding decisions for aging programs and services, ensuring that the new unified process is simpler and more streamlined than the current multiple processes. Contracts will be administered jointly.
LLCC 11..44 The Leadership Group will assess the feasibility of the creation of a Joint Powers Authority for ongoing funding and coordination of aging programs and services. Purposes of the Joint Powers Authority would be to utilize coordinated funding decisions to support and enhance coordination, to eliminate duplication of aging services, to alleviate fragmentation, and to identify ways to fill gaps in services.
LLCC 11..55 The Leadership Group will convene a separate organization, the Service Coordination and Advocacy Group, which will encompass the current senior advisory bodies to the San José City Council and the Santa Clara County Board of Supervisors, leaders of senior organizations and heads of key providers of aging services. The purposes of the Service Coordination and Advocacy Group include: 1) providing regular opportunities for all public and private service providers to exchange information and conduct ongoing planning for aging services with one another and with representatives of consumer and advocacy organizations; 2) improving coordination among city, county, and community-based organizations; 3) eliminating duplication of aging services; 4) alleviating fragmentation; and 5) identifying ways to fill gaps in services.

SECTION 4
COMMUNITY FOR A LIFETIMETEN-YEAR STRATEGIC PLAN 52
LLCC 11..66 The Service Coordination and Advocacy Group will develop a coordinated advocacy network charged with accomplishing the following, at a minimum:
• Educating the community about a broad range of aging issues, increasing awareness about older persons, their contributions to the community as well as their needs, and about services available to assist them.
• Building close partnerships with every local elected official to ensure thorough understanding and advocacy for aging issues.
• Organizing a team of advocates who proactively and persistently advocate within the city and county governments of Santa Clara County. This team identifies every agency and committee that engages in any activities that should coordinate with or be responsive to older persons. The team then identifies ways to connect older persons with those services, either by adapting the services for older persons and/or informing older persons about the services. The result is that aging issues and responsiveness to them are embedded in all programs, services and activities of all local governments as well as in all citizens’ committees, and in the decisions and actions of staff and elected officials.
• Creating and train a team of at least five advocates to be highly visible spokespersons for aging issues.
• Organizing citizen advocates with local elected officials to identify priority issues for aging and together, present them to state officials.
Aging - By the Numbers
In 2000, 28 percent of adults aged 65 and over lived alone. The likelihood of living alone increased with age to 38.9 percent for those 85 and older.
2000 U.S. Census

SECTION 4
COMMUNITY FOR A LIFETIMETEN-YEAR STRATEGIC PLAN 53
FFOOCCUUSS OOFF NNEEEEDD:: Decrease in funding for aging services despite increase in need for those services.
OOBBJJEECCTTIIVVEE FF11:: Increase funding for service strategies that impact older adults’ most prominent needs.
HHOOUUSSIINNGG FFUUNNDDIINNGG SSTTRRAATTEEGGIIEESS::
HHFF 11..11 Seek funding from the State HOME Tenant Based Rental Assistance Program for the senior rental subsidy program through a joint powers agreement among the cities of Santa Clara County and the county. Jurisdictions would apply to the state’s HOME Fund for needed funding and solicit corporate funding. Jurisdictions would form a joint powers agreement as a vehicle to distribute funds raised and contract with an agency such as Housing Authority to operate the program.
HHFF 11..22 Obtain vacant land at no cost from Valley Transportation Authority and other governmental sources for the nonprofit development of low-income senior housing. Finance construction through the Housing Trust of Santa Clara County and other governmental and nongovernmental funds available. Seek funding for construction grants and loans from private corporations, tax credits, or bonds.
HHFF 11..33 Fund the home repair consortium through fee-for-service revenue, grants, and contributions from public and private partners, such as the Community Development Block Grant Fund, the state’s HOME Fund, from industry leaders, and corporations. Consider marketing to insurance companies for financial support of the consortium.
IINNFFOORRMMAATTIIOONN FFUUNNDDIINNGG SSTTRRAATTEEGGIIEESS::
IIFF 11..11 Incorporate funding for 2-1-1 in the United Way budgeting process. Seek state appropriations for 2-1-1 statewide. Consider seeking state approval for a small (less than $1 per customer, per month) tax on all telephone bills to fund 2-1-1 statewide, similar to taxes some states have to fund 9-1-1. Assess fees for additional services such as client assessments or care management.
AARREEAA OOFF NNEEEEDD:: FFUUNNDDIINNGG

SECTION 4
COMMUNITY FOR A LIFETIMETEN-YEAR STRATEGIC PLAN 54
IIFF 11..22 Include funds for public education/marketing in the United Way 2-1-1 budget.
IIFF 11..33 Solicit private and public funding for increased production and distribution of the Senior Services Directory.
LLAANNGGUUAAGGEE FFUUNNDDIINNGG SSTTRRAATTEEGGIIEESS::
LLFF 11..11 Seek Older Americans Act funding from the Council on Aging for these training and outreach activities. Coordinate with United Way 2-1-1 funding.
LLFF 11..22 Seek Older Americans Act funding from the Council on Aging for these training and outreach activities.
TTRRAANNSSPPOORRTTAATTIIOONN FFUUNNDDIINNGG SSTTRRAATTEEGGIIEESS::
TTFF 11..11 Seek additional funding sources for the Valley Transportation Authority.
TTFF 11..22 Seek funding for volunteer services from the Older Americans Act through the Council on Aging. Training, policy changes, and other direct services should be financed by the Valley Transportation Authority. Private/public partnerships with technology and design companies can be developed to redesign transportation equipment to improve its accessibility.
SECTION 4
COMMUNITY FOR A LIFETIMETEN-YEAR STRATEGIC PLAN 55
IINN--HHOOMMEE CCAARREE FFUUNNDDIINNGG SSTTRRAATTEEGGIIEESS::
IICCFF 11..11 Seek additional funding from the federal Centers for Medicare and Medicaid Services.
IICCFF 11..22 Work through the Leadership Group to influence national and state leaders to expand federal funding to serve a greater number of older persons in their homes.
IICCFF 11..33 Fund the private pay in-home care model through clients’ share of cost and subsidies from local and state, public and private sources.
IICCFF 11..44 Seek funds from cities to increase senior centers’ ability to educate seniors and their families about self-managed care.
Aging - By the Numbers
CCAARREEGGIIVVEERR SSUUPPPPOORRTT FFUUNNDDIINNGG SSTTRRAATTEEGGIIEESS::
CCSSFF 11..11 Seek additional funding from the National Family Caregiver Support Program through the federal Administration on Aging and the Council on Aging of Silicon Valley.
The reported median income in 2000 for persons 65 and older was $13,769 with an average of $19,168 in earnings for men and $10,899 for women. The major sources of income as reported by the Social Security Administration for the 65-plus population were Social Security (38% of aggregate income), earnings (21%), income from assets (20%), and public/private pensions (19%).
U.S. Bureau of Labor Statistics
SECTION 4
COMMUNITY FOR A LIFETIMETEN-YEAR STRATEGIC PLAN 56
HHEEAALLTTHH CCAARREE FFUUNNDDIINNGG SSTTRRAATTEEGGIIEESS::
HHCCFF 11..11 Develop a private/public partnership that includes the Santa Clara Valley Health and Hospital System to approach the John A. Hartford Foundation in New York for funding and other resources such as training curricula and technical assistance.
HHCCFF 11..22 Expand the partnership to include San José State University and focus on gerontological nursing and gerontological social work and contact the John A. Hartford Foundation for resources in those areas. Consider Robert Wood Johnson Foundation funding for these areas as well.
SSEENNIIOORR CCEENNTTEERR PPRROOGGRRAAMM FFUUNNDDIINNGG SSTTRRAATTEEGGIIEESS::
SSCCFF 11..11 Tie funding for information and referral services to the 2-1-1 system and United Way funding. Seek funding to support legal assistance and case management from the Council on Aging, cities, the county, and United Way.
SSCCFF 11..22 Seek local government funding for senior center facilities and planning. Encourage the Council on Aging to fund the study of baby boomer needs as part of their planning responsibilities under the Older Americans Act.
LLEEAADDEERRSSHHIIPP AANNDD CCOOOORRDDIINNAATTIIOONN FFUUNNDDIINNGG SSTTRRAATTEEGGIIEESS::
LLCCFF 11..11 Seek private and public funding from the partner organizations that kick off strategic plan implementation and from members of the Leadership Group.

Section 5
Strategy
Implementation
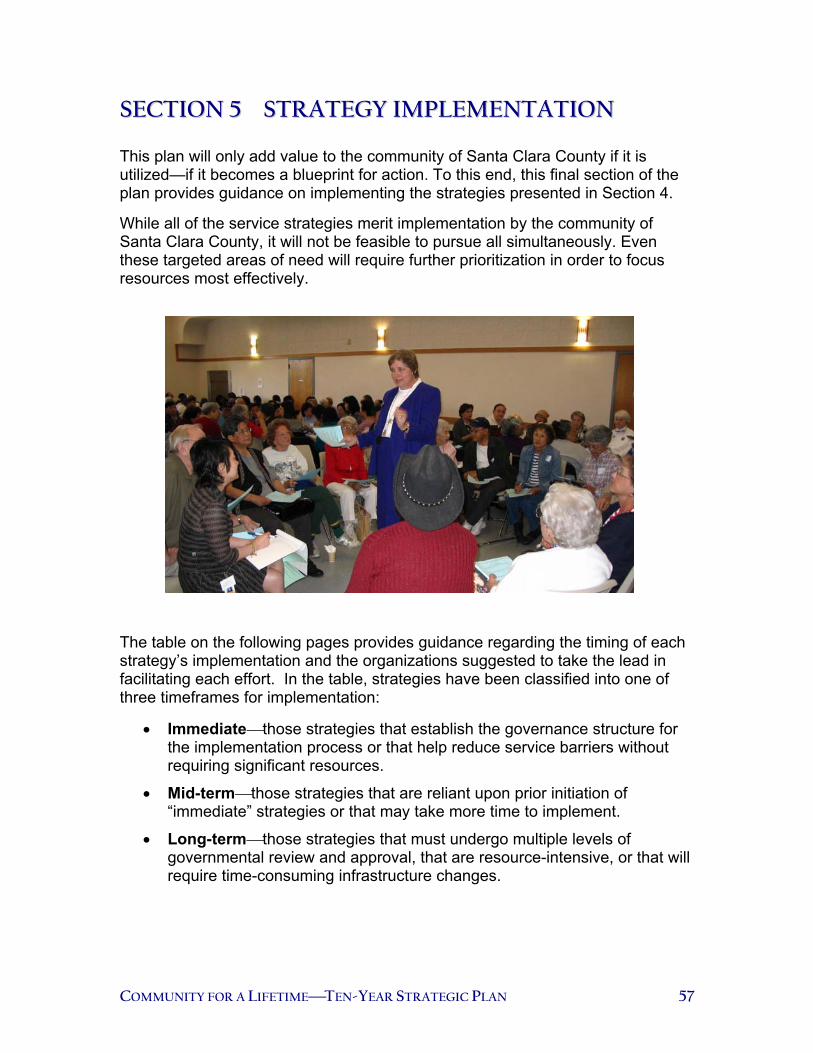
COMMUNITY FOR A LIFETIMETEN-YEAR STRATEGIC PLAN 57
SSEECCTTIIOONN 55 SSTTRRAATTEEGGYY IIMMPPLLEEMMEENNTTAATTIIOONN
This plan will only add value to the community of Santa Clara County if it is utilized—if it becomes a blueprint for action. To this end, this final section of the plan provides guidance on implementing the strategies presented in Section 4.
While all of the service strategies merit implementation by the community of Santa Clara County, it will not be feasible to pursue all simultaneously. Even these targeted areas of need will require further prioritization in order to focus resources most effectively.
The table on the following pages provides guidance regarding the timing of each strategy’s implementation and the organizations suggested to take the lead in facilitating each effort. In the table, strategies have been classified into one of three timeframes for implementation:
• Immediatethose strategies that establish the governance structure for the implementation process or that help reduce service barriers without requiring significant resources.
• Mid-termthose strategies that are reliant upon prior initiation of “immediate” strategies or that may take more time to implement.
• Long-termthose strategies that must undergo multiple levels of governmental review and approval, that are resource-intensive, or that will require time-consuming infrastructure changes.

SECTION 5
COMMUNITY FOR A LIFETIMETEN-YEAR STRATEGIC PLAN 58
NNEEXXTT SSTTEEPPSS As the implementation table indicates, the Leadership and Coordination strategies must be implemented first—these form the infrastructure for coordinated and effective implementation of all other strategies. A small team will need to take responsibility to jumpstart the process and help to convene a Leadership Group of funders and policy makers, and a Service Coordination and Advocacy Group that represents a broad coalition of organizations that serve older adults and their families in Santa Clara County. This governance and advocacy structure must be coordinated and countywide—one that pulls together the disparate efforts and commissions currently in effect throughout Santa Clara Countyso that service fragmentation is minimized. This structure would make joint funding decisions, advocate a common platform, share information on emerging and existing service needs, and draw in partners to implement the plan’s strategies. Perhaps the most pervasive theme that surfaced from the input of over 1,100 Santa Clara County community members was that the service providers of this county—public and private alike—care deeply about the well-being of their older adult members. Implementing this plan, through a coordinated and collaborative infrastructure, will leverage and optimize that dedication and commitment. You are never too old – Consider these famous examples:
George Burns won his first Oscar at age 80.
Golda Meir was 71 when she became Prime Ministerof Israel.
Painter Grandma Moses didn’t start painting until she was over 80. She completed more than 1500 paintings, 25% of those were produced when she was over 100.
Michelangelo was 71 when he painted the Sistine Chapel.
Casey Stengel didn’t retire from managing the New York Mets until he was 75.
Albert Schweitzer was still performing operations in his African hospital at age 89.
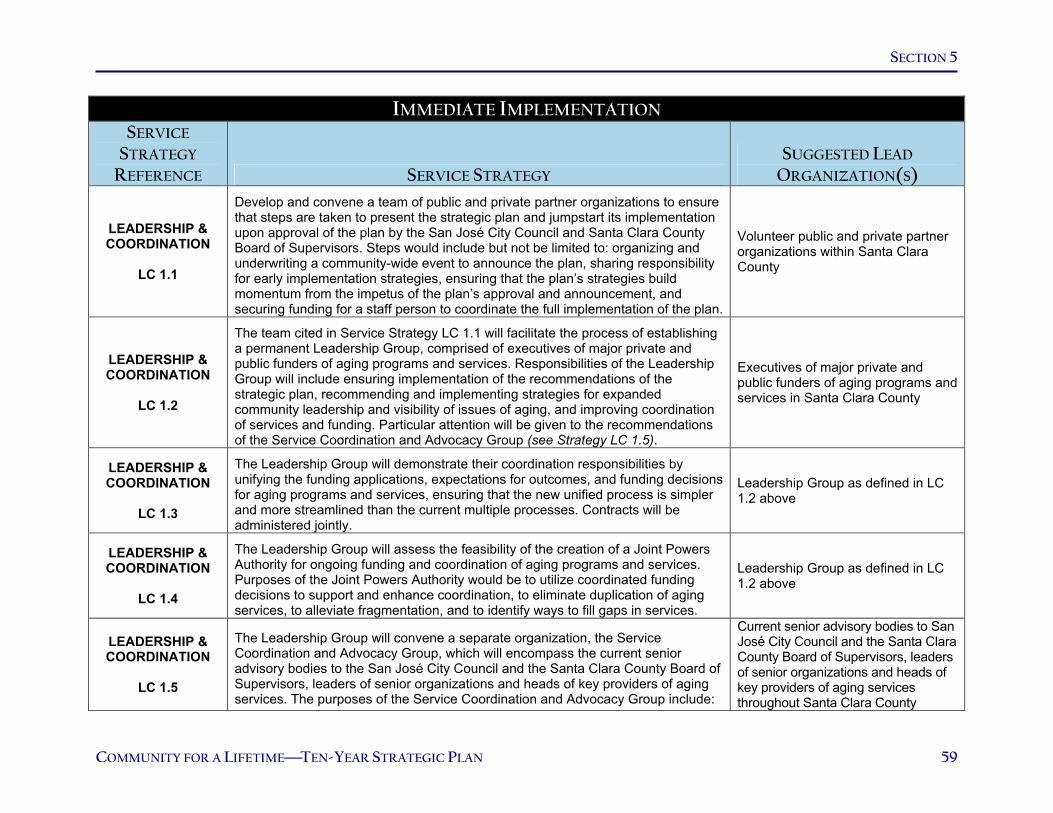
SECTION 5
COMMUNITY FOR A LIFETIMETEN-YEAR STRATEGIC PLAN 59
IMMEDIATE IMPLEMENTATION SERVICE
STRATEGY
REFERENCE SERVICE STRATEGY SUGGESTED LEAD
ORGANIZATION(S)
LEADERSHIP & COORDINATION
LC 1.1
Develop and convene a team of public and private partner organizations to ensure that steps are taken to present the strategic plan and jumpstart its implementation upon approval of the plan by the San José City Council and Santa Clara County Board of Supervisors. Steps would include but not be limited to: organizing and underwriting a community-wide event to announce the plan, sharing responsibility for early implementation strategies, ensuring that the plan’s strategies build momentum from the impetus of the plan’s approval and announcement, and securing funding for a staff person to coordinate the full implementation of the plan.
Volunteer public and private partner organizations within Santa Clara County
LEADERSHIP & COORDINATION
LC 1.2
The team cited in Service Strategy LC 1.1 will facilitate the process of establishing a permanent Leadership Group, comprised of executives of major private and public funders of aging programs and services. Responsibilities of the Leadership Group will include ensuring implementation of the recommendations of the strategic plan, recommending and implementing strategies for expanded community leadership and visibility of issues of aging, and improving coordination of services and funding. Particular attention will be given to the recommendations of the Service Coordination and Advocacy Group (see Strategy LC 1.5).
Executives of major private and public funders of aging programs and services in Santa Clara County
LEADERSHIP & COORDINATION
LC 1.3
The Leadership Group will demonstrate their coordination responsibilities by unifying the funding applications, expectations for outcomes, and funding decisions for aging programs and services, ensuring that the new unified process is simpler and more streamlined than the current multiple processes. Contracts will be administered jointly.
Leadership Group as defined in LC 1.2 above
LEADERSHIP & COORDINATION
LC 1.4
The Leadership Group will assess the feasibility of the creation of a Joint Powers Authority for ongoing funding and coordination of aging programs and services. Purposes of the Joint Powers Authority would be to utilize coordinated funding decisions to support and enhance coordination, to eliminate duplication of aging services, to alleviate fragmentation, and to identify ways to fill gaps in services.
Leadership Group as defined in LC 1.2 above
LEADERSHIP & COORDINATION
LC 1.5
The Leadership Group will convene a separate organization, the Service Coordination and Advocacy Group, which will encompass the current senior advisory bodies to the San José City Council and the Santa Clara County Board of Supervisors, leaders of senior organizations and heads of key providers of aging services. The purposes of the Service Coordination and Advocacy Group include: 1) idi l t iti f ll bli d i t i id t
Current senior advisory bodies to San José City Council and the Santa Clara County Board of Supervisors, leaders of senior organizations and heads of key providers of aging services throughout Santa Clara County

SECTION 5
COMMUNITY FOR A LIFETIMETEN-YEAR STRATEGIC PLAN 60
IMMEDIATE IMPLEMENTATION SERVICE
STRATEGY
REFERENCE SERVICE STRATEGY SUGGESTED LEAD
ORGANIZATION(S) 1) providing regular opportunities for all public and private service providers to exchange information and conduct ongoing planning for aging services with one another and with representatives of consumer and advocacy organizations; 2) improving coordination among city, county, and community-based organizations; 3) eliminating duplication of aging services; 4) alleviating fragmentation; and 5) identifying ways to fill gaps in services.
HOUSING
H 2.1
Institute a senior home repair consortium that offers a single point of entry for clients to access a variety of home repair-related services. Service partners might include organizations such as Youth Build, Rebuilding Together, the Housing Industry Foundation, Tri-County Apartment Industry, city and county government programs, and other community-based organizations. Offer a sliding-scale fee-for-service model.
Youth Build, Rebuilding Together, the Housing Industry Foundation, Tri-County Apartment Industry, and other private and public housing service organizations as coordinated through the Service Coordination and Advocacy Group
INFORMATION
I 1.1
Support the United Way’s development of a “2-1-1” phone service—modeled, in part, after “4-1-1” and “9-1-1.” Ensure that the service provides a single point of contact for information, referral, and assistance regarding services for older adults and their care networks in Santa Clara County. Trained staff are equipped to respond to calls by assessing callers’ needs, identifying appropriate next steps for resolving the need, and connecting the caller to service organizations or other relevant resources. Inform Santa Clara County’s development process by researching 2-1-1 models already operating in other states.
United Way of Silicon Valley, and all aging services organizations as represented by the Leadership Group and Service Coordination and Advocacy Group
INFORMATION
I 1.2
Conduct an education campaign about information and assistance resources for seniors in Santa Clara County. Train volunteer teams to disseminate the information to community leaders and organizations that interact with seniors and their care networks.
Council on Aging as lead trainer; all service organizations and community leaders willing to volunteer to disseminate; coordinated through the Service Coordination and Advocacy Group
INFORMATION
I 1.3
Increase distribution of the Senior Services Directory. Currently, seniors can obtain the directory by purchasing it from the Council on Aging of Silicon Valley at its office or through its Web site. Develop a more proactive approach to distribution that brings the directory to seniors rather than relying on seniors to seek out the directory. Consider alternative strategies—and their costs—such as delivering the directory to homes of seniors, advertising it to informal caregivers of seniors, or selling the directory at locations
Council on Aging in concert with other member organizations of the Service Coordination and Advocacy Group
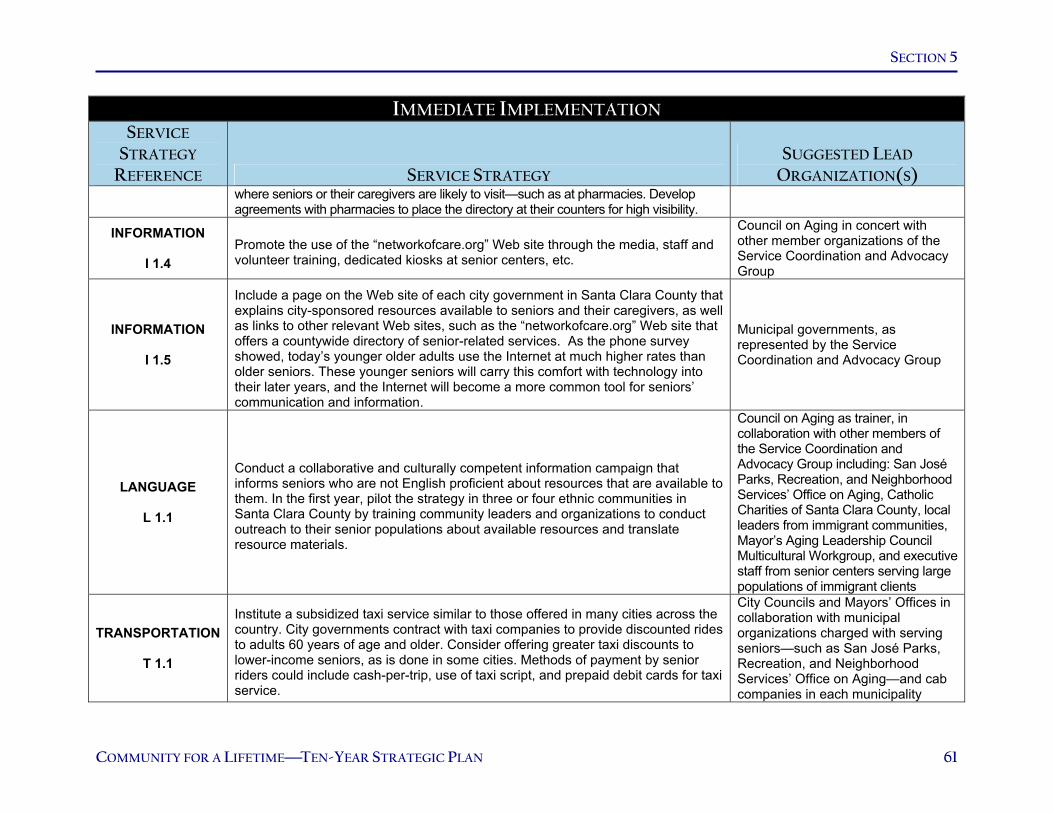
SECTION 5
COMMUNITY FOR A LIFETIMETEN-YEAR STRATEGIC PLAN 61
IMMEDIATE IMPLEMENTATION SERVICE
STRATEGY
REFERENCE SERVICE STRATEGY SUGGESTED LEAD
ORGANIZATION(S) where seniors or their caregivers are likely to visit—such as at pharmacies. Develop agreements with pharmacies to place the directory at their counters for high visibility.
INFORMATION
I 1.4 Promote the use of the “networkofcare.org” Web site through the media, staff and volunteer training, dedicated kiosks at senior centers, etc.
Council on Aging in concert with other member organizations of the Service Coordination and Advocacy Group
INFORMATION
I 1.5
Include a page on the Web site of each city government in Santa Clara County that explains city-sponsored resources available to seniors and their caregivers, as well as links to other relevant Web sites, such as the “networkofcare.org” Web site that offers a countywide directory of senior-related services. As the phone survey showed, today’s younger older adults use the Internet at much higher rates than older seniors. These younger seniors will carry this comfort with technology into their later years, and the Internet will become a more common tool for seniors’ communication and information.
Municipal governments, as represented by the Service Coordination and Advocacy Group
LANGUAGE
L 1.1
Conduct a collaborative and culturally competent information campaign that informs seniors who are not English proficient about resources that are available to them. In the first year, pilot the strategy in three or four ethnic communities in Santa Clara County by training community leaders and organizations to conduct outreach to their senior populations about available resources and translate resource materials.
Council on Aging as trainer, in collaboration with other members of the Service Coordination and Advocacy Group including: San José Parks, Recreation, and Neighborhood Services’ Office on Aging, Catholic Charities of Santa Clara County, local leaders from immigrant communities, Mayor’s Aging Leadership Council Multicultural Workgroup, and executive staff from senior centers serving large populations of immigrant clients
TRANSPORTATION
T 1.1
Institute a subsidized taxi service similar to those offered in many cities across the country. City governments contract with taxi companies to provide discounted rides to adults 60 years of age and older. Consider offering greater taxi discounts to lower-income seniors, as is done in some cities. Methods of payment by senior riders could include cash-per-trip, use of taxi script, and prepaid debit cards for taxi service.
City Councils and Mayors’ Offices in collaboration with municipal organizations charged with serving seniors—such as San José Parks, Recreation, and Neighborhood Services’ Office on Aging—and cab companies in each municipality

SECTION 5
COMMUNITY FOR A LIFETIMETEN-YEAR STRATEGIC PLAN 62
IMMEDIATE IMPLEMENTATION SERVICE
STRATEGY
REFERENCE SERVICE STRATEGY SUGGESTED LEAD
ORGANIZATION(S)
TRANSPORTATION
T 1.3
Examine the feasibility of broadening the eligibility criteria and easing the enrollment process for participation in the Valley Transportation Authority’s paratransit program. According to some sources, roughly 60 percent of applicants have been declined since new eligibility criteria were established.
Valley Transportation Authority in concert with transportation representatives from the Service Coordination and Advocacy Group
TRANSPORTATION
T 2.1 Implement a “bus buddy” volunteer program, in which volunteers assist seniors getting on and off the bus.
Collaboration between community-based service organizations that promote seniors’ independence and Valley Transportation Authority
TRANSPORTATION
T 4.2
Conduct a targeted review of seniors’ desires and needs pertaining to coordinated transportation among senior centers to determine the exact nature of the transportation problems related to travel to and between senior centers and the most responsive strategies for meeting those needs.
Municipal and community-based organizations that manage senior centers, coordinated through representatives on the Service Coordination and Advocacy Group
IN-HOME CARE
IC 2.2
Conduct a performance review of personal care programs and care management programs to identify efficiencies that could be gained and used to deliver services to more seniors in need.
Designated team of reviewers from the Service Coordination and Advocacy Group
CAREGIVER SUPPORT
CS 1.3
Equip senior centers to be an “information and referral” resource where caregivers can learn about support and respite services in Santa Clara County.
Collaboration between municipal and community-based organizations that manage senior centers and caregiver support organizations, as coordinated through representatives on the Service Coordination and Advocacy Group
CAREGIVER SUPPORT
CS 1.4
Ensure that information about caregiver support and respite services is included in the 2-1-1 information, referral, and assistance phone line for older adult services (see Strategy I 1.1).
United Way of Silicon Valley and caregiver support organizations, as coordinated through representatives on the Service Coordination and Advocacy Group
HEALTH CARE
HC 1.5
Attract more professionals to geriatrics by increasing the visibility of Santa Clara County’s existing geriatric specialists. Specifically, highlight their work at area hospitals and clinics through advertising campaigns and news spotlights.
Area hospitals and clinics, as represented by and coordinated through the Service Coordination and Advocacy Group

SECTION 5
COMMUNITY FOR A LIFETIMETEN-YEAR STRATEGIC PLAN 63
IMMEDIATE IMPLEMENTATION SERVICE
STRATEGY
REFERENCE SERVICE STRATEGY SUGGESTED LEAD
ORGANIZATION(S) HEALTH CARE
HC 1.7
Support efforts at the state and federal level to expand public funding for training of health professionals specializing in the needs of elders.
Advocacy arm of the Service Coordination and Advocacy Group
HEALTH CARE
HC 2.1
Encourage collaboration among service and resource providers to enhance the coordination and effectiveness of discharge planning so that older adults receive appropriate care in the community upon discharge from area hospitals.
Santa Clara County Department of Aging and Adult Services, Santa Clara Valley Medical Center, and Hospital Council of Santa Clara County, as represented by and coordinated through the Service Coordination and Advocacy Group
SENIOR CENTERS
SC 1.2
Develop competency standards and training for senior center volunteers. Faced with serious budget reductions, many centers have turned to volunteers to provide services once handled by paid staff. Unfortunately, volunteers rarely receive the same level of training as staff and vary widely in their ability to provide services such as information and referral.
Municipal and community-based organizations that manage senior centers, coordinated through representatives on the Service Coordination and Advocacy Group
SENIOR CENTERS
SC 1.3 Ensure that services offered at senior centers are included in the 2-1-1 information, referral, and assistance phone line (see Strategy I 1.1).
United Way of Silicon Valley and municipal and community-based organizations that manage senior centers, as coordinated through representatives on the Service Coordination and Advocacy Group

SECTION 5
COMMUNITY FOR A LIFETIMETEN-YEAR STRATEGIC PLAN 64
MID-TERM IMPLEMENTATION
SERVICE
STRATEGY
REFERENCE SERVICE STRATEGY SUGGESTED LEAD
ORGANIZATION(S)
LEADERSHIP & COORDINATION
LC 1.6
The Service Coordination and Advocacy Group will develop a coordinated advocacy network charged with accomplish the following, at a minimum:
• Educating the community about a broad range of aging issues, increasing awareness about older persons, their contributions to the community as well as their needs and about services available to assist them.
• Building close partnerships with every local elected official to ensure thorough understanding and advocacy for aging issues.
• Organizing a team of advocates who proactively and persistently advocate within the city and county governments of Santa Clara County. This team identifies every agency and committee that engages in any activities that should coordinate with or be responsive to older persons. The team then identifies ways to connect older persons with those services, either by adapting the services for older persons and/or informing older persons about the services. The result is that aging issues and responsiveness to them are embedded in all programs, services and activities of all local governments as well as in all citizens’ committees, and in the decisions and actions of staff and elected officials.
• Creating and training a team of at least five advocates to be highly visible spokespersons for aging issues.
• Organizing citizen advocates join with local elected officials to identify priority issues for aging and together, present them to state officials.
The Service Coordination and Advocacy Group, representing a broad continuum of aging services organizations
HOUSING
H 1.1
Introduce a rental subsidy program for the county’s most economically vulnerable older adults—those with annual incomes of $12,000 or less—so that these seniors pay no more than 30 percent of their monthly income on rent. Administer the subsidy program through a private nonprofit organization, such as the Housing Trust of Santa Clara County.
Collaboration among housing service organizations—as represented on the Service Coordination and Advocacy Group—cities and county government
LANGUAGE
L 1.2
Develop culturally competent public service announcements in languages other than English that introduce senior-relevant resources and services to different ethnic and language-specific communities. Disseminate messages through
Collaboration between media outlets and community organizations as represented on the Service C di ti d Ad G
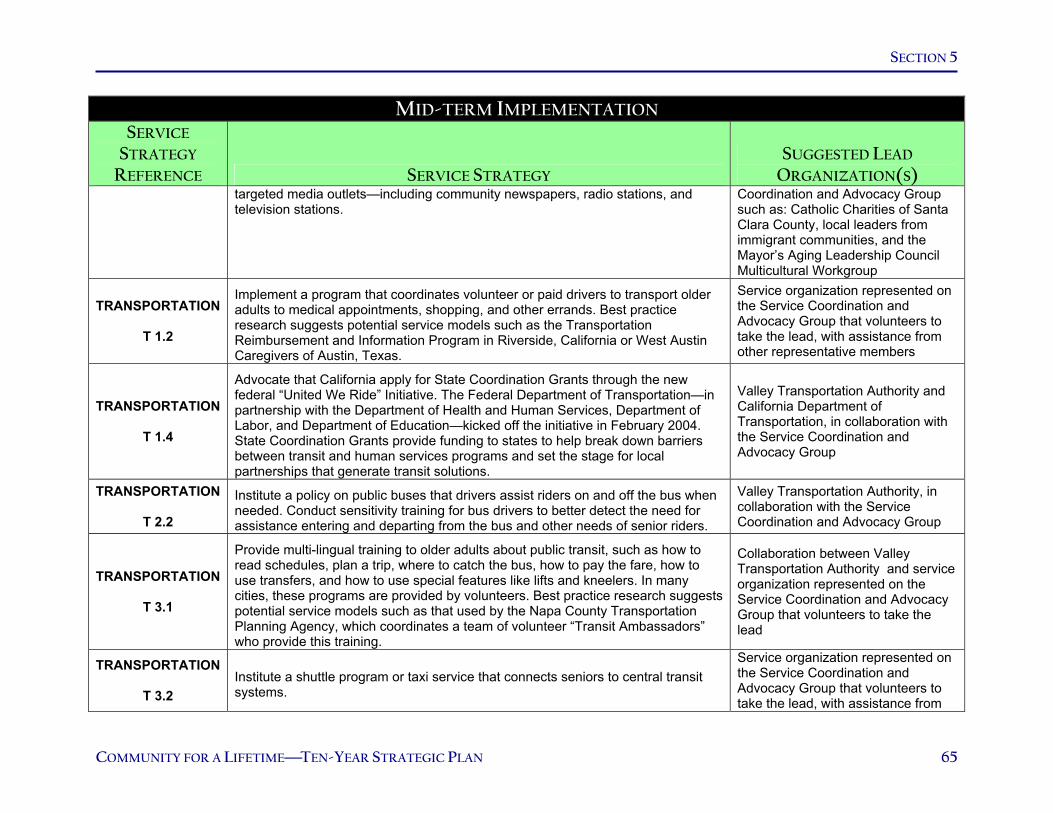
SECTION 5
COMMUNITY FOR A LIFETIMETEN-YEAR STRATEGIC PLAN 65
MID-TERM IMPLEMENTATION SERVICE
STRATEGY
REFERENCE SERVICE STRATEGY SUGGESTED LEAD
ORGANIZATION(S) targeted media outlets—including community newspapers, radio stations, and television stations.
Coordination and Advocacy Group such as: Catholic Charities of Santa Clara County, local leaders from immigrant communities, and the Mayor’s Aging Leadership Council Multicultural Workgroup
TRANSPORTATION
T 1.2
Implement a program that coordinates volunteer or paid drivers to transport older adults to medical appointments, shopping, and other errands. Best practice research suggests potential service models such as the Transportation Reimbursement and Information Program in Riverside, California or West Austin Caregivers of Austin, Texas.
Service organization represented on the Service Coordination and Advocacy Group that volunteers to take the lead, with assistance from other representative members
TRANSPORTATION
T 1.4
Advocate that California apply for State Coordination Grants through the new federal “United We Ride” Initiative. The Federal Department of Transportation—in partnership with the Department of Health and Human Services, Department of Labor, and Department of Education—kicked off the initiative in February 2004. State Coordination Grants provide funding to states to help break down barriers between transit and human services programs and set the stage for local partnerships that generate transit solutions.
Valley Transportation Authority and California Department of Transportation, in collaboration with the Service Coordination and Advocacy Group
TRANSPORTATION
T 2.2
Institute a policy on public buses that drivers assist riders on and off the bus when needed. Conduct sensitivity training for bus drivers to better detect the need for assistance entering and departing from the bus and other needs of senior riders.
Valley Transportation Authority, in collaboration with the Service Coordination and Advocacy Group
TRANSPORTATION
T 3.1
Provide multi-lingual training to older adults about public transit, such as how to read schedules, plan a trip, where to catch the bus, how to pay the fare, how to use transfers, and how to use special features like lifts and kneelers. In many cities, these programs are provided by volunteers. Best practice research suggests potential service models such as that used by the Napa County Transportation Planning Agency, which coordinates a team of volunteer “Transit Ambassadors” who provide this training.
Collaboration between Valley Transportation Authority and service organization represented on the Service Coordination and Advocacy Group that volunteers to take the lead
TRANSPORTATION
T 3.2 Institute a shuttle program or taxi service that connects seniors to central transit systems.
Service organization represented on the Service Coordination and Advocacy Group that volunteers to take the lead, with assistance from

SECTION 5
COMMUNITY FOR A LIFETIMETEN-YEAR STRATEGIC PLAN 66
MID-TERM IMPLEMENTATION SERVICE
STRATEGY
REFERENCE SERVICE STRATEGY SUGGESTED LEAD
ORGANIZATION(S) other representative members
TRANSPORTATION
T 3.3 Place bus stops in strategic locations within close proximity of senior centers as a convenient point of entry for seniors in need of public transportation.
Valley Transportation Authority, in collaboration with the Service Coordination and Advocacy Group
TRANSPORTATION
T 4.1
Develop shuttle services that transport older adults between senior centers and from senior centers to local destinations for shopping, medical appointments, and other errands.
Service organization represented on the Service Coordination and Advocacy Group that volunteers to take the lead, with assistance from other representative members
IN-HOME CARE
IC 2.1
Utilize senior centers as resource centers that promote self-managed care. Through literature and informed staff, educate seniors and their families about how to function as their own care coordinators. Information could include how to choose an in-home service provider, the services that comprise personal care programs, and how to prevent unscrupulous individuals from exploiting seniors.
Collaboration between service experts in self-care management, in-home care and municipal organizations, and community-based organizations that manage senior centers, coordinated through representatives on the Service Coordination and Advocacy Group
CAREGIVER SUPPORT
CS 1.1
Increase working adults’ awareness of caregiver support opportunities through education campaigns targeted to workplaces. As baby boomers age over the next 10 to 20 years, they will feel the pressures of working and caring for loved ones and will, themselves, require more care from working family members and friends. Institute periodic seminars by aging service organizations to workplaces in Santa Clara County. Best practice research suggests potential service models such as that of the “Caring Workplace” employed by St. Andrew’s At-Home Services in Saint Louis, Missouri. The program works with business councils and business sponsors to educate employees about caregiver and elder care resources.
Service experts in caregiver support and service organizations volunteering to disseminate, coordinated through the Service Coordination and Advocacy Group
CAREGIVER SUPPORT
CS 1.2
Examine the geographic distribution and cultural competencies of adult day care centers in Santa Clara County to identify appropriate locations and underserved ethnic communities for expansion of adult day care services.
Council on Aging of Silicon Valley, in collaboration with adult day care service organizations represented on the Service Coordination and Advocacy Group
CAREGIVER SUPPORT
Support family caregivers through training on caregiving techniques and skills. Consider applying a “train-the-trainer” model in which master trainers teach
Council on Aging of Silicon Valley, in collaboration with adult day care
i i ti t d

SECTION 5
COMMUNITY FOR A LIFETIMETEN-YEAR STRATEGIC PLAN 67
MID-TERM IMPLEMENTATION SERVICE
STRATEGY
REFERENCE SERVICE STRATEGY SUGGESTED LEAD
ORGANIZATION(S)
CS 1.5 volunteer health care and social service professionals to train groups of family caregivers in the community about needed caregiving and coping tools and resources. Best practice research suggests potential service models such as one employed by Mather Lifeways—a community-based organization in Evanston, Illinois that developed and implemented a caregiving train-the-trainer curriculum recognized by the Federal Administration on Aging.
service organizations represented on the Service Coordination and Advocacy Group
HEALTH CARE
HC 1.6
Use the resources of the City of San José and Santa Clara County to promote private giving to support expansion and development of additional programs in area colleges and universities to train health professionals specializing in meeting the health and social service needs of elders.
Leadership Group and advocacy arm of the Service Coordination and Advocacy Group
HEALTH CARE
HC 2.2
Assess the feasibility of developing expanded outreach and enrollment for low-income seniors that may be dual-eligible but not enrolled in Medicare and Medi-Cal.
Valley Community Outreach Services, Social Services Agency, and Santa Clara Valley Medical Center
HEALTH CARE
HC 2.4
Increase community-based long-term care services—as already noted in other strategies—such as increased adult day care centers and expanded eligibility to in-home care programs modeled after the In-Home Supportive Services Program.
In-home care and caregiver support organizations as represented on the Service Coordination and Advocacy Group
SENIOR CENTERS
SC 1.1
Restore full-time staff at senior centers including those who provide information and assistance, legal assistance, and management and coordination of programs services. These programs were severely impacted by the budget reductions most cities had to take in fiscal years 2002-03 and 2003-04. Most centers lost highly trained paid staff who provided most of the “linkages” to needed services.
Municipal organizations that manage senior centers—coordinated through representatives on the Service Coordination and Advocacy Group —and city councils
SENIOR CENTERS
SC 2.1
Conduct a baby boomer interest assessment to help prepare senior centers and senior services for baby boomers’ entrance into “senior status” over the next ten years. Identify the ways in which this generation’s needs and interests will be similar to and different from today’s youngest seniors.
Municipal organizations that manage senior centers—coordinated through representatives on the Service Coordination and Advocacy Group
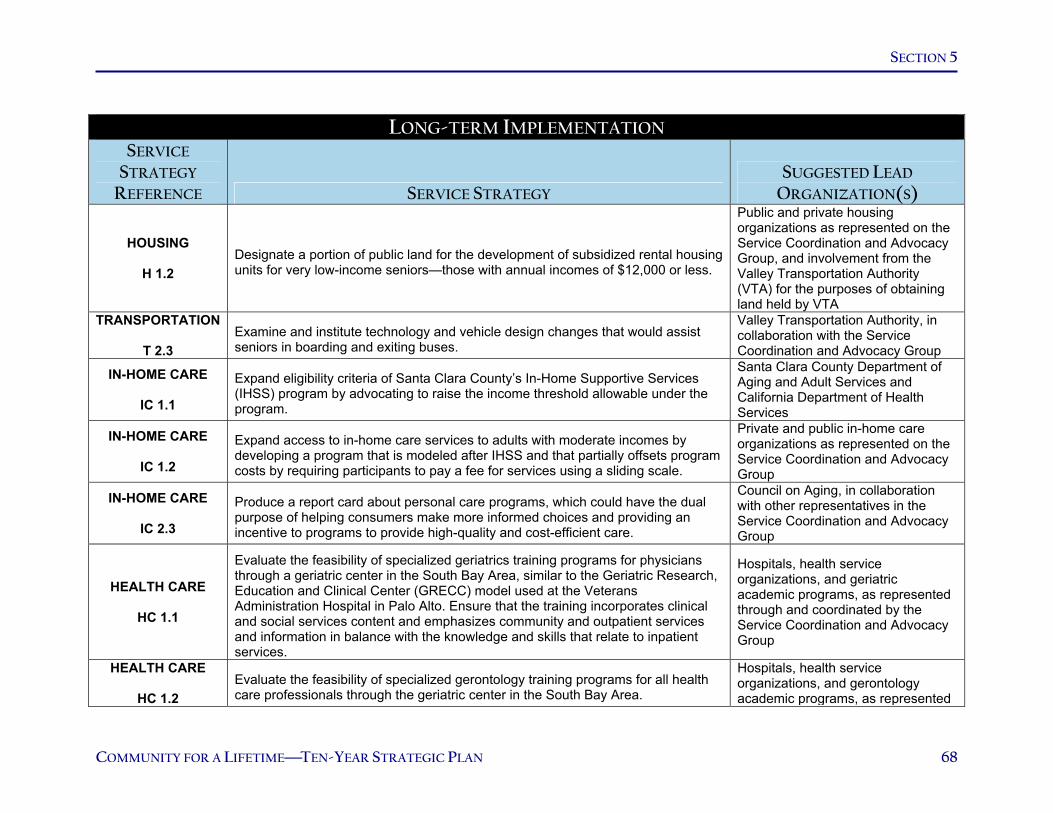
SECTION 5
COMMUNITY FOR A LIFETIMETEN-YEAR STRATEGIC PLAN 68
LONG-TERM IMPLEMENTATION
SERVICE
STRATEGY
REFERENCE SERVICE STRATEGY SUGGESTED LEAD
ORGANIZATION(S)
HOUSING
H 1.2 Designate a portion of public land for the development of subsidized rental housing units for very low-income seniors—those with annual incomes of $12,000 or less.
Public and private housing organizations as represented on the Service Coordination and Advocacy Group, and involvement from the Valley Transportation Authority (VTA) for the purposes of obtaining land held by VTA
TRANSPORTATION
T 2.3 Examine and institute technology and vehicle design changes that would assist seniors in boarding and exiting buses.
Valley Transportation Authority, in collaboration with the Service Coordination and Advocacy Group
IN-HOME CARE
IC 1.1
Expand eligibility criteria of Santa Clara County’s In-Home Supportive Services (IHSS) program by advocating to raise the income threshold allowable under the program.
Santa Clara County Department of Aging and Adult Services and California Department of Health Services
IN-HOME CARE
IC 1.2
Expand access to in-home care services to adults with moderate incomes by developing a program that is modeled after IHSS and that partially offsets program costs by requiring participants to pay a fee for services using a sliding scale.
Private and public in-home care organizations as represented on the Service Coordination and Advocacy Group
IN-HOME CARE
IC 2.3
Produce a report card about personal care programs, which could have the dual purpose of helping consumers make more informed choices and providing an incentive to programs to provide high-quality and cost-efficient care.
Council on Aging, in collaboration with other representatives in the Service Coordination and Advocacy Group
HEALTH CARE
HC 1.1
Evaluate the feasibility of specialized geriatrics training programs for physicians through a geriatric center in the South Bay Area, similar to the Geriatric Research, Education and Clinical Center (GRECC) model used at the Veterans Administration Hospital in Palo Alto. Ensure that the training incorporates clinical and social services content and emphasizes community and outpatient services and information in balance with the knowledge and skills that relate to inpatient services.
Hospitals, health service organizations, and geriatric academic programs, as represented through and coordinated by the Service Coordination and Advocacy Group
HEALTH CARE
HC 1.2 Evaluate the feasibility of specialized gerontology training programs for all health care professionals through the geriatric center in the South Bay Area.
Hospitals, health service organizations, and gerontology academic programs, as represented

SECTION 5
COMMUNITY FOR A LIFETIMETEN-YEAR STRATEGIC PLAN 69
LONG-TERM IMPLEMENTATION SERVICE
STRATEGY
REFERENCE SERVICE STRATEGY SUGGESTED LEAD
ORGANIZATION(S) through and coordinated by the Service Coordination and Advocacy Group
HEALTH CARE
HC 1.3
Develop collaborations between local hospitals and area universities and colleges that train advanced practice nurses who specialize in care for older adults in the full continuum of health care settings and with programs providing training on epidemiologic trends in elder populations and effective public health interventions.
Hospitals, health service organizations and medical education programs, as represented through and coordinated by the Service Coordination and Advocacy Group
HEALTH CARE
HC 1.4
Increase interest in geriatrics among clinicians as well as other health professionalssuch as nurses and social workersto encourage new professionals to pursue this specialty option. Specifically, through the geriatric center cited in Strategy HC 1.1, provide an active program of continuing medical education (CME) for physicians and other health professionals on issues and care for elders.
Hospitals, health service organizations and medical education programs, as represented through and coordinated by the Service Coordination and Advocacy Group
HEALTH CARE
HC 2.3
Encourage private sector employers to offer long-term care insurance, not necessarily as a paid benefit, but to raise awareness about preparing for the care of aging family members.
Advocacy arm of the Service Coordination and Advocacy Group
SENIOR CENTERS
SC 2.2
Incorporate “universal design concepts” into new city government, county government, and senior center facilities to assist adults as they age. Examples of these designs include wider walkways, increased lighting, larger print signs, grab bars in hallways and restrooms, ramps, and automatic doors. Some, but not all, of these features are required by the Americans with Disabilities Act.
City councils and city planning departments, coordinated by the Service Coordination and Advocacy Group
SENIOR CENTERS
SC 2.3
Provide a “bundling of services” near senior center locations that appeal to a broad continuum of older adults. For example, create “one-stop” destinations that include ATMs, coffee shops, public transit information, fitness centers, adult day care centers, libraries, community services, as well as senior center programs.
City councils and city planning departments, coordinated by the Service Coordination and Advocacy Group
SENIOR CENTERS
SC 2.4
Expand and market services at senior centers to attract and appeal to younger seniors’ discrete interests and levels of activity. The phone survey and other studies have shown that computer classes, fitness, and travel programs are among the top priorities of younger seniors.
Municipal and community-based organizations that manage senior centers—coordinated through representatives on the Service Coordination and Advocacy Group

Appendices

COMMUNITY FOR A LIFETIMETEN-YEAR STRATEGIC PLAN A-1
AAPPPPEENNDDIIXX AA AAGGIINNGG SSEERRVVIICCEESS PPRROOVVIIDDEERR SSUURRVVEEYY SSUUMMMMAARRYY RREEPPOORRTT
IINNTTRROODDUUCCTTIIOONN As part of the strategic planning effort, a survey was conducted in July and August 2004 to better understand the capacity of organizations in Santa Clara County to serve seniors’ needs. This report summarizes the methodology and findings from that survey.
PPRROOVVIIDDEERR SSUURRVVEEYY MMEETTHHOODDOOLLOOGGYY
SSaammppllee GGrroouupp In July and August 2004, the Aging Services Provider Survey was conducted with a sample of 54 organizations that offer services to older adults. The sample group was selected by staff at the Santa Clara County Department of Aging and Adult Services (DAAS) and at the Office on Aging at San José Parks, Recreation, and Neighborhood Services and was validated by the Strategic Plan Advisory Group. Organizations were selected if they were known to receive substantial funding for aging services and serve a significant population of older adults in Santa Clara County. Organizations were also selected such that each of the following service areas was represented in the sample group:
• Food and Nutritional Resources • Housing Services • In-Home Care • Care Management • Cultural and Recreational Activities • Information, Referral, and Assistance • Education and Employment • Emergency Services • Financial Assistance and Benefits • Health and Wellness • Legal Assistance • Mental Health • Transportation
The survey was mailed to the following 54 public and private organizations.
PUBLIC ORGANIZATIONS Santa Clara County DAAS Santa Clara Valley Health and Hospital
SystemPublic Health San José Parks, Recreation and Neighborhood ServicesOffice on Aging
Santa Clara Valley Health and Hospital SystemMental Health Services
Office of the Public Defender Santa Clara Valley Health and Hospital SystemDepartment of Alcohol and Drug Services
Campbell Recreation and Community Services DepartmentCampbell Adult Center
Cupertino Parks and Recreation DepartmentLive Oak Adult Day Services
Santa Clara Parks and Recreation DepartmentSanta Clara Senior Center Sunnyvale Parks and Recreation
Cupertino Community Services Los Altos Recreation Department

APPENDIX A
COMMUNITY FOR A LIFETIMETEN-YEAR STRATEGIC PLAN A-2
Gilroy Community Services Department Housing Authority of County of Santa Clara Department of Veterans’ AffairsSan José Respite Program Sunnyvale Senior Center
San José Silicon Valley Workforce Investment Network Morgan Hill Senior Center
Milpitas Recreation Services PRIVATE ORGANIZATIONS
Catholic Charities of Santa Clara County Silicon Valley Independent Living Center Outreach, Inc. Hospice of the Valley Mexican American Community Services, Inc. Adult Day Health Center Yu-Ai-Kai
Project Match, Inc. Sacred Heart Community Services Vietnamese Voluntary Foundation National Council on Aging Indian Community Center Korean American Community Services Alzheimer’s Activity Center Avenidas Senior Center
Community Housing Developers Community Services Agency of Mountain View and Los Altos
Economic and Social Opportunities, Inc. Senior Adults Legal Assistance Addison Penzak Jewish Community Center Emergency Housing Consortium Self-Help for the Elderly of Santa Clara County Health Trust/Meals on Wheels Metropolitan Education District Council on Aging Silicon Valley Next Door: Solutions to Domestic Violence Billy DeFrank LGBT Center Northside Community Center Asian Law Alliance Portuguese Organization for Social Services and Opportunities
Los Gatos-Saratoga Department of Community Education and Recreation (The 55+ Program)
Saratoga Area Senior Coordination Council Legal Aid Society of Santa Clara County Seniors at Home Jewish Family Asian Americans for Community Involvement Second Harvest Food Bank
SSuurrvveeyy RReessppoonnddeennttss Approximately 43 percent—or 23 organizations—of the sample group returned the survey with partial or complete information. Another 12 organizations responded that they were unable to complete the survey for various reasons. Despite multiple follow-up phone calls, 19 organizations did not respond in any fashion to the survey. The following eight public organizations and 15 private organizations returned the survey with complete or partial information.
PUBLIC ORGANIZATIONS Cupertino Parks and Recreation DepartmentLive Oak Adult Day Services
San José Parks, Recreation and Neighborhood ServicesOffice on Aging
Santa Clara Valley Health and Hospital SystemPublic Health
Santa Clara Valley Health and Hospital SystemMental Health Services
Santa Clara Valley Health and Hospital SystemDepartment of Alcohol and Drug Services
Santa Clara County DAAS
Campbell Recreation and Community Services DepartmentCampbell Adult Center
Office of the Public Defender
PRIVATE ORGANIZATIONS Avenidas Senior Center Alzheimer’s Activity Center Sacred Heart Community Services National Council on Aging Catholic Charities of Santa Clara County Outreach, Inc. Senior Adults Legal Assistance Mexican American Community Services, Inc.
APPENDIX A
COMMUNITY FOR A LIFETIMETEN-YEAR STRATEGIC PLAN A-3
Adult Day Health Center Project Match, Inc. Hospice of the Valley Yu-Ai-Kai Vietnamese Voluntary Foundation Korean American Community Services Indian Community Center Community Services Agency of Mountain View and Los Altos
SSuurrvveeyy CCoonntteenntt
The survey asked organizations about their levels and sources of revenue, the percent of revenue dedicated to aging services, program expenditures, the level and variety of services organizations provide to older adults, and the extent to which older adults experience waiting lists and delays in receiving services. Data was requested for four fiscal years (FY) covering a ten-year spanFY 1994-95, FY 1999-00, FY 2002-03, and FY 2003-04.
SSuurrvveeyy LLiimmiittaattiioonnss Although data was requested for four FYs, only five of the 23 respondents were able to provide data for FY 1994-95; 18 respondents were able to provide data for FY 1999-00, FY 2002-03, and FY 2003-04. In an effort to keep the sample size as large as possible, data for FY 1994-95 was discarded, and data reflecting FYs 1999-00, 2002-03, and 2003-04 were analyzed and presented in this summary. While 23 organizations responded to the survey with information of some kind, only 18 of those organizations provided complete expenditure and service-level data. The sample of 18 organizations was then divided into subsample groups based on the services they offered (specifically, into the 13 service areas listed on the first page of this summary). This produced, in some cases, very small subsample groups—comprised of only two organizations in some instances. Due to the small sample size of the survey group, the data provided in this report should be considered illustrative and not statistically representative of the funding and service trends for aging services in Santa Clara County. The survey methodology did not attempt to extrapolate estimates of countywide expenditures or service levels from the sample group’s responses. Rather, the intent of this survey was to identify trends—increases and decreases in funding and service levels—that might be indicative of the larger service provider population. Therefore, dollar amounts and service levels presented in this summary should not be construed as representing totals for aging services in Santa Clara County.
SSUURRVVEEYY RREESSUULLTTSS The data presented in this section depict the funding and service level trends for those service areas that were identified as relating to the prominent needs of older adults in the Senior Needs Assessment. These are:
• Housing • Information • Language • Health Care and Insurance • Transportation • In-Home Care • Caregiver Support
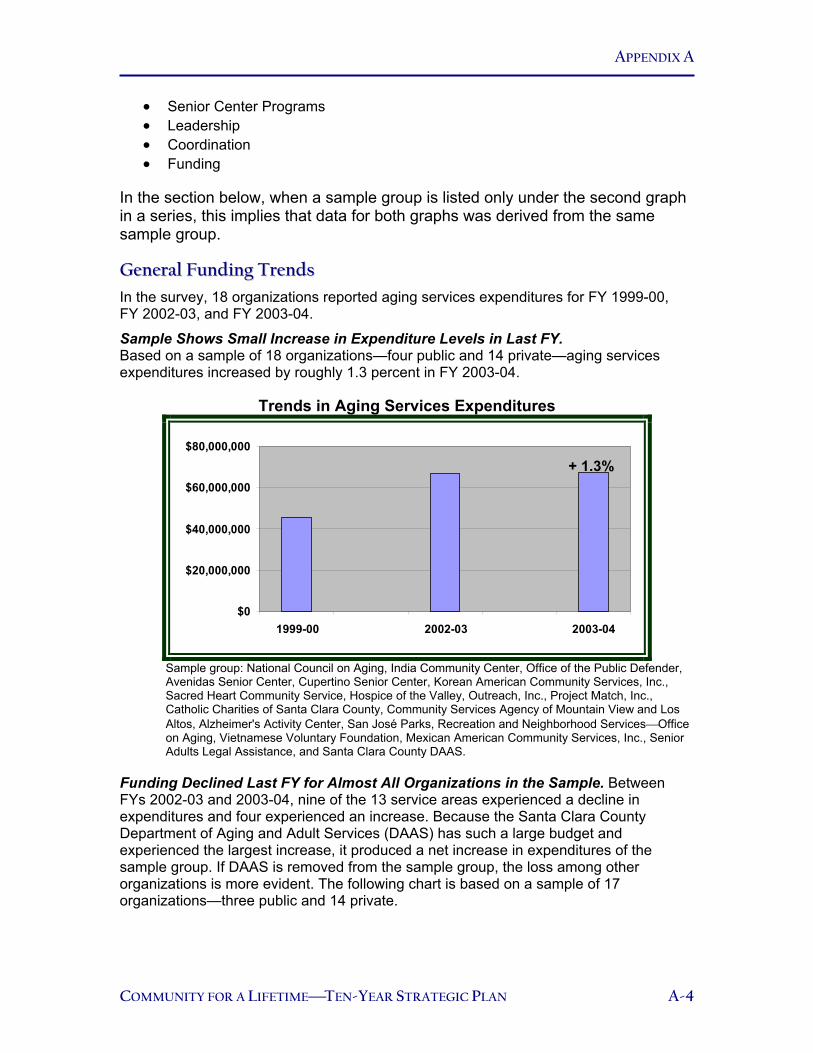
APPENDIX A
COMMUNITY FOR A LIFETIMETEN-YEAR STRATEGIC PLAN A-4
• Senior Center Programs • Leadership • Coordination • Funding
In the section below, when a sample group is listed only under the second graph in a series, this implies that data for both graphs was derived from the same sample group.
GGeenneerraall FFuunnddiinngg TTrreennddss In the survey, 18 organizations reported aging services expenditures for FY 1999-00, FY 2002-03, and FY 2003-04.
Sample Shows Small Increase in Expenditure Levels in Last FY. Based on a sample of 18 organizations—four public and 14 private—aging services expenditures increased by roughly 1.3 percent in FY 2003-04.
Trends in Aging Services Expenditures
$0
$20,000,000
$40,000,000
$60,000,000
$80,000,000
1999-00 2002-03 2003-04
Sample group: National Council on Aging, India Community Center, Office of the Public Defender, Avenidas Senior Center, Cupertino Senior Center, Korean American Community Services, Inc., Sacred Heart Community Service, Hospice of the Valley, Outreach, Inc., Project Match, Inc., Catholic Charities of Santa Clara County, Community Services Agency of Mountain View and Los Altos, Alzheimer's Activity Center, San José Parks, Recreation and Neighborhood ServicesOffice on Aging, Vietnamese Voluntary Foundation, Mexican American Community Services, Inc., Senior Adults Legal Assistance, and Santa Clara County DAAS.
Funding Declined Last FY for Almost All Organizations in the Sample. Between FYs 2002-03 and 2003-04, nine of the 13 service areas experienced a decline in expenditures and four experienced an increase. Because the Santa Clara County Department of Aging and Adult Services (DAAS) has such a large budget and experienced the largest increase, it produced a net increase in expenditures of the sample group. If DAAS is removed from the sample group, the loss among other organizations is more evident. The following chart is based on a sample of 17 organizations—three public and 14 private.
+ 1.3%

APPENDIX A
COMMUNITY FOR A LIFETIMETEN-YEAR STRATEGIC PLAN A-5
Trends in Aging Services Expenditures (Less DAAS)
$0
$5,000,000
$10,000,000
$15,000,000
$20,000,000
$25,000,000
1999-00 2002-03 2003-04
Sample group: National Council on Aging, India Community Center, Office of the Public Defender, Avenidas Senior Center, Cupertino Senior Center, Korean American Community Services, Inc., Sacred Heart Community Service, Hospice of the Valley, Outreach, Inc., Project Match, Inc., Catholic Charities of Santa Clara County, Community Services Agency of Mountain View and Los Altos, Alzheimer's Activity Center, San José Parks, Recreation and Neighborhood ServicesOffice on Aging, Vietnamese Voluntary Foundation, Mexican American Community Services, Inc., and Senior Adults Legal Assistance.
HHeeaalltthh aanndd WWeellllnneessss FFuunnddiinngg TTrreennddss In the survey, five organizations—one public and four private—reported delivering health and wellness services to older adults in Santa Clara County. Recent Trends Reflect Decline in Funding for Health and Wellness. Survey respondents that provided health and wellness services experienced a decrease in program funding of roughly 15.7 percent in FY 2003-04.
Expenditures for Health and Wellness
1999-00
2002-03
2003-04
$5,500,000
$6,000,000
$6,500,000
$7,000,000
$7,500,000
$8,000,000
- 6.9%
- 15.7%

APPENDIX A
COMMUNITY FOR A LIFETIMETEN-YEAR STRATEGIC PLAN A-6
Health and Wellness Sample Group Relies Largely on Federal Sources for Funding. The graph below shows that 96.3 percent of the group’s funding comes from federal sources.
Funding Sources for Health and Wellness
0%
20%
40%
60%
80%
100%
120%
1999-00 2002-03 2003-04
Federal Funds State Funds County Funds City Funds Private Funds
Sample group: Avenidas Senior Center, Korean American Community Services, Inc., Catholic Charities of Santa Clara County, Vietnamese Voluntary Foundation, and San José Parks, Recreation and Neighborhood ServicesOffice on Aging.
HHoouussiinngg FFuunnddiinngg TTrreennddss In the survey, three private organizations reported delivering housing services to older adults in Santa Clara County. Recent Trends Reflect Increase in Funding for Housing Services. The graph below shows that these organizations experienced a 0.8 percent increase in funding for housing services in FY 2003-04.
Expenditures for Housing Services
1999-00
2002-032003-04
$480,000
$490,000
$500,000
$510,000
$520,000
$530,000
$540,000
Private Funding Consistently Largest Fund Source for Sample of Housing Service Providers. The following graph shows that private funding sources have consistently
Fed portion = 96.3%
+0.8%

APPENDIX A
COMMUNITY FOR A LIFETIMETEN-YEAR STRATEGIC PLAN A-7
exceeded all other funding sources for housing. In FY 2003-04, private funds accounted for 94.6 percent of total housing funds.
Funding Sources for Housing Services
0%
20%
40%
60%
80%
100%
1999-00 2002-03 2003-04
Federal Funds State Funds County Funds City Funds Private Funds
Sample group: Avenidas Senior Center, Korean American Community Services, Inc., and Project Match, Inc.
IInnffoorrmmaattiioonn,, RReeffeerrrraall,, aanndd AAssssiissttaannccee SSeerrvviicceess FFuunnddiinngg TTrreennddss In the survey, four organizations—one public and three private—reported delivering information, referral, and assistance services to older adults in Santa Clara County.
Information, Referral, and Assistance Services Experience Slight Decline in Funding. The chart below depicts a 1.7 percent decrease in funds between FY 2002-03 and FY 2003-04.
Expenditures for Information, Referral, and Assistance Services
1999-00
2002-03 2003-04
$0
$250,000
$500,000
$750,000
$1,000,000
Federal, State, and City Funding Increases While Private Funding Declines for Information, Referral, and Assistance Services. The following chart shows that for FY 2003-04 federal, state, and city funding sources have increased by 7.8 percent,
Private portion = 94.6%
- 1.7%
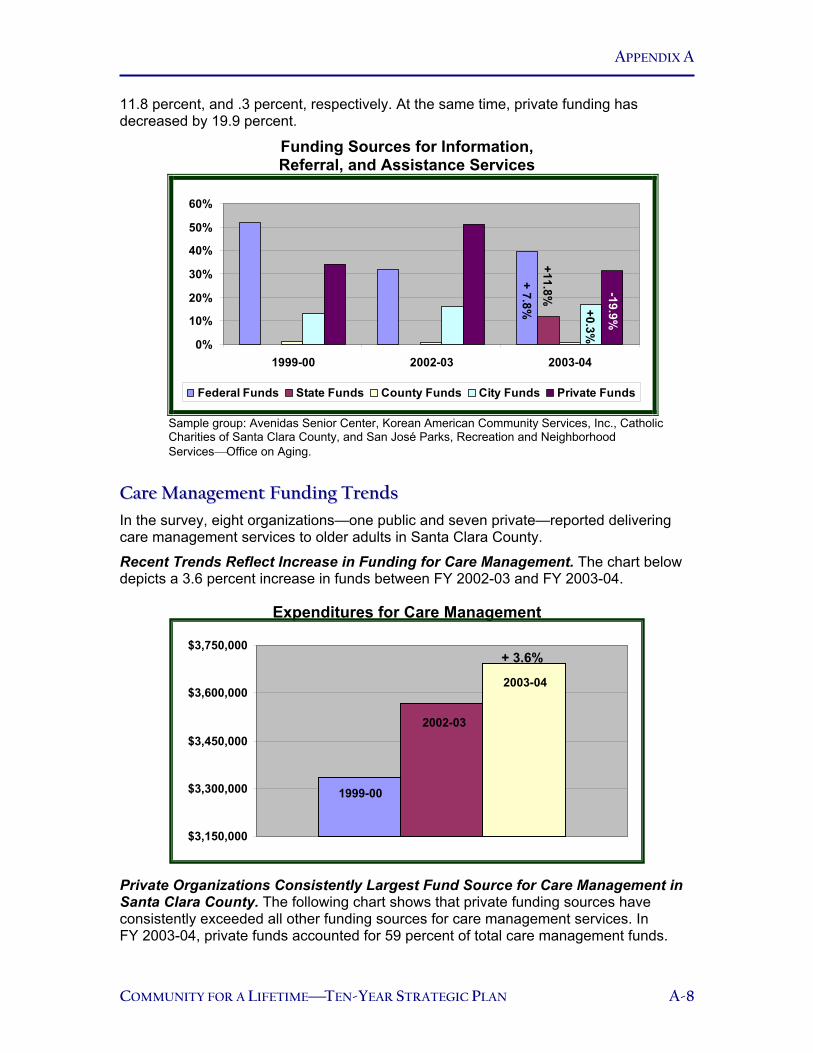
APPENDIX A
COMMUNITY FOR A LIFETIMETEN-YEAR STRATEGIC PLAN A-8
11.8 percent, and .3 percent, respectively. At the same time, private funding has decreased by 19.9 percent.
Funding Sources for Information, Referral, and Assistance Services
0%
10%
20%
30%
40%
50%
60%
1999-00 2002-03 2003-04
Federal Funds State Funds County Funds City Funds Private Funds
Sample group: Avenidas Senior Center, Korean American Community Services, Inc., Catholic Charities of Santa Clara County, and San José Parks, Recreation and Neighborhood ServicesOffice on Aging.
CCaarree MMaannaaggeemmeenntt FFuunnddiinngg TTrreennddss In the survey, eight organizations—one public and seven private—reported delivering care management services to older adults in Santa Clara County. Recent Trends Reflect Increase in Funding for Care Management. The chart below depicts a 3.6 percent increase in funds between FY 2002-03 and FY 2003-04.
Expenditures for Care Management
Private Organizations Consistently Largest Fund Source for Care Management in Santa Clara County. The following chart shows that private funding sources have consistently exceeded all other funding sources for care management services. In FY 2003-04, private funds accounted for 59 percent of total care management funds.
1999-00
2002-03
2003-04
$3,150,000
$3,300,000
$3,450,000
$3,600,000
$3,750,000 + 3.6%
+ 7.8%
+11.8% +0.3%
-19.9%

APPENDIX A
COMMUNITY FOR A LIFETIMETEN-YEAR STRATEGIC PLAN A-9
Funding Sources for Care Management
0%10%20%30%40%50%60%70%
1999-00 2002-03 2003-04
Federal Funds State Funds County Funds City Funds Private Funds
Sample group: Avenidas Senior Center, Korean American Community Services, Inc., Outreach, Inc., Project Match, Inc., Catholic Charities of Santa Clara County, Alzheimer’s Activity Center, Vietnamese Voluntary Foundation, San José Parks, Recreation, and Neighborhood Services—Office on Aging.
IInn--HHoommee CCaarree FFuunnddiinngg TTrreennddss In the survey, two organizations—one public and one private—reported delivering in-home care services to older adults in Santa Clara County. Recent Trends Reflect Increase in Funding for In-Home Care Services. The chart below depicts a 17.2 percent increase in funds for FY 2003-04 based on a sample of one public and one private organization. The DAAS is the public organization contributing to this data. Due to the size of DAAS’ budget, the data reflects a net increase in expenditures in the sample group. However, if you remove DAAS from the sample group, this area would reflect a loss in expenditures.
Expenditures for In-Home Care Services
1999-00
2002-03
2003-04
$0
$5,500,000
$11,000,000
$16,500,000
$22,000,000
$27,500,000
$33,000,000
$38,500,000
Federal and State Government Consistently Largest Funding Source for In-Home Care Services in Santa Clara County. The chart below shows that federal and state funding sources have consistently exceeded all other funding sources for in-home care
Private portion = 59%
+ 17.2%

APPENDIX A
COMMUNITY FOR A LIFETIMETEN-YEAR STRATEGIC PLAN A-10
services. In FY 2003-04, federal and state funds accounted for 39.1 percent and 39.4 percent respectively, of in-home care funds.
Funding Sources for In-Home Care Services
0%
10%
20%
30%
40%
50%
1999-00 2002-03 2003-04
Federal Funds State Funds County Funds City Funds Private Funds
Sample group: Catholic Charities of Santa Clara County and Santa Clara County Department of Aging and Adult Services.
CCuullttuurraall aanndd RReeccrreeaattiioonn FFuunnddiinngg TTrreennddss In the survey, five organizations—one public and four private—reported delivering cultural and recreation services to older adults in Santa Clara County. Both Language and Senior Center Programs fall under the umbrella of Cultural and Recreation.
Recent Trends Reflect Decrease in Funding for Cultural and Recreation Services. The chart below depicts a 7.9 percent decrease in funds between FY 2002-03 and FY 2003-04.
Expenditures For Cultural and Recreation Services
1999-00
2002-03
2003-04
$2,200,000
$2,400,000
$2,600,000
$2,800,000
$3,000,000
City Consistently Largest Funding Source for Cultural and Recreation Services in Santa Clara County. The chart below shows that the city has consistently exceeded all
Fed portion = 39.1%
State portion = 39.4%
- 7.9%

APPENDIX A
COMMUNITY FOR A LIFETIMETEN-YEAR STRATEGIC PLAN A-11
other funding sources for cultural and recreation services. In FY 2003-04, the city accounted for 79.7 percent of cultural and recreation funds.
Funding Sources for Cultural and Recreation Services
0%
20%
40%
60%
80%
100%
1999-00 2002-03 2003-04
Federal Funds State Funds County Funds City Funds Private Funds
Sample group: Avenidas Senior Center, Korean American Community Services, Inc., Catholic Charities of Santa Clara County, Vietnamese Voluntary Foundation, and San José Parks, Recreation and Neighborhood ServicesOffice on Aging.
TTrraannssppoorrttaattiioonn FFuunnddiinngg TTrreennddss In the survey, two private organizations reported transportation as one of many services they deliver to older adults in Santa Clara County. Recent Trends Reflect Increase in Funding for Transportation Services. The chart below depicts a 16.5 percent increase in funds between FY 2002-03 and FY 2003-04.
Expenditures for Transportation Services
1999-00
2002-03
2003-04
$0
$50,000
$100,000
$150,000
$200,000
$250,000
Private Organizations Consistently Largest Funding Source for Transportation Services in Santa Clara County. The chart below shows that private organizations have consistently exceeded other funding sources for transportation services. In FY 2003-04, private funds accounted for 87.8 percent of transportation funds.
City portion = 79.7%
+ 16.5%

APPENDIX A
COMMUNITY FOR A LIFETIMETEN-YEAR STRATEGIC PLAN A-12
Funding Sources for Transportation Services
0%
20%
40%
60%
80%
100%
1999-00 2002-03 2003-04
Federal Funds State Funds County Funds City Funds Private Funds
Sample group: Avenidas Senior Center and Catholic Charities of Santa Clara County.
CCOOMMPPAARRIISSOONN OOFF FFUUNNDDIINNGG AANNDD SSEERRVVIICCEE LLEEVVEELLSS In this section of the summary we compare—in each service area—the percent change in expenditures to the percent change in the number of seniors served between FY 2002-03 and FY 2003-04.
HHeeaalltthh aanndd WWeellllnneessss CCoommppaarriissoonnss In the survey, five organizations—one public and four private—reported delivering health and wellness services to older adults in Santa Clara County.
Number Of Older Adults Requiring Health and Wellness Services Increased While Funding Decreased. Health and wellness services recognized a decrease in funding of 15.7 percent between FY 2002-03 and FY 2003-04 while seniors’ needs for health and wellness services increased by 12 percent during the same period. In 2004-05, the need for health and wellness services increased again by 4.1 percent. The trends reflect a possible 60-day delay receiving service while on a waiting list that may range in size from 0 to 100 clients.
Private portion = 87.8%

APPENDIX A
COMMUNITY FOR A LIFETIMETEN-YEAR STRATEGIC PLAN A-13
Changes in Health and Wellness Expenditures and Service Levels Between 2002-03 and 2003-04
-20%
-10%
0%
10%
20%
Percent Change in ExpendituresPercent Change in Service Levels
Sample group: Avenidas Senior Center, Korean American Community Services, Inc., Catholic Charities of Santa Clara County, Vietnamese Voluntary Foundation, and San José Parks, Recreation and Neighborhood ServicesOffice on Aging.
HHoouussiinngg SSeerrvviicceess CCoommppaarriissoonnss In the survey, three private organizations reported delivering housing services to older adults in Santa Clara County.
Older Adults Requiring Housing Services Decreased While Funding Experienced Slight Increase. While funding for housing services had slightly increased between FY 2002-03 and FY 2003-04 (by 0.8 percent), the need for senior housing decreased by 12.2 percent. However, the FY 2004-05 data reflects an increased need for senior housing of 3 percent. The trends reflect a possible 240-day delay receiving service while on a waiting list that may range in size from 0 to 25 clients.
Changes in Housing Expenditures and Service Levels Between 2002-03 and 2003-04
-15.0%
-10.0%
-5.0%
0.0%
5.0%
Percent Change in ExpendituresPercent Change in Service Levels
Sample group: Avenidas Senior Center, Korean American Community Services, Inc., and Project Match, Inc.

APPENDIX A
COMMUNITY FOR A LIFETIMETEN-YEAR STRATEGIC PLAN A-14
IInnffoorrmmaattiioonn,, RReeffeerrrraall,, aanndd AAssssiissttaannccee CCoommppaarriissoonnss In the survey, four organizations—one public and three private—reported delivering information, referral, and assistance services to older adults in Santa Clara County. Need for Information, Referral, and Assistance Increasing While Funding Decreasing. Between FY 2002-03 and FY 2003-04, the number of seniors requiring information assistance increased by 35.2 percent. During the same period, the funding decreased by 1.7 percent. Aging adults’ need for information assistance continued to increase in 2004-05 by 6.4 percent. The trends reflect a possible five-day delay receiving service.
Changes in Information, Referral, and Assistance Services Expenditures and Service Levels Between 2002-03 and 2003-04
-20%
0%
20%
40%
Percent Change in ExpendituresPercent Change in Service Levels
Sample group: Avenidas Senior Center, Korean American Community Services, Inc., Catholic Charities of Santa Clara County, and San José Parks, Recreation and Neighborhood ServicesOffice on Aging.
CCaarree MMaannaaggeemmeenntt CCoommppaarriissoonnss In the survey, eight organizations—one public and seven private—reported delivering care management services to older adults in Santa Clara County. Older Adults’ Need for Care Management Increases While Funding Increases As Well. During FY 2002-03 and FY 2003-04, the number of older adults requiring care management services increased by 1 percent. At the same time, funding increased by 3.6 percent. However, in FY 2004-05 the number of adults requiring care decreased by 6.5 percent. The trends reflect a possible 60-day delay receiving service while on a waiting list that may range in size from 0 to 800 clients.
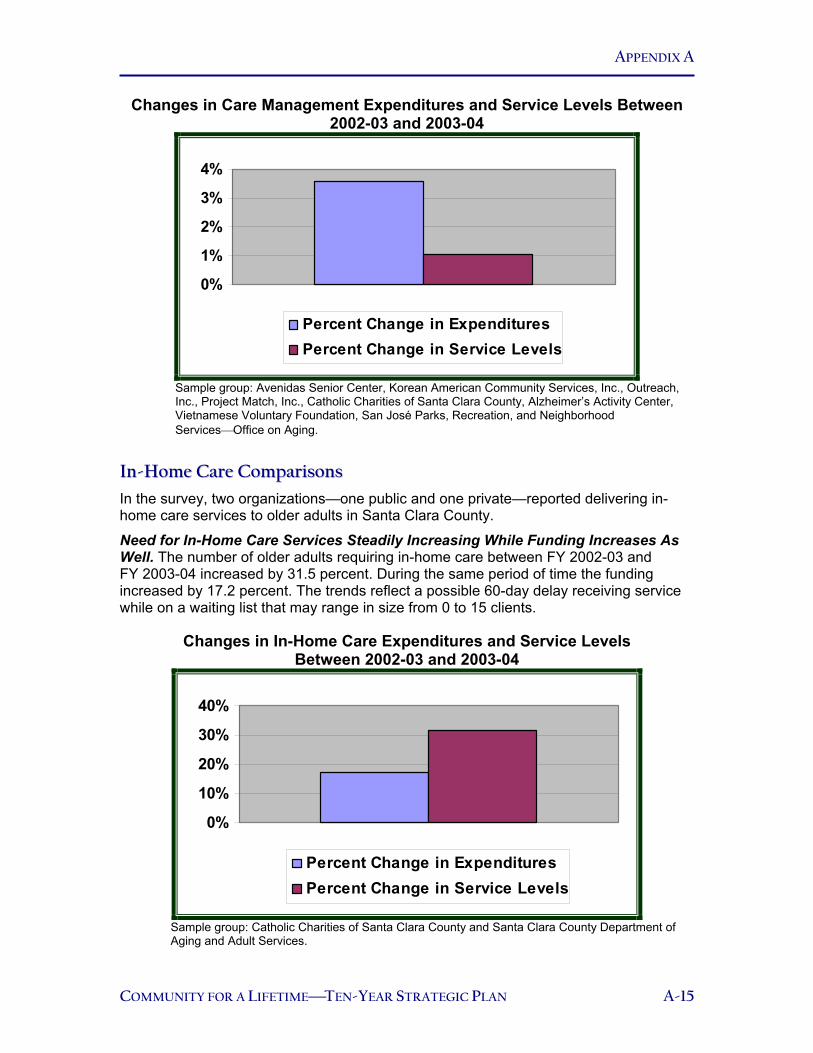
APPENDIX A
COMMUNITY FOR A LIFETIMETEN-YEAR STRATEGIC PLAN A-15
Changes in Care Management Expenditures and Service Levels Between 2002-03 and 2003-04
0%
1%
2%
3%
4%
Percent Change in ExpendituresPercent Change in Service Levels
Sample group: Avenidas Senior Center, Korean American Community Services, Inc., Outreach, Inc., Project Match, Inc., Catholic Charities of Santa Clara County, Alzheimer’s Activity Center, Vietnamese Voluntary Foundation, San José Parks, Recreation, and Neighborhood ServicesOffice on Aging.
IInn--HHoommee CCaarree CCoommppaarriissoonnss In the survey, two organizations—one public and one private—reported delivering in-home care services to older adults in Santa Clara County.
Need for In-Home Care Services Steadily Increasing While Funding Increases As Well. The number of older adults requiring in-home care between FY 2002-03 and FY 2003-04 increased by 31.5 percent. During the same period of time the funding increased by 17.2 percent. The trends reflect a possible 60-day delay receiving service while on a waiting list that may range in size from 0 to 15 clients.
Changes in In-Home Care Expenditures and Service Levels Between 2002-03 and 2003-04
0%
10%
20%
30%
40%
Percent Change in ExpendituresPercent Change in Service Levels
Sample group: Catholic Charities of Santa Clara County and Santa Clara County Department of Aging and Adult Services.
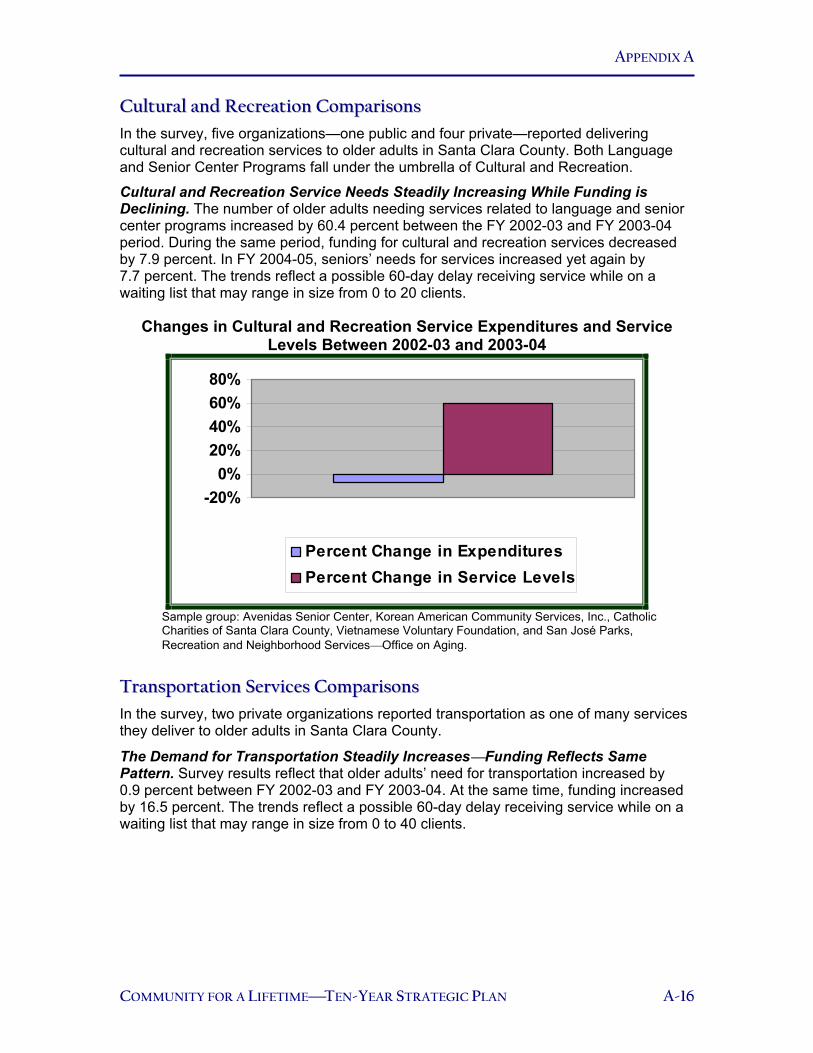
APPENDIX A
COMMUNITY FOR A LIFETIMETEN-YEAR STRATEGIC PLAN A-16
CCuullttuurraall aanndd RReeccrreeaattiioonn CCoommppaarriissoonnss In the survey, five organizations—one public and four private—reported delivering cultural and recreation services to older adults in Santa Clara County. Both Language and Senior Center Programs fall under the umbrella of Cultural and Recreation.
Cultural and Recreation Service Needs Steadily Increasing While Funding is Declining. The number of older adults needing services related to language and senior center programs increased by 60.4 percent between the FY 2002-03 and FY 2003-04 period. During the same period, funding for cultural and recreation services decreased by 7.9 percent. In FY 2004-05, seniors’ needs for services increased yet again by 7.7 percent. The trends reflect a possible 60-day delay receiving service while on a waiting list that may range in size from 0 to 20 clients.
Changes in Cultural and Recreation Service Expenditures and Service Levels Between 2002-03 and 2003-04
-20%0%
20%40%60%80%
Percent Change in ExpendituresPercent Change in Service Levels
Sample group: Avenidas Senior Center, Korean American Community Services, Inc., Catholic Charities of Santa Clara County, Vietnamese Voluntary Foundation, and San José Parks, Recreation and Neighborhood ServicesOffice on Aging.
TTrraannssppoorrttaattiioonn SSeerrvviicceess CCoommppaarriissoonnss In the survey, two private organizations reported transportation as one of many services they deliver to older adults in Santa Clara County.
The Demand for Transportation Steadily IncreasesFunding Reflects Same Pattern. Survey results reflect that older adults’ need for transportation increased by 0.9 percent between FY 2002-03 and FY 2003-04. At the same time, funding increased by 16.5 percent. The trends reflect a possible 60-day delay receiving service while on a waiting list that may range in size from 0 to 40 clients.
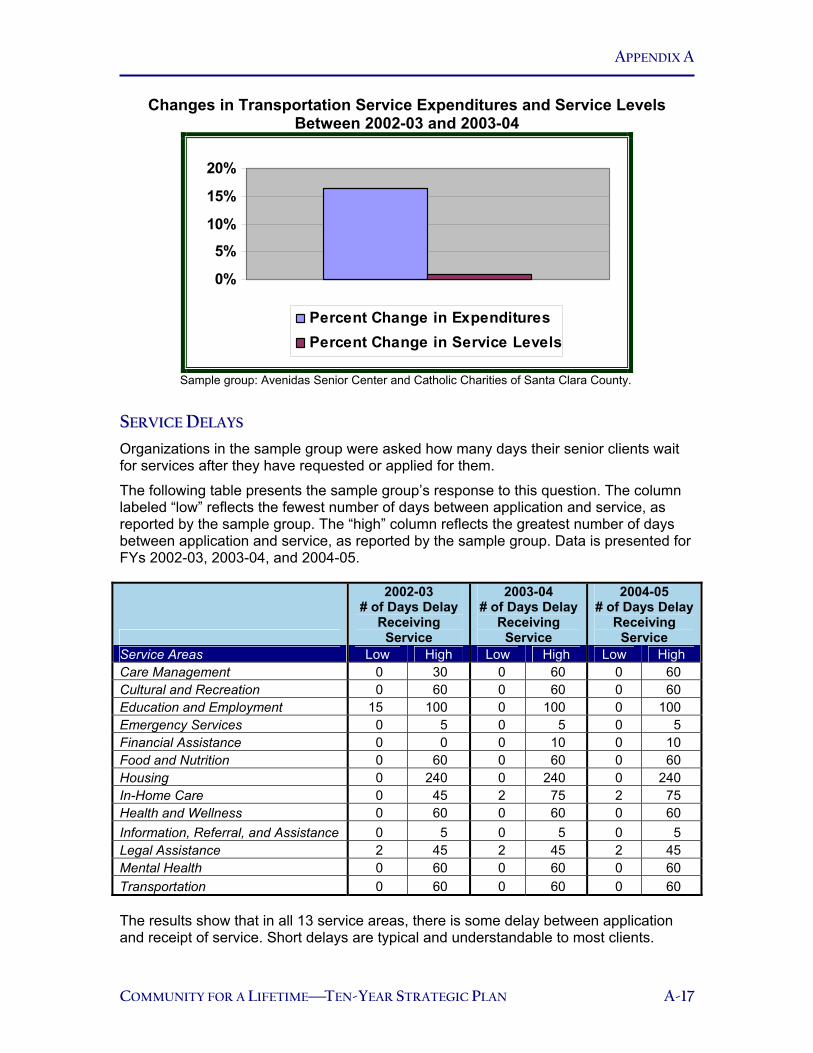
APPENDIX A
COMMUNITY FOR A LIFETIMETEN-YEAR STRATEGIC PLAN A-17
Changes in Transportation Service Expenditures and Service Levels Between 2002-03 and 2003-04
0%
5%10%
15%
20%
Percent Change in ExpendituresPercent Change in Service Levels
Sample group: Avenidas Senior Center and Catholic Charities of Santa Clara County.
SSEERRVVIICCEE DDEELLAAYYSS Organizations in the sample group were asked how many days their senior clients wait for services after they have requested or applied for them. The following table presents the sample group’s response to this question. The column labeled “low” reflects the fewest number of days between application and service, as reported by the sample group. The “high” column reflects the greatest number of days between application and service, as reported by the sample group. Data is presented for FYs 2002-03, 2003-04, and 2004-05.
2002-03 # of Days Delay
Receiving Service
2003-04 # of Days Delay
Receiving Service
2004-05 # of Days Delay
Receiving Service
Service Areas Low High Low High Low High Care Management 0 30 0 60 0 60 Cultural and Recreation 0 60 0 60 0 60 Education and Employment 15 100 0 100 0 100 Emergency Services 0 5 0 5 0 5 Financial Assistance 0 0 0 10 0 10 Food and Nutrition 0 60 0 60 0 60 Housing 0 240 0 240 0 240 In-Home Care 0 45 2 75 2 75 Health and Wellness 0 60 0 60 0 60 Information, Referral, and Assistance 0 5 0 5 0 5 Legal Assistance 2 45 2 45 2 45 Mental Health 0 60 0 60 0 60 Transportation 0 60 0 60 0 60
The results show that in all 13 service areas, there is some delay between application and receipt of service. Short delays are typical and understandable to most clients.

APPENDIX A
COMMUNITY FOR A LIFETIMETEN-YEAR STRATEGIC PLAN A-18
However, as the table shows, 11 out of the 13 service areas reported delays of 30 days or more.
WWAAIITTIINNGG LLIISSTTSS Results from the survey of a sample of 18 service providers show that waiting lists exist in the majority of service areas. The following table depicts the extent of waiting lists for each service area reported by the sample group. The column labeled “low” reflects the shortest waiting list reported by an organization in a particular service area. The “high” column reflects the longest waiting list reported by an organization in that service area. Data is presented for FYs 2002-03, 2003-04, and 2004-05.
2002-03 # of Clients on
Waiting List
2003-04 # of Clients on
Waiting List
2004-05 # of Clients on
Waiting List Service Areas Low High Low High Low High Care Management 0 350 0 500 0 870 Cultural and Recreation 0 20 0 18 0 23 Education and Employment 0 100 0 100 0 200 Emergency Services 0 0 0 0 0 0 Financial Assistance 0 0 0 10 0 10 Food and Nutrition 0 100 0 120 0 130 Housing 0 20 0 25 0 20 In-Home Care 0 0 0 10 0 15 Health and Wellness 0 50 0 100 0 150 Information, Referral, and Assistance 0 0 0 0 0 0 Legal Assistance 0 150 0 150 0 150 Mental Health 0 20 0 18 0 23 Transportation 0 25 0 30 0 40
As the table shows, in every service area above, at least one organization in the sample group had no waiting list. However, in 11 out of 13 service areas, organizations have experienced waiting lists of some kind in the last three years, the longest of which is reflected in the “high” column above. Only Emergency Services and Information, Referral and Assistance did the sample group organizations providing these services report no waiting lists in all three years.

COMMUNITY FOR A LIFETIMETEN-YEAR STRATEGIC PLAN B-1
AAPPPPEENNDDIIXX BB SSEENNIIOORR NNEEEEDDSS AASSSSEESSSSMMEENNTT OOFF SSAANNTTAA CCLLAARRAA CCOOUUNNTTYY SSUUMMMMAARRYY RREEPPOORRTT
BBAACCKKGGRROOUUNNDD The purpose of a strategic plan is to focus resources on addressing the issues that are of greatest priority and need to the community. Thus, effective strategic planning for aging services must start by asking older adults and their caregivers what services they need and rely upon. In May and June of 2004, the City of San José and County of Santa Clara undertook a Senior Needs Assessment for this purpose. MMEETTHHOODDOOLLOOGGYY
Three methods were utilized to identify older adults’ needs in Santa Clara Countya telephone survey, community input events, and expert interviews. Each method employed a different data collection technique, targeted different stakeholders, and compensated for inherent limitations in the other methods. While the phone survey’s quantitative data provided perspective on the general status of older adults and the prevalence of various needs in Santa Clara County’s senior population, the qualitative data from the community input and expert interviews brought greater focus to and appreciation for those needs. Collectively, the methods maximized participation, ensured comprehensiveness, and helped to pinpoint trends. The following is a description of each research method. MMeetthhoodd 11TTeelleepphhoonnee SSuurrvveeyy
A randomized telephone survey was used to conduct a broad assessment of the characteristics, status, and needs of older adults in Santa Clara County. The survey instrument built upon a Senior Needs Assessment survey conducted in Santa Clara County in 1989 and included questions pertaining to essential needs, health and wellness, independence, and community engagement. The survey instrument was developed in consultation with the Strategic Plan Advisory Group. Telephone survey interviewers used a method called “random digit dial” to call both listed and unlisted telephone numbers in Santa Clara County. The telephone numbers were generated at random, with no bias toward geography or any other demographic factor. Telephone interviewers sought out households that included an adult aged 60 years or older. They made calls during the day, in the evening, and on weekends to avoid bias toward any particular lifestyle. Telephone interviewers were equipped to conduct the interview in the five most predominantly spoken languages in the countyEnglish, Spanish, Mandarin, Vietnamese, and Tagalog. Of those adults that were old enough to qualify for the telephone interview, roughly 50 percent agreed to participate. No data was collected on why individuals refused to participate, or which individuals refused—in terms of demographic make-up. However, two possible reasons may have included concern about sharing information over the phone to someone they do not know, or a lack of time to participate.
APPENDIX B
COMMUNITY FOR A LIFETIMETEN-YEAR STRATEGIC PLAN B-2
Telephone calls were made until a sample of 504 older adults completed telephone interviews. This enabled the survey results to be scientifically rigorous—at a 95 percent confidence level. In other words, the sample size ensures 95 percent certainty that the results reflect the larger population of non-institutionalized older adults in Santa Clara County. In addition, the survey responses have a 4.37 percent margin of error, which means that each response is accurate within a range of +/- 4.37 percentage points. It is important to recognize that each percentage point in the survey translates into roughly 2,200 older adults in Santa Clara County. Therefore, even relatively small percentages reflect the needs or status of a sizeable number of older adults. This research method was advantageous for several reasons: it allowed older adults to participate in the needs assessment without leaving their homes; it reached out to older adults without bias; and, it allowed the city and county to get an accurate picture of the needs and status of non-institutionalized older adults in the county through statistical sampling. The telephone survey also had its limitations: it could not reach older adults who do not own telephones; it could not reach older adults in institutional settings; and while the methodology for identifying older adults was random, results from the interviews show that there was some bias regarding which older adults were willing to participate in the interviews. Namely, older adults of Asian and Latino descent refused to be interviewed at higher rates than non-Hispanic Whites and African-Americans. As a result, these ethnic groups are underrepresented in the survey population. Conscious efforts were made to compensate for this limitation in the community input events through targeted outreach to these communities. Local advocates and services providers who work with ethnic groups of older adults noted that this lack of participation by minorities was not surprising, particularly with respect to Asian seniors. These experts indicated that the Asian seniors they work with are highly reluctant to provide information over the phone to strangers. In addition, researchers have found that members of immigrant groups are reluctant to provide information to the government for fear of negative consequences regarding public benefits and citizenship status. Future needs assessment efforts will need to consider how to compensate for this behavior when attempting to gather statistically valid sample data. MMeetthhoodd 22CCoommmmuunniittyy IInnppuutt EEvveennttss
The city and county hosted two “town hall meetings,” 20 focus groups with older adults and those concerned about their needs, and a “virtual focus group” of homebound seniors who could not otherwise attend an event. In total, over 630 individuals were reached through these events. The community input events enabled older adults to share their needs and concerns in greater depth than the telephone survey permitted. They also allowed community members who had not been eligible for the phone survey—such as younger caregivers of seniors—to share their perspectives. Finally, the events provided a setting in which some seniors felt more comfortable participating than in the telephone survey. This had the effect of boosting representation by communities within the older adult population—including Asians and Latinos—and enriching the city’s and county’s understanding of older adults’ needs in general.

APPENDIX B
COMMUNITY FOR A LIFETIMETEN-YEAR STRATEGIC PLAN B-3
Town Hall MeetingsThe town hall meetings were held at Berryessa Community Center and Southside Community and Senior Centerboth in San José where the greatest concentration of older adults live. Announcements of these events were published in local papers, broadcast on local radio stations, posted at senior centers around the county, inserted in senior center newsletters, and distributed to older adults by agencies that serve them. The announcements were produced in five languages—English, Spanish, Mandarin, Vietnamese, and Tagalog. To encourage attendance, the Mayor’s Office of San José sponsored free cab rides to and from the events, to ensure that all individualsincluding those with impaired mobility had safe and obtainable transportation. Over 23 percent of the town hall participants utilized this free service. At each event, participants broke out into smaller discussion groups of 8 to 15 members. Each group was led by a facilitator who asked the group a list of pre-set questions, and a note taker documented the group’s input on a recording worksheet. Interpreters were available to translate discussions into Spanish, Mandarin, Cantonese, Vietnamese, Tagalog, and sign language. The discussions centered on the most pressing needs of seniors today and how local government and community-based organizations could help address those needs. The town hall meetings were an effective method for inviting broad participation by anyone interested in discussing older adults’ needs in Santa Clara County. A total of 365 individuals attended the town hall meetings. The events’ participants were geographically and ethnically diverse—representing almost every region of the county and including those who were Latino, Vietnamese, Chinese, Korean, Punjabi, Filipino, and African-American. Focus GroupsFocus groups offered the most intimate and private setting for older adults and their caregivers to share their service needs and priorities. The Strategic Plan Advisory Group identified 16 communities to invite to focus groups. These were:
• Korean seniors
• Chinese seniors
• Vietnamese seniors
• Filipino seniors
• Latino seniors
• Indo American (Hindi and Punjabi) seniors
• Mountain View and Los Altos seniors
• West San José seniors
• Willow Glen seniors
• Morgan Hill seniors
• Gilroy seniors

APPENDIX B
COMMUNITY FOR A LIFETIMETEN-YEAR STRATEGIC PLAN B-4
• Lesbian, gay, bisexual, and transgender seniors
• Caregiving seniors
• Senior center/nutrition site staff
• Family caregivers of seniors
• Seniors in residential care In some cases, multiple groups from the same community wished to participate in a focus group. Consequently, 20 focus groups were convened with 16 communities. These communities were selected to participate in focus groups for one or both of the following reasons: focus groups were perceived as a more comfortable and culturally sensitive setting for the community to share its needs; and focus groups offered a way to bolster the community’s representation in the needs assessment. These settings were also more accessible for some participants, such as caregivers. Adult day care and child care were offered during these focus groups. A total of 238 individuals participated in the focus groups, with groups ranging in size from 6 to 31 participants. Strategic Plan Advisory Group members volunteered to facilitate the focus groups, or secured staff with the language and cultural competencies needed, using uniform focus group guides and questions. Phone Interviews with Homebound SeniorsThe needs assessment effort also reached out to seniors who were unable to leave their homes to attend a community input event. Staff volunteers conducted phone interviews with a randomized sample of 29 participants of the county’s In-Home Supportive Services and Senior Nutrition programs. These seniors were asked questions similar to those asked in the traditional focus groups. Their responses were documented, compiled, and incorporated into the analysis of seniors’ needs.
MMeetthhoodd 33EExxppeerrtt IInntteerrvviieewwss
Expert interviews comprised the third arm of the Senior Needs Assessment. Knowledgeable service providers, policy makers, and community leaders within Santa Clara County were asked to share their insights about the service needs of older adults and the community’s capacity to respond to them. Input from these experts offered a valuable point of reference to older adults’ responses in the phone survey and community input events. The Strategic Plan Advisory Group identified local experts whose policy and service expertise included that of health, transportation, housing, nutrition, information and referral, in-home supportive services, elder abuse, recreation, education, and community services. In some instances, individuals recommended for interviews could not be reached, despite multiple attempts. In all, 32 interviews were conducted with 40 individuals—either in person, by phone, or by email. Each expert was asked the same set of questions pertaining to the needs of older adults in Santa Clara County and the county’s service capacity and leadership in addressing those needs.

APPENDIX B
COMMUNITY FOR A LIFETIMETEN-YEAR STRATEGIC PLAN B-5
AANNAALLYYTTIICCAALL MMEETTHHOODDOOLLOOGGYY Results were first examined independently to identify the most frequently cited needs from each of the three research methods—telephone survey, community input events, and expert interviews. These findings were then compared across research methods for common themes. When a need was noted with great frequency in the results of two or more research methods, that need was considered significant and one that warranted focus from the community in the strategic plan.
MMEETTHHOODDOOLLOOGGIICCAALL LLIIMMIITTAATTIIOONNSS By undertaking a community-driven approach to strategic planning, the process ensured that the service needs identified reflected pervasive local issues and that the strategies for solving them were realistic and feasible for organizations to undertake in Santa Clara County. This approach also introduced some limitations that are important to note. The randomized telephone survey could not reach older adults who do not own telephones; it could not reach older adults in institutional settings; and while the methodology for identifying older adults was random, results from the interviews show that there was some bias regarding which older adults were willing to participate in the interviews. Namely, older adults of Asian and Latino descent refused to be interviewed at higher rates than non-Hispanic whites and African-Americans. As a result, these ethnic groups are underrepresented in the phone survey population. Conscious efforts were made to compensate for this limitation in the community input events through targeted outreach to these communities.
Local advocates and services providers who work with ethnic groups of older adults noted that this lack of participation by minorities was not surprising, particularly with respect to Asian seniors. These experts indicated that the Asian seniors they work with are highly reluctant to provide information over the phone to strangers. In addition, researchers have found that members of immigrant groups are reluctant to provide information to the government for fear of negative consequences regarding public benefits and citizenship status. Future needs assessment efforts will need to consider how to compensate for this behavior when attempting to gather statistically valid sample data. In addition, soliciting input from over 1,100 community members meant that myriad service needs were raised through the course of the needs assessment. Not all of these needs could be addressed in the strategic plan. By its nature, a strategic plan needs to focus on select issues that are pervasive in a community. For this reason, only those needs that were common across community input methods were highlighted in the plan. Relying on community members’ input to identify pervasive service needs also meant that needs that are particularly sensitive or difficult for individuals to express were unlikely to present themselves in the needs assessment and, consequently, in the strategic plan. Service needs related to mental health, elder abuse, and end-of-life care, for example, are often uncomfortable topics for discussion and were not commonly noted during the needs assessment. These areas of need warrant assessment through other means and community action to address them.
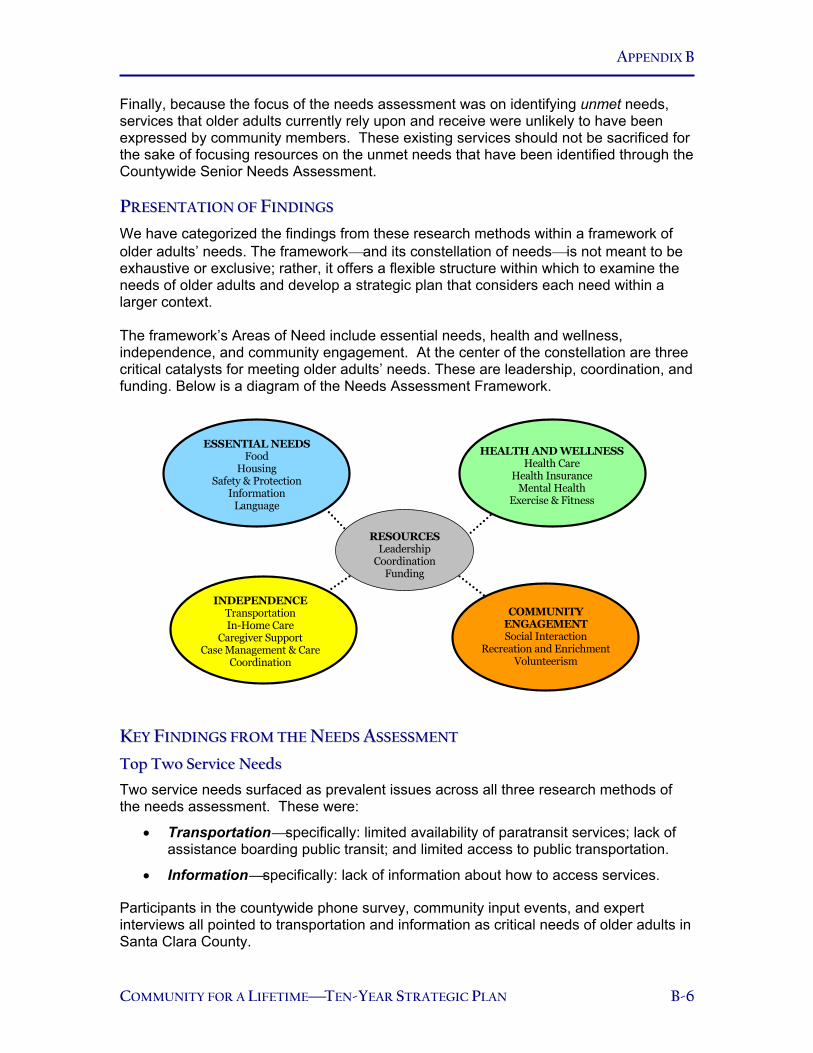
APPENDIX B
COMMUNITY FOR A LIFETIMETEN-YEAR STRATEGIC PLAN B-6
Finally, because the focus of the needs assessment was on identifying unmet needs, services that older adults currently rely upon and receive were unlikely to have been expressed by community members. These existing services should not be sacrificed for the sake of focusing resources on the unmet needs that have been identified through the Countywide Senior Needs Assessment.
PPRREESSEENNTTAATTIIOONN OOFF FFIINNDDIINNGGSS We have categorized the findings from these research methods within a framework of older adults’ needs. The frameworkand its constellation of needsis not meant to be exhaustive or exclusive; rather, it offers a flexible structure within which to examine the needs of older adults and develop a strategic plan that considers each need within a larger context. The framework’s Areas of Need include essential needs, health and wellness, independence, and community engagement. At the center of the constellation are three critical catalysts for meeting older adults’ needs. These are leadership, coordination, and funding. Below is a diagram of the Needs Assessment Framework.
KKEEYY FFIINNDDIINNGGSS FFRROOMM TTHHEE NNEEEEDDSS AASSSSEESSSSMMEENNTT
TToopp TTwwoo SSeerrvviiccee NNeeeeddss
Two service needs surfaced as prevalent issues across all three research methods of the needs assessment. These were:
• Transportationspecifically: limited availability of paratransit services; lack of assistance boarding public transit; and limited access to public transportation.
• Informationspecifically: lack of information about how to access services.
Participants in the countywide phone survey, community input events, and expert interviews all pointed to transportation and information as critical needs of older adults in Santa Clara County.
RESOURCESLeadership
CoordinationFunding
INDEPENDENCETransportationIn-Home Care
Caregiver SupportCase Management & Care
Coordination
HEALTH AND WELLNESSHealth Care
Health InsuranceMental Health
Exercise & Fitness
COMMUNITYENGAGEMENTSocial Interaction
Recreation and EnrichmentVolunteerism
ESSENTIAL NEEDSFood
HousingSafety & Protection
InformationLanguage

APPENDIX B
COMMUNITY FOR A LIFETIMETEN-YEAR STRATEGIC PLAN B-7
AAddddiittiioonnaall KKeeyy SSeerrvviiccee NNeeeeddss
Six more service needs arose as top concerns to older adults in two of the three input methods. These were:
• Housingspecifically: lack of access to affordable housing and lack of affordable home repair.
• Languagespecifically: more prevalent lack of information about services for older adults who do not speak English as a primary language.
• Health Carespecifically: lack of health professionals with gerontology/geriatric training and poor linkages between health care and long-term care.
• In-Home Carespecifically: shortage of affordable in-home care services and lack of care management services.
• Caregiver Supportspecifically: lack of support for older adults’ caregiving. • Senior Center Programsspecifically: desire for senior centers to provide
access to information and assistance services, including legal assistance, and management and coordination services for people who need in-home care or assisted living; and the need for senior centers to prepare to serve the disparate interests of baby boomers and older seniors.
These key needs are not listed in any priority order, as each was given the same valuation for being one of the most commonly cited needs in two of the three research methods.
KKeeyy RReessoouurrccee NNeeeeddss Only in the expert interviews were participants asked about resource needs for senior services. Experts pointed to two types of resources that they felt were critical to advancing the well-being of older adults in Santa Clara County. These were:
• Leadership and Coordinationspecifically: lack of coordinated leadership and advocacy for aging services.
• Fundingspecifically: stagnating or decreasing funding for services despite increase in need for services.
Below, we present a summary of these key findings by Area of Need within the Needs Assessment Framework.

APPENDIX B
COMMUNITY FOR A LIFETIMETEN-YEAR STRATEGIC PLAN B-8
• Housing • Information • Language
HOUSING Affordable housing was noted as a serious concern by older adults and aging services experts. While the telephone survey showed housing/home repair as a problem facing a small percentage of older adults, it is one that has a critical impact on the well-being of those seniors.
• Affordable housing was the third most common need cited in both the community input events and the expert interviews.
• Over 5 percent of survey respondents reported that they were not very confident or not at all confident that they could stay in their homes as long as they would like. The most common reasons for this doubt were:
− Financial reasons/money
− Medical/health reasons
− Stairs
• Almost 6 percent of older adults reported that they did not have enough money sometime in the last year to pay for needed repairs to their home.
INFORMATION The need for information to access needed services was prominent in both the community input events and the telephone survey.
• Information and referral assistance was the fifth most common need raised in the community input events. It was also the second most frequently cited service that older adults stated they rely upon and feel is important to preserve.
• Over 6 percent of older adults reported in the phone survey that they have difficulty or need assistance obtaining information about how to access services they need. Of these, almost 60 percent stated that no one is helping them obtain information.
• Information and referral services were requested by survey respondents more often than any other possible senior center service: 53 percent of older adults would like to see a senior center in their area offer information and referral services.
• For those older adults who reported a need for assistance of some kind but are not receiving it, their most frequent reason for this unmet need was that they do not know who to turn to or where to get the help.
LANGUAGE Language barriers were the sixth most common concern of participants in the community input events, and while the phone survey did not find language to be a
ESSENTIAL NEEDS

APPENDIX B
COMMUNITY FOR A LIFETIMETEN-YEAR STRATEGIC PLAN B-9
prevalent barrier to needed services, this is likely attributable to the under-representation of non-English speakers in the phone survey population. Because “information” was a predominant issue across all research methods, we include language in the key findings because it is a critical component of satisfying information needs. For example:
• A greater proportion of non-English speaking older adults reported the need for assistance in obtaining information to access services: 13.7 percent compared to 5.6 percent of those who speak English.
• Non-English speaking older adults were more interested than English speakers in the availability of information and referral services at local senior centers: 74.5 percent versus 50.6 percent, respectively.
• Health Care and Insurance
HEALTH CARE and INSURANCE Health care and health insurance were notable issues across all three research methods.
• Health care was the second most common issue raised in the community input events. Concerns included the high cost of care, the lack of health care clinics, and lack of medical professionals with geriatric and gerontology training.
• Health care was the fourth most common issue raised in the expert interviews. Experts noted the rising costs of care, prescriptions, and insurance. They also pointed out the poor linkage between health care and long-term care for older adults.
• In the phone survey, while almost 95 percent of older adults reported that they have health insurance, the rate of insurance varied by race/ethnicity and age.
− According to the survey, 12.2 percent of Asian, Latino, and African-American older adults were uninsured compared to 2.4 percent of non-Hispanic White older adults.
− Younger seniors were also more likely to be uninsured: 10.2 percent of adults aged 60 to 64 years reported being uninsured compared to roughly 2.8 percent of 65- to 84-year-olds and 6.1 percent of those 85 and older.
HEALTH & WELLNESS

APPENDIX B
COMMUNITY FOR A LIFETIMETEN-YEAR STRATEGIC PLAN B-10
• Transportation • In-Home Care • Caregiver Support
TRANSPORTATION Transportation was a prominent issue across all three research methods.
• Transportation was the most common issue raised in both the community input events and the expert interviews. Concerns included the cost of transportation, lack of accessible transportation, lack of coordination between bus and light rail schedules and among senior centers, lack of escorted transportation, and lack of assistance boarding public transit.
• Transportation was most often cited in the community input events as a service older adults rely upon and feel is important to preserve.
• Over 10 percent of older adults reported that they have difficulty or need assistance using transportation or going outside of the home to shop or visit the doctor. Of these, over 55 percent stated that no one is helping them get around.
• In the survey, older seniors were more likely to need help getting outside of the home or using transportation than their younger counterparts: 24.2 percent of adults 85 and older reported this need, compared to 14.7 percent of 75- to 84-year-olds, and 6.4 percent of 60- to 74-year-olds.
• In addition, non-English speaking older adults were more likely than English speakers to need help getting outside of the home or using transportation: 27.4 percent versus 7.6 percent, respectively.
• Non-English speaking older adults were less able to get where they wanted to go
than their English-speaking counterparts: 15.7 percent reported sometimes, rarely, or almost never get there versus 5.4 percent, respectively.
IN-HOME CARE The need for in-home care was a noteworthy issue in the community input events, the expert interviews, and the phone survey.
• Participants of the community input events cited in-home supportive services as one of the top five services they rely upon and feel is important to preserve.
• Experts cited the need for in-home supportive services more often than any other issue except transportation. Concerns related to the lack of affordable low-cost in-home services, delays in providing the service once applications have been submitted, lack of home-delivered meals, and lack of adequate care management.
• Over 13 percent of older adults in the phone survey reported that they have difficulty or need assistance with some kind of activity of daily living—such as bathing or preparing a meal—or with an instrumental activity of daily living like going shopping. Of the older adults needing this assistance, 41.2 percent stated that they do not currently receive any help.
INDEPENDENCE
APPENDIX B
COMMUNITY FOR A LIFETIMETEN-YEAR STRATEGIC PLAN B-11
• A greater proportion of non-English speaking older adults were in need of assistance with personal care than their English-speaking counterparts: 7.8 percent compared to 0.7 percent, respectively.
• A greater proportion of older seniors have disabilities that limit their activities than younger seniors: 36.7 percent of 75- to 84-year-olds and 42.4 percent of those 85 years and older report having disabilities, compared to 22 percent of 60- to 64-year-olds and 27.7 percent of 65- to 74-year-olds.
CAREGIVER SUPPORT Caregiver support presented itself in the expert interviews and in the phone survey.
• Experts raised the issue of caregiver support in 16 out of 32 interviews. Concerns included the need for adult day care; lack of respite for caregivers; the need to provide services in culturally sensitive ways; and lack of information about available services for caregivers.
• According to the phone survey, almost one-quarter of older adults are caregivers—providing or arranging care for someone other than themselves.
• Over 23 percent of senior caregivers reported in the survey that they only sometimes, rarely, or never get relief when they need time off from caregiving.
• Non-English speaking older adults were more likely to be caregivers than their English-speaking counterparts: 41.2 percent compared to 22 percent, respectively.
• Just over 88 percent of senior caregivers provide care for a single generationmost commonly for a spouse or partner (40 percent) or for a parent or in-law (18 percent). However, almost 12 percent care for multiple generationssuch as a child and a spouse, a grandchild and parent or in-law, and so forth.
• Senior Center Programs
SENIOR CENTER PROGRAMS Senior centers are an outlet for many older adults’ community engagement. Results from the phone survey reflected appreciable growth in older adults’ attendance at senior centers and a desire to access more community opportunities. At the community input events, preserving and expanding senior center programs was the sixth most common need cited.
• At community input events, participants commonly noted the need to keep senior centers operating; to offer more social opportunities through the senior centers such as trips, clubs, cultural events, etc; and the need to offer a wider variety of programs that stimulate seniors both mentally and physically.
COMMUNITY ENGAGEMENT
APPENDIX B
COMMUNITY FOR A LIFETIMETEN-YEAR STRATEGIC PLAN B-12
• Senior center programs were one of the five services most frequently cited by community input participants as those that older adults rely upon and feel should be preserved. Meal programs at senior centers were specifically cited as critical to older adults’ well-being.
• According to results from the 2004 and 1989 surveys, attendance at senior centers has increased almost 64 percent since 1989, from 18.2 percent to 29.8 percent.
• Of the almost 30 percent of older adults that have visited a senior center in the last six months, over 52 percent of older adults did so primarily for social or recreational reasons; while over 25 percent did so to access health and human services.
• When asked which services older adults would like to see at their local senior center, the most popular interests were information and referral services, legal assistance, and management and coordination services for people who need in-home services or assisted living.
• Leadership and Coordination • Funding The issues of leadership, coordination, and funding were
among those most often raised during the expert interviews. While these issues were not reflected in the community input findings or phone survey results, this is because the question of needed community resources was not asked of older adults in these methods. We present them among our key findings of the overall needs assessment because of the importance local experts placed on these resources as needs for delivering effective aging services to Santa Clara County’s older adults. LEADERSHIP Thirty of the 32 group or individual interviews responded to the question of leadership. Of those 30 who commented on the subject, 16 raised concerns and 14 made positive or neutral comments about the extent of leadership on aging in the community. Generally, all 30 of the leadership comments acknowledged key individuals in the community who have demonstrated leadership on aging issues in the county. Concerns raised in 16 of the interviews centered around the need for more coordinated leadership, rather than individual efforts. Examples of perceived leadership weaknesses included:
• Leadership is fragmented.
• Lack of clarity about which organizations are responsible for various aspects of aging services.
• Lack of leadership at the state, county, and city level.
• Lack of senior advocacy.
• Lack of a leadership coalition that prioritizes which services need to be funded/provided and in which order.
RESOURCES

APPENDIX B
COMMUNITY FOR A LIFETIMETEN-YEAR STRATEGIC PLAN B-13
COORDINATION The coordination/collaboration issue was raised in 15 of the 32 expert interviews. Common themes that emerged regarding the coordination and/or collaboration of services include:
• Lack of coordination among city, county, and community-based organizations.
• Lack of coordination with the health department. • Lack of overall vision in the county. • Fragmentation. • Lack of information sharing. • Need to eliminate the duplication of services and turf wars. • Failure to implement new policies and procedures. • Lack of a strategic plan.
FUNDING Funding was an issue raised in 15 interviews. There was great concern expressed regarding the “tidal wave” in the aging population (including baby boomers and frail elderly persons), resulting in the need for increased services. Concern was also raised regarding the frequent funding cuts that services experience. Common themes that emerged regarding funding include:
• Inconsistent federal, state, and local funding streams. • Decrease in funding for services while the number of older adults is
increasing. • Cutbacks in funding threaten the safety-net services that have a successful
track record. • Absence of secure adult protective services funding. • Lack of local control and the existence of too much top-down funding. • Lack of adequate funding to keep community-based organizations functioning
to meet the needs of at-risk seniors. • Concern that city programs are moving to a fee-based model. • Possibility of impending staff layoffs related to funding cuts that would result
in further reduced services. FFIINNDDIINNGGSS BBYY RREESSEEAARRCCHH MMEETTHHOODD
FFiinnddiinnggss ffrroomm tthhee TTeelleepphhoonnee SSuurrvveeyy In this section of the needs assessment report, we present key findings from the countywide phone survey of 504 older adults. Where possible, key findings are compared to those of a needs assessment survey that was conducted in 1989. Some key findings compare responses across subgroups of survey respondents. In these cases, the differences between groups’ responses were tested and found to be statistically significant. In other words, we are highly confident that these differences are not random; rather, they reflect true disparities in status and/or need.

APPENDIX B
COMMUNITY FOR A LIFETIMETEN-YEAR STRATEGIC PLAN B-14
Below, we report the demographic characteristics of the survey respondents and then present the status of older adults in regard to their reported essential needs, health and wellness, independence, and community engagement. DDEEMMOOGGRRAAPPHHIICC CCHHAARRAACCTTEERRIISSTTIICCSS
The following demographic data provides a snapshot of the population of older adults in Santa Clara County in 2004. AGE Of adults 60 years and older, those 65 to 74 years of age comprise the largest age group. Compared to the 1989 survey, those 75 to 84 years of age and 85 and older have shown the greatest growth in population size.
Age Group Percent in 2004 Percent in 1989 60-64 25.2% 29.8% 65-74 36.5 48.6 75-84 21.6 18.5 85 and older 6.5 3.1 Refused 9.9 0.0 Don’t know .2 0.0 Totals 100.0% 100.0%
GENDER The older adult populationboth in the phone survey and according to Census datais comprised of more women than men, a disparity that increases with age.
Gender Percent in 2004 Survey
Male 37.5%Female 62.5Total 100.0%
Age Group Percent in 2004 Survey (Males)
Percent in 2004 Survey
(Females) Total
60-64 40.9% 59.1% 100.0% 65-74 38.6 61.4 100.0 75-84 33.0 67.0 100.0 85 and older 36.4 63.6 100.0
RACE/ETHNICITY The older adult population of Santa Clara County is very diverse racially. While most older adults are non-Hispanic White, other racial/ethnic groups comprise a large minority, including 20.4 percent who are Asian.
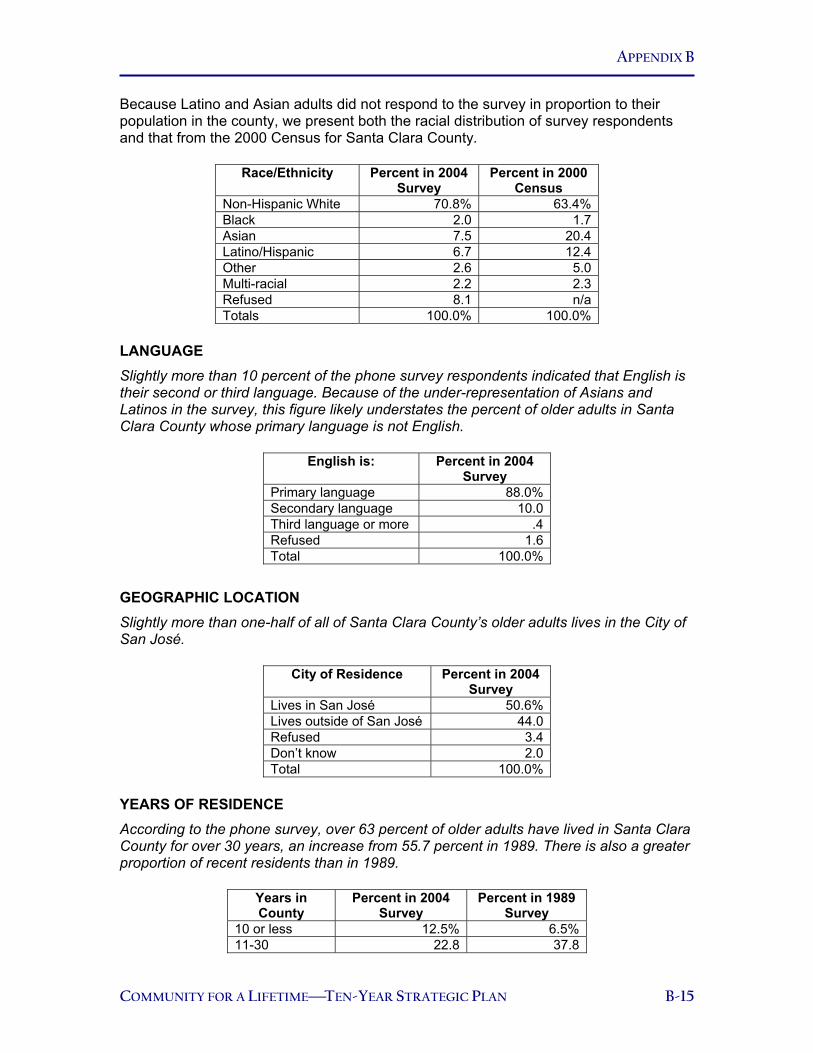
APPENDIX B
COMMUNITY FOR A LIFETIMETEN-YEAR STRATEGIC PLAN B-15
Because Latino and Asian adults did not respond to the survey in proportion to their population in the county, we present both the racial distribution of survey respondents and that from the 2000 Census for Santa Clara County.
Race/Ethnicity Percent in 2004 Survey
Percent in 2000 Census
Non-Hispanic White 70.8% 63.4% Black 2.0 1.7 Asian 7.5 20.4 Latino/Hispanic 6.7 12.4 Other 2.6 5.0 Multi-racial 2.2 2.3 Refused 8.1 n/a Totals 100.0% 100.0%
LANGUAGE Slightly more than 10 percent of the phone survey respondents indicated that English is their second or third language. Because of the under-representation of Asians and Latinos in the survey, this figure likely understates the percent of older adults in Santa Clara County whose primary language is not English.
English is: Percent in 2004 Survey
Primary language 88.0%Secondary language 10.0Third language or more .4Refused 1.6Total 100.0%
GEOGRAPHIC LOCATION Slightly more than one-half of all of Santa Clara County’s older adults lives in the City of San José.
City of Residence Percent in 2004 Survey
Lives in San José 50.6%Lives outside of San José 44.0Refused 3.4Don’t know 2.0Total 100.0%
YEARS OF RESIDENCE According to the phone survey, over 63 percent of older adults have lived in Santa Clara County for over 30 years, an increase from 55.7 percent in 1989. There is also a greater proportion of recent residents than in 1989.
Years in County
Percent in 2004 Survey
Percent in 1989 Survey
10 or less 12.5% 6.5% 11-30 22.8 37.8

APPENDIX B
COMMUNITY FOR A LIFETIMETEN-YEAR STRATEGIC PLAN B-16
30 or more 63.2 55.7 Refused 2.4 0.0 Totals 100.0% 100.0%
HOUSEHOLD INCOME In 2000, the median household income of Santa Clara County adults aged 55 to 64 was $80,600. The median household income of 65- to 74-year-olds was $49,400. This Census data roughly comports with the household incomes of the phone survey respondents.
Household Income Range
Percent in 2004 Survey
Less than $15,000 7.3%$15,000-$24,999 8.3$25,000-$49,999 17.7$50,000-$74,999 14.1$75,000-$100,000 8.3More than $100,000 10.7Refused/don’t know 33.5Total 100.0%
EMPLOYMENT STATUS According to the phone survey, almost 31 percent of Santa Clara County’s older adults are working or looking for work, and over 65 percent are retired. In the phone survey, those looking for work were between the ages of 60 and 74.
Employment Status Percent in 2004 Survey
Working full-time 18.8%Working part-time 8.5Looking for work 3.6Retired 65.5On disability .4Has never worked .2Refused/don’t know 3.0Total 100.0%
EDUCATIONAL ATTAINMENT Based on the phone survey sample, almost 90 percent of Santa Clara County’s older adults are high school graduates, and almost 40 percent have four-year college degrees.
Educational Attainment Percent in 2004 Survey
Less than high school 7.1%High school graduate 20.8Vocation/trade certificate 1.8Some college 19.0Two-year degree 9.3Four-year degree or higher 39.5Refused/don’t know 2.4Total 100.0%
APPENDIX B
COMMUNITY FOR A LIFETIMETEN-YEAR STRATEGIC PLAN B-17
LIVING ARRANGEMENT Since 1989, there has been a slight increase in the number of older adults in Santa Clara County who are living alone, from 26.9 percent to 30 percent, according to the two phone surveys. Most older adults live with their spouses or partners.
Living Arrangement Percent in 2004 Survey
Lives alone 30.0%Lives with spouse or partner
43.5
Three in household 13.7Four in household 5.4Five or more in household 5.4Refused/don’t know 2.0Total 100.0%
HOME OWNERSHIP According to the phone survey, in 2004, over 80 percent of older adults owned their homes and almost 15 percent rented. This reflects a slight decrease in home ownership since the 1989 survey.
Home Ownership Percent in 2004 Survey
Percent in 1989 Survey
Own 80.4% 87.8% Rent 14.7 12.2 Other 2.4 0.0 Refused/don’t know 2.6 0.0 Totals 100.0% 100.0%
AARREEAASS OOFF NNEEEEDD
In this assessment, we define essential needs as those relating to food, shelter, safety and protection, language, and information about available services.
KKeeyy FFiinnddiinnggss
FOOD • Roughly 4 percent of older adults reported that they did not have enough money
to buy the groceries they needed sometime in the past year.
ESSENTIAL NEEDS

APPENDIX B
COMMUNITY FOR A LIFETIMETEN-YEAR STRATEGIC PLAN B-18
HOUSING • Over 90 percent of Santa Clara County’s older adults reported that they are
either very confident or somewhat confident that they will be able to live in their current homes as long as they would like.
• Over 15 percent of older adults reported that they have difficulty making needed repairs or changes to their homes. Of these, over 27 percent stated that no one is helping them make needed house repairs.
• Non-Hispanic White older adults were more likely to report a need for assistance with home repair than Asian, Latino, and African-American older adults, as a group: 17.4 percent compared to 8.5 percent, respectively.
• Almost 6 percent of older adults reported that they did not have enough money sometime in the last year to pay for needed repairs to their home.
SAFETY AND PROTECTION
• Over 98 percent of older adults in the phone survey felt very safe or somewhat safe in their neighborhoods. Non-English speaking older adults were more likely to feel unsafe in their neighborhoods than their English-speaking counterparts: 5.9 percent compared to 1.4 percent, respectively.
• Almost 6 percent of older adults reported that they know someone who is
experiencing, or who has experienced, abuse or neglect. Of these, roughly 55 percent believed those victims know where to seek help or protection.
• Over 52 percent of older adults would like senior centers to offer legal services. Adults aged 60 to 64 years are more interested in accessing legal services at their local senior centers than any other age group: 65.4 percent of them requested it in the phone survey, compared to 55.4 percent of 65- to 74-year-olds, 33 percent of 75- to 84-year-olds, and 30.3 percent of those aged 85 and older. Adults aged 60 to 64 years requested this service more than any other possible service at a senior center.
• Almost 6 percent of older adults reported that they have difficulty or need assistance taking care of legal matters such as wills or trusts. Of these, over 57 percent indicated that no one is helping them with these legal issues.
• According to the survey, non-English speaking older adults have greater difficulty taking care of legal matters than those who speak English: 11. 8 percent versus 4.9 percent, respectively.
LANGUAGE • Over 4 percent of older adults reported that they have difficulty translating things
into a language other than English. As mentioned earlier, this statistic probably undercounts the true needs related to language barriers, as some of the ethnic groups that were underrepresented in the survey population were likely non-English speakers.
• Of the 4 percent of older adults that reported difficulty translating things into a language other than English, almost 62 percent reported that no one is helping them translate. Of those who need this help and are receiving assistance, over

APPENDIX B
COMMUNITY FOR A LIFETIMETEN-YEAR STRATEGIC PLAN B-19
87 percent of those helping are unpaid family or friends. This last finding may overstate the reliance on unpaid family or friends. According to an advocate who works with non-English speaking older adults, many of them refer to their community workers and case managers as “friends.”
• A higher proportion of non-English speaking older adults report needing assistance with translating things into another language: 13.7 percent versus 2.6 percent of English speakers.
INFORMATION • When asked to name their most common sources for information about services,
older adults most frequently provided the following sources: Family or friends (24.4 percent)
Internet (14.1 percent)
Phone book/yellow pages (10.3 percent)
Senior Center (7.7 percent)
• Family and friends were equally common sources of information across income levels. However, use of other sources differed by socioeconomic status: older adults with household incomes of less than $50,000 were more likely to rely on senior centers for their information than adults with higher incomes. Adults with higher incomes were somewhat more likely to rely on the yellow pages and much more apt to use the Internet for information.
• Just over 58 percent of older adults have used the Internet at some point in time. Of the 42 percent who have not used the Internet, their most common reasons for this included:
− Don’t have a computer (45 percent)
− Don’t know how to use it (20.4 percent)
− Not interested (20.4 percent)
• According to the phone survey, older adults who are Asian, Latino, and African-American—as a group—are less likely to use the Internet than their non-Hispanic White counterparts: 42.7 percent versus 60.1 percent, respectively.
• In addition, older seniors are less likely than younger seniors to use the Internet: 75.6 percent of 60-to 64-year-olds use it; 64.1 percent of 65- to 74-year-olds use it; and 24.2 percent of adults 85 years and older use it.
• Information and referral services were requested by survey respondents more often than any other possible senior center service: 53 percent of older adults would like to see a senior center in their area offer information and referral services.
• Adults aged 60 to 64 years are more interested in the availability of information and referral services at their local senior centers than any other age group: 63.8 percent of them requested it in the phone survey, compared to 56.5 percent of 65- to 74-year-olds, 37.6 percent of 75- to 84-year-olds, and 24.2 percent of those aged 85 years and older.

APPENDIX B
COMMUNITY FOR A LIFETIMETEN-YEAR STRATEGIC PLAN B-20
• Non-English speaking older adults are also more interested in the availability of information and referral services at local senior centers: 74.5 percent versus 50.6 percent of English speakers.
• Over 6 percent of older adults reported that they have difficulty or need assistance obtaining information about how to access services they need. Of these, almost 60 percent stated that no one is helping them obtain information.
• A greater proportion of non-English speaking older adults report the need for assistance in obtaining information to access services: 13.7 percent compared to 5.6 percent of English speakers.
• For those older adults who report a need for assistance of some kind but are not receiving it, their most frequent reason for this unmet need is that they do not know who to turn to or where to get the help (30.4 percent).
In this assessment, health and wellness encompass the following areas of need: health status, health care, health insurance, mental health, mental health care, and exercise and fitness.
KKeeyy FFiinnddiinnggss
HEALTH STATUS
• Eighty percent of older adults reported that they are in excellent or good health, the same percentage as that reported in 1989. Just over 19 percent reported that their health was fair or poor.
• According to the phone survey, older adults with higher incomes are more likely to report excellent health than their counterparts with lower incomes. For example, 24 percent of older adults with household incomes of less than $25,000 reported excellent health compared to over 46 percent of older adults with incomes over $100,000.
• Twenty-eight percent of older adults reported that they have a condition or disability that limits their daily activities.
• According to the survey, older adults of lower incomes are more likely to have health conditions or disabilities that limit their daily activities: for example, 37 percent of those with household incomes of less than $50,000 reported having these limitations, compared to 20 percent of those with incomes over $100,000.
• Older seniors are also more likely to have health conditions or disabilities that limit their activity: the highest rates of disability were found among those 85 years and older (42.4 percent), while adults aged 60 to 64 years had the lowest (22.0 percent).
HEALTH & WELLNESS

APPENDIX B
COMMUNITY FOR A LIFETIMETEN-YEAR STRATEGIC PLAN B-21
HEALTH CARE
• Almost 4 percent of older adults reported that they did not have enough money to follow up on a doctor’s recommendation for tests or treatment sometime in the past year.
• Between 4 and 5 percent of older adults reported that they did not have enough money to get a prescription filled sometime in the past year.
• Almost 5 percent of older adults reported that they did not have enough money to obtain dental care they needed sometime in the past year.
• Three percent of older adults reported that they did not have enough money to obtain eyeglasses they needed sometime in the past year.
• Between 1 and 2 percent of older adults reported that they did not have enough money to obtain the hearing aid they needed sometime in the past year.
• When asked if there were someone who could take care of them if they were very ill or disabled, just under 10 percent of older adults reported that there was no one, and 4.2 percent were unsure if someone could take care of them.
HEALTH INSURANCE • Almost 95 percent of older adults reported that they have health insurance. Of
those with health insurance, over 25 percent indicated that they have Medicare coverage. Just 5 percent reported having Medi-Cal coverage. Over 67 percent reported private insurance coverage.
• According to the survey, Asian, Latino, and African-American older adults are more likely than non-Hispanic White older adults to be uninsured: 12.2 percent compared to 2.4 percent, respectively.
• Younger seniors are also more likely to be uninsured: 10.2 percent of adults aged 60 to 64 years reported being uninsured compared to roughly 2.8 percent of 65- to 84-year-olds and 6.1 percent of those 85 years and older.
MENTAL HEALTH • Almost 10 percent of older adults admitted they had felt sad or anxious enough in
the past year to warrant care from a mental health professional or counselor.
• Of those who admitted needing mental health care, 68 percent stated that they always or usually get that care, while 32 percent stated that they sometimes, rarely, or never get the care they needed.
EXERCISE AND FITNESS • Almost 18 percent of older adults reported that they want to increase their
exercise or participation in a fitness program. Almost 66 percent of older adults stated that they were satisfied with their level of fitness.
• The youngest seniors are more interested in increasing their level of exercise than their older counterparts: over 25 percent of adults aged 60 to 64 years

APPENDIX B
COMMUNITY FOR A LIFETIMETEN-YEAR STRATEGIC PLAN B-22
reported a desire for more exercise, compared to 13 percent of 65- to 74-year-olds, and 14.7 percent of 75- to 84-year-olds.
In this assessment, independence refers to older adults’ status and needs related to transportation, in-home care, caregiver support, care management and care coordination.
KKeeyy FFiinnddiinnggss
GENERAL STATUS • When asked about a series of activities of daily living that older adults might have
difficulty doing on their own, 95 percent of older adults stated that they did not need assistance with these activities.
• Of the roughly 5 percent of older adults that cited a need for assistance with some kind of activity, 42 percent are not getting the help they need.
• Older adults with the lowest incomesthose with household incomes less than $25,000 per yearare more likely to need assistance with daily tasks: 8.4 percent reported needing assistance compared to 5 percent of the overall survey population. Older adults with household incomes below $25,000 comprised 15 percent of the survey population.
• Non-English speaking older adults are more likely to need assistance with daily tasks than their English-speaking counterparts: 9.8 percent compared to 4.3 percent, respectively.
• A greater proportion of older seniors have disabilities that limit their activities than younger seniors: 36.7 percent of 75- to 84-year-olds and 42.4 percent of those 85 years and older report having disabilities, compared to 22 percent of 60- to 64-year-olds and 27.7 percent of 65- to 74-year-olds.
TRANSPORTATION • Over 93 percent of older adults reported that they are always or usually able to
get where they need to go. Over 6.5 percent are sometimes, rarely, or almost never able to get where they need to go.
• Non-English speaking older adults are less able to get where they want to go than their English-speaking counterparts: 15.7 percent reported sometimes, rarely, or almost never getting there versus 5.4 percent, respectively.
• Asian, Latino, and African-American older adults—as a group—are less able to get where they want to go than their non-Hispanic White counterparts: 10.9 percent reported sometimes, rarely, or almost never getting there versus 5.6 percent, respectively.
• Over 10 percent of older adults reported that they have difficulty or need assistance using transportation or going outside of the home to shop or visit the doctor. Of these, over 55 percent stated that no one is helping them get around.
INDEPENDENCE

APPENDIX B
COMMUNITY FOR A LIFETIMETEN-YEAR STRATEGIC PLAN B-23
• In the survey, older seniors were more likely to need help getting outside of the home or using transportation than their younger counterparts: 24.2 percent of adults 85 years and older reported this need, compared to 14.7 percent of 75- to 84-year-olds, and 6.4 percent of 60- to 74-year-olds.
• In addition, non-English speaking older adults were more likely to need help getting outside of the home or using transportation than their English-speaking counterparts: 27.4 percent versus 7.6 percent, respectively.
• While 2.7 percent of all survey respondents who identified themselves by race reported needing assistance using public transportation, 6.1 percent of Asian, Latino, and African-American older adults—as a group—cited this need.
• Almost 88 percent of older adults reported that their most common form of transportation is driving their own or someone else’s vehicle.
• According to the phone survey, older adults’ modes of transportation differ by socioeconomic status: older adults with household incomes of less than $25,000 are far more likely to use public transit12.7 percent compared to 4.2 percent of the overall older adult population.
IN-HOME CARE
• Over 13 percent of older adults in the phone survey reported that they have difficulty or need assistance with an activity of daily living—such as bathing or preparing a meal—or with an instrumental activity of daily living like going shopping. Of this 13.5 percent of older adults, 41.2 percent stated that they are not receiving any assistance for these needs.
• A greater proportion of non-English speaking older adults are in need of assistance with personal care than those who speak English: 7.8 percent compared to 0.7 percent, respectively.
CAREGIVER SUPPORT • Almost one-quarter of older adults currently provide or arrange care for someone
other than themselves.
• Non-English speaking older adults are more likely to be caregivers than their English-speaking counterparts: 41.2 percent compared to 22 percent, respectively.
• Almost one-half of senior caregivers provide care for their spouse or partner.
• Just over 88 percent of senior caregivers provide care for a single generation. However, almost 12 percent care for multiple generationssuch as a child and a spouse, a grandchild and parent or in-law, and so forth.
• Over 23 percent of senior caregivers reported that they only sometimes, rarely, or never get relief when they need time off from caregiving.
• Non-English speaking older adults are more interested in the availability of adult day care at local senior centers than are those who speak English: 62.7 percent compared to 41.5 percent, respectively.

APPENDIX B
COMMUNITY FOR A LIFETIMETEN-YEAR STRATEGIC PLAN B-24
CARE MANAGEMENT AND CARE COORDINATION • Over 57 percent of older adults would like to see a senior center in their area
offer management and coordination services for people who need in-home services or assisted living. Phone survey respondents requested this service more often than any other senior center service.
In this assessment, community engagement incorporates older adults’ status and needs related to community contact, recreation and enrichment, language, and volunteerism.
KKeeyy FFiinnddiinnggss
COMMUNITY CONTACT/ISOLATION • Over 84 percent of older adults reported that they are satisfied with their level of
involvement in visiting family, friends, and others.
• In the phone survey, older adults’ satisfaction with the amount of interaction with loved ones differed by race/ethnicity. Almost 20 percent of Asian, Latino, and African-American older adults, as a group, desired more visits with family and friends, compared to just over 9 percent of non-Hispanic White older adults.
• Attendance at senior centers has increased almost 64 percent since 1989, according to results from the 2004 and 1989 surveys, from 18.2 percent to 29.8 percent.
• Adults aged 60 to 64 years are the least likely of older adults to visit a senior center: just under 19 percent visited one in the last six months compared to almost 30 percent of the overall senior population.
• The most common reason that older adults cited for not getting help with activities that they have difficulty doing themselves was “I don’t have anyone to help me” (15.9 percent).
• Almost 10 percent of older adults reported that there was no one who could take care of them if they were very ill or disabled, and another 4 percent weren’t sure if someone could.
RECREATION AND ENRICHMENT
• Of the almost 30 percent of older adults that have visited a senior center in the last six months, over 52 percent of older adults did so primarily for social or recreational reasons; while over one-quarter did so to access health and human services.
• Of the older adult population, those aged 60 to 64 years are the most interested in increasing their involvement in recreational and enrichment activities.
• Over 20 percent of older adults are not satisfied with their level of involvement in taking educational classes and desire more involvement.
COMMUNITY ENGAGEMENT

APPENDIX B
COMMUNITY FOR A LIFETIMETEN-YEAR STRATEGIC PLAN B-25
• A greater percentage of non-English speaking older adults desire more involvement in educational classes than their English-speaking counterparts: over 35 percent compared to roughly 19 percent, respectively.
• Non-English speaking older adults are more interested than English speakers in having local senior centers offer computer classes: almost 55 percent compared to 40.4 percent, respectively. They are also more interested in centers offering educational lectures: 66.7 percent versus 46.4 percent, respectively.
VOLUNTEERISM
• Just over 12 percent of older adults indicated that they desire more involvement in volunteer opportunities.
FFiinnddiinnggss ffrroomm tthhee CCoommmmuunniittyy IInnppuutt EEvveennttss
More than 630 individuals participated in 23 community input events20 focus groups, two town hall meetings, and a set of phone interviews with homebound seniors. These participants were asked to name the most pressing issues facing older adults in the City of San José and in Santa Clara County today. Their responses detailed numerous issues. Exhibit 1 displays those issues that were raised at more than one event and the number of events at which each issue was raised.
EEXXHHIIBBIITT 11 RREECCUURRRRIINNGG IISSSSUUEESS RRAAIISSEEDD AATT CCOOMMMMUUNNIITTYY IINNPPUUTT EEVVEENNTTSS
RECURRING ISSUES
NUMBER OF EVENTS AT
WHICH ISSUE WAS
RAISED Transportation 21 Health Care 15 Housing 14 Nutrition/Meals 11 Information/Referral 9 Language/Cultural/Citizenship Barriers 8 Senior Center Programs 8 Costs/Taxes/Finances 7 General Services/City Services 6 In-Home Care Services 6 Isolation 5 Safety/Identity Theft/Scams 5 Education 3 Elder Abuse 3 Long-Term Care/Assisted Living 3 Legal Services 2
As Exhibit 1 displays, seven issues were noted with greater frequency than the others. These issues are as follows.
• Issue 1Transportation (21 out of 23 events). • Issue 2Health Care (15 out of 23 events).

APPENDIX B
COMMUNITY FOR A LIFETIMETEN-YEAR STRATEGIC PLAN B-26
• Issue 3Housing (14 out of 23 events). • Issue 4Nutrition/Meals (11 out of 23 events). • Issue 5Information/Referral (9 out of 23 events). • Issue 6Language/Cultural/Citizenship Barriers (8 out of 23 events). • Issue 7Senior Center Programs (8 out of 23 events).
Below, we present the common themes that event participants raised in regard to the seven principal issues and the areas of need in which they fall in the Needs Assessment Framework.
IIssssuuee 11:: TTrraannssppoorrttaattiioonn
Overwhelmingly, older adults cited transportation-related issues as the most pressing need of older adults in Santa Clara County. Transportation was most often cited in the community input events as a service older adults rely upon and feel is
important to preserve. Themes that emerged regarding transportation include:
• High cost of transportation. • Lack of accessible transportation. • Lack of transportation coordination among senior centers. • Lack of coordination between bus and light rail schedules. • Lack of available emergency transportation. • Lack of available escorted transportation. • Lack of assistance boarding public transportation. • Lack of safety while using public transportation. • Lack of transportation provisions made for seniors with temporary needs. • Difficulty qualifying for Outreach’s services. • Lack of transportation stipend/assistance for grandparents caring for
grandchildren.
IIssssuuee 22:: HHeeaalltthh CCaarree
Following transportation, health care ranked second as the most pressing issue older adults face in the county. Themes that emerged regarding health care include:
• High cost of medical/dental care, insurance, and prescription drugs. • Lack of health care clinics. • Lack of information regarding drug interactions. • Difficulty understanding and completing medical forms. • Difficulty acquiring medical appointments. • High degree of wait time in medical offices. • Lack of medical professionals with gerontology/geriatric training.
IIssssuuee 33:: HHoouussiinngg
Housing was the third most common issue raised at community input events. Themes that emerged regarding housing include:
INDEPENDENCE
HEALTH & WELLNESS
ESSENTIAL NEEDS
APPENDIX B
COMMUNITY FOR A LIFETIMETEN-YEAR STRATEGIC PLAN B-27
• Lack of affordable housing for seniors. • Long waiting lists for senior housing/apartments. • Location of low-costing housing. • Lack of Section 8 vouchers. • Lack of accessible housing for the disabled.
IIssssuuee 44:: NNuuttrriittiioonn//MMeeaallss
Proper nutrition and the availability of well-balanced meals were also major concerns of those attending the community input events. This issue ranked fourth among participants’ pressing
needs. Meal and nutrition programs were also cited as one of the top five services relied upon by older adults and one that they feel should be preserved. Themes that emerged regarding nutrition and adequate meals include:
• Lack of senior meal programs and meals-on-wheels programs. • Lack of availability of meals for those with special and/or medical dietary
needs. • Lack of nutritionally balanced meals. • Lack of vegetarian meals available. • Lack of proper nutrition education.
IIssssuuee 55:: IInnffoorrmmaattiioonn//RReeffeerrrraall
Event participants cited information about services as a pressing need for seniors—the fifth most common issue raised at the community input events. Information was also the second most frequently cited service that older adults stated they rely upon
and feel is important to preserve. Themes that emerged regarding information and referral include:
• Lack of information available describing services. • Lack of knowledge about where information is available. • Lack of brochures/printed materials describing services. • Difficulty accessing information that is available. • Difficulty accessing information via the telephone and speaking with an actual
person.
IIssssuuee 66:: LLaanngguuaaggee,, CCuullttuurraall,, CCiittiizzeennsshhiipp BBaarrrriieerrss
A variety of ethnic and culturally diverse groups were represented at the community input events. These groups cited language and/or cultural differences as a pressing issue they
ESSENTIAL NEEDS
ESSENTIAL NEEDS
ESSENTIAL NEEDS
APPENDIX B
COMMUNITY FOR A LIFETIMETEN-YEAR STRATEGIC PLAN B-28
face today. Along with senior centers/senior programs, language and cultural barriers was the sixth most common issue raised at the events. Themes that emerged regarding language, cultural, and citizenship barriers include:
• Lack of senior center newsletters in multiple languages. • Lack of opportunity to learn the English language. • Lack of culturally sensitive medical professionals. • Lack of medical correspondence in patient’s language (including
prescriptions). • Lack of services (senior center, interpreters, etc.) available to the deaf. • Lack of interpreters for emergency situations (police, fire, or medical). • Lack of updated multilingual services chart. • Lack of public signage in multiple languages. • Lack of available citizenship classes in native language. • Lack of immigrant benefits. • Lack of full and equal legal rights. • Lack of information and referral services to new immigrants.
IIssssuuee 77:: SSeenniioorr CCeenntteerr PPrrooggrraammss
Preserving and expanding senior center programs was the sixth most common need cited by community input participants. The
responses at the community input events described the many ways in which seniors rely on these centers not only for the services offered but as a means of socialization. Themes that emerged regarding senior centers include:
• Need to keep senior centers operating. • Need to provide bigger, cleaner, better-supervised senior centers. • Need to offer more social opportunities through the senior centers such as
trips, clubs, cultural events, etc. • Need to offer a wider variety of programs that stimulate seniors both
intellectually and mentally. • Need to provide exercise programs/equipment at senior centers. • Need to separate senior programs and youth programs.
FFiinnddiinnggss ffrroomm tthhee EExxppeerrtt IInntteerrvviieewwss During May and June of 2004, 32 interviews were conducted with 40 community leaders in San José and Santa Clara County regarding aging services issues. Exhibit 2 displays the issues that were raised in multiple interviews and the number of interviews in which they were noted.
COMMUNITY ENGAGEMENT

APPENDIX B
COMMUNITY FOR A LIFETIMETEN-YEAR STRATEGIC PLAN B-29
EEXXHHIIBBIITT 22 RREECCUURRRRIINNGG IISSSSUUEESS RRAAIISSEEDD IINN EEXXPPEERRTT IINNTTEERRVVIIEEWWSS
RECURRING ISSUE
NUMBER OF INTERVIEWS
IN WHICH ISSUE WAS
RAISED Transportation 19 In-Home Care Services 17 Caregiver Support 16 Leadership 16 Housing 15 Collaboration/Coordination 15 Funding/Limited Financial Resources 15 Health Care 14 Diversity 5 Growth of the Older Population 5 Information, Referral, and Assistance 4 Meals/Nutrition 4 Client Advocacy 4 Senior and Community Centers 4 Care management 3 Care Coordination 3 Income Maintenance 3 Protective Services 2
As Exhibit 2 demonstrates, eight issues stood out as those most often noted by the experts. These issues are as follows.
• Issue 1Transportation (19 out of 32 interviews). • Issue 2In-Home Care Services (17 out of 32 interviews). • Issue 3Caregiver Support (16 out of 32 interviews). • Issue 4Leadership (16 out of 32 interviews). • Issue 5Housing (15 out of 32 interviews). • Issue 6Coordination/Collaboration (15 out of 32 interviews). • Issue 7Funding (15 out of 32 interviews). • Issue 8Health Care (14 out of 32 interviews).
Below, we present the themes that developed across interviews regarding these eight principal issues.
IIssssuuee 11:: TTrraannssppoorrttaattiioonn
Nineteen experts cited transportation as the key issue requiring the city’s and county’s attention. This was the most common issue cited by the experts. According to the experts, older adults throughout the county experience difficulty obtaining
affordable and accessible transportation, which reduces their independence. Themes that emerged regarding transportation include:
INDEPENDENCE

APPENDIX B
COMMUNITY FOR A LIFETIMETEN-YEAR STRATEGIC PLAN B-30
• Reductions in transportation services. • Rising costs of the paratransit system. • Increased need for transportation (rapidly increasing senior population and
frail elderly population). • Lack of accessible and affordable transportation. • Lack of transportation options for seniors in San José/Santa Clara County
that are not included in Valley Transportation Authority/Outreach contract. • Lack of transportation options for disabled seniors. • Lack of transportation subsidy for low-income older adults. • Lack of transportation assistance for middle-income older adults. • Difficult/laborious process applying for Outreach.
IIssssuuee 22:: IInn--HHoommee CCaarree SSeerrvviicceess
In-home care services warranted the attention of 17 experts and was the second most common issue raised in the interviews. Issues of concern included the lack of available
service, the high cost of services, the fragmentation of services, and the delay in receiving services. Themes that emerged regarding in-home care services include:
• Lack of affordable low-cost services (for example, house cleaning, companion, etc.).
• Lack of affordable home care for seniors that are not low income. • Delays between applying for services and receiving services. • Lack of affordable community-based services for long-term care. • Lack of support for family caregivers. • Lack of service coordinators provided for Section 8 housing residents. • Lack of adequate care management. • Lack of adequate respite care. • Lack of available adult-day care. • Lack of hot, home-delivered meals (meals-on-wheels). • Need to identify isolated seniors.
IIssssuuee 33:: CCaarreeggiivveerr SSuuppppoorrtt
The issue of caregiver support was raised in half of the expert interviews. Issues included the concern about seniors caring for a senior parent, the need for caregiver respite, and the
needs grandparents have raising their grandchildren. Themes that emerged regarding caregiver support are listed below.
• Lack of support for caregivers. • Seniors who are aging and caring for a senior parent and their needs for
services such as adult day care. • Lack of respite for caregivers. • Need to be proactive about caregiver support and provide services in
culturally sensitive ways. • Lack of information about available services for caregivers.
INDEPENDENCE
INDEPENDENCE

APPENDIX B
COMMUNITY FOR A LIFETIMETEN-YEAR STRATEGIC PLAN B-31
IIssssuuee 44:: LLeeaaddeerrsshhiipp
The lack of coordinated leadership was cited as a significant issue in 16 of the interviews. While many Interviewees identified individual leaders within the community, they also
referenced a general lack of focus within senior services and the need for an overall aging vision and strategic plan. Themes that emerged regarding leadership include:
• Lack of leadership at the state, county, and city level. • Lack of senior advocacy. • Lack of a leadership coalition that prioritizes which services need to be
funded and provided.
IIssssuuee 55:: HHoouussiinngg
The issue of housing was the fifth most common issue noted by experts. Themes that emerged regarding housing include:
• Lack of affordable housing for seniors. • Lack of housing with service coordination and information and referral
services. • Lack of subsidized housing (not just for lowest incomes). • Lack of culturally-specific housing.
IIssssuuee 66:: CCoooorrddiinnaattiioonn//CCoollllaabboorraattiioonn ooff SSeerrvviicceess
The need for better service coordination and collaboration was raised in 15 interviews. Themes associated with this area include:
• Lack of coordination among city, county, and community-based organizations.
• Lack of coordination with the health department. • Lack of overall vision in the county. • Fragmentation. • Lack of information sharing. • Need to eliminate the duplication of services and turf wars. • Failure to implement new policies and procedures. • Lack of a strategic plan.
IIssssuuee 77:: FFuunnddiinngg
Concerns about funding were raised by 15 interviewees. These concerns centered around the need to expand services to accommodate the “tidal wave” in the aging population (including
RESOURCES
ESSENTIAL NEEDS
RESOURCES
RESOURCES

APPENDIX B
COMMUNITY FOR A LIFETIMETEN-YEAR STRATEGIC PLAN B-32
HEALTH & WELLNESS
baby boomers and frail elderly persons) and the frequent funding cuts that services experience. Themes that emerged regarding funding include:
• Inconsistent federal, state, and local funding streams. • Decrease in funding for services while the number of older adults is
increasing. • Cutbacks in funding threaten the safety-net services that have a successful
track record. • Absence of secure adult protective services funding. • Lack of local control and the existence of too much top-down funding. • Lack of adequate funding to keep community-based organizations functioning
to meet the needs of at-risk seniors. • Concern that city programs are moving to a fee-based model. • Possibility of impending staff layoffs related to funding cuts that would result
in further reduced services.
IIssssuuee 88:: HHeeaalltthh CCaarree
Health care was noted by experts as another serious issue that older adults face in the county. Comments focused on the high
cost and lack of available medical/dental care. Themes that emerged regarding health care include:
• Lack of outpatient mental health services. • Lack of linkage between health care and long-term care. • Lack of physicians willing to continue care for patients once they enter a
nursing home. • Lack of medical professionals trained as geriatricians. • Needed focus on health care outcomes. • Needed focus on a managed care approach for seniors. • Needed use of telehealth for health and long term care services. • Rising costs for medical care. • Rising costs for prescriptions. • Rising costs for health insurance.

In the U.S., nearly one out of every four households (23% or 22.4 million households) is involved in car e- giving to persons aged 50 or over.
In 2000, about half of older Americans lived in nine states: California with 3.6 million; Florida (2.8); New York (2.4); Texas (2.1); and Pennsylvania (1.9). Ohio,
Illinois, Michigan and New Jersey each had well over one million.
The reported median income in 2000 for persons 65 and older in the United States was $13,769
with an average of $19,168 in earnings for men and $10,899 for women.
In 2000, there were 143 older women for every 100 older men (or 20.6 million older women to 14.4 million older men). The ratio of women to men increases to 245 to 100 for persons age 85 and older.
Community for a Lifetime — A Ten Year Strategic Plan
2000 U.S. Census
In 2000, there were 50,545 centenarians in the United States, a 35 percent increase from 1990. This number is expected to fur ther increase to 324,000 by 2030 and to 834,000 in 2050.