Embed Size (px)
Citation preview

Community Food Projects Indicators of Success Report FY18 INDICATORS OF SUCCESS REPORT FY 2018
Prepared by New Entry Sustainable Farming Project March 2019

Community Food Projects Indicators of Success Report FY18
1 | N e w E n t r y S u s t a i n a b l e F a r m i n g P r o j e c t
Contents EXECUTIVE SUMMARY ........................................................................................................................................................ 2
Introduction and Study Methods ....................................................................................................................................... 4
Whole Measures for Community Food Systems ................................................................................................................ 4
Healthy People ............................................................................................................................................................... 5
Strong Communities ..................................................................................................................................................... 10
Thriving Local Economies ............................................................................................................................................. 11
Sustainable Ecosystems ................................................................................................................................................ 18
Justice and Fairness ...................................................................................................................................................... 20
Conclusion ........................................................................................................................................................................ 21
Appendix ........................................................................................................................................................................... 22
References ........................................................................................................................................................................ 23
Cover photo courtesy of Somali Bantu Community Association of Maine

Community Food Projects Indicators of Success Report FY18
2 | N e w E n t r y S u s t a i n a b l e F a r m i n g P r o j e c t
EXECUTIVE SUMMARY The Community Food Projects Competitive Grant Program (CFP) was started in 1996 with the aim of fighting food insecurity through the development of community food projects that promote the self-sufficiency of low-income communities. Since 1996, this program has awarded over $90 million to organizations nationally (Community Food Projects, 2018).
The New Entry Sustainable Farming Project (New Entry) is honored to serve as the technical assistance provider for CFP applicants and grantees since 2014. As part of this work, New Entry provides feedback and guidance to applicants and grantees and facilitates trainings on project planning and evaluation development. An important component of project evaluation is assessing each grantee’s accomplishments through the annual Indicators of Success survey. Through these yearly surveys, we can track and assess the unique and tangible impacts CFPs have on their communities.
As New Entry has been involved with CFPs since 2014, we have seen shifts and changes in the way CFPs operate and respond to the needs of their community. Several events took place in 2018 that affected various aspects of healthy food production and distribution in the US, from agricultural policy and climate change, to women’s and immigrants’ rights. These events also shaped the work of the CFP grantees in 2018 and demonstrated that these projects serve and support the important and critical food security needs of communities across the country.
Agricultural Policy
In December 2018, a new Farm Bill was signed into law. Although not perfect, there is a lot to celebrate regarding support for community food systems. The bill ensured that funding for CFP continued, but it reduced program funding from $9 million to $5 million annually (National Sustainable Agriculture Coalition, 2018). The CFP program has been in operation under the USDA’s National Institute of Food and Agriculture for over 2 decades and has supported innovative projects across the US, helping communities work toward food security and self-reliance.
Climate Change
In summer of 2018, we saw communities across the country severely impacted due to wildfires and hurricanes. California experienced the most deadly and destructive wildfire season in history (Kasler, 2018). While the fires originated in California, the effects of the fires on air quality affected several states in the region. We also saw destructive hurricane damage in 2018, with Hurricanes Michael and Florence causing significant damage to the Southeastern US States. During these disasters, organizations implementing CFPs were able to continue to supply their communities with healthy foods. Below is a quote from Ava Ryan, a CFP grantee who works at North Coast Opportunities in California.
“Our community (now) has greater access to food, particularly in areas that have been affected by the most recent disasters. During disasters, food access can be particularly difficult as roads close and trucks cannot bring food into the communities that need it. For those that remain during disaster times, the community gardens serve as an emergency food resource. The only grocery store in one community burned down and the garden became the only source of fresh vegetables within a 10-mile radius. The community has also become more empowered to grow their own food and work to change the food system for their benefit so that they are not reliant on others bringing food in. Business owners are benefitted as all funds from the grant have been spent within the county to purchase materials for

Community Food Projects Indicators of Success Report FY18
3 | N e w E n t r y S u s t a i n a b l e F a r m i n g P r o j e c t
garden development. Local nurseries have seen increased business as well from gardeners who go to buy plants and plant starts. The gardens are also a testament to the resiliency of these communities and many residents who are not gardeners comment that seeing a garden growing in a place that was devastated so recently by fires brings them joy.”
The rise of more frequent and severe natural disasters, such as wildfires and hurricanes, will continue to impact the agricultural sector as climate variability becomes the new norm. Adopting sustainable agriculture farming practices (improving soil health, water conservation measures, crop rotation, and diversification, among others) is a strategy that can help producers mitigate changes to their farm and ranch environments (Union of Concerned Scientists). CFPs have been implementing sustainable growing practices including organic practices (certified and not certified) and using integrated pest management. In 2014, CFPs reported growing on 232 acres using sustainable practices, while in 2018, grantees reported 30,961 acres in sustainable production.
Women’s Rights
We saw the continued rise of the #MeToo movement in 2018, following the sexual abuse scandals in Hollywood. This movement also revealed unfortunate truths about the food industry as well, with accusations of top chefs engaged in sexual assault and harassment (Anderson, 2017). During this time, Community Food Projects grantees continued to support, give voice to, and empower women in their communities through their projects. We have seen continued growth in the number of new community based leadership roles reported for women. In the 2015 IOS, 171 new leadership roles for women were reported while in FY 2018 1,558 were reported. (Note: 2014 survey did not specifically ask about women’s leadership roles).
Immigrant’s Rights
Lastly, immigration continued to be a critical topic for much of 2018, with an emphasis on building a wall at the Mexican border to keep immigrants from entering the US. This wall dialogue, along with the Muslim ban and other instances of anti-immigrant sentiment created a hostile environment for immigrants in the US. These policies significantly impacted farm communities reliant on foreign agricultural labor. CFP grantees have a long history of supporting and working with immigrants and refugees and we saw greater impacts of this during this reporting period. In FY 2018, 35% of projects worked with immigrant populations and served 20,400 people. In 2014, 15% of projects worked with immigrant populations.
It takes an integrated community-based approach to achieve healthy thriving local food systems and CFP has maintained collaboration as an integral component of the grant program from the beginning. Working in partnership with nonprofit organizations, local government and policy makers, youth, schools, educational institutions, faith-based institutions, and others, each community food project takes a grassroots, from the ground up approach. A core value of the program is to be rooted in community – to incorporate input and engagement from the very constituents the projects seek to serve. Empowering the local population is necessary and leads to long-term success and viability. Resilience cannot be achieved unless all stakeholders truly have a seat at the table, and their perspectives respectfully heard and represented.

Community Food Projects Indicators of Success Report FY18
4 | N e w E n t r y S u s t a i n a b l e F a r m i n g P r o j e c t
Introduction and Study Methods The primary goals of CFP are to:
• Meet the food needs of low-income individuals through food distribution, community outreach to assist in participation in Federally assisted nutrition programs, or improving access to food as part of a comprehensive service;
• Increase the self-reliance of communities in providing for the food needs of the communities; • Promote comprehensive responses to local food access, farm, and nutrition issues; and • Meet specific state, local or neighborhood food and agricultural needs including needs related to:
o Equipment necessary for the efficient operation of a project; o Planning for long-term solutions; or o The creation of innovative marketing activities that mutually benefit agricultural producers and
low-income consumers (National Sustainable Agriculture Coalition, Community Food Projects, 2018).
In order to determine the collective impact of this grant program on an annual basis, the Community Food Security Coalition and the USDA’s National Institute of Food and Agriculture developed the Community Food Projects Indicators of Success. This method focuses on outcomes based reporting and was conducted by the Community Food Security Coalition annually from 2005 – 2011. In 2014, the New Entry Sustainable Farming Project (New Entry) became the Training and Technical Assistance provider for CFP grantees, and began conducting the survey.
The data for this survey is collected online using Qualtrics (a web-based tool for survey research), and includes both an organizational component for the recipient organization of the grant as well as a beneficiary component for communities served to gain an understanding of the impact on the projects’ participants. The Indicators of Success questionnaire instrument surveys both Planning Grant recipients as well as Implementation Grant recipients (the majority being Implementation grantees). 91% of recipients (73 of 80 projects) active in FY 2018 completed the survey.
Whole Measures for Community Food Systems The Whole Measures for Community Food Systems was developed as a values-based planning and evaluation tool for community food security projects in 2009. The Whole Measures tool was jointly developed by the Community Food Security Coalition and the Center for Popular Research, Education and Policy and was based on work done by the Center for Whole Communities. The tool strives to take a holistic approach to evaluating community food security, so that practitioners and community members can work together to develop a systems level understanding of the unique challenges of their community and how their projects impact their lives. The tool is broken down into 6 major categories (Abi-Nader, 2009).
• Healthy People • Strong Communities

Community Food Projects Indicators of Success Report FY18
5 | N e w E n t r y S u s t a i n a b l e F a r m i n g P r o j e c t
• Thriving Local Economies • Vibrant Farms and Gardens • Sustainable Ecosystems
• Justice and Fairness
The Indicators of Success was developed to incorporate these 6 components of Whole Measures for Community Food Systems to evaluate the collective impact of Community Food Projects. These six categories are not discrete topic areas, but rather practice areas that are synergystically entwined. They are important fields individually, but indicators within each field can collectively be used to assess the true value of Community Food Projects.
Overview: FY 2018 Activities
80 grant projects were active in FY 2018 representing 32 different states. 73 of the 80 (91%) active grantees in FY 2018 responded to the survey from 29 different states. 593 individual project participants (“beneficiaries”) from 23 different projects (representing 15 states/territory: CA, Canada, CO, GA, FL, HI, KY, MA, MD, MN, NC, NY, OR, VA, WA) responded to the beneficiary survey.
The top 5 activities implemented by CFPs in FY 2018 are represented below. The table in the Appendix contains the full breakdown of all activities.
Top 5 Activities % of Projects % Growth since 2010 Food Access and Outreach 70% 45% Nutrition and Health Education 63% 71% Capacity Building Within Your Community 55% NA Local Food Distribution 55% 59% Job Skills Training 44% 40%
Healthy People Whole communities encompass healthy people and community food systems that increase access to nutritious food while also cultivating broader dimensions of health.
Supporting healthy people is at the core of the Community Food Projects grant program. People benefit in a variety of ways, both directly and indirectly, from the work of CFPs nationally. Grantees reported that in FY 2018, overall, 371,441 people benefited directly from these projects, and an estimated 1,217,803 benefited indirectly. People benefited primarily as food recipients, as customers, by attending events or participating in skills trainings. The following chart displays the ways in which beneficiaries participated in projects.

Community Food Projects Indicators of Success Report FY18
6 | N e w E n t r y S u s t a i n a b l e F a r m i n g P r o j e c t
The tables below show the diversity of the populations that these CFPs worked with directly during FY 2018, both as a percent of projects working with the population, and as the total number of people.
Beneficiaries % of Projects # of Direct Beneficiaries
Hispanic or Latino 44% 22,009
Black or African American 43% 10,757
Bi-racial or multi-racial 34% 5,099
Asian or Pacific Islander 28% 3,170
Native American/Eskimo/Aleut 22% 4,236
Beneficiaries % of Projects # of Direct Beneficiaries People with low income 77% 99,049 Women 69% 35,438 Youth 68% 70,793 Seniors 61% 16,318 Farmers 47% 1,275 English as a second language 42% 26,413 Immigrants 35% 20,407 General Public 33% 43,126 Vendors/Business Owners 33% 1,002 Head Start 14% 2,488 Veterans 11% 498 Other 11% 184 Strike Force communities 5% 7,702 Promise Zones 4% 2,702
130,131
107,116
76,624
39,045
0
20,000
40,000
60,000
80,000
100,000
120,000
140,000
Direct customers Food recipients Attended events Participated intraining
Num
ber o
f Peo
ple
Beneficiary Participation 2018

Community Food Projects Indicators of Success Report FY18
7 | N e w E n t r y S u s t a i n a b l e F a r m i n g P r o j e c t
Low income communities are the target audience for the Community Food Projects grant program. Barriers to economic self-sufficiency exist in many areas of life, further challenging individuals and communities on the path to healthier lives. By assisting individuals in accessing healthy foods, CFPs thus work to eliminate one of the many struggles in day-to-day life for neighbors living on low incomes.
Outreach to increase participation in federal assistance programs is one of the stated goals of the CFP grant program. By facilitating the use of these benefits through community-based projects, recipients are not only able to increase their ability to meet their food needs, but in many cases, they are able to do so with fresh food that was grown or purchased through their local community food system. 32 of the 73 projects that responded to the survey facilitate federal assistance participation in some capacity. 68% of these projects reported that they were able to facilitate an increase in the use of federal benefits in FY 2018. For many projects, facilitating use meant accepting the benefits at their farmers markets, or points of sale, and for some projects, this included helping people enroll in public benefits.
One organization in Virginia stated,
“Our organization saw a 19% increase in the amount of supplemental nutrition assistance program (SNAP) money spent at the farmer's market from the previous year. SNAP families spent $763 dollars in SNAP benefits on local market products, which was doubled by our organization. Families redeemed $1,421 - a significant source of revenue for local farmers. 100% of eligible farmers participated in the Farm Market Fresh program and accepted incentive vouchers for fresh fruits and vegetables from WIC families and Seniors.”
Calypso Farm and Ecology Center, Alaska Former Grantee and Example of Success
Calypso Farm and Ecology Center, located in Fairbanks, Alaska, received a CFP grant in 2007. The grant funds
supported the expansion of Calypso’s Schoolyard Garden Initiative into Hunter Elementary School located in one of
the most food insecure regions of the Fairbanks Community. Today, thanks in large part to the CFP funds,
the Hunter School garden continues to thrive and is a source of local food and garden-based educated in the Hunter School neighborhood. At the time that Calypso
received the CFP funds, they were a young organization with a high level of community support and a relatively
small annual operating budget. Those federal dollars provided the funding necessary to get the project off the ground. At the heart of the project is a youth leadership program. Without financial support, they would not have had the staffing and program development funds to get
the project started with a strong foundation. Through the years since receiving the CFP, they have continued to get
grant funding and have developed a strong base of community funding for the program. Overall, they have learned how to run the program efficiently. Funding the project remains the largest challenge. They streamlined
their staffing and continually innovate to keep the program thriving. One of the biggest lessons that they
have learned is that progress and success is not equivalent to expansion. Community involvement, youth leadership and a focus on food justice continues to drive the project. A realistic, economic approach to program planning has allowed them to keep the program going -
even through difficult economic times.

Community Food Projects Indicators of Success Report FY18
8 | N e w E n t r y S u s t a i n a b l e F a r m i n g P r o j e c t
The table below represents the percentage of projects facilitating the use of federal benefits and the number of people impacted.
Facilitating Federal Benefits % of Projects # of Beneficiaries
Supplemental Nutrition Assistance Program (SNAP) 33% 217,539
Senior Farmers' Market Nutrition Program 11% 864
Women, Infants and Children (WIC) 9.5% 4,947
Farmers' Market Nutrition Program 5.4% 123
Other Federal benefits 4.1% 857
Increasing access to healthy food and knowledge around healthy eating are two fundamental components of the Community Food Project grant program. Food access outreach and nutrition / health education were the top two activities among CFPs in FY 2018. To increase beneficiaries’ knowledge of nutrition and healthy eating, projects offered a wide range of opportunities, including classes and workshops, field trips, samples of healthy food, and recipes. To increase accessibility to individuals with low English proficiency, organizations also offer market signage in multiple languages.
The charts below represent responses from CFP beneficiaries when asked how frequently they ate fruits and vegetables before being part of their Project and after participation.
Weekly Fruits and Vegetables
While this represents a small percentage of the overall number of people who were impacted by these CFPs, it clearly shows that these respondents (573 total respondents) have significantly increased their intake of fruits and vegetables. The percentage of participants who recalled not eating fruits and vegetables on a weekly basis dropped from 5% before participation to zero after participation, while the percentage whose fruit and vegetable consumption was more than once a day increased from 29% to 46%.
29%
26%
40%
5%
Before
More than once aday
4-6 times/week
1-3 times/week
Not at all
46%
38%
16%
0%
Now
More than once aday
4-6 times/week
1-3 times/week
Not at all

Community Food Projects Indicators of Success Report FY18
9 | N e w E n t r y S u s t a i n a b l e F a r m i n g P r o j e c t
While consumption of fruits and vegetables is a critical contribution to a healthy diet and community, not all members of a community have equal ability to access fresh foods. The Community Food Projects grant program encourages grantee organizations to address access in their communities. The chart below represents beneficiary responses to their ease of access to fresh food.
75% of respondents said the CFP they participated in has made it easy or very easy for them to access fresh food. For those still struggling to access fresh food, price and distance to a grocery store were commonly cited reasons. The third most commonly cited barrier to access was the poor quality of the produce that is available at accessible locations. Additionally, a few people mentioned that they lack adequate transportation to access the grocery store.
58% of CFP projects worked specifically with youth in their communities through classes, community garden projects, and economic initiatives. Overall, 7,628 total youth were served a total of 412,765 meals as part of these CFPs. Educating youth and allowing them access to more healthy foods can have large implications that are felt throughout the entire community.
“In total, 740 students and 44 teachers participate in school garden programming operated by Rochester Roots, Inc. In this naturally engaging environment, youth learn the principles and concepts of sustainability through the garden's living systems and many take that new knowledge and integrate it within their families. Families have also donated raspberry canes, strawberry plants and flowers to share with the school. Youth collaborate with graduate students, sustainability experts and a game designer who work with the children to engineer agricultural technologies, products and games, respectively. The multi-year program culminates in an annual competition where experts give feedback to the youth who are awarded one of eight wellbeing awards - with 'Resilience' being the highest of achievement. The skills and new knowledge learned through this process contributes to the sustainability and wellbeing of our community.”
21%
54%
23%
2%Ease of Access
Very easy
Easy
Hard
Very Hard

Community Food Projects Indicators of Success Report FY18
10 | N e w E n t r y S u s t a i n a b l e F a r m i n g P r o j e c t
Strong Communities A strong food system builds strong communities across class, race, age, education, and other social categories.
Building strong communities is at the core of Community Food Projects. This includes not only organizational partnerships, but also stronger local food policies and empowered community leaders. The table below identifies the percent of projects working on various capacity building activities in their communities. In FY 2018, 55% of Projects focused on capacity building within their communities, which ranged from working with local store owners and strengthening relationships among diverse business sectors to training farmers and creating youth leadership programs.
Capacity Building Activities % of Projects
Capacity building within your community 55%
Training and Technical Assistance 29%
Food Policy Council/Network 16%
Community Food Assessment 14% In FY 2018, the 73 CFP projects that participated in the survey reported 2,309 organizational partnerships, with 357 of those representing new partnerships. These partnerships strengthened projects in a variety of ways, such as participating in project planning, helping with food distribution and program outreach, and offering joint programming. One CFP Project Director in Wyoming stated,
“Every partnership has brought new perspectives, needs, ideas for solutions, and contributing activities and resources that both challenge and benefit this project. In some cases, partnerships help us identify new beneficiaries who otherwise would have been under served or unserved altogether. In other instances, partners have taken on the lead of a particular aspect of community health and wellness that intersects with this project's specific focus on food access and food systems work and expands it to a broader response to community health needs.”
In addition to forming new partnerships and getting volunteers involved, CFPs created new leadership opportunities in their communities. Of the 2,413 new leadership roles created in FY 2018, 31% of those were filled by people of color, and 17% engaged youth.
767
437
1558
0200400600800
10001200140016001800
People of Color Youth Women
Num
ber o
f Peo
ple
New Leadership Roles

Community Food Projects Indicators of Success Report FY18
11 | N e w E n t r y S u s t a i n a b l e F a r m i n g P r o j e c t
Community food assessments and food policy councils are two additional ways that CFPs develop strong communities. In FY 2018, 8 projects conducted community food assessments, covering an area with an average of 40,000 residents. Additionally, these CFPs formed 11 food policy councils. These 11 food policy councils represented 135 organizations and had over 246 individuals working to address local food policy initiatives.
Thriving Local Economies Thriving local economies form decisions that ensure the wellbeing of future generations. They account for hidden costs in decision-making and work to build systems that regenerate output (wastes) into input (resources).
A key element of creating self-reliant communities is helping to create flourishing local economies. In FY 2018, Community Food Projects impacted their local economies through job creation, creation of new markets, and by helping local individuals prepare business plans. Each of these activities will create lasting impacts in their communities and build more resilient communities moving forward.
A beneficiary noted how the CFP program he participated in affected his life,
“This program has really impacted me in a positive way, I’ve been able to grow as an individual. My mother came to the United States in 1998 from El Salvador escaping from poverty and violence. She has worked her whole life in factories, because the lack of education, she has not been able to obtain a job that she was pleased with because they were very low paying jobs. When I became involved with this project, I was able to help provide for my family and myself while also learning life skills. I also was able to give back to my community and provide fresh and healthy vegetable and fruits.”
Somali Bantu Community Association, Maine
The Somali Bantu Community Association's community farming program, now called Liberation Farms, underwent dramatic and exciting transformations this year. They had over 130 New American farmers growing fresh, chemical-free, culturally appropriate produce for themselves and their families on sites in Auburn and Lewiston, Maine. Each farmer received 1/10 of an acre, seeds, seedling, trainings, and technical assistance. Of those farmers, 32 also self-organized into 9 different ‘iskashito’ groups. Iskashito is a traditional Somali method of cooperative growing where farmers work together on one piece of land and equitably share the profits of their combined labor and efforts. Iskashito farmers more than tripled their sales from last year! Thanks to plentiful storage crops, by the end of winter they anticipate quadrupling their sales from last year. Additionally, in 2017, they worked with 8 different wholesale accounts and in 2018 were able to work with 13 different wholesale accounts. There was programmatic growth in many ways including developing new record and bookkeeping systems and purchasing a new tractor which built the community's capacity to manage their farmland with more independence.

Community Food Projects Indicators of Success Report FY18
12 | N e w E n t r y S u s t a i n a b l e F a r m i n g P r o j e c t
The following table displays several economic impact indicators and activities undertaken by CFPs in FY 2018, with the corresponding number of participants involved or dollar amount generated.
Economic Impact
Direct jobs created 252
Jobs retained 499
Indirect jobs created 74
Markets expanded 102
New markets established 61
Market sales increase $270,402
Micro-enterprise opportunities supported 263
Farmers' markets started 9
Farms started or build on 149
CSAs started 5
CSAs operated 13
Projects that prepared business plans 18
Business plans prepared 454
Economic Impact Activities % of Projects Local food distribution 55% Job skills training 44% Entrepreneurial food and agricultural activity 40% Community or Incubator kitchen 30% Farm/Grower Cooperative 29% Micro-enterprise/Entrepreneur skill training 23% Community Supported Agriculture (CSA) 21% Promoting Local Food Purchases 18% Farmers’ Market 16% Incubator farm 10% Farm to School 8% Food hub 8%
VOLUNTEERS
CFPs engaged 13,650 volunteers and
a total of 117,628 volunteer hours

Community Food Projects Indicators of Success Report FY18
13 | N e w E n t r y S u s t a i n a b l e F a r m i n g P r o j e c t
In FY 2018, 21 projects operated a total of 64 farmers’ market locations. These markets mostly operated one day per week, for an average of 28 weeks/year, with an average weekly attendance of approximately 206.
Thirty-four survey respondents reported working with 1,275 farmers in FY 2018. 21% of the farmers (267) can live off the farm income as their primary income. Partnering with local farms has positive impacts on farmers’ bottom lines as well as a project’s community members. One CFP Project Director in Colorado explained,
“Our farmers are learning how to run every aspect of the farm. They learn sustainable agriculture, volunteer management, leadership skills, sales, customer service, food safety, basic math, and so much more. Not only do these skills increase their competency at the farm, but they are building transferable skills that can be applied to any job.”
In addition to helping individuals gain job readiness skills and supporting the development of businesses, CFPs had an impact in terms of the food they bought, sold and distributed throughout FY 2018. 38 projects (52%) purchased over 4.4 million pounds of food, amounting to over $2.4 million. Most CFPs purchased food from multiple sources, and 33 of the 38 purchased either from farmers participating in their program, or other small-scale farmers.
One beneficiary from Maryland noted that the program helped her start a new business,
“Most importantly, I learned to find my voice. (This program) gave me the encouragement, motivation, and confidence to know that I can create and build my small business food enterprise.”

Community Food Projects Indicators of Success Report FY18
14 | N e w E n t r y S u s t a i n a b l e F a r m i n g P r o j e c t
Tanner Medical Center, Georgia
West Georgia Regional Food System Collaborative’s ‘Get Healthy, Live Well’ program was created to work on understanding the systemic infrastructure, policy issues and economic concerns that must be addressed to make healthy
food more viable in west Georgia. The group includes more than 30 representatives, including local farmers, business and restaurant owners, chefs, school nutrition directors, master gardeners and concerned citizens. The ‘Get Healthy, Live Well’ Regional Food Systems Collaborative has spearheaded initiatives as part of their CFP grant to fill in the gaps where grocery stores and farmers’ markets are not accessible. There are several components of this project, including Kids ‘N
the Kitchen, an interactive teaching kitchen program for grades K-8, launched in 2017. Since it launched, the program has implemented almost 200 lessons, reaching over 11,400 children at a dozen schools. Carrollton City Schools reports that
40 to 60 percent of the sampled food are being selected as part of school meals. In efforts to increase access to local farmers’ markets, Tanner partnered with the Cotton Mill Farmers’ Market in Carrollton to offer a more accessible outdoor location for the farmers’ market, next to the Tanner Medical Center/Carrollton campus. The new location
includes convenient access to parking, nearby connections to the Carrollton GreenBelt (an 18-mile bike and pedestrian path), the Tanner Walking Trail, and is a short distance from a local housing authority. The Cotton Mill Farmers’ Market
has reported increased sales of the highlighted in-season food product utilized on the days in which a cooking demonstration was held. In addition, pop-up farmers’ markets were held in partnership with Bowdon United Christian
Ministries, that are held in conjunction with food pantry giveaway days, with the market slogan, “Take What You Want, Pay What You Can, Eat What You Take.” The Bowdon pop-up market has served approximately 60 individuals per month,
with Get Healthy, Live Well providing cooking demonstrations of in-season produce. Get Healthy, Live Well’s (GHLW) active collaboration with local food pantries and promotion of EBT benefits, the Cotton Mill Farmers’ market EBT
participation increased from $76.00 of EBT Swipes and EBT double-up tokens of $1,593 in April 2018, to $736 in EBT swipes and $2,061 EBT tokens in August 2018.

Community Food Projects Indicators of Success Report FY18
15 | N e w E n t r y S u s t a i n a b l e F a r m i n g P r o j e c t
30 projects sold 895,565 pounds of food in their communities. 39 projects distributed over 16.2 million pounds of food, with an overlap of 550,675 pounds between food sold and distributed. 30 projects donated over 6.7 million pounds in FY 2018.
Customers Sales % of Projects # of Customers Sales/customers
Direct to consumer $2,099,794.00 39% 50073 $42
Healthy Corner Store $126,728.00 3% 16466 $8
Schools $79,522.16 10% 72077 $1.10
Retail $76,592.77 7% 159 $482
Restaurants $20,862.00 12% 123 $170
The Community Food Projects grant program prioritizes projects that take comprehensive and cross-sector approaches to community economic sustainability. One CFP project in Oregon focused on various educational opportunities and SNAP matching program.
“Participants in the Farm and Food Program received hands-on farming and garden experience, gained useful skills through gardening classes and cooking skills courses. They also learned about raising farm animals and the how they fit into the cycle of life on the farm. Additionally, they were able to stretch their SNAP dollars for the purchase of local food through the ‘Double Up Food Bucks’ program at their local farmers market. To us, this is an example of the power of collaboration to provide a variety of in-depth services to a high-need population.”
2224
29
8
15
0
5
10
15
20
25
30
35
Farmersparticipating inyour program
Food distributors Small scale farmers Large scalefarmers
Grocery store
Num
ber o
f Pro
ject
s
Sources for Purchasing Food

Community Food Projects Indicators of Success Report FY18
16 | N e w E n t r y S u s t a i n a b l e F a r m i n g P r o j e c t
Vibrant Farms and Gardens
Vibrant farms are often local farms that shorten the gap between farmer and consumer and actively contribute to sustaining and revitalizing regional food systems and economies.
In FY 2018, 38 CFPs grew 842,740.6 pounds of food on 31,487 acres of land. Thirty-three of the 38 projects growing food did so in an urban setting. Forty-three projects grew vegetables, 32 grew herbs, 20 projects grew berries, 11 had orchards and 11 raised animals (either sheep, goats, pigs, cattle or poultry).
These projects had various land tenure situations ranging from owning, to leasing, to informal agreements. Collectively in FY 2018, these projects worked with over 407 different owners. Most projects worked with fewer than 10 landowners.
34 projects worked with farmers directly in some capacity. This work ranged from training, to facilitating market access, to purchasing food from the farmers. 1,275 farmer participants grew food to sell. CFPs in FY 2018 helped start or develop 150 farms.
Whole Measures for Community Food Systems identifies working with socially disadvantaged and immigrant and refugee community members as an indicator of a more just and inclusive food system. One California-based Project Director noted,
“Planting Justice stewarded more than 1,200 varieties of rare and heirloom tree-crops in the nursery collection, and did so in a way that provided living-wage, full-time jobs with benefits to 15 low-income people, including 11 formerly incarcerated people. None of these staff members returned to prison this year.”
Farmworker Association of Florida
With outreach and offices in each of five rural, low income, mostly immigrant farmworker communities across central and south Florida, the Farm Worker
Association of Florida (FWAF) continued supporting sustainable agriculture community gardens in three
communities and established a fourth garden in Apopka. This project enables the increase of small-scale food
production in farmworker communities. It also increases low-income community members’ access to and
consumption of affordable, organic foods. Working in the gardens as well as the training (formal and informal) help
to raise low-income community members’ awareness about the importance of producing and consuming fresh
fruits and vegetables that are locally grown using methods that conserve natural resources. Approximately sixty families in total were involved in planning and care for the gardens. FWAF distributed over 4,000 pounds of harvested, organic food plus 224 potted herbs and over 200 packets of seeds to 314 families, including over 700
children.

Community Food Projects Indicators of Success Report FY18
17 | N e w E n t r y S u s t a i n a b l e F a r m i n g P r o j e c t
859 farmers working with these CFPs received some form of training. These trainings varied by program, but topics ranged from production skills through post-harvest handling and market training. The training opportunities had a very positive impact on the project beneficiaries. The charts below represent project beneficiaries’ farming experience before participating in their CFP, and now. Overall, the respondents (266 total respondents) indicated an increased level of farm and garden experience due to participation in their CFP. The percentage of participants who indicated no or low levels of farming/gardening experience dropped from 53% before participation to 7% after. Those who indicated medium and high levels of experience rose from 47% before participation to 93% after, demonstrating the positive impact of the Projects’ trainings on the collective growing and production experience among their communities.
Farming and Gardening Experience before Participation Vs. Now
746
434
2044
467
0
500
1000
1500
2000
2500
SociallyDisadvantaged
Women People of Color Farmers growingfood to sell
Num
ber o
f Peo
ple
Farmer Demographics
15%
32%35%
18%
Level of Farming Experience BEFORE CFP
High
Medium
Low
No experience
48%45%
7%
0%
Level of Farming Expereince AFTER CFP
High
Medium
Low
No experience

Community Food Projects Indicators of Success Report FY18
18 | N e w E n t r y S u s t a i n a b l e F a r m i n g P r o j e c t
44% of the projects facilitated community gardens, for a total of 272 gardens, with 3,947 plots and 7,983 different gardeners. This is an impact that will last long-term, since not only are people able to provide food for themselves and their families in the short-term, but they gain valuable gardening skills so that they are able to continue to provide for their families into the future.
One beneficiary had the following to say about the community garden they participated in,
"The community garden is a safe space where we have access to fresh herbs and vegetables, without chemicals or pesticides, where we connect with our roots, our culture, our resistance. This is a place without borders."
Farm & Garden Activities % of Projects Community Garden 44% Youth/School gardening or agriculture project 40% Composting 39% Urban Agriculture 31% Community Supported Agriculture (CSA) program 20% Restoration of traditional agriculture/foods 17% Immigrant/Migrant farm project 15% Incubator farm 9%
Sustainable Ecosystems
Sustainable, balanced ecosystems are built upon interdependent relationships, depend upon clean air and water and healthy soil, and provide the foundation for all life.
While the primary focus of the CFP grant program is to increase healthy food access for low-income communities, many CFPs also have a strong commitment to sustainable practices, both for the food they produce and how they produce it, as well as in the training they provide to farmers and community members. The Whole Measures approach prioritizes the development of projects that protect the air, water, and soil, since nutrition is intrinsically tied to food produced in healthy environments.
One strategy implemented by sustainable farmers and gardeners is composting. The importance of composting is clear among CFPs as well. Eleven projects (15%) composted over 306,280 pounds of food in FY 2018, and many mentioned using compost for soil health as part of their growing practices.
In addition to their own practices, 50% of the projects working with farmers reported that the farmers they worked with had changed their practices. This included a wide variety of changes, including sustainable growing techniques, including cover crop usage, soil amendments, and certified organic practices. Changes were also seen in farmers’ crop plans as they learned more about food safety regulations and perfected their business plans.
One Project Director from Maine noted,

Community Food Projects Indicators of Success Report FY18
19 | N e w E n t r y S u s t a i n a b l e F a r m i n g P r o j e c t
“This year, thanks to training provided by the Farm Production Manager, many of the farmers began growing in rows. Farmers also began using more amendments and compost before planting. There have been broader efforts to cover crop, rotate crops, and plant in ways that will minimize soil erosion. Farmers also began to compost for the first time this year.”
Tolowa Dee-ni’ Nation, California
The Srtaa~ Shvm (hii) Mvlh Ghee-saa-ghit-na' Project was designed to increase healthy food access and self-
sufficiency in communities across Del Norte and its Tribal Lands. Within Del Norte and its Tribal Lands there are
many small, extremely rural communities that exist in food deserts--the population center, Crescent City, contains the only two full service grocery stores in our county and the only stores accepting certain food assistance programs
such as WIC. This leaves access to healthy and affordable food very difficult for most of the community. However, in
the project area it is possible to grow food 12 months a year, which is promising as they look more towards
perennial production of introduced and traditional food resources. Efforts of this project concentrate in four main
categories: design and installation of perennial food forests, support and expansion of existing community
gardens, community education promoting food security and self-sufficiency, and financial support for expanding school gardens. In FY 2018 considerable progress was
made on planting the four perennial food forests, which will eventually provide fresh food and learning
opportunities to the four rural communities of focus in their project area. Though the more direct impact of
providing fresh food from community gardens is extremely important, the steps towards perennial production that
have been taken over the last year is an exciting and important development. After finally solidifying locations, community partners, and community support (which has been a long process, due to rural location) the project has now completed all necessary infrastructure and majority of the plantings. These sites are now in the community
consciousness and receive widespread community support.

Community Food Projects Indicators of Success Report FY18
20 | N e w E n t r y S u s t a i n a b l e F a r m i n g P r o j e c t
Another CFP grantee said,
“Our farmers reported having increased knowledge about their costs of production, greenhouse/hoophouse construction and best practices for succession planting and selecting varieties. Additionally, some producers are now growing extra produce specifically for donation purposes.”
CFPs grew, purchased or gleaned over 305,550 pounds of food in FY 2018. 61% of projects grew food, 18% gleaned food, and 33% purchased food.
97% of projects that reported growing food and their specific growing practices used sustainable land management techniques, organic practices (though not all certified), and/or integrated pest management techniques. In total, there were 30,961 unique acres of land using these types of unique growing practices in FY2018. 83% of projects purchasing food did so from sources that used sustainable land management techniques, organic practices (not all certified), and/or integrated pest management techniques.
Justice and Fairness
Just and fair food and farms come from food systems deliberately organized to promote social equity, worker rights, and health through all activities.
Building more self-reliant, resilient communities requires fostering justice, fairness, and inclusivity throughout all sectors. By working with diverse populations and increasing the diversity of leadership roles, communities are able to benefit in the long-term by being stronger and more resilient. These CFPs have fostered justice and fairness by creating leadership opportunities for people of color and women and developing partnerships with business owners and community partners of color.
More than half of CFPs have expanded to different groups, low-income populations, and/or new businesses in FY2018 through several methods, but one successful method involves creating strategic and creative partnerships.
One project director noted that, ‘We began to reach out to and involve individuals working multiple jobs who are living with poverty and food insecurity, by partnering with a local hotel and its service worker staff.”
CFPs are working to understand the diverse needs of those they serve so that they can have a lasting impact on their communities.
Another project director noted, “We have greatly expanded our Latinx and native Hawaiian ethnic groups by producing more cultural foods and preparing more cultural foods. We have also increased our low-income customer base by offering half off all local organic produce for those who are on SNAP benefits. We have expanded new businesses and added many new vendors by continuing to be a stable and accessible market that is open to the public daily.”

Community Food Projects Indicators of Success Report FY18
21 | N e w E n t r y S u s t a i n a b l e F a r m i n g P r o j e c t
The following table illustrates how CFPs worked with people of color and women.
# of people Leadership Roles
People of Color 750 Women 1546
Farmers
People of Color 2044 Women 434 Community partners of color 1602
Business owners of color 369
CFPs in 2018 worked to support diverse populations from around the world. When asked what specific communities the CFPs grew foods for, over 24 different communities were noted, the full list is available below.
The staff of these organizations who were working on CFP grants in 2018 were also diverse. On average, each organization had 3.5 cultural groups represented on staff and 2.7 different languages spoken.
A project working with Choctaw populations in Oklahoma, stated,
“A greenhouse was constructed and native Choctaw heirloom crops were planted. Seed saving began as well as educational outreach and program promotion activities. Tribal members are able to learn more about Choctaw heirloom crops while gaining knowledge on cultivating fresh fruits and vegetables and the benefits of a healthy diet.”
Immigration and racial justice have been among the most debated topics in political and social spaces during this past year, and the Community Food Projects program influences and is influenced by decisions at the local, state, and federal level. As a community food security movement, justice and fairness are important values that can be achieved through Community Food Projects, and those in other fields can continue to look to the CFP program as a model for creating and cultivating whole, healthy, and fair communities through food, farming, and nutrition education in our country’s most vulnerable places.
Conclusion The Community Food Projects Competitive Grant Program allows organizations across the country to impact tens of thousands of lives each year through increased access to fresh food, education and resources on farming to healthy eating and cooking, and increased food security. Since these projects are deeply rooted in the communities they serve, they continue to impact lives after the initial funding is concluded through increased resiliency and self-sufficiency. In both the short and long-term, these projects are making a difference and contributing to a future where our communities are more connected to their food sources, are more confident about their ability to access food, and are more equipped to provide healthier food for themselves and their families.
Community Food Projects Indicators of Success Report FY18
22 | N e w E n t r y S u s t a i n a b l e F a r m i n g P r o j e c t
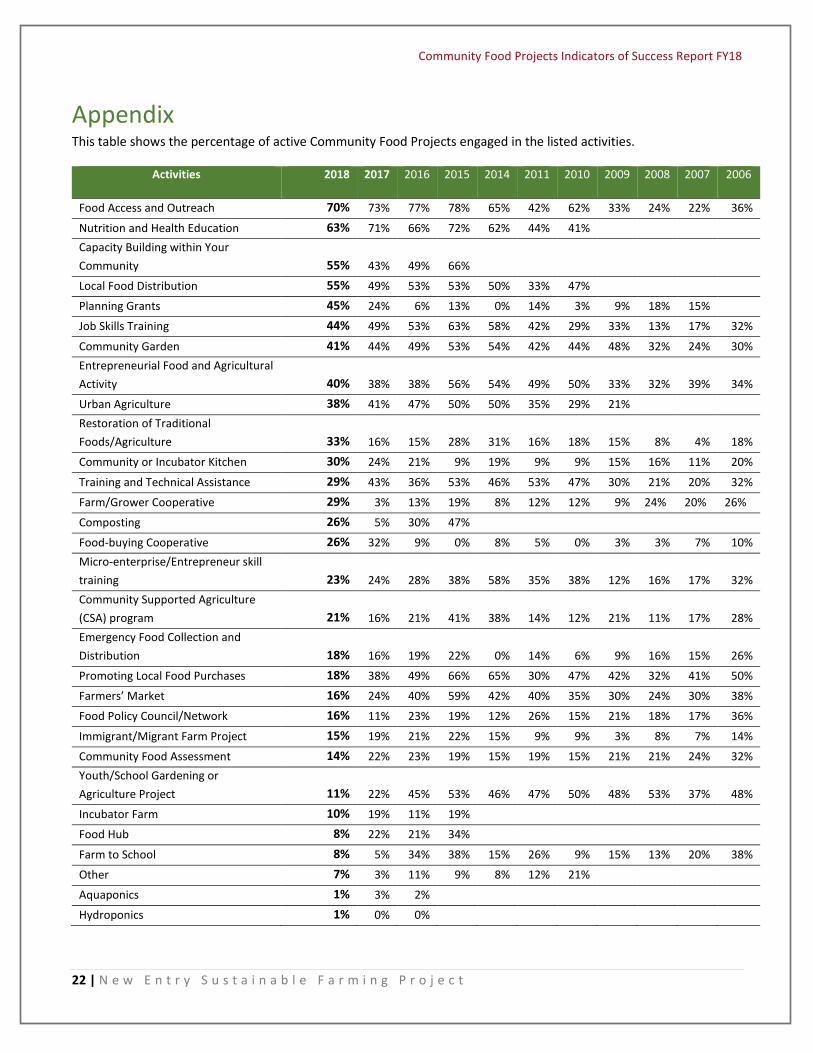
Appendix This table shows the percentage of active Community Food Projects engaged in the listed activities.
Activities 2018 2017 2016 2015 2014 2011 2010 2009 2008 2007 2006
Food Access and Outreach 70% 73% 77% 78% 65% 42% 62% 33% 24% 22% 36%
Nutrition and Health Education 63% 71% 66% 72% 62% 44% 41% Capacity Building within Your Community 55% 43% 49% 66%
Local Food Distribution 55% 49% 53% 53% 50% 33% 47%
Planning Grants 45% 24% 6% 13% 0% 14% 3% 9% 18% 15%
Job Skills Training 44% 49% 53% 63% 58% 42% 29% 33% 13% 17% 32%
Community Garden 41% 44% 49% 53% 54% 42% 44% 48% 32% 24% 30% Entrepreneurial Food and Agricultural Activity 40% 38% 38% 56% 54% 49% 50% 33% 32% 39% 34%
Urban Agriculture 38% 41% 47% 50% 50% 35% 29% 21% Restoration of Traditional Foods/Agriculture 33% 16% 15% 28% 31% 16% 18% 15% 8% 4% 18%
Community or Incubator Kitchen 30% 24% 21% 9% 19% 9% 9% 15% 16% 11% 20%
Training and Technical Assistance 29% 43% 36% 53% 46% 53% 47% 30% 21% 20% 32%
Farm/Grower Cooperative 29% 3% 13% 19% 8% 12% 12% 9% 24% 20% 26%
Composting 26% 5% 30% 47%
Food-buying Cooperative 26% 32% 9% 0% 8% 5% 0% 3% 3% 7% 10% Micro-enterprise/Entrepreneur skill training 23% 24% 28% 38% 58% 35% 38% 12% 16% 17% 32% Community Supported Agriculture (CSA) program 21% 16% 21% 41% 38% 14% 12% 21% 11% 17% 28% Emergency Food Collection and Distribution 18% 16% 19% 22% 0% 14% 6% 9% 16% 15% 26%
Promoting Local Food Purchases 18% 38% 49% 66% 65% 30% 47% 42% 32% 41% 50%
Farmers’ Market 16% 24% 40% 59% 42% 40% 35% 30% 24% 30% 38%
Food Policy Council/Network 16% 11% 23% 19% 12% 26% 15% 21% 18% 17% 36%
Immigrant/Migrant Farm Project 15% 19% 21% 22% 15% 9% 9% 3% 8% 7% 14%
Community Food Assessment 14% 22% 23% 19% 15% 19% 15% 21% 21% 24% 32% Youth/School Gardening or Agriculture Project 11% 22% 45% 53% 46% 47% 50% 48% 53% 37% 48%
Incubator Farm 10% 19% 11% 19%
Food Hub 8% 22% 21% 34%
Farm to School 8% 5% 34% 38% 15% 26% 9% 15% 13% 20% 38%
Other 7% 3% 11% 9% 8% 12% 21%
Aquaponics 1% 3% 2%
Hydroponics 1% 0% 0%

Community Food Projects Indicators of Success Report FY18
23 | N e w E n t r y S u s t a i n a b l e F a r m i n g P r o j e c t
References National Sustainable Agriculture Coalition. (December 2018). 2018 Farm Bill Drilldown: Local/Regional Food Systems, Rural Development. Retrieved from: http://sustainableagriculture.net/blog/2018-farm-bill-drilldown-local-rural/ National Sustainable Agriculture Coalition. (March 2018). Community Food Projects. Retrieved from: http://sustainableagriculture.net/publications/grassrootsguide/local-food-systems-rural-development/community-food-project-grants/ Abi-Nader, Jeanette (2009). Whole Measures for Community Food Systems. Center for Whole Communities. Kasler, Dale. (November, 2018). Worst Wildfire Year Since When? More California Acres have Burned in 2018 than Last Decade. Retrieved from: https://www.sacbee.com/latest-news/article221788220.html Union of Concerned Scientists. What is Sustainable Agriculture? Retrieved from: https://www.ucsusa.org/food-agriculture/advance-sustainable-agriculture/what-is-sustainable-agriculture Anderson, Brett. (October 2017). John Besh Restaurants fostered culture of sexual harassment, 25 women say. Retrieved from https://www.nola.com/business/2017/10/john_besh_restaurants_fostered.html