Embed Size (px)
Citation preview

COMMUNITY CONVERSATION
Nicole Conley, Chief Financial Officer
May 2016
Ways To Connect
• Let’s Talk AISD, www.austinisd.org/letstalk• AISD Facebook, www.facebook.com/austinisd• AISD Twitter, @AustinISD
Use hashtag #AISDbudget• www.austinisd.org/budget/contact-us
En español• AISD Educa Austin Twitter @ • www.facebook.com/educaaustin
2

Austin ISD Demographics
• Approximately 83,000 Students
• Over 12,000 Employees
• 130 campuses/diverse school communities
• 59.9% Economically disadvantaged
• 27.7% English Language Learners
• 9.9 % Special education students
3
59.6%25.8%
8.0%
6.6% Diverse Student Body
Hispanic
White
African Amer.
Other

What Makes Us AISD Proud
Diverse Programming• Early College High Schools at Reagan and LBJ
• International Baccalaureate (IB) Program at Anderson
• Fine arts academies at the elementary, middle and high school level
• Participation in the Creative Learning Initiative
• Dual Language Programs at elementary, expanding to middle next year
• Magnet Programs at LASA, Kealing and Fulmore
• Multiple learning academies at Akins, including special sequences in science,
technology, engineering and math
• Career exploration opportunities in areas of culinary arts, automotive engineering &
design, fire and police services, computer and health sciences
• An Anti-Defamation League designated No Place for Hate district
• A Social Emotional Learning district
Strong Academic Performance• Increasing graduation rate (86.3 percent in 2015)
• More National Board Certified Teachers than any other school district in Texas
High Financial Ratings • Lowest property tax rate in the region. AISD board lowered I&S tax rate in FY2015
and FY2016 and will propose doing so again in 2017
• Triple “A” rated, Superior ratings from state, GFOA and ASBO awards for budget and
financial reporting
Environmental Stewardship• Guerrero Thompson LEED certification
4

The average ACT composite score in AISD exceeded those at state and national levels
5
Austin ISDStateNational

The district’s average SAT composite score exceeded the state & national averages
6
Austin ISDStateNational

Budget Cycle Begins Each Year on July 1Developing a budget is a year-round process
7
Planning
(review goals and objectives, budget
status, and revenue
projections)
Preparation
(develop school, department, and
district-wide budget recommendations)
Review and Coordination
(assess and prioritize all
budget requests and prepare the recommended
budgetAdoption
(conduct public hearing and obtain approval of Board
of Trustees)
Implementation
(execute budgeted
expenditures)
Evaluation
( assess performance data to use in the next year's budget
planning)
Monitoring
(track budget performance
using established accounting and
auditing processes)

FY2017 Preliminary Expenditure Budget Assumptions
• Awaiting School Finance Lawsuit outcome, therefore, assumes no change to current school finance structure/state revenue
• Projects the State funding formula per capita rate will increase from 176.437 in FY2016 to 380.000 in FY2017
• Enrollment decrease of 1,331 students
• Property tax collectability rate of 100.0 percent
• Includes salary increases for regular and part-time employees
– 3.0% across-the-board salary increase for all regular full-time and part-time employees
– Increase minimum hourly rate to $13.00
8

FY2017 Preliminary Budget Revenue Assumptions
• Increase in Net Taxable Value of approximately 14.9 percent from 2015 to 2016
• M&O tax rate remains at $1.079/$100 taxable value and I&S tax rate reduction from $0.123/$100 taxable value to $0.113/$100 taxable value
• Current tax exemptions:– $25,000 Homestead Exemption– Over 65- maintains the local over 65 exemption of $25,000 in addition
to the state required $10,000– Disabled Exemption-maintains the local disabled exemption of
$15,000 in addition to the state required $10,000– Historical Designated Property Exemption
• General Fund Budget proposes an estimated surplus of $14.7 million• Remaining reserves levels for FY2017 are above the Board policy.
However, out-year expenditures are projected to have a deficit.
9

AISD Budget Challenges
• Rising inflationary costs
• Declining enrollment which translates into declining revenue
• Record high and rising appraisal values which substantially increases the district recapture liability. In FY2019, more than half of every local tax dollar collected will go to the state
• Lagging teacher salaries: ranking 8 out of 10 when compared to local districts and 9 out of 9 to urban peers
• Newly implemented 2015-2020 Strategic Plan addresses the importance of reinventing the urban education experience necessitated by new needs of students
• Graduation requirements under House Bill 5 (HB5) added significant costs without providing additional funding
10
10

AISD Budget Challenges (continued)
• As part of a multi-year financial plan, the district utilized fund balance reserves to offset budget shortfalls for three years from FY2013 through FY2015. – This was only to be utilized as an interim solution as the district worked to
develop a financial solvency plan that eliminated the dependency on district reserves for ongoing operating needs.
• The district was able to balance the budget in FY2016 and it is projected the budget will again be balanced in FY2017.
• The district is forecasting a deficit from FY2018 through FY2020.
• AISD has implemented and exhausted several budget balancing solutions and savings options to address previous budget shortfall
• Under current law, school districts must seek voter approval through a tax ratification election (TRE) to increase the tax rate for M&O purposes beyond 1.04
11
11

All Dollars Are Not Created Equal12
Bond Dollar - CollectM&O Dollar - Collect
M&O Dollar - Keep Bond Dollar - Keep

The Impact of Recapture13
$922
$1,062
$1,163$1,251
$1,347
$273
$406
$533$631
$724
$-
$200
$400
$600
$800
$1,000
$1,200
$1,400
$1,600
FY2016 (Adopted) FY2017 (Preliminary) FY2018 (Projected) FY2019 (Projected) FY2020 (Projected)
Mill
ion
s
M&O Collections Chapter 41 Payments
29.6%
38.2%
45.8%50.4%
53.8%

Revenue vs. Recapture*
$723.4$809.7
$921.6$1,061.7
$1,162.5$1,251.3
$1,347.2
$599.7 $628.6 $648.8 $655.6 $629.5 $620.8 $622.8
-$123.7 -$181.1 -$272.8-$406.1
-$533.0-$630.5
-$724.4
$34.8 $33.5 $18.5 $34.6 $24.6 $24.2 $23.8
-1,000
-500
0
500
1,000
1,500
FY2014 FY2015 FY2016 FY2017 FY2018 FY2019 FY2020
Mill
ion
s
Total M&O Collections Net M&O Collections Retained
Chapter 41 Recapture Total State Aid
14
*This chart is based on the preliminary values provided by the Travis Central Appraisal District (TCAD) in early April 2016; TCAD will furnish certified preliminary values in May 2016

FY2017 Preliminary BudgetOverview of Expenditures by Fund
Fund FY2016
Adopted FY2017
Preliminary $
Change %
Change
General Fund $1,001,749,277 $1,146,325,475 $144,576,198 14.4%
Food Service 40,886,129 36,801,100 -4,085,029 -10.0%
Debt Service 109,033,174 106,464,540 -2,568,634 -2.4%
Total 1,151,668,580 1,289,591,115 137,922,535 12.0%
Less Recapture -272,762,822 -406,064,487 -133,301,665 48.9%Total Operating Expenditures $878,905,758 $883,526,628 $4,620,870 0.5%
15

Budget OverviewGeneral Fund Revenue
Revenue Source
FY2016Adopted Budget
FY2017Preliminary
Budget $ Change % Change
Local $930,485,500 $1,071,040,297 $140,554,797 15.1%
State 48,921,282 66,516,398 17,595,116 36.0%
Federal 23,273,563 23,472,742 199,179 0.9%
Total $1,002,680,345 $1,161,029,437 $158,349,092 15.8%
Less:
Recapture -272,762,822 -406,064,487 -133,301,665 48.9%
Operating Revenue $729,917,523 $754,964,950 $25,047,427 3.4%
16

Budget OverviewGeneral Fund Expenditure Budget
FY2016 Adopted Budget
FY2017 Preliminary
BudgetDifference % Change
Total Revenue $1,002,680,345 $1,161,029,437 $158,349,092 15.8%
Less: Recapture -272,762,822 -406,064,487 -133,301,665 48.9%
Net Revenue $729,917,523 $754,964,950 $25,047,427 3.4%
Total Operating Expenditures 728,986,455 740,260,988 11,274,533 1.5%
Net Other (Sources) Uses 30,000 30,000 0 0.0%Total Expenditures and Other (Sources) Uses 729,016,455 740,290,988 11,274,533 1.5%
Net Change in Fund Balances $901,068 $14,673,962 $13,772,894 1,528.5%
17

FY2017 Preliminary Budget By Object(Excluding Recapture)
Payroll Costs86.7%
Purchase & Contracted
Services8.3% Supplies
3.7%
Other Operating Costs1.2%
Capital Outlay0.1%
Debt Service0.1%
18
18

Where the Money Goes:General Fund Expenditures (Excluding Chapter 41)
FY2017 Preliminary Budget Expenditure Category by Function Expenditures
% of Expenditures
Instruction, Curriculum, & Staff Development 456,421,421 61.7%
School & Instructional Leadership 63,637,020 8.6%
Student Support 32,991,219 4.5%
Student Transportation 28,156,374 3.8%
Extracurricular 14,510,762 2.0%
General Administration 19,332,602 2.6%
Plant Maintenance, Security & Operations 88,115,362 11.9%
Data Processing 21,092,623 2.8%
Community Services 4,445,549 0.6%
Debt Services & Capital Outlay 2,161,029 0.3%
Payments to Intergovernmental Entities 9,397,027 1.3%
Total Operating Expenditures Excluding Chapter 41 740,260,988 100.0%
19
19

FY2017 Preliminary Budget Tax Rates
*I&S Tax Rate is projected to decrease for three years in a row
20
Tax RatesFY2014
AdoptedFY2015
AdoptedFY2016
AdoptedFY2017
Preliminary*
M&O $1.079 $1.079 $1.079 $1.079
I&S $0.163 $0.143 $0.123 $0.113
Total Tax Rate $1.242 per $100 of taxable
value
$1.222 per $100 of taxable
value
$1.202 per $100 of taxable
value
$1.192 per $100 of taxable
value
To see how the school tax portion of your annual property taxes pay for all the services provided by the Austin Independent School District visit http://www.austinisd.org/budget/mytaxdollar

Summary of Changes from FY2016 Adopted Budget to FY2017 Preliminary Budget
Description Amount
3% across-the-board salary increase for regular full-time and part-time employees
$15,030,000
Increase minimum hourly rate to $13.00 per hour 1,382,947
Increase in Chapter 41 Estimate 133,301,665
Other Baseline Increases 4,574,503
Preliminary Budget Decreases -9,712,917
Net Change in Expenditure Budget $144,576,198
21

Other Expenditure Baseline Increases
Expenditures Amount
Insurance and Bonding Costs $24,304
Property Appraisal and Collection Fees 734,280
Shared Service: Blind/Deaf Payment to State 404,274
Utilities including water, gas and electricity 623,043
State TRS Matching Contribution 759,002
Expand campus based technology team from 5 FTEs to 25 FTEs 1,145,676
Expand GPS Software for Viewing Bus Arrivals 75,000
UIL Mandated Rate Increase 75,000
Subtotal $3,840,579
22

Expenditure Baseline Increases (continued)
Expenditures Amount
Dyslexia Evaluation $198,429
Health and Physical Education 10,000 Equipment to provide online and mobile ticketing for athletic contests 40,000
Software Asset Management 325,000
Audit Fee/ERP Increase & Election Costs 20,495Establish fund for CALT program to train teacher on language therapy 140,000
Subtotal from prior slide 3,840,579
Total Increase in Baseline Expenditures $4,574,503
23
23
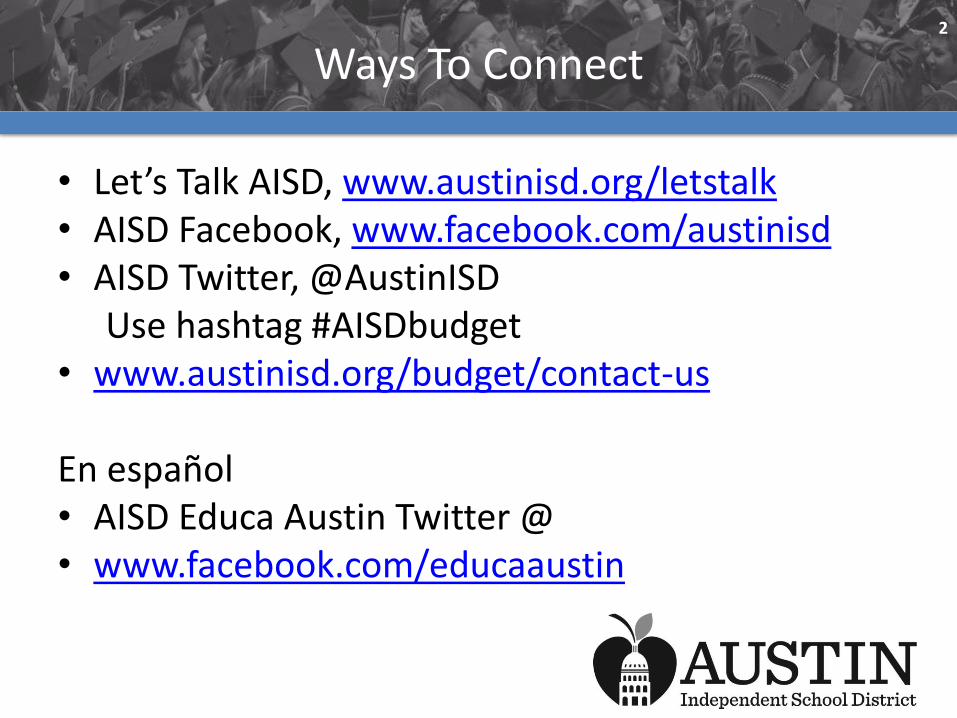
Proposed Budget Decreases (continued)24
Expenditures Amount
Health plan savings $2,411,139
Reduction of payroll costs resulting from decrease in student
enrollment 3,907,405
Reduce FTEs CAC / Campus non classroom positions 1,480,487
Curriculum Writing Cadre 298,046
Savings for custodial evening schedules net of night differential 615,840
Strategic Compensation Initiative 1,000,000
Total Proposed Budget Decreases $9,712,917

Fiscal Sustainability
Expenditures = Revenue
Maintain a Reasonable Reserve Levels
25

Where can I get more information about the AISD budget?
• AISD is your public school district, and you have access to clear and detailed information about the budget process and how your tax dollars are allocated and spent. You can go online to access multiple years of information at http://www.austinisd.org/budget
• You can also see how the district spends money by going to the AISD check registry at http://www.austinisd.org/sites/default/files/dept/budget/docs/AISD_Budget_CheckRegister. Here, you can review a list of every check that AISD has written for products or services within the last six years.
26

How do I get involved in the budget process?
• Attend PTA meetings at your child’s school • Get involved with your campus District Advisory Council
(DAC)• Contact your AISD board member or your state legislator • Email questions and suggestions to
[email protected]• Attend a scheduled Community Conversation meeting • Sign up to speak at a regularly scheduled meeting of the
Board of Trustees • Remember, there’s a lot of information about the budget
and the district at www.austinisd.org
27

QUESTIONS
28
28

29

1. How many students does AISD serve?
30
30
a. Less than 5,000b. 25,000-35,000c. 80,000-85,000d. More than 200,000

1. How many students does AISD serve?
31
31
a. Less than 5,000b. 25,000-35,000
c. 80,000-85,000 Correctd. More than 200,000
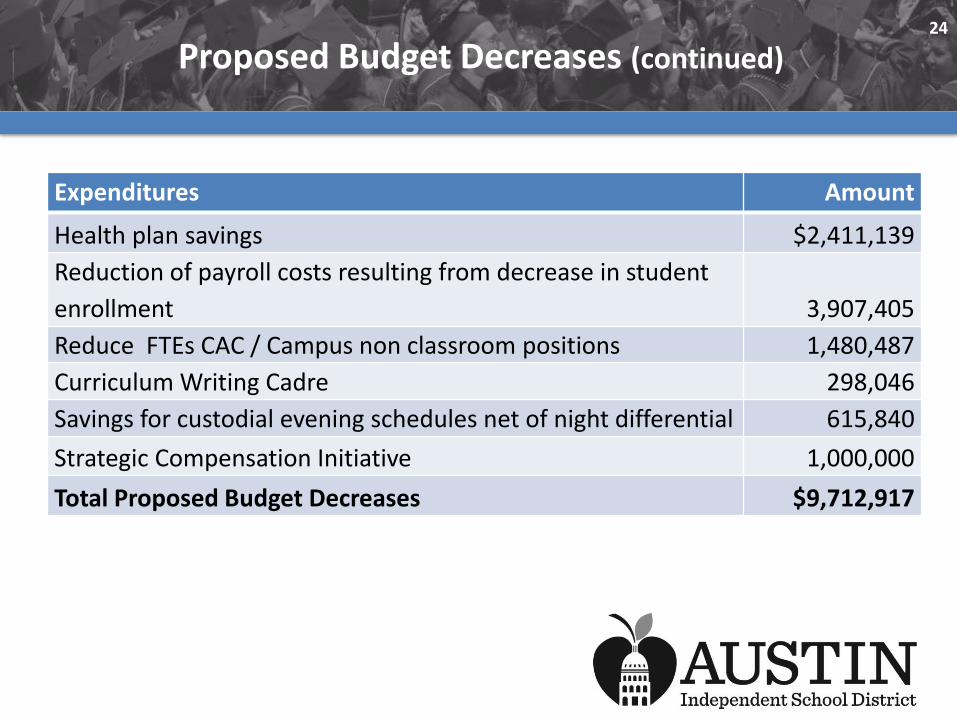
2. What is recapture?
32
32
a. A new game similar to capture the flagb. Annexing a surrounding districtc. When a sports player retrieves the ball
after a missed field goal or free throwd. A mechanism in state funding formulas
that ensures that a district's property wealth per student does not exceed certain levels. This provision takes local tax dollars from “property-rich” districts to provide state funding for “property-poor” districts

2. What is recapture?
33
33
a. A new game similar to capture the flagb. Annexing a surrounding districtc. When a sports player retrieves the ball after a missed
field goal or free throw
d. A mechanism in state funding formulas that ensures that a district's property wealth per student does not exceed certain levels. This provision takes local tax dollars from “property-rich” districts to provide state funding for “property-poor” districts Correct

3. How much is the AISD Budget?
34
34
a. Over $1 billionb. About $500 millionc. Between $250 and $499 milliond. Less than $100 million

3. How much is the AISD Budget?
35
35
a. Over $1 billion Correctb. About $500 millionc. Between $250 and $499 milliond. Less than $100 million

4. Where does the majority of AISD's funding come from?
36
36
a. State Income Taxb. Local Property Taxesc. State Fundingd. Bake Sales

4. Where does the majority of AISD's funding come from?
37
37
a. State Income Tax
b. Local Property Taxes Correctc. State Fundingd. Bake Sales

5. True or False:
38
38
If a homeowner has a homestead designation on their property, they will benefit from a $25,000 homestead exemption on their property values. True or False?

5. True!
39
39
If a homeowner has a homestead designation on their property, they will benefit from a $25,000 homestead exemption on their
property values. True