Embed Size (px)
Citation preview

1
Community Capability Model Framework
Project Information
Project Title Community Capability Model for Data-‐Intensive Research
Start Date 1st June 2011
End Date 31st May 2012
Project Director Liz Lyon (UKOLN, University of Bath)
Project Manager Manjula Patel (UKOLN, University of Bath)
Contact email [email protected]
Partners Microsoft Research, UKOLN (University of Bath)
Project Webpage URL http://communitymodel.sharepoint.com/
Document Information
Author(s) Liz Lyon, Alex Ball, Monica Duke, Michael Day
Filename CCMF Literature Review.doc
Date 24 April 2012
Version 1.2
Access Project Team
Acknowledgments UKOLN is funded by the Joint Information Systems Committee (JISC) of the Higher and Further Education Funding Councils, as well as by project funding from JISC, Microsoft Research and the European Union. UKOLN also receives support from the University of Bath where it is based.

2
Document History Version Date Comments 0.1 10/08/2011 Initial version – extracted and updated from Project Plan based on discussions
at F2F meeting, 11th July 2011 23/08/2011 Circulated to UKOLN staff
Uploaded to SharePoint 0.2 06/09/2011 Revised model parameters 0.3 07/09/2011 Revised model parameters following UKOLN meeting, 7th Sept 2011 0.4 08/09/2011 Reformatted 0.5 04/01/2012 Converted to White Paper 0.6 20/01/2012 Expanded scope, review of existing models, presentation of model 0.7 20/01/2012 Updated text of UoB mini case study 0.8 26/01/2012 Completed review of existing models, expanded presentation of model 0.9 30/01/2012 Updated motivation section, added next steps 0.10 01/02/2012 Added ESRC mini case study 0.11 02/02/2012 Further edits to CCMF section 0.12 03/02/2012 Further edits to CCMF section 1.0 08/02/2012 Further edits to CCMF section, added conclusions and executive summary 1.1 13/04/2012 CCMF section and executive summary adjusted in the light of feedback from
Melbourne workshop, added table of contents 1.2 24/04/2012 Motivation and CCMF sections adjusted in the light of further feedback

3
Contents Acknowledgments ......................................................................................................................... 1 Executive Summary ....................................................................................................................... 4 1 Introduction .......................................................................................................................... 6
1.1 Glossary of terms .......................................................................................................... 6 2 Motivation and purpose ....................................................................................................... 7
2.1 Funders ......................................................................................................................... 7 2.2 HE institutions ............................................................................................................... 9 2.3 Principal Investigators (PIs) ......................................................................................... 11
3 Review of existing models ................................................................................................... 12 3.1 Community Maturity Model ....................................................................................... 12 3.2 Capability Maturity Models ......................................................................................... 13 3.3 Cornell Maturity Model ............................................................................................... 18 3.4 Software Maturity Curve ............................................................................................. 20 3.5 Functional and Political Ecology of Requirements Model ........................................... 21
4 Community Capability Model Framework .......................................................................... 22 4.1 Collaboration ............................................................................................................... 22 4.2 Skills and training ........................................................................................................ 26 4.3 Openness .................................................................................................................... 27 4.4 Technical infrastructure .............................................................................................. 32 4.5 Common practices ...................................................................................................... 37 4.6 Economic and business models .................................................................................. 40 4.7 Legal and ethical issues ............................................................................................... 43 4.8 Academic culture ........................................................................................................ 44
5 Next steps ........................................................................................................................... 46 6 Conclusions ......................................................................................................................... 47 7 References .......................................................................................................................... 47
4
Executive Summary
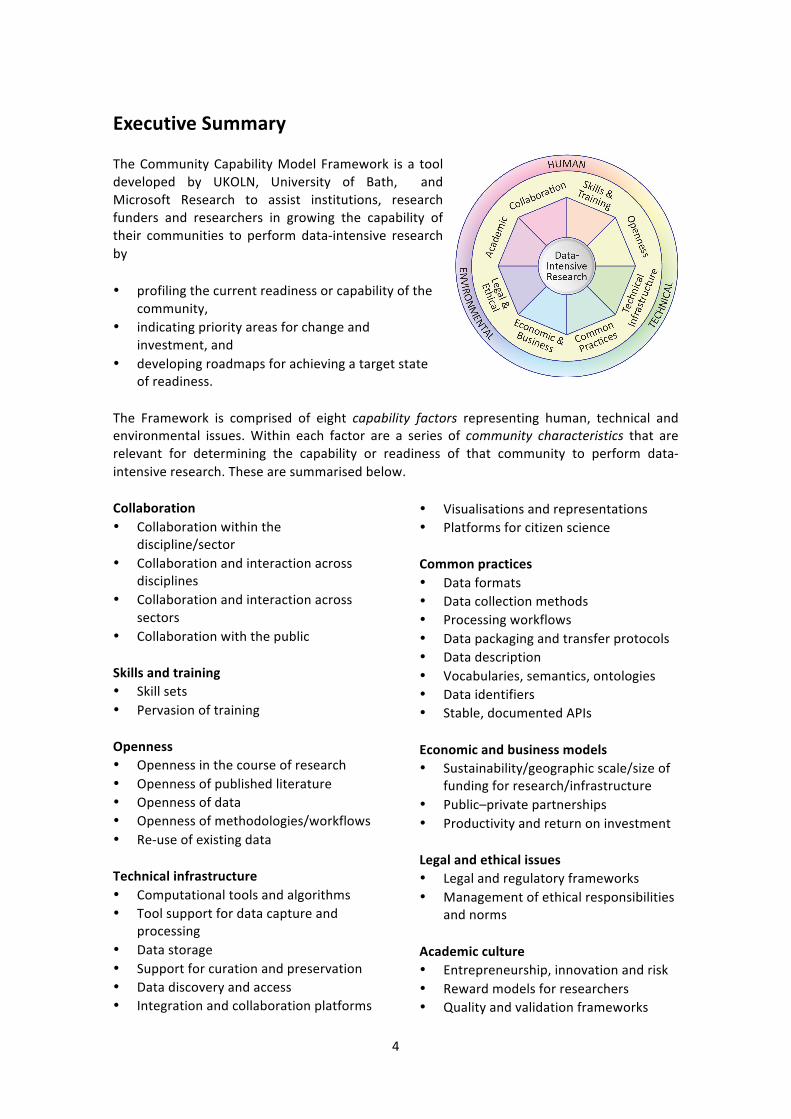
The Community Capability Model Framework is a tool developed by UKOLN, University of Bath, and Microsoft Research to assist institutions, research funders and researchers in growing the capability of their communities to perform data-‐intensive research by
• profiling the current readiness or capability of the community,
• indicating priority areas for change and investment, and
• developing roadmaps for achieving a target state of readiness.
The Framework is comprised of eight capability factors representing human, technical and environmental issues. Within each factor are a series of community characteristics that are relevant for determining the capability or readiness of that community to perform data-‐intensive research. These are summarised below.
Collaboration • Collaboration within the
discipline/sector • Collaboration and interaction across
disciplines • Collaboration and interaction across
sectors • Collaboration with the public
Skills and training • Skill sets • Pervasion of training
Openness • Openness in the course of research • Openness of published literature • Openness of data • Openness of methodologies/workflows • Re-‐use of existing data
Technical infrastructure • Computational tools and algorithms • Tool support for data capture and
processing • Data storage • Support for curation and preservation • Data discovery and access • Integration and collaboration platforms
• Visualisations and representations • Platforms for citizen science
Common practices • Data formats • Data collection methods • Processing workflows • Data packaging and transfer protocols • Data description • Vocabularies, semantics, ontologies • Data identifiers • Stable, documented APIs
Economic and business models • Sustainability/geographic scale/size of
funding for research/infrastructure • Public–private partnerships • Productivity and return on investment
Legal and ethical issues • Legal and regulatory frameworks • Management of ethical responsibilities
and norms
Academic culture • Entrepreneurship, innovation and risk • Reward models for researchers • Quality and validation frameworks

5
The functional requirements for the model framework were determined through a series of mini-‐case studies with a research funder, a research-‐led higher education institution and several principal investigators. A literature search was conducted for existing capability, readiness and maturity models, to see if any could be adapted to the requirements. None were found that could be a direct basis for the model framework, though inspiration could be drawn from several. A new model framework was therefore developed, drawing on the literature, the expertise of the project team and that of participants in four workshops conducted in the latter half of 2011 in the UK, the US and Sweden.
The model framework will now be validated through application to a number of research communities. Our future plans for the model framework include specialising it for different stakeholders and developing its utility as a tool supporting decision making and planning.

6
1 Introduction
Following the publication of The Fourth Paradigm (Hey et al. 2009), researchers across a range fields have been inspired by the possibilities of data-‐intensive research, that is, research involving large amounts of data, possibly combined from many sources across multiple disciplines, and requiring some degree of computational analysis. In many cases, though, these researchers find themselves unable to take part in it due lack of facilities, insufficient access to data, cultural disincentives or other such reasons. In response, UKOLN, University of Bath and Microsoft Research have been developing a Community Capability Model Framework (CCMF). The purpose of the CCMF is to assist institutions, research funders and researchers in growing the capability of their communities to perform data-‐intensive research by
• profiling the current readiness or capability of the community, • indicating priority areas for change and investment, and • developing roadmaps for achieving a target state of readiness.
In this paper, we present the CCMF itself, explain the concepts behind it and how it came to be in its current form. We begin in Section 2 by exploring the requirements and desiderata for the CCMF, through a set of stakeholder case studies. In Section 3, we survey alternative models of community capability, and evaluate their utility for the purposes set out in Section 2. In Section 4 we present the CCMF we have developed, and explain the various elements and how they came to be chosen. In Section 5, we indicate the next steps we intend to take with the CCMF, including how we see it being implemented by researchers, institutions and funders. Our conclusions are presented in Section 6.
1.1 Glossary of terms
The terms below have the following meaning in the context of this paper.
Capability model. A model for determining whether, how easily, and how well the agent in question could, in theory and in practice, accomplish a given task.
Community. In a broad sense, a community is set of people who share a particular location within the structure of an institution or society in general. Communities typically engage in both common and collective activities, and develop shared values, vocabularies, strategies and tactics (Agre 1998). In the particular case of academia, the term ‘community’ can apply at several different granularities: from the set of all academics and researchers, to disciplines such as physics or chemistry, or to narrow sub-‐disciplines such as organic crystallography (Treloar 1998: section 2.4.1). It can also apply to the academics and researchers within a particular institution or department, or those working on a common project.
In the context of the CCMF, the communities we are most interested in modelling are those defined by a discipline, a sub-‐discipline, or an institution.
Data-‐intensive research. Research belonging to what Gray (2009) termed the Fourth Paradigm of Science, that is, eScience or ‘data exploration’. It is typified by workflows where researchers only apply their academic insight to data after an intense period of data collection and processing, with the processing stages dominant. For the purposes of the CCMF, the following characteristics are necessary indicators of data-‐intensive research:

7
a) The research typically involves intense computational analysis of data. b) The research typically involves analysis of large quantities of data, that is, more data
than a research team could reasonably be expected to review without software assistance.
Also, if research involves combining data from several different sources, where the different source datasets have been collected according to different principles, methods and models, and for a primary purpose other than the current one, then it is likely to be classed as data-‐intensive research.
2 Motivation and purpose
We have identified three priority stakeholder groups with particular and distinctive interests in data-‐intensive research: funders, institutions and researchers. The views and opinions of each of these groups were investigated through a series of mini case-‐studies based on structured interviews with a range of individuals. The interviews explored perceived barriers to, enablers of and infrastructure requirements for data-‐intensive research, and identified priorities for the CCMF. A summary of the findings is presented below.
2.1 Funders
Source: Interviews with three representatives from the ESRC Policy & Resources Directorate, Jeremy Neathey (Director of Training & Resources), Vanessa Cuthill (Head of Research Resources), Kristine Doronenkova (Principal Policy Manager).
The ESRC is one of the seven UK Research Councils and funds a range of data-‐intensive research including longitudinal studies, major studies such as Understanding Society and the Census, which involve data-‐linking with other datasets, smaller projects designed to build up networks such as the micro-‐data analysis and the cross-‐national pathfinder projects, and the Digital Social Research Programme.
2.1.1 Barriers
Skills. Quantitative data skills i.e. a lack of capacity to understand how to effectively manipulate large and complex quantitative datasets, but also qualitative data skills. Data management skills are a grey area for many researchers; also data discoverability.
Access. This includes legal barriers, as well as physical access, ESRC has funded the Secure Data Service (SDS). Linking data-‐sets in different secure physical settings is a challenge, in particular when there are trans-‐national issues.
Cultural antecedents. There is a perceived strong cultural dynamic where medics need to have a more open view on why data resources are being created i.e. not for a simple hypothesis-‐driven science.
Infrastructure Fragmentation. ESRC strategy seeks to create a seamless set of access routes into the data but this involves a broad set of stakeholders who hold social science data. Joining up the landscape would enhance capacity to do data-‐intensive research.

8
2.1.2 Enablers
National role. ESRC acts as an agent for change with the level of funding to support data intensive research and data linkage, to create new resources and improve existing ones. ESRC acts as a catalyst for other partners through the data strategy and facilitates informed debate.
Standards. The Administrative Data Taskforce seeks to improve access to a range of administrative data through a more consistent approach to access arrangements, metadata standards and interpretation of the law.
Co-‐ordination of core funders through an overarching data access advisory group, through the UK Data Forum and through common infrastructure and governance mechanisms such as the UK Data Service activity. Case studies in administrative data point to a lack of common governance to data access and legal/statutory problems, which are only surmountable by changes to primary legislation.
Training. ESRC programme of investment at u/g and school level, through Doctoral Training Centre (DTC) cohorts and the National Centre for Research Methods to build up skills levels through the life course of researchers. ESRC is also working with HEFCE, the British Academy and MRC to join up across funders.
2.1.3 Infrastructure Requirements
UK Data Service as a one-‐stop-‐shop to discover and use a whole portfolio of datasets.
Tools. Investing in intermediate level software tools which lead people towards a more nuanced and sophisticated use of larger datasets.
Data Licences. ESRC has a role in negotiating licences to enable researchers to access the maximum amount of data.
Data Citation. Promoting a culture of data sharing by providing data citation mechanism and tools to enable the collection of attribution metrics which in turn provide incentives for researchers.
2.1.4 CCMF Priorities
Cross-‐funder integration including facilitating a more joined up approach to research outputs and outcomes. A central information resource or network of organisations and funding programmes which enables discovery of research opportunities at the planning phase: joining up across different agencies will maximise existing research funding.
Strategic Impact. Can the CCMF help to demonstrate the benefits and value from following particular strategic funding choices? Can it help the community identify what is the right level of investment in software tools, prevent inventing new tools and encourage modification and adaption of existing tools? Can the CCMF provide guidance in understanding research opportunities from new forms of data e.g. transactional data? Can the CCMF help to break down barriers across international boundaries?
9
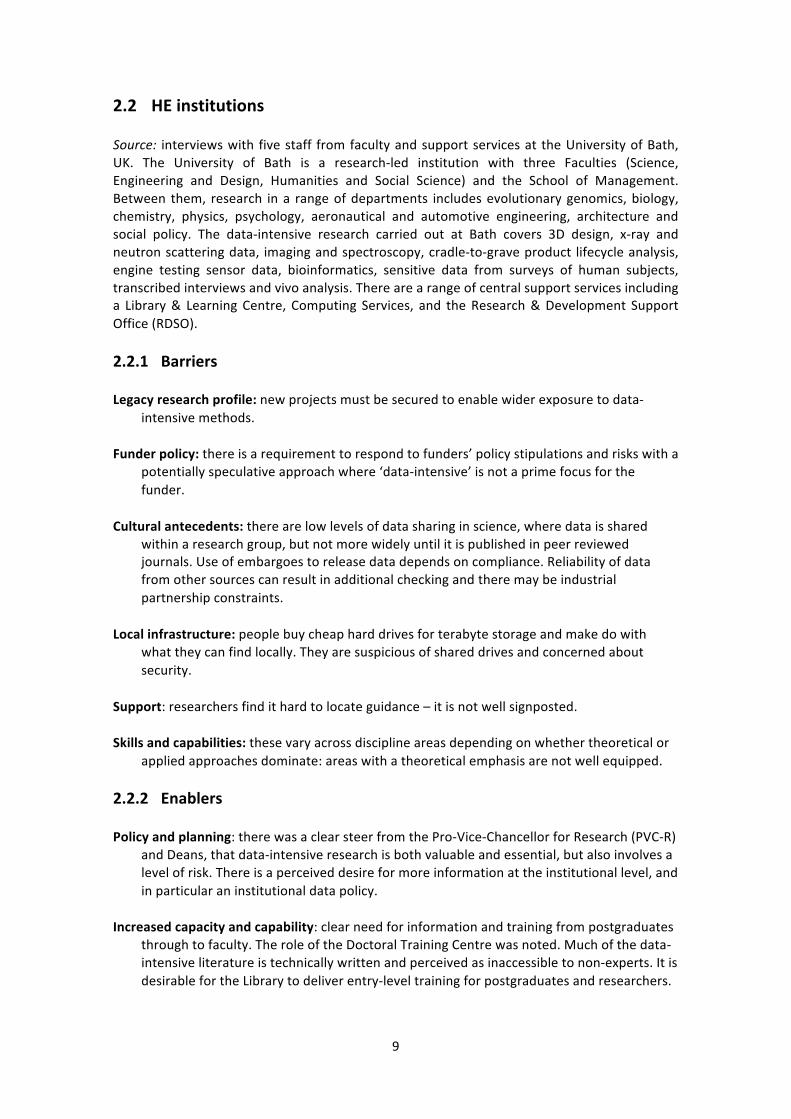
2.2 HE institutions
Source: interviews with five staff from faculty and support services at the University of Bath, UK. The University of Bath is a research-‐led institution with three Faculties (Science, Engineering and Design, Humanities and Social Science) and the School of Management. Between them, research in a range of departments includes evolutionary genomics, biology, chemistry, physics, psychology, aeronautical and automotive engineering, architecture and social policy. The data-‐intensive research carried out at Bath covers 3D design, x-‐ray and neutron scattering data, imaging and spectroscopy, cradle-‐to-‐grave product lifecycle analysis, engine testing sensor data, bioinformatics, sensitive data from surveys of human subjects, transcribed interviews and vivo analysis. There are a range of central support services including a Library & Learning Centre, Computing Services, and the Research & Development Support Office (RDSO).
2.2.1 Barriers
Legacy research profile: new projects must be secured to enable wider exposure to data-‐intensive methods.
Funder policy: there is a requirement to respond to funders’ policy stipulations and risks with a potentially speculative approach where ‘data-‐intensive’ is not a prime focus for the funder.
Cultural antecedents: there are low levels of data sharing in science, where data is shared within a research group, but not more widely until it is published in peer reviewed journals. Use of embargoes to release data depends on compliance. Reliability of data from other sources can result in additional checking and there may be industrial partnership constraints.
Local infrastructure: people buy cheap hard drives for terabyte storage and make do with what they can find locally. They are suspicious of shared drives and concerned about security.
Support: researchers find it hard to locate guidance – it is not well signposted.
Skills and capabilities: these vary across discipline areas depending on whether theoretical or applied approaches dominate: areas with a theoretical emphasis are not well equipped.
2.2.2 Enablers
Policy and planning: there was a clear steer from the Pro-‐Vice-‐Chancellor for Research (PVC-‐R) and Deans, that data-‐intensive research is both valuable and essential, but also involves a level of risk. There is a perceived desire for more information at the institutional level, and in particular an institutional data policy.
Increased capacity and capability: clear need for information and training from postgraduates through to faculty. The role of the Doctoral Training Centre was noted. Much of the data-‐intensive literature is technically written and perceived as inaccessible to non-‐experts. It is desirable for the Library to deliver entry-‐level training for postgraduates and researchers.
10
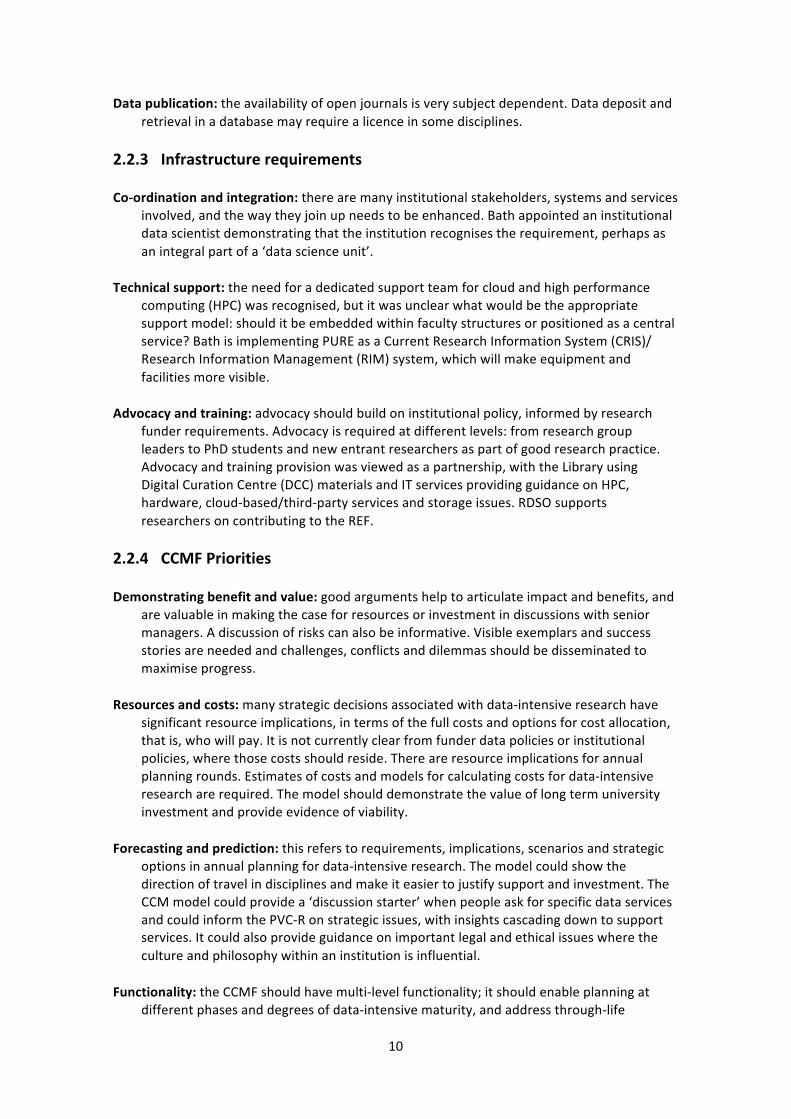
Data publication: the availability of open journals is very subject dependent. Data deposit and retrieval in a database may require a licence in some disciplines.
2.2.3 Infrastructure requirements
Co-‐ordination and integration: there are many institutional stakeholders, systems and services involved, and the way they join up needs to be enhanced. Bath appointed an institutional data scientist demonstrating that the institution recognises the requirement, perhaps as an integral part of a ‘data science unit’.
Technical support: the need for a dedicated support team for cloud and high performance computing (HPC) was recognised, but it was unclear what would be the appropriate support model: should it be embedded within faculty structures or positioned as a central service? Bath is implementing PURE as a Current Research Information System (CRIS)/ Research Information Management (RIM) system, which will make equipment and facilities more visible.
Advocacy and training: advocacy should build on institutional policy, informed by research funder requirements. Advocacy is required at different levels: from research group leaders to PhD students and new entrant researchers as part of good research practice. Advocacy and training provision was viewed as a partnership, with the Library using Digital Curation Centre (DCC) materials and IT services providing guidance on HPC, hardware, cloud-‐based/third-‐party services and storage issues. RDSO supports researchers on contributing to the REF.
2.2.4 CCMF Priorities
Demonstrating benefit and value: good arguments help to articulate impact and benefits, and are valuable in making the case for resources or investment in discussions with senior managers. A discussion of risks can also be informative. Visible exemplars and success stories are needed and challenges, conflicts and dilemmas should be disseminated to maximise progress.
Resources and costs: many strategic decisions associated with data-‐intensive research have significant resource implications, in terms of the full costs and options for cost allocation, that is, who will pay. It is not currently clear from funder data policies or institutional policies, where those costs should reside. There are resource implications for annual planning rounds. Estimates of costs and models for calculating costs for data-‐intensive research are required. The model should demonstrate the value of long term university investment and provide evidence of viability.
Forecasting and prediction: this refers to requirements, implications, scenarios and strategic options in annual planning for data-‐intensive research. The model could show the direction of travel in disciplines and make it easier to justify support and investment. The CCM model could provide a ‘discussion starter’ when people ask for specific data services and could inform the PVC-‐R on strategic issues, with insights cascading down to support services. It could also provide guidance on important legal and ethical issues where the culture and philosophy within an institution is influential.
Functionality: the CCMF should have multi-‐level functionality; it should enable planning at different phases and degrees of data-‐intensive maturity, and address through-‐life

11
planning from the initial concept, through design and inception, to delivery. The model should be validated against different types of data, different types of user and different aspects of policy development.
2.3 Principal Investigators (PIs)
Source: interviews with six PIs from the eResearch South Consortium (core institutions Oxford, Reading Southampton, STFC).
2.3.1 Barriers
Skills and capabilities: many researchers don’t see the benefits of data-‐intensive research, that is, they lack the vision to develop data-‐intensive research ideas and projects.
Methodological constraints: there are tensions between supervisors and students/postgraduates in terms of research methods and techniques.
First access to the data: this is seen as an immense advantage. If data collection is closely tied to subsequent analysis, and because it is hard work to win research grants, researchers will hang on to their data and be reluctant to share more widely.
Resource and Effort: significant work is required to include all the necessary information about the data, particularly when datasets are large. There is little incentive to make data usable for others.
Cultural antecedents: these may influence the way research is carried out; this is particularly true in medicine, for example. Differing views are present at both the coalface practitioner and funder strategic levels.
2.3.2 Enablers
Shared Methodologies: in social science, methods are shared as well as data. If methods are shared then the effort is distributed. There are however communities who will share data and not methods, or vice versa. More credit is given for methodology in social science.
Data citation: there needs to be a demonstrable link between the PI, the grant award, the data, and the research project. Currently, if someone else cites one’s data, one does not get credit. One ought to get more credit when one’s data is used by other disciplines – currently the reverse arrangement is true.
Data publication: papers with every author/data contributor listed will be accepted for publication in some areas (e.g. climate science) but not in others. A good example of data publication is in crystallography, which includes citations of structures. Citing a paper is viewed as a blunt instrument because one needs to cite each role that individuals had in the research work. The film credits model was presented as a good approach.
Data quality: data validation is a requirement of the scientific method but more work is needed to make data useable by other research groups.
12
Data visualisation: visualisation may provide incentives for someone from another field to use one’s data.
Incentives (or winning hearts and minds): ‘there is nothing in it for people at the moment’.
2.3.3 Infrastructure Requirements
Shared mission: mission-‐driven organisations with common goals have produced data-‐sharing success stories, for example CERN and EBI; if other disciplines were organised in this way, would there be benefits? Some fields have been encouraged to share data and communities actively coalesce around the data when it is created.
Training: the perceived role of a PI is to ‘come up with ideas and get grants’. There needs to be more emphasis on life-‐long learning to ensure senior research staff are engaged at the coalface.
Security: the exemplar of animal-‐based research was quoted, where steps are taken to minimise animal utilisation,1 and data sharing is within a secure environment.
2.3.4 CCMF Priorities
Demonstrate benefit and value: protocols and methodologies may have real value in addition to the data. It is hard to determine whether data has value in a different domain until someone from that domain tries to use the data.
Case studies and exemplars: few specific cases to demonstrate the value of data reuse.
Clarify roles and responsibilities: the relationship between the data centre and the PI/institution is unclear. Data centres do not take all the data offered to them: they choose which data to keep. There may be no obvious single place to keep a particular dataset. One always needs to balance the benefits of additional research based on data against the costs of storage, and there may be tensions between HE institutions and data centres. The CCMF could distinguish between responsibility for ‘publishing’ data at a sufficient level of quality to enable data citation and re-‐use, and responsibility for archiving or preserving the data in the longer term.
3 Review of existing models
3.1 Community Maturity Model
The Community Maturity Model was developed by The Community Roundtable to help define a discipline of community management for organisations (Happe 2009). It identifies a set of competencies necessary for successful community management, and for each of them describes how they appear at four different levels of maturity (see Figure 1).
1 The Three Rs of animal-‐based research are: replace the use of animals with other techniques where possible, reduce the number of animals used to a minimum, and refine procedures to minimise suffering.

13
Figure 1: The Community Maturity Model
The authors identify several ways in which this model may be used:
• as a standard skill set against which to perform gap analysis within an organisation, to inform training programmes or recruitment policy;
• to communicate community management ideas within an organisation, and manage expectations for what is currently possible;
• to help organisations develop a plan for improving their community management, that is, what to do and in what order;
• as a framework for contextualising case studies and examples of best practice.
These use cases resonate strongly with the aims for the CCMF, and the model itself is elegant and easy to comprehend at a glance. There are significant differences, though, between community management and data-‐intensive research that speak against using the Community Maturity Model as an exact template for the CCMF. The Community Maturity Model is predicated on the notion that there is a single ideal way to perform community management, whereas with data-‐intensive research, the ideal state for any given community will likely depend on that community’s values and priorities; the CCMF will therefore need to accommodate several different ideals. The Community Maturity Model also restricts itself to competencies present within an organisation, whereas the capability for data-‐intensive research has a complex set of dependencies ranging across disciplines, institutions, shared facilities and research teams.
3.2 Capability Maturity Models
There are several capability maturity models in existence. The first was developed by the Software Engineering Institute at Carnegie Mellon University and relates to the capability of an organisation to develop software on specification, on time and on budget (Paulk et al. 1993). The model identifies five different levels of maturity with respect to efficient software development (see Figure 2).

14
Figure 2: The five levels of software process maturity, and the key process areas of each
For each level, the model identifies key process areas, each with its own specific set of goals. Achieving a given maturity level means achieving the goals of the key process areas of that and all previous levels. To make this more concrete, the model specifies for each key process area a set of key practices that if performed would satisfy the area’s goals. Each of these key practices contributes to one of the following common features:
1. Commitment to Perform: the organisation must commit to establishing and continuing the process (e.g. institute an organisational policy);
2. Ability to Perform: the organisation must ensure its ability to perform the requisite activities (e.g. by performing training or committing resources);
3. Activities Performed: the organisation must implement the process, for example by establishing operational plans and procedures, performing the activities, and fine-‐tuning the procedures in the light of experience;
4. Measurement and Analysis: the organisation must measure the performance of activities and analyze the results;
5. Verifying Implementation: the organisation must verify that the activities performed actually achieve the goals of the key process area, for example through an audit or quality assurance process.
The practices contributing to Activities Performed tend to be the ones that directly concern the goals of the key process area; the others help with embedding these practices into the organisation.

15
The model has two primary use cases. The first is to determine the current maturity level of a software-‐developing organisation, either for internal purposes or for the benefit of a client choosing between potential contractors. The second builds on the first, assisting organisations in designing a roadmap to increase their maturity level.
A slightly different approach was taken when the model was adapted to describe system engineering processes (Bate et al. 1995). Here, the process areas are taken as primary, with a capability level assigned to each process area individually. Practices associated with each process area are again grouped into common features, but this time the common features – more numerous and specific than in the previous model – are the measure used for determining the capability level (see Figure 3).
Figure 3: Improvement path for process capability
This version of the model makes more explicit the difference between practices that are specific to a process area (base practices) and those generic practices that help to embed the base practices into the organisation. Indeed, performing all the base practices of a process area is the measure of achieving Level 1 in that area. Moving beyond Level 1 involves the same generic practices regardless of process area.
Like its predecessor, the systems engineering flavour of the model is intended for use as a tool to appraise the current state of an organisation’s processes, set targets for how the organisation should be operating, and draw up a roadmap of how to achieve those targets. The authors of the model do not recommend using the model to evaluate potential contractors, though they acknowledge that it might be so used.

16
More recently, the model has been applied to research data management in two independent efforts. The Australian National Data Service (2011) provides descriptions of the five levels of maturity for four key process areas, as summarised in Table 1.
Table 1: Research Data Management Capability Maturity Guide Summary Table of Levels
Level 1: Initial
Level 2: Development
Level 3: Defined
Level 4: Managed
Level 5: Optimised
Process is disorganised and ad hoc
Process is under development
Process is standardised, communicated
Process is managed, measured
Focus is on continuous improvement
Institutional policies and procedures
Policies & procedures may be undeveloped, not up to date, and/or inconsistent.
Policies & procedures are developed & harmonised.
Policies & procedures are promulgated & absorbed into behaviours.
Policies & procedures accepted as part of the culture & subject to audit.
Policies & procedures are subject to review & improvement.
IT infrastructure
IT infrastructure provision is patchy, disorganised & poorly publicised.
Funds are invested in technology & skills. Responsibilities are defined. Processes are established, defined & documented.
Management shows active support. Facilities are well-‐defined & communicated, standardised &integrated.
Funding adapted to need. Management actively engaged. Documentation kept up to date.
Concerted efforts to maintain, update & publicise infrastructure. Metrics & feedback used to optimise services.
Support services
Training is ad hoc, curation & preservation services are disorganised, data management planning is unsupported & other services inconsistent & poorly publicised
Investment in skills. Services identified & staffed. Responsibilities are defined. Documentation & training developed.
Active participation in training & widespread availability of services.
Widespread take up of services. Curation & preservation acknowledged as critical to the institutional mission.
Customer feedback used extensively to update & improve services.
Managing metadata
Metadata management is chaotic & understood by only a few.
Responsibilities are defined & skills developed. Processes are established, defined & documented. Metadata applied to key datasets & shared externally.
Processes are standardised & integrated. Metadata applied to new datasets & shared externally.
Metadata quality metrics collected. All datasets described & metadata shared.
Continuous improvement applied to processes & capabilities.
This version of the model is much simpler than the two described above, with narrative descriptions of maturity levels within each process area replacing the sets of key practices and common features. The focus is on higher education institutions, with the four process areas mapping neatly onto groups and services such as senior management, IT support, researcher support or staff development, and the library. The model acknowledges that not all organisations will aim to attain Level 5 in all areas.
17
Crowston and Qin (2011) take a different approach, focusing on scientific data management within a research project. They interpret the five levels as follows.
1. Data are managed within the project on an ad hoc basis, following the intuitions of the project staff.
2. Plans, policies and procedures are in place for data management, but they are peculiar to the project and reactive in nature.
3. The project tailors for itself plans, policies and procedures set up for data management at the discipline, community or institutional level; these plans tend to be pro-‐active in nature.
4. The project measures the success and effectiveness of its data management to ensure standards are maintained.
5. The project identifies weaknesses in its data management and addresses the defects pro-‐actively.
In developing their version of the model, Crowston and Qin consulted data management literature to identify key practices in data management, which they grouped into the following four key process areas:
1. Data acquisition, processing and quality assurance (3 practices) 2. Data description and representation (7 practices, including ‘Develop and apply metadata
specifications and schemas’, ‘Design mechanisms to link datasets with publications’, ‘Ensure interoperability with data and metadata standards’)
3. Data dissemination (4 practices, including ‘Encourage sharing’, ‘Distribute data’) 4. Repository services/preservation (7 practices, including ‘Store, backup and secure data’,
‘Perform data migration’, ‘Validate data archives’)
In addition, they identified several generic practices that closely resembled those in the earlier models, for example,
• developing policies for data release, sharing, data rights and restrictions, and data curation.
• identifying staffing needs, • developing business models, • developing data management tools, • training researchers and support staff, • capturing provenance data, • developing collaborations and partnerships, • assessing impact and enforcing policy.
The use cases for all three models strongly resemble those intended for the CCMF. They provide a clear framework for characterising an organisation or project, and identifying improvements that could be made as well as the order in which they should be tackled. They also provide a reference vocabulary for describing relevant activities and functions, without being overly specific about how these should be carried out or implemented. There is a potential mismatch with the CCMF in terms of the object of study, with the first two models focusing on commercial organisations. The ANDS version, though, shows how it can be applied to higher education institutions, and Crowston and Qin’s model focuses on research projects while also referencing (and having clear implications for) the wider institutional and disciplinary context. Indeed, perhaps the most important difference to reconcile between these models and what is required for the CCMF is that they again admit only one target state to which organisations should aspire, with the possible exception of the ANDS model; in

18
contrast, it would be hard to find a single generic description that could apply to all successful forms of data-‐intensive research.
3.3 Cornell Maturity Model
Kenney and McGovern (2003, 2005) present a different five-‐stage maturity model, specifically relating to the type of response given by higher education institutions to the challenges of digital preservation. These five stages are as follows.
1. Acknowledge. The institution recognises it must perform some degree of digital preservation.
2. Act. The institution instigates digital preservation projects. 3. Consolidate. The institution embeds digital preservation as ongoing programmes. 4. Institutionalise. The institution unifies the various digital preservation activities into a
single programme. 5. Externalise. The institution collaborates with others to achieve economies of scale and
increased digital preservation capability.
In the early expressions of the model, key indicators for each stage were described along the three dimensions of policy and planning, technological infrastructure, and content and use. These dimensions were later changed to organisational infrastructure, technological infrastructure, and resources, with a corresponding new set of key indicators. To emphasise that organisations should develop in each of the dimensions in parallel, but that the digital preservation capability can still be stable with uneven development, they became known as the three legs of a digital preservation Three-‐Legged Stool (see Figure 4).
Figure 4: The Cornell Maturity Model Three-‐Legged Stool
The model was further developed by the AIDA Project into a scorecard-‐based tool for benchmarking the current state of digital asset management within an institution or department.2 AIDA expanded and formalised the indicators within each leg, arriving at eleven metrics in each of the organisation and technology legs, and nine metrics within the resources leg. While AIDA was intended as a self-‐assessment toolkit, the AIDA Project Team provided a service for assessing completed scorecards to determine an overall picture of institutional readiness, recommend actions for increasing readiness, and provide guidance on digital asset management issues.
2 AIDA Project Web pages, URL: http://aida.jiscinvolve.org/wp/

19
The AIDA scorecard provided by the Project Team was in the form of a Microsoft Word document with form controls, with analysis performed on an accompanying Excel spreadsheet. The process of performing the benchmarking exercise itself, though, was left up to the individual to plan. Seeing a need, the UK Digital Curation Centre (DCC) applied its experience from developing the tools that supported DRAMBORA and the Digital Asset Framework to produce a Web-‐based tool allowing a team of contributors to collaborate on an AIDA-‐style self-‐assessment. This tool, CARDIO,3 uses a very similar set of metrics (‘statements’) to AIDA proper, but with one fewer in the technology leg and a specific emphasis on research data. These statements are shown in Table 2. In addition, CARDIO can be used at the project level as well as at a departmental or institutional level.
Table 2: CARDIO's version of the Three-‐Legged Stool
Organisation Technology Resources 1. Data Ownership and
Management 2. Data Policies and
Procedures 3. Data Policy Review 4. Sharing of Research
Data/Access to Research Data
5. Preservation and Continuity of Research
6. Internal Audit of Research Activities
7. Monitoring and Feedback of Publication
8. Metadata Management 9. Legal Compliance
10. Intellectual Property Rights and Rights Management
11. Disaster Planning and Continuity of Research
1. Technological Infrastructure
2. Appropriate Technologies
3. Ensuring Availability 4. Managing data integrity 5. Obsolescence 6. Managing technological
change 7. Security Provisions 8. Security Processes 9. Metadata tools
10. Institutional Repository
1. Data Management Costs and Sustainability
2. Business Planning 3. Technological Resources
Allocation 4. Risk Management 5. Transparency of
Resource Allocation 6. Sustainability of Funding
for Data Management and Preservation
7. Data Management Skills 8. Number of Staff for Data
Management 9. Staff Development
Opportunities
The use cases for this model – assessing the current state of readiness of an institution and identifying priorities for development – again resonate strongly with those for the CCMF. Just as the CCMF should be applicable to researchers, institutions and funders, the Three-‐Legged Stool can be applied at several different granularities. The notion of having broad, abstract dimensions measured according to specific, concrete metrics is a useful one. Once more, though, the model considers only one correct route from nil readiness to complete readiness through each leg, and through each metric within each leg. The CCMF, by contrast with have to model several types of community capability, and by implication several different ‘routes’ to achieving capability.
3 CARDIO Website, URL: http://cardio.dcc.ac.uk/
20
3.4 Software Maturity Curve
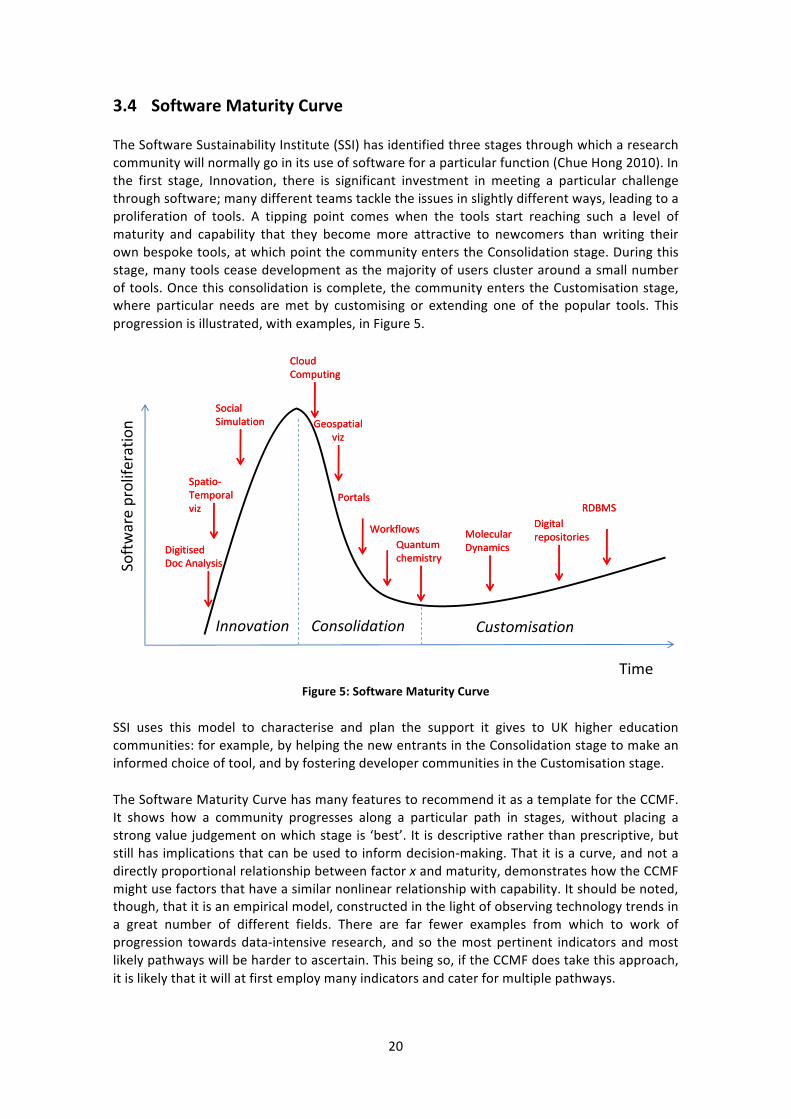
The Software Sustainability Institute (SSI) has identified three stages through which a research community will normally go in its use of software for a particular function (Chue Hong 2010). In the first stage, Innovation, there is significant investment in meeting a particular challenge through software; many different teams tackle the issues in slightly different ways, leading to a proliferation of tools. A tipping point comes when the tools start reaching such a level of maturity and capability that they become more attractive to newcomers than writing their own bespoke tools, at which point the community enters the Consolidation stage. During this stage, many tools cease development as the majority of users cluster around a small number of tools. Once this consolidation is complete, the community enters the Customisation stage, where particular needs are met by customising or extending one of the popular tools. This progression is illustrated, with examples, in Figure 5.
Figure 5: Software Maturity Curve
SSI uses this model to characterise and plan the support it gives to UK higher education communities: for example, by helping the new entrants in the Consolidation stage to make an informed choice of tool, and by fostering developer communities in the Customisation stage.
The Software Maturity Curve has many features to recommend it as a template for the CCMF. It shows how a community progresses along a particular path in stages, without placing a strong value judgement on which stage is ‘best’. It is descriptive rather than prescriptive, but still has implications that can be used to inform decision-‐making. That it is a curve, and not a directly proportional relationship between factor x and maturity, demonstrates how the CCMF might use factors that have a similar nonlinear relationship with capability. It should be noted, though, that it is an empirical model, constructed in the light of observing technology trends in a great number of different fields. There are far fewer examples from which to work of progression towards data-‐intensive research, and so the most pertinent indicators and most likely pathways will be harder to ascertain. This being so, if the CCMF does take this approach, it is likely that it will at first employ many indicators and cater for multiple pathways.
Softw
are prolife
ratio
n
Time
CustomisationInnovation Consolidation
PortalsPortals
QuantumchemistryQuantumchemistry
CloudComputingCloudComputing
RDBMSRDBMS
SocialSimulationSocialSimulation
WorkflowsWorkflows
Spatio-‐Temporalviz
Spatio-‐Temporalviz
MolecularDynamicsMolecularDynamics
Geospatialviz
Geospatialviz
DigitisedDoc AnalysisDigitisedDoc Analysis
DigitalrepositoriesDigitalrepositories
21
3.5 Functional and Political Ecology of Requirements Model
The models above each map out a course of evolving maturity and capability for organisations along their lifecycle. Bergman et al. (2002) present a more general model that describes how organisations shift from one system or workflow to another in response to problems.
In the functional model they describe, the current system or workflow is modelled as a solution space St (that is, as a set of solutions to a previous set of problems). Stakeholders in the system identify inconsistencies between the current system and some desired state of affairs; such inconsistencies, or anomalies, form an anomaly space. The stakeholders with an influence over the situation, called principals, identify a subset of anomalies as problems that need to be solved, the total set of which is the problem space P. The problems within P are mapped onto solution space sources within St (i.e. system components or stakeholders experiencing the problems) to give the objective requirements. A proposed solution space St+1 is chosen from among the possibilities (Sʹ′) to address a subset (Pt) of the problems in P. Constraints are modelled as mappings from the problems in Pt to future solution source pieces in Sʹ′; once imposed by the principals, these restrict which solution space can be chosen as St+1. The two mapping exercises can, along with other forms of investigation, lead to the discovery of other problems and solution space sources in a process called problem blossoming. Note that it is not a straightforward linear process to get to a point where Pt, St+1, and all the mappings are agreed by the principals.
Solution space transformation is the process of moving from St to St+1. It can fail for various different reasons, not least selecting the wrong set of problems to solve, and selecting an St+1 that is in practice unreachable from St.
The political model adds an extra dimension to this, specifically to account for situations where the principals do not come to natural consensus on the problems to be included in the set Pt. Bergman et al. concentrate on situations involving a two-‐party contest; a proponent coalition agrees on a problem set PP, but they are opposed by an opponent coalition made up of principals who do not find PP a compelling case for change, disagree with the characterisation of St, or prefer a different problem set PO. Four possible outcomes are identified:
1. The opponent coalition ‘wins’ and the solution space transformation does not go ahead. 2. The proponent coalition ‘wins’ and while the solution space transformation may go ahead,
there is a danger that the result will lack critical functionality. 3. The two coalitions find a compromise solution. This usually leads to a stable solution space
transformation, but there is a danger that some of the wrong problems may creep in. 4. The proponent coalition re-‐examines the current situation and produces a new St and PP;
this is known as reprobleming. This may result in competition between several possible combinations of Pt and St+1.
The primary value of these models is in their ability to describe what went right and what went wrong in cases where organisations have undergone large scale transformations. While a certain amount of benefit can be gained from understanding, at the time, the processes involved in planning and executing such a transformation, as general models they do not provide specific guidance on achieving a particular end such as improved capability for data-‐intensive research. As such they are not suitable as templates for the CCMF itself, but they do provide useful insights into how the CCMF might handle different ‘target states’ of data-‐intensive research and the routes to achieving them; for example, the CCMF may incorporate an element of choice as to which barriers need to be overcome.

22
4 Community Capability Model Framework
The model that we propose comprises a framework of eight capability factors representing human, technical and environmental issues. Within each factor are a series of community characteristics that are relevant for determining the capability or readiness of that community to perform data-‐intensive research.
In the sections below, we present the community characteristics associated with each factor, alongside indications of how each characteristic is ‘measured’ for the purposes of analysis and comparison. The characteristics come in two varieties: dimensions and modes. Dimensions, where the alternatives can be thought of as points along a spectrum, are shown underlined with a double-‐headed arrow. Modes, where the alternatives do not stand in a linear relationship to one another, are shown underlined with a normal line.
For each characteristic, we provide one or more exemplars demonstrating how the alternatives should be interpreted. We also provide a short commentary explaining the relevance of the characteristic for determining capability, and how our thinking has been shaped by the literature and by discussions with the community. These discussions took place in a series of five workshops held between September 2011 and February 2012 in the UK, US, Sweden and Australia.
4.1 Collaboration
The working relationships that are formed during research have a strong bearing on the types of research that can be performed. Collaborations can be of a small, informal nature, more formally organised and self-‐managed, or rigorously controlled and managed through contracts and agreements. The characteristics of collaboration are examined under the headings of same-‐discipline, same-‐sector collaboration, cross-‐disciplinary collaboration and cross-‐sectoral working.
The drive to work on a local or global scale can derive from characteristics of the data itself. Some data has inherent local boundaries, e.g. water characteristics in specific locations, while data used by other disciplines is not inherently bound by geographic or national limits, e.g.

23
astronomy. Based on the suggestion that data drives collaborations, it could be speculated that new domains could emerge from new data combinations.
Where the driver for data-‐intensive research is the sheer scale of the data needed to answer the research question, collaboration is a key strategy for drawing together sufficient capacity to perform the collection and processing. Olson et al. (2008) present a theory of remote scientific collaboration which identifies five key factors to success:
1. The nature of the work. Success is more likely if collaborators can work on their contributions for the most part independently.
2. Common ground. Success is more likely if the collaborators have a history of working together and share a vocabulary and working style.
3. Collaboration readiness. Success is more likely if the goals of the collaborators are aligned, and they all derive benefit from the collaboration.
4. Management, planning, and decision making. Success is more likely if there is strong leadership, a clear network of responsibility, and a democratic element to decision-‐making.
5. Technology readiness. Success is more likely if reliable collaboration technology is in place.
These factors can also be seen to be relevant to certain types of data-‐intensive research, thereby supporting the correlation between capability for this research and successful collaborations.
Collaboration within the discipline/sector
Lone researchers.
Departmental research groups.
Collaboration across research groups within or between organisations.
Discipline organised at a national level.
International collaboration and consortia.
Exemplars. Bioinformatics and neuroinformatics are dominated by small teams, with few large-‐scale contributors. Astronomy on the other hand is recognised as a discipline strongly characterised by being organised at an international scale. Eurographics is a European-‐wide association for professionals in computer graphics and related visual disciplines. A UK branch of Eurographics organises an annual UK meeting, which is in addition to the international conference organised by the parent organisation. UK Research Councils organise ‘sandpits’ and other forms of community networking to encourage consortial research bids. In Australia, it is common for groups of institutions to form collaborative research centres; the Australian Centre for Plant Functional Genomics, for example, is a collaboration between the Universities of Adelaide, Melbourne, South Australia and Queensland.
Commentary. This is collaboration that is characterised by working with others from the same discipline. Within departments, researchers organise themselves into research groups, often around a highly-‐specialised area that identifies them as experts. These groups often have a hierarchical structures that derive from institutional positions and experience. These small groups can support each other through meetings and internal seminars. Allied research groups can also find synergies and collaborate on research projects, either within their own institution or by joining up with others. A discipline can also organise itself by holding national meetings and discussions, and of course international collaborations manifest not only as large conferences but also as consortia which undertake a programme of work.

24
Researchers do work along the spectrum whilst undertaking research; researchers may start working along on an idea, expose it gradually and gain collaborators within their group, then gain more collaborators from the wider community as the research progresses from initial idea to published results and beyond.
Collaboration and interaction across disciplines
No collaboration with other disciplines.
Individual researchers occasionally collaborate outside their discipline.
Disciplines collaborate through joint conferences or publications.
Bilateral collaborations.
Formal collaboration between research groups from several different disciplines.
Exemplars The WELMEC centre based at the University of Leeds works in the areas of musculoskeletal and cardiovascular research. Their research is organised around a series of clinical ‘Innovation Challenges’ which are intended to have outcomes in the clinic within the lifetime of the project. The research centre is interdisciplinary encompassing work in the areas of biosensors, imaging and virtual pathology, biotribological interfaces, biological and biomimetic scaffolds, cell and matrix therapies, in-‐silico simulations and physiological simulations. The collaboration brings together over 200 researchers from various schools, faculties and institutes at Leeds: the Faculties of Engineering, Biological Sciences, Medicine and Health and Maths, the Institute of Medical and Biological Engineering, the NIHR Leeds Musculoskeletal Biomedical Research Unit, the Leeds Institute of Molecular Medicine, the Leeds Dental Institute, the School of Electrical and Electronic Engineering and the School of Computing. This collaboration can be characterised as being large and multi-‐disciplinary across several groups, formally organised within this separately funded centre.
Commentary. Different perspectives can be used to characterise the collaborations of researchers across disciplines. Firstly the extent to which collaboration is manifested by researchers – are there a few researchers who collaborate with other disciplines or is it the norm for the discipline? Secondly one can consider the frequency and regularity in which collaborations take place. Lastly, there are various forms of collaboration, some more formal than others. Collaborations could range from simple bilateral agreements between two groups to larger multi-‐discipline consortia framed by formal contracts. Conferences and meetings that attract practitioners from various disciplines can be considered a form of collaboration and interaction, and similarly journals with a broad reach across disciplines can help to identify new cross-‐disciplinary communities.
Collaboration and interaction across sectors
None Attempts have been made but are not considered successful.
Despite successful examples working with other sectors is not the norm – some barriers are perceived.
A discipline or group has gained experience of working closely with one or two sectors.
Work successfully with several other sectors on different problems
Exemplars The Alzheimer’s Disease Neuroimaging Initiative (ANDI)4 is an initiative that involves several partners chiefly in the US, with collaborators from Canada and other international
4 http://adni.loni.ucla.edu/

25
parties. The funding model is described as a public-‐private partnership with heavy involvement from the National Institutes of Health. Industry funding was also received from pharmaceutical companies and Foundations. Other associations taking part include the Food and Drug Administration (FDA), The initiative has an aim focussed on Alzheimer’s and defining the progression of the disease by collecting and validating data from patients and controls. Users of the data come from different sectors, with university researchers being the largest group to make requests. Other groups are pharmaceutical and biotechnology companies, scanner manufacturers, government scientists and high school teachers.
Another example is Sage Bionetworks, a not-‐for-‐profit organisation based in the US which offers the Washington Partners Program. Under the Program, biomedical teams collaborate on genomics analysis and drug development to help improve disease outcomes. In 2011 their partners from the Washington area included Amgen and Presage, biotechnology companies, and the Center for Tissue and Cell Sciences in Seattle’s Children’s hospital.
Commentary. Researchers from higher education institutions can form alliances with sectors such as public institutions and industry to collaborate on solving problems. The degree of success with which collaboration with sectors outside of higher education is achieved can vary. The drive to undertake cross-‐sector collaboration can come from a need to converge on a specific disease or problem. Sometimes this results in close collaboration between two closely allied sectors – for example, medicine, biotechnology or pharmacy research departments with hospitals and clinics – or with pharmaceutical companies. Other groups may gain experience of working successfully with several other sectors.
Collaboration with the public
No collaboration with the public.
The public’s involvement is limited to acting as subjects of study, user testing, etc.
Contact with the public is only through occasional appearance in the media e.g. news bulletins, TV programmes
Mainly informational, sometimes participative, targeted media programmes are organised to engage the public e.g. science fairs
Dedicated programmes involving the public in research; Crowd sourcing/citizen science
Exemplars. The Natural Ground report published by the Association of Medical Research Charities (AMRC) describes different ways in which patients are being involved by charities that fund medical research. Some charities have lay members on their steering groups helping to decide their research strategy. Others employ a parallel review process when considering funding grants, and the lay members on that panel comment on the practical implications of the research suggested for patients. These comments are considered alongside the peer-‐review results when funding decisions are made. The AMRC report quotes INVOLVE, a (UK) national advisory group funded by the National Institute for Health Research, which makes the distinction, ‘Many people define public involvement in research as doing research “with” or “by” the public, rather than “to”, “about” or “for” the public.’
GalaxyZoo is a project in Astronomy that epitomises success in collaborating with the public to solve a problem at a scale that requires human brain processing in large quantities. The project has developed a large community of contributors to help classify galaxies by examining photographs and categorising the characteristics of the phenomena captured by the photograph. They employed the Zooniverse platform and social media like blogs and

26
contributor forums to manage their interactions with the public. The lay members of the community become true collaborators with the scientists, with some contributions resulting in new discoveries and joint publications.
The UK funds a National Co-‐ordinating Centre for Public Engagement5 which specialises in advising on all aspects of public engagement for researchers and higher education institutions.
Commentary. Engaging with the public has become a responsibility for researchers and the institutions within which they work, as funders have expectations that researchers can show the impact of their research on the public and how they are meeting the needs of wider society. Different forms of engagement include consulting and informing as well as collaboration, employing different formats and media. The public can be involved at different stages of the research life cycle. Whilst enrolling patients in clinical trials is one example of how the public collaborates with researchers, a distinction is made between involving the public passively and giving them a more active voice or role.
4.2 Skills and training
The capability of a community to perform data-‐intensive research is strongly influenced by the individual capabilities of its members, and the capacity that results from the combination and multiplication of these capabilities. Community capability can therefore be enhanced by training members in the relevant skills. This training is most effective when it is fully embedded as part of the early education and continuing professional development of researchers.
Skill sets
Tools and technologies (cloud computing, visualisations, statistical analysis, simulations, modelling)
Data description and identification (metadata, vocabularies, citation)
Collaboration and communication (engaging with other researchers, the public, the media)
Policy and planning (data management, business models)
Exemplars. Tools exist to support many of the functions that are important in data-‐intensive research, so in practice a working knowledge of these tools goes a long way towards fulfilling the skill requirements of data-‐intensive research. In the area of data management planning, tools such as DMPOnline or DMPTool, CARDIO, DAF and DRAMBRORA are important to know. For statistical analysis tools, the most commonly used tools are R and SPSS.
Commentary. There are a wide range of skills associated with data-‐intensive research which cover policy and planning activities through to detailed data description and complex data analysis. Different core competencies will be required by different stakeholder groups, and at different skill levels (beginner, intermediate, expert) so they are not enumerated here, but it would be useful to identify them when the CCMF is applied in practice.
5 http://www.publicengagement.ac.uk

27
Pervasion of training
No training available.
Training programmes in development.
Training available but not embedded within u/g and p/g degree programmes. Patchy uptake. Little or no on-‐job coaching or mentoring on data management.
Training embedded within u/g and p/g degree programmes and available for researchers. Mentors usually provided on request.
Dedicated training, fully embedded in all u/g and p/g degree programmes, accredited with professional qualifications, and an established part of continuing professional development.
Exemplars: Training in relevant skills is available in UK EPSRC and ESRC Doctoral Training Centres, and in the form of the National eScience Institute, EBI and UKDA training programmes. Also in the UK, JISC has funded a series of projects setting up research data management training.
Commentary. There is much variation across disciplines, institutions and degree programmes. Some UK research funders have established Doctoral Training Centres to develop and deliver training programmes for their disciplinary communities. JISC has funded training materials which target particular disciplines e.g. psychology. At some institutions, the University of Bath among them, support services such as subject liaison librarians and IT services are beginning to develop a range of training programmes for researchers, covering topics such as data management planning. The UK Digital Curation Centre has delivered training modules on a regional basis as part of the Regional Roadshow Programme, while national data centres such as the ESDS (in the UK) and ICPSR (in the US) run workshops on data management.
4.3 Openness
Historically, scientific progress has been driven forward by the open communication of research methods and results. More generally, the principle of openness can be applied at different levels: from openness in communicating the plans for research and ongoing progress whilst the research is undertaken, to opening up the published literature to a wider audience. Driven by concerns for improving the validation, reproducibility and reusability of research, the last decade has also seen calls for opening up the data and other details of methodologies employed, alongside final results and conclusions, for scrutiny and re-‐use by the wider community, a process that is considered by some to add value to research.
Neelie Kroes, Vice President and European Commissioner responsible for the Digital Agenda, is quoted as saying, ‘We cannot afford for access to scientific knowledge to become a luxury, and the results of publicly funded research in particular should be spread as widely as possible.’ (ODE Project 2011)

28
Openness in the course of research
No sharing. No details released.
Selected details released, e.g. in a proposal or project plan.
Selected intermediate results are shared within a limited group.
Intermediate results are shared through traditional means, e.g. conference papers.
Sharing is done publicly on the web. Full details are disclosed.
Exemplars. Nature Precedings6 is part of the Nature Publishing Group’s stable of products and is dedicated to the sharing of new and preliminary findings. It accepts various communication forms such as pre-‐prints, presentations and posters. One of the collections within Nature Precedings relates to the Human Microbiome Project; this collection contains a series of ‘marker papers’ that describe a project’s purpose, experimental design and scope, its data quality policies, anticipated data analyses to be included in future publications, and its data release plan.
Commentary. This characteristic describes whether researchers choose to communicate information about their research whilst it is still ongoing, the extent to which they make their plans and intermediate results known, and the mechanisms they use to achieve openness. Such openness makes an informal variety of early peer review possible, which in the long term may result in more interoperable data and therefore more opportunities for data-‐intensive research.
Openness of published literature
No sharing of papers or metadata outside publication channels.
Authors share metadata for their publications.
Authors share theses or other selected sections from the literature.
Authors provide copies of their publications on request or other negotiated means.
Publications are made available on open access.
Exemplars. Pre-‐print servers have been set up and are well used in some disciplines, for example ArXiv in physics and mathematics, CogPrints and PsyDok in psychology, RePEc in Economics and Organic Eprints in organic agriculture. Many institutions also have an online repository for giving access to the published outputs (or the related metadata) of their researchers.
Commentary. The body of published literature can be available under different conditions – some literature is available only through payment agreements; sometimes only the description of the literature (metadata) is accessible, whilst at the other extreme some communities have embraced the practice of sharing of all the published literature through archives freely available to all. The openness or otherwise of a publication may depend on its type (journal paper, conference paper, thesis), or readers may need to make specific personal requests in order to gain access. Providing open access to published literature may make it easier for potential reusers to locate suitable data.
6 http://precedings.nature.com/

29
Openness of data
No sharing. No details released.
The data are described in the literature but not made available.
Data are available on request, after embargo or with other conditions.
Efforts are made to make data discoverable and re-‐usable as well as available.
Data is available in re-‐usable form and freely available to all. Community curation of the data may be possible.
Exemplars. O’Donoghue et al. (2010) note the unevenness of availability of biological data, with the two extremes exemplified by the PDB, which contains almost all experimentally determined structures contrasted with image data from high throughput experiments. For the latter there is poor data integration and ‘most of these data are never made publicly available’. Despite steps to start sharing such data (the Cell Centered Database, CCDB,7 is provided as an example) barriers still remain, including a lack of standardisation in organising and categorising data, and the difficulty of transferring large datasets over the network.
The ODE Project (2011) provides several narratives of instances of sharing, including the PANGAEA data publishing system for earth and environmental science, the UK Data Archive’s collection of digital social science and economic research data, and the collaboration between life sciences databases in the US, the UK and Japan, which exchange and synchronise their data daily. The culture of open access to data in molecular biology is contrasted with that in chemical information, where data is often proprietary and access is limited and costly.
Data is published as a matter of course in astronomy, proteomics and philology. The latter is an interesting case: it is a well-‐established discipline that saw the potential of digital data very early on. It has a long history of inter-‐domain standardisation, with many communities coming together to share their data, ultimately culminating in the Text Encoding Initiative.
Commentary. This characteristic describes the sharing of data that underlies research. This data can be available subject to certain conditions (e.g. registering with a database, agreeing to conditions of use). The data may be released as a matter of routine, or very rarely. Different amounts of effort go into making the data discoverable and re-‐usable by formatting it to a certain standard or complying with agreed data description requirements. In experiments with multi-‐stage workflows, only some stages of the data might be shared e.g. processed, structured data rather than the underlying raw data. Reference data sets are another form of partial data that can be shared.
The ODE Project (2011) describes different barriers to data sharing as perceived in the different communities that it surveyed. These ranged from lack of knowledge on how to share data, the need to restrict categories of data that are confidential or sensitive, sharing data not being high on the agenda because it does not assist with career advancement, or other rewards, national or regional competitiveness, ownership problems, and rapidly changing technology. The participants of the CCMDIR workshops echoed these concerns when discussing perceived barriers to data sharing:
• Legal or ethical constraints • Lack of technical infrastructure for sharing. • Lack of incentives, or the perception of disincentives
7 http://ccdb.ucsd.edu/

30
Other experiences of data sharing that were remarked on within the CCMDIR workshops were as follows.
• The Linked Open Data cloud diagram, with its five criteria to qualify for inclusion, has proved massively successful as a driver towards the publication of linked open data. It took just under a decade, though, to arrive at these criteria.
• In fields where the culture is to work in teams, and it is teams that are awarded grants, data sharing is often seen as necessary. It is through sharing data that researchers receive invitations to join teams.
• Crystallography has a tradition of data papers as a contribution, a tradition that has the potential to spread to other disciplines. In hydrology, whether data is free depends on the data collection process and who participates in collecting it. Where it is collected by public institutions the data will be free, but when collected by oil companies it will not be freely available.
Treloar (2011) presents a model of data openness with the following three domains.
1. Private research domain. Typically access is tightly controlled and restricted to a core team within a single institution. Technological platforms such as laboratory information management systems or research management systems are used.
2. Shared research domain. This is where some, but not all, the data is shared by the core team with other colleagues, often outside the home institution. Technological platforms such as wikis or Sharepoint may be used.
3. Public domain. Data is published so that (with a few exceptions) anyone can gain access to it. Institutional repositories may be used to provide this access. Typically the data will be given a persistent identifier, and the associated metadata will be fixed.
Openness of methodologies/workflows
No sharing No details released
Released within limited scope. Partial details released.
The details of the workflow are shared but not the underlying scripts; only partial stages of the workflow are shared.
Sharing publicly on the web. Non-‐standard scripts, tools and software released.
Exemplars MyExperiment is a service dedicated to the sharing of scientific workflows. One example of sharing workflows through MyExperiment is the investigation of sleeping sickness (Trypanosomiasis) in African cattle across a large team across different countries (including Scotland, Kenya and Australia). Different components of a workflow are captured to stitch together access to databases and analysis processes. The workflow is then shared on MyExperiment which also offers features to support formation of communities which can rate, tag and discover each other’s workflows.
OpenWetWare is an online community for biology and biological engineering researchers. One component of the site is a space for sharing protocols and experimental techniques. In chemistry, there are several examples of open notebook science, where records of entire experiments – both data and methods – are shared online in near real time: UsefulChem at Drexel University, ISIS BioLab LaBLogs at STFC, Bio Blogs at the University of Southampton.
Commentary. Releasing data alone may not be sufficient to replicate results and findings. Details of methodologies and workflows which allow other researchers to reproduce the workings and methods of other groups may be required. This characteristic describes the

31
practice of sharing information regarding the processes employed, either as descriptions or in executable forms, so that one researcher can apply the same methods either to the same dataset or perhaps to alternative data or applications.
Reuse of existing data
Only own data used.
Data exchanged within limited scope.
Regularly combine data sets in specific established ways. Provenance tracked in ad hoc ways.
Multiple existing datasets often combined. Provenance tracked systematically.
Exemplars. In recent years the number of papers published using archival data from the Hubble Space Telescope has exceeded the number of papers for which data was specially collected (see Figure 6).
Figure 6: Number of papers published using original (GO) or archival (AR) Hubble Space Telescope data over time (source: http://archive.stsci.edu/hst/bibliography/pubstat.html)
In the social sciences, the re-‐use of data is strongly encouraged. Census data and longitudinal studies are extensively shared and reused. Genome-‐wide association studies (GWAS) rely on collecting sufficient samples of DNA from the population to study genetic variants. Sage Bionetworks is building a community platform for biologists, to support access to shared data and applications through the platform. The data are derived from different sources and stored in different formats. Sources of data include public databases and donations from pharmaceutical companies and other groups. Figure 7 shows an overview of how these data are combined in analysis.
Commentary. This characteristic focuses on the attitudes and practices of using data sets generated by other researchers. Researchers may be open to regularly using data shared by others, but they may only trust specific sources. Data sets obtained from the community can be processed in different ways – data can be aggregated, re-‐analysed under the original conditions or mined to generate new insights.

32
Figure 7: A digital commons for community-‐based analysis (source: Mangravite, L., Sage Bionetworks Congress 2011, http://sagecongress.org/2011/Mangravite.pdf )
4.4 Technical infrastructure
The technical infrastructure that supports research comprises tools and services that are used at different the stages of the research life cycle. This capability factor describes categories of tools and services that meet user needs across various activities: computational tools and algorithms, data capture and processing, data storage, curation and preservation, data discovery and access, platforms for integration, collaboration and citizen science and visualisation and representation.
Within each of the tool categories in this capability factor, there are different models to describe the progression of tools. The Software Sustainability Institute’s Software Maturity Curve (see Section 3.4) offers the stages of exploration (custom tools and scripts), consolidation (on a single computing platform), and customisation (formalising the processes as modules for common tools). Other progressions that might be considered are moving from custom tools and scripts to many commercial offerings, then to a single commercial offering, then to an open source alternative.
Whilst the diversity of tools can be described in other ways, for example the types of packaging and release (is the software open?) participants in the CCMDIR workshops suggested that this should not be considered a measure of maturity. Neither should the degree of diversity in itself be taken as a measure. The measure they preferred was, ‘How well do the available tools help you to do research?’ One delegate suggested a three-‐point scale to make comparisons of capability: not adequate (software performing below requirements); adequate; above adequate (has features few people use, and is expected to meet users’ needs for the next few years). Delegates at a later workshop, though, felt that explicit use of these terms implied measurement against a ‘standard’ set of requirements rather than one relative to a community’s needs; they preferred the more verbose descriptions.
The participants at the CCMDIR workshops discussed the relationships between technical infrastructure, security concerns and institutional barriers to sharing data and processing power with collaborators. Processing power is often secured in clusters behind firewalls, and external-‐facing web servers are not set up to handle the level of processing power and bandwidth that would be required to share the data being processed inside the secure

33
clusters. Internal laboratories and external facing services that provide the interface with collaborators represent two different classes of power. Data is valuable but must be coupled with processing to exploit its value. If shipping of data is prohibitive due to its size, one pathway to sharing would be to enable access to the processing clusters to collaborators, though it is an open question whether there are business models that could support this type of collaboration. Another alternative might be providing clusters for web services. The balance of protecting internal processing power while managing external access would need to be studied, whilst the Return on Investment proposition would have to be worked out. One participant voiced the opinion, ‘For some of the potential users of my data their processing power limitations will prevent them.’
Computational tools and algorithms
None Tools exist but perform below requirements
Tools have sufficient features to meet the needs of most users.
Tools have features few people use, expected to meet users’ needs for the next few years
Exemplars: NESSTAR8 is a software system for the analysis of data online, owned by the Norwegian Social Science Data Services. It handles survey data and multidimensional tables as well as text data. VisTrails9 is a scientific workflow and provenance management system that provides support for data exploration and visualisation, developed in the US. R is a language for statistical computing and graphics, used in sectors like finance and bioinformatics.
Commentary. Computational tools and algorithms form the backbone of most data-‐intensive research workflows. If such tools underperform, it places a hard limit on what research can be conducted.
Tool support for data capture and processing
No tool support for data capture
Tools do not meet user requirements well or do not interoperate. Tools are custom and quality varies.
One or two good tools available. A few clear leaders
Most tools that support data capture do it well and meet user requirements
All tools support data capture well and interoperate. There is a good choice of tools for data processing
Exemplars. In neuroinformatics, many of the data formats are proprietary, with the effect of locking researchers into using the data capture products of a particular vendor.
Commentary. Tools that support data capture and processing often make assumptions about the formats in which the data is stored and processed. The extent to which the tools support formats that are more widely supported by other tools may determine whether data can be shared, understood, processed and re-‐used within the wider technical environment. When the tools support open or agreed formats or the interchange of data in different formats, tool interoperability increases.
8 http://www.nesstar.com/ 9 http://www.vistrails.org/

34
Data storage
None. Insufficient data storage available to meet user needs.
Although data storage capacity is sufficient, other requirements (e.g. security) are not met.
Dedicated storage facilities meet current requirements, but will be outgrown shortly.
Storage is available and is expected to meet future needs.
Exemplars. The University of Bristol has recently invested in a petabyte-‐scale research data storage facility called BluePeta, in order to support the large scale datasets being produced by some research groups.
Commentary. Data storage needs to grow as data volumes increase, but requirements may also be defined by the data type. Such requirements may involve issues of physical location, performance, access control and security, scalability, reliability, and speed as well as capacity. For example, in some communities the storage of clinical data must adhere to the ISO/IEC 27000 series of information security standards. Data storage can be organised locally, nationally or globally. Interactions with data storage are required by several of the other tool categories, such as data capture and processing tools, discovery services and curation and preservation services.
Support for curation and preservation
None Support is only available in specialised cases
Insufficient tools and facilities exist to meet needs.
Dedicated tools are available and are widely used
Common infrastructure is well funded and well used
Exemplars The UK has a well-‐established infrastructure for handling social science data (UKDA, ESDS). Earth observation science is highly advanced in terms of data archiving and preservation (as the observations are irreplicable) but not in terms of standard analyses, whereas particle physics is highly advanced in data sharing but has little interest in keeping/revisiting old data. In bioinformatics, the data is considered important, but the software used to process it is considered ephemeral.
Commentary. As the exemplars indicate, the relative importance of the tools that enhance contemporary usefulness of data and those that aid its long-‐term preservation varies between disciplines. For disciplines reliant on irreplicable observations, good preservation tools help maintain stocks of data for future data-‐intensive research.
Data discovery and access
None Discovery services very discipline-‐specific; require specialised knowledge or rights
Discovery opened to all but siloed (not interopeable)
Data discoverable and accessible to all, good integrated services
Exemplars. The Australian National Data Service provides a discovery service for research data held by Australian universities. As well as providing catalogue records for datasets in a search-‐engine-‐friendly format, Research Data Australia also holds records of researchers, research

35
organisations, research projects and data-‐related services.10 In the UK, the NERC Data Discovery Service provides a cross-‐search facility for data held in NERC’s data centres.11
Commentary. One barrier identified is cross-‐domain federation of catalogues produced by different communities e.g. critical zone observatories look at data across atmospheric, geology, hydrology, chemistry. Different types of catalogues do not integrate well and there is no standard way to publish them, and no easy way to federate them for cross-‐discovery. E.g. naming standards for chemicals, variables for water quality. One measure suggested is to see how far the community is from agreeing standards. Two different approaches in the above example are either reaching shared understanding across disciplines (this may be hard to achieve) or to adopt a cross-‐walk mechanism.
Integration and collaboration platforms
None. Platforms exist but perform below requirements.
Platforms have sufficient features to meet the needs of most users.
Platforms have features few people use, expected to meet users’ needs for the next few years.
Exemplars. Virtual Research Environments such as Sakai are entering common usage in universities. There are also some discipline-‐based collaboration environments in operation, such as NanoHub (serving nanoscience and nanotechnology). Meyer et al. (2012) report that astrophysicists studying gamma ray bursts use text messaging and email to rapidly alert each other to detection of new bursts, but social network sites do not feature in their professional communications.
Commentary. Integration and collaboration tools may help researchers manage their workflows and interactions more efficiently, increasing their capacity for data-‐intensive research.
Visualisations and representations
None. Tools exist but perform below requirements.
Tools have sufficient features to meet the needs of most users.
Tools have features few people use, expected to meet users’ needs for the next few years.
Exemplars. Microsoft’s WorldWide Telescope is a tool for visualising spatial data in context. It can overlay datasets on images of the night sky (in the case of astronomical data) or on a globe (for geospatial data). Microsoft’s ChronoZoom tool performs a similar visualisation function for timeline data, allowing one to browse, overlay and explore data from multiple sources at arbitrary magnifications.
Commentary. A special supplement to Nature Methods in March 2010 was dedicated to visualising biological data. The issue reviews the wide range of products required for visualisations in biology. The tools are employed throughout the research lifecycle from data collection through to communication of results. Tools vary in how specialised they are and in how they are intended to be used (stand-‐alone or integrated), making comparisons between tools difficult. Additionally, images are required to represent different granular levels of biological entities, from whole organs to atomic representations of proteins.
10 http://services.ands.org.au/home/orca/rda/ 11 http://data-‐search.nerc.ac.uk/

36
In their commentary, O’Donoghue et al. (2010) note the following trends in the development of biological visualisation tools:
• Despite improvements the tools are still not coping with the size of data that users would like to process and understand, and there is still room for better integration and usability.
• Improvements in accessibility of hardware and network resources have brought visualisation tools to a wider user base.
• There has been a proliferation of tools to meet diverse needs. • Tools have developed that allow the user to customise them to their specific needs (e.g.
VTK, Cytoscape) • The tools are better integrated with databases and data sources, with other analytical
tools and with infrastructures like the Web. • The improved integration is ascribed to the availability of organised and categorised data
in pooled sources such as the PDB. • Despite optimism that understanding and application of usability principles to biological
visualisation tools will continue improving, there is a perception that work on usability is not valued, slowing down progress in making tools more usable and easier to learn.
• Visual analytics, which helps developers understand how much of the visualisation process to automate, is being applied to biological visualisation tools. Innovative representations from outside of biology are also being applied in the search for new visual metaphors.
• Tools to operate on different scales of data and that are able to switch between levels of detail (e.g. cellular, protein structure, atomic detail) are an area of ongoing research.
• Other advances in biological visualisation software user interfaces are expected to come from agreements on standardised representations, display hardware that works on a larger scale (e.g. large devices or arrays), adding a third dimension to representations and augmented interaction through the addition of sound or touch feedback.
O’Donoghue et al. conclude by suggesting that ‘a standardised visualisation environment that allows seamless integration of biological data’ is desirable, but efforts to make this possible, such as collaborative efforts on data integration, are at a ‘pioneering stage’.
Platforms for citizen science
None Customised tools available, used by a small number of groups
Very flexible tools available and well used
Tools have been re-‐deployed to other disciplines.
Exemplars. Zooniverse began as the platform for GalaxyZoo but is now home to a suite of citizen science projects. RunCoCo first had success with Project Woruldhord but the software developed was then adopted to help build other community collections, such as The Great War Archive. Nature Locator is an application for mobile phones, and facilitates crowd sourced data collection and validation. TROVE, based at the National Library in Australia, invites participation from the public by tagging and contributing records to the collection.
Commentary. Citizen science platforms provide infrastructure that enables non-‐specialists to participate and collaborate in the research process. Whilst the platforms can be developed within a specific project they can then be redeployed to meet the need of other communities.
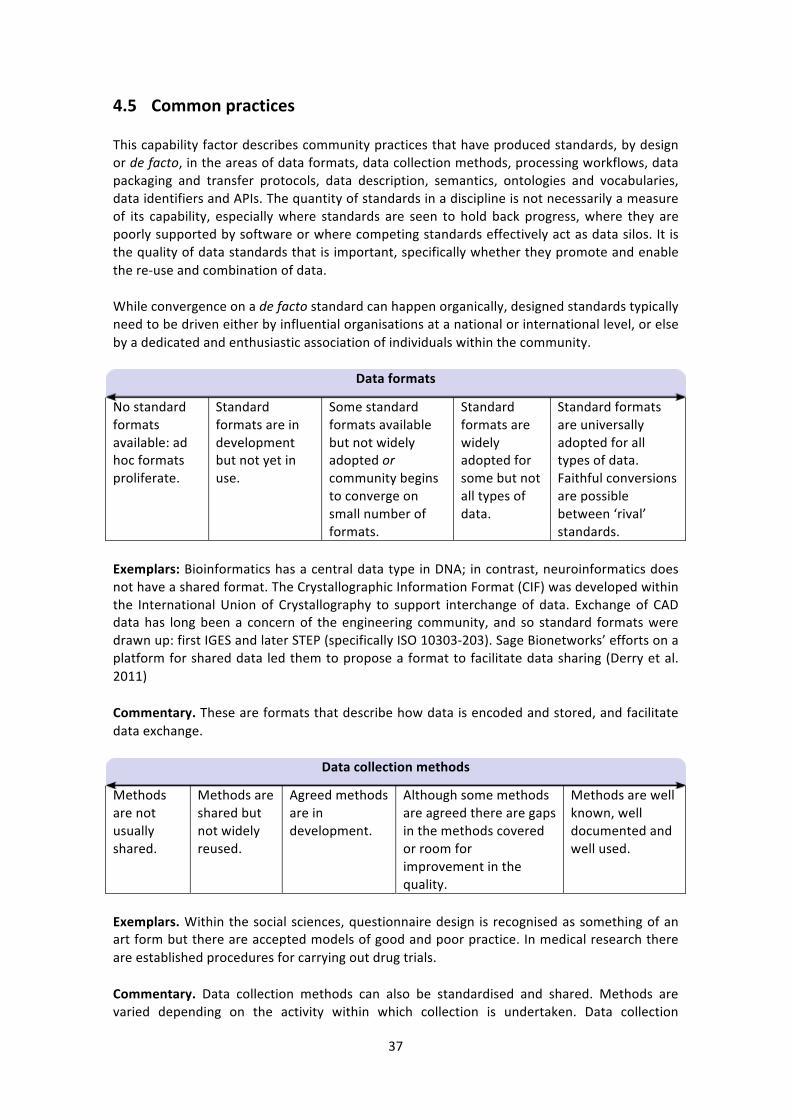
37
4.5 Common practices
This capability factor describes community practices that have produced standards, by design or de facto, in the areas of data formats, data collection methods, processing workflows, data packaging and transfer protocols, data description, semantics, ontologies and vocabularies, data identifiers and APIs. The quantity of standards in a discipline is not necessarily a measure of its capability, especially where standards are seen to hold back progress, where they are poorly supported by software or where competing standards effectively act as data silos. It is the quality of data standards that is important, specifically whether they promote and enable the re-‐use and combination of data.
While convergence on a de facto standard can happen organically, designed standards typically need to be driven either by influential organisations at a national or international level, or else by a dedicated and enthusiastic association of individuals within the community.
Data formats
No standard formats available: ad hoc formats proliferate.
Standard formats are in development but not yet in use.
Some standard formats available but not widely adopted or community begins to converge on small number of formats.
Standard formats are widely adopted for some but not all types of data.
Standard formats are universally adopted for all types of data. Faithful conversions are possible between ‘rival’ standards.
Exemplars: Bioinformatics has a central data type in DNA; in contrast, neuroinformatics does not have a shared format. The Crystallographic Information Format (CIF) was developed within the International Union of Crystallography to support interchange of data. Exchange of CAD data has long been a concern of the engineering community, and so standard formats were drawn up: first IGES and later STEP (specifically ISO 10303-‐203). Sage Bionetworks’ efforts on a platform for shared data led them to propose a format to facilitate data sharing (Derry et al. 2011)
Commentary. These are formats that describe how data is encoded and stored, and facilitate data exchange.
Data collection methods
Methods are not usually shared.
Methods are shared but not widely reused.
Agreed methods are in development.
Although some methods are agreed there are gaps in the methods covered or room for improvement in the quality.
Methods are well known, well documented and well used.
Exemplars. Within the social sciences, questionnaire design is recognised as something of an art form but there are accepted models of good and poor practice. In medical research there are established procedures for carrying out drug trials.
Commentary. Data collection methods can also be standardised and shared. Methods are varied depending on the activity within which collection is undertaken. Data collection
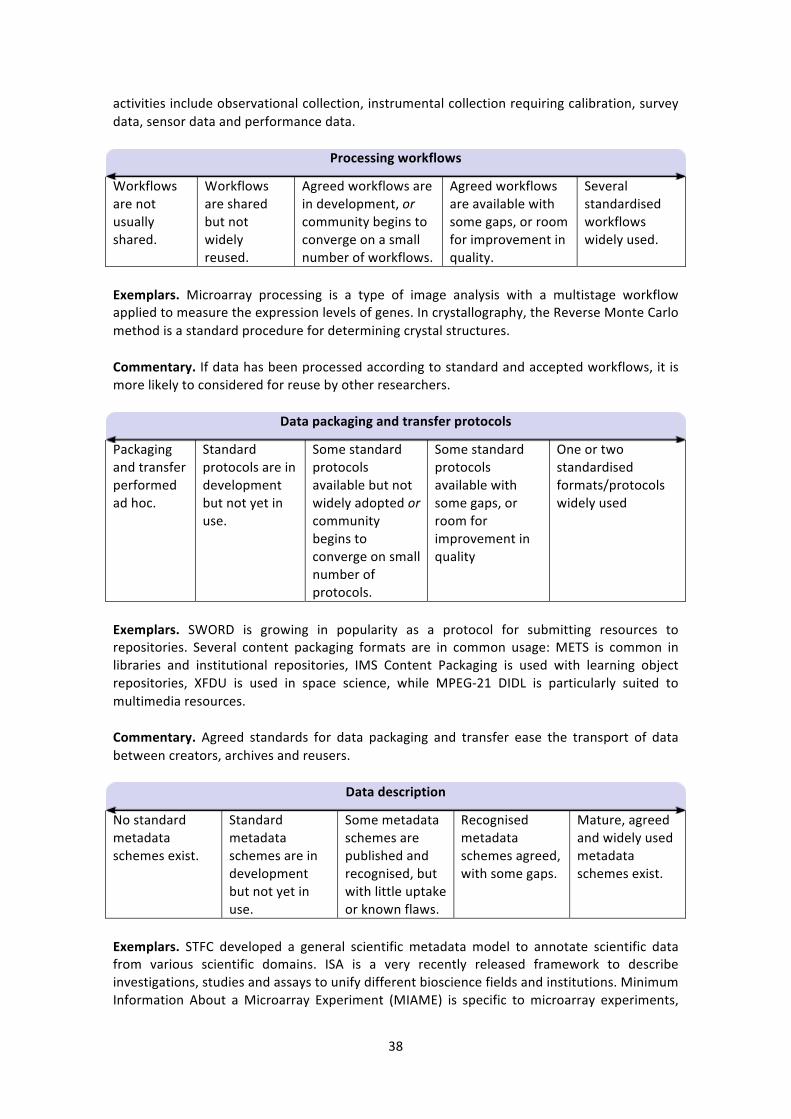
38
activities include observational collection, instrumental collection requiring calibration, survey data, sensor data and performance data.
Processing workflows
Workflows are not usually shared.
Workflows are shared but not widely reused.
Agreed workflows are in development, or community begins to converge on a small number of workflows.
Agreed workflows are available with some gaps, or room for improvement in quality.
Several standardised workflows widely used.
Exemplars. Microarray processing is a type of image analysis with a multistage workflow applied to measure the expression levels of genes. In crystallography, the Reverse Monte Carlo method is a standard procedure for determining crystal structures.
Commentary. If data has been processed according to standard and accepted workflows, it is more likely to considered for reuse by other researchers.
Data packaging and transfer protocols
Packaging and transfer performed ad hoc.
Standard protocols are in development but not yet in use.
Some standard protocols available but not widely adopted or community begins to converge on small number of protocols.
Some standard protocols available with some gaps, or room for improvement in quality
One or two standardised formats/protocols widely used
Exemplars. SWORD is growing in popularity as a protocol for submitting resources to repositories. Several content packaging formats are in common usage: METS is common in libraries and institutional repositories, IMS Content Packaging is used with learning object repositories, XFDU is used in space science, while MPEG-‐21 DIDL is particularly suited to multimedia resources.
Commentary. Agreed standards for data packaging and transfer ease the transport of data between creators, archives and reusers.
Data description
No standard metadata schemes exist.
Standard metadata schemes are in development but not yet in use.
Some metadata schemes are published and recognised, but with little uptake or known flaws.
Recognised metadata schemes agreed, with some gaps.
Mature, agreed and widely used metadata schemes exist.
Exemplars. STFC developed a general scientific metadata model to annotate scientific data from various scientific domains. ISA is a very recently released framework to describe investigations, studies and assays to unify different bioscience fields and institutions. Minimum Information About a Microarray Experiment (MIAME) is specific to microarray experiments,
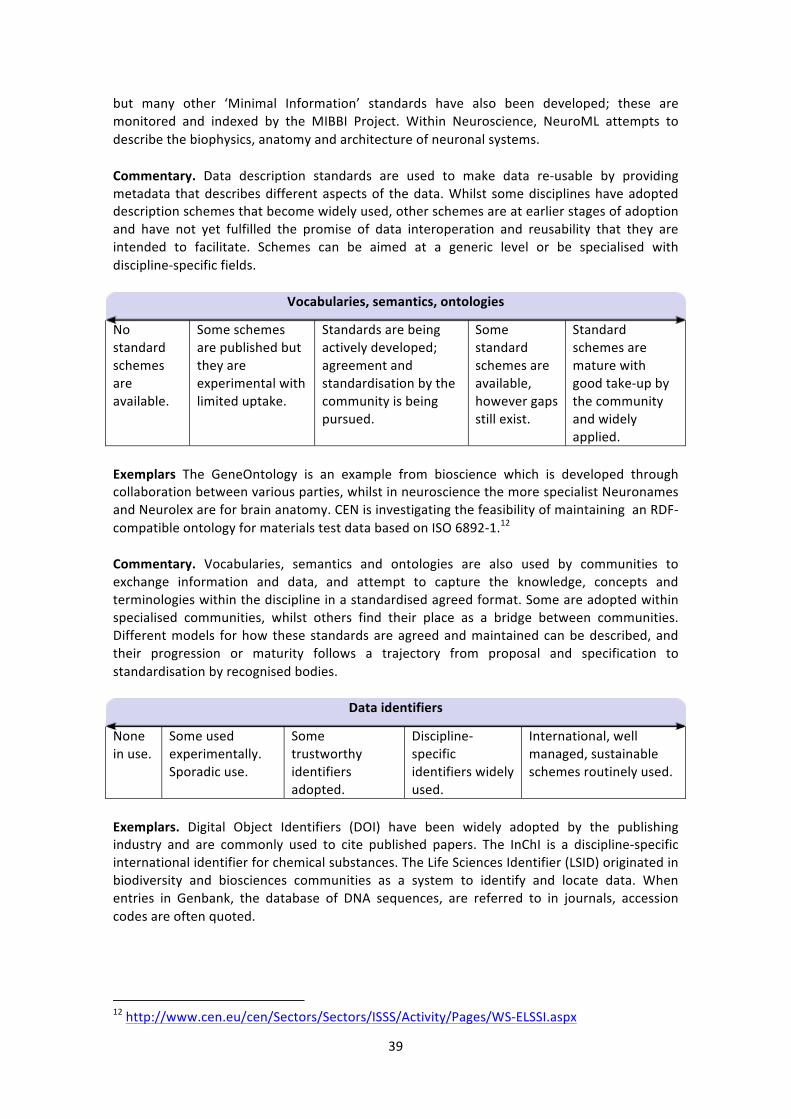
39
but many other ‘Minimal Information’ standards have also been developed; these are monitored and indexed by the MIBBI Project. Within Neuroscience, NeuroML attempts to describe the biophysics, anatomy and architecture of neuronal systems.
Commentary. Data description standards are used to make data re-‐usable by providing metadata that describes different aspects of the data. Whilst some disciplines have adopted description schemes that become widely used, other schemes are at earlier stages of adoption and have not yet fulfilled the promise of data interoperation and reusability that they are intended to facilitate. Schemes can be aimed at a generic level or be specialised with discipline-‐specific fields.
Vocabularies, semantics, ontologies
No standard schemes are available.
Some schemes are published but they are experimental with limited uptake.
Standards are being actively developed; agreement and standardisation by the community is being pursued.
Some standard schemes are available, however gaps still exist.
Standard schemes are mature with good take-‐up by the community and widely applied.
Exemplars The GeneOntology is an example from bioscience which is developed through collaboration between various parties, whilst in neuroscience the more specialist Neuronames and Neurolex are for brain anatomy. CEN is investigating the feasibility of maintaining an RDF-‐compatible ontology for materials test data based on ISO 6892-‐1.12
Commentary. Vocabularies, semantics and ontologies are also used by communities to exchange information and data, and attempt to capture the knowledge, concepts and terminologies within the discipline in a standardised agreed format. Some are adopted within specialised communities, whilst others find their place as a bridge between communities. Different models for how these standards are agreed and maintained can be described, and their progression or maturity follows a trajectory from proposal and specification to standardisation by recognised bodies.
Data identifiers
None in use.
Some used experimentally. Sporadic use.
Some trustworthy identifiers adopted.
Discipline-‐specific identifiers widely used.
International, well managed, sustainable schemes routinely used.
Exemplars. Digital Object Identifiers (DOI) have been widely adopted by the publishing industry and are commonly used to cite published papers. The InChI is a discipline-‐specific international identifier for chemical substances. The Life Sciences Identifier (LSID) originated in biodiversity and biosciences communities as a system to identify and locate data. When entries in Genbank, the database of DNA sequences, are referred to in journals, accession codes are often quoted.
12 http://www.cen.eu/cen/Sectors/Sectors/ISSS/Activity/Pages/WS-‐ELSSI.aspx

40
Commentary. Data identifiers are developed to provide unique and unambiguous methods to refer to or access research objects. They may serve the purposes of identification and location. The objects may be literature, chemical or biological entities, or entries in databases.
Stable, documented APIs
APIs not generally published or used.
Some tools offer APIs but with insufficient documentation.
A handful of well recognised APIs but these are the exception rather than the norm.
Most key disciplinary tools and services have useful, stable, and documented APIs.
Culture of developing APIs widespread.
Exemplars. APIs have been published for data repositories such as ChemSpider, the Earth Observing System, data.nasa.gov, and the Virtual Solar Observatory, and for services such as RNAfold, RNAforester, RNAhybrid, RNAshapes, and BiologicalNetworks.13
Commentary. Where data repositories and data processing services provide APIs, it opens up the possibilities for automated workflows and thereby increases the scale at which research can be performed.
4.6 Economic and business models
Moving into data-‐intensive research requires some degree of investment, and it is therefore important to consider how this might be funded and the business case for making the move. Disciplinary differences are important here: the business case will be easier to make where it is important to publish quickly and generate many research papers from a single investment, and harder where the emphasis is on careful and considered weighing of evidence.
The following six dimensions are used to characterise the funding model for research and infrastructure within a community. The dimensions are inter-‐dependent: for example, investments on an international scale are likely to be larger and more sustained. As such, all six dimensions should be considered together.
Sustainability of funding for research
Funding focused on short-‐term projects and quick returns.
Single-‐phase thematic investments on a 3-‐5 year timescale.
Multi-‐phase thematic investments in 5-‐10 year blocks which build a community.
Geographic scale of funding for research
Projects funded internally or through grants from regional agencies.
Projects funded by national funders.
Funding by international bodies and bi-‐lateral initiatives between national funders.
13 http://www.programmableweb.com/apis/directory/1?apicat=Science

41
Size of funding for research
Small-‐scale projects (e.g. to exploit open innovation methodologies for bio-‐informatics tool development).
Mid-‐scale projects (e.g. digitisation and analysis of large textual corpora).
Major investment (e.g. in longitudinal data surveys).
Sustainability of funding for infrastructure
One-‐off investments with no commitment to sustainment.
Infrastructure projects allowed slow transition to self-‐financing model.
Sustained multi-‐decade investments in data centres and services.
Geographic scale of funding for infrastructure
Investments by a single funding body at regional or national level.
Collaborative development at the national level by multiple funders.
Collaborative development between international funders.
Size of funding for infrastructure
Small-‐scale tool development.
Co-‐ordinated investments in distributed systems.
Large central investments in network infrastructure or tools.
Exemplars. The UK eScience Programme, which was funded by EPSRC and completed in 2011, successfully brought together a diverse community of researchers, developers and support staff across a wide group of domains, building core infrastructure, tools and applications. The NSF DataNet Programme includes a group of major 5-‐10 year horizon projects such as DataONE, which is focused on diverse environmental data. The UK Digital Curation Centre has been funded in a series of three-‐year phases (from 2004 to date) and provides a suite of advisory services, tools and training to UK higher education institutions. The International Virtual Observatory and Large Hadron Collider are long-‐term trans-‐national thematic initiatives. Elixir as a multi-‐national, multi-‐funder infrastructure project. UK BioBank is a national initiative with funders from different sectors. In 2011, state-‐level eResearch service providers formed a collaboration called the Australian eResearch Organisation (AeRO) to provide a coherent, nationwide eResearch infrastructure and services programme.
Commentary. There are many thematic perspectives to consider here including scholarly communication and data publishing models, approaches to data curation and preservation, network-‐level infrastructure, through to capacity-‐building programmes. The established political and funding landscape in a particular geographical area is strongly influential in determining the business models in place. In order to realise the full potential global scale of data-‐intensive research, politico-‐legal issues and barriers linked to trans-‐national borders, will need to be overcome.
The degree of centralisation or devolution is key in considering funding models. Patterns of funding flow need to be considered: funding that does not flow centrally but is distributed across several PIs, does not fit well with a business model where resources are centralised. Conversely, if data storage needs to be localised because the data volumes are too big to transfer, this runs counter to a centralised model of funding. Business plans are important to calculate return on investment, for example in relation to HPC.

42
Public–private partnerships
None. Informal collaboration with industry but no funding involved.
Corporate / SME are non-‐funded partners in proposals with academia.
Research is co-‐funded by industry and other sources.
Established formal co-‐investment partnerships running long-‐term multi-‐phase projects.
Exemplars. UK BioBank, the White Rose Grid eScience Centre and the VISTA/Mapping the Underground project are all examples of initiatives with joint public and private funding.
Commentary. In communities where it is common for research to be partially or wholly funded by the private sector, the diversity of funding streams may make the research more sustainable, and the research may have greater impact outside academia. At the same time, the research may be contingent on business models and return on investment, and it is less likely that data will be made available for reuse.
Productivity and return on investment
Long lead times between project start and submission of outputs (e.g. 6 years), and between acceptance and publication of papers (e.g. 2 years). Funders expect projects to publish a small number of papers each with high long-‐term impact.
Mid-‐range lead times between project start and submission of outputs (e.g. 3 years), and between acceptance and publication of papers (e.g. 1 year). Funders expect projects to publish a moderate number of papers in high-‐impact journals.
Short lead times between project start and submission of outputs (e.g. 18 months), and between acceptance and publication of papers (e.g. 3 months). Funders expect projects to publish a large number of both high quality papers and progress reports.
Exemplars. We would place disciplines such as art history and classics at the slow-‐cycle extreme of this dimension. At the other extreme, we would expect to see disciplines with a strong emphasis on publication priority, such as high energy physics and genomics. Occupying the middle ground would be disciplines such as psychology and engineering informatics.
Commentary. The impact that this characteristic has on community capability is relatively weak but it is still important to recognise. While the metric is couched in terms of timescales and publishing patterns, the underlying feature we are interested in is the character of the research. The rapid-‐cycle end of the dimension is the natural home for disciplines where the interest is in finding new things: new particles, new molecules, new sequences. The slow-‐cycle end of the dimension is the natural home for disciplines where the interest is in profound insight, and improved understanding of complex issues. Disciplines where the focus is on proving or understanding a particular relationship fall somewhere in the middle. Data-‐intensive research methods can assist in all these areas of enquiry, but the immediacy of their impact varies. At the rapid-‐cycle end, it is relatively straightforward to decide which patterns to look for in data, and relatively obvious when an interesting result has been found; in such cases an investment in the means of data-‐intensive research has a quick pay-‐off. At the slow-‐cycle end, it is typically harder to assemble a comprehensive dataset to analyse, and the analytical steps to automate may themselves require debate and justification; in such cases, greater preparation is needed before data-‐intensive research methods are applied, and once they are it may take some time to reap the benefits.
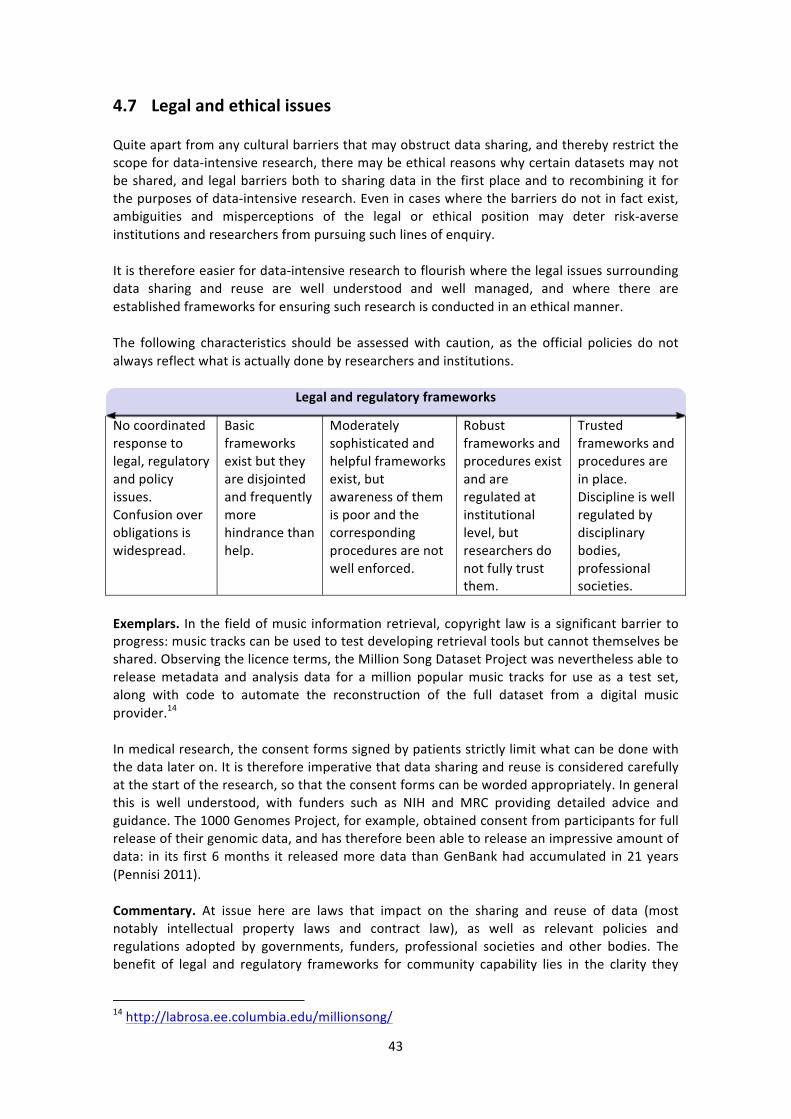
43
4.7 Legal and ethical issues
Quite apart from any cultural barriers that may obstruct data sharing, and thereby restrict the scope for data-‐intensive research, there may be ethical reasons why certain datasets may not be shared, and legal barriers both to sharing data in the first place and to recombining it for the purposes of data-‐intensive research. Even in cases where the barriers do not in fact exist, ambiguities and misperceptions of the legal or ethical position may deter risk-‐averse institutions and researchers from pursuing such lines of enquiry.
It is therefore easier for data-‐intensive research to flourish where the legal issues surrounding data sharing and reuse are well understood and well managed, and where there are established frameworks for ensuring such research is conducted in an ethical manner.
The following characteristics should be assessed with caution, as the official policies do not always reflect what is actually done by researchers and institutions.
Legal and regulatory frameworks
No coordinated response to legal, regulatory and policy issues. Confusion over obligations is widespread.
Basic frameworks exist but they are disjointed and frequently more hindrance than help.
Moderately sophisticated and helpful frameworks exist, but awareness of them is poor and the corresponding procedures are not well enforced.
Robust frameworks and procedures exist and are regulated at institutional level, but researchers do not fully trust them.
Trusted frameworks and procedures are in place. Discipline is well regulated by disciplinary bodies, professional societies.
Exemplars. In the field of music information retrieval, copyright law is a significant barrier to progress: music tracks can be used to test developing retrieval tools but cannot themselves be shared. Observing the licence terms, the Million Song Dataset Project was nevertheless able to release metadata and analysis data for a million popular music tracks for use as a test set, along with code to automate the reconstruction of the full dataset from a digital music provider.14
In medical research, the consent forms signed by patients strictly limit what can be done with the data later on. It is therefore imperative that data sharing and reuse is considered carefully at the start of the research, so that the consent forms can be worded appropriately. In general this is well understood, with funders such as NIH and MRC providing detailed advice and guidance. The 1000 Genomes Project, for example, obtained consent from participants for full release of their genomic data, and has therefore been able to release an impressive amount of data: in its first 6 months it released more data than GenBank had accumulated in 21 years (Pennisi 2011).
Commentary. At issue here are laws that impact on the sharing and reuse of data (most notably intellectual property laws and contract law), as well as relevant policies and regulations adopted by governments, funders, professional societies and other bodies. The benefit of legal and regulatory frameworks for community capability lies in the clarity they
14 http://labrosa.ee.columbia.edu/millionsong/
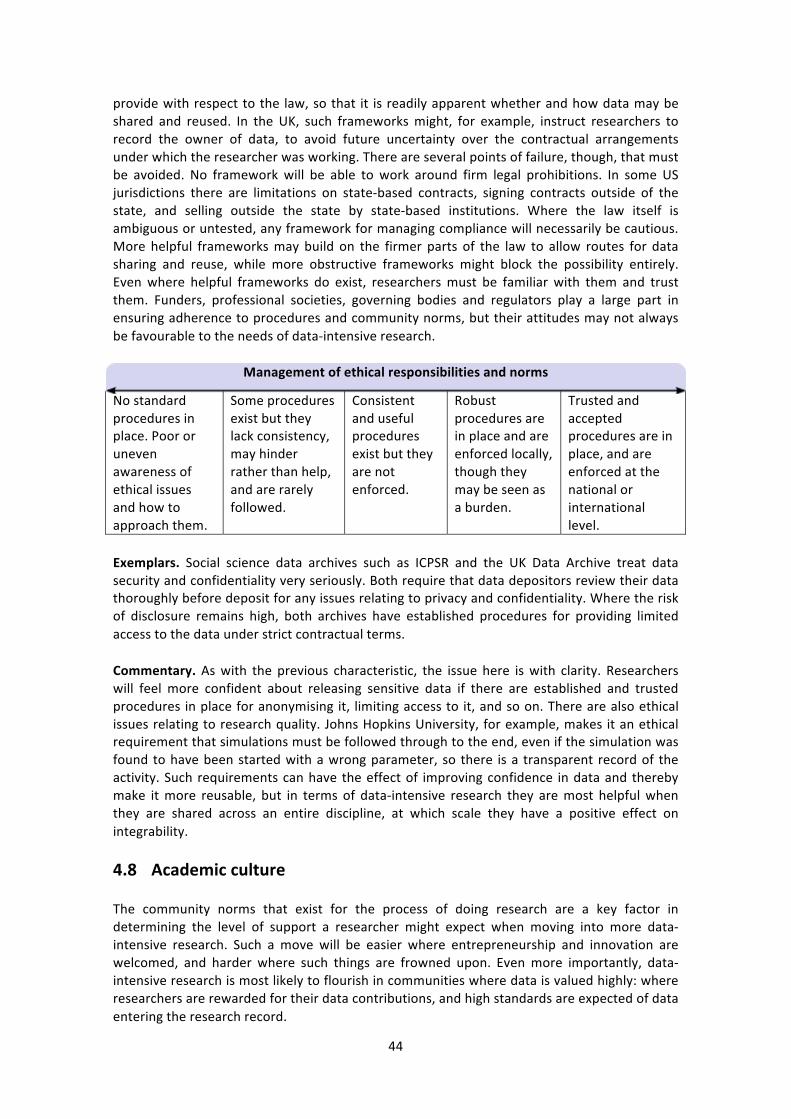
44
provide with respect to the law, so that it is readily apparent whether and how data may be shared and reused. In the UK, such frameworks might, for example, instruct researchers to record the owner of data, to avoid future uncertainty over the contractual arrangements under which the researcher was working. There are several points of failure, though, that must be avoided. No framework will be able to work around firm legal prohibitions. In some US jurisdictions there are limitations on state-‐based contracts, signing contracts outside of the state, and selling outside the state by state-‐based institutions. Where the law itself is ambiguous or untested, any framework for managing compliance will necessarily be cautious. More helpful frameworks may build on the firmer parts of the law to allow routes for data sharing and reuse, while more obstructive frameworks might block the possibility entirely. Even where helpful frameworks do exist, researchers must be familiar with them and trust them. Funders, professional societies, governing bodies and regulators play a large part in ensuring adherence to procedures and community norms, but their attitudes may not always be favourable to the needs of data-‐intensive research.
Management of ethical responsibilities and norms
No standard procedures in place. Poor or uneven awareness of ethical issues and how to approach them.
Some procedures exist but they lack consistency, may hinder rather than help, and are rarely followed.
Consistent and useful procedures exist but they are not enforced.
Robust procedures are in place and are enforced locally, though they may be seen as a burden.
Trusted and accepted procedures are in place, and are enforced at the national or international level.
Exemplars. Social science data archives such as ICPSR and the UK Data Archive treat data security and confidentiality very seriously. Both require that data depositors review their data thoroughly before deposit for any issues relating to privacy and confidentiality. Where the risk of disclosure remains high, both archives have established procedures for providing limited access to the data under strict contractual terms.
Commentary. As with the previous characteristic, the issue here is with clarity. Researchers will feel more confident about releasing sensitive data if there are established and trusted procedures in place for anonymising it, limiting access to it, and so on. There are also ethical issues relating to research quality. Johns Hopkins University, for example, makes it an ethical requirement that simulations must be followed through to the end, even if the simulation was found to have been started with a wrong parameter, so there is a transparent record of the activity. Such requirements can have the effect of improving confidence in data and thereby make it more reusable, but in terms of data-‐intensive research they are most helpful when they are shared across an entire discipline, at which scale they have a positive effect on integrability.
4.8 Academic culture
The community norms that exist for the process of doing research are a key factor in determining the level of support a researcher might expect when moving into more data-‐intensive research. Such a move will be easier where entrepreneurship and innovation are welcomed, and harder where such things are frowned upon. Even more importantly, data-‐intensive research is most likely to flourish in communities where data is valued highly: where researchers are rewarded for their data contributions, and high standards are expected of data entering the research record.

45
Entrepreneurship, innovation and risk
Highly risk-‐averse
Moderately risk averse
Calculated risks taken
Moderately innovative and experimental
Highly innovative and experimental
Exemplars. Biotechnology and medical technology are two areas where innovation is encouraged. Since 2005, the NIH has funded research into nanomedicine: highly innovative molecular-‐level medical interventions, although at this early stage the emphasis is on understanding the physical and chemical properties of biological structures at the nanoscale. In the UK, it is common for academic research in areas such as biotechnology to be spun out into commercial companies. For example, the companies Clarinnis Bio, Creative Gene Technology and ReInnervate all grew out of research at Durham University.
Commentary. The move to a new paradigm of research requires a certain degree of investment, in both time and effort, and there is always a risk that it may not produce interesting results, or that peer reviewers may not accept the new methodology. There is therefore risk to both the PI and the funder when it comes to funding such research. In disciplines where risk-‐taking and innovation are seen in a positive light, this is less of a barrier.
Reward models for researchers
None Narrow range of contributions recognised.
Wider range of contributions recognised, but informally.
Measures exist for more than one type of contribution and are well recognised.
All contributions are recognised and rewarded, through established procedures and measures.
Exemplars. O’Donoghue et al. (2010) suggest that improvements in the usability of visualisation software for biology are slowed down because work in usability is not well rewarded compared to the rewards for doing ‘new research’. Anecdotal reports that promotion committees are starting to consider the data contributions made in the social sciences have been made.
Commentary. Contributions to data intensive research are made in different ways. Not all these contributions are formally recognised when considering rewards for researchers. Rewards can come in many forms including career advancement, recognition by peers and funding, both for research and for training students and junior researchers. Methods for measuring contributions are also varied, with some measures for example publications being well established. Even within publications, however, there are different ways of recording contribution. Multi-‐author efforts can credit each contributor. Other categories of contribution encompass software products and sharing of analysed data, such as DNA sequences. Some contributions such as efforts to curate data and make it reusable are notorious for being poorly recognised and rewarded.

46
Quality and validation frameworks
Lightweight self-‐review of data. Results not reproducible.
Lightweight review of data by colleagues.
Partial peer review (whether data matches description, whether column headings make sense)
Thorough peer review (for integrity, appropriateness, reproducibility)
Data thoroughly reviewed and curated by specialists. Results are reproducible.
Exemplars. There is a movement within computational science to establish reproducibility as the gold standard of quality, mirroring the standards of proof in theoretical work and peer review of experimental/observational procedure in empirical work (Yale Law School Roundtable on Data and Code Sharing 2010; Peng 2011).
Commentary. Even if data is shared, it may not be in a state amenable to reuse, let alone full validation. Unless data is sufficient quality, and provably so, it is of limited use in data-‐intensive research conducted by other researchers. A community’s capability for such research, therefore, is increased where data is available that has been through thorough independent quality checks, and where this data is maintained and integrated with similar data by specialist curators.
5 Next steps
Information has been combined from a range of sources – including the mini-‐case studies, the four consultation workshops, the literature review, material from colleagues, advice from steering group members and various discussion sessions – to inform the proposed CCMF Project Phase 2.
The scope of the CCMF is broad. The visualisation has proved helpful in encapsulating the concepts and providing an indication of the lightweight approach to ‘metrics’ illustrated by our use of the terms ‘dimensions’ and ‘modes’. The content scope of the CCMF should include collaboration, openness, standards, technical infrastructure, common practices, economic and business aspects, academic issues, legal and ethical issues, skills and training, each presented as either a dimension with development positions or stages, or as a mode, with variations or flavours.
There has been a clear steer from the three stakeholder groups interviewed for the mini case studies, that a Community Capability Model Framework is perceived as a valuable and timely resource to inform both strategic planning and practical research endeavours. In particular we have received community input that the CCMF for data-‐intensive research should have the following functionality. It should
• inform strategic planning approaches and advise on investment directions; • show the direction of travel in various communities to make the case for support more
accessible; • provide criteria to make the business case for investment; • provide resources to inform decision-‐making; • provide guidance on important legal and ethical issues; • provide a ‘discussion starter’ or checklist approach with templates to provide prompts and
to stimulate thinking;

47
• provide a through-‐life plan for storage and HPC; • provide a through-‐life plan for a dataset to inform a data storage policy; • have a predictor capability, perhaps taking data from institutional REF submissions as
indicators of potential data requirements in the future; • have an ability to model different scenarios with a ‘slider’ for different situations; • address through-‐life planning, and take one through the stages of concept, design,
inception, and delivery but also inform mid-‐activity decisions; • be flow-‐chart based; • be multi-‐level and multi-‐phase/time-‐based; • deal with legacy data and activities; • be validated against datasets from three or four types of data, and against different user
communities and policy perspectives; • help to create a common language; • be a Web-‐based tool surrounded by a support environment.
6 Conclusions
The Community Capability Model Framework is a tool for evaluating a community’s current readiness to perform data-‐intensive research, and for identifying areas where a change could be made to increase capability. It consists of eight capability factors dealing with human, technical and environmental issues; within each factor, the CCMF identifies characteristics that can be used to judge community capability.
While the CCMF has been developed with the involvement of a wide range of stakeholders and interested parties, the immediate next step will be to validate it by applying the framework to a number of research communities. In the longer term we hope to develop tailored versions of the framework for different stakeholders, and to improve the usefulness of the tool as an aid to decision making and planning.
7 References
Agre, P. (1998), ‘Designing Genres for New Media: Social, Economic, and Political Contexts’, in S. G. Jones (ed.), Cybersociety 2.0: Revisiting Computer-‐Mediated Community and Technology (Thousand Oaks, CA: SAGE), 69–99.
Australian National Data Service (2011), ‘Research Data Management Framework: Capability Maturity Guide’, ANDS Guides, http://ands.org.au/guides/dmframework/dmf-‐capability-‐maturity-‐guide.html
Bate, R., Kuhn, D., Wells, C., et al. (1995), A Systems Engineering Capability Maturity Model, version 1.1, maturity model CMU/SEI-‐95-‐MM-‐003 (Pittsburgh, PA: Carnegie Mellon University) http://www.sei.cmu.edu/reports/95mm003.pdf
Bergman, M., King, J. L., and Lyytinen, K. (2002), ‘Large-‐Scale Requirements Analysis Revisited: The Need for Understanding the Political Ecology of Requirements Engineering’, Requirements Engineering, 7: 152–71, http://dx.doi.org/10.1007/s007660200011
Buckholtz, N. (2011), ‘The Alzheimer’s Disease Neuroimaging Initiative’, The Fourth Paradigm [blog], 10 June, http://blogs.nature.com/fourthparadigm/2011/06/10/the-‐alzheimers-‐disease-‐neuroimaging-‐initiative

48
Chue Hong, N. (2010), ‘Software Sustainability in e-‐Research: Dying for a Change?’, paper presented at e-‐Research Australasia, Gold Coast, Queensland, 8–12 November, https://ocs.arcs.org.au/index.php/eraust/2010/paper/view/141
Crowston, K., and Qin, J. (2010), ‘A Capability Maturity Model for Scientific Data Management: Evidence from the Literature’, Proceedings of the American Society for Information Science and Technology, 48, http://dx.doi.org/10.1002/meet.2011.14504801036
Derry, J., Mangravite, L., Suver, C., et al. (2011), ‘Developing Predictive Molecular Maps of Human Disease through Community-‐based Modeling’, Nature Precedings, http://dx.doi.org/10.1038/npre.2011.5883.1
Gray, J. (2009), ‘Jim Gray on eScience: A Transformed Scientific Method’, ed. T. Hey, S. Tansley, and K. Tolle, in Hey et al. (2009: pp. xix–xxxiii).
Happe, R. (2009), ‘The Community Maturity Model’, The Community Roundtable Blog, http://community-‐roundtable.com/2009/06/the-‐community-‐maturity-‐model/
Hey, T., Tansley, S., and Tolle, K. (2009) (eds.), The Fourth Paradigm (Redmond, WA: Microsoft Research) http://research.microsoft.com/en-‐us/collaboration/fourthparadigm/
Kenney, A. R., and McGovern, N. Y. (2003), ‘The Five Organisational Stages of Digital Preservation’, in P. Hodges, M. Sandler, M. Bonn, and J. P. Wilkin (eds.), Digital Libraries: A Vision for the 21st Century. A Festschrift in Honor of Wendy Lougee on the Occasion of Her Departure from the University of Michigan (Ann Arbor: University of Michigan Scholarly Publishing Office) http://hdl.handle.net/2027/spo.bbv9812.0001.001
Kenney, A. R., and McGovern, N. Y. (2005), ‘The Three-‐Legged Stool: Institutional Response to Digital Preservation’, paper presented at the 2nd Convocatoria del Coloquio de marzo, Cuba, March, http://www.library.cornell.edu/iris/dpo/docs/Cuba-‐ark-‐nym_final.ppt
Kolata, G. (2010), ‘Sharing of Data Leads to Progress on Alzheimer’s’, The New York Times, 12 August, http://www.nytimes.com/2010/08/13/health/research/13alzheimer.html
Meyer, E. T., Bulger, M., Kyriadkidou-‐Zacharoudiou, A., et al. (2012), Collaborative Yet Independent: Information Practices in the Physical Sciences (London: Research Information Network; London: Royal Astronomical Society; Bristol: Institute of Physics Publishing; London: Institute of Physics) http://www.iop.org/publications/iop/2012/page_53560.html.
O’Donoghue, S. I., Gavin, A.-‐C., Gehlenborg, N., et al. (2010), ‘Visualizing Biological Data – Now and in the Future’, Visualizing Biological Data; Supplement 3s to Nature Methods, 7: pp. S2–S4.
ODE Project (2011), Ten Tales of Drivers & Barriers in Data Sharing (The Hague: Alliance for Permanent Access) http://www.alliancepermanentaccess.org/index.php/current-‐projects/ode/outputs/
Olson, J. S., Hofer, E., Bos, N., et al. (2008), ‘A theory of remote scientific collaboration’, in G. M. Olson, A. Zimmerman, and N. Bos (eds.) Scientific Collaboration on the Internet

49
(Cambridge, MA: MIT Press), 73–97, http://www.ics.uci.edu/~jsolson/publications/CollaborationsInAcademia/TORSC.pdf
Paulk, M. C., Curtis, B., Chrissis, M. B., and Weber, C. V. (1993), Capability Maturity Model for Software, version 1.1, technical report CMU/SEI-‐93-‐TR-‐D24 (Pittsburgh, PA: Carnegie Mellon University) http://dx.doi.org/10.1109/52.219617
Peng, R. (2011), ‘Reproducible Research in Computational Science’, Science, 2 December: 1226–7, http://dx.doi.org/10.1126/science.1213847
Sansone, S., Rocca-‐Serra, P., Field, D., et al. (2012), ‘Toward interoperable bioscience data’, Nature Genetics, 44: 121–126, http://dx.doi.org/10.1038/ng.1054
Treloar, A. (1998), ‘Hypermedia Online Publishing: The Transformation of the Scholarly Journal’, (Ph.D. thesis, Monash University) http://andrew.treloar.net/research/theses/phd/
Treloar, A. (2011), ‘Private Research, Shared Research, Publication, and the Boundary Transitions’, http://andrew.treloar.net/research/diagrams/data_curation_continuum.pdf
Yale Law School Roundtable on Data and Code Sharing (2010), ‘Reproducible Research: Addressing the Need for Data and Code Sharing in Computational Science’, IEEE Computing in Science and Engineering, 12 (5): 8–13, http://dx.doi.org/10.1109/MCSE.2010.113