Embed Size (px)
Citation preview
Community Broadcasting Sector Programming & Community Development Census
Report prepared on behalf of the CBAA by Survey Matters JUNE 2017
1

2
Contents
Introduction
About This Report 3
Methodology 4
Sample 5
Findings
Sources of Programming 7
Programming Mix 12
Specialist Programming 18
Other Local Production Activity 23
Audience and Community Development 28
Appendix
Definitions 32
About Survey Matters 34
3
About This Report The Community Broadcasting Station Census is a comprehensive research project that collects information and reports on the activities of stations in the Australian community radio sector. The Community Broadcasting Association of Australia (CBAA) has been collecting census information since 2003. This latest census report covers the 2015/2016 financial year and is the eighth data collection. In prior years, a single census provided a snapshot of the community radio sector covering programming, program sources, finances, staffing, volunteers, subscribers, sponsorship, training and technology. In an effort to reduce the time required for stations to complete the census, the CBAA decided to split future census data collection projects over three separate surveys. The three census surveys cover: 1. Infrastructure and Technology 2. Programming and Community Development 3. Financial Health of Community Radio This census survey focused on Programming and Community Development, providing information about the extent and range of community radio programming that is broadcast to specific segments of the community.

Methodology Survey Distribution The Community Broadcasting Station Census Survey was fielded between 29 June and 5 October 2016. The survey was distributed via an email, inviting stations to complete an online survey. Invitations containing unique survey links were sent to the station managers or appropriate contacts at 338 long term and temporary licenced community radio stations on 29 June 2016, representing all community radio stations besides Remote Indigenous Broadcasting Services. Four reminder emails were sent to respondents who had not completed the survey. Several follow up telephone calls were also made to stations who had not responded, and paper surveys were sent to regional and remote stations who had not completed the survey to assist with participation. The survey remained open until 5 October 2016. The survey questionnaire was designed by the CBAA, in conjunction with Think: Insight & Advice and Survey Matters. While several questions remain the same as prior survey waves, allowing comparison to prior years, many of the questions are new or have been evolved to meet changing information requirements. Results and Analysis Representatives from 169 stations responded to the survey, from the distribution to 342 stations. Of these, 15 were partially completed surveys. In total, 27 paper surveys were received. This represents a 50% response rate. Live data verifications and reconciliation checks within the online survey ensured that all completed online responses to the survey contained consistent data. Unfortunately, inaccuracies in much of the data provided in the paper surveys meant that only 12 could be included in the census. Where minor inconsistencies were found in the paper surveys, follow up telephone calls were made to verify the data and ensure more accurate reporting. Responses received closely reflect the composition of the sector by the service area, or location, within which stations operate. When responses were reviewed by community of interest, however, there were some categories where a lower number of responses than required for accurate sector representation were received. Before analysing the results, data has been weighted to reflect the composition of the sector by both station location and category/community of interest. Results were compiled in Survey Manager Panel software, and results were analysed in Marketsight statistical software. Overall results after the weighting can be taken to provide accurate representation of the sector overall. Projections have been made to weight the survey data to total sector results. Where applicable, results are also presented in this report to show differences in station broadcasting based on the station’s location or category/community interest. Results for segments with small sample sizes should be treated with care. Comparisons to prior survey waves are provided where questions remain consistent.
5
Sample
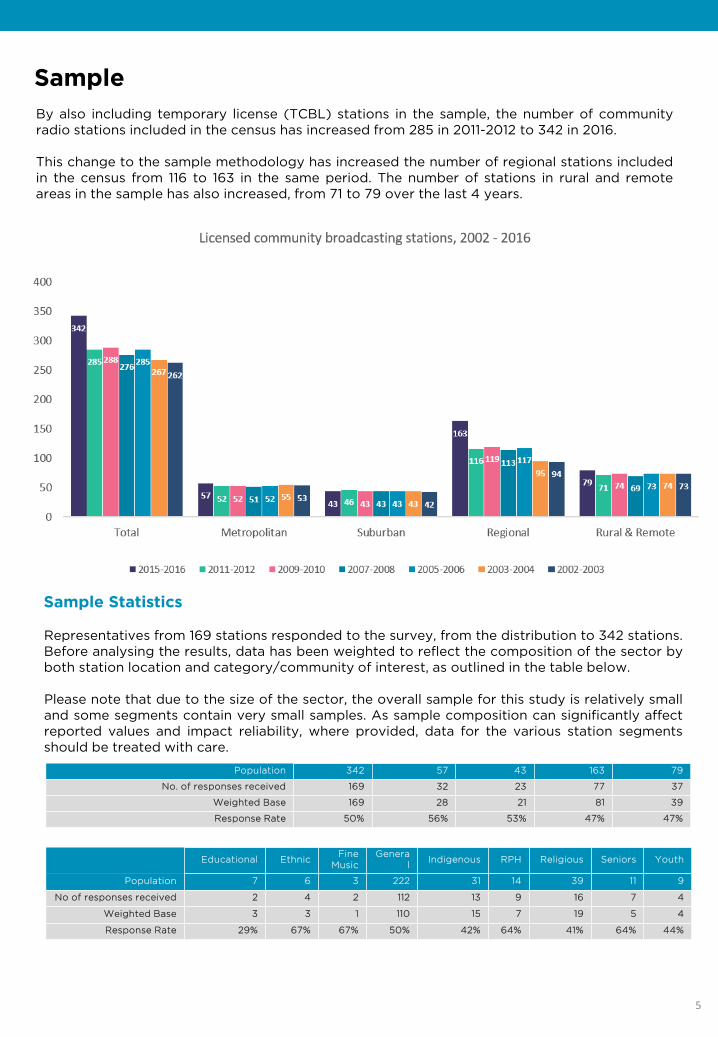
By also including temporary license (TCBL) stations in the sample, the number of community radio stations included in the census has increased from 285 in 2011-2012 to 342 in 2016. This change to the sample methodology has increased the number of regional stations included in the census from 116 to 163 in the same period. The number of stations in rural and remote areas in the sample has also increased, from 71 to 79 over the last 4 years.
Sample Statistics Representatives from 169 stations responded to the survey, from the distribution to 342 stations. Before analysing the results, data has been weighted to reflect the composition of the sector by both station location and category/community of interest, as outlined in the table below. Please note that due to the size of the sector, the overall sample for this study is relatively small and some segments contain very small samples. As sample composition can significantly affect reported values and impact reliability, where provided, data for the various station segments should be treated with care.
Population 342 57 43 163 79
No. of responses received 169 32 23 77 37
Weighted Base 169 28 21 81 39
Response Rate 50% 56% 53% 47% 47%
Educational Ethnic Fine Music
General Indigenous RPH Religious Seniors Youth
Population 7 6 3 222 31 14 39 11 9
No of responses received 2 4 2 112 13 9 16 7 4
Weighted Base 3 3 1 110 15 7 19 5 4
Response Rate 29% 67% 67% 50% 42% 64% 41% 64% 44%

FINDINGS
6

Sources of Programming
The first section of the 2016 Community Broadcasting Station Census – Programming and Community Development asked stations to indicate the total hours of programming that their station broadcast over the last week. Specifically, they were asked to specify the number of hours of locally produced content their station broadcast on their primary analogue service last week as well as the number of hours of externally produced content they broadcast over the same period. Of their locally produced content, stations were also asked to indicate how many hours were presented live. The Census also asked stations to indicate which services they use to source their externally produced programming from, and the specific sources or methods they use to access the programs.
7
SOURCES OF PROGRAMMING
Q1. How many hours of Locally/Externally Produced Content did your station broadcast on your primary analogue service LAST WEEK? 8
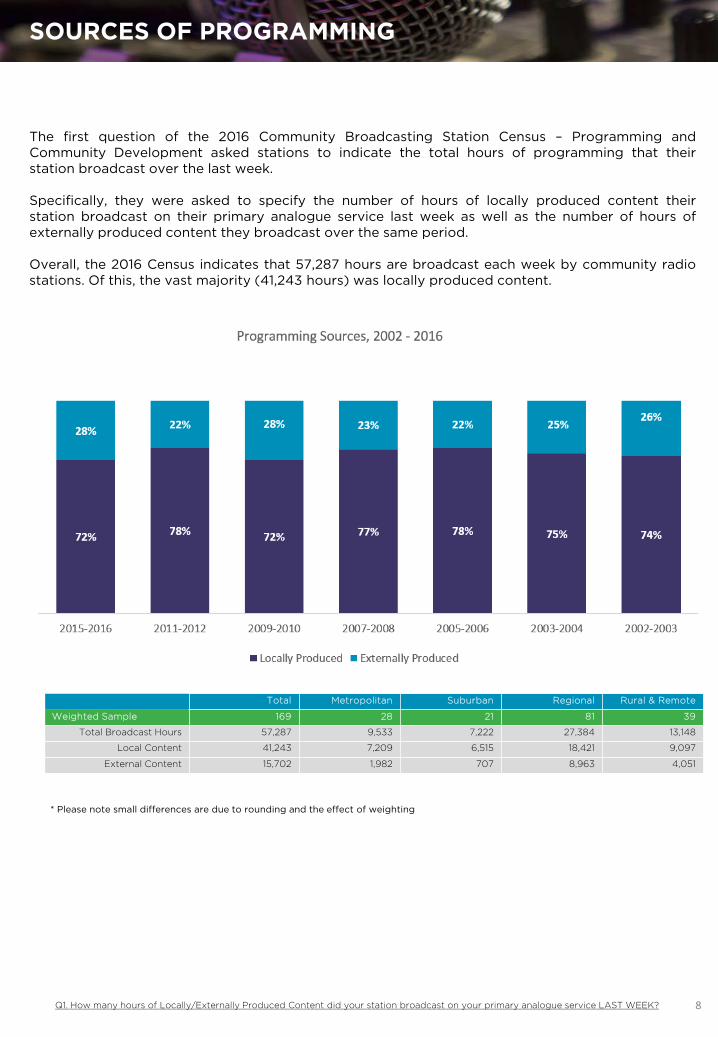
The first question of the 2016 Community Broadcasting Station Census – Programming and Community Development asked stations to indicate the total hours of programming that their station broadcast over the last week. Specifically, they were asked to specify the number of hours of locally produced content their station broadcast on their primary analogue service last week as well as the number of hours of externally produced content they broadcast over the same period. Overall, the 2016 Census indicates that 57,287 hours are broadcast each week by community radio stations. Of this, the vast majority (41,243 hours) was locally produced content.
* Please note small differences are due to rounding and the effect of weighting
Total Metropolitan Suburban Regional Rural & Remote
Weighted Sample 169 28 21 81 39
Total Broadcast Hours 57,287 9,533 7,222 27,384 13,148
Local Content 41,243 7,209 6,515 18,421 9,097
External Content 15,702 1,982 707 8,963 4,051
Q1: How many hours of LOCALLY PRODUCED CONTENT did your station broadcast on your primary analogue service LAST WEEK?
72% of all programming on community radio is locally produced.
9
LOCAL CONTENT
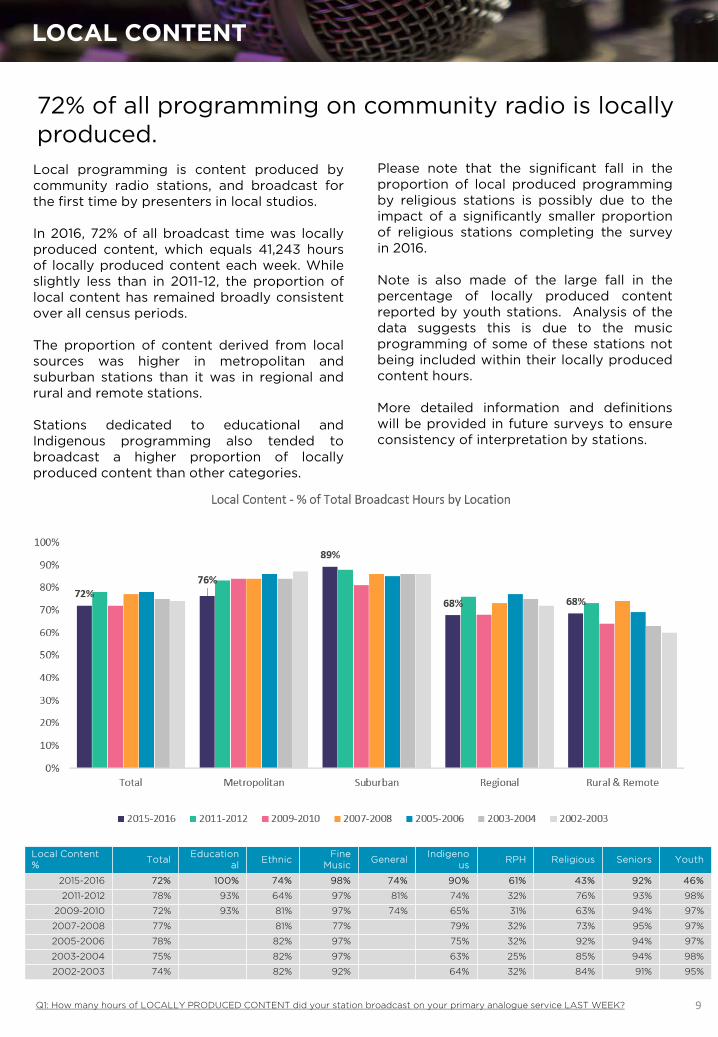
Local programming is content produced by community radio stations, and broadcast for the first time by presenters in local studios. In 2016, 72% of all broadcast time was locally produced content, which equals 41,243 hours of locally produced content each week. While slightly less than in 2011-12, the proportion of local content has remained broadly consistent over all census periods. The proportion of content derived from local sources was higher in metropolitan and suburban stations than it was in regional and rural and remote stations. Stations dedicated to educational and Indigenous programming also tended to broadcast a higher proportion of locally produced content than other categories.
Please note that the significant fall in the proportion of local produced programming by religious stations is possibly due to the impact of a significantly smaller proportion of religious stations completing the survey in 2016. Note is also made of the large fall in the percentage of locally produced content reported by youth stations. Analysis of the data suggests this is due to the music programming of some of these stations not being included within their locally produced content hours. More detailed information and definitions will be provided in future surveys to ensure consistency of interpretation by stations.
* Please note some segments contain small samples.
Local Content % Total Education
al Ethnic Fine Music General Indigeno
us RPH Religious Seniors Youth
2015-2016 72% 100% 74% 98% 74% 90% 61% 43% 92% 46%
2011-2012 78% 93% 64% 97% 81% 74% 32% 76% 93% 98%
2009-2010 72% 93% 81% 97% 74% 65% 31% 63% 94% 97%
2007-2008 77% 81% 77% 79% 32% 73% 95% 97%
2005-2006 78% 82% 97% 75% 32% 92% 94% 97%
2003-2004 75% 82% 97% 63% 25% 85% 94% 98%
2002-2003 74% 82% 92% 64% 32% 84% 91% 95%
Q2. Of that locally produced content, how many hours were presented live? 10
LIVE LOCAL PROGRAMMING
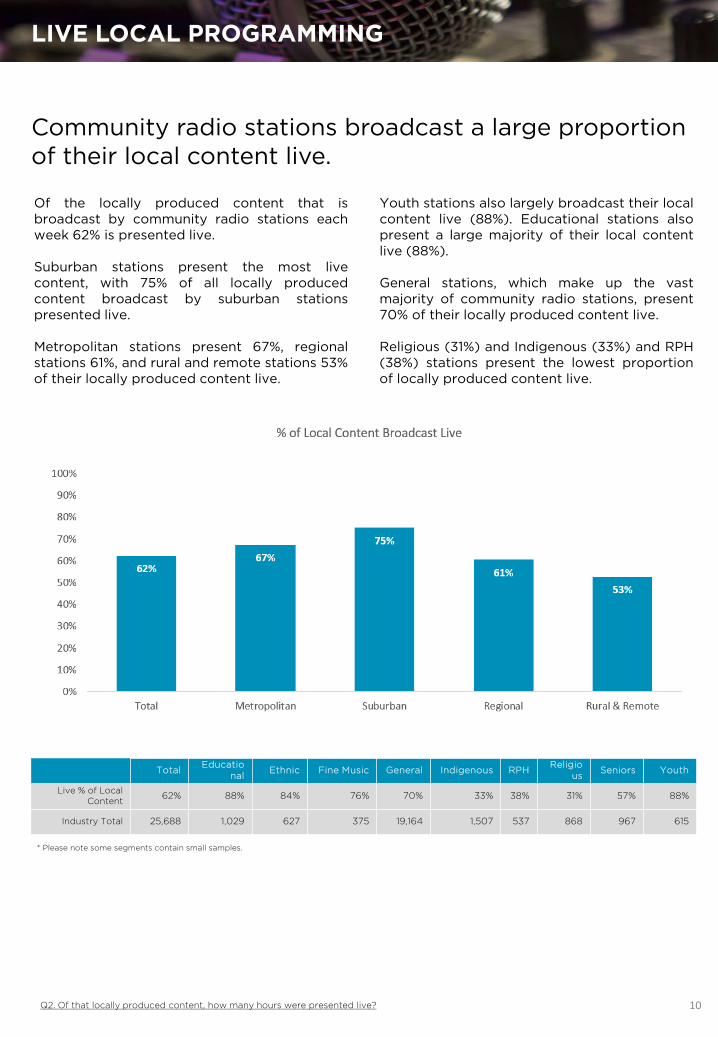
Of the locally produced content that is broadcast by community radio stations each week 62% is presented live. Suburban stations present the most live content, with 75% of all locally produced content broadcast by suburban stations presented live. Metropolitan stations present 67%, regional stations 61%, and rural and remote stations 53% of their locally produced content live.
Community radio stations broadcast a large proportion of their local content live.
Youth stations also largely broadcast their local content live (88%). Educational stations also present a large majority of their local content live (88%). General stations, which make up the vast majority of community radio stations, present 70% of their locally produced content live. Religious (31%) and Indigenous (33%) and RPH (38%) stations present the lowest proportion of locally produced content live.
* Please note some segments contain small samples.
Total Educational Ethnic Fine Music General Indigenous RPH Religio
us Seniors Youth
Live % of Local Content 62% 88% 84% 76% 70% 33% 38% 31% 57% 88%
Industry Total 25,688 1,029 627 375 19,164 1,507 537 868 967 615

Q33. How many hours of content form each of the following sources did your station broadcast last week 11
SOURCES OF EXTERNAL PROGRAMMING
Stations use a variety of external content sources to supplement their locally produced programming.
Many community radio stations rely on a variety of external sources to enable them to remain on air for 168 hours a week. When asked to identify their main sources of external content, a third of stations (32%) play live audio sourced via satellite. A further 21% and 18% of stations download files online and use physical media respectively, while 20% rely on other sources. Regional, rural and remote stations rely on externally produced content more than metropolitan and suburban stations, using external sources for almost a third (33% and 30% respectively) of their programming. While regional stations source 46% of their external content via downloaded files or physical media, 31% is live audio sourced via satellite. Conversely, rural and remote stations play a greater proportion of live audio sourced via satellite (42%). Metropolitan stations indicated that they source 39% of their external content via sources other than those listed.
General and Indigenous stations are the most likely to play live audio accessed via satellite, while religious stations (who rely on external content for a greater proportion of their programming than any other station category) source 80% of their external content via downloaded files or physical media.
Of the various services that stations use to access external audio content, the Community Radio Network (CRN) is the most widely used. Stations reported using an average of 13.6 hours per week both for access to programs and as a sustaining service. Regional, rural and remote stations relied on CRN for 17.2 and 20.2 hours per week respectively. BBC and NIRS are also used by a number of stations, for, on average, 1 hour per week. BBC is used as a sustaining service by metropolitan and suburban stations for approximately 3 and 2 hours per week respectively. NIRS is also used, predominantly for access to programs, by stations in rural and remote areas. Mediapoint Christian is used for 1.5 hours per week, predominantly by regional stations. Stations also report using other services for approximately 9.8 hours of content per week.
External Content Sources Total Metropolitan Suburban Regional Rural & Remote
Live Audio via Satellite 32% 18% 31% 31% 42%
Live Audio via Online 5% 3% 7% 4% 7%
Files via Satellite 3% 2% 16% 2% 4%
Files via Online 21% 25% 3% 25% 15%
Physical Media 18% 12% 41% 21% 10%
Other 20% 39% 0% 17% 22%

12
Programming Mix
Community radio broadcasting offers a range of music, talkback, news bulletins and current affairs programming. Nearly all stations broadcast spoken word content, with only a few being music only stations. The census asked stations to indicate the number of hours of music and spoken word programming they broadcast each week. Of their specified hours of music programming, the census asked stations to indicate how many hours of this were specifically Australian music as well as the number of hours of different music genres they play each week. Of their spoken word programming, stations were asked to indicate the number of hours of total spoken word, news and current affairs they broadcast each week. Stations were also asked to indicate how many hours of their spoken word programming is locally produced.
Q3. How many hours of primarily MUSIC BASED PROGRAMMING, both locally and externally produced, did your station broadcast last week? Q6. How many hours of primarily SPOKEN WORD CONTENT did your station broadcast last week? Q7. How many minutes of last week’s spoken word content was live read and / or recorded NEWS BULLETIN CONTENT? Q9. How many hours of last week’s spoken word content was specifically CURRENT AFFAIRS?
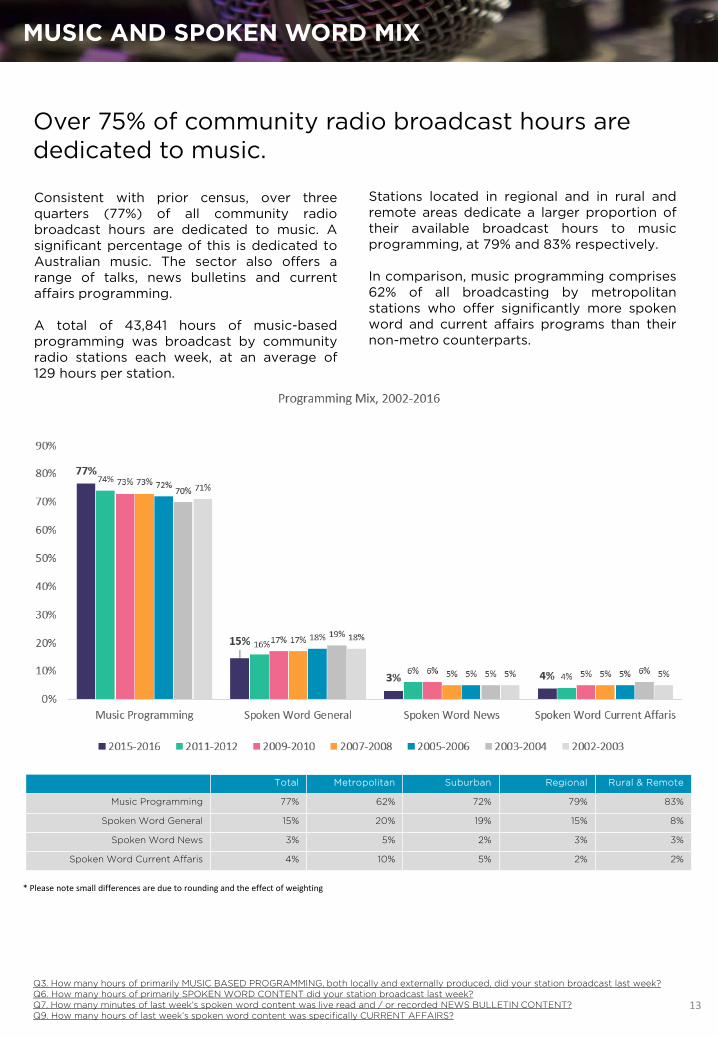
Consistent with prior census, over three quarters (77%) of all community radio broadcast hours are dedicated to music. A significant percentage of this is dedicated to Australian music. The sector also offers a range of talks, news bulletins and current affairs programming. A total of 43,841 hours of music-based programming was broadcast by community radio stations each week, at an average of 129 hours per station.
13
MUSIC AND SPOKEN WORD MIX
Over 75% of community radio broadcast hours are dedicated to music.
Stations located in regional and in rural and remote areas dedicate a larger proportion of their available broadcast hours to music programming, at 79% and 83% respectively. In comparison, music programming comprises 62% of all broadcasting by metropolitan stations who offer significantly more spoken word and current affairs programs than their non-metro counterparts.
* Please note small differences are due to rounding and the effect of weighting
Total Metropolitan Suburban Regional Rural & Remote
Music Programming 77% 62% 72% 79% 83%
Spoken Word General 15% 20% 19% 15% 8%
Spoken Word News 3% 5% 2% 3% 3%
Spoken Word Current Affaris 4% 10% 5% 2% 2%

Q3. How many hours of that music based programming was AUSTRALIAN MUSIC? 14
AUSTRALIAN MUSIC PROGRAMMING
Community radio is dedicated to the promotion of Australian music, and thirty six percent (36%) of the music broadcast by community radio stations each week is Australian music. This represents an average of 47 hours per week per station, or 15,609 hours in total of Australian music broadcasting each week across stations collectively. The percentage of Australian music played has remained relatively consistent since the Census began in 2002/3.
Over a third of all music played by community radio stations is Australian music
Australian Music Average
Hours Per Week
Total Hours per Week
Total 47 15,609
Location
Metropolitan 32 1,573
Suburban 46 1,988
Regional 46 7,512
Rural & Remote 57 4,538
Station Category
Educational 16 112
Ethnic 5 15
Fine Music 24 72
General 49 10,833
Indigenous 62 1,937
Print Handicapped 0 0
Religious 43 1,581
Seniors / Mature Age 42 458
Youth 67 600
Q39. Please indicate how many hours of the following music genres your station broadcast last week. 15
MUSIC PROGRAMMING MIX BY GENRE
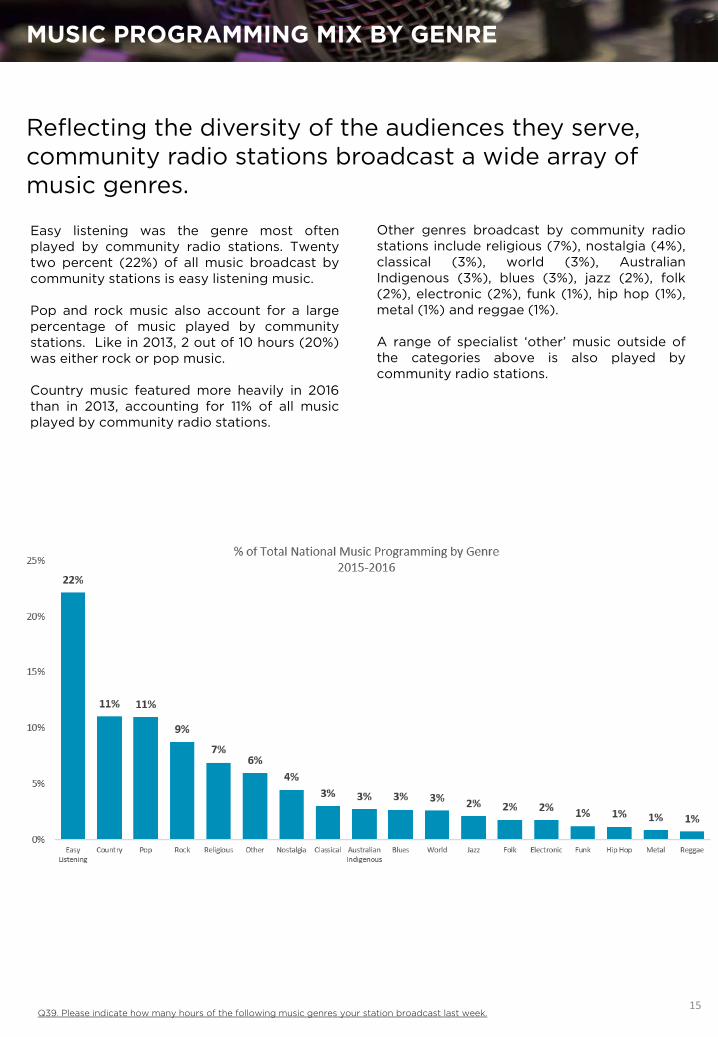
Easy listening was the genre most often played by community radio stations. Twenty two percent (22%) of all music broadcast by community stations is easy listening music. Pop and rock music also account for a large percentage of music played by community stations. Like in 2013, 2 out of 10 hours (20%) was either rock or pop music. Country music featured more heavily in 2016 than in 2013, accounting for 11% of all music played by community radio stations.
Other genres broadcast by community radio stations include religious (7%), nostalgia (4%), classical (3%), world (3%), Australian Indigenous (3%), blues (3%), jazz (2%), folk (2%), electronic (2%), funk (1%), hip hop (1%), metal (1%) and reggae (1%). A range of specialist ‘other’ music outside of the categories above is also played by community radio stations.
Reflecting the diversity of the audiences they serve, community radio stations broadcast a wide array of music genres.
16
SPOKEN WORD CONTENT
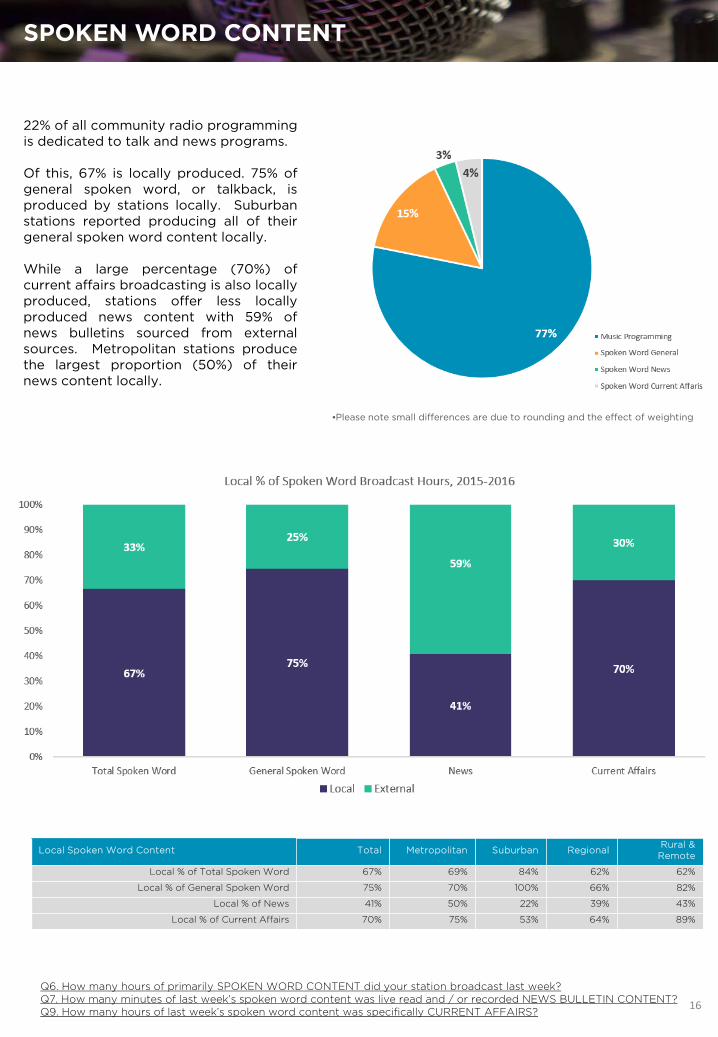
22% of all community radio programming is dedicated to talk and news programs. Of this, 67% is locally produced. 75% of general spoken word, or talkback, is produced by stations locally. Suburban stations reported producing all of their general spoken word content locally. While a large percentage (70%) of current affairs broadcasting is also locally produced, stations offer less locally produced news content with 59% of news bulletins sourced from external sources. Metropolitan stations produce the largest proportion (50%) of their news content locally.
Q6. How many hours of primarily SPOKEN WORD CONTENT did your station broadcast last week? Q7. How many minutes of last week’s spoken word content was live read and / or recorded NEWS BULLETIN CONTENT? Q9. How many hours of last week’s spoken word content was specifically CURRENT AFFAIRS?
•Please note small differences are due to rounding and the effect of weighting
Local Spoken Word Content Total Metropolitan Suburban Regional Rural & Remote
Local % of Total Spoken Word 67% 69% 84% 62% 62%
Local % of General Spoken Word 75% 70% 100% 66% 82%
Local % of News 41% 50% 22% 39% 43%
Local % of Current Affairs 70% 75% 53% 64% 89%

17
SPOKEN WORD CONTENT
Q6. How many hours of primarily SPOKEN WORD CONTENT did your station broadcast last week? Q7. How many minutes of last week’s spoken word content was live read and / or recorded NEWS BULLETIN CONTENT? Q9. How many hours of last week’s spoken word content was specifically CURRENT AFFAIRS?
The proportion of community radio airtime dedicated to spoken word programming declines the further away from major cities a station is based. While metropolitan stations dedicate 35% of their programming to talk, only 20% of regional and 13% of rural and remote community radio airtime is spoken word programming. On average, metropolitan stations broadcast 59 hours of spoken word programming each week, more than half of which is talkback. By comparison, suburban stations broadcast 45 hours, regional stations 35 hours and rural and remote stations only 26 hours of spoken word each week.
While RPH stations dedicate all of their airtime to spoken word programming to meet the needs of their community of interest, ethnic stations also devote a large proportion (86%) of their broadcast time to spoken word programming. Ethnic stations broadcast an average of 117 hours of general spoken word, or talkback, each week. Educational and Indigenous stations both dedicate approximately a quarter of their programming time to spoken word programs, with an average of 27 and 28 hours respectively of talkback programming each week. General stations broadcast an average of 31 hours of spoken word each week or 18% of their total broadcast hours. Of this spoken word programming, 22 hours is talkback, 5 hours is current affairs and 4 hours is news broadcasts.
* Please note some segments contain small samples. Please note, small differences are due to rounding or missing data.
Programming Mix. % Spoken Word Hours Total Metropolitan Suburban Regional Rural & Remote
Music Programming 77% 62% 72% 79% 83%
Spoken Word General 15% 20% 19% 15% 8%
Spoken Word News 3% 5% 2% 3% 3%
Spoken Word Current Affaris 4% 10% 5% 2% 2%
Spoken Word & Music Mix Total Educatio
nal Ethnic Fine
Music Genera
l Indigenou
s RP
H Religio
us Seniors Youth
Music Programming 77% 74% 14% 99% 81% 77% 1% 83% 88% 86%
Spoken Word General 15% 16% 70% 0% 13% 16% 53% 8% 9% 12%
Spoken Word News 3% 3% 5% 1% 2% 2% 22% 2% 3% 1%
Spoken Word Current Affairs 4% 7% 12% 0% 3% 5%
25% 2% 0% 2%

18
Specialist Programming
Community radio broadcasting provides information and content that serves the interests of many diverse groups within Australian society. Stations were asked to indicate the number of hours each week they dedicate to specialist programming, including Indigenous, Ethnic, Religious, RPH Radio Reading, LGBTIQ, Seniors, Women’s, Sports and Youth. Stations were also asked to indicate how many hours of this specialist programming is locally produced by their station.
19
SPECIALIST PROGRAMMING
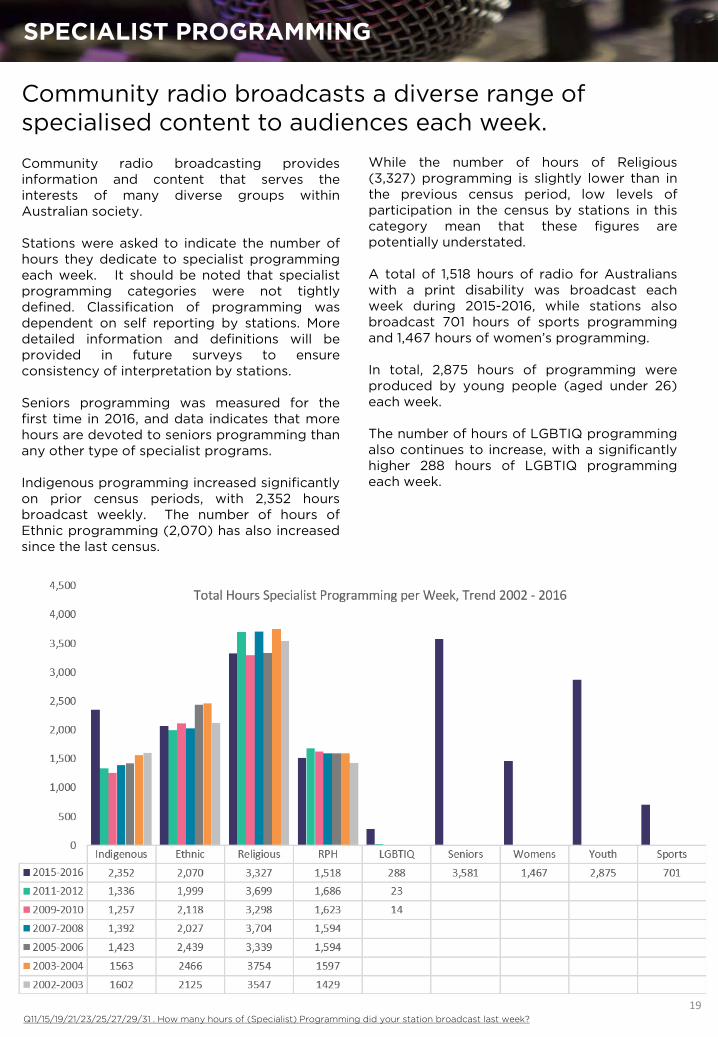
Community radio broadcasting provides information and content that serves the interests of many diverse groups within Australian society. Stations were asked to indicate the number of hours they dedicate to specialist programming each week. It should be noted that specialist programming categories were not tightly defined. Classification of programming was dependent on self reporting by stations. More detailed information and definitions will be provided in future surveys to ensure consistency of interpretation by stations. Seniors programming was measured for the first time in 2016, and data indicates that more hours are devoted to seniors programming than any other type of specialist programs. Indigenous programming increased significantly on prior census periods, with 2,352 hours broadcast weekly. The number of hours of Ethnic programming (2,070) has also increased since the last census.
While the number of hours of Religious (3,327) programming is slightly lower than in the previous census period, low levels of participation in the census by stations in this category mean that these figures are potentially understated. A total of 1,518 hours of radio for Australians with a print disability was broadcast each week during 2015-2016, while stations also broadcast 701 hours of sports programming and 1,467 hours of women’s programming. In total, 2,875 hours of programming were produced by young people (aged under 26) each week. The number of hours of LGBTIQ programming also continues to increase, with a significantly higher 288 hours of LGBTIQ programming each week.
Community radio broadcasts a diverse range of specialised content to audiences each week.
Q11/15/19/21/23/25/27/29/31 . How many hours of (Specialist) Programming did your station broadcast last week?

20
LOCALLY PRODUCED SPECIALIST PROGRAMMING
Q12/16/20/22/24/26/28/30/32 . How many hours of that (Specialist) Programming was produced by your station?
A large percentage of specialist programs are locally produced.
Seventy two percent (72%) of all specialist programming is produced locally by community broadcasting stations. For some specialist programming, this figure is significantly higher. Nearly all (99%) programming produced by young people is produced locally in community broadcasting stations. Similarly, over 96% of Seniors, 96% of Ethnic and 95% of LGBTIQ programming is produced in-house. Eighty four percent (84%) of all Sports programming is locally produced, as is 77% of RPH Radio Reading programming, 73% of Women’s programming and 71% of Indigenous programming.
Religious stations continue to produce the lowest percentage of their content locally, with only 56% of all religious programming broadcast each week produced by local community radio stations. Again, note is made of the low participation of stations in this sector.
Women’s
21
INDIGENOUS PROGRAMMING
Q11. How many hours of Indigenous Programming did your station broadcast last week? Q12. How many hours of that Indigenous Programming was produced by your station? Q13. How many hours of last week’s Indigenous programming was presented in an Indigenous Australian language? Q14. How many hours of that Indigenous Australian language content was produced by your station?
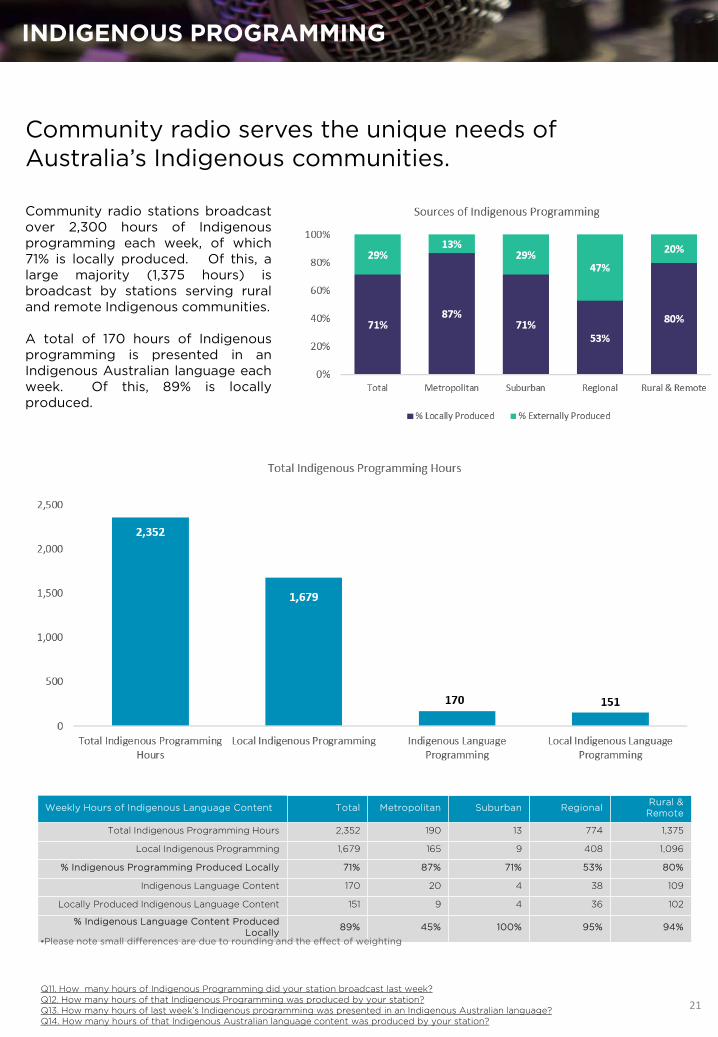
Community radio stations broadcast over 2,300 hours of Indigenous programming each week, of which 71% is locally produced. Of this, a large majority (1,375 hours) is broadcast by stations serving rural and remote Indigenous communities. A total of 170 hours of Indigenous programming is presented in an Indigenous Australian language each week. Of this, 89% is locally produced.
Community radio serves the unique needs of Australia’s Indigenous communities.
Weekly Hours of Indigenous Language Content Total Metropolitan Suburban Regional Rural & Remote
Total Indigenous Programming Hours 2,352 190 13 774 1,375
Local Indigenous Programming 1,679 165 9 408 1,096
% Indigenous Programming Produced Locally 71% 87% 71% 53% 80%
Indigenous Language Content 170 20 4 38 109
Locally Produced Indigenous Language Content 151 9 4 36 102
% Indigenous Language Content Produced Locally 89% 45% 100% 95% 94%
•Please note small differences are due to rounding and the effect of weighting

22
ETHNIC PROGRAMMING
Q15. How many hours of Ethnic Programming did your station broadcast last week? Q16. How many hours of that Ethnic Programming was produced by your station?
As well as serving Indigenous communities, community radio broadcasts programs that meet the needs of many other Culturally and Linguistically Diverse (CALD) communities in Australia. A total of 2,070 hours of ethnic programming is broadcast each week, of which 96% is locally produced. Most (1,541 hours) is broadcast by metropolitan and suburban stations. Of particular note, 79%, or 1,629 hours are presented in language other than English or an Australian Indigenous language each week. Nearly all of this is produced locally by community stations.
Weekly Hours of Ethnic Content Total Metropolitan Suburban Regional Rural &
Remote
Total Ethnic Programming Hours 2,070 781 760 331 197
Locally Produced Ethnic Programming 1,983 760 734 323 166
% Ethnic Programming Produced Locally 96% 97% 97% 97% 84%
Non English, Non Indigenous Language Content 1,629 617 656 224 131
Locally Produced Non English, Non Indigenous Language Content 1,609 613 649 218 129
% Non English, Non Indigenous Language Content Produced Locally 99% 99% 99% 97% 98%
Other Local Production Activity
Aside from live broadcasting, community radio stations produce and make available a variety of other material for their listeners. The next section of the survey asked stations to provide information about the other local production activities they undertake, including production of podcasts, video content, online only audio, recording of live Australian music broadcasts and outside broadcasting.
23
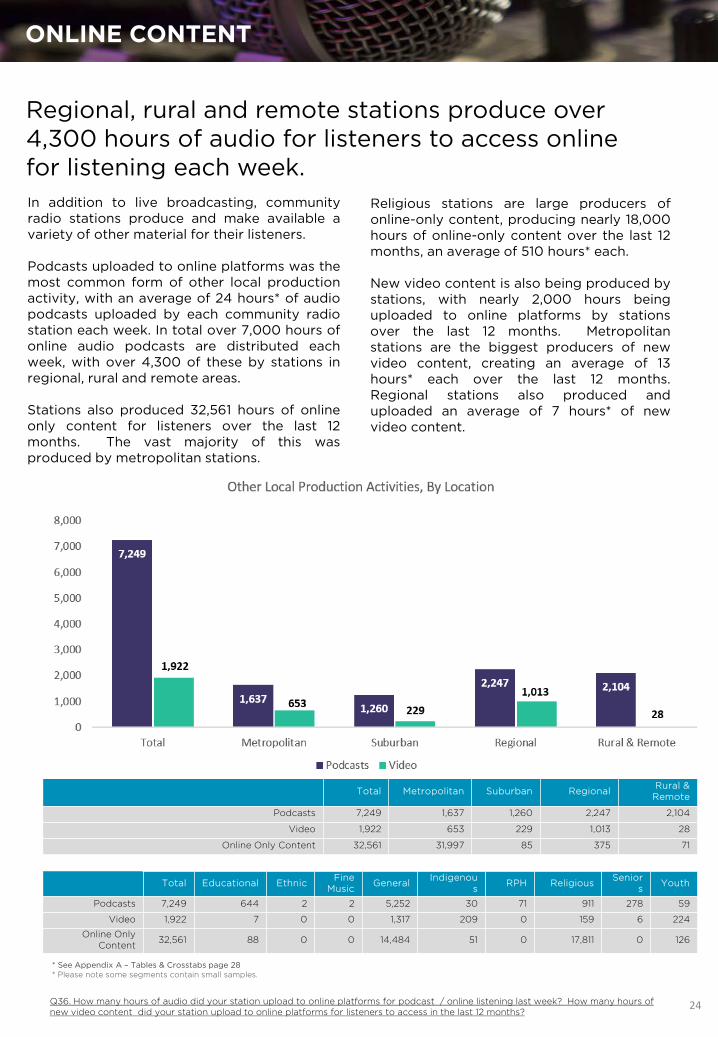
Q36. How many hours of audio did your station upload to online platforms for podcast / online listening last week? How many hours of new video content did your station upload to online platforms for listeners to access in the last 12 months?
24
ONLINE CONTENT
Regional, rural and remote stations produce over 4,300 hours of audio for listeners to access online for listening each week. In addition to live broadcasting, community radio stations produce and make available a variety of other material for their listeners. Podcasts uploaded to online platforms was the most common form of other local production activity, with an average of 24 hours* of audio podcasts uploaded by each community radio station each week. In total over 7,000 hours of online audio podcasts are distributed each week, with over 4,300 of these by stations in regional, rural and remote areas. Stations also produced 32,561 hours of online only content for listeners over the last 12 months. The vast majority of this was produced by metropolitan stations.
Religious stations are large producers of online-only content, producing nearly 18,000 hours of online-only content over the last 12 months, an average of 510 hours* each. New video content is also being produced by stations, with nearly 2,000 hours being uploaded to online platforms by stations over the last 12 months. Metropolitan stations are the biggest producers of new video content, creating an average of 13 hours* each over the last 12 months. Regional stations also produced and uploaded an average of 7 hours* of new video content.
* See Appendix A – Tables & Crosstabs page 28 * Please note some segments contain small samples.
Total Metropolitan Suburban Regional Rural & Remote
Podcasts 7,249 1,637 1,260 2,247 2,104
Video 1,922 653 229 1,013 28
Online Only Content 32,561 31,997 85 375 71
Total Educational Ethnic Fine Music General Indigenou
s RPH Religious Seniors Youth
Podcasts 7,249 644 2 2 5,252 30 71 911 278 59
Video 1,922 7 0 0 1,317 209 0 159 6 224
Online Only Content 32,561 88 0 0 14,484 51 0 17,811 0 126
25
AUSTRALIAN MUSIC PERFORMANCE
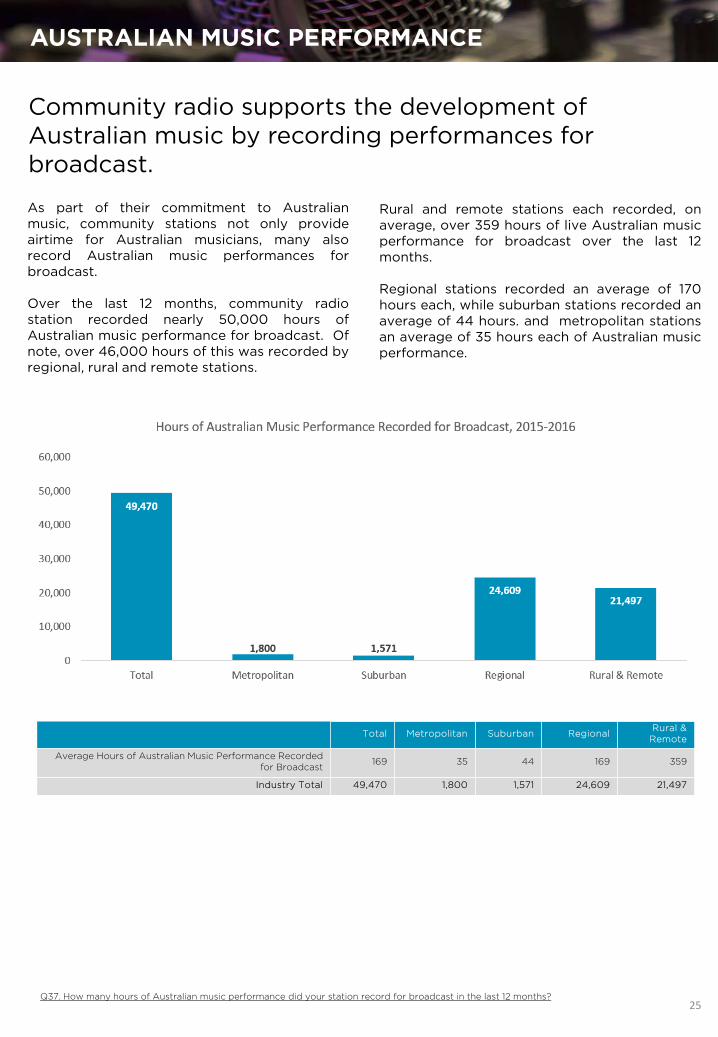
Q37. How many hours of Australian music performance did your station record for broadcast in the last 12 months?
Community radio supports the development of Australian music by recording performances for broadcast. As part of their commitment to Australian music, community stations not only provide airtime for Australian musicians, many also record Australian music performances for broadcast. Over the last 12 months, community radio station recorded nearly 50,000 hours of Australian music performance for broadcast. Of note, over 46,000 hours of this was recorded by regional, rural and remote stations.
Total Metropolitan Suburban Regional Rural & Remote
Average Hours of Australian Music Performance Recorded for Broadcast 169 35 44 169 359
Industry Total 49,470 1,800 1,571 24,609 21,497
Rural and remote stations each recorded, on average, over 359 hours of live Australian music performance for broadcast over the last 12 months. Regional stations recorded an average of 170 hours each, while suburban stations recorded an average of 44 hours. and metropolitan stations an average of 35 hours each of Australian music performance.

26
OUTSIDE BROADCASTS
Q37. How many hours of outside broadcasts did your station conduct in the last12 months?
Stations across all geographic locations conducted 3,000 outside broadcasts over the last 12 months. Of these, 470 were conducted by metropolitan stations, 982 by suburban stations, 1,041 by regional stations and 553 by rural and remote stations. Suburban stations conducted an average of 26 outside broadcasts each over the last 12 months, significantly more than stations in other areas. Indigenous stations were the most likely to conduct outside broadcasts, at an average of 20 each. General stations conducted an average of 10, while religious stations conducted an average of 8 over the last 12 months.
Outside Broadcasts Total Metropolitan Suburban Regional Rural & Remote
Average No of Outside Broadcasts 10 9 26 7 8
Industry Total 3,046 470 982 1,041 553
Educational Ethnic Fine Music General Indigenous RPH Religiou
s Seniors Youth
No of Outside Broadcasts Conducted in Last 12 Months 11 4 3 10 20 8 8 3 5
Industry Total 77 17 8 2,043 473 98 265 34 31

27
CONTENT DISTRIBUTION
Q38. Does your station supply locally produced program content to any of the following recipients / services?
A third of community radio stations distribute locally produced content to external sources. Some community radio stations supply locally produced content to different recipients or services. This includes community sector—based distribution services (such as CRN and NIRS), other individual community broadcasting stations, non-sector programming services and media organisation and other government, not profit or commercial organisations. Given their size and resources, metropolitan stations are the biggest distributors, with 43% supplying locally produced content to community sector based distribution services. Approximately 20% of stations in suburban, regional, and rural and remote areas also supply to sector-based distribution services.
Stations also provide content to other individual community radio stations. Nineteen percent (19%) of metropolitan stations provide content to other individual stations, as do 15% of regional and 16% of rural and remote stations. Given their size and the limited resources of many stations, both financial and human capital, nearly 65% of stations do not provide content to other recipients.

Audience and Community Development
Community radio stations broadcast a wide range of local information, announcements, and information about local issues and events Stations were asked to indicate how many hours of local community information, such as community service announcements, community events, calendars and interviews about their local community broadcast last week, as well as the number of individuals and organisations their station broadcasts information for. Stations were next asked to indicate how, aside from broadcasting, they develop their ‘community of interest’, through the range of services they provide their local community such as providing opportunities for local artists to perform live, engagement with marginalised and disadvantaged sections of their community, educational opportunities, cultural and language preservation and ministry to their communities, among others.
28
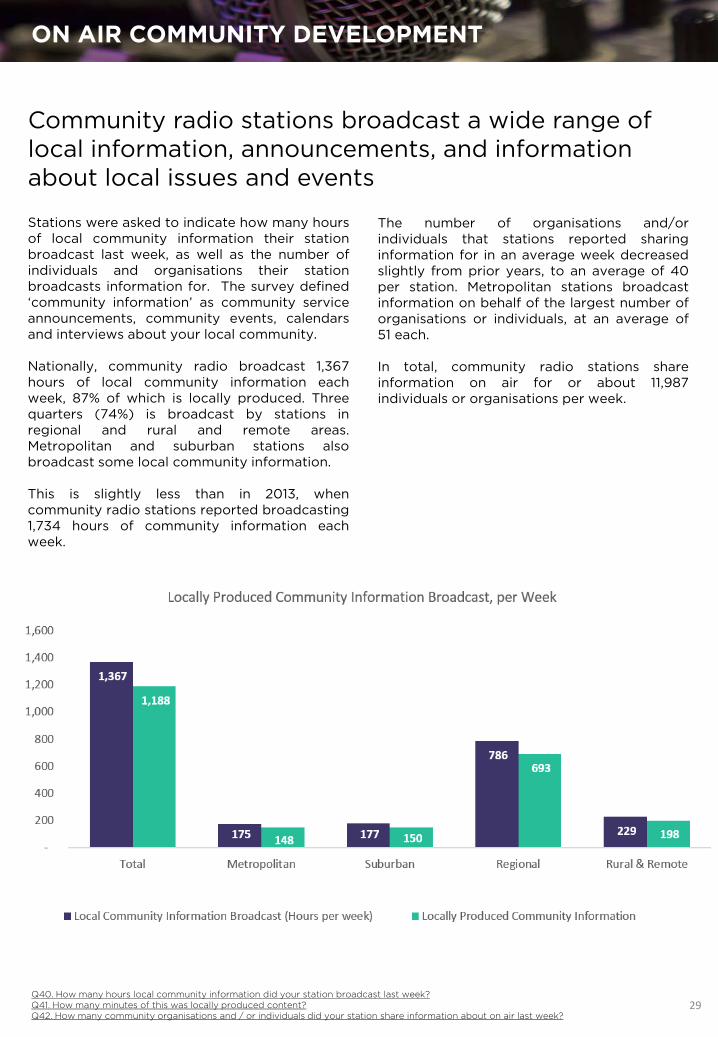
Q40. How many hours local community information did your station broadcast last week? Q41. How many minutes of this was locally produced content? Q42. How many community organisations and / or individuals did your station share information about on air last week?
29
ON AIR COMMUNITY DEVELOPMENT
Community radio stations broadcast a wide range of local information, announcements, and information about local issues and events Stations were asked to indicate how many hours of local community information their station broadcast last week, as well as the number of individuals and organisations their station broadcasts information for. The survey defined ‘community information’ as community service announcements, community events, calendars and interviews about your local community. Nationally, community radio broadcast 1,367 hours of local community information each week, 87% of which is locally produced. Three quarters (74%) is broadcast by stations in regional and rural and remote areas. Metropolitan and suburban stations also broadcast some local community information. This is slightly less than in 2013, when community radio stations reported broadcasting 1,734 hours of community information each week.
The number of organisations and/or individuals that stations reported sharing information for in an average week decreased slightly from prior years, to an average of 40 per station. Metropolitan stations broadcast information on behalf of the largest number of organisations or individuals, at an average of 51 each. In total, community radio stations share information on air for or about 11,987 individuals or organisations per week.

Q43. Aside from Broadcasting, how do you develop your community of interest? 30
OFF AIR COMMUNITY DEVELOPMENT
In addition to broadcasting, community radio stations also provide a variety of other services to their community of interest. Stations were next asked to indicate how they develop their ‘community of interest’. A list was provided and they were able to select all activities that they undertake. Reflecting the support provided by community radio for Australian music and the local community, sixty five percent (65%) of stations reported that they provide opportunities for local artists to perform live. In metropolitan and suburban areas, this increased to 71% of stations. Over half (52%) of stations also reported that they actively engage with marginalised and disadvantaged communities. Again, this increased to 60% of metropolitan stations. Eighty one percent (81%) of Indigenous stations reported that they engage with marginalised or disadvantaged communities. Reflecting their mission, 89% of RPH stations also engage with disadvantaged communities.
Educational programming or opportunities for community members is provided by 55% of stations. As would be expected, educational programming and opportunities are provided by 100% of educational stations. Eighty three percent (83%) of Indigenous stations also provide educational programming, as do 78% of RPH stations. As would be expected, a large proportion (78%) of religious stations report providing ministry to a religious community. Nearly a third (30%) of stations engage in Indigenous or ethnic cultural or language preservation.

31
32
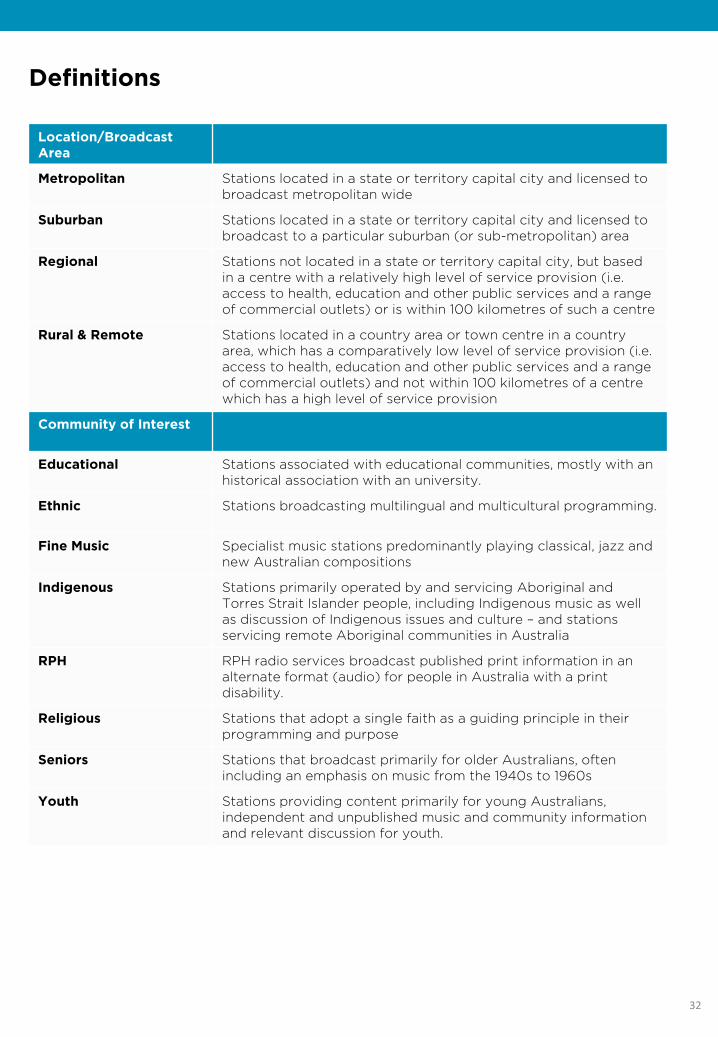
Definitions
Location/Broadcast Area
Metropolitan Stations located in a state or territory capital city and licensed to broadcast metropolitan wide
Suburban Stations located in a state or territory capital city and licensed to broadcast to a particular suburban (or sub-metropolitan) area
Regional Stations not located in a state or territory capital city, but based in a centre with a relatively high level of service provision (i.e. access to health, education and other public services and a range of commercial outlets) or is within 100 kilometres of such a centre
Rural & Remote Stations located in a country area or town centre in a country area, which has a comparatively low level of service provision (i.e. access to health, education and other public services and a range of commercial outlets) and not within 100 kilometres of a centre which has a high level of service provision
Community of Interest
Educational Stations associated with educational communities, mostly with an historical association with an university.
Ethnic Stations broadcasting multilingual and multicultural programming.
Fine Music Specialist music stations predominantly playing classical, jazz and new Australian compositions
Indigenous Stations primarily operated by and servicing Aboriginal and Torres Strait Islander people, including Indigenous music as well as discussion of Indigenous issues and culture – and stations servicing remote Aboriginal communities in Australia
RPH RPH radio services broadcast published print information in an alternate format (audio) for people in Australia with a print disability.
Religious Stations that adopt a single faith as a guiding principle in their programming and purpose
Seniors Stations that broadcast primarily for older Australians, often including an emphasis on music from the 1940s to 1960s
Youth Stations providing content primarily for young Australians, independent and unpublished music and community information and relevant discussion for youth.

33

Survey Matters specialise in providing research services to associations and not-for-profit organisations, their customers, and members. Survey Matters have helped a wide range of associations understand their value proposition - what is important to members, how the association can help them and how satisfied they are with their associations' performance. We also work with associations to generate and build industry data and knowledge to support advocacy, promotion, industry development and marketing activities. As authors of the Associations Matter Research Series, Survey Matters have a significant knowledge base of the Australasian association sector. Survey Matters is a member of the Australian Market and Social Research Society.
For any questions or for further information, please contact: Rebecca Sullivan Survey Matters T: 61 3 9452 0101 E: [email protected]