Embed Size (px)
Citation preview


DOI: 10.1016/j.infoecopol.2008.10.001
____________________________________________________________________________________________________________
Community-Based Production of Open Source Software: What do we know about the developers who participate? *
By
Paul A. David Stanford University & All Souls College,
University of Oxford & UNU-Merit (Maastricht) [email protected]
Joseph S. Shapiro Massachusetts Institute of Technology
First draft: April 2006 Refereed draft: 15 June 2007
This version: 16 October 2008
* ACKNOWLEDGEMENTS The research reported in this paper was made possible by grant awards to Stanford University from the National Science Foundation program on Digital Technology and Society: IIS-0112962 (2001-04) and IIS-0329259 (2003-05). The international Project for Research on the Economics of Free/Libre & Open Source Software (PREFLOSS) has been sustained by funding under these awards and by support from the Stanford Institute for Economic Policy Research (SIEPR), and by its European academic partner institutions: UNU-MERIT and the former Infonomics Institute associated with the University of Maastricht), IMRI (at Université Paris-Dauphine), Informatics-GSyC (at Universidad Rey Juan Carlos, Mostoles) and SPRU/INK (at University of Sussex). [See http://siepr.stanford.edu/programs/OpenSoftware_David/OS_Project_Funded_Announcmt.htm.] Many colleagues have had a helpful hand in making this study possible: Andrew H. Waterman, Rishab A. Ghosh, and Ruediger Glott made vital contributions to the design and preliminary analysis of the data from the FLOSS-US Survey for 2003, and to subsequent study of the relationship between its findings and those from the 2002 FLOSS-EU Survey. Francesco Rullani provided critical help by obtaining from the Source Forge archives membership size information for projects to which individual survey participants reported having contributed.Gregorio Robles ran computer searches that validated asserted project participation for a subsample of respondents by matching their e-mail addresses with those found in the code repositories of large projects hosted elsewhere than on Source Forge. In preparing this paper, we have benefited from the comments and suggestions offered by participants at the OSSEMP 2007 Workshop of the 3rd International Conference on Open Source Software, held at the University of Limerick, 14 June, 2007. The recommendations in Edward Steinmueller’s detailed review of an earlier draft and those of an anonymous reviewer have helped greatly to improve the article’s organization and exposition. None of those thanked here should be held responsible for the defects that may remain. Contact author: P. A. David, Department of Economics, Stanford University, Stanford, CA. USA 94305-6072. Tel: (650) 723-3710; Fax: (650) 725- 5702. Email: [email protected]
Abstract
This paper seeks to close an empirical gap regarding the motivations, personal attributes and behavioral patterns among free/libre and open source (FLOSS) developers, especially those involved in community-based production, and considers the bearing of its findings on the existing literature and the future directions for research. Respondents to an extensive web-survey’s (FLOSS-US 2003) questions about their reasons for beginning to work FLOSS are classified according to their distinct “motivational profiles” by hierarchical cluster analysis. Over half of them also are matched to projects of known membership sizes, revealing that although some members from each of the clusters are present in the small, medium and large ranges of the distribution of project sizes, the mixing fractions for the large and the very small project ranges are statistically different. Among developers who changed projects, there is a discernable flow from the bottom toward the very small towards to large projects, some of which is motivated by individuals seeking to improve their programming skills. It is found that the profile of early motivation, along with other individual attributes, significantly affects individual developers’ selections of projects from different regions of the size range. Keywords: Open source software, FLOSS projects, community-based peer production, population heterogeneity, micro-motives, motivational profiles, web-cast surveys, hierarchical cluster analysis JEL Code Nos.: J22, L17, L23, L25, L39, P13

1
1. Introduction: Closing a Surprising Gap in Empirical Research on Open Source
There is surprising gap in the present state of empirical knowledge regarding the motivations,
personal attributes and behavioral patterns of those who are engaged in producing free/libre and open
source software (FLOSS). There has been no lack of theoretical conjectures, anecdotal insights from
participant observers and systematic collection and analysis of survey questionnaire data, all directed
toward answering the question “Who are the open source software developers, and why do they do
it?” Much has been learned, yet the resulting collective picture has remained rather blurry, if not
inchoate, especially at the focal point where interest in the question has been strongest and one might
therefore have expected that the resolution would be sharpest. Unarguably, the focal point of the
recent wave of academic research and business interest in “open source” as a movement and a mode
of producing computer programs has centered on the large collaborative development “communities”
that are associated with emblematically successful FLOSS products such as the Linux kernel, Mozilla
(and lately Firefox), KDE, Gnome, FreeBSD, and Python. That interest certainly is warranted, and yet
has not been well served. It remains difficult to extract from the existing research literature an
empirically grounded picture of any sizable portion of the global population that is participating in
one or another of the large, community-based collaborations developing open source software
systems. That is the bothersome ‘gap’, and the surprise is that it has persisted this long and, unlike
other obtrusive gaps, has remained largely unremarked upon.1
1.1 “Minding the gap”: What we don’t know, but need to learn about the participants in the “commons-based peer production” paradigm
The particular lacuna in the literature that concerns us has formed because obtaining suitably
large and appropriately constituted samples of observations on the population of large project
participants turns out to be not such a simple a matter as one might casually assume. The difficulty, in
a nutshell, is that the kind of data which is most straightforward for quantitative researchers to obtain
is not what one really wants if the aim is to understand processes such as skills mobilization, the
coordination of effort, and organizational governance in the context of large community-based
development projects. On the one hand, web-cast surveys have been collecting extensive bodies of
data from self-identified open source developers at large, although it is becoming increasing clear that
many (if not most) of those who regard themselves as open source software developers are not
participants in big collaborative projects, but, instead, are individuals who work independently or in
1 Calling attention to hazardous ‘gaps’ remains a regular public practice – as may be noted at some stops on the London Underground, where passengers boarding the train are cautioned by the loudspeaker system to “Please mind the gap!” between the platform and the cars.

2
very small groups to compose and release programs under one or another “open source” license.2 On
the other hand, numerous small-scale surveys and case studies have successfully examined specific
research issues, such as the strength of ideological vis-à-vis utilitarian or purely pecuniary motives,
the emergence of internal specialization and division of labor, movements of individuals from
contributing to project forum discussions to core development tasks such as algorithm design or the
responsibility of being a maintainer with authority to commit new material or patches to the codebase
of particular modules or “code packages.” These obviously are topics that hold considerable interest,
and so have been studied within the context of particular community-based FLOSS projects. Yet, the
individuals whose behaviors are observed (and whose attitudes and concerns are expressed) in those
contexts may well be self-selected into the specific project on the basis of characteristics, attitudes or
propensities that render them (and their project) idiosyncratic, rather than “typical” or “representative”
of the population that distributes itself among the totality of community-based development efforts;
and a fortiori unrepresentative of developers who choose to work independently, or on very small
projects. It would be necessary to accumulate an appropriately stratified comparative set of such
project studies on the basis of which a meta-analysis of findings might be performed, but, inasmuch as
the need for that has not been perceived, the substantial effort that this would entail has not been
undertaken.
The empirical strategy pursued here addresses these problems by classifying the respondents
to an extensive web-survey (FLOSS-US 2003) according to the approximate membership sizes of the
principal projects on which these individuals were working, thereby permitting separation and
analysis of sub-populations associated with different portions of the distribution of project sizes. Our
analysis introduces a further methodological innovation, designed to capture significant
heterogeneities in motives of the general population of FLOSS developers: hierarchical cluster
analysis is use to extract a set of distinctive “motivational profiles” from the entire web-sample’s
responses to a battery of questions concerning their reasons (Likert-scaled on “importance”) for
beginning to develop FLOSS. This procedure assigns each individual to one or another among the set
of the identified “profiles,” which are interpreted with the aid of normalized motivational intensity
maps. In this way we are able to reveal the existence of some significant differences in the mixtures of
motivational profiles, as well as in the distributions of other individual characteristics among the
participants in community-based projects participants, as contrasted with the mass of developers that
are essentially working independently or in very small projects.
2 Dalle and David (2005, 2006), and Dalle et al. (2005) draw attention to the importance of differentiating between developers in community-based (“C-mode”) production of FLOSS and those working in “I-mode” projects. For evidence of the latter’s numerical importance, see below (Section 4.1).

3
1.2 Why go to the trouble of trying to closing this gap?
The fascination of contemporary social thinkers and social scientists with “open source software”
is quite understandable when one considers the several distinct novelties that were presented by the
growth of the free/libre and open source software movement, and the emergence of large communities
of volunteers engaged in developing computer programs that were made freely available for
downloading. Early contributions to the academic literature on “the open-source phenomenon” were
directed primarily to identifying the motivations underlying the sustained and in many instances
intensive involvement of many people in this non-contractual and unremunerated productive activity.
That issue has been particularly prominent in economists’ and management and organization
scientists’ contributions to the literature. This reflects the view prominent within those branches of
social science that widespread voluntary participation in the creation of commercially valuable goods
which are to be distributed without charge constitutes a quite significant behavioral anomaly. Others,
particularly legal scholars, have been more intrigued with the implications of using novel contractual
terms for licensing intellectual property use for purposes quite different than garnering revenue,
namely assuring open access to future versions of the code built upon current contributions (Benkler
2002, McGowan 2005). Still others, observing these developments from the vantage points of
organizational and political science have focused on the implications of the potentials for wider
implementation of a new organizational paradigm -- initially described by Weber (2004) and
forcefully advocated by Benkler (2006) under the label “commons-based peer production.”
In good measure it is the impressive technical achievements and the communitarian ethos
associated with the mode of software production carried on by the members of large, geographically
distributed projects, and their dependence upon and expression through a particular class of (copyleft)
software licensing terms, that has generated the great interest that the open source movement had
commanded in both popular and scholarly circles. But the picture one draws from the research
literature of the population of FLOSS developers remains disappointingly “blurry”, if not somewhat
inchoate.
One is presented with a widely varying assortment of human motivations for participating in
open source development, ranging from “fun” to “necessity of modifying programs” or “liberating
code” from proprietary vendor’s packages, to improving one’s software skills, or furthering one’s
professional career in the software industry.3 Considerable disagreement persists as to whether
FLOSS code, particularly that produced by the larger, well-known projects is mainly contributed by
volunteers or is being paid for by corporate sponsors, and, correspondingly, whether those projects are
attracting skilled professional programmers, young students who join communities as social contexts
in which to learn about computer software development, or other individuals who are seeking to
3 See, e.g., von Krogh et al. (2003) and the literature discussed below (Section 2).

9
apart from the fact that this task is “doable” and yet has been left not done, there are compelling
reasons for returning to these often discussed topics in the micro-economics and micro-sociology of
FLOSS communities in order to arrive at a more discriminating descriptive study of the human
resources that are engaged in the “open source way of working.” These follow from an
acknowledgement of the potentially important longer-term implications of community-based open
source software development as a “paradigm-shifting” phenomenon, a movement whose
consequences may well beyond those affecting the organizational evolution of the software industry.
1.3. Organization of the paper: a ‘roadmap’ of our procedures and main results
Section 2 describes the main data source upon which the present analysis rests, the 2003
FLOSS-US Survey whose design and descriptive findings were reported by David, Waterman and
Arora (2003). We situate this source (in Section 2.1) among the set of nine surveys carried out before
2005, all but one of which had focused on discovering the characteristics and avowed motives of
contributors to the development of FLOSS, and indicate the particular features of this survey that
rendered it especially suitable for the present purposes. We follow the previous research contributions
in giving special attention to the question of motivation in Section 2.2 discusses the strengths and
limitations of the available information from the FLOSS-US respondents about their reasons for
beginning to develop open source software, and for their choices of the first project and the main
project in which they currently were participating.
Section 3 occupies a major portion of the paper, in which we present a multi-step reanalysis
of the motivations data for the subset of 1459 individuals who supplied complete answers to the
battery of FLOSS-US questions that asked them to assign relative importance of each of 11 suggested
reasons for beginning to contribute to FLOSS development. Contrasts been the character of those
Likert-scaled responses, and the salient reasons for project choice are reviewed in Section 3.1.
Although the attention focused on delineating FLOSS developers’ motivations has encouraged the
projection of a static picture, Section 3.2 takes notice of evidence extracted from surveys that points to
the mutability of motives – in regard to both the reasons for current involvement with FLOSS and the
choices among projects. Not only do motives evolve, but there is reason to view those changes as
interdependent with changes in individual material circumstances and social contexts. This points to
the usefulness for purposes of statistical analysis of explicitly recognizing developer’s stated reasons
for having first become involved with FLOSS development as a lagged endogenous state-variable that
may be treated as a pre-determined “fixed” effect; the advantages of this for econometric studies of
the putative role of motivation in accounting for subsequent behavioral patterns are considerable. In
Section 3.3 we are able to show that the population of self-identified developers at large is
heterogeneous in the “fixed” patterns of its members’ initial motivations for involving themselves in
FLOSS activities. This is done first by adopting a “bootstrap” estimation approach to calculating the

10
variance of individual responses to each of the specific items in the battery of questions about
motivation, re-sampling from the universe of all 1459 responses to show the variations that would
appears in projects of 30, and 100 (randomly drawn) members. Second, factor analysis is applied to
the complete set of Likert-scaled responses, and the resulting factor-loadings are used to generate a
distribution of motivational factor scores, the properties of which can be examined and interpreted.
Having established an empirical basis for treating individual “motivation” as a multi-dimensional
profile, and shown the population of developers at large to be heterogeneous in those “profiles,” we
proceed (in Section 3.4) to group them into distinct “types”, or “motivational profile clusters”. Rather
than trying to chop up the continuous distribution for motivational factor scores, hierarchical
clustering analysis has been applied to the full set of Likert-scaled responses regarding developers’
reasons for beginning to work on FLOSS development. The results, which enable us to assign one of
five mutually exclusive motivational profiles to each of the survey respondents is a significant
advance beyond the present state of the literature, in that it yields quantitative estimates of the
numerical weights of distinct motivational (cluster) types in the population of developers at large.
To aid in the interpretation of the resulting five clusters, we introduce (in Section 3.5) the
device of “normalized motivational intensity maps”, using the distribution of Likert scores to show
the relative intensity of importance assigned to each of the questionnaire’s 11 specific suggested
reasons for becoming involved in FLOSS development. This approach is applied both for the entire
set of survey respondents and for the sub-populations comprising the component clusters, and
presented graphically in intensity maps for each. Rather strikingly, these reveal the main features in
which the motivational profiles represented in those clusters are systematically different from one
another. Lastly, to round out our portraits of those several motivational types, we examine the
available information provided by the written “other reasons” that the survey respondents could
supply as supplements to the way they answered questions which suggested reasons for initially
contributing to FLOSS development and choosing specific projects. The “other reasons” lend
themselves to classification within an extended version of Deci and Ryan’s (1985) “intrinsic-
extrinsic” taxonomic scheme for human motivations, and the distributions of the “other reasons” to
which developers attached importance among those categories for each of the clusters’ members. This
contributes to providing a richer, more nuanced interpretation of the ‘caricatures’ we present of these
distinctive motivational profiles. The portraits of each clusters’ membership then are rounded out with
descriptive statistics of demographic and occupational variables elicited by the FLOSS-US survey,
which reveal that some significant variations exist among them also in those objective dimensions.
Section 4 connects the micro-level data pertaining to individual developers with information
about the projects with which they cay be associated. The discussion starts with a brief description of
the methods used in locating the FLOSS-US survey respondents in projects whose position in the
contemporaneous distribution of project sizes can be obtained, thereby assigning some 847 of the
1459 FLOSS-US survey respondents to three domains within the project size distribution: those at the

11
extreme lower end, having 1 or 2 members (which we associate with I-mode production), those at the
opposite extreme having 30 members or more (which we take to represent “large” project engaged in
C-mode production of FLOSS), and the those in the intervening “middle” range from 3 to 29
members. Consistent with the known skew of the SourceForge project size distribution, fully half of
this linked sample of survey respondents are found to have been engaged at the low end of the project
size distribution, whereas approximately 20 percent were associated with projects at the upper end of
the distribution.
With the project-linked survey respondents partitioned among these three size ranges, Section
4.1 examines the association between project size and patterns of motivation in these sub-populations,
using the information from the distribution of motivational factor scores, and the device of
motivation-intensity maps to identify differences in this respect between FLOSS developers who were
working in I-mode and those in C-mode projects. The question of the extent and directionality of the
circulation of developers among projects, and specifically the degree which such movements occur
across the boundaries that we defined (rather than being largely confined with the respective strata of
small, medium and large projects) is examined in Section 4.2. This analysis makes use of the data
from the FLOSS-US survey’s questions about the respondents’ initial and current projects in those
cases where the two were different.
Section 5 brings together the preceding findings about the characteristics of the FLOSS
developers in the different motivational clusters, on the one hand, and the distribution of those
motivational types across the small, medium and large projects, on the other hand. This integration
proceeds in two main steps. We look first (in Section 5.1) at the issue of whether the mixture of
motivational factors of the developer populations is much the same or exhibits distinct differences as
one moves across the range of their project sizes. Then the descriptive statistics of developers at the
upper and lower extrema of the project size distribution are compared to identify whether there are
significant statistical differences between those contributing to FLOSS production in C-mode and
those who are working in I-mode. This analysis examines demographic, occupational and experience
characteristics, as well as the variation of expected proportions of motivational types and motivational
intensities across the range from the large to the very small projects.
A further (second) step in the analysis (in Section 5.2) asks whether the initial motivations of
developers and their objective characteristics have significant predictive power on the choices made
by FLOSS developers regarding the sizes of the main projects to which they contribute. For this
purpose we estimate an ordered probit regression model, whose independent variables include
experience in FLOSS, age upon first developing FLOSS, occupational status, earnings from FLOSS,
expected future job roles, country of residence, and educational attainment.
The paper concludes (in Section 6) by recapitulating the main empirical findings and
considers briefly some of their implications for future research on the interplay between individual

12
motivations, organizational practices and institutional structures in the mobilization and coordination
of resources, and the governance of community-based production of open source software.
2. Data from other studies and from the present paper
The basic dataset on which our analysis in this paper rests is drawn from the responses to the
2003 FLOSS-US web-cast survey (conducted between January and June 2003) that elicited a total of
1,587 valid responses from open source software developers.15 The online survey asked 46 questions
about developers’ demographic characteristics, education, occupational status, software experience,
reasons for participating in FLOSS development, open source project roles and contributions,
remuneration, and other topics. Respondents learned about the survey from advertisements posted on
50 websites and mailing lists in many countries. Hence these data do not represent a probabilistic
sample of all FLOSS developers. Other data on FLOSS developers use a similar voluntary sample,
whether gathered from web posting of a questionnaire (e.g., Ghosh et al. 2002), or from responses to
targeted e-mailing of a questionnaire in the case of the Boston Consulting Group’s “Hacker Survey”
(Lakhani et al., 2002; Lakhani and Wolf, 2005).
Several advantages of working with the FLOSS-US data in the present connection may be
noted briefly at the outset. First, although the number of observations is smaller than those available
from the FLOSS-EU, it is still quite ample and the geographical balance between Europe and North
American respondents is more representative of the global population.16 Secondly, while responses to
the same array of suggested reasons for beginning to contribute to open source software development
are available from both surveys (by design), those from the FLOSS-US survey are Likert-scaled.
Thirdly, the self-selected sample elicited by the web-cast survey method is likely to yield a more
representative sample of the global population, particular in the relative balance between participants
to very small and large projects, in comparison with the BCG approach, which targeted individuals in
the e-mail lists of established projects. Lastly, the timing of the FLOSS-US survey in 2003 coincides
with the coverage of a documented database of all the projects in the SourceForge archive, from
which it was convenient to obtain project size information that could be linked to the files for more
15 David, Waterman, and Arora (2003) provide a detailed description of the survey methods (including the web-postings and non-English translations of the request for cooperation) and the basic statistical findings. The present study is a reanalysis of the FLOSS-US dataset, which has selected the subset of respondents who provided complete answers to questions regarding their motivations for beginning to contribute to open source software development. 16 SourceForge.Net contains perhaps the web’s largest repository of open source projects, and comparing the geographical location of FLOSS-US respondents against the more than a million registrants on SourceForge in 2006 (as estimated by Robles and Gonzalas-Barahona [this Issue]) provides some idea of the extent to which the FLOSS-US represents the larger universe of developers (see also Robles et al., 2006). The comparison we have made of the regions of residence of the two populations shows a reassuringly close correspondence, although because the SF.Net population is very large, the proportions are precisely estimated and the differences between the two are statistically significant. These statistics are not shown here due to space constraints, but may be obtained privately from the authors.

13
than half of the individual survey respondents – particularly those who reported themselves engaged
principally in projects that were discovered to fall into the very small and medium size-ranges.
Since the true universe of FLOSS developers has dynamic size and lacks clear definition, it is
not possible to strictly examine the representative-ness of any sample, even one that is quite large; an
on-line survey such as FLOSS-US cannot even report a defined response rate.17 Nevertheless, it is
important to set this data source in the context of other studies conducted in roughly the same time
period, namely the opening quinquenium of the present century, and to establish that if we cannot say
whether or not it is representative of the global FLOSS developer population, it is reassuring that the
FLOSS-US respondents collectively resemble those described by other survey-based studies of that
population in respect to a number of their basic characteristics.
2.1 The FLOSS-US Survey in Context
At least eight other empirical analyses have surveyed FLOSS developers during the period up
to 2005, almost all of which had among their goals a clearer understanding these developers’ motives.
One may group these surveys into the three categories summarized in Table 1: four of the studies
prepared an online survey to which developers were invited to respond (Robles et al. 2001; Ghosh et
al. 2002; David, Waterman, and Arora 2003; Mitsubishi 2004)18; three surveys involved contacting
developers whose emails were obtained from online code repositories, achieving response rates from
8 to 34 percent, and gaining between 79 and 684 respondents (Lakhani et al., 2002; Lakhani and Wolf
2005; Hars and Ou, 2002 and Haruvy, Wu, and Chakravarty 2003); and two surveys, each of which
obtained a few hundred responses, were conducted by emailing questionnaires to participants in a
single large project (Lakhani and von Hippel 2002 on Apache, and Hertel, Nieder, and Herrman 2003
on the Linux kernel).
Table 1 about here
The heterogeneous methods, unequal sample universes, different survey dates, diverse
phrasing of questions and answer choices, and varied selection biases due to low response rates across
these studies, all allow one to reasonably question their comparability. Nonetheless, comparing the
demographics of their respondents gives some idea of their consistency. Several studies’ lack of
reporting of standard deviations makes it difficult to know the statistical significance of differences 17 Although one might infer that FLOSS-US developers had a greater proclivity to participate in a survey than was the case among the developers that are not represented among the responses, this is not edifying, and even that conclusion must be qualified by the observation that not all those who might have wished to respond actually became aware of the survey before it was closed. 18 The 2003 FLOSS-US survey, as a described by David, Waterman and Arora (2003), repeated an number of basic questions in the same form in which they appeared in the 2002 FLOSS-EU survey of developers designed by Ghosh et al. (2002) The survey conducted by Mitsubishi (2004) followed suit, especially repeating the motivational questions of the two previous surveys.

14
between surveys, but for some of the demographic variables the mean values across these surveys are
very similar. The mean ages of the developers in these samples are quite tightly clustered between 27
and 30 years; between 95 and 99 percent of respondents are male, and the respondent sub-populations
have mean durations of FLOSS experience in the range from 4.1 to 5.3 years.19
Other demographics vary widely among these surveys. The portion of survey respondents
from North America ranges from 1 percent in Mitsubishi (2004), a study focusing on Asian
developers, to 48 percent in Hertel, Nieder, and Herrman (2003), a study focusing on Linux. Between
14 and 32 percent of respondents are students, and between 4 and 11 percent are not employed. In
Robles et al. (2001), the survey yielding the largest sample, 15 percent of the respondents had a
graduate degree,20 whereas the corresponding figure is 43 percent for the respondents to the FLOSS-
US (as reported by David, Waterman, and Arora, 2003).
As has been noted (in the discussion of Section 1.1) these empirical studies collectively
emphasize an assortment of motives for FLOSS contributors. Almost all included questions seeking to
elicit information on the relevance of a variety of suggested reasons for participating in FLOSS,
Robles et al. (2001), which focused on software engineering questions, being the exception in that
regard. The FLOSS-EU survey allowed developers to choose up to 4 from 14 listed reasons for
joining a FLOSS community, and to choose another four reasons for staying in the FLOSS
community, and Ghosh et al. (2002) report that the two dominant motivations were focused on human
capital formation: “sharing knowledge and skills” and “learning and developing new skills” were
mentioned twice as frequently as any of the other listed reasons. The least frequently cited motives
were making money, gaining reputation, and distributing non-marketable software. Similar results
arose from a question on the expectations held by respondent regarding the motivations of others in
the FLOSS movement. The FLOSS-US survey instrument included one battery of questions (in Q 4)
about the respondent’s reasons for first developing FLOSS, and a second question (Q12) asks for the
respondent’s reasons for selection to work on a particular FLOSS project. Many respondents wrote in
other reasons, but the reasons indicated as having been important in motivating initial involvement in
FLOSS development are reported (by David, Waterman, and Arora, 2003) to be rather differently
focused than those found from the FLOSS-EU data: the preponderant responses were strongly
normative, emphasizing the ideology of “libre” software and a communitarian ethos (“we should be
free to modify software we use,” and wanting “to give something back to the community”). This
presented a contrast with the tenor of the reasons stated for having selected one’s main project, which
19 It may be noted that all these surveys also concur in not having obtained any responses from FLOSS developers located on the continent of Africa -- probably as much a reflection of the surveyors’ limited access to websites and email lists there than of anything else, although even in 2006, as Gonzales-Barahona et al report [this Issue), the Africa’s proportion of the global FLOSS developer population remains quite small. 20 Robles et al. (2001) was a short survey aimed at programmers and software engineers, and which did not explore motivations but asked only technical questions. The difference in focus between this and other surveys may partly explain the higher educational attainment in FLOSS-US and others vis-à-vis Robles et al. (2001).

15
were more instrumental and ego-oriented (“it was technically interesting” and the “software . . . would
be useful to me”).
Among the surveys with defined sample universes, the Boston Consulting Group study
(Lakhani et al.,2002) similarly permitted respondents to indicate their agreement with various
proposed motives for developing FLOSS. The dominant reasons included intellectual stimulation and
improvement of skills, whereas the least common motivations were the requirement of a license, and
the goal of “beating” proprietary software. Hars and Ou (2002) found that 70 percent of respondents
identified improvement of programming skills as a dominant motivation, 52 percent stressed the value
of a peer network, and 39 percent cited their need to use or modify the software in question. Haruvy,
Wu, and Chakravarty (2003) had developers choose items from a 7-point Likert scale, and report that
“[q]uite a few respondents sent emails expressing indignation at survey items which suggested [that]
monetary items could possibly motivate their contributions to open source projects” (p. 21). They
convert these responses into scalar intensity values for selfish and non-selfish motives, and find a
modal unselfish-to-selfish ratio of 1.25.
The two surveys in Table 1 that studied the developers participating in a large project identify
additional motives. Lakhani and von Hippel (2002) explain that Apache developers devote time to the
mundane task of reading and answering user queries because such activities help the developers
improve their own code and websites, and they suggest that such direct rewards may supersede
altruism or direct enjoyment of work as motivations for FLOSS development.21 Hertel, Nieder, and
Herrmann (2003) derive seven factors from principal component analysis on motivational questions,
which they interpret as follows (i) identification as a Linux user, (ii) identification as a Linux
developer, (iii) desire to improve a developer’s own software and career prospects, (iv) positive
expected reactions of friends and family, (v) ideological motives regarding FLOSS, (vi) enjoyment of
programming, and, as a counter-motive (vii) expenditure of time on FLOSS programming. While this
study identifies multiple motives for developers, like many others, it does not emphasize
heterogeneity of motivation within the population of developers. Thus, the survey respondents might
reflect the existence of several groups each distinguished by a unique motivation, or a homogeneous
population of developers, each of whom has multiple motivations. To fully understand the
motivations of FLOSS developers, however, requires an effort to distinguish empirically between
those two interpretive possibilities – which is the main task that will occupy us in the next section.
2.2 Problems of bias and noise in data about individual motivations
We proceed with the caveat that our data, being generated in response to a web-cast survey,
21 This interpretation represents an extension of von Hippel’s user-innovator model which figures as the guiding framework for empirical research in other studies, including, more recently, those focused upon open source software production. See von Hippel (1988, 2002); Morrison, Roberts, and von Hippel (2000); and Henkel and von Hippel (2004).

16
pertains to a self-selected population’s reported characteristics, perceptions and expressed reasons for
(some of) their actions. Further, our use of the information supplied by developers in response to
questions posed by the FLOSS-US survey about their reasons for beginning to participate in open
source development, and their choice of particular projects on which to focus their contributions adds
some special sources for concern. But it seems quite unavoidable in the circumstances, even though
economists typically are inclined not to accord much weight to the personal testimony that economic
actors might offer regarding the subjective beliefs or reasons for their behaviors.22
No incentive in the structure or implementation of the FLOSS-US survey would have
encouraged developers to misrepresent their motives in replying to the anonymous on-line
questionnaire, and developers’ stated reasons for their participation should not be dismissed in favor
of essentially a aprioristic speculations guided by psychology, or sociology or economics. But a
measure of skepticism and considerable caution nevertheless is warranted in working with these
micro-data on expressed motivations. Developers may generate beliefs and statements about their
“values” to satisfy their suppositions about what survey-takers will regard to be appropriate; or, for
reasons of cognitive dissonance, they may offer statements about their perceptions or goals that have
the effect of rendering the their own behaviors more readily rationalized and consistent. 23 Errors in
measurement in stated reasons may therefore be correlated with other, objective observations on
behavior, and so may give rise to biased regression estimates when the forms of data are used in
conjunctions with one another.
In view of the interest of this study in learning whether the attributes of the developers who
contribute to community production in large projects are different from those who are drawn to
projects in the lower range of the size distribution, it is natural to worry that the reporting of
motivations might be distorted in some way that was related to choices of project size. If such
relationships do exist, not all of them seem as transparent and straightforward as the connection
between being motivated to learn to be a better programmer by observing and interacting with others,
and choosing not to develop software independently; or to reverse the causation, finding opportunities
for skills development in the FLOSS large project that one had joined out of curiosity to be a
important “reason” for participating in the open source movement. To illustrate the point that the
motivation-size connections are multi-valent, consider one of the most widely discussed of the early
“economic” explanations offered for the puzzle of the “open source software movement” by Lerner
and Tirole (2002), who suggested that software developers might volunteer their efforts without
requiring immediate compensation because the open setting of FLOSS projects permitted career-
seeking algorithm designers and programmers to openly exhibit their technical expertise; by sharing
22 Rather than asking individuals about the motives and intentions that led them to make one choice rather than another, the modern theory of demand instructs us that it is better to proceed by observing how behaviors change when constraints are altered, and interpreting the outcomes as reflecting “revealed preferences.” 23 Bertrand and Mullainathan (2001), who review literature on the usefulness of subjectively reported beliefs.

17
the fruits of their knowledge, they might more readily build a reputation that would widely “signal”
their expert capabilities to potential employers. 24 A different argument that similarly involved an
instrumental or extrinsic purpose, has come from the management and innovation studies side25:
developing and freely sharing open source software could be a form of innovative investment that
allowed those undertaking it to better satisfy their own particular human wants, by developing a new
artifact that would meet its creator’s need more satisfactorily than any of those that were already
available. The latter explanation therefore “naturalized” open-source software developers as simply
one among a larger class of “user-innovators” who looked forward to benefitting directly from the
“own use-value” of the customized programs they were creating or modifying so as to better meet
their personal use requirements.
Neither of the foregoing depictions of what is motivating FLOSS developers would seem to
carry any clear and compelling implications regarding the size of the projects that people thus
motivated would chose to join. Fleshing out the specifics of these “reasons” a bit further, however,
points to different considerations that could favor either large project or small project participation.
Opportunities to generate direct financial benefits are likely to be more certain in the case of
programmers who were owners or partners in a software services enterprise, and thus could work
essentially independently, or on small projects to adapt or modify existing open source programs, or
develop new ones for clients with idiosyncratic needs. The prospects of commercial success in each
of such endeavors are likely to be closely circumscribed by the market competition of others with
similar skills, whereas both the expectation and the up-side variance in the “payoffs” from
successfully initiating and leading a large project would tend to be considerable bigger by
comparison. On that argument, the motivation of “signaling” one’s software expertise, suggested by
Lerner and Tirole (2002) would seem more immediately pertinent in the case of developers who
choose to contribute to large open source software projects, especially as displaying extraordinary
technical abilities in that arena would make them more widely visible and elicit expressions of peer-
esteem that attracted the attention of potential employers. But, except for the exceptional few, the
expected pecuniary rewards of winning that sort of reputational tournament may well be dominated
24 See Lerner and Tirole (2002), whose influential paper asked (p.98): “Why would thousands of top-notch programmers contribute freely to the provision of a public good?” Their suggestion that there was a reputation-building advantage to making prominent contributions to a large and successful open source project echoed the point made by Dasgupta and David (1994), concerning the “signaling value” for young researchers of initially accepting academic “open science” appointments, even though they contemplate eventual employments in corporate proprietary R&D labs. 25 See, e.g., von Hippel (2002) for the initial reflexive extension of his previous research on user-innovators (von Hippel 1988) to both “explain” open-source software development, and broaden the significance of user-driven innovation. Hars and Ou (2002) added empirical support to this line of explanation, emphasizing the value placed by survey respondents on “own use” of their contributions to open source code, and reported finding positive correlation between high values accorded to this reason for participating in FLOSS development and greater reported weekly hours of work. Lakhani and von Hippel (2002) suggested “own-use” motives might be especially important for developers carrying out ordinary, unchallenging programming tasks.

18
by the opportunities to create a small software service business. Materialistic and rational
“explanations” in that case might actually be masking “reasons” that involve ego-gratification and the
quest for peer esteem as an end in itself.
3. Analysis of Survey Data on Motives for Engaging in FLOSS Development
The FLOSS-US survey included two sets of questions about the motives of developers. The
first of these (Q4) asks the importance of several motivations in the respondent’s decision to first
develop FLOSS. Respondents choose from a four-option Likert scale (very important, important, a bit
important, or not important) for each of 11 listed motivations. (These are displayed in Fig.1a, below.)
While FLOSS-US presented sub-parts of Q4 in alphabetical order, denoting the questionnaire items
by letters a through k, the chart in Fig. 1a re-orders these questions and the distribution of Likert-
scaled response to each in a sequence starting with intense expressions of ideological that can be read
as serving to identify (or self-identify) the respondent with the ethos and values of the “open source
movement,” or with a particular community of FLOSS developers. The ordering of responses
proceeds downwards toward responses that place greater and greater emphasis on pragmatic and
technical reasons.
Figure 1a about here
Some measure of instability or endogenous formation of motivations is afforded by the
second survey question (Q12), which asks why developers chose to participate in a particular project,
and allow for the possibility of reasons that would different in case of the respondents’ current project
from those that governed this choice in the case of the first project. The suggested options for answers
to Q12 are shown in Figure 1b, but (unlike Q4) this question did not ask for Likert-scaled responses.)
While Q4 invites articulation of general expressions of interest and values, Q12 captures decisions at
the margin—given a developer’s reason for developing FLOSS: What pushed the individual to select
that particular project over alternatives? Again the chart presents sub-parts of Q12 in descending
order, from social and community-oriented to technical. FLOSS-US obtained Q12 responses
separately for a respondent’s current or most recent project (for exposition, we subsequently call this
the “current” project) and for a respondent’s first project.26
Figure 1b about here
Overall, pecuniary and direct career motives have comparative small importance among the
reasons listed in Q4 for beginning their participation, and direct business sponsorship is infrequent:
only 7 percent say that their employers’ having directed them to collaborate in open source
26 Our analysis generally makes use of Q12 results for both the first and the principle recent or current projects, as will be seen, but in a few cases only the current project data are used.

19
development work was very important or important in their initial involvements.27 Commitment to the
FLOSS ethos, by contrast, has notable prominence: 68 to 79 percent list positive ideological reasons
(Q4a,b,e) as being either very important or important, whereas only 52 percent assigned that measure
of importance to the negative element of the FLOSS movement’s anti-proprietary software stance
(Q4f). Whereas the proportion declaring freedom “to modify software we use” (Q4b) to be
unimportant just approaches 7 percent, the proportions that felt the same way regarding their actual
“need” to modify existing software, or to fix bugs in existing software was almost three time larger
(20 and 22 percent, respectively). The motivation to become a better programmer (Q4h) was assigned
the top two degrees of importance by just over 68 percent of the respondents, and matched the joining
FLOSS activities because they constituted “the best way for software to be developed” (Q4a) in
assigned importance. Pragmatic interests in learning how particular programs worked, and interacting
with like-minded programmers held somewhat less power as a motivation for initial involvement in
FLOSS, with 55-59 percent scoring those reasons as important or very important. It may be remarked
that the FLOSS-EU and the FLOSS-US data both show that ideological and pragmatic reasons each
have important roles in inducing programmers’ to embark upon open source software development,
whereas only for very small minorities do direct career considerations and employer sponsorship
appear to figure importantly in that regard. The FLOSS-US survey sample, which drew about half its
members from Western Europe -- compared with the 70 percent share that the latter region held in the
FLOSS-EU sample population -- shows greater importance being assigned to ideological motivations,
whereas it is the pragmatic aspects of open source code development that are cited with greater
relative frequently as important reasons. 28
While respondents often emphasize ideological motives for first developing FLOSS, they
give greater emphasis to practical reasons for choosing a particular project. From Figure 1b it is seen
that fewer than half of developers listed a project’s importance and visibility as reasons for joining it,
while about two-thirds mentioned their chosen project’s technical appeal, and nearly 80 percent
expected that the software would be personally useful. There were only small differences between
respondents’ motives for choosing their current and first projects. For example, 61 percent of
27 It will be seen by inspection of Figure 1a that the sum “very important” and “important” responses varies directly with the former of the two components, so giving the sum in the text is not misleading in indicating differences in relative importance attached to the prompted reasons. 28 Since the FLOSS-US 2003 Surveys included questions on motivation that were very similar (by design) to those posed in the FLOSS-EU 2002, a merged FLOSS-EU and FLOSS-US dataset could be created by R. Glott and A. Waterman, using responses from 4,402 respondents to very similarly worded questions regarding their reasons for participating in FLOSS development. This yielded counts of positive responses to the six principal motivations noted in the text. Over half of respondents emphasized their desires to improve programming skills, while only 43 percent emphasized the value of “sharing knowledge and contributing to community.” Still fewer – only 30 percent – emphasized the value of providing alternatives to proprietary software, and only a fourth valued the experience of participating in community. The percentages cited refer to the proportion of all respondents who had either listed the motivation in question on their answers to the FLOSS-EU questionnaire, or marked the Likert-scale to indicate that reason as “very important” when answering the FLOSS-US questionnaire. Further analysis of this dataset is the subject of a future paper.

20
respondents chose their first project out of technical interest, while 69 percent of respondents chose
their current project for its technical interest. The stability of the distribution of answers relating the
respondent’s first project and current project is attributable in good part, although not wholly, to the
fact that for more than a third of the sample their current project is also their first project.29 Moreover,
the distributions of the aggregated responses to the suggested reasons for project selection (in Q12)
can mask shifts in such considerations that occur with the passage of time and accumulation of
experience in the case of those developers whose main current project differed from their first project.
To see this mutability of “motivations-at-the-margin” it is necessary to shift our analysis of the data to
the micro-level, where the heterogeneity of the pattern of individual motives also will come into view.
3.2 Mutable motives and “fixed effects”
In the analysis of the evidence on individual level patterns of motivation that will be
described later in this section we proceed by treating the reported reasons for beginning to contribute
to open source (from Q4) as a comparable “fixed effect”, inasmuch as it reports the state of all the
respondents at a comparable point in their experience with the activity. Motives (being reasons given
to having done something) may be shaped by experience, and hence re-shaped by learning and
reflection; expressed reasons may well be colored by social contexts and situational norms, which are
subject to change. Further, inasmuch as the FLOSS-US survey sought retrospective reports on
developers’ motives for first involving themselves in FLOSS production activities, it is legitimate to
treat our observations on this multi-dimensional lagged variable as an exogenous “fixed effect” – even
if it is acknowledged that current motivations may be endogenous and co-evolving with other variates
describing the developer’s employment status and roles, capabilities, perceptions, goals.30
There is some evidence to support taking developers’ reasons for their initial FLOSS
engagement to be lagged endogenous variables (and hence predetermined for purposes of further
analyzing the currently observed behaviors of those actors). The data comes from comparing results
29 Within the subset of FLOSS-US respondents for whom the membership sizes of their project(s) could be established, it is seen from Table 9 (in Section 4.2) that the proportion having identical first and current projects was higher than this, at 0.36. But this reflects the greater ease of identifying and establishing the project sizes if both the first and the current projects when the individual list the same project under each heading. 30 It may be important to emphasize that the conceptual of a motivational factor-score, as it is used here, applies to a past state of the individual; that Figure 2 therefore depicts the distribution of past motivational states (all relating to a comparable event, their initiation into the world of open source). The same point applies to the related concept of individual “motivational profiles” that will be introduced operationally by employing cluster analysis methods in Section 3.4, below. Whether one’s recollected frame of mind at a past point in time, and in one’s personal history, exerts any causal influence on one’s current beliefs and actions is an empirical question. It could be reframed as an hypothesis, but to test it one would need first to be able to distinguish been the effect of a past mental state that was no longer operative, and the actual recurrence of the same mental state. The retrospective character of the underlying data adds another issue, namely whether errors in the recollection of a person’s past motivating concerns are independently distributed, or induced by changing circumstances that would render them correlated with individual current characteristics and external situation. This is territory into which we have no intention of venturing econometrically on this occasion.

21
obtained from the within-survey repetition of two sorts of motivational questions. Because the design
of the 2002 FLOSS-EU survey used the same set of suggested answers about their reasons for starting
and for continuing to contribute to FLOSS, Ghosh and Glott (2005) report that comparison of the two
patterns of motivations that they obtain by application of cluster analysis to this data exhibits a very
substantial transformation: the distribution obtained for the initial event (from retrospection
observations) found almost half of the of the 2784 respondents grouped in a single large cluster whose
reasons were so diffuse that they defied characterization, leaving the remainder more-or-less evenly
distributed among 5 clusters (the 4 larger ones being labeled “ideologists”, “materialists”,
“recognition seekers,” “software improvers”).31 The prominent reasons for “continuing” to contribute,
which presumably refer to the respondents’ current states at the time of the survey, an average of 4.1
years later, were reduced to a list of 4 clusters from which the “materialist” label disappeared (along
with a small group previously caricatured as “enthusiasts”). The relative numbers of those clustered
under the heading “ideologists” was almost doubled, and “skill improvers” not only emerged but
became the dominant cluster.32
These findings suggest the reasons that are expressed for continuing to contribute not only are
mutable, but should be viewed as being endogenously formed by the experience of participation
itself.33 Taken in conjunction with the Rullani’s (2007) work on the influence of social
communications with other developers in conditioning developers’ behaviors with regard to project-
founding on Source Forge, such evidence should at very least raise doubts about econometric studies
that include currently expressed motivation among the (presumed exogenous) regressors in models
purporting to explain variations in micro-level measures of the nature and extent work effort
contributed by FLOSS developers (see, e.g., Lakhani and Wolf, 2005, and other small sample studies
discussed by von Krogh et al. 2008).
Further support of the apparent mutability of the reasons people offer for their involvement
involved in FLOSS activities is provided by the FLOSS-US data on developers’ reasons for the choice 31 The clustering algorithm used by Ghosh and Glott (2005) assigned 50.0 percent of the sample to these the four roughly equal motivational clusters for “starting” that are named in the text, and the remaining 46.3 percent in the “diffuse” motives group. The clusters for “continuing” were reduced to 4 from 6, and by the elimination of the “diffuse” and “materialist” categories, along with the small cluster of “enthusiasts”, and the inflow of individuals into the clusters now labeled “skills improvers” (which emerged as the latest cluster), “ideologists” (next largest in relative size) and “software improvers.” These three clusters then accounted for 88 percent of the sample. 32 Table 1 give this as the mean duration of FLOSS experience from the FLOSS-EU survey respondents, “experience” being calculated as the difference between the date of the survey and that of started to work on FLOSS. . 33 Rullani’s (2007) econometric analysis of micro-level data from SourceForge finds that there are significant positive effects upon project-launching probabilities of the extent of the developer’s social communications interaction experience with others who are active in that open source collaboration environment. Although von Krogh et al. (2008), p. 20 interpret these findings as supporting the general notion that “learning” in peripheral activities promoted increasing levels of participation, Rullani’s discussion is cast more in terms of positive socialization experiences acting to reinforce the individual’s commitment to the common purpose of creating open source software.

22
of a specific project Q4. As has already been noted, the character of the reasons supplied by FLOSS-
US respondents to the latter questions (in question-set Q12) is quite different, and generally more
immediately practical in nature than those indicated as motivating their participation in unspecified
open source activities. But the point of interest here is that the considerations affecting marginal, or
differential choices – “motivations for actions at the margin”, as they are described by Dalle and
David (2005) – show significant inter-temporal consistency and do not appear to evolve as the
individual acquires experience in the pursuit.
It is possible to use the responses to a different motivational question in the FLOSS-US
survey to examine whether and how individual developers’ motives change over time, in regard to the
choice of their main open source project. The respondents provided two sets of reasons for choosing
specific FLOSS projects – one set for their choice of a beginning (first) project and the other set for
their subsequent choice of their principal current project, so that the comparison of these reasons in
Table 2 provides some indication of the inter-temporal stability of developers’ expressed motives.34
As is seen from Panel A, the distribution of responses to the prompted set of reasons show substantial
differences between the first and the current project. Even though there is a weak degree of
persistence, which is visible when one reads down the columns, a Pearson chi-squared test cannot
reject the hypothesis that the two sets of responses are statistically independent.
Table 2 about here
The lower panel (B) of Table 2 examines the “other reasons” (an optional and non-exclusive
supplement to the respondents’ answers to Q12’s prompted reasons) that were supplied, but in this
case only one “other reason” is recorded for the individual that took up this option.35 Across
motivations, developers listing practical motivations showed slightly more stability than developers
listing instrumental or social motivations. For example, 73 percent of developers who chose their
current project because its “software would be useful” listed the same motivation for choice of first
project, and 59 percent of developers who chose their current project because it was “technically
interesting” listed the same motivation for choice of first project. By contrast, less than half of
developers who listed instrumental (“important and visible project”) or social motivations (“knew
people working on it”) for their current project listed the same reason for choosing their first project.
34 A respondent was able to indicate multiple reasons for choosing the first project and, similarly, multiple reasons for choosing the current project; so, in Panel A of Table 2 the frequencies of responses in the columns and rows reflect the multiple reasons provided by individual respondents. 35 In Panel B of Table 2, as the Notes explain, only one ‘other reason” is recorded for each of the respondents that exercised the “write-in option” on Q12. With the exception of those supplying instrumental reasons of a “practical” or utilitarian kind (see the elaborated classification Table 6a and 6b), those supplying an other reason for choosing their first project represented the majority of those who also supplied another reason for their current project choice. The elaboration of various “practical reasons” prompted by Q12 may account for the exception to this general pattern.

23
This emerges from Table 2 when one compares the frequency distribution of responses to the
promoted “reasons” (in Q12) for selecting the developer’s first FLOSS project with those supplied
when asked the same questions in regard to their primary current project. Reading down the columns
in the upper panel (A) of the table, it is seen that the proportions entered in the cells along the
principal diagonal of the matrix (boldfaced) are in every instance essentially as large as, or greater
than those appearing in the column’s other cells, but the positive association is not statistically
significant. The lower panel (B) repeats the analysis for the “other reasons” offered to this pair of
questions, with a stronger, significant result: the “motives at the margin” for the selection of a first
project tend to recur in regard to the individual’s choice of a subsequent project.
3.3. The heterogeneity of developer’ motivations
Descriptive statistics of the kind presented by Figures 1a and 1b show that multiple
motivations characterize the whole population of FLOSS developers, but they do not disclose whether
the array of motives are widely shared, and whether, if that is not the case, there are different groups
within the whole that are characterized by distinctive motivational patterns. When one looks at survey
data about the distribution of motives that developers offer for participating in FLOSS activities, or
for selecting a particular project in which to work, it is temping to form a picture of a representative
individual who harbors these varied reasons for their actions. In doing so, one is implicitly weighing
the several dimensions of motivation according to the relative frequency with which they occur
among the reasons expressed by members of survey populations. That is a facile conceptual
simplification which is usually recognized to be without empirical warrant. It is nonetheless appealing
because some further analysis at the micro-level would be required to discern and measure just how
different the individual members of the population are from one another in their motivations, and in
their behaviors. Consequently an effort to establish that such heterogeneity is present and to quantify
its extent may yield an important step toward more appropriate analytical modeling. as well as in
providing the means to better understand the diversity of individual actors’ goals, capabilities, norms
and strategies whose interplay produces the social and institutional structures that emerge in FLOSS
communities and affect the performance of specific projects.
3.2.1. Quantifying the heterogeneity of micro-motives: bootstrapping
We employ two approaches to delineating the heterogeneity of developers’ motivations at the
micro-level. The first mimics what would be found among the members of a project who had been
randomly recruited, a counterfactual presupposition that is useful in exhibiting the variability of the
distribution of motives. A Monte Carlo approach can be employed to obtain estimated sample means
and standard deviations for a simple measure of the importance of each of the specified motivations
suggested by Q4 and Q12 of the FLOSS-US survey. This entails re-sampling from the entire survey
population that provided complete responses to those question, first drawing replicated samples of 30

24
developers, and then of 100 developers by random sampling with replacement. 36 Coding each
individual response that scored the suggested reason to be “very important” as 1, as 0 otherwise, the
sample mean motivation variable for each questions is a proportion. Consequently, the standard error
of the proportion found from the re-sampling of developers who listed that particular reason as being
very important is a deterministic function of the overall portion of developers who gave that (certain)
answer. The bootstrapped standard errors nevertheless provide us with some estimate of the
heterogeneity in the population from which the random samples were drawn.
To interpret these estimates, one may imagine that the set of estimates mimics the variability
in the motives of participants that were mobilized to work on a FLOSS project by a process of random
attachment. The variances around the means of the proportions of members who regarded the
suggested motives in this array to be very important are decreasing functions of the size of the project
created by random draws from the population. Therefore it is pertinent to note that the generated
sample sizes (ranging from 30 to 100) span the part of the project group membership size distribution
that contained almost all of the large and well-established projects that Source Forge hosted during the
years 2001-2003. The standard error across these samples is small but nonzero, as may be seen from
Table 3.
Table 3 about here
But these bootstrapped estimates reveal substantial heterogeneity: a 95 percent confidence
interval, for example, suggests that if a project has 30 developers, anywhere between 16 and 48
percent of those developers will claim that a very important reason for their developing FLOSS is that
FLOSS is that it is the “best way for software to be developed.” Similarly, a project leader can know
with 95 percent confidence that between 25 and 61 percent of developers in a project of 30 people – a
fairly wide range – will hold their desire to “give back to the community” to be “very important” in
motivating their contributions to developing FLOSS. It remains the case that only a small proportion
of such “random recruits” would have been asked to cooperate with the project by an employer: the
95 percent confidence interval around the mean proportion for whom this reason is very important in
motivating their participation would range from nil to 9 percent.
3.2.2. Quantifying the heterogeneity of micro-motives: factor scores
The second approach to describing heterogeneity of motives uses factor analysis to derive a
single motivational factor for every respondent, and then constructs the distribution of this factor-
score over the whole survey population. Although motivations at the individual level are certainly
multi-dimensional (or vector-valued), it is convenient to try to form a scalar measure of the
individual’s expressed motivations, simply in order to reduce the problem of quantifying its
36 The computations were performed with Stata’s Bootstrap: see http://www.stata.com/help.cgi?bootstrap. Setting the replication level at 200 is generally found to be fully adequate for estimates comparable with the distributions of normal variate.

25
variability among the individuals in the population. We can do this by first applying factor analysis to
the 1459 individual survey responses to Q4’s that underlie the distributions (seen in Table 1a) of the
reasons FLOSS-US developers offered for beginning to contribute to open source software. For the
purposes of this analysis we consider all the Likert-scale answers to the battery of 11 suggested
reasons, and extract the first factor’s loadings on those questionnaire items. These may be inspected in
Table A1 of the Appendix, where it is seen (at the top of the table) that assigning greatest importance
to the more ideologically and normatively colored reasons (i.e., wanting to “become a better
programmer”, to “interact with like-minded programmers”, to “be free to modify software we use”,
etc.) receive high positive factor loadings. The more technical reasons that are held to be very
important by respondents appear with lower but still positive loadings toward the bottom of the list.
These statistical results in a broad way recapitulate the informal and subjective arrangement
of the data on the aggregate distributions of responses to the survey questions (Q4) on the reasons for
beginning to develop FLOSS, which appear in Figure 1a. Their advantage is purely descriptive, for
factor analysis cannot be used to discriminate between alternative interpretations or theories; as
employed here it is essentially a means of data-reduction that permits the computation of a scalar
variable from all the information in each respondent’s answers to that battery of questions. This
scalar is the individual’s “motivational factor-score,” which is found by applying the factor loadings
from Table A1 to his (or her) answers to Q4 {q(a)…q(k)}.
Doing this for each respondent in the FLOSS-US dataset who supplied complete answers to
all the items in the Survey’s Q4 the items in the survey yields the frequency density displayed by
Figure 2. Here we have a continuous representation of the heterogeneity of self-reported motives in
the population of FLOSS developers. Figure 2 about here
If all developers had the same motivations, then the factor score would have constant value and
variance of zero. The probability density function (Figure 2) shows that reported motivations differ
substantially between developers. The factor score evidently has a non-symmetric distribution, and
the hypothesis that the factor is normally distributed is decisively rejected by a Shapiro-Wilk test.
3.3. Cluster analysis: grouping heterogeneous respondents by motivational profile
Having established that the “representative FLOSS developer” is an inappropriate construct,
because the population we are examining exhibits significant heterogeneity in the members
motivational profiles, we now turn to more carefully describe the main profiles suggested by
combinations of important reasons for FLOSS participation, and examine their distribution in the
population of survey respondents. For this purpose we proceed by use cluster analysis, and then
characterize the “normalized motivations” associated with each of the identified clusters. The
objective being to be able to assess the quantitative importance of various complexes of motivation

26
that have figured in previous theoretical and empirical discussions of this question, grouping
developers into clusters is a natural way to approach that question. 37
The principal tool employed in this analysis is hierarchical complete linkage cluster analysis,
based on the full set of responses to Q4. Although the number of methods for cluster analysis exceeds
the number of studies using cluster analysis, and statistical theory gives limited guidance as to the
appropriate choice of cluster method (Everitt 1993), several reasons can nevertheless be offered in
support of the choice of hierarchical complete linkage analysis. Hierarchical agglomerative cluster
analysis forms a taxonomy of characteristics that allows quantitative comparison of different numbers
of clusters via stopping rules and graphical comparison via dendrograms. Partitioning methods –
principally k-means and k-medians analysis – allow stopping rules but no easy graphical comparison
and require an a priori specification of the number of clusters to be formed. Hierarchical analysis also
has the advantage of permitting a choice of what method to use in comparing cluster characteristics,
whereas partitioning methods generally use the mean or median value. Among various methods for
hierarchical analysis that were tried, it was found that complete linkage analysis with the FLOSS-US
data consistently forms medium-sized clusters, allowing for sufficient observations in each cluster to
compare developer motivations.38
Figure 3 about here
The hierarchical analysis uses the 1,459 developers who answer every sub-part of Q4 to form
five clusters. This analysis produces one dominant cluster containing 696 developers (nearly half the
sample), another cluster with 325 observations, and others with 59, 145, and 234 developers. The
population of developers breaks into two distinct branches—the first two clusters come from division
of the first branch, and the last three clusters come from division of the second branch. The
dendrogram in Figure 3 suggests that clusters 1 and 2 will have similar characteristics, that clusters 3
37 A plausible alternative to cluster analysis for examining heterogeneity in a population of developers would be to solely use factor analysis to construct several “motivation” factors, then to discuss the distribution and meaning of these factors (see Hertel, Nieder, and Herrmann 2003). We prefer to focus on the results of cluster analysis, however, since discussion of survey responses among different clusters allows more direct examination of motives than discussion of a combined product of many survey responses, which is what factor analysis would allow. Since responses to Q4 and Q12 pertain to quite different questions, and since the binary answers for the five listed motivations in Q12 provided limited additional information for constructing clusters, we use only Q4 in constructing clusters, though we report the answers of these clusters on Q12. 38 Any cluster method can form unstable results from a given distribution of data, as the agglomeration of observations into clusters when multiple observations have equal distinctness requires arbitrary decisions. Since the assignment of all developers to clusters depends on assignment of the first few developers to clusters, breaking of such ties can cause results to vary each time that analysis forms clusters. For simplicity, we assign each developer a randomly generated number and use this random assignment to choose among different developers when more than one developer has similar characteristics. Nonetheless, exact results from cluster analyses can vary based on small differences in the underlying data or the chosen distance measure and methods of generating clusters, leading some researchers to emphasize that cluster analysis serves a more useful role in generating hypotheses than in testing them (see Everitt 1993).

27
and 4 will have similar characteristics, and that cluster 5 will have the most similarity to clusters 3 and
4.
3.4. Methods for characterizing and distinguishing the motivational clusters
To simplify analysis of the four-option Likert scaled responses to Q4, we calculate
"normalized intensity" measures for populations of developers. “Population” here refers to any
subset—all developers, a cluster of developers, or another grouping. We define a population’s
response intensity as the number of developers in the population who list a motivation as “very
important” or “important,” divided by the number of developers who list a motivation as “not
important.” Intensity summarizes responses to the Likert scale in scalar form. The first and within-
question normalization divides, for each sub-part of Q4, each population’s intensity for the question
by the mean intensity for the question among all developers, producing a normalized intensity for that
population. The second and within-population normalization divides population’s normalized
intensity measure for each question by the mean normalized intensity across questions. This second
step gives the twice-normalized intensities that appear in Tables 4 and 5. This approach ensures that
all motivations have a within-population mean of one, facilitating comparison of the listed value of
motivations across questions within each population but not across populations.
3.4.1. Defining measures of “motivational intensity”
To explain this approach formally, let i index developers, P denote the number of developers
in population p, N denote the total number of developers, and q index a sub-part of question four, so q
∈{a, b, . . . , k}. The intensity Ap for population p on question q is
1
1
( )i P
ipq ipqi
pq i P
ipqi
vimp impA
nimp
=
==
=
+=∑
∑
where vimp, imp, and nimp represent indicators that take the value one if a developer gives response
“very important,” “important,” or “not important,” respectively, and zero otherwise. The intensity for
all developers on question q, B, is
1
1
( )i N
iq iqi
q i N
iqi
vimp impB
nimp
=
==
=
+=∑
∑
The first normalization F, for question q equals the ratio of a population’s intensity to the
mean intensity for all developers:
pqpq
q
AF
B= (1)

28
The twice-normalized intensity T for population p divides the normalized intensity for question q by
the mean normalized intensity for all 11 sub-parts of Q4:
11
1
11 pqpq q
pqq
FT
F=
=
=
∑ (2)
For Q12, we use a similar approach but define intensity as the portion of developers listing a
particular motivation, since Q12 does not use a Likert scale. By definition, each cluster has mean
twice-normalized intensity of one on Q4 and the same mean on Q12.
3.4.2.Reading the motivational intensity maps
The normalization methods outlined above (in section 3.5) applies readily to sub-populations
of all developers, but also can apply to one population that includes all developers. To derive such
normalization, we calculate intensities for all developers on each part of Q4, and then omit the first
normalization in equation (1) since we only have one population. We proceed to directly calculate the
second normalization in equation (2). We use a similar approach for Q12, but define intensity as the
portion of respondents who agreed with a motivation listed in sub-part of Q12.
Table 4 about here
Table 4 presents these normalized results, and they imply similar conclusions to Figures 1a
and 1b, albeit with more simple scalar comparison. Desires “to give back to the community”, and
belief in the importance being “free to modify the software we use” constitute the two dominant
motivations for becoming engaged in developing FLOSS. An employer’s request that one collaborate
in a FLOSS project, and the enjoyment of fixing bugs, on the other hand, have comparatively slight
quantitative importance. For Q12 the potential usefulness of a project’s software represented the
leading reason for choosing that particular project, and knowing participants in the project was the
least important motivation for choosing to contribute to it. In the responses to Q12, the normalized
intensities are seen to vary little between current project and first project (Table 4).
Table 5 about here
Table 5 presents twice-normalized intensities for each cluster (see section 2.2 for explanation
of the method), and further explanation of the table’s structure may increase its comprehensibility.
Each of the first five columns shows values for a particular cluster, while the last two columns test
equivalence of mean demographic characteristics across clusters. For Q4, dark grey cells show the
three top twice-normalized values for each cluster while white cells indicate the three least common

29
responses for each cluster, though the cluster 4 has a tie between q4j and q4i for low motivation. For
Q12, dark and light grey appear for only the top and bottom single responses, though cluster 1 has two
questions with equally low twice-normalized intensity (q12c and 12d). As was explained previously,
earlier, sub-parts of Q4 and Q12 appear in intuitive rather than alphabetical order. One could read the
ordering as proceeding from identification with the public ethos of the FLOSS community, toward
commitment to programming expertise, and in the limit to non-ideological professionalism.
It is striking that, as the shadings indicate, clusters have pronounced differences in the
gradient of intensity. One indication that these clusters identify ideological or non-ideological groups
appears in the concentration of common and uncommon responses. In clusters 1, 2, and 5, the most
common answers appear in adjacent rows. Cluster 5, for example, emphasizes ideological reasons for
developing FLOSS and rarely lists pragmatic reasons. Clusters 2 and 4, by contrast, more often list
pragmatic reasons and less often list ideological reasons.
These motivations cohere with the dendrogram (Figure 3) in suggesting the similarity of
clusters. Clusters 1, 2 and 4 emphasize responses in the lower part of Table 5, indicated by having two
or three dark grey (most intense) responses below Q4h and two or more of the white (least intense)
responses at or above item Q4h. Clusters 1 and 2 have greatest similarity, with one apparent
difference being that only the few developers who fall in Cluster 1 emphasize the specific reason fpr
their initial participation: an employer’s request that they collaborate in developing open source
software.
Table 6 about here
Table 6 offers some thumbnail characterizations, or caricatures of the motivational profiles
represented in these clusters. Clusters 1 and 2 eschew ideological reasons and emphasize technical
motivations. Learning and social interactions rarely motivate the anti-ideological hackers of Clusters 1
and 2, and so they resemble the motivation profile that Lerner and Tirole (2005) suggest—an
individualist, materially motivated programmer who develops FLOSS in the interest of a future
career, and, in cluster one, for current employment. The differentiating label of “professionals” given
to Cluster 1 is meant to reflect the exceptionally high intensity score associated with being initially
having been asked by an employer to work on open source (as seen from Table 5:Panel A), as well as
the relative concentration within this group of individuals whose project choice was bound up with
having launched the project as one that was technically interesting (Table 5: Panel B). By contrast,
the “aspiring hackers” of Cluster 2 share the motive of needing to patch bugs in existing software, but
differ in being strongly motivated to start contribution to FLOSS projects by the the challenge of
fixing bugs and their desire to learn how particular programs work.
Cluster 3 appears more individualist and instrumental about improving software programming
skills—including learning how particular programs work. Developers in this cluster do not attach
great importance to “giving back to the community” as their motive for stating to develop FLOSS,
although, if they have little experience, they may be conscious of being unable to contribute expertise

30
to the FLOSS community and having joined a project in order to develop programming and other
software skills. Members of Cluster 3 evince a distinct social orientation – those who want to work
with like-minded others and regard open source as the best mode for software development are
relatively prominent, while wanting to become better programmers. This complex of expressed
motives would appear to reflect a particularly strong attraction to membership in a community that
includes other neophytes who, similarly, are seeking mutual instruction or reassurance. Clearly,
patching code does not motivate those in the Cluster 3 profile: they are not code producers, so much
as “social learners” – the label affixed to them in Table 6.
Developers in cluster 4 heavily emphasize the need to modify code and identify with the free
software movement’s ethos: this cluster resembles Raymond’s (2001) hackers in expertise. They
rarely emphasize interaction with others, improvement of programming skills, or the desire to learn
about particular programs. This cluster rarely mentions the “challenge of fixing bugs in existing
software” but often emphasizes needing to “fix bugs in existing software.” Perhaps the first phrasing
of challenge does not appeal to these developers, but the second of practical need more reflects their
motivations. This cluster has the greatest intensity of the need to modify existing software—its users
have some clearly practical motivation.
Cluster 5 more than any other voices ideological positions often associated with the FLOSS
movement, while attaching least importance to the instrumental technical reasons or to professional
reasons for engaging in FLOSS projects. Developers in this cluster somewhat resemble Cluster 3 in
attaching moderate importance to improving software skills with like-minded others. They also appear
to continue learning, though with more confidence than developers Cluster 3. This may explain the
response of wanting to “give back to the community”—if they had watched and communicated with
others before beginning to work on a project. But that statement may be read as referring to the
FLOSS community at large rather than to a project-based community, particularly since Cluster 5
developers often launched the project on which they work, which for many was their first project.
Further light is shed on Cluster 5 types by the observation that three-fourths of them are
members of the very small project sub-sample (Table 10). Also, Cluster 5 assignees
disproportionately reported that the reason for their current project choice was that “I launched the
project” (Table 3 Panel B). In the context of the latter statements, the relative importance that Cluster
5 assigns to “giving back to the community” might be interpreted as referring to the contribution of
the project’s code, rather than a contribution to larger projects that were community-based. This
reading reinforces the suggestion that “community” refers to the open source community at large
rather than a particular project community. For cluster 5, lack of identification with the FLOSS
movement perhaps compensates for lack of involvement in a FLOSS community project.
Perhaps the characterization of the profile of Cluster 5 as that of “user-innovators“ (by Table
6) may be viewed as less than entirely appropriate, inasmuch as its application by von Hippel (2002,
2005) to explain the behavior of open source developers has associated its use in this context with
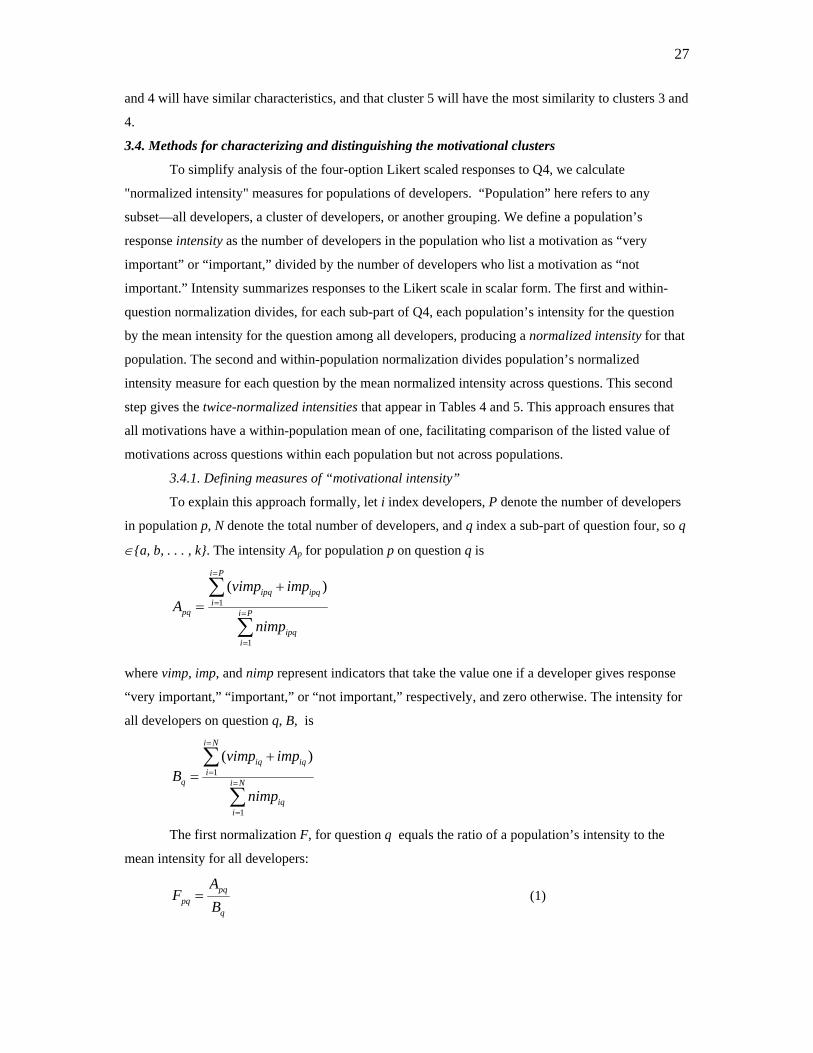
31
special connotations that derive in large measure from von Hippel’s (1988) influential earlier studies
of the sources of innovation in certain fields of business. There the image of the proto-typical user-
innovator is that of the individual hobbyist, or professional, who shuns large organizations and
designs and proves the usefulness of novel artifacts which satisfy his or her needs that have remained
unmet by existing, mass-produced goods. Although such people might write a particular driver for the
Linux kernel, it seems more likely that individuals having the user-innovator’s salient motivation
would have focused upon software needs that they believed themselves to be capable of meeting by
working independently or in a small project collaboration.39 One therefore should recall (from Table
5:Panel) that among developers’ motives in chosing to work on specific projects, the reason to which
the highest normalized intensity score attached attaches in the Cluster 5 group is that they launched
the project themselves. This congruence reinforces the case for application of the “user-innovator”
labeling, while leaving open the empirical question of whether it will be found that Cluster 5
developers predominate in the very small projects.
The collective portraits of the motivational cluster sub-populations can be rounded out by
looking at their respective demographics, educational attainments, employment status and career
expectations (Table 7). The two rightmost columns present tests of the hypothesis that the clusters
have equal mean values, and show that this hypothesis is rejected in regard to for the means of age,
experience, portion with children over age six, the portion of respondents with high school and
graduate education, and the expected future role in FLOSS-based commercial enterprise as a company
owner, officer, director, or some other professional capacity.40 . The other categories have some
differences across the clusters, though ANOVA cannot reject the hypothesis that the clusters have
equal means.
Cluster 1 (professionals) has the demographics that one might expect given their motivational
responses. They have above-average experience and relatively fewer students (19 percent of Cluster
1) than any other cluster. Cluster 1 has the greatest portion of people with undergraduate education
(42 percent). Although this cluster has relatively fewer graduates of professional school (4 percent)
than any other cluster, the small number of professional graduates overall and similarity across
clusters gives the difference limited importance. Consistent with our characterizations based on the
motivations data, Cluster 1 and 2 members are exclusively male, included substantially larger cohorts
who had embarked on FLOSS development prior to the year 2000, and averaged more years of
experience without having started their involvement with FLOSS at ages as young as those of the
members of Clusters 3 and 5. Compared to developers in other clusters, the members of Cluster 2 39 For such such people, the attractions of starting to develop FLOSS in I-mode would be far stronger than those of becoming part of a large, on-going community based project that was already at work building a complex software system, and this might be expected to lead Cluster 5 developers being disproportionately represented among the members of very small projects. 40 The variable for which inter-cluster differences in means are significant are denoted by boldface, a convention that is followed in subsequent tables.
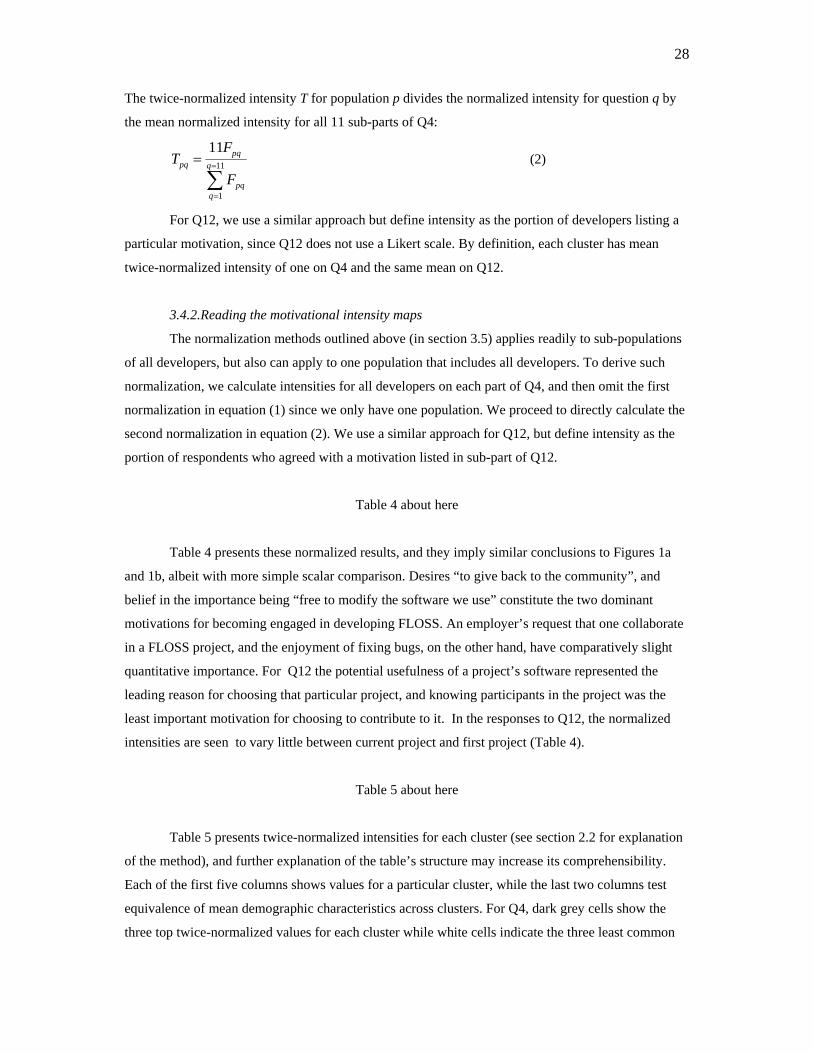
32
(aspiring hackers) have more experience, a greater probability of working in a firm, and lower
probability of having children. Cluster 3 (social learners) ties for the youngest developers overall.
These developers expend the greatest work effort on FLOSS but have the lowest probability of
working in a firm. Cluster 4 (social programmers) has the oldest developers on average, the highest
proportion of female developers is found in Cluster (albeit only 3 percent), as is the highest level
average educational attainment level. Cluster 5 (user-innovators) has the lowest mean experience of
any cluster and ties with cluster 3 for lowest mean age. Developers in this cluster have lower average
education, with relatively few developers completing graduate school and more than any other cluster
completing high school.
3.5. More clues for cluster interpretation: “written-in reasons” for developing FLOSS
The FLOSS-US survey also allowed developers to write-in a motivation for first developing
FLOSS. Nearly a third of respondents wrote in an additional motivation for first developing FLOSS
or for choosing a specific project,41 and these write-ins give further insight into the heterogeneity of
developer motives. Write-in motivations had varied length and substance: some resembled a listed
option; others did not. These written motivations spanned many topics – enjoyment of programming
as a hobby, recollections of speeches by Richard Stallman, and others – which we summarize into
several categories. Tables 8a and 8b report the results. The interest of these tables lies in the respects
in which they enrich the picture that emerges from the responses to Q4a-Q4k. (in Figure 1a, and Table
4) while remaining consistent with its main features. To give a few examples, Cluster 2's emphasis on
bugs in Q12other fits its positive chosen response to fixing bugs in Q4a-Q4k; Cluster 3's emphasis on
ideology in Q4other fits its responses to Q4a-Q4k; Cluster 4's emphasis on practical goals in Q12
other fits its responses to Q4a-Q4k; and Cluster 5's emphasis on giving back to community in Q4other
and Q12other echoes this cluster's listing of this motive in Q4a-Q4k.
There are, however, some differences between the cluster characterizations and the "other"
responses: Cluster 1 has been characterized on the basis of Q4a-Q4k as “non-ideological” but
respondents who are assigned to that cluster wrote in ideological "other" motivations at a rate that was
only slightly below the mean for the sample as a whole. To take another example, members of
Clusters 2 and 5 have been characterized as not having important needs to modify existing software,
but their responses to Q4other and Q12other frequently refer to their needing to "modify or create"
software. Perhaps these developers needed to “create” but not “modify” software, and were
responding in a very precise way to the conflation of the two activities in the questionnaire.
41 The write-in option for Q4 did not distinguish whether this motivation applied to a respondent’s current/most recent or to a respondent’s first project.

33
Some differences in values across the clusters appear to have large magnitude, but a Pearson
chi-squared test does not reject the hypothesis that clusters and response categories are independent,
either using the aggregated categories (italics) or all sub-categories.
To facilitate comparison of these write-in motivations, we distinguish five categories of
motivations – intrinsic, instrumental-knowledge, instrumental-visibility, instrumental- practical, and
principle – and several specific motivations within categories. Intrinsic motivations include the many
developers who wrote variants of “fun” and others who discussed desire to be part of a community or
liking developers already in a project (“wanted to be part of the community,” “friendly community,”
etc.). These motivations emphasize the pleasure inherent in the development of FLOSS without focus
on its consequences. We distinguish three categories of instrumental motivations because most
written-in responses have instrumental focus. Instrumental-knowledge responses focus on developing
FLOSS for acquiring programming knowledge or for academic purposes. Instrumental-visibility
responses discuss hope of developing a reputation among peers or signaling skills to future employers.
Instrumental-practical responses emphasize concrete needs: a developer needed to modify existing
software or create non-existing software, worked on FLOSS for earnings or following an employer’s
mandate, recognized the prohibitive cost of developing or purchasing proprietary code, valued the
high quality and short development time of FLOSS code, or required collaboration to develop a
project or extend its lifetime. The fifth category of principled responses focuses on positive FLOSS
ideology, including three mentions by name of Richard Stallman; negative ideology towards
proprietary software, including three mentions of Microsoft; and emphasis on desire to help others
and give back to community.
In Q4, 20 percent of respondents wrote in a motivation and most of these write-ins fit into one
of the above five categories (see Table 8a: col.1). About three percent of all developers wrote an
intrinsic motivation, almost all focused on fun or challenge and few focused on the value of
community. About one percent of all developers wrote in an instrumental motive focused on
knowledge acquisition, and an additional one percent discussed signaling or reputation. Over six
percent of all respondents discussed an instrumental-practical motivation. The need to modify or
create software accounted for nearly half of this group. Fewer developers discussed ideology, and a
respondent was twice as likely to write positive comments about FLOSS as to write negative
comments about proprietary software
In Q12, 20 percent of all respondents wrote in a motivation. These responses had a similar
distribution to those given on Q4, but with greater emphasis on the need to modify or create a
program, and more discussion of the need to fix bugs (Table 8b: col. 1). Among developers who
wrote in a response, the clusters emphasized somewhat different categories, although as in the
responses to Q4 (see Figure 3), clusters 1 and 2 are similar in the relative prominence assigned to
intrinsic motives, and the similiarity of the comparably high relative frequency of practical
instrumental reasons in clusters 3, 4, and 5 is notable.

34
When it comes to reasons for project choice, there is less differentiation among the clusters in
the salient reasons. Bug-fixing, the need to create/modify software, and employment-required
participation are salient in all clusters (taking the 3 most frequent specific reasons, and including ties).
Interestingly enough, in comparison with other clusters, Cluster 1 looks little different in most
respects apart from the greater relative importance assigned to “fun”, although its members supplied a
comparatively higher proportion of “other” answers in Table 8a, even if that was not the case in the
responses on Q12, as shown in Table 8b.
One further point of interest is the overall frequency of “employment required it” statements
among the “other reason” cases in this table. It is essentially the same proportion (3-4%) that is
observed citing this as very important among the stated options for participating in responses to Q4 –
but is not cited among the “other” reasons on that question. This consistency supports the conclusion
that employed contributors are a very small core in the overall developer population. That this reason
is particularly prominent in Clusters 1, 2 and 4 is partially consistent with the anecdotal evidence that
sponsored contributions are directed toward the larger projects, since it is found (see Table 12, below)
that Clusters 2 assignees form a significantly bigger share of the developers in the larger projects than
in the very small ones. But the data also supports the qualification that business “sponsorship” of
participation in FLOSS production also figures at the level of small enterprises, such as software
services and consultancies.
4. Who are the I-mode and C-mode Developers?
4.1 Finding and classifying the project sizes of survey respondents
To measure a project’s size, we use data obtained by matching survey responses with data
from SourceForge.Net and other platforms. A search of the roughly contemporaneous Source Forge
archive identified the number of active developers in project groups named by FLOSS-US
respondents.. In some cases, the reported name from FLOSS-US resembled multiple possible projects
on the platform. When these multiple entries had similar project sizes, the modal size represented a
majority of observations, and the mode differed substantially from the mean (e.g., three matched
SourceForge projects had size 14 and one group had size 1), we identified the project with the modal
size. In other cases where multiple entries for the same project had different group sizes, we identified
size as the mean of non-zero project sizes, rounded to the nearest integer. When SourceForge
indicated that a project had zero or an unknown number of developers, we did not use this source of
information on project size.
Analysis of project size requires identification of developers in large and small projects, a
decision which requires definition of “large” and “small.” These categories reflect extremes of a latent
characteristic of project size. In the extreme, one can imagine a small project as a student who
develops a program as a class assignment and posts it on the web, while Debian’s 1,300 developers
(Robles, Gonzalez, and Michlmayr 2005) represent an extremely large project. Several reasons,

35
however, suggest that large and small projects represent distinct forms of organization rather than
small changes along a continuum. First, structure: to coordinate activities among many developers,
large projects must introduce modularity, which could substantially change the dynamics of FLOSS
programs and their associated developers.42 Second, communication: research emphasizes that
dynamics of groups – including online communities – changes sharply as group size increases (see
Butler 2001 and references contained therein). Mailing lists also encounter this challenge, as
coordination requires directed communication between individuals rather than open pronouncements
to groups, and mailing lists rarely eliminate need for binary interactions. Finally, public interest: large
projects like Apache and Linux have received more public attention than the many one- and two-
person projects for outperforming proprietary software, and it may be useful to know whether
attracting differently motivated developers helps these large projects succeed.
No research on open source development communities provides any clear demarcation for
how large a “large project” has to be in terms of it current contributing membership size. Some
references discussed in Butler (2001) suggest that group dynamics change nonlinearly at groups of
between 5 and 10 persons, but the evidence seems too general and far-removed from FLOSS to
directly apply. More general research on social interaction capabilities of humans and their
implications for the sizes of cooperating groups gives some imprecise guidance as to the constraints of
group sizes. Richard Dunbar’s much-acclaimed correlation of primate communities and brain sizes
suggests that human brains can only maintain relationships with 150 others (Dunbar, 2003). This
magnitude has been designated the “Dunbar’s number” for maximum sustainable group size by more
than one prominent recent writer on the subject of group interactions (see Gladwell 2002, Watts
2004). While it is well known that the number of interactions within a group increases nonlinearly in
group size, the nature of the “connections” among the members also matters when one is concerned to
locate the boundary beyond which the group’s complexity of become unmanageable. A group with N
members will have (N2-N)/2 binary interactions among its members if one suppose that the latter are
directional (Bossard 1945), and it is easy to see that the response of the interaction possibilities to
increases in group size is quite non-linear in the size range from 20 to 30.
Figure 4 about here
Looking at the SF distribution, in Figure 4, we see the distribution of the SourceForge project
sizes to which we could match our FLOSS-US survey respondents is highly skewed, with the mode
being single member projects, and the mass in the 1-2 membership range. Figure 4 demonstrates that
choice of an exact size for distinguishing small projects does matter, since so many projects have size
of 1-2 people. Since the archetypal small project includes a developer posting a solo work or perhaps
collaboration with a partner, we define small projects to include either 1-2 developers.
42 Dalle and David (2005, 2006); see Lerner and Tirole’s (2002) discussion of Mozilla and Netscape.

36
The exact lower bound size that is selected for demarcating large projects has limited
importance—as Figure 3 shows that very few projects have known size with more than 20 developers.
Some other developers participated in clearly large projects, even if their project has no SourceForge
listing. This criterion defines participants in 19 such projects as community-mode.43 Thus, we were
able to classify an additional number of survey respondents as participants in large projects like the
Linux Kernel, Apache, and Mozilla (see the list in Table A2) without needing to establish their
membership sizes precisely. On this basis it is possible for us to assign as many as 847 of the 1459
FLOSS-US respondents (for all of whom we have complete motivations data, and hence motivational
cluster assignments) to one or another of the three size ranges: the very small I-mode projects with 1
to 2 members, the “large” C-mode projects whose lower bound is set at 30 members, and the
remainder in the range from 3 to 29.
4.2 Movements of developers across the project size range
The sub-sample of 384 FLOSS-US respondents for whom we have information on the size of
their first and their current (main) project allows makes it possible to construct transition matrices
describing the pattern of developers’ movements. Two kinds of mobility are involved in this “capture-
recapture” data, one that crosses project boundaries, and the other that crosses the boundaries we have
defined in the distribution of project sizes. Considering all developers with known size, a chi-squared
test based on the data in Panel A of Table 9 firmly rejects the hypothesis that the sizes of first and
current projects are independently distributed: the entries in the cells forming the principal diagonal
are disproportionately high, indicating significant inertia, or persistence within the size-strata. Indeed,
Panel A of Table 9, on its face, appears to be telling us that the probability of a developer remaining
within the same stratum of the project size distribution is extremely high: for the large project strata it
is about 0.47, whereas the corresponding within-strata persistence probabilities are higher still, at 0.72
for those starting at the lower end, and 0.62 for starting projects that lie in the middle range.
Table 9 about here:
But appearances in this case are deceptive, because a substantial number of developers list the
same project as first and most recent/current, so that rather than moving within the same part of the
size distribution, they may not have changed projects at all.44 This could be the case either because
their initiation into open source development was very recent, or their commitment to the project on
43 The projects include Linux kernel, Debian, Perl, Mozilla, Postfix, Sendmail, KDE, Gnome, Emacs, Crystal space, Samba, Apache, Mplayer, Freebsd, Mono, Openoffice.org, Openbsd, Php, and Xfree86. See Appendix 2 for the distribution of FLOSS respondents that were matched to these projects. 44 In the FLOSS-US sample population as a whole almost 17 percent of respondents reported having contributed to only a single project, as can be seen from the frequency distribution based on the answers to Q9, in David, Waterman and Arora (2003), p. 29. In the sub-sample on which Table 9 is constructed, however, the bias toward the inclusion of single project developers is strong, because it is more likely that one will be able to have found the project size for one project than the sizes of both projects in a pair. Therefore, the single-project developers’ contribution to the mean overall rate of within-stratum persistence (0.36) implied by the diagonal cells in Panel A of Table 9 is likely to be substantially above 0.17.

37
which their FLOSS activities had begun was truly more durable. Panel A therefore reflects the
presence of “movers” and of “stayers” of different kinds, given that the time intervals separating the
first and current projects differed among individuals, and the high persistence rates in the cells
forming that table’s principal diagonal are in large part reflecting truncation bias due to the short time
elapsed between the dates at which those individual had started working on FLOSS and the survey.45
Consequently, Panel B is focused exclusively on the subset of 244 respondents among the
384 (almost two-thirds of those in Panel A) whose current and first projects were not the same. These
are the “movers” in the organizational dimension. It is striking that a repeat of the chi-square test now
cannot reject the hypothesis that movers’ pair of project sizes are distributed independently. Rather
than persisting within their size stratum of origin, those who start on very small projects have a 0.25
probability to going to a large project, which is 70 percentage points higher than the probability that
they will go to a project of intermediate size, and almost 300 percentage points greater than the
probability that they will move to a different but equally small project. For those who start developing
FLOSS in the context of large projects, the probability that those who start there will move to another
large project is 0.20, which is 78 percentage points greater than the probability of their moving to the
bottom end of the size distribution, and 45 percentage point higher than the probability of their
moving into a project in the intermediate range of the size distribution. The situation among those
whose first project was situated in the latter range is even more striking, for the probability of their
moving the higher stratum (at 0.19) is 6 time larger than the probability that they will go to a very
small project.
The large project stratum therefore emerges from this analysis as an attractor in the
circulation dynamics of those who change projects, While these communities may well be regarded as
sites of software skills development and organizational know-how that foster open source production
at large, it appears that they are also absorbing, and enhancing the programming abilities of
developers who made a start on individual projects, undertaken without formal instruction in their
capacity as students.
5. Project Size and the Distribution Developer’s Motives and Characteristics
We are now able to bring together the findings about the characteristics of the FLOSS
developers in the different motivational clusters and the distribution of those motivational types across
45 Among the respondents to the FLOSS-US survey who answered Q9 about the number of projects to which they contributed, about one third reported having worked on only 1 or 2 projects. So, it should not be supposed that no additional instances of project joining intervened between the observations on first and current (main) project participation from which Table 9 has been derived. Indeed, from the frequency distribution of the number of projects to which they had contributed, one can calculated that for roughly another third (34 percent) of the FLOSS-US developers had joined 1or 2 intervening projects, and for another 24 percent the intervening number of projects was either 3 or 4. Indeed, in the uppermost quintile of that frequency distribution, 7 is the minimum number of projects on which developers said they worked. See David, Waterman and Arora (2003: Fig.37, p. 29).

38
the small, medium and large projects, which is what we need to know to answer the questions that
spurred this inquiry. This can be done in several steps, looking first at the issue of whether the
mixture of motivational factors of the developer populations is much the same or exhibits distinct
differences as one moves across the range of their project sizes. Secondly, we compare the
descriptive statistics of developers at the upper and lower ends of the project size distribution to see
whether there are significant differences between those who are contributing to FLOSS production in
C-mode and those who are working in I-mode, considering both their demographic, occupational and
experience characteristics, and the variation of expected proportions of motivational types and
motivational intensities across the range from the large to the very small projects. Lastly, we
undertake to learn whether the initial motivations of developers and their objective characteristics
have significant predictive power in regard to the sizes of the FLOSS projects on which they choose
the work. The independent variables selected to estimate the marginal effects on project size choice in
this model include experience in FLOSS, age upon first developing FLOSS, occupational status,
earnings from FLOSS, expected future job roles, country of residence, and educational attainment.
5.1. Project size-associated variations in developers’ motives and attributes
The boundaries defining small, and large projects have been drawn somewhat arbitrarily, so it
is of interest to start by observing that the heterogeneity distribution of the motivations for beginning
to participate in FLOSS, which we have argued can be viewed as “historically fixed” characteristics of
the individual developers, offers support for the partitioning of the size distribution that has been
established by those boundaries. This may be seen from Figure 5, which has been obtained by
making use of results from the motivational factor score distribution that was presented by Figure 2
(in Section 3.3). Given the factor-loadings in Appendix Table A1, and the observations on the 847 on
the known sizes of the respondents’ projects, it is simple to arrange the individual factor-scores in
ascending order of project size. One may then test in a simple way whether or not there are
statistically significant differences between the distributions of factor scores that lie above and below
each project size in the array.
Figure 5 about here
Figure 5 displays the results of the series of Kolmogorov-Smirnov tests computed for the
distributions formed by all the possible size partitions, showing the K-S distinctiveness test statistic
plotted against project size. The leftmost point, for example, shows the distinctness between of the
constructed motivation factor score for developers in one-person projects and those in all the other
projects of known sizes. These data suggest some change in motivation between two- and three-
persons, although this change continues up to a project size of five. The data also show a change in
distinctness of motivation when using a partition at projects with slightly over 30 developers. This
partition reveals a quite distinct break that indicates some underlying difference between the mix of
motivational profiles typical of the developers in the large projects and those in the rest of the size
distribution. Before looking at that possibility explicitly, is it pertinent to see whether there are

39
significant differences in other attributes of the participants in large and small projects. The
descriptive statistics in Table 10 reveal that such differences do existing, although only in some of the
characteristics of interest.
Table 10 about here
Table 10 compares the mean values for non-motivation characteristics of respondents whose
project sizes are known to fall into the small (1-2 member) range and the large (>29 member) range.
Because there are some missing observations on these variables for 63 respondents out of the 602
identified in those projects, the sample sizes in the cells of the table for some variable are smaller than
the N’s shown at the bottom of the tables first two columns; the third column reports the results of
two-tailed t-tests of the differences between the means for the size groups (assuming unequal
variances).
It will be recalled (from Table 1a) that the mean respondent in the entire FLOSS-US sample
started to develop open source software at the age of 24, in 1998. The age and experience means from
Table 10 imply the same starting age for those participating in the large projects, whereas those in
small projects appear to have started when they were 23. Making the same calculations for the
developers participating in medium size projects shows that they have 5.3 years of experience, much
the same as that of the average respondent, and were a year older when they started developing
FLOSS. Thus, the mean ages of those on medium and large project are close to 30 in both cases, and
exceed those of the participants on the very small projects by 2.7- 2.9 years. But none of these
differences are large enough to be statistically significant. Although students are a distinct minority
among FLOSS developers, constituting only 29 percent of the survey respondent, compared with the
the 68 percent who were employees, it seems that the greater frequency with which students are found
among the contributors to 1 and 2 person projects accounts for the younger average starting ages that
are observed there.46
A minority of respondents earned money from FLOSS, and the paid respondents are
approximately evenly divided among those receiving payment for support, development and
administrative work. About a third of these respondents have graduate degrees, and a majority has
some higher education. Since these data represent a sub-sample of all respondents that may have
some selection bias, they do not even represent all FLOSS-US developers, and these statistics differ
somewhat from descriptive statistics for all respondents (David, Waterman, and Arora 2003).
To help interpret the distinctiveness of motivational factor-scores across the project size
distribution, we can use the method of twice normalizing motivation-intensities of responses to the
individual questions in the survey (Q4). Table 11 displays the normalized intensity maps for the three
46 The classification “unemployed” often includes only individuals who are not enrolled as students, lack employment and were seeking paid work. Since the surveys do not require non-student respondents who check “unemployed” to satisfy the latter condition, we refer to these developers simply as “not employed”.

40
domains of the project size distribution, marking the cells in Panel A with the three highest intensity
scores in each size class by dark shading, and leaving those with the three lowest scores un-shaded.
Table 11 about here
The mappings of normalized motivational intensities for participants in the three project size
ranges reveal quite disjoint patterns in the locations of high and low intensity levels for the
populations groups in these parts of the project size distribution. In Panel A there is only one instance
of concurrence at the low intensity level – between those in small the medium size projects in regard
to Q4j, which concerned the importance of wanting to know how a particular program worked.
Similarly, there is only a single instance of concurrence at the high intensity level –between the
distributions of developers on medium and large projects, in this case on the importance of needing to
needing to patch bugs in existing software as a reason for working on open source code.
But, unlike the normalized intensity maps constructed on the basis of Q12 responses for the
different clusters (Table 4), or the map for the whole FLOSS-US survey sample (Table 3), Panel A of
Table 11 does not exhibit discernable patterns in which high intensity values are grouped toward the
top of or the bottom of the columns, with the low intensity value tending to have the opposite
grouping. The assignment of strong relative importance to normative and ideological reasons
beginning to develop open source software, or to individuals’ technical and professional are not found
to be clearly concentrated in different ranges of the project size distribution.
That observation prepares us to find from Table 12 that no signle motivational cluster-type
represents a majority among either the C-mode or the I-mode populations, although in the latter case
cluster 3 (‘social learners’) comes close. The cluster-mix in large and small projects is significantly
different, mainly in the greater weight of cluster 2 (‘aspiring hackers’) participating in C-mode
FLOSS production.
5.2 Predicting the size range of projects to which developers choose to contribute
We estimate the correlates of a developer’s project size by ordered probit rather than by OLS
for three reasons. First, for several large projects (KDE, Linux Kernel, Gnome, etc.), we know that a
project has more than 30 developers but did not find its exact membership size. Second, project sizes
frequently change, but plausibly remain in a single size category (small, or medium, or large) over
time, so we may measure exact project size with substantial error but measure size categories far more
accurately. Third, the decisions of developers described here represent individuals choosing modes of
work rather than exact sizes, and a categorical variable distinguishing these modes rather than a
continuous variable identifying exact project sizes reflects this decision process. While a multinomial
or categorical logit recognizes the categorical nature of the dependent variable, these models ignore
the inherent ordering of project size from small to medium and large, and the ordered probit’s use of
this additional information makes it a more informative model for our purposes.

41
For each developer i, we observe the ordered response yi={0,1,2} representing respectively
small, medium, and large projects. The following process determines the latent variable y*i:
y*i = xiβi + ei
where β is a K x 1 vector and [e|x]~N(0,1). The ordered response depends on two unknown threshold
parameters α1 and α2:
y=0 if y* ≤ α1
y=1 if α1<y*≤α2
y=2 if α2<y* . The response probabilities have the following distributions:
P(y=0|x) = φ(α1-xβ) P(y=1|x) = φ(α2-xβ)-φ(α1-xβ) P(y=2|x) = 1-φ(α2-xβ)
where φ(⋅) represents the standard normal cumulative distribution function, and the three probabilities
add to one (Wooldridge 2002, p. 505). Table 13 (below) presents the partial, or marginal effects
∂pm(x)/∂xk (denoted mfx in the table) for m=0,1,2 rather than the regression coefficients, since the
coefficients do not have practical economic interpretation. Estimation of this ordered probit
system utilizes more data than the comparisons between large and very small projects
presented in Table 10, mainly by including 229 observations on developers in projects with
known size larger than 2 and smaller than 30.47
Table 13 about here From the results (in the form of the partial effects) are displayed in Table 13) it is seen that
developers with the motivational profile of “aspiring hackers” (in cluster 2) have a probability of
beginning their FLOSS work on small project that is 15 percentage points greater than that for “social
learners” (in cluster 3); and the proportionate differential in their probability of starting on a small
project is 16 percentage points lower than those of “social learners.”48 There are also non-
motivational characteristics that have a palpable and statistically significant marginal effects on the
portion of the project size distribution in which developers chose to contribute. Compared with the
“not employed,” for developers that are employees the probability of initially participating in a large
project is 37 percentage point lower; and the probability of initial participation in a small project is 29
47 Some observations had to be dropped because of incomplete responses to questions from which right-hand variables in the regressions were constructed. Table 12 shows 245 respondents on projects in the medium size range to have provided complete responses to Q4’s questions about motivation, of which 16 had to be excluded from the regression underlying Table 13. 48 These are the only motivational difference effects that are statistically significant at or above the 95 percent confidence level, and the latter of the pair is the one that is more precisely estimated as a result of the substantially larger number of observations for developers at the lower end of the project size range.

42
percentage points lower -- both differences being significant at the 99 percent level of confidence.49
Educational attainment above the high school level has a positive marginal effect on the probability of
initially joining a large project: the effect of a college education contributes a 10 percentage point
increase, which is statistically significant, and the probability is an additional 6 percentage points
higher for those at the post-college (graduate) level – although that marginal effect is imprecisely
estimated due to the comparatively small number of observations of those with graduate education.
Lastly, it is seen receiving pay and the choice of the size of the FLOSS projects in which such
developers work are not unrelated. The probability of participating in a large project is 8 percentage
points higher for developers that are being paid directly (compared with the effect of being paid at
all). Although this differential effect is not significant, the 10 percentage point reduction in the in the
probability of working on a very small project when one is being directly paid for contributing to
FLOSS development is significant. There is a weaker, but nonetheless statistically significant positive
effect of paid status on the probability of selecting a project that is in the medium size range, most like
towards its upper end. But the form in which income is received for producing open source code
doesn’t appear to matter noticeable in regard to the observed tendency to work on larger projects.
Whether developers are paid directly or indirectly, the marginal effects are much the same: the
foregoing effects’ magnitudes are if anything, slightly larger for those receiving indirect pay –
possibly as officers or consultant to open source project foundations, or owners of companies engaged
in smaller development projects. It is certainly reassuring that these regression results are not at
variance with the anecdotal evidence that business firms’ sponsorship of programmers to collaborate
in producing FLOSS code is being targeted mainly to support the larger community-based projects.
6. Concluding discussion
This paper has closed at least some part of the gap in the present state of empirical knowledge
about the motivations, personal attributes and behavioral patterns that characterize members of the
many voluntary communities that work on open source software development projects. The empirical
strategy devised to address the problem classifies the respondents to an extensive web-survey
(FLOSS-US 2003) according to the approximate membership sizes of the principal projects on which
these individuals were working, thereby permitting separation and analysis of sub-populations
associated with different portions of the distribution of project sizes. Our analysis introduced a further
methodological innovation, designed to capture significant heterogeneities in motives of the general
population of FLOSS developers: hierarchical cluster analysis is used to extract a set of distinctive
“motivational profiles” from the entire web-sample’s responses to a battery of questions concerning
their reasons (Likert-scaled on “importance”) for beginning to develop FLOSS. This procedure
49 The calculations are made adding the effects of differences between the indicated employment status variables and the reference status, which in this case is seen to be that of “student”.

43
assigns each individual to one or another among the set of the identified “profiles,” which are
interpreted with the aid of normalized motivational intensity maps.
To briefly recapitulate the highlights of what has been learned: significant contrasts in the
mixtures of motivational profiles have been found between the participants in community-based
projects participants and those working essentially independently or on very small projects. Analysis
of the resulting dataset establishes that “project size matters” in other, non-motivational dimensions:
the sub-populations contributing to the large and the very small FLOSS projects exhibit differences in
demographic characteristics, educational attainments, experience, involvement in technically
demanding project, the likelihood of receiving direct monetary compensation, and in still other
regards. These differences suggest that ‘representative agent’ thinking, and a fortiori the construction
of formal models describing the population of FLOSS developers as homogeneous actors or “agents”
are likely to sacrifice empirical understanding for analytical simplicity.
The 2003 FLOSS-US survey asked respondents to recall attitudinal aspects of their initial
engagements with open source software development activities, as well as those surrounding
subsequent choices of projects to which they would contribute. Far from being uniform, the
constellation of individual’s avowed motives for involvement in FLOSS and project selections is
found to be heterogeneous; when reduced to a scalar index by application of factor analysis, the
distribution of factor-scores is continuous and symmetrical, varying widely between the scores
associated with a strong importance being attached to normative and ideological aspects of the open
source movement, instrumental technical needs and interests, and intrinsic satisfactions of addressing
the challenges of creating new programs and patching and modifying those that already exist.
Moreover, our study has marshaled a variety of evidence micro-level and meso-level data that
exhibits and quantifies the mutabity of motives held by open source developers. These findings are
consitent with the view that individual motivations are subject to changes in this context under the
influence of the accumulation of relevant experience. The aspect of endogeneity raises some
methodological problems for econometric analyses of the role of motivation in the observed behavior
of developers with regard to work roles, effort and acceptance of payment for work on FLOSS
projects. To the extent that these behaviors are formed concurrently, their value as “explanatory
variables” is likely to be diminished.
Issues of the latter kind appear to be especially complicated as well as important in regard to
efforts to describe and explain the patterns in the circulation of developers among projects of different
kinds and sizes, which is the system-level view of the problems of personnel recruitment and retention
with which leaders of FLOSS projects have to contend. Where in a diverse landscape of projects
FLOSS developers find it possible to substantially improve their software skills, and where they take
those skills if they change the projects to which they contribute, are no less important questions that
deserve more systematic research on a scale larger than the exploration offered on this occasion.
Despite the limited scale on which we were able to illustrate the potentialities of using capture-

44
recapture approaches to describing the inter-product movements of FLOSS developers, that exercise
has brought to light indications that the large projects form an powerful field of attraction, retaining
developers who start there and drawing in others whose initial efforts and skill acquisition were first
acquired in very different (independent and very small project) contexts.
The distinctions among the profiles that were derived using hierarchical cluster analysis of
developer motivations appear to be robust from several different perspectives. First, the profiles lend
themselves to interpretation, something that is by no means guaranteed in the application of clustering
methodology. Second, demographic variables not used in the derivation of the profiles are quite
consistent with their interpretations. Third, the clusters accord in important ways, but not invariably,
with the additional information provided by respondents regarding their motivations. Fourth, when
information about the size of the projects are used to sort profiled developers, there is a consistency in
the interpretation of ‘professionals’ and ‘aspiring hackers’ cluster profiles as more being likely to be
engaged in larger projects while the other three profiles are associated with smaller projects. Fifth,
and finally, the use of ordered probit analysis to examine factors affecting project choices finds one
difference in motivational profiles to be influential: that is the difference between membership in the
cluster of “aspiring hackers” and that of the cluster of “social learners” does exert a positive
differential effect upon the probability of working on large projects, and a negative effect on
probability of being a contributor to a very small project. Other differences in motivation are
quantitatively weaker as well as failing to reach conventional levels of statistical significance.
These latter results, when coupled with the heterogeneity of participation in each size class
may indicate that the effects of different motivations are more useful for marginal analysis than as a
structural variable – i.e., initial motivational orientations, at least, are not sufficient to govern choices
of among projects of different sizes, nor does project size itself dictate the profiles of the developers
that are attracted to that part of the size distribution. Further analysis of the motivational profiles and
other attributes of developers who move to projects in a markedly different size range is a topic that
clearly calls for further research. But, as has been pointed out, a general attack on it with longitudinal
data would have to address the complications arising from the mutability and endogeneity of
individuals motives – issues that have been finessed in this study by basing our motivational profiles
on survey respondents’’ retrospective reports of their reasons for starting to develop FLOSS.
The results of this paper provide strong evidence that heterogeneity of motivation is a key
feature of open source communities. How this heterogeneity is managed, accommodated, or resisted
seem likely to be important influences on the stability, persistence, and outcomes of open source
development efforts. In particular, it suggests that communities that find ways of mobilizing
individuals with quite different motivations to join and to persevere in their contributions as well as
making effective use of each of the different motivational types may expect greater success in their
efforts. Evaluation of this prediction and further elaboration of the implications of developer

45
heterogeneity appear to be the frontier to which research should now direct efforts in studying open
source communities.
References
Benkler, Y., 2002. Coase’s penguin, or, Linux and the nature of the firm. Yale Law Journal 112(3), pp. 369-446. Benkler, Y., 2006. The Wealth of Networks: How Social Production Transforms Markets and Freedom. Yale University Press, New Haven CT. Bertrand, M., Mullainathan, S., 2001. Do people mean what they say? Implications for subjective survey data. American Economic Review Paper and Proceedings, 91(2), pp. 67-72. Bitzer, J., Schrettl, W. and Schröder, P.J.H., 2004. Intrinsic motivation in open source software development. Freien Universität Berlin Working Paper No 2004/19. Bonaccorsi, A, Rossi, C., 2004. Altruistic individuals, selfish firms? The structure of motivation in open source software. Unpublished Working Paper. Sant’Anna School of Advanced Studies, Pisa, Italy. Bossard, J.H., 1945. Law of family interaction. American Journal of Sociology 50, pp. 292-294. Boston Consulting Group, 2003. Boston Consulting Group/OSDN Hacker Survey. Boston Consulting Group, Boston MA. Butler, B.S., 2001. Membership size, communication activity, and sustainability: A resource-based model of online social structures.” Information Systems Research 12(4), pp. 346-362. Crowston, K., Howison, J., 2005. The social structure of free and open source software development. First Monday 10(2), http://www.firstmonday.dk/issues/issue10_2/crowston/index.html.
Crowston, K. & Howison, J., 2006. Hierarchy and centralization in free and open source software team communications. Knowledge, Technology and Policy, 18(4): pp. 65-85. [Available at http://floss.syr.edu/publications/ktp2005.pdf.]
Dalle, J-M., David, P.A. 2005. The allocation of software development resources in ‘open source’ production mode. In: Feller, J, Fitzgerald, B, Hassam, S., Lakhani K.R., (Eds.), Perspectives on Free and Open Source and Free Software. MIT Press, Cambridge MA, pp. 297-328. [Preprint available as SIEPR Discussion Paper 02-27 (2003) at: http://siepr.stanford.edu/papers/pdf/02-27.pdf.] Dalle, J-M., David, P.A., Ghosh, R.A. and Steinmueller, W.E., 2005. Advancing Economic Research on the Free and Open Source Software Mode of Production.” In: Wynants, M, and J Cornelis. (Eds.), Building Our Digital Future: Future Economic, Social, & Cultural Scenarios Based on Open Standards. VUB Press, Brussels, pp. 395-428. Dalle, J-M., David, P.A., 2006. Simulating code growth in libre (open-source) mode. In: Brousseau, E, and N Curien. (Eds.), Internet and Digital Economics. Cambridge University Press, Cambridge. Dalle, J-M., David, P.A., 2008. Motivation and coordination in Libre software development: A stygmergic simulation perspective on Large Community-Mode projects. DRUID-SCANCOR

46
Conference Paper, Stanford University (March). A revised version of SIEPR Discussion Paper 07-024, December. [Available at: http://siepr.stanford.edu/papers/pdf/07-24.pdf] Dasgupta, P., David, P.A., 1994. Towards a new economics of science. Research Policy 23: pp. 487-521. David, P. A., 2006. A Multi-dimensional view of the ‘sustainability’ of Free & Open Source Software development: Sustaining commitment, innovation and maintainability with growth. OSS Watch Conference on Open Source and Sustainability, Said Business School, Oxford, April 10-12, 2006. [Available at: http://www.oss-watch.ac.uk/events/2006-04-10-12/presentations/pauldavid.pdf ]. David, P. A., Rullani, F., 2008. Dynamics of innovation in an ‘open source’ collaboration environment: Lurking, laboring and launching FLOSS projects on SourceForge, Industrial and Corporate Change, 17(4): pp. 647-710. [Preprint available as SIEPR Discussion Paper 07-022, at: http://siepr.stanford.edu/papers/pdf/07-22.pdf.] David, P. A., Shapiro, J. S., 2007. Free/Libre and open source software’s global diffusion and production in institutions of higher education: Results from the FLOSSWorld survey of developing and transition economies). Presented at the 2nd International Workshop of the EC FLOSSWorld Project, Brussels, 9-11tJune 2007. [Available at: http://www.oii.ox.ac.uk/research/project.cfm?id=31.] David, P. A., Waterman, A. and Arora, S., 2003. FLOSS-US: The Free/Libre/Open Source Software Survey for 2003. SIEPR-NSF Project on Open Source Software Working Paper, September. [Available at: http://siepr.stanford.edu/programs/OpenSoftware_David/FLOSS-US-Report.pdf ] Deci, E. L., Ryan, R. M., 1985. Intrinsic Motivation and Self-Determination in Human Behavior. Plenum, New York. Dunbar, R.I.M., 1993. Coevolution of neocortical size, group size and language in humans. Behavioral and Brain Sciences 16, pp. 681-735. Elliott, M.S, and Scacchi, W., 2006. Mobilization of software developers: The free software movement. [Available at: http://www.ics.uci.edu/~wscacchi/Papers/New/Elliott-Scacchi-Free-Software-Movement.pdf.] Everitt, B S., 1993. Cluster Analysis, 3rd ed. Edward Arnold, London. Feller, J., Fitzgerald,B., 2002. Understanding Open Source Software Development. Addison-Wesley, London. Feller, J., Finnegan, P. Kelly, D. MacNamara, M., 2005. Initial characterisation and roadmap of libre software development, CALIBRE (EC FP6 – Project 4337: IST 2002-2.3.2.3: Coordination Action for Libre Software), Report D.1.1. [Available at: http://bl.ul.ie/calibre/deliverables/D1.1.pdf.] Fitzgerald, B. 2005. Has Open Source a Future?, in Perspectives on Open Source Software, J. Feller, B. Fitzgerald, S. A. Hissam and K. R. Lakhani, eds. Cambridge, MA: MIT Press. FLOSSPOLS, 2005. Free/Libre and open source software: Policy support, Deliverable D10, FLOSSPOLS Project, eGovernment Unit of the European Commission's DG Information Society, Sixth Framework Programme of the European Union. [Available at http://flosspols.org/deliverables/FLOSSPOLS-D10-skills%20survey_interim_report-revision-FINAL.pdf] FLOSSImpact, 2006. Economic impact of open source software on innovation and the competitiveness of the Information and Communication Technologies (ICT) sector in the EU. Final

47
Report, FLOSSPOLS Project, eGovernment Unit of the European Commission's DG Information Society, Sixth Framework Programme of the European Union. [Available at http://ec.europa.eu/enterprise/ict/policy/doc/2006-11-20-flossimpact.pdf] FLOSSWorld, 2007. Free/Libre and open source software: Worldwide impact study, Deliverable 31, International Report -- Skills Study. FLOSSPOLS Project, eGovernment Unit of the European Commission's DG Information Society, Sixth Framework Programme of the European Union. [Available at: http://www.flossworld.org/deliverables.php.] Ghosh, R.A, Glott, R., Krieger, B., Robles, G., 2002. Free/Libre and open source software: Survey and study.” International Institute for Infonomics, University of Maastricht, The Netherlands. Available at http://www.infonomics.nl/FLOSS/report/. Ghosh, R.A, Glott, R., 2005. Free Software Developers: Who, How and Why?, Ch. 7 in The Economics of the Digital Society, Luc Soete and Bas ter Weel, eds., Elgar, Cheltenham, UK. Giuri, P., Ploner, M., Rullani, F., Torrisi, S., 2004. Skills and openness of OSS projects: Implications for performance. Unpublished Working Paper, Università di Camerino. Gladwell, M., 2002. The Tipping Point: How Little Things Can Make a Big Difference. Back Bay Books, Boston, MA. Grilches, Z., 1977. Estimating the returns to schooling: Some econometric problems. Econometrica 45(1), pp. 1-22. Hars, A., Ou, S., 2002. “Working for free? Motivations for participating in open-source projects.” International Journal of Electric Commerce 6, pp. 25-39. Haruvy, E., Wu, F., Chakravarty, S., 2003. Incentives for developers’ contributions and product performance metrics in open source development: An empirical exploration. Unpublished working paper, University of Texas at Dallas. Healy, K, Schussman. A., 2003. The ecology of open-source software development. Unpublished Working Paper, University of Arizona. Henkel, J. von Hippel, E., 2004. Welfare implications of user innovation. The Journal of Technology Transfer 30(1-2), pp. 73-87. Hertel, G, Nieder, S. and Herrmann, S., 2003. Motivation of Software Developers in Open-Source Projects: An Internet-based Survey of Contributors to the Linux Kernel. Research Policy 32: 1159-1177. Howison, J., Inoue, K., and Crowston, K., 2006. Social dynamics of free and open source team communications. In: Proceedings of the IFIP 2nd International Conference on Open Source Software (Lake Como, Italy), 203/2006 of IFIP International Federation for Information Processing. Springer, Boston, US, pp.319–330. Iannici, F., 2005. Coordination processes in open source software development: The Linux case study. Emergence: Complexity and Organization 7(2), pp. 21-31. Krishnamurthy, S. 2002. Cave or community? An empirical examination of 100 open source projects. First Monday 7(6), http://www.firstmonday.org/issues/issue7_6/krishnamurthy/index.html.

48
Krishnamurthy, S. 2005. The elephant and the blind men – Deciphering the free/libre/open source puzzle.” First Monday 10, Special Issue nos. 2, http://www.firstmonday.org/issues/special10_10/krishnamurthy/index.html . Lakhani, K.R., von Hippel, E., 2002. How open source software works: ‘free’ user-to-user assistance.” Research Policy 32(6), pp. 923-943. Lakhani, K., Wolf, R., Bates, J. and DiBona, C., 2002. The Boston Consulting Group Hacker Survey. http://downloads.planetmirror.com/pub/lca/2003/proceedings/papers/Hemos/Hemos.pdf. Lakhani, K., Wolf, R., 2005. Why hackers do what they do: Understanding motivation and effort in free/open source software projects. In: Feller, J, Fitzgerald, B, Hassam, S., Lakhani K.R. (Eds.), Perspectives on Free and Open Source Software. MIT Press, Cambridge MA, pp. 3-22. Lee, S, Moisa, N. and Weiss, M., 2003. Open source as a signaling device – An economic analysis. Unpublished Working Paper, Goethe-University. Lerner, J, and J. Tirole. 2002. Some simple economics of open source. Journal of Industrial Economics, 50(2): pp. 197-234. Lerner, J. Tirole, J., 2005. The economics of technology sharing: Open source and beyond. Journal of Economic Perspectives 19, pp. 9-120. Lerner, J, Pathak, P.A. and Tirole, J., 2006. The dynamics of open source contributors. American Economic Review Papers and Proceedings 96(2), pp. 114-118. MacIntyre, A., 1984. After Virtue: A Study in Moral Theory. University of Notre Dame Press, Notre Dame, IN. Manski, C., 2004. Measuring expectations. Econometrica 72(5), pp. 1329-1376. Maurer, S.M., Scotchmer, S., 2006. Open source software: the new intellectual paradigm, NBER Working Paper 12148. McGowan, D. 2005. Legal aspects of free and open source software, Ch.24 In: J. Feller, J., Fitzgerald, B., Hissam, S.A., and Karim R. Lakhani, K.R. (Eds.), Perspectives on Free and Open Source Software. Cambridge MA: MIT Press, pp. 361-392. Michlmayr, M., 2004. Managing volunteer activity in free software projects. Proceedings of the 2004 Usenix Annual Technical Conference, Freenix Track, pp. 93-102. Michlmayr, M., Hill B.M., 2003. Quality and the reliance on individuals in free software projects. Proceedings of the 3rd Workshop on Open Source Software Engineering, pp. 105-109. Mitsubishi Research Institute, 2004. Free/Libre/Open Source Software Asian Developers Online Survey (FLOSS-ASIA). Unpublished Monograph, Tokyo, Japan. Morrison, P.D., Roberts, J.H. von Hippel,E., 2000. Determinants of user innovation and innovation sharing in a local market. Management Science 46(12), pp. 1513-1527. Raymond, E., 2001. The Cathedral and the Bazaar. O’Reilly, Sebastopol, CA. Robles, G., Jesus M. Gonzalez-Barahona, J. M., 2006. Geographic Location of Developers at SourceForge. Proceedings of the 2006 International Workshop on Mining Software Repositories, ACM Press, New York, pp. 144-150.

49
Robles, G, Gonzalez-Barahona, J.M. and Michlmayr, M., 2005. Evolution of volunteer participation in libre software projects: Evidence from Debian.” Proceedings of the First International Conference on Open Source Systems, pp. 100-107. Robles, G., Scheider, H. Trekowski, I. and Weber, N., 2001. Who is doing it? A research on Libre software developers. Unpublished Working Paper, Fachgebiet für Informatik und Gesellschaft TU-Berlin. Rossi, C, and Bonaccorsi, A., 2005. Intrinsic motivations and profit-oriented firms in Open Source software. Do firms practice what they preach? Unpublished Working Paper, Sant’Anna School of Advanced Studies, Pisa, Italy. Rullani, F. 2007. Dragging developers towards the core, CESPRI Working Papers 190, CESPRI, Centre for Research on Innovation and Internationalisation, Universita' Bocconi, Milan, Italy. [Available at: http://ideas.repec.org/p/cri/cespri/wp190.html] Stiglitz, J., 1987. Causes and consequences of dependence of quantity upon price. Journal of Economic Literature 25, pp. 1-48. von Krogh, G., 2003. Open-Source software development: An overview of new research on innovator’s incentives and the innovation process, Sloan Management Review, 44(3), pp. 14-18. von Krogh, G., Spaeth, S., Lakhani, K. R., 2003. Community-joining and specialization in open source software innovation: a case study,” Research Policy, 32(7): pp. 1217-1241. von Krogh, G., Spaeth, S., Haefliger, S. and Wallin, M., 2008. Open Source Software: What we know (and do not know) about motives to contribute. DIMEWorking Papers on Intellectual Property Rights, No.38 (April). [Available at: http://www.dime-eu.org/working-papers/wp14.] von Hippel, E., 1988. The Sources of Invention. Oxford University Press, New York. von Hippel, E. 2002. Horizontal innovation networks - by and for users. Massachussetts Institute of Technology, Sloan School of Management, Working Paper No. 4366-02. June. von Hippel, E. 2005. Democratizing Innovation. Cambridge MA: MIT Press. Watts, Duncan J., 2004. Six Degrees: The Science of a Connected Age. W. W. Norton, New York. Weber, Steven, 2004. The Success of Open Source. Cambridge, MA: Harvard University Press. Wooldridge, J., 2002. Econometric Analysis of Cross Section and Panel Data. MIT Press, Cambridge MA. Ye, Y. and K. Kishida, 2003. Toward an understanding of the motivation of open source software developers. Proceedings of 2003 International Conference on Software Engineering (ICSE2003),” Portland, Oregon, pp.419-429.
50
Figure 1a. Motivation for first developing FLOSS (Q4)
31.0
26.6
13.4
22.5
36.3
24.4
42.8
36.6
47.1
32.4
25.2
26.7
26.9
32.1
31.9
32.5
34.7
25.1
31.5
36.1
10.4
23.8
24.7
29.3
26.3
19.5
27.1
17.1
21.9
14.5
19.5
82.7
20.0
22.1
30.3
19.1
12.3
16.0
5.4
16.4
6.9
12.1
3 4
0% 20% 40% 60% 80% 100%
Q4k: Employer wanted me to collaborate in OS
Q4c: Needed modification of existing software
Q4d: Needed to fix bugs in existing software
Q4i: Liked challenge of fixing bugs in existing software
Q4j: Wanted to learn how particular program worked
Q4h: Way to become better programmer
Q4g: Wanted to interact with like-minded programmers
Q4e: As FS user, wanted to give back to community
Q4f: Wanted to provide alternatives to proprietary
Q4b: We should be free to modify software we use
Q4a: Best way for software to be developed
Very importantImportantA bit importantNot important
Source: David, Waterman and Arora (2003), based on analysis of 1,459 respondents to the FLOSS-US survey who answered every sub-part of Q4.
Of the 1459 respondents to Q4, 289 or approx. 20 percent, also marked the option “Other” and wrote in another reason, indicating its position on the Likert scale. The distribution of importance rating on this answer was as follows: Very important: 59.2%:, Important: 9.2%; A bit important: 1.4%; Not important: 30.2%
Figure 1b. Motivation for choosing project (Q12)
16.1
61.0
77.3
34.8
17.5
31.5
13.9
69.0
79.7
42.1
16.7
37.7
0.0 10.0 20.0 30.0 40.0 50.0 60.0 70.0 80.0 90.0
Q12f: Other
Q12b: Technically interesting
Q12d: Software being developed would be useful to me
Q12e: I launched the project
Q12c: Knew people working on it
Q12a: Important and visible project
Current/most recent projectFirst Project
Source: Analysis of FLOSS-US. For current project, statistics include 1,394 respondents who listed some motivation for their current project choice and answered every part of Q4. For first project, statistics include 1,232 respondents who listed some motivation for first project and who answered every part of Q4.

51
Figure 2. Density of motivation factor scores
Source: Analysis of FLOSS-US. 1,459 observations. Density depicted using epanechnikov kernel with half-width of 0.15 evaluated using 50 points.

52
Figure 3. Dendrogram of five clusters constructed from Q4 only.
Source: Hierarchical cluster analysis of total set of complete FLOSS-US survey responses to motivational question set (Q4) on reasons for beginning to contribute to FLOSS development.
Figure 4. Histogram of sizes of respondents’ projects found on SourceForge
Source: Analysis of FLOSS-US and search of SourceFourge.Net (SF). Histogram bins have width one. If only one of a developer’s projects has known size, this figure plots the developer according to that size. If both a developer’s current and first projects have known size, this figure plots the developer according to the mean of the two projects’ sizes, rounded to the nearest integer. Obviously large projects (Linus Kernel, Apache, etc.) not included.

53
Figure 5. Distinctness of project sizes: estimated from the distributions of individuals’ motivation factor-scores arising from alternative binary
partitions of the FLOSS-US Survey subsample whose project sizes are known
Source: Based on assigned individual “motivational factor scores”, using estimated factor loadings (see Table A1 and Figure 3) computed for all respondents to the FLOSS-US Survey who gave complete answers to question-set Q4: reasons for beginning to contribute to FLOSS development. See the text for further discussion.

54
Table 1. FLOSS-US compared with other pre-2005 surveys of FLOSS developers
Type Online survey, website posts, emailed lists Emailed developers Emailed developers from a
single project
Survey title TU Berlin FLOSS-EU FLOSS-US FLOSS-
ASIA BCG Apache Linux kernel
Reference if different from title
Robles et al. (WIDI 2001)
Ghosh et al. (2002)
David, Waterman, and Arora
(2003)
Mitsubishi (2004)
Wolf et al (2002);
Lakhani and Wolf (2005)
Hars and Ou (2002)
Haruvy, Wu, &
Chakravarty (2003)
Lakhani and von Hippel (2002)
Hertel, Nieder, and Herrman
(2003)
Data collection June 2001 to Aug 2001
Feb 2002 to Apr 2002
Jan to June 2003
Dec 2003 - Jan 2004 Oct 2001,
Apr 2002 - - Oct 99 to Feb 00 Feb-Apr 2000
Method
Online survey, website posts,
emailed lists
Online survey, website posts, emailed lists
Online survey, website posts,
emailed lists
Online survey, website posts,
emailed lists
Emailed SourceForge
project contributors
Emailed developers
Emailed developers Emailed
developers
Linux mailing list
announcements
Usable responses (rate) 5478 2784 1588 138 684 of 1994 (34%)
79 of 389 (20%)
160 of 2000 (8%) 336 of 1709
(19.6%) 141 (half
developers)
Motivation questions None
Reasons for joining FLOSS
community; reasons for staying in FLOSS
Reason for developing
FLOSS, reasons for
specific project
Reason for developing
FLOSS
Reasons for working on
specific FLOSS project
Reasons for
developing FLOSS
Reasons for developing FLOSS or
working on specific project
None
Reasons for working in
Linux community
Number of projects - - 1811 * - 287 41 (with
25% from Linux)
More than 90 1 1
Respondents per project - - 0.88 * - 2.38 1.93 1.78 - -
Table 1 continued on next page.

55
Table 1 continued from previous page.
Source TU Berlin FLOSS-EU FLOSS-US FLOSS-ASIA BCG Hars and
Ou (2002)
Haruvy, Wu, &
Chakravarty (2003)
Lakhani and von Hippel
(2002)
Hertel, Nieder, and
Herrman (2003)
Location North America (%) 35% 13% 27% 1% 45% - - - 48%
Western Europe (%) 47% 71% (EU) 53% 2% 38% - - - 37% (all Europe)
Number continents - - 6 3 6 - 5 - Number countries 94 - 65 16 52 - "At least 18" - 28 Age (mean) 27 27 29.0 * 27 29.8 - - - - Male 1 98.9% 98.4% 98.5% 97.5% 95% - - - Employment status Not employed - 4% 4% - - - 11% - 5% Employed - 79% 68% - - - 89% - 72% Student 0 17% 29% 16% - 14% 32% - 23% Highest Education High school - - 19% - - - - - - Bachelor's degree 41% 33% 36% - - 48% 31% - - Master's degree 11% 28% - - 21% 16% - - Ph.D. 4% 9%
43% - - 3% 21% - -
FLOSS experience - 4.1 5.1 4 5.3 - 4.7 - - Mean effort - - 10.0 - 14.1 - - - 18.4 Note: response rate shows number of usable observations out of total number solicited. FLOSS experience in years, mean effort in hours per week. "Employed" includes self-employment or work at a firm. BCG randomly chose 10 percent of SF projects with both more than one developer and reported maturity stage of Alpha, Beta, or Production/Stable, and they emailed developers listed in these projects to obtain 526 responses. BCG also emailed all participants in SF projects with reported maturity stage of Mature who had multi-person teams to obtain 158 additional responses. Hars and Ou (2002) obtained email addresses from "discussion lists and news groups ... both general open source communities and specific open source programmers' forums" (p. 5). Haruvy et al. (2003) emailed "2000 programmers listed as contributors on open source web pages and on selected open source developer lists" (p. 16). They provide no further details or exact websites. Haruvy, Wu, & Chakravarty (2003) do not count modules as separate projects. Hertel, Nieder, and Herrman: half of respondents were active developers, others merely read the Linux kernel mailing list. They have no defined response rate since they emailed lists recent/current projects (and their paper does not declare the lists' membership size) rather than directly contacting a set number of individual developers. FLOSS-EU, FLOSS-US, BCG: FLOSS experience is years since first FLOSS contribution. FLOSS-US: mean commitment averages current/most recent and first projects. * implies new estimates from underlying FLOSS-US data rather than stated in David, Waterman, and Arora (2003). Number of projects: FLOSS-US counts first and current..

56
Table 2. Stability of reasons for selecting a project: different first and current projects compared Panel A: Chosen motivations from list Response for first project Q12a Q12c Q12e Q12d Q12b ANOVA P value N Response for current project Q12a: Important and visible project 0.39 0.18 0.30 0.68 0.58 8.62 0.00 426 Q12c: Knew people working on it 0.40 0.30 0.26 0.66 0.60 5.65 0.00 191 Q12e: I launched the project 0.25 0.14 0.38 0.65 0.50 9.09 0.00 481 Q12d: Software would be useful 0.27 0.17 0.28 0.73 0.54 6.10 0.00 909 Q12b: Technically interesting 0.29 0.17 0.28 0.70 0.59 5.52 0.00 783 Pearson chi-squared (16) 14.38 Prob > chi-squared 0.57 Panel B: Other written motivations Response for first project
Intrinsic Knowledge Visibility Practical Principle Other listed None listed Total
Response for current project Intrinsic 10 0 0 0 0 0 8 18 Instrumental-knowledge 0 16 0 0 0 0 6 22 Instrumental-visibility/signaling 0 0 3 0 0 0 1 4 Instrumental-practical 0 0 0 50 0 0 34 84 Principle 0 0 0 0 13 0 18 31 Other listed 0 0 0 0 0 12 21 33 None listed 4 8 0 63 4 10 1,178 1,267 Total 14 24 3 113 17 22 1,266 1,459 Pearson chi-squared(36) 3,400 Prob > chi-squared 0.00 Notes: Analysis using FLOSS-US survey responses to Q12. In Panel A, each row shows distribution of responses for current project across responses for first project. An observation in Panel A may appear in multiple cells. Chi-squared (degrees of freedom) tests independence of rows and columns on the basis of a 1,459 observation dataset with the same cell frequencies appearing in Panel A, but with each observation appearing in only one cell – assigned on the basis of being “very important” or “important:” Panel B shows a cross-tabulation of responses supplied to under the option of writing in an “Other reason”, and these are tabulated using the elaboration of the intrinsic-extrinsic (instrumental) motive framework shown more fully in Table 6a and 6b. In Panel B, an observation can appear in only one column, being the first-stated “other reason” in those cases where more than one distinct motive was volunteered. In both panels, diagonal entries (indicating same response for first as for current project) appear in bold. All entries exclude observations with same first and current projects.

57
Table 3. Heterogeneities in developers’ motivations among the FLOSS-US survey respondents: bootstrap estimates
Population
Mean Standard error:
30 obs Standard
error: 100 obs Q4a: Best way for software to be developed 0.32 0.08 0.05 Q4b: We should be free to modify software we use 0.47 0.09 0.05 Q4f: Wanted to provide alternatives to proprietary 0.37 0.09 0.05 Q4e: As free software developer, wanted to give back to community 0.43 0.09 0.05 Q4g: Wanted to interact with like-minded programmers 0.24 0.08 0.04 Q4h: Way to become better programmer 0.36 0.09 0.05 Q4j: Wanted to learn how particular program worked 0.23 0.08 0.04 Q4i: Liked challenge of fixing bugs in existing software 0.13 0.06 0.03 Q4d: Needed to fix bugs in existing software 0.27 0.08 0.04 Q4c: Needed modification of existing software 0.31 0.08 0.05 Q4k: Employer wanted me to collaborate in OS 0.03 0.03 0.02 Q12a: Important and visible project 0.38 0.09 0.04 Q12c: Knew people working on it 0.17 0.07 0.04 Q12e: I launched the project 0.42 0.09 0.05 Q12d: Software being developed would be useful to me 0.80 0.08 0.04 Q12b: Technically interesting 0.69 0.08 0.04 Notes: Analysis using FLOSS-US. Bootstrap uses 200 draws with replacement, number of observations drawn indicated in each column (30, 100). Q4 “Population Mean” values show the proportions responding "very important" in the entire populations of FLOSS-US respondents on which Figures 1a, and 1b, respectively, are based.

61
Table 4. Measured salience of motivations for first developing FLOSS and for Project Selections: Normalized intensity maps for FLOSS-US Survey population Survey item Panel A: Reason for first developing FLOSS (Q4) Q4a: Best way for software to be developed 1.16 Q4b: We should be free to modify software we use 2.33 Q4f: Wanted to provide alternatives to proprietary 0.77 Q4e: As free software developer, wanted to give back to community 2.93 Q4g: Wanted to interact with like-minded programmers 0.73 Q4h: Way to become better programmer 1.14 Q4j: Wanted to learn how particular program worked 0.58 Q4i: Liked challenge of fixing bugs in existing software 0.27 Q4d: Needed to fix bugs in existing software 0.49 Q4c: Needed modification of existing software 0.57 Q4k: Employer wanted me to collaborate in OS 0.02 Mean across Q4 sub-questions 1.00 N 1,459 Panel B: Reason for choosing specific project (Q12)
Current/ most recent
project First
project Q12a: Important and visible project 0.77 0.71 Q12c: Knew people working on it 0.34 0.39 Q12e: I launched the project 0.86 0.78 Q12d: Software being developed would be useful to me 1.62 1.74 Q12b: Technically interesting 1.41 1.37 Mean across Q12 sub-questions 1.00 1.00 N 1,459 1,459 Source: Analysis of FLOSS-US. Higher values represent greater importance assigned to question. With each column of each panel, shading represents relative importance: most important items have darkest shade while least important items have no shading. Panel A shades 3 most important items, while Panel B shades 2 most important items, and leaves the least important un-shaded. See text for formulae used to compute normalized intensity scores, which are defined differently for Panel B questions than for questions in Panel A.

62
Table 5. Normalized Motivational Intensity Maps for the Cluster Profiles based on Reasons
for Beginning to Contribute to FLOSS development and for Choice of Project Survey item C1 C2 C3 C4 C5 Panel A: Reason for first developing FLOSS (Q4) Q4a: Best way for software to be developed 0.06 0.05 1.48 1.12 1.09 Q4b: We should be free to modify software we use 0.19 0.05 0.95 1.91 2.22 Q4f: Wanted to provide alternatives to proprietary 0.06 0.04 1.02 0.54 1.44 Q4e: As FS software user, wanted to give back to community 0.42 0.09 0.44 0.88 3.00 Q4g: Wanted to interact with like-minded programmers 0.10 0.29 0.83 0.17 1.13 Q4h: Way to become better programmer 0.54 1.08 2.86 0.12 0.76 Q4j: Wanted to learn how particular program worked 0.13 2.51 1.54 0.24 0.36 Q4i: Liked challenge of fixing bugs in existing software 0.16 1.97 0.77 0.24 0.20 Q4d: Needed to fix bugs in existing software 1.29 3.44 0.37 3.86 0.14 Q4c: Needed modification of existing software 1.02 1.50 0.45 9.43 0.06 Q4k: Employer wanted me to collaborate in OS 7.03 0.00 0.29 0.93 0.61 Mean across Q4 sub-questions 1.00 1.00 1.00 1.00 1.00 Number of respondents 59 145 696 234 325 Panel B: Reason for choosing current/most recent project (Q12) Q12a: Important and visible project 0.93 0.99 1.10 0.84 0.82 Q12c: Knew people working on it 0.75 1.02 1.04 1.01 0.82 Q12e: I launched the project 1.45 0.52 0.88 0.90 1.56 Q12d: Software being developed would be useful to me 0.87 1.35 0.92 1.59 0.75 Q12b: Technically interesting 1.00 1.11 1.06 0.67 1.05 Mean across Q12 sub-questions 1.00 1.00 1.00 1.00 1.00 Number of respondents 59 145 696 234 325 Source: Analysis of FLOSS-US survey. Panels A and B present “twice-normalized” scores for each of the five clusters generated by hierarchical complete linkage cluster analysis of responses to question 4. Higher scores reflect greater relative importance assigned to the indicated reason. See text for definitions of “twice-normalized” motivational intensity scores for individual clusters.
Table 6. Key characteristics of motivational clusters Cluster Profile Key characteristics
1 Professionals Non-ideological, expert, self-employed or company-sponsored to collaborate on FLOSS projects
2 Aspiring hackers No need to modify existing code but like fixing bugs and learning new programs
3 Social learners Become better programmers, learn how programs work, work with like-minded, "give back to community," support FLOSS ideology
4 Social programmers Experienced, employment related needs to use, modify existing code and fix bugs; project choice influenced by social connections with other developers
5 “User-innovators” Modifying existing software unimportant, learning & interacting with like-minded others unimportant; wanted to "give back to community," and launched own project.
Source: See text discussion for labeling of cluster-profiles based on intensity maps (Table 5), and comparisons of within-cluster distributions of “other reasons” from Tables 8a, 8b.

63
Table 7: Demographic & Occupational Characteristics of Clusters-- Descriptive Statistics
C1 C2 C3 C4 C5 ANOVA F-stat
ANOVA P-value
Age 30.0 28.8 28.5 30.7 28.5 3.86 0.00 (7.8) (7.2) (8.0) (8.5) (8.0) Years experience in FLOSS 5.6 6.4 5.1 5.4 4.1 8.60 0.00 (3.9) (4.9) (4.2) (4.7) (3.3) Began developing FLOSS in year 2000 or later 0.29 0.30 0.42 0.38 0.51 6.41 0.00 Began developing FLOSS before the year 2000 0.68 0.66 0.54 0.58 0.46 5.56 0.00 Highest formal education: high school 0.20 0.14 0.22 0.12 0.23 4.42 0.00 Highest formal education: undergraduate 0.42 0.39 0.38 0.36 0.37 0.26 0.91 Highest formal education: graduate 0.35 0.42 0.34 0.46 0.35 3.11 0.01 Highest formal education: professional 0.04 0.05 0.06 0.07 0.05 0.36 0.84 Female 0.00 0.00 0.02 0.03 0.01 1.29 0.27 No children 0.69 0.84 0.77 0.76 0.81 2.07 0.08 Children under age six 0.14 0.09 0.12 0.12 0.11 0.44 0.78 Children over age six 0.12 0.04 0.09 0.14 0.07 3.22 0.01 Unmarried, without partner 0.42 0.38 0.42 0.34 0.36 1.34 0.25 Unmarried, not living with partner 0.16 0.16 0.13 0.10 0.18 1.43 0.22 Unmarried, living with partner 0.16 0.15 0.19 0.20 0.16 0.53 0.71 Married, not living with spouse 0.00 0.00 0.01 0.01 0.00 0.56 0.69 Married, living with spouse 0.26 0.30 0.24 0.32 0.29 1.19 0.31 Separated/divorced 0.00 0.00 0.01 0.03 0.02 1.08 0.37 Student 0.19 0.27 0.30 0.24 0.32 1.79 0.13 Employee 0.56 0.59 0.49 0.55 0.50 1.66 0.16 Self-employed 0.19 0.13 0.16 0.18 0.15 0.70 0.59 Not employed 0.07 0.01 0.04 0.02 0.04 1.95 0.10 Expected future FLOSS role: consultant 0.46 0.59 0.54 0.56 0.50 1.45 0.22 Expected future FLOSS role: employee 0.47 0.57 0.56 0.61 0.62 1.74 0.14 Expected future FLOSS role: company owner/ officer/ director/"other"
0.53 0.43 0.53 0.57 0.48 2.43 0.05
N 59 145 696 234 325 Note: ANOVA tests the null hypothesis that all clusters have same mean value. Standard deviations for continuous variables appear in parentheses below mean values. Each cell presents mean for all individuals answering the relevant survey item, and nonresponse causes some cells to represent less than the total number of observations (N) shown for the relevant cluster. For the age and experience variables, the figures in parentheses given the standard deviations around the respective cluster means.

64
Table 8a. Listed "other" motivations: total FLOSS-US sample and distribution within motivational clusters
Total Cluster
1 Cluster
2 Cluster
3 Cluster
4 Cluster 5
Panel A: Other reasons for first developing FLOSS (Q4): Percentages of all “other reasons”
Fun 13.64 28.57 28.57 11.11 13.51 8.11 Enjoy community 1.4 0 3.57 1.59 0 1.35 Total intrinsic 15.0 28.57 32.14 12.7 13.51 9.46 Instrumental-knowledge 6.64 0 3.57 7.94 8.11 6.8 Instrumental-Visibility/reputation/signaling 6.64 9.52 7.14 3.97 8.11 9.5 Needed to modify or create software 16.43 19.05 21.43 11.9 18.92 20.3 FLOSS best quality 6.29 0 10.71 5.56 8.11 6.8 Cost 8.39 9.52 14.29 9.52 5.41 5.4 Collaboration essential / extend project lifetime 3.85 0 0 7.14 0 2.7 Total instrumental-serve practical goal 35.0 28.6 46.4 34.1 32.4 35.1 Positive ideology 7.34 4.76 0 10.32 2.7 8.11 Negative ideology 3.85 0 0 6.35 5.41 1.35 Give back to community 2.1 0 0 0.79 2.7 5.41 Total instrumental-serve “principles” 13.3 4.8 0.0 17.5 10.8 14.9 Another listed reason 23.43 28.57 10.71 23.81 27.03 24.32 Total 100.0 100.0 100.0 100.0 100.0 100.0 N writing in any other reason 286 55 91 93 21 26 Pearson chi-squared(20), subtotals in italics 25.55 Prob > chi-squared 0.18 Pearson chi-squared(44), all groups 50.66 Prob > chi-squared 0.23

65
Table 8b --distribution of “other motivations” for project choices
Total Cluster
1 Cluster
2 Cluster
3 Cluster
4 Cluster
5 Panel B: Other reasons for choosing specific project (Q12)
Fun 6.54 12.5 9.68 4.9 5.56 8.06 Enjoy community 1.31 0 0 1.4 0 3.23 Total intrinsic 7.9 12.5 9.7 6.3 5.6 11.3 Learn 6.54 6.25 3.23 9.79 0 6.45 Needed in academic work 3.59 0 3.23 2.8 3.7 6.45 Total instrumental-knowledge 10.1 6.3 6.5 12.6 3.7 12.9 Instrumental-Visibility/reputation/signaling 1.31 0 0 2.8 0 0 Needed to modify or create software 16.01 12.5 9.68 18.18 20.37 11.29 Bugs 16.99 31.25 22.58 14.69 24.07 9.68 FLOSS best quality 1.31 0 6.45 1.4 0 0 Required by employment 16.01 18.75 25.81 11.19 22.22 16.13 Cost 0.98 0 0 1.4 0 1.61 Total instrumental-serve practical goal 51.3 62.5 64.5 46.9 66.7 38.7 Ideology 2.94 6.25 3.23 2.8 1.85 3.23 Help others / give to community 9.8 0 9.68 11.19 5.56 12.9 Total instrumental-serve “principle” 12.7 6.3 12.9 14.0 7.4 16.1 Another listed reason 16.67 12.5 6.45 17.48 16.67 20.97 Total 100.0 100.0 100.0 100.0 100.0 100.0 N writing in any other reason 306 43 113 91 36 23 Pearson chi-squared(20), subtotals in italics 22.77 Prob > chi-squared 0.30 Pearson chi-squared(48), all groups 49.76 Prob > chi-squared 0.40 Source: Analysis of FLOSS-US. Italics denote sub-totals. Chi-squared (degrees of freedom) tests the independence of responses, excluding developers in "none listed" from the clusters.

66
Table 9. Transition matrix for developers’ movements among projects of different membership sizes
First project Current/most recent project Small Medium Large 1-2 3-29 >29 Panel A: All developers Small 111 42 32 Medium 30 80 22 Large 13 7 47
Pearson chi-squared(4) 140.58 Prob > chi-squared 0.00 Panel B: Developers for whom first and current/most recent
projects were different Large 51 42 32 Medium 30 29 22 Small 13 7 18
Pearson chi-squared(4) 7.96 Prob > chi-squared 0.09 Source: See text discussion. Data includes only developers for whom both their first and current/recent project membership sizes are known.

67
Table 10. Characteristics and work patterns of FLOSS developers populations:
differences between participants in “Large” (>29 member) and “Small” (1-2 member) projects Project size Small Large Diff Source Directly paid 0.24 0.34 * Q33 (.43) (.48) Age 27.59 30.28 ** Q1 (7.5) (7.81) Years of experience in FLOSS 4.45 6.36 ** Q1 (3.38) (4.68) Separated, divorced, or unmarried 0.75 0.71 Q40 Children under age 6 0.13 0.11 Q39 Worked on >5 projects 0.22 0.40 ** Q9 Current and first projects overlap 0.57 0.62 Q11 Duration of first & current project overlap (mths) 31.04 45.04 ** Q11 Duration of current project: 0-1 years 0.45 0.33 ** Q11 Duration of current project: 1-5 years 0.49 0.54 Q11 Duration of current project: >5 years 0.06 0.14 ** Q11 Mean hrs/wk, current project 10.93 10.85 Q13 (12.05) (11.72) Max hrs/day, current project 10.79 11.78 Q14 (5.52) (6.17) Days of working at maximum intensity 12.66 9.86 Q15 (44.8) (22.76) Hours spent during most intense period 145.83 132.86 Q14,15 (537.73) (367.61) Total projects: one 0.11 0.09 Q9 Total projects: multiple, current=first 0.74 0.17 Q9 Total projects: multiple, current & first differ 0.13 0.70 Q9 Current project: role 1 0.30 0.21 ** Q16 Current project: role 2 0.27 0.21 Q16 Current project: role 3 0.32 0.38 Q16 Current project: role 4 0.20 0.14 Q16 Current project: role 5 0.27 0.36 * Q16 Current project: role 6 0.14 0.18 Q16 When work on FLOSS: before work 0.14 0.24 ** Q37 When work on FLOSS: after work 0.72 0.77 Q37 When work on FLOSS: at work, during work hours 0.33 0.48 ** Q37 When work on FLOSS: on weekends 0.74 0.72 Q37 When work on FLOSS: at work, off work hours 0.19 0.34 ** Q37 When work on FLOSS: unemployed, so anytime 0.18 0.13 Q37 N 422 180 Notes: Standard deviations appear in parentheses. N shows the number of observations in each column, though some variables have missing observations and hence individual cells may represent fewer than N observations. Developers with one project reply in Q9 that they have only worked on one project. A developer has different first and current projects if in Q10 the developer writes in different names for the first and current projects. Project roles defined as follows: 1=coding and project maintenance and algorithm design; 2=coding and algorithm design and user interface; 3=debugging and testing and feedback; 4=project maintenance and communication and algorithm design; 5=coding but not project maintenance and not algorithm design; 6=documentation and public relations and communication. Experience equals years since first developing FLOSS. * indicates that a two-tailed t test assuming unequal variance rejects the null hypothesis of equal values for developers in small and large projects at 95% confidence; ** at 99% confidence.

68
Table 11. Normalized relative intensity scores indicating the relative importance of different
motivations among FLOSS Developers, showing averages by respondents’ project size Survey Questionnaire Items: Panel A -- Reason for first developing FLOSS (Q4) Small Medium Large Project Size (number of people in respondents’ current project) 1-2 3-29 >29 Number of Respondents in Project Size Group: N 422 245 180 Q4b: We should be free to modify software we use 0.96 1.20 0.76 Q4f: Wanted to provide alternatives to proprietary 1.07 1.03 0.71 Q4e: As free software developer, wanted to give back to community 1.01 0.83 1.20 Q4g: Wanted to interact with like-minded programmers 1.07 1.02 0.74 Q4h: Way to become better programmer 1.11 1.01 0.70 Q4j: Wanted to learn how particular program worked 0.84 0.92 1.61 Q4i: Liked challenge of fixing bugs in existing software 0.88 1.03 1.14 Q4d: Needed to fix bugs in existing software 0.77 1.09 1.57 Q4c: Needed modification of existing software 0.78 1.37 1.03 Q4k: Employer wanted me to collaborate in OS 1.21 0.50 0.98 Mean across Q4 sub-questions 1.00 1.00 1.00 Panel B: Reason for choosing current project (Q12) Small Medium Large Q12a: Important and visible project 0.92 0.89 1.24 Q12c: Knew people working on it 0.80 1.09 1.25 Q12e: I launched the project 1.49 0.86 0.37 Q12d: Software being developed would be useful to me 0.91 0.99 1.16 Q12b: Technically interesting 0.88 1.17 0.98 Mean across Q12 sub-questions 1.00 1.00 1.00 Source: Analysis of FLOSS-US 2003 Survey: values on normalized intensity scores, derived for each question from the ratio between the proportion of respondents who coded the motive as “very important” and the proportion coding it as “not important.” Within each column of each panel, higher values indicate greater relative importance is assigned to the motivation. Panel A shades the 3 most important items darkest, and leaves the three least important un-shaded; Panel B shades the 2 most important items darkest, and leaves the1 least important un-shaded. See text for formulae.

69
Table 12. Distribution of Small- and Large-Project Participants by “Motivation Profiles” Identified
by Cluster Analysis of FLOSS-US Survey Respondents
Small Project and Large Project Populatons Only Cluster Small (1-2) Large (>29) Total 1 (Professionals) % 5.2% 5.5% 5.3 % N 22 10 32 2 (Aspiring hackers) % 7.6% 16.7% 10.3% N 32 30 62 3 (Social learners) % 49.1% 45.0% 47.8% N 207 81 288 4 (Social programmers) % 14.0% 12.8% 13.6% N 59 23 82 5 (User-innovators) % 24.2% 20.0% 22.9% N 102 36 138 Total % 100.0% 100.0% 100.0% N 422 180 602
Pearson chi-squared (4) 11.09 Prob > chi-squared 0.03 Chi-squared goodness-of-fit (4) 60.75 Prob > chi-squared 0.00 Source: See text discussion. Total column includes only developers in these two known membership size ranges, and percentages add to 100 within each column. Pearson chi-squared tests reject the null hypothesis that project size (small/large) and cluster assignment are independent. Chi-squared goodness-of-fit tests rejects the null hypothesis that developers in large projects have the same distribution across clusters as the combined large and small project population of developers.

70
Table 13. Association of motivation and participation small, medium and large projects:
ordered probit estimates
mfx: Prob small
Robust se
mfx: Prob
medium Robust
se
mfx: Prob large
Robust se
Cluster 1: ‘professionals’ 0.08 (0.10) -0.02 (0.03) -0.06 (0.07) Cluster 2: ‘aspiring hackers’ -0.16 (0.06)** 0.01 (0.01) 0.15 (0.06)* (Reference: Cluster 3) :’social learners’ Cluster 4: ‘social programmers’ -0.02 (0.06) 0.00 (0.01) 0.02 (0.05) Cluster 5: ‘user innovators’ 0.00 (0.05) 0.00 (0.01) 0.00 (0.04) Age 0.00 (0.00) 0.00 (0.00) 0.00 (0.00) First project differs from current 0.02 (0.05) 0.00 (0.01) -0.02 (0.04) Max hrs in a day: current project 0.00 (0.00) 0.00 (0.00) 0.00 (0.00) Max hrs in a day: first project 0.00 (0.00) 0.00 (0.00) 0.00 (0.00) Female 0.06 (0.27) -0.01 (0.08) -0.04 (0.19) (Reference: student) Employee -0.01 (0.06) 0.00 (0.01) 0.01 (0.05) Self-employed 0.03 (0.08) -0.01 (0.02) -0.03 (0.06) Not employed -0.30 (0.07)** -0.08 (0.07) 0.38 (0.14)** Paid directly for FLOSS work -0.10 (0.05)* 0.01 (0.01)* 0.08 (0.05) Paid indirectly for FLOSS work -0.11 (0.04)* 0.01 (0.01)* 0.09 (0.04)* (Reference: not paid for FLOSS) (Reference: future role is none) Future role: owner -0.02 (0.05) 0.00 (0.01) 0.01 (0.04) Future role: company director -0.01 (0.05) 0.00 (0.01) 0.01 (0.04) Future role: company officer 0.00 (0.05) 0.00 (0.01) 0.00 (0.04) Future role: employee 0.05 (0.05) -0.01 (0.01) -0.04 (0.04) Future role: consultant 0.08 (0.04) -0.01 (0.01) -0.06 (0.04) Future role: other 0.14 (0.20) -0.04 (0.08) -0.10 (0.12) Highest education: high school 0.14 (0.06)* -0.04 (0.02) -0.10 (0.04)** (Reference: highest edu is college) Highest education: graduate -0.07 (0.05) 0.01 (0.01) 0.06 (0.05) Highest education: professional -0.09 (0.11) 0.01 (0.00) 0.08 (0.11) ---------------------------------------------- N 506 Wald chi-squared(34) 66.74 Prob > chi-squared 0.00 Pseudo R-squared 0.06 Probability of outcome 0.40 0.35 0.25 Source: Analysis of FLOSS-US. Dependent variable = 1 for small project, = 2 for medium project, = 3 for large project. Regression includes fixed effects for 11 country categories, not shown here. Marginal effects evaluated at mean values of independent variables. * Statistically signficant at 95% confidence, ** at 99%.

71
APPENDIX
Table A1. Factor analysis of individual motivation responses to Q4 Variable Factor loadings Q4h (Way to become better programmer): very important 0.49 Q4h: important -0.05 Q4h: a bit important -0.21 Q4h: not important -0.40 Q4g (Wanted to interact with like-minded programmers): very important 0.44 Q4g: important 0.11 Q4g: a bit important -0.20 Q4g: not important -0.42 Q4b (We should be free to modify software we use): very important 0.41 Q4b: important -0.11 Q4b: a bit important -0.20 Q4b: not important -0.33 Q4f (Wanted to provide alternatives to proprietary): very important 0.41 Q4f: important -0.01 Q4f: a bit important -0.10 Q4f: not important -0.40 Q4e As FS software user, wanted to give back to community): v important 0.37 Q4e: important -0.07 Q4e: a bit important -0.22 Q4e: not important -0.29 Q4a (Best way for software to be developed): very important 0.36 Q4a: important 0.10 Q4a: a bit important -0.20 Q4a: not important -0.42 Q4j (Wanted to learn how particular program worked): very important 0.36 Q4j: important 0.15 Q4j: a bit important -0.06 Q4j: not important -0.50 Q4i (Liked challenge of fixing bugs in existing software): very important 0.28 Q4i: important 0.31 Q4i: a bit important 0.09 Q4i: not important -0.59 Q4d (Needed to fix bugs in existing software): very important 0.10 Q4d: important 0.22 Q4d: a bit important 0.08 Q4d: not important -0.42 Q4c (Needed modification of existing software): very important 0.05 Q4c: important 0.13 Q4c: a bit important 0.15 Q4c: not important -0.35 Q4k (Employer wanted me to collaborate in OS ): very important 0.05 Q4k: important 0.10 Q4k: a bit important 0.31 Q4k: not important -0.33 Factor scores: median 0.02 Factor scores: standard deviation 1.00 Shapiro-Wilk W test for normality: Prob > z 0.00 N 1,459 Source: Analysis of FLOSS-US.

72
Table A2. Frequency distribution of FLOSS-US Survey respondents matched with projects found in the SourceForge archive for 2001-2003
Project name Total number of
survey respondents
Percentage of large number
projects Apache 3 0.89 Debian 46 13.69 Emacs 9 2.68 Jboss 3 0.89 Jedit 3 0.89 Linux kernel 48 14.29 Mozilla 29 8.63 Mplayer 5 1.49 Openoffice.org 15 4.46 Perl 6 1.79 Php 9 2.68 Python 4 1.19 Samba 6 1.79 Xfree86 3 0.89 Projects with 1 survey respondent 131 38.99 Projects with 2 survey respondents 16 4.80 Total 336 100 Note: See text for matching project names and from the 2003 FLOSS-US survey respondents with project membership sizes obtained from the SourceForge archive for the years 2001-2003. This table lists a project name only if the project had more than three respondents in the survey. Table counts two responses if a developer writes in large current and large first projects that differ. Table counts one response if a developer writes in the same large project as first and as current.


![Relationship-Based Access Control for an Open-Source ...pwlfong/Pub/sacmat2015.pdf · OpenMRS [4] is a production-scale, open-source electronic medical records system that has been](https://img.dokumen.tips/doc/110x75/6057934d55c42a4a8716546c/relationship-based-access-control-for-an-open-source-pwlfongpubsacmat2015pdf.jpg)