Embed Size (px)
Citation preview
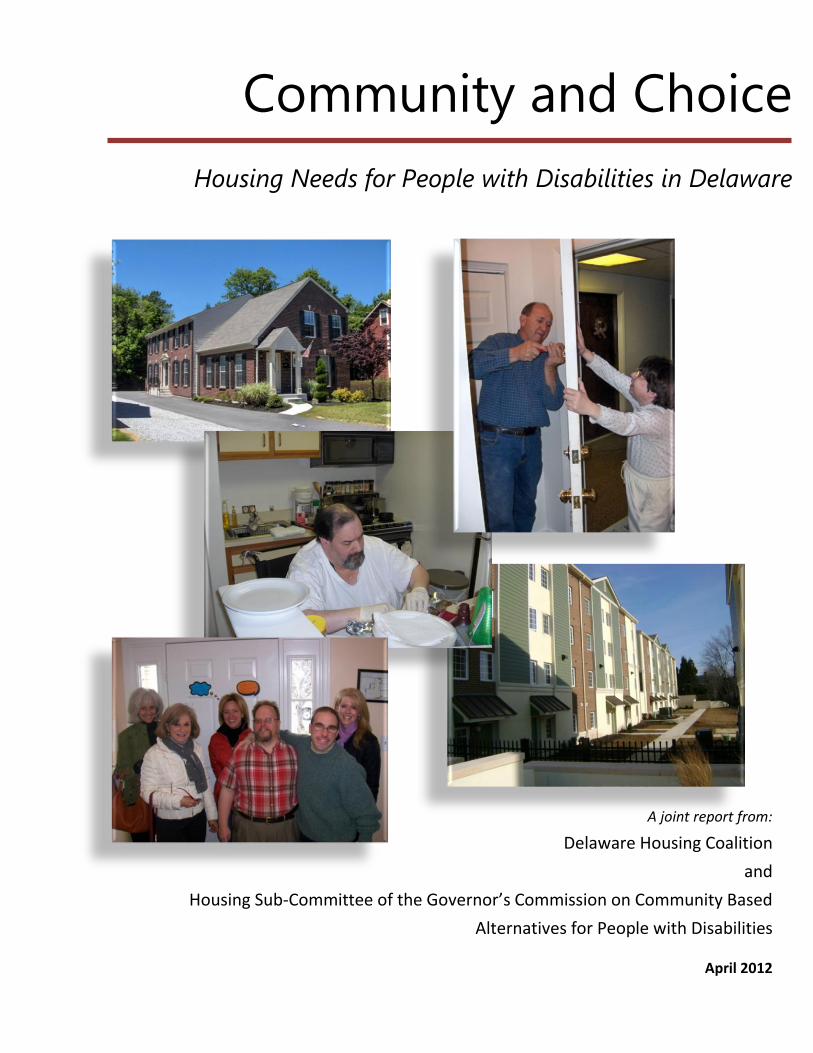
A joint report from:
Delaware Housing Coalition
and
Housing Sub-Committee of the Governor’s Commission on Community Based
Alternatives for People with Disabilities
April 2012
Housing Needs for People with Disabilities in Delaware
Community and Choice

This page intentionally left blank.
A LETTER FROM THE HOUSING SUBCOMMITTEE CO-CHAIRS
With this report, Community and Choice: Housing Needs for People with Disabilities in Delaware, the state’s
affordable housing and disability communities culminate the first stage of a continuing effort to better understand
the scope and nature of the housing needs for people with disabilities in the state, in order to provide more
effective and appropriate responses.
The Housing Sub-Committee of the Governor’s Commission on Community Based Alternatives for People with
Disabilities and the State Council for Persons with Disabilities joined with the Delaware Housing Coalition over the
past many months, making use of a renewed and enhanced sub-committee to serve as a working group for this
report. Because the need is multifaceted and the data scattered, we have been engaged in an effort that has had
many challenges. However, that is exactly why a workgroup of this sort was needed.
Among the estimated 108,500 people with disabilities in the State of Delaware, incomes are typically lower than
among those without disabilities, with a higher overall percentage in poverty or at risk of falling into poverty, and a
much higher need for housing assistance. The need for accessible, affordable housing is a major barrier to people
with disabilities living in the community, and housing needs severely limit the options of people with disabilities
choosing to live in the least restrictive setting of their choice. Independence, choice, and integration are critical
and still overlooked issues which must be factored into the consideration of housing needs for people with
disabilities.
There are many changes afoot which have promise of leading to better and more appropriate housing solutions for
people with disabilities in Delaware. We have tried, along with the articulation of the need, to accurately describe
some of those potential solutions. Our recommendations, organized by the areas of accessibility, affordability,
community, and systems provide an outline of them.
We will continue to act, via the Housing Sub-Committee, to develop proposals and policies toward implementing
such solutions. We will also work through the three-year statewide comprehensive community-based housing
planning initiative, now in mid-course, that was begun by the Homeless Planning Council and the Delaware
Housing Coalition, in order to raise the housing needs of people with disabilities to the level of a standard
consideration in state and local planning.
We welcome your partnership in making the housing needs of people with disabilities better and more widely
understood and encourage your participation in, and support of, our ongoing efforts.
Daniese McMullin-Powell, Co-Chair Housing Sub-committee
Sandra Tuttle, Co-Chair Housing Sub-committee
Ken Smith, Executive Director Delaware Housing Coalition
Susan Starrett, Executive Director Homeless Planning Council of Delaware

This page intentionally left blank.
C o m m u n i t y a n d C h o i c e | 1
CONTENTS
A Letter from the Housing Subcommittee Co-Chairs ................................................................................................ 3
Acknowledgements ................................................................................................................................................. 4
Introduction: The Need for a Fresh Review .............................................................................................................. 6
Prevalence of Disabilities ......................................................................................................................................... 7
Poverty and Housing Needs among People with Disabilities .................................................................................. 12
Delaware Data Review by Population .................................................................................................................... 23
Intellectual and Developmental Disabilities .............................................................................................................. 23
Substance Abuse and Mental Health ........................................................................................................................ 26
HIV/AIDS .................................................................................................................................................................... 31
Sensory Disabilities .................................................................................................................................................... 32
Physical Disabilities ................................................................................................................................................... 33
Youth Aging out of Foster Care ................................................................................................................................. 36
Prioritizing Housing Choice and Community Care .................................................................................................. 37
Rental Housing Needs ............................................................................................................................................ 45
Homeownership Needs ......................................................................................................................................... 56
Other Issues ........................................................................................................................................................... 63
Recommendations ................................................................................................................................................. 66
Accessibility. .............................................................................................................................................................. 67
Affordability .............................................................................................................................................................. 73
Community ................................................................................................................................................................ 80
Systems ..................................................................................................................................................................... 86
Appendixes ............................................................................................................................................................ 90
Appendix A: Questions used to identify disability in major national data sources ................................................... 90
Appendix B: Glossary of Accessibility Terms ............................................................................................................. 92
Appendix C: Focus Group Protocol ............................................................................................................................ 94
Appendix D: Key Housing Terms ............................................................................................................................... 95
Appendix E: Matrix of Recommendations................................................................................................................. 97
Endnotes................................................................................................................................................................ 98
2 | C o m m u n i t y a n d C h o i c e
Table of Figures
Table 1: Measures of Disability Prevalence, United States ........................................................................................... 7
Table 2: Prevalence of Any Disability by Age and for the Total, Civilian Noninstitutionalized and Household
Populations 5 Years and Over, United States and Delaware, 2006 ............................................................................... 9
Table 3: Population in Group Quarters, Delaware, 2010 .............................................................................................. 9
Table 4: Population with Self-Care or Independent Living Difficulty, Delaware, 2008-2010 ...................................... 10
Table 5: Percent of Population with Limitations with ADLs/Self-care Difficulty or ..................................................... 11
Table 6: Median Household Income, Civilian Noninstitutionalized Population, Delaware, 2008 ............................... 13
Table 7: Poverty Rates and Median Earnings by Disability, Delaware, 2008-2010 ..................................................... 14
Table 8: Percent of Population with a Disability by Poverty, Delaware, 2008-2010 ................................................... 14
Table 9: SSI Recipients by Eligibility Category and Age, Delaware, 2009 .................................................................... 15
Table 10: Annual Poverty Rates by Functional or Activity Limitation Status, Ages 25 to 61, United States, 1997 ..... 16
Table 11: Labor Force Participation, Percent of Population Employed, and Unemployment Rate, Delaware, 2009 . 17
Table 12: Housing Conditions of Renter Households by Disability, United States, 2009 ............................................ 18
Table 13: Total Public Housing and Housing Choice Voucher Waiting Lists, Delaware, September 2010 .................. 19
Table 14: Percent of Subsidized Households with a Disability, United States and Delaware, 2008 ............................ 20
Table 15: USDA Section 515 and Section 514 Housing Occupancy Statistics, United States and Delaware, 2010 ..... 21
Table 16: Public Housing Residents by Income and Household Type (DSHA, WHA and NHA) September 2010 ........ 21
Table 17: Previous Living Situation of Individuals using Homeless Residential Services, ............................................ 22
Table 18: Persons Homeless by County, Delaware, January 2011 Point-in-Time ........................................................ 23
Table 19: DDDS Clients Aged 50 and Over, December 2009 ....................................................................................... 24
Table 20: HCBS Waiver Expenditures, Delaware, FY 2005 - 2009 ............................................................................... 25
Table 21: Licensed Group Homes and Beds for People with Developmental Disabilities, Delaware, 2011 ................ 25
Table 22: DSAMH Consumer Registry by Residential Arrangement, June 30, 2010 Point-in-Time Analysis ............... 27
Table 23: Individuals with Substance Abuse or Mental Health Conditions Identified as in Need of Stable Housing,
DSAMH Point-in-Time Analysis, June 30, 2010 ............................................................................................................ 28
Table 24: Estimates of Housing Need for Persons with Substance Abuse and Mental Illness, Delaware ................... 29
Table 25: Inventory of Assisted Beds for People with Substance Abuse/Mental Illness, Delaware, 2011 .................. 30
Table 26: Individuals Living with HIV/AIDS by County of Residence, Delaware, 2011 ................................................ 31
Table 27: Percent of Population With Sensory Disabilities, U.S. and Delaware, 2008-2010 ....................................... 32
Table 28: Consumers on DHSS Division for the Visually Impaired (DVI) Registry by Severity and County, March 2011
..................................................................................................................................................................................... 33
Table 29: Consumers on DHSS Division for the Visually Impaired Registry by Age, March 2011 ................................ 33
Table 30: Percentages of Difficulties in Physical Functioning among Persons Aged 18 years and over ..................... 34
Table 31: Estimate of Population using Mobility Devices, Delaware, 2010 ................................................................ 34
Table 32: Households with Mobility or Self-Care Disabilities with Housing Problems, Delaware, 2005-2007 ........... 35
C o m m u n i t y a n d C h o i c e | 3
Table 33: Percent of Assisted Living and Nursing Home Residents with Source of Payment ..................................... 40
Table 34: Nursing Home Admissions and Discharges, Individuals under age 65, Delaware, 2010 ............................. 40
Table 35: Institutional and Home and Community Based Waiver Expenditures and Recipients, ............................... 41
Table 36: Estimated Institutional and Community Cost Estimates, Delaware, 2010 .................................................. 42
Table 37: Community Living Arrangements of MFP Participants Ever Enrolled Through June 2010, by Targeted
Population, U.S. ........................................................................................................................................................... 44
Table 38: Estimate of Worst Case Housing Needs, Delaware, 2006-2008 .................................................................. 46
Table 39: Summary of Local Data on Housing Needs .................................................................................................. 48
Table 40: Affordable Rents and Average LIHTC Rents ................................................................................................. 50
Table 41: Section 504 Accessible Public Housing Units, Delaware, 2010 .................................................................... 52
Table 42: Accessible Units in Assisted Housing Inventory, Delaware 2010 ................................................................. 53
Table 43: Fully Accessible Units funded by Low Income Housing Tax Credit (LIHTC), Delaware, 2010-2011 ............. 53
Table 44: Renter-occupied housing units by type of structure, Delaware, 2008-2010 ............................................... 54
Table 45: Renter-occupied units by year built, Delaware 2008-2010 ......................................................................... 55
Table 46: Estimate of Accessible Multifamily Rental Units in Delaware ..................................................................... 55
Table 47: Tenant-based Rental Assistance for People with Disabilities in Delaware .................................................. 56
Table 48: Rehabilitations and Accessibility Modifications in Delaware Homeowner Rehabilitation Programs .......... 59
Table 49: Elderly Very Low Income (VLI) and Cost-burdened Owner-occupied Households, Delaware, 2006-2008 .. 60
Table 50: Estimates of Very Low Income (VLI) Elderly Homeowner Households with Disabilities, Delaware ............ 61

4 | C o m m u n i t y a n d C h o i c e
ACKNOWLEDGEMENTS
Governor’s Commission on Community based Alternatives for People with Disabilities: Housing Subcommittee
Sandy Tuttle, Co-Chair
Daniese McMullin-Powell, Co-Chair
PARTICIPATING ORGANIZATIONS
Arc of Delaware
City of Dover
City of Wilmington
Community Legal Aid Society, Inc. (CLASI) Disabilities Law Project
Connections CSP
Delaware Division of Human Relations
Delaware HIV Consortium
Delaware Housing Coalition
Delaware State Housing Authority (DSHA)
Department of Services for Children, Youth and their Families (DSCYF)
Developmental Disabilities Council (DDC)
Division of Developmental Disabilities Services (DDDS)
Division of Long Term Care Residents Protection (DLTCRP)
Division of Medical and Medical Assistance (DMMA)
Division of Services for Aging and Adults with Physical Disabilities (DSAAPD)
Division of Substance Abuse and Mental Health (DSAMH)
Dover Housing Authority
Federal Home Loan Bank of Pittsburgh (FHLB)
Homeless Planning Council of Delaware
Independent Living Council
Milford Housing Development Corporation (MHDC)
Ministry of Caring
NAMI Delaware
National Multiple Sclerosis Society / DE Chapter
New Castle County
State Council for Persons with Disabilities (SCPD)
United Cerebral Palsy of Delaware
Wilmington Housing Authority
WSFS Bank
REPRESENTATIVES
Carol Barnett, DSAAPD
Vince Boehm, Developmental Disabilities Council
Lisa Bond, DSAAPD
Darlene Bonney, Ministry of Caring
Merton Briggs, NAMI Delaware
Dave Buches, Federal Home Loan Bank
Carrie Casey, New Castle County
Dianne Casey, DE HIV Consortium
Chris DiSanto, Connections CSP
Vincent Garlick, New Castle County
Marlena Gibson, Delaware State Housing Authority
Brian Hartman, CLASI, Disabilities Law Project
Tracey Harvey, City of Dover
Kyle Hodges, State Council for Persons with Disabilities
Carlyle Hooff, DSAMH
Cliffvon Howell, DSAMH
Joe Hughes, DSAMH
Yolanda Jenkins, DSCYF
Patricia Kelleher, Arc of Delaware
Lottie Lee, DSAAPD
Daniese McMullin-Powell, DMMA
Don Moore, United Cerebral Palsy of Delaware
Meghan Morgan, DDDS
Anne Mountain, Ministry of Caring Bethany House
Vincent Petroff, Delaware Human Relations Commission
Renee Purzycki, DLTCRP
Paul Reynolds, New Castle County
Al Rose, Developmental Disabilities Council
Eugene Rudder, Wilmington Housing Authority
Stacie Shriver, DDDS
Jo Singles, Support Staff, SCPD
Michael Skipper, WSFS Bank
Bobby Smith, Dover Housing Authority
Ken Smith, Delaware Housing Coalition
Susan Starrett, Homeless Planning Council of Delaware
Fred Traute, MHDC
Debra Veenema, National Multiple Sclerosis Society / DE Chapter
Vaughn Watson, City of Wilmington
C o m m u n i t y a n d C h o i c e | 5
SPECIAL THANKS: DATA COLLECTION AND FOCUS GROUPS
Thanks to the many people who assisted with the development of this report and provided data and other
information:
Carol Barnett, DSAAPD
Lisa Bond, DSAAPD
Griff Campbell, Department of Labor
Michelle Carre, Delaware Apartment Association
Dianne Casey, Delaware HIV Consortium
Bea Chesaroni, New Castle County Department of
Community Services
Meagan DeCrappeo, National Low Income Housing Coalition
Bob Goodhart, Division for the Visually Impaired, DHSS
Kyle Hodges, SCPD
Cliffvon Howell, DSAMH
Yolanda Jenkins, DSCYF
Patricia Kelleher, Arc of Delaware
Lottie Lee, DHSS
Emily Lanter, DSHA
Andy Lorenz, DSHA
William Love, DSAAPD
Daniese McMullin-Powell, DMMA
Don Moore, United Cerebral Palsy-Delaware
Wendy Nurse, DSAMH
Phyllis Palabrica, Colonial Paralyzed Veterans Association
Renee Purzycki, DLTCRP
Stacey Slacum, USDA Rural Development
Melissa Smith, DSAMH
Valerie Smith, DDDS
Susan Starrett, Homeless Planning Council of Delaware
Shamika Ponzo, City of Wilmington
Maurice Tippett, DSAMH
Fred Traute, First State RC & D
Pat Weygandt, DDDS
Natalie White, Delaware Department of Transportation
And to those who helped organize, facilitate, and record focus groups:
Carol Barnett, DSAAPD
Dianne Casey, Delaware HIV Consortium
Chris Devaney, Connections CSP
Kyle Hodges, SCPD
Yolanda Jenkins, DSCYF
Patricia Kelleher, Arc of Delaware
Lottie Lee, DHSS
Marissa Llyod, DSCYF
Gina Miserendino, Delaware Housing Coalition
Tina Riley
Susan Starrett, Homeless Planning Council of Delaware
Special thanks to the following organizations for their financial
and in-kind support of the focus groups and this report:
Connections, CSP
Delaware Department of Health and Social Services
Delaware HIV Consortium
Delaware State Housing Authority
Discover Bank
And to Citi Community Development for their support of
Delaware Housing Coalition’s Good Neighborhood Project
6 | C o m m u n i t y a n d C h o i c e
INTRODUCTION: THE NEED FOR A FRESH REVIEW
In the mid-2000s, the Housing Subcommittee of the Governor’s Commission on Community Based Alternatives for
People with Disabilities developed a strategic plan, as part of the overall strategic plan of the Commission, to
improve affordable housing opportunities for persons with disabilities and remove this major hurdle to
independent living and a community based model of care. The lack of clear, reliable data on the scope of housing
needs among people with disabilities in Delaware was a challenge even then. In 2006-2007, the Delaware State
Housing Authority and its consultants, Mullin & Lonergan Associates, worked closely with the Housing
Subcommittee on the Special Populations section of its 2008-2012 Statewide Housing Needs Assessment. This
resulted in several steps forward and new information, but the state’s housing community has still struggled with
the need to better understand the scope and nature of the housing needs of people with disabilities in Delaware in
order to provide appropriate responses. With multiple unique subpopulations, each with distinctive needs and
their own network of service providers, advocates, and data sources, simply assembling the information that is
available into a coherent whole is itself demanding.
To revisit this topic, the Housing Sub-Committee of the Governor’s Commission on Community Based Alternatives
and the Delaware Housing Coalition have joined together to make use of a renewed and enhanced sub-committee
to serve as the study workgroup, which held its first meeting in February 2011. The Housing Sub-Committee’s
leadership worked to ensure participation, encouraged wide collaboration in the work, and provide guidance and
insight. Delaware Housing Coalition facilitated the study and implemented the work plan (data gathering, research,
analysis, report). Through the workgroup model, the sub-committee collected data, conducted focus groups and
interviews, collectively reviewed research products, and discussed and refined the study’s recommendations. The
Delaware State Housing Authority (DSHA) provided assistance with data collection, research and analysis. The
various divisions of the Department of Health and Social Services (DHSS) provided data, input and feedback on the
report.
First of all, we need better raw data about disability housing needs (populations, immediate needs, long-term
projections). This includes updating and revisiting primary data available in Delaware (providers, state and local
agencies) and reviewing national data sources. Secondly, income poverty and disability interact in ways that
mutually reinforce one another. So, a more careful analysis is required of the relationship between income
poverty, disability, and specific housing needs. In the third place, there is a spectrum of disability housing needs,
each of which requires different solutions and resources. People with disabilities are over-represented among the
homeless, living involuntarily in shelters and institutions instead of a home of their own. The need for rental
housing is aggravated by the need for higher rental subsidies, absence of support services, and lack of accessibility.
Similarly, the needs of owner-occupants span a range of their own, from the need for retrofits to remain in the
home or financial help to offset housing cost burdens, on the one hand, to homebuyer financial preparation, asset-
building, universal design in general housing construction, and special lending products, on the other.

7 | C o m m u n i t y a n d C h o i c e
PREVALENCE OF DISABILITIES
Nationally, there are 36.4 million people with disabilities in the United States, or 11.9% of the population.1 The
prevalence of disabilities varies across surveys due to a variety of reasons, but is generally between 11% and 19%
nationally. The Survey on Income and Program Participation (SIPP) estimated that in 2005, there were 54.4 million
people in the United States with some level of disability and 34.9 million with a severe disability.2
Table 1: Measures of Disability Prevalence, United States
Source Year Population U.S. Delaware
U.S. Census 2000 Civilian noninstitutionalized population 16-64
9.7% 9.4%
Panel Study on Income Dynamics (PSID)
2001 Population 18-64 reporting any disability 14.7% n/a
Survey on Income and Program Participation (SIPP)
2005
Total population reporting any disability 18.7% n/a
Total population reporting a severe disability
12.0% n/a
American Community Survey (ACS)
2010
All (civilian noninstutionalized population) 11.9% 12.3%
18-64 10.0% 10.9%
65 or over 36.7% 31.3%
Current Population Survey (CPS) 2009 Civilian population 16 years and over 11.4% n/a
Behavioral Risk Factor Surveillance Survey (BRFSS)
2009 Population in households, 18 and over 18.9% 18.4%
National Health Interview Survey (NHIS)
2009 Population over 18 reporting unable or limited in their ability to work due to a health condition
10.0% n/a
The most frequent and current measure of disability prevalence available at the national and state level is the
American Community Survey (ACS), which
has replaced the previous “long form” of
the decennial census in collecting detailed
household and housing information. Using
a series of six questions about sensory,
ambulatory, cognitive, independent living
and self-care difficulties, the 2010 ACS
reports a disability prevalence rate of
11.9% nationally and 12.3% in Delaware
for the civilian noninstitutionalized
population, regardless of age. The ACS
estimates that there are 108,444
Delawareans with disabilities. The
prevalence rate varies widely by age
group: 31% for individuals 65 and over,
10.9% for those 18-64, and 4.4% for those
under 18.
0% 5% 10% 15% 20% 25% 30% 35%
Any Disability
Hearing Difficulty
Vision Difficulty
Cognitive Difficulty
Ambulatory Difficulty
Self-Care Difficulty
Independent Living Difficulty
Percent of Population with a Disability by Age Delaware, 2010
Population 18-64
Population 65 and over
Source: 2010 American Community Survey
8 | C o m m u n i t y a n d C h o i c e
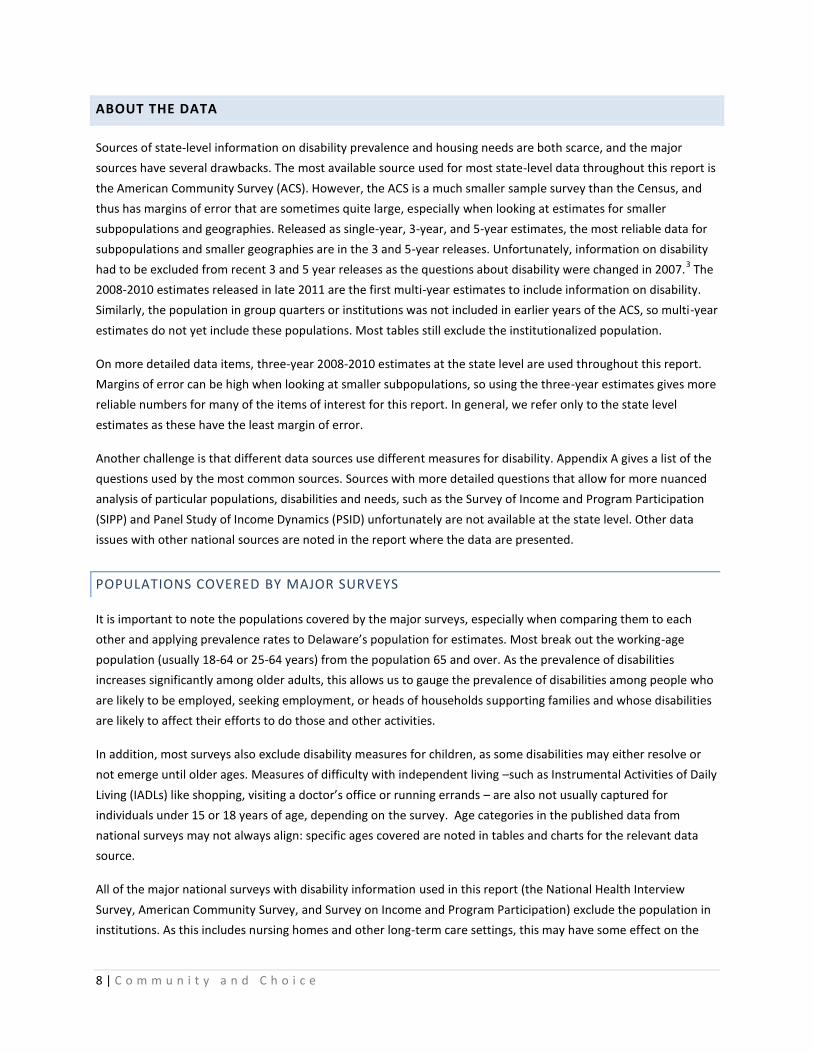
ABOUT THE DATA
Sources of state-level information on disability prevalence and housing needs are both scarce, and the major
sources have several drawbacks. The most available source used for most state-level data throughout this report is
the American Community Survey (ACS). However, the ACS is a much smaller sample survey than the Census, and
thus has margins of error that are sometimes quite large, especially when looking at estimates for smaller
subpopulations and geographies. Released as single-year, 3-year, and 5-year estimates, the most reliable data for
subpopulations and smaller geographies are in the 3 and 5-year releases. Unfortunately, information on disability
had to be excluded from recent 3 and 5 year releases as the questions about disability were changed in 2007.3 The
2008-2010 estimates released in late 2011 are the first multi-year estimates to include information on disability.
Similarly, the population in group quarters or institutions was not included in earlier years of the ACS, so multi-year
estimates do not yet include these populations. Most tables still exclude the institutionalized population.
On more detailed data items, three-year 2008-2010 estimates at the state level are used throughout this report.
Margins of error can be high when looking at smaller subpopulations, so using the three-year estimates gives more
reliable numbers for many of the items of interest for this report. In general, we refer only to the state level
estimates as these have the least margin of error.
Another challenge is that different data sources use different measures for disability. Appendix A gives a list of the
questions used by the most common sources. Sources with more detailed questions that allow for more nuanced
analysis of particular populations, disabilities and needs, such as the Survey of Income and Program Participation
(SIPP) and Panel Study of Income Dynamics (PSID) unfortunately are not available at the state level. Other data
issues with other national sources are noted in the report where the data are presented.
POPULATIONS COVERED BY MAJOR SURVEYS
It is important to note the populations covered by the major surveys, especially when comparing them to each
other and applying prevalence rates to Delaware’s population for estimates. Most break out the working-age
population (usually 18-64 or 25-64 years) from the population 65 and over. As the prevalence of disabilities
increases significantly among older adults, this allows us to gauge the prevalence of disabilities among people who
are likely to be employed, seeking employment, or heads of households supporting families and whose disabilities
are likely to affect their efforts to do those and other activities.
In addition, most surveys also exclude disability measures for children, as some disabilities may either resolve or
not emerge until older ages. Measures of difficulty with independent living –such as Instrumental Activities of Daily
Living (IADLs) like shopping, visiting a doctor’s office or running errands – are also not usually captured for
individuals under 15 or 18 years of age, depending on the survey. Age categories in the published data from
national surveys may not always align: specific ages covered are noted in tables and charts for the relevant data
source.
All of the major national surveys with disability information used in this report (the National Health Interview
Survey, American Community Survey, and Survey on Income and Program Participation) exclude the population in
institutions. As this includes nursing homes and other long-term care settings, this may have some effect on the
9 | C o m m u n i t y a n d C h o i c e
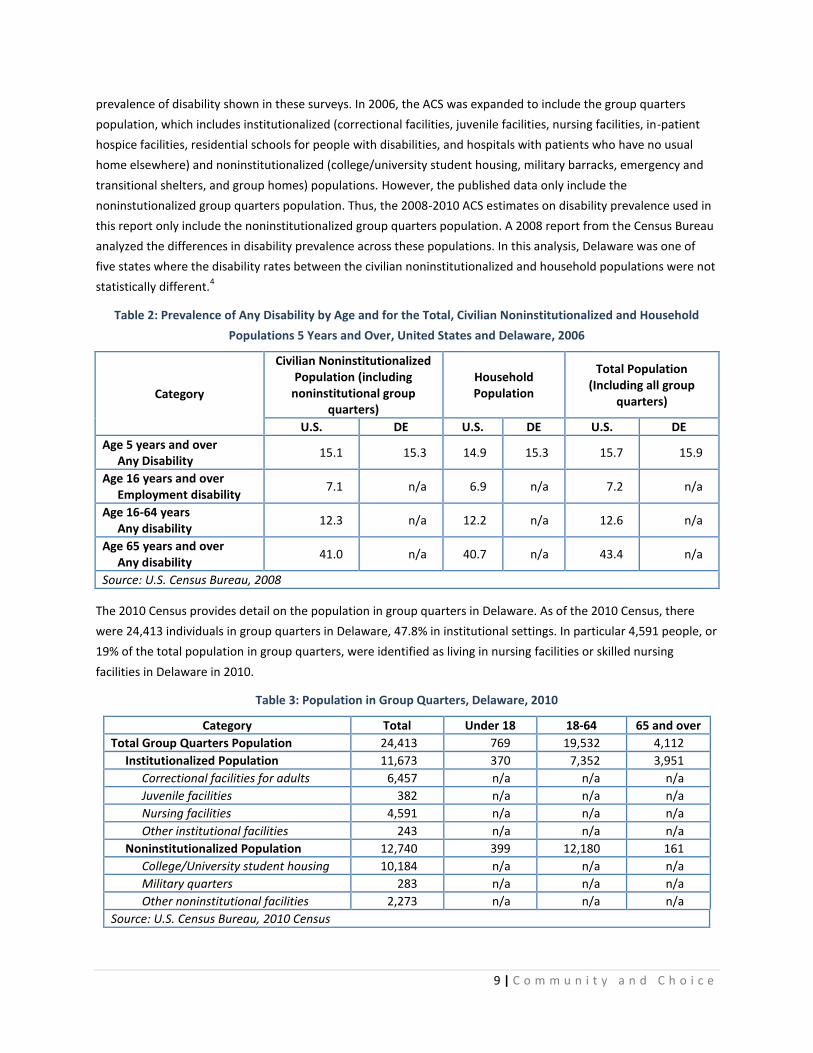
prevalence of disability shown in these surveys. In 2006, the ACS was expanded to include the group quarters
population, which includes institutionalized (correctional facilities, juvenile facilities, nursing facilities, in-patient
hospice facilities, residential schools for people with disabilities, and hospitals with patients who have no usual
home elsewhere) and noninstitutionalized (college/university student housing, military barracks, emergency and
transitional shelters, and group homes) populations. However, the published data only include the
noninstutionalized group quarters population. Thus, the 2008-2010 ACS estimates on disability prevalence used in
this report only include the noninstitutionalized group quarters population. A 2008 report from the Census Bureau
analyzed the differences in disability prevalence across these populations. In this analysis, Delaware was one of
five states where the disability rates between the civilian noninstitutionalized and household populations were not
statistically different.4
Table 2: Prevalence of Any Disability by Age and for the Total, Civilian Noninstitutionalized and Household
Populations 5 Years and Over, United States and Delaware, 2006
Category
Civilian Noninstitutionalized Population (including
noninstitutional group quarters)
Household Population
Total Population (Including all group
quarters)
U.S. DE U.S. DE U.S. DE
Age 5 years and over Any Disability
15.1 15.3 14.9 15.3 15.7 15.9
Age 16 years and over Employment disability
7.1 n/a 6.9 n/a 7.2 n/a
Age 16-64 years Any disability
12.3 n/a 12.2 n/a 12.6 n/a
Age 65 years and over Any disability
41.0 n/a 40.7 n/a 43.4 n/a
Source: U.S. Census Bureau, 2008
The 2010 Census provides detail on the population in group quarters in Delaware. As of the 2010 Census, there
were 24,413 individuals in group quarters in Delaware, 47.8% in institutional settings. In particular 4,591 people, or
19% of the total population in group quarters, were identified as living in nursing facilities or skilled nursing
facilities in Delaware in 2010.
Table 3: Population in Group Quarters, Delaware, 2010
Category Total Under 18 18-64 65 and over
Total Group Quarters Population 24,413 769 19,532 4,112
Institutionalized Population 11,673 370 7,352 3,951
Correctional facilities for adults 6,457 n/a n/a n/a
Juvenile facilities 382 n/a n/a n/a
Nursing facilities 4,591 n/a n/a n/a
Other institutional facilities 243 n/a n/a n/a
Noninstitutionalized Population 12,740 399 12,180 161
College/University student housing 10,184 n/a n/a n/a
Military quarters 283 n/a n/a n/a
Other noninstitutional facilities 2,273 n/a n/a n/a
Source: U.S. Census Bureau, 2010 Census
10 | C o m m u n i t y a n d C h o i c e
SEVERITY OF DISABILITY AND LIMITATIONS IN ACTIVITIES OF DAILY LIVING (ADLS)
Severity of disability is an important facet of the overall prevalence of disability in the population: people with
more severe disabilities are more likely to experience poverty, long-term poverty, unemployment or inability to
work, and more likely to need supportive services. Measures of severity can have large effects on estimates of
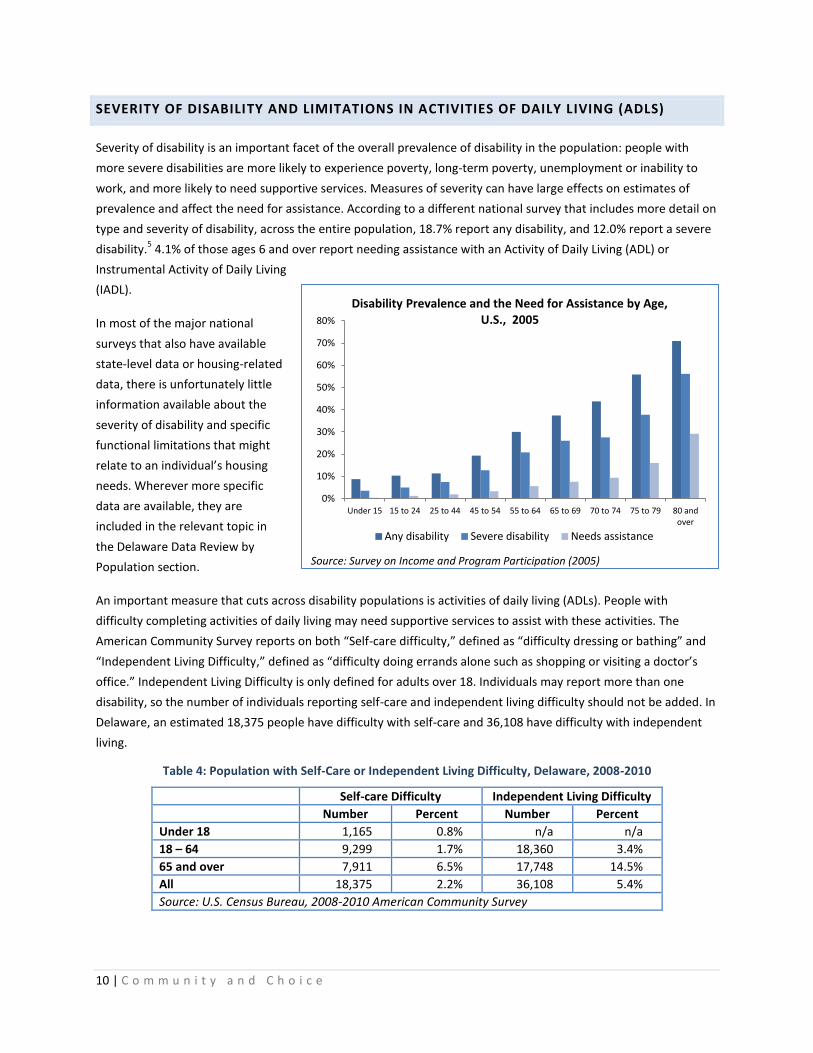
prevalence and affect the need for assistance. According to a different national survey that includes more detail on
type and severity of disability, across the entire population, 18.7% report any disability, and 12.0% report a severe
disability.5 4.1% of those ages 6 and over report needing assistance with an Activity of Daily Living (ADL) or
Instrumental Activity of Daily Living
(IADL).
In most of the major national
surveys that also have available
state-level data or housing-related
data, there is unfortunately little
information available about the
severity of disability and specific
functional limitations that might
relate to an individual’s housing
needs. Wherever more specific
data are available, they are
included in the relevant topic in
the Delaware Data Review by
Population section.
An important measure that cuts across disability populations is activities of daily living (ADLs). People with
difficulty completing activities of daily living may need supportive services to assist with these activities. The
American Community Survey reports on both “Self-care difficulty,” defined as “difficulty dressing or bathing” and
“Independent Living Difficulty,” defined as “difficulty doing errands alone such as shopping or visiting a doctor’s
office.” Independent Living Difficulty is only defined for adults over 18. Individuals may report more than one
disability, so the number of individuals reporting self-care and independent living difficulty should not be added. In
Delaware, an estimated 18,375 people have difficulty with self-care and 36,108 have difficulty with independent
living.
Table 4: Population with Self-Care or Independent Living Difficulty, Delaware, 2008-2010
Self-care Difficulty Independent Living Difficulty
Number Percent Number Percent
Under 18 1,165 0.8% n/a n/a
18 – 64 9,299 1.7% 18,360 3.4%
65 and over 7,911 6.5% 17,748 14.5%
All 18,375 2.2% 36,108 5.4%
Source: U.S. Census Bureau, 2008-2010 American Community Survey
0%
10%
20%
30%
40%
50%
60%
70%
80%
Under 15 15 to 24 25 to 44 45 to 54 55 to 64 65 to 69 70 to 74 75 to 79 80 and over
Disability Prevalence and the Need for Assistance by Age, U.S., 2005
Any disability Severe disability Needs assistance
Source: Survey on Income and Program Participation (2005)
11 | C o m m u n i t y a n d C h o i c e
Rates in Delaware are similar to those reported in national surveys, and rates across national surveys are also
similar. Other national surveys report on limitations in Activities of Daily Living (ADLs), defined as eating, dressing
or bathing (similar to the ACS’ measure “Self-Care Difficulty”), and Instrumental Activities of Daily Living (IADLs),
defined as household chores and shopping (similar to the ACS’ measure “Independent Living Difficulty”).
Nationally, the National Health Interview Survey (NHIS) reports that about 4.4 million adults (2%) required the help
of another person with ADLs and 9.2 million (4%) with IADLs.6
Table 5: Percent of Population with Limitations with ADLs/Self-care Difficulty or
IADLs/Independent Living Difficulty, United States
ADLs/Self-care Difficulty IADLs/Independent Living Difficulty
ACS (DE) ACS (U.S.) NHIS ACS (DE) ACS (U.S.) NHIS
Under 18 0.8% 0.9% n/a n/a n/a n/a
18 – 64 1.7% 1.8% 1.1% 3.4% 3.5% 2.3%
65 and over 6.5% 8.8% 6.4% 14.5% 16.2% 12.7%
All 2.2% 2.6% 1.9% 5.4% 5.6% 4.0%
Source: U.S. Census Bureau, 2010 American Community Survey; Centers for Disease Control and Prevention, 2009 National Health Interview Survey
DISABILITY AMONG OLDER ADULTS
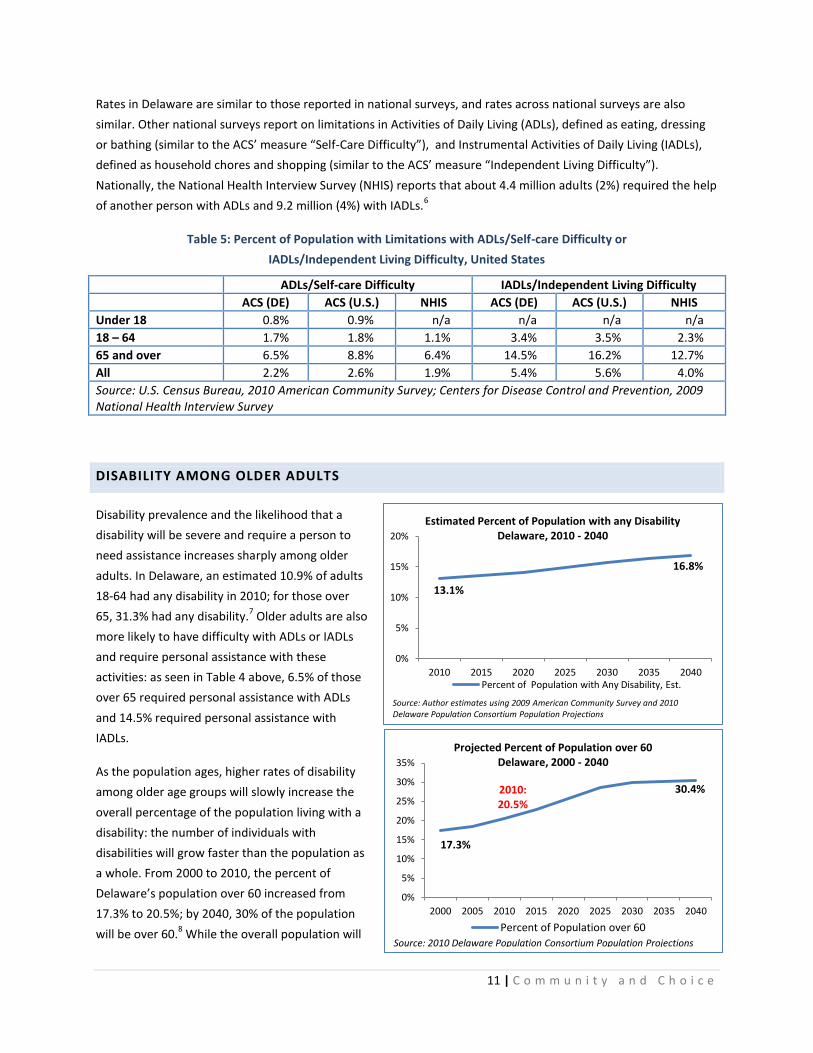
Disability prevalence and the likelihood that a
disability will be severe and require a person to
need assistance increases sharply among older
adults. In Delaware, an estimated 10.9% of adults
18-64 had any disability in 2010; for those over
65, 31.3% had any disability.7 Older adults are also
more likely to have difficulty with ADLs or IADLs
and require personal assistance with these
activities: as seen in Table 4 above, 6.5% of those
over 65 required personal assistance with ADLs
and 14.5% required personal assistance with
IADLs.
As the population ages, higher rates of disability
among older age groups will slowly increase the
overall percentage of the population living with a
disability: the number of individuals with
disabilities will grow faster than the population as
a whole. From 2000 to 2010, the percent of
Delaware’s population over 60 increased from
17.3% to 20.5%; by 2040, 30% of the population
will be over 60.8 While the overall population will
17.3%
2010: 20.5%
30.4%
0%
5%
10%
15%
20%
25%
30%
35%
2000 2005 2010 2015 2020 2025 2030 2035 2040
Projected Percent of Population over 60 Delaware, 2000 - 2040
Percent of Population over 60
Source: 2010 Delaware Population Consortium Population Projections
13.1%
16.8%
0%
5%
10%
15%
20%
2010 2015 2020 2025 2030 2035 2040
Estimated Percent of Population with any Disability Delaware, 2010 - 2040
Percent of Population with Any Disability, Est.
Source: Author estimates using 2009 American Community Survey and 2010 Delaware Population Consortium Population Projections
12 | C o m m u n i t y a n d C h o i c e
increase about 16% from 2000 to 2040, the population over 60 will increase 150%.
To create a general estimate of how this might affect disability prevalence in Delaware, we applied the 2009 rates
of disability prevalence by detailed age group and sex reported by the American Community Survey in Delaware to
the Delaware Population Consortium’s 2010 Population Projection Series. The 2009 rate was held constant across
the projections. Using this method, individuals with any disability are projected to increase from 13.1% of the
population in 2010 to 16.8% of the population in 2040.
POVERTY AND HOUSING NEEDS AMONG PEOPLE WITH DISABILITIES
AFFORDABILITY CHALLENGES FOR ALL HOUSEHOLDS
The recent recession and persistently high unemployment hit lowest income households earliest and hardest, in an
environment where the largest employment growth was already among lower-wage jobs in lower-wage industry
sectors. The foreclosure crisis has also put upward pressure on rents as millions of households, with battered
credit, lost savings and often unemployed, return to renting in a housing market that had added little multifamily
rental stock through the homeownership boom years. Decreases in home prices are of little help to the most
vulnerable households.
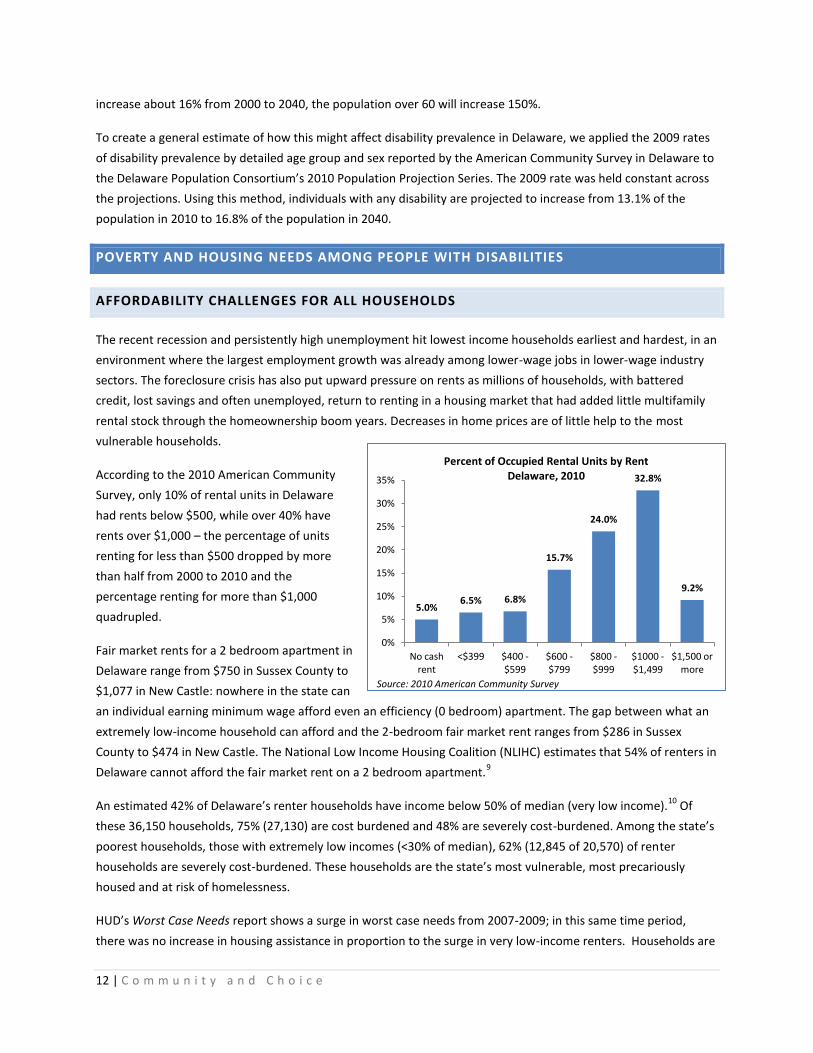
According to the 2010 American Community
Survey, only 10% of rental units in Delaware
had rents below $500, while over 40% have
rents over $1,000 – the percentage of units
renting for less than $500 dropped by more
than half from 2000 to 2010 and the
percentage renting for more than $1,000
quadrupled.
Fair market rents for a 2 bedroom apartment in
Delaware range from $750 in Sussex County to
$1,077 in New Castle: nowhere in the state can
an individual earning minimum wage afford even an efficiency (0 bedroom) apartment. The gap between what an
extremely low-income household can afford and the 2-bedroom fair market rent ranges from $286 in Sussex
County to $474 in New Castle. The National Low Income Housing Coalition (NLIHC) estimates that 54% of renters in
Delaware cannot afford the fair market rent on a 2 bedroom apartment.9
An estimated 42% of Delaware’s renter households have income below 50% of median (very low income).10
Of
these 36,150 households, 75% (27,130) are cost burdened and 48% are severely cost-burdened. Among the state’s
poorest households, those with extremely low incomes (<30% of median), 62% (12,845 of 20,570) of renter
households are severely cost-burdened. These households are the state’s most vulnerable, most precariously
housed and at risk of homelessness.
HUD’s Worst Case Needs report shows a surge in worst case needs from 2007-2009; in this same time period,
there was no increase in housing assistance in proportion to the surge in very low-income renters. Households are
5.0% 6.5% 6.8%
15.7%
24.0%
32.8%
9.2%
0%
5%
10%
15%
20%
25%
30%
35%
No cash rent
<$399 $400 - $599
$600 -$799
$800 - $999
$1000 - $1,499
$1,500 or more
Percent of Occupied Rental Units by Rent Delaware, 2010
Source: 2010 American Community Survey
13 | C o m m u n i t y a n d C h o i c e
considered to have worst case needs when they have very low incomes (below 50% of median), do not have
housing assistance, and are either severely cost burdened or living in severely inadequate housing. In 2009 7.10
million households had worst case needs by this definition: 41.4% of very low income renter households.11
Only
25% of very low income renter households reported having housing assistance.
For those without housing assistance, options are scarce due to a declining stock of affordable rental housing, the
long-term loss of federally assisted housing, substandard housing conditions, and “mismatch” of renters to units.
Nationally, higher income households occupy about 42% of the units that are affordable to extremely low-income
renters, and 36% of units affordable to households from 30-50% AMI. Only 32 units of adequate, affordable rental
housing are available every 100 extremely low income renters.12
In Delaware, only about 12% of vacant for-rent
units are affordable to extremely low income households. Worsening this situation, the country’s stock of
subsidized rental housing has declined steadily in recent years: since 1995, approximately 360,000 project-based
Section 8 units have been lost, with another 10,000 – 15,000 lost every year, and annually, about 10,000 public
housing units are lost to either demolition or sale.
In Delaware, as in the nation, there is a general scarcity of housing assistance for the most vulnerable households.
Statewide, approximately 13,600 households are on public housing and Housing Choice Voucher waiting lists,
mostly households with extremely low incomes.13
As of 12/31/11, there were a combined 8,170 households on
waiting lists at project-based Section 8 sites in Delaware (privately owned, federally subsidized sites), and over
3,000 households on waiting lists for Low income Housing Tax Credit (LIHTC) sites.14
INCOME AND POVERTY RATES
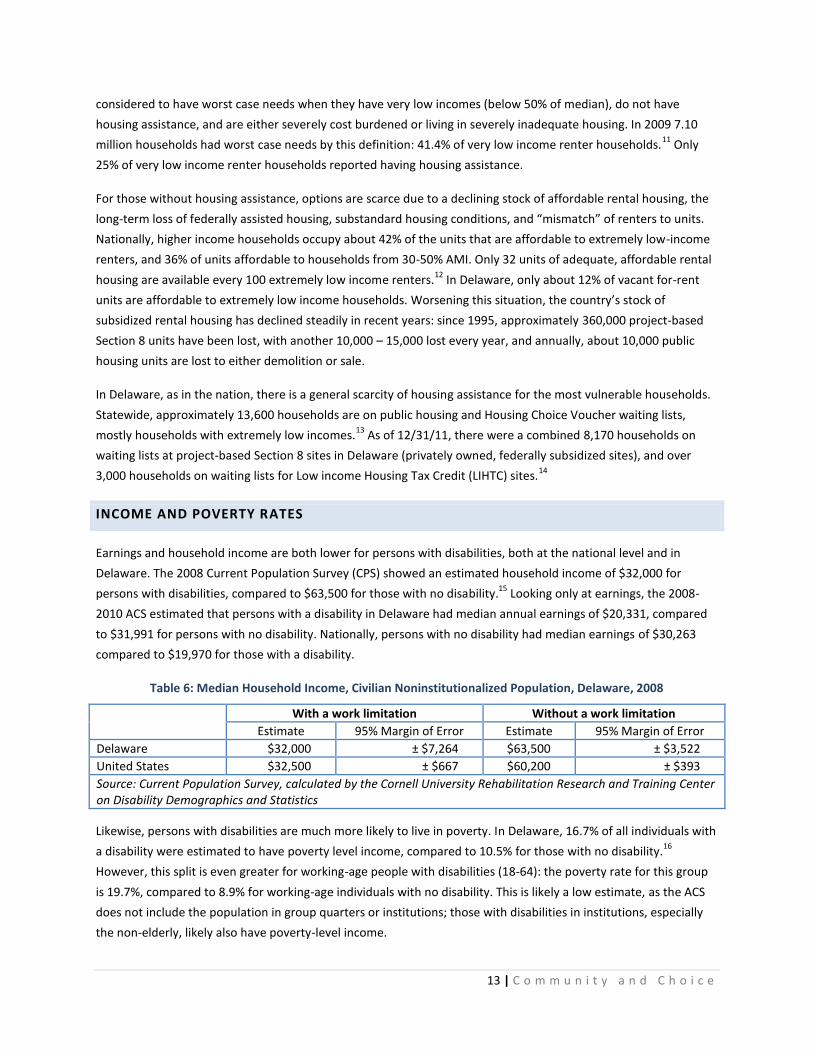
Earnings and household income are both lower for persons with disabilities, both at the national level and in
Delaware. The 2008 Current Population Survey (CPS) showed an estimated household income of $32,000 for
persons with disabilities, compared to $63,500 for those with no disability.15
Looking only at earnings, the 2008-
2010 ACS estimated that persons with a disability in Delaware had median annual earnings of $20,331, compared
to $31,991 for persons with no disability. Nationally, persons with no disability had median earnings of $30,263
compared to $19,970 for those with a disability.
Table 6: Median Household Income, Civilian Noninstitutionalized Population, Delaware, 2008
With a work limitation Without a work limitation
Estimate 95% Margin of Error Estimate 95% Margin of Error
Delaware $32,000 ± $7,264 $63,500 ± $3,522
United States $32,500 ± $667 $60,200 ± $393
Source: Current Population Survey, calculated by the Cornell University Rehabilitation Research and Training Center on Disability Demographics and Statistics
Likewise, persons with disabilities are much more likely to live in poverty. In Delaware, 16.7% of all individuals with
a disability were estimated to have poverty level income, compared to 10.5% for those with no disability.16
However, this split is even greater for working-age people with disabilities (18-64): the poverty rate for this group
is 19.7%, compared to 8.9% for working-age individuals with no disability. This is likely a low estimate, as the ACS
does not include the population in group quarters or institutions; those with disabilities in institutions, especially
the non-elderly, likely also have poverty-level income.

14 | C o m m u n i t y a n d C h o i c e
Table 7: Poverty Rates and Median Earnings by Disability, Delaware, 2008-2010
With a Disability With no Disability
Median earnings $20,331 $31,991
Percent in poverty (<100% of poverty threshold)* 16.7% 10.5%
Percent in poverty or near-poverty (<200% of poverty threshold)
39.4% 24.9%
*Poverty thresholds used in the ACS are those set by the Census Bureau by household size and presence of children. For a one-person household under 65, the 2009 poverty threshold was $11,161. Source: U.S. Census Bureau, 2008-2010 American Community Survey
Poverty is even more widespread among people with severe disabilities. Those with a severe disability are far more
likely to be in poverty: 27% of people 25 – 64 years old with a severe disability had poverty-level income compared
to 12.0% of those with a non-severe disability and 9.1% of those with no disability.17
In 2005, 41.5% of people 25 -
64with a severe disability had monthly household income below $2,000, compared to 20.4% of those with a
nonsevere disability and 13.7% of those with no disability.
Poverty-level income itself is an inadequate measure of material hardship and need, as the level is so low: the
federal poverty threshold for one person in 2009 was $11,161 (those under 65; for those over 65, $10,289)18
. A
family or person may have double that income and still face serious housing and other needs. Nationally, 36% of
individuals with a disability are estimated to have income below 200% of the federal poverty level, making up 18%
of persons with income below 200% of the poverty level.19
In Delaware, 18,434 people were estimated to have income below 100% of the federal poverty level and a
disability in 2008-2010. When we expand our view of poverty to include households with income from 100-200%
of the poverty level (for one person under 65, 100% in 2009 was $11,161; 200% was $22,322), the disparity
between people with disabilities and those with no disabilities is even more stark. In Delaware, an estimated 39%
of people with disabilities had income below 200% of the federal poverty level, compared to 25% of people with
no disabilities. People with disabilities make up about 19% of those in poverty in Delaware.
Table 8: Percent of Population with a Disability by Poverty, Delaware, 2008-2010
Population With a
Disability Percent
Below 100% of Poverty Threshold* (2009: $11,161) 97,812 18,434 18.8%
Below 200% of Poverty Threshold (2009: $22,322) 230,789 43,442 18.8%
Over 200% of Poverty Threshold 631,594 66,937 10.6%
*Poverty thresholds used in the ACS are those set by the Census Bureau by household size and presence of children. For a one-person household under 65, the 2009 poverty threshold was $11,161. Source: U.S. Census Bureau, 2008 - 2010 American Community Survey Universe: Civilian noninstitutionalized population for whom poverty status was determined.
Among those who are homeless, about 35% of whom have a disability, incomes are often so low as to be
practically negligible. The 2011 Delaware Point-in-Time study showed that 43% of individuals surveyed who were
homeless had no income whatsoever, and 25% had income of less than $500 a month20
. Many of these individuals
count state General Assistance (approximately $90 a month) as their only income. 68% of individuals surveyed thus
had income below $500 a month.

15 | C o m m u n i t y a n d C h o i c e
FEDERAL INCOME SUPPORTS
People with disabilities may need
to rely on Supplemental Security
Income (SSI) or Social Security
Disability Insurance (SSDI) as their
main source of income, and
disproportionately experience
poverty and long-term poverty. In
Delaware, the Social Security
Administration (SSA) reports that
9,253 non-elderly adults with
disabilities received SSI benefits in
2009.21
This works out to an annual
income of just over $8,000, well
below the 2009 federal poverty
threshold of $11,161. The standard SSI benefit of $698/month does not allow an individual to rent even an
efficiency apartment anywhere in the state.
Table 9: SSI Recipients by Eligibility Category and Age, Delaware, 2009
Category Age
Aged Blind and disabled
Under 18 18 – 64 65 or older
Delaware 15,384 14,082 3,577 9,253 2,549
Kent 3,431 3,211 748 2,215 468
New Castle 9,103 8,232 2,190 5,303 1,610
Sussex 2,850 2,639 639 1,735 471
Source: Social Security Administration, SSI Recipients by State and County, 2009
Priced Out in 2010: The Housing Crisis for People with Disabilities reports that in 2010, approximately 4.4 million
adults with disabilities between 18 and 65 relied on SSI as their main source of income and had annual incomes of
less than $8,500.22
Many of those in institutions, often funded by Medicaid, rely on SSI for their income and
absolutely require a housing subsidy to live in the community. In many communities, including in all of Delaware,
individuals relying on SSI for income would need to pay close to or even more than 100% of their monthly income
to afford the fair market rent on a basic apartment. Across the nation, the average person on SSI needed to pay
112% of their monthly income to rent a 1 bedroom apartment.
For the 9,253 non-elderly adults with disabilities receiving SSI benefits in Delaware, the fair market rent on a 1
bedroom apartment would be 123% of their monthly income. As a percent of the median income, SSI is 17% of the
one-person median income for Delaware.
$209
$284
$372
$380
$832
$0 $100 $200 $300 $400 $500 $600 $700 $800 $900
Supplemental Security Income (SSI)
1-person 2010 Poverty Threshold
Minimum Wage (DE)
30% of AMI (DE, 1 person)
2010 1 BR Fair Market Rent
Affordable Rents and 1-BR Fair Market Rent, Delaware
Affordable Rent
Sources: HUD, U.S. Census Bureau, Social Security Administration

16 | C o m m u n i t y a n d C h o i c e
LONG-TERM POVERTY
People with disabilities are far more likely to experience long term poverty (36 months or more of poverty-level
income), and those in long-term poverty are far more likely to have disabilities, especially disabilities of long
duration. The poverty rate for those with no work disability was 6%; for those with a work limitation only, 10%,
but for those for whom their disability prevented work in all months of the year, the poverty rate was 32%.23
Annual poverty rates (households with annual income below the poverty level) are also 2 to 5 times higher among
working-age people with disabilities compared to their counterparts without disabilities. As might be expected,
poverty rates are generally higher for those with more severe disabilities. 6.08% of individuals 25-61 with no
disability were in poverty, compared to 12.09% with some disability and 22.75% of those who had a severe
disability.
Table 10: Annual Poverty Rates by Functional or Activity Limitation Status, Ages 25 to 61, United States, 1997
Disability No Difficulty Difficulty Inability or Needs
Assistance to Perform Activity (Severe Disability)
Sensory Limitation 7.43 16.84 23.55
Functional limitation 6.48 12.50 22.84
ADLs/IADLs 7.20 18.10 25.90
Any limitation 6.08 12.09 22.75
Source: She and Livermore, 2009
Poverty-level income is compounded by higher costs for services and results in much higher rates of material
hardships such as food insecurity among people with disabilities in poverty. In 1997, average annual out-of-pocket
health care expenditures among working-age people with disabilities were about 3 times higher than that of their
counterparts without disabilities.24
Controlling for income and other demographics, people with work limitations
were more likely than those without work limitations to experience more material hardships, at every level of
income. About 40% of those in poverty reporting a work limitation in 1998, regardless of duration, experienced
food insecurity compared to just 4% of those with incomes above 200% of the poverty level and no work
limitation.25
People with disabilities living in poverty are much more likely than others living in poverty to experience material
hardship. Further, people with more severe disabilities or disabilities of long duration are more likely to experience
material hardship, even among people with income below poverty level. 21% of people with income below poverty
level and a work limitation lasting more than 12 months reported not getting needed medical care, compared to
12% of people with no work limitation. 20% reported food insecurity with hunger, compared to 8% of people with
no work limitation.26
Costs for transportation, medical care, attendant care and assistive technology may all make low income an even
greater barrier to living independently in the community. She and Livermore (2007) used reports of material
hardship in the Survey on Income and Program Participation to identify a poverty standard adjusted for people
with disabilities: how much income would a person with a disability need to have an equal probability of
experiencing material hardship as a person with no disability? Their analysis suggested a disability-adjusted
poverty standard of $34,239 for a person with a work limitation lasting longer than 12 months.

17 | C o m m u n i t y a n d C h o i c e
Low asset limits in critical federal income support programs may also contribute to long-term poverty as they
create barriers for people with disabilities to save and to make investments that may improve their circumstances
long-term, including education, assistive technology, transportation and homeownership. Current asset limits for
Supplemental Security Income,
for example, have not been
raised since 1989, at $2,000
per person or $3,000 per
couple. While other important
programs’ eligibility and asset
limits are controlled by states
(for example, Medicaid and
Supplemental Nutrition
Assistance Program (SNAP)),
low asset limits in these
federal programs remain a
major barrier. Delaware has
eliminated asset tests in its
Medicaid and SNAP (food
stamp) programs.
EMPLOYMENT
It is often challenging for people with disabilities to acquire and maintain employment. When they are employed,
it is more likely to be on a part-time basis and/or in lower-income occupational groups, and those in the labor
market are far more likely to be unemployed. The Bureau of Labor Statistics’ Current Population Survey (CPS)
reports that 1/3 of workers with a disability were employed part-time, compared to about 1/5 of those with no
disability.27
Among working age adults (16-64), 35.2% of persons with a disability were in the labor force, with an
unemployment rate of 15.6% in 2009, compared to 77.8% participation among persons with no disability and an
unemployment rate of 9.2%.
2009 ACS estimates on disability and employment similarly show the disproportionate impact of disability on
unemployment and labor force participation in Delaware. Persons with a disability made up 5.4% of employed
persons in Delaware, but 13.6% of those who were unemployed and 28.7% of those not in the labor force.
Table 11: Labor Force Participation, Percent of Population Employed, and Unemployment Rate, Delaware, 2009
Persons with a disability Persons with no disability
Labor force
participation rate
Percent of population employed
Unemployment Rate
Labor force participation
rate
Percent of population employed
Unemployment Rate
All persons 22.4 19.2 14.5 70.9 64.5 9.0
16 to 64 years 35.2 29.7 15.6 77.8 70.7 9.2
65 and over 6.8 6.3 7.4 22.1 20.7 6.3
Source: Current Population Survey, calculated by Cornell University
63%
48%
16% 21%
27%
15% 17%
25%
69%
0%
10%
20%
30%
40%
50%
60%
70%
80%
No disability Not severe Severe
Percentage of People 21 to 64 Years Employed in the Previous 12 Months by Disability Status, U.S., 2005
Employed full-time, year-round Employed part-time, year-round Unemployed year-round
Source: Survey on Income and Program Participation (2005)
18 | C o m m u n i t y a n d C h o i c e
People with severe disabilities are often even more limited in their employment. 69.3% of people 21-64 with
severe disabilities were unemployed year-round, compared to 24.8% of those with non-severe disabilities and
16.5% of those with no disability.28
Only 15.6% of people with severe disabilities were employed full-time, year-
round, compared to 62.9% of those with no disability. More than half (55.0%) of those with severe disabilities
reported that their disabilities prevented them from working. When people with severe disabilities are able to
maintain employment, still, their earnings are far less than their counterparts with non-severe or no disabilities:
the 2005 SIPP reported median monthly earnings of $2,539 for those with no disability, $2,250 for those with a
non-severe disability, and only $1,458 for those with a severe disability.
WORST CASE HOUSING NEEDS
Biannually, the U.S. Department of Housing and Urban Development releases a report on worst case housing
needs as a measure of the nation’s most critical housing needs. “Worst case needs” are defined as households
with very low incomes (below 50% of the area median for their household size) who do not receive government
housing assistance and are severely cost burdened (pay more than 50% of their income for rent), live in severely
inadequate conditions (overcrowded or substandard), or both. In the past, issues with the main data source used
to develop HUD’s worst case needs studies led to serious concerns that the needs of persons with disabilities and
their prevalence among households with worst case needs were underestimated. In 2011, HUD addressed these
concerns with new data methods and released a supplement to its report focusing on the worst case housing
needs of persons with disabilities.29
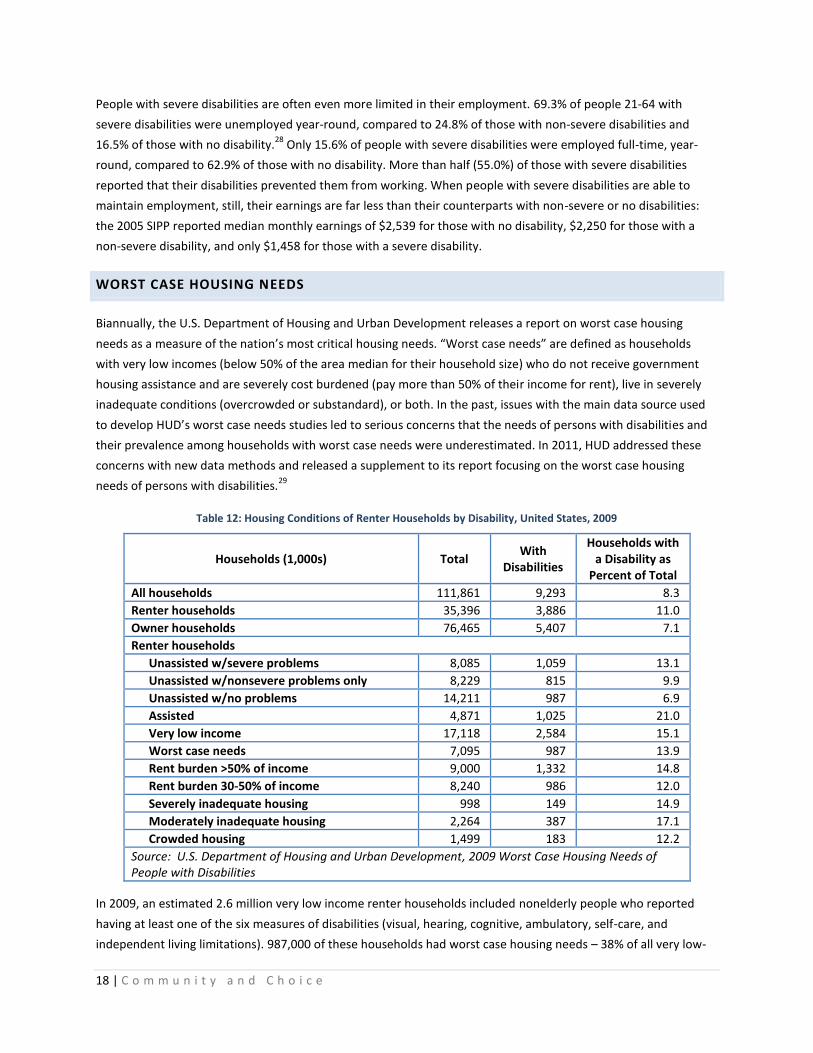
Table 12: Housing Conditions of Renter Households by Disability, United States, 2009
Households (1,000s) Total With
Disabilities
Households with a Disability as
Percent of Total
All households 111,861 9,293 8.3
Renter households 35,396 3,886 11.0
Owner households 76,465 5,407 7.1
Renter households
Unassisted w/severe problems 8,085 1,059 13.1
Unassisted w/nonsevere problems only 8,229 815 9.9
Unassisted w/no problems 14,211 987 6.9
Assisted 4,871 1,025 21.0
Very low income 17,118 2,584 15.1
Worst case needs 7,095 987 13.9
Rent burden >50% of income 9,000 1,332 14.8
Rent burden 30-50% of income 8,240 986 12.0
Severely inadequate housing 998 149 14.9
Moderately inadequate housing 2,264 387 17.1
Crowded housing 1,499 183 12.2
Source: U.S. Department of Housing and Urban Development, 2009 Worst Case Housing Needs of People with Disabilities
In 2009, an estimated 2.6 million very low income renter households included nonelderly people who reported
having at least one of the six measures of disabilities (visual, hearing, cognitive, ambulatory, self-care, and
independent living limitations). 987,000 of these households had worst case housing needs – 38% of all very low-
19 | C o m m u n i t y a n d C h o i c e
income renter households with disabilities. Renter households that include people with disabilities are more likely
than those that do not include people with disabilities to have very low incomes, experience worst case needs, pay
more than one-half of their income for rent, and have other housing problems such as living in inadequate or
overcrowded housing. Other key findings of this report include:
66% of renter households with disabilities had very low incomes, compared to 46% of those without
disabilities
Ambulatory, cognitive and independent living limitations were the most prevalent limitations among
households with worst case needs that included people with disabilities.
34% of renter households with disabilities had severe rent burden (>50% of income towards rent),
compared to 24% without disabilities.
Additionally, 619,000 households with worst case needs include elderly people with disabilities.
Although state-level data are not produced for the HUD Worst Case Housing Needs report, for this study, a state-
level estimate of worst case rental housing needs was developed. This estimate is discussed in detail in the Rental
Housing Needs section.
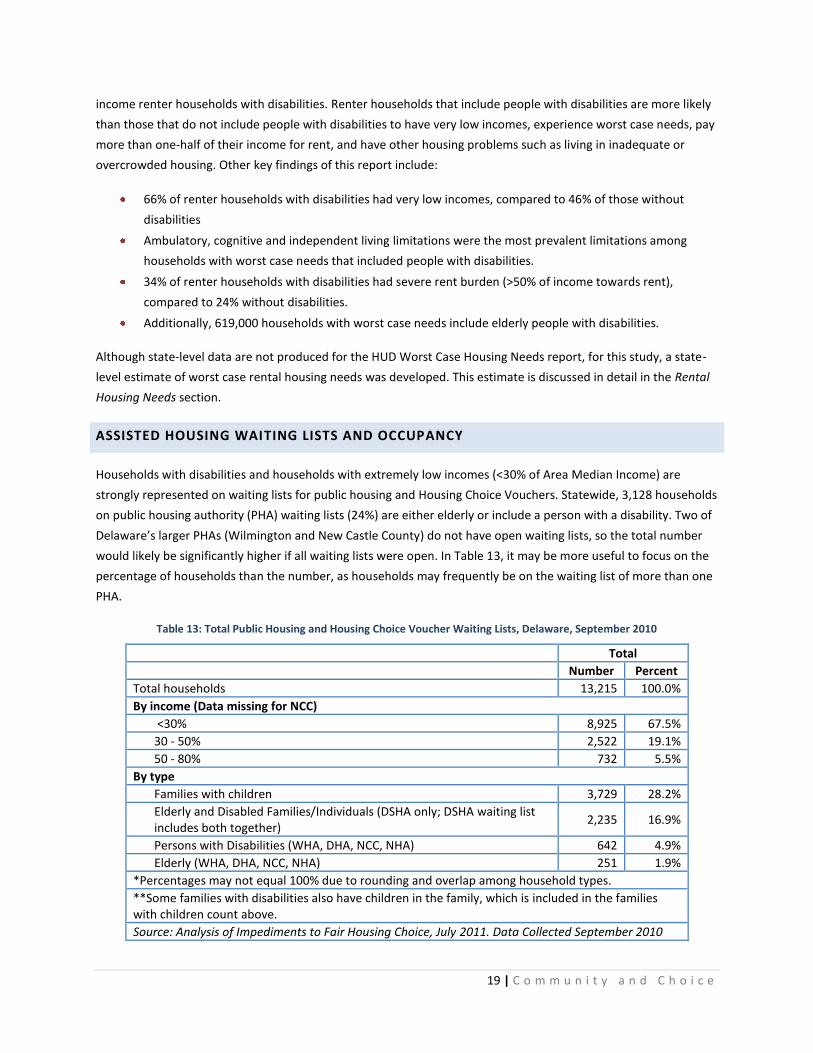
ASSISTED HOUSING WAITING LISTS AND OCCUPANCY
Households with disabilities and households with extremely low incomes (<30% of Area Median Income) are
strongly represented on waiting lists for public housing and Housing Choice Vouchers. Statewide, 3,128 households
on public housing authority (PHA) waiting lists (24%) are either elderly or include a person with a disability. Two of
Delaware’s larger PHAs (Wilmington and New Castle County) do not have open waiting lists, so the total number
would likely be significantly higher if all waiting lists were open. In Table 13, it may be more useful to focus on the
percentage of households than the number, as households may frequently be on the waiting list of more than one
PHA.
Table 13: Total Public Housing and Housing Choice Voucher Waiting Lists, Delaware, September 2010
Total
Number Percent
Total households 13,215 100.0%
By income (Data missing for NCC)
<30% 8,925 67.5%
30 - 50% 2,522 19.1%
50 - 80% 732 5.5%
By type
Families with children 3,729 28.2%
Elderly and Disabled Families/Individuals (DSHA only; DSHA waiting list includes both together)
2,235 16.9%
Persons with Disabilities (WHA, DHA, NCC, NHA) 642 4.9%
Elderly (WHA, DHA, NCC, NHA) 251 1.9%
*Percentages may not equal 100% due to rounding and overlap among household types.
**Some families with disabilities also have children in the family, which is included in the families with children count above.
Source: Analysis of Impediments to Fair Housing Choice, July 2011. Data Collected September 2010
20 | C o m m u n i t y a n d C h o i c e
Assisted housing (public housing, Housing Choice Vouchers, or privately owned housing with project-based
subsidies) is highly effective in reducing worst case housing needs, especially among people with disabilities.
Renter households that include people with disabilities are two times more likely to receive housing assistance
than those that do not: about 37% of very low-income renter households with disabilities received housing
assistance compared to only 23% of those without disabilities.30
In the focus groups convened to inform this
report, feedback from consumers identified the availability of some assisted housing, however limited, as the main
positive they saw about housing for persons with disabilities. While it is in short supply, for those able to access it,
it results in a major improvement in their quality of life.
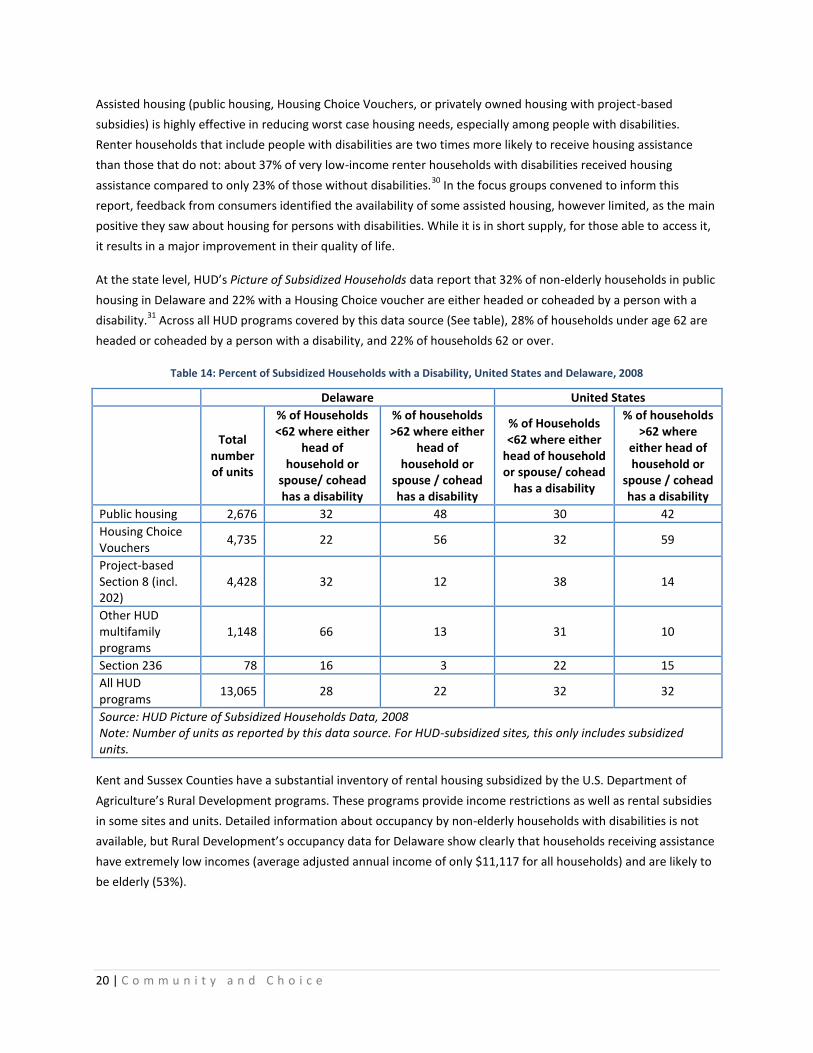
At the state level, HUD’s Picture of Subsidized Households data report that 32% of non-elderly households in public
housing in Delaware and 22% with a Housing Choice voucher are either headed or coheaded by a person with a
disability.31
Across all HUD programs covered by this data source (See table), 28% of households under age 62 are
headed or coheaded by a person with a disability, and 22% of households 62 or over.
Table 14: Percent of Subsidized Households with a Disability, United States and Delaware, 2008
Delaware United States
Total
number of units
% of Households <62 where either
head of household or
spouse/ cohead has a disability
% of households >62 where either
head of household or
spouse / cohead has a disability
% of Households <62 where either
head of household or spouse/ cohead
has a disability
% of households >62 where
either head of household or
spouse / cohead has a disability
Public housing 2,676 32 48 30 42
Housing Choice Vouchers
4,735 22 56 32 59
Project-based Section 8 (incl. 202)
4,428 32 12 38 14
Other HUD multifamily programs
1,148 66 13 31 10
Section 236 78 16 3 22 15
All HUD programs
13,065 28 22 32 32
Source: HUD Picture of Subsidized Households Data, 2008 Note: Number of units as reported by this data source. For HUD-subsidized sites, this only includes subsidized units.
Kent and Sussex Counties have a substantial inventory of rental housing subsidized by the U.S. Department of
Agriculture’s Rural Development programs. These programs provide income restrictions as well as rental subsidies
in some sites and units. Detailed information about occupancy by non-elderly households with disabilities is not
available, but Rural Development’s occupancy data for Delaware show clearly that households receiving assistance
have extremely low incomes (average adjusted annual income of only $11,117 for all households) and are likely to
be elderly (53%).
21 | C o m m u n i t y a n d C h o i c e
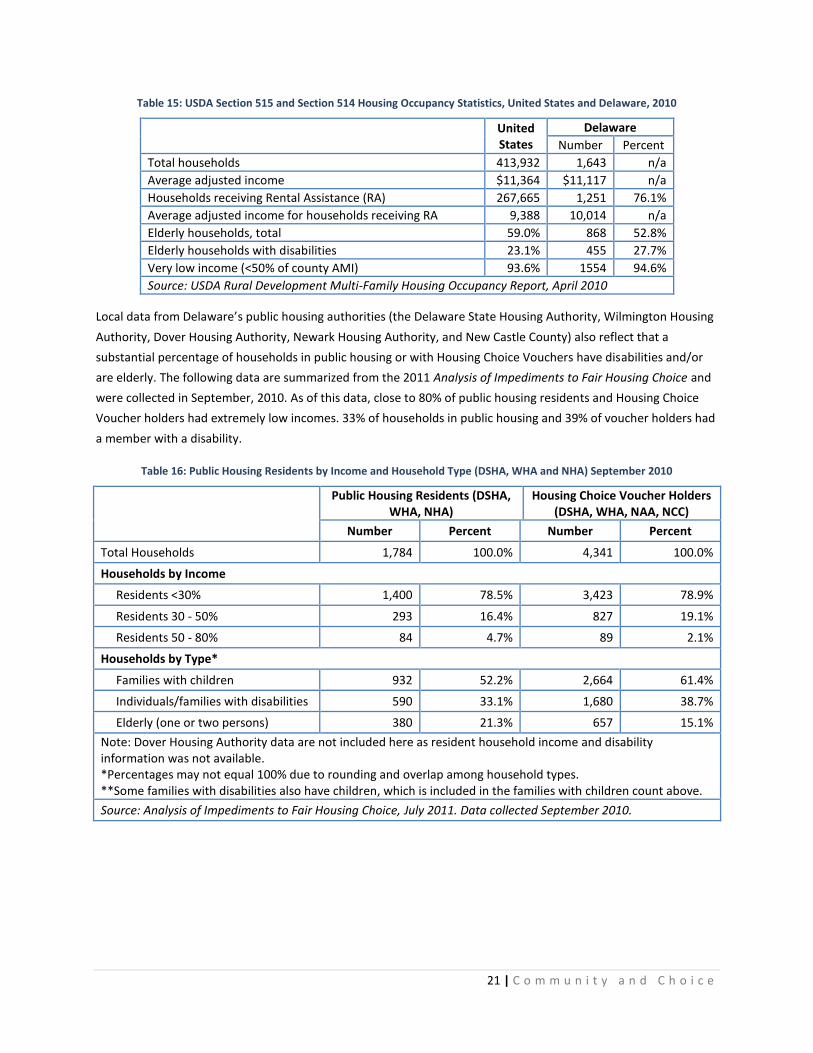
Table 15: USDA Section 515 and Section 514 Housing Occupancy Statistics, United States and Delaware, 2010
United States
Delaware
Number Percent
Total households 413,932 1,643 n/a
Average adjusted income $11,364 $11,117 n/a
Households receiving Rental Assistance (RA) 267,665 1,251 76.1%
Average adjusted income for households receiving RA 9,388 10,014 n/a
Elderly households, total 59.0% 868 52.8%
Elderly households with disabilities 23.1% 455 27.7%
Very low income (<50% of county AMI) 93.6% 1554 94.6%
Source: USDA Rural Development Multi-Family Housing Occupancy Report, April 2010
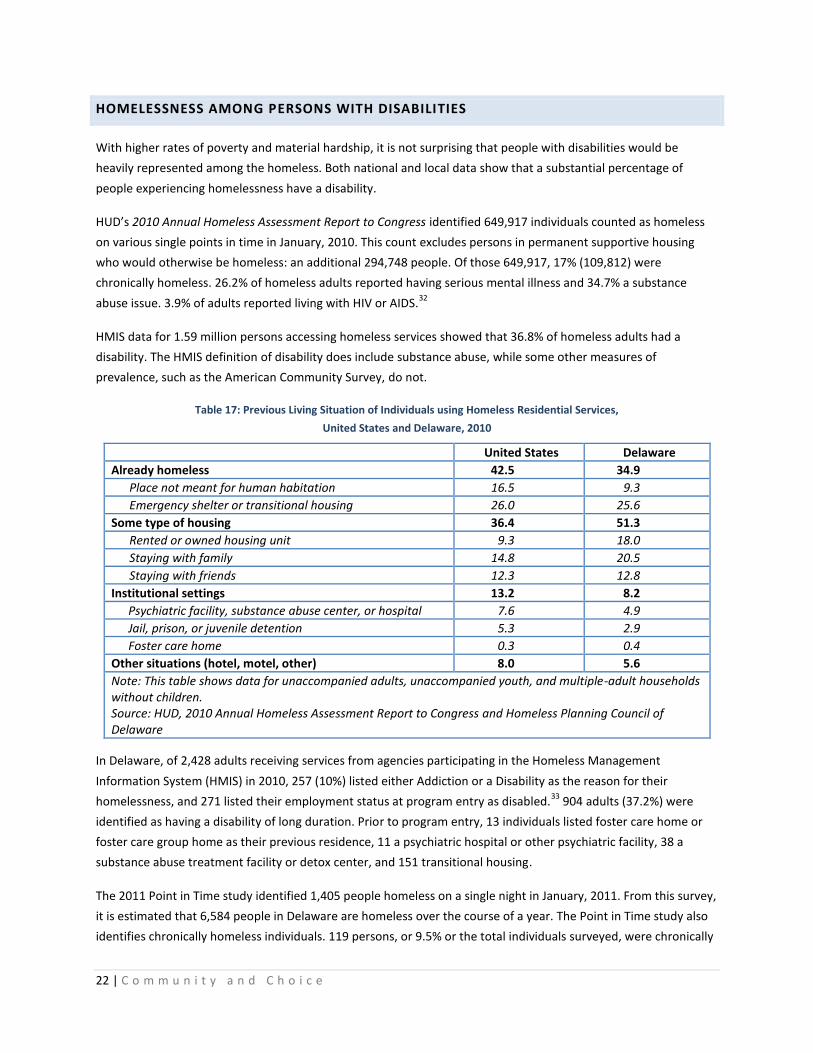
Local data from Delaware’s public housing authorities (the Delaware State Housing Authority, Wilmington Housing
Authority, Dover Housing Authority, Newark Housing Authority, and New Castle County) also reflect that a
substantial percentage of households in public housing or with Housing Choice Vouchers have disabilities and/or
are elderly. The following data are summarized from the 2011 Analysis of Impediments to Fair Housing Choice and
were collected in September, 2010. As of this data, close to 80% of public housing residents and Housing Choice
Voucher holders had extremely low incomes. 33% of households in public housing and 39% of voucher holders had
a member with a disability.
Table 16: Public Housing Residents by Income and Household Type (DSHA, WHA and NHA) September 2010
Public Housing Residents (DSHA, WHA, NHA)
Housing Choice Voucher Holders (DSHA, WHA, NAA, NCC)
Number Percent Number Percent
Total Households 1,784 100.0% 4,341 100.0%
Households by Income
Residents <30% 1,400 78.5% 3,423 78.9%
Residents 30 - 50% 293 16.4% 827 19.1%
Residents 50 - 80% 84 4.7% 89 2.1%
Households by Type*
Families with children 932 52.2% 2,664 61.4%
Individuals/families with disabilities 590 33.1% 1,680 38.7%
Elderly (one or two persons) 380 21.3% 657 15.1%
Note: Dover Housing Authority data are not included here as resident household income and disability information was not available. *Percentages may not equal 100% due to rounding and overlap among household types. **Some families with disabilities also have children, which is included in the families with children count above.
Source: Analysis of Impediments to Fair Housing Choice, July 2011. Data collected September 2010.
22 | C o m m u n i t y a n d C h o i c e
HOMELESSNESS AMONG PERSONS WITH DISABILITIES
With higher rates of poverty and material hardship, it is not surprising that people with disabilities would be
heavily represented among the homeless. Both national and local data show that a substantial percentage of
people experiencing homelessness have a disability.
HUD’s 2010 Annual Homeless Assessment Report to Congress identified 649,917 individuals counted as homeless
on various single points in time in January, 2010. This count excludes persons in permanent supportive housing
who would otherwise be homeless: an additional 294,748 people. Of those 649,917, 17% (109,812) were
chronically homeless. 26.2% of homeless adults reported having serious mental illness and 34.7% a substance
abuse issue. 3.9% of adults reported living with HIV or AIDS.32
HMIS data for 1.59 million persons accessing homeless services showed that 36.8% of homeless adults had a
disability. The HMIS definition of disability does include substance abuse, while some other measures of
prevalence, such as the American Community Survey, do not.
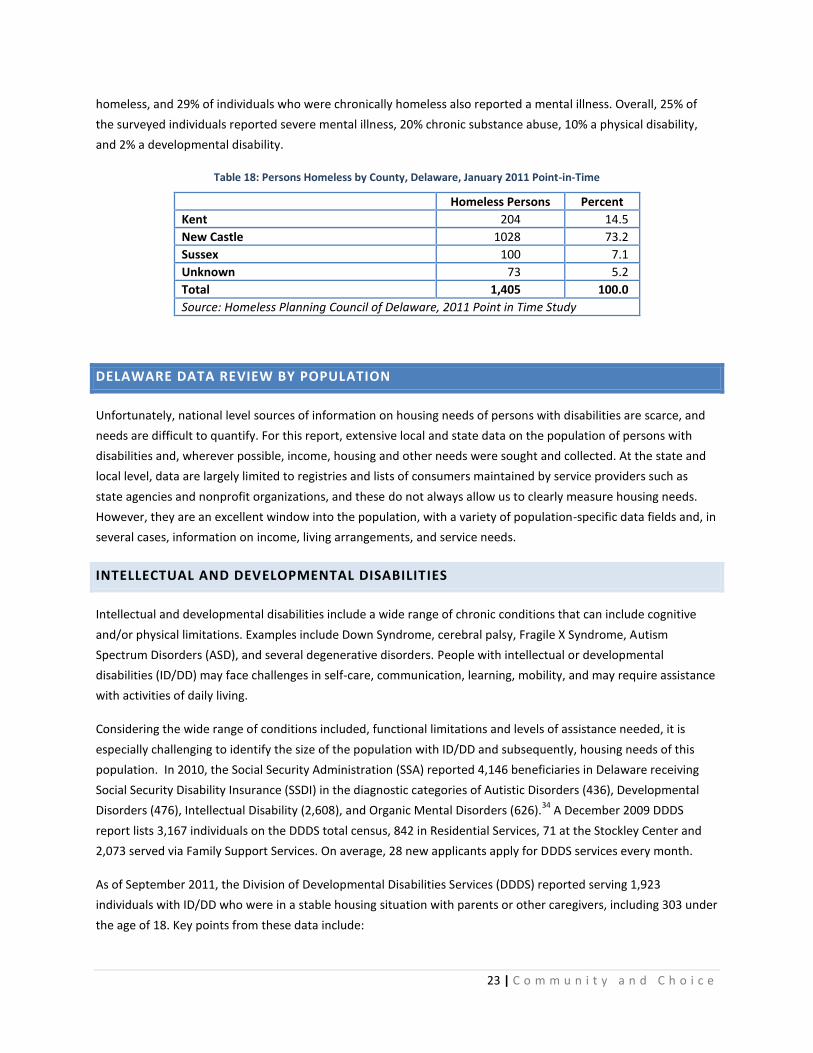
Table 17: Previous Living Situation of Individuals using Homeless Residential Services,
United States and Delaware, 2010
United States Delaware
Already homeless 42.5 34.9
Place not meant for human habitation 16.5 9.3
Emergency shelter or transitional housing 26.0 25.6
Some type of housing 36.4 51.3
Rented or owned housing unit 9.3 18.0
Staying with family 14.8 20.5
Staying with friends 12.3 12.8
Institutional settings 13.2 8.2
Psychiatric facility, substance abuse center, or hospital 7.6 4.9
Jail, prison, or juvenile detention 5.3 2.9
Foster care home 0.3 0.4
Other situations (hotel, motel, other) 8.0 5.6
Note: This table shows data for unaccompanied adults, unaccompanied youth, and multiple-adult households without children. Source: HUD, 2010 Annual Homeless Assessment Report to Congress and Homeless Planning Council of Delaware
In Delaware, of 2,428 adults receiving services from agencies participating in the Homeless Management
Information System (HMIS) in 2010, 257 (10%) listed either Addiction or a Disability as the reason for their
homelessness, and 271 listed their employment status at program entry as disabled.33
904 adults (37.2%) were
identified as having a disability of long duration. Prior to program entry, 13 individuals listed foster care home or
foster care group home as their previous residence, 11 a psychiatric hospital or other psychiatric facility, 38 a
substance abuse treatment facility or detox center, and 151 transitional housing.
The 2011 Point in Time study identified 1,405 people homeless on a single night in January, 2011. From this survey,
it is estimated that 6,584 people in Delaware are homeless over the course of a year. The Point in Time study also
identifies chronically homeless individuals. 119 persons, or 9.5% or the total individuals surveyed, were chronically
23 | C o m m u n i t y a n d C h o i c e
homeless, and 29% of individuals who were chronically homeless also reported a mental illness. Overall, 25% of
the surveyed individuals reported severe mental illness, 20% chronic substance abuse, 10% a physical disability,
and 2% a developmental disability.
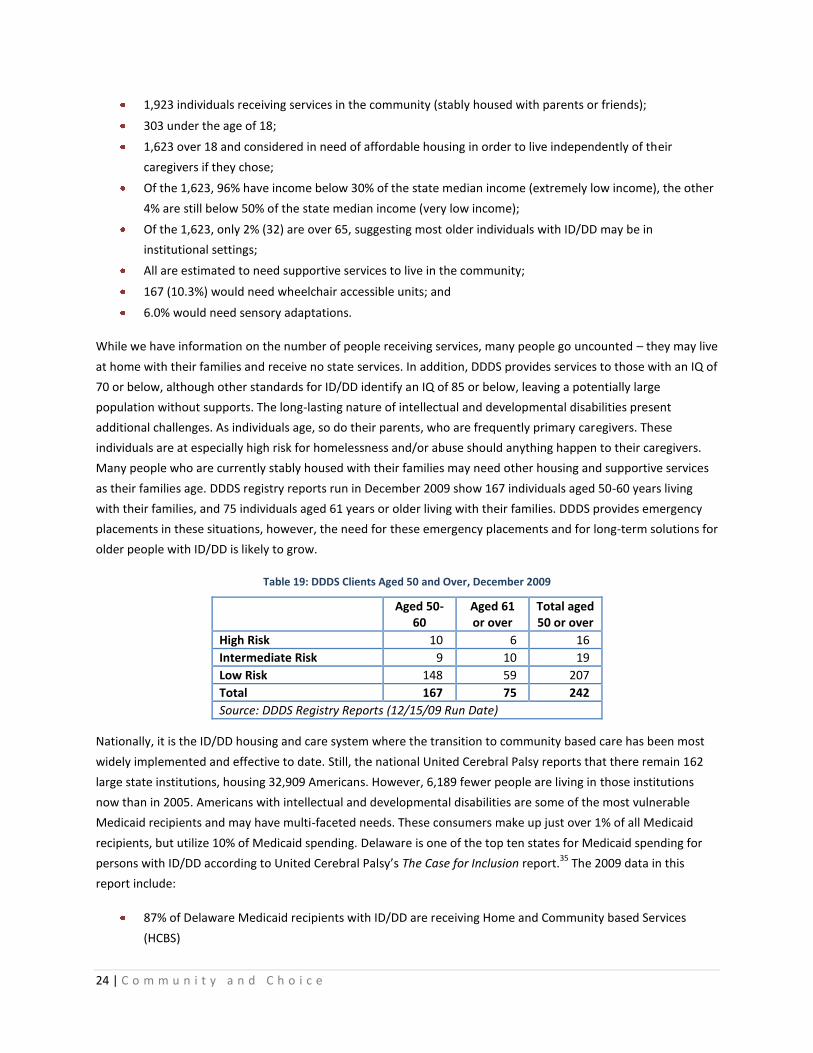
Table 18: Persons Homeless by County, Delaware, January 2011 Point-in-Time
Homeless Persons Percent
Kent 204 14.5
New Castle 1028 73.2
Sussex 100 7.1
Unknown 73 5.2
Total 1,405 100.0
Source: Homeless Planning Council of Delaware, 2011 Point in Time Study
DELAWARE DATA REVIEW BY POPULATION
Unfortunately, national level sources of information on housing needs of persons with disabilities are scarce, and
needs are difficult to quantify. For this report, extensive local and state data on the population of persons with
disabilities and, wherever possible, income, housing and other needs were sought and collected. At the state and
local level, data are largely limited to registries and lists of consumers maintained by service providers such as
state agencies and nonprofit organizations, and these do not always allow us to clearly measure housing needs.
However, they are an excellent window into the population, with a variety of population-specific data fields and, in
several cases, information on income, living arrangements, and service needs.
INTELLECTUAL AND DEVELOPMENTAL DISABILITIES
Intellectual and developmental disabilities include a wide range of chronic conditions that can include cognitive
and/or physical limitations. Examples include Down Syndrome, cerebral palsy, Fragile X Syndrome, Autism
Spectrum Disorders (ASD), and several degenerative disorders. People with intellectual or developmental
disabilities (ID/DD) may face challenges in self-care, communication, learning, mobility, and may require assistance
with activities of daily living.
Considering the wide range of conditions included, functional limitations and levels of assistance needed, it is
especially challenging to identify the size of the population with ID/DD and subsequently, housing needs of this
population. In 2010, the Social Security Administration (SSA) reported 4,146 beneficiaries in Delaware receiving
Social Security Disability Insurance (SSDI) in the diagnostic categories of Autistic Disorders (436), Developmental
Disorders (476), Intellectual Disability (2,608), and Organic Mental Disorders (626).34
A December 2009 DDDS
report lists 3,167 individuals on the DDDS total census, 842 in Residential Services, 71 at the Stockley Center and
2,073 served via Family Support Services. On average, 28 new applicants apply for DDDS services every month.
As of September 2011, the Division of Developmental Disabilities Services (DDDS) reported serving 1,923
individuals with ID/DD who were in a stable housing situation with parents or other caregivers, including 303 under
the age of 18. Key points from these data include:
24 | C o m m u n i t y a n d C h o i c e
1,923 individuals receiving services in the community (stably housed with parents or friends);
303 under the age of 18;
1,623 over 18 and considered in need of affordable housing in order to live independently of their
caregivers if they chose;
Of the 1,623, 96% have income below 30% of the state median income (extremely low income), the other
4% are still below 50% of the state median income (very low income);
Of the 1,623, only 2% (32) are over 65, suggesting most older individuals with ID/DD may be in
institutional settings;
All are estimated to need supportive services to live in the community;
167 (10.3%) would need wheelchair accessible units; and
6.0% would need sensory adaptations.
While we have information on the number of people receiving services, many people go uncounted – they may live
at home with their families and receive no state services. In addition, DDDS provides services to those with an IQ of
70 or below, although other standards for ID/DD identify an IQ of 85 or below, leaving a potentially large
population without supports. The long-lasting nature of intellectual and developmental disabilities present
additional challenges. As individuals age, so do their parents, who are frequently primary caregivers. These
individuals are at especially high risk for homelessness and/or abuse should anything happen to their caregivers.
Many people who are currently stably housed with their families may need other housing and supportive services
as their families age. DDDS registry reports run in December 2009 show 167 individuals aged 50-60 years living
with their families, and 75 individuals aged 61 years or older living with their families. DDDS provides emergency
placements in these situations, however, the need for these emergency placements and for long-term solutions for
older people with ID/DD is likely to grow.
Table 19: DDDS Clients Aged 50 and Over, December 2009
Aged 50-
60 Aged 61 or over
Total aged 50 or over
High Risk 10 6 16
Intermediate Risk 9 10 19
Low Risk 148 59 207
Total 167 75 242
Source: DDDS Registry Reports (12/15/09 Run Date)
Nationally, it is the ID/DD housing and care system where the transition to community based care has been most
widely implemented and effective to date. Still, the national United Cerebral Palsy reports that there remain 162
large state institutions, housing 32,909 Americans. However, 6,189 fewer people are living in those institutions
now than in 2005. Americans with intellectual and developmental disabilities are some of the most vulnerable
Medicaid recipients and may have multi-faceted needs. These consumers make up just over 1% of all Medicaid
recipients, but utilize 10% of Medicaid spending. Delaware is one of the top ten states for Medicaid spending for
persons with ID/DD according to United Cerebral Palsy’s The Case for Inclusion report.35
The 2009 data in this
report include:
87% of Delaware Medicaid recipients with ID/DD are receiving Home and Community based Services
(HCBS)
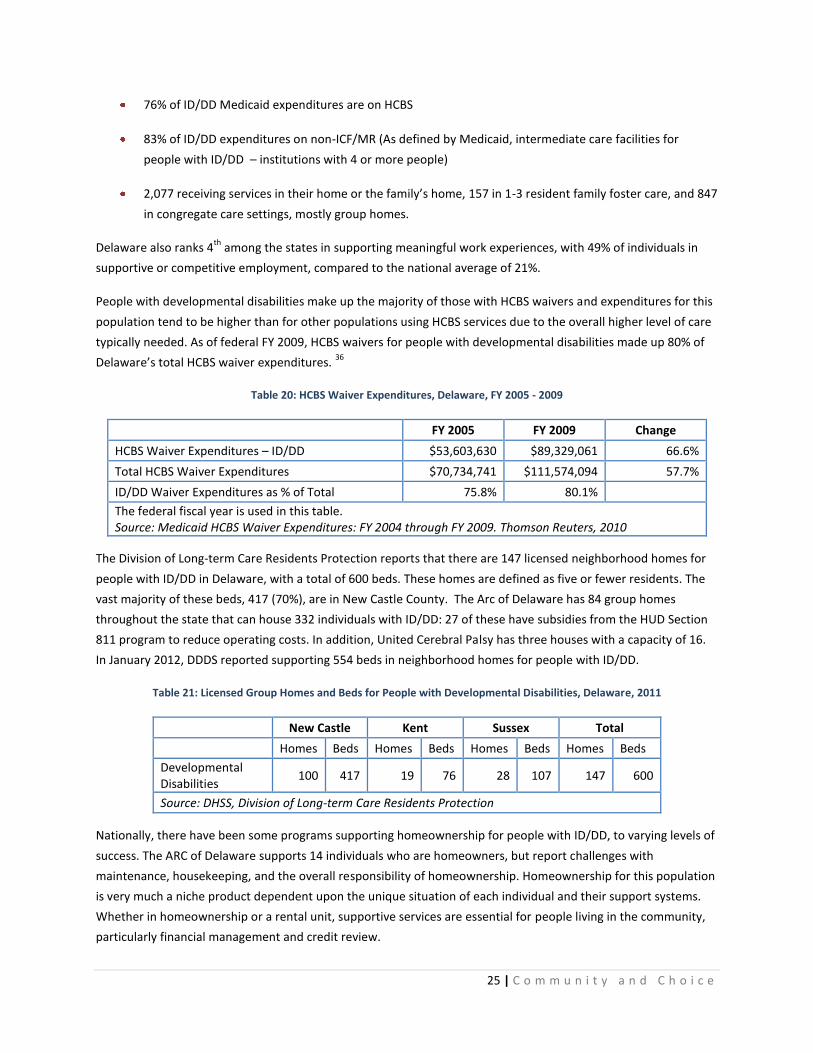
25 | C o m m u n i t y a n d C h o i c e
76% of ID/DD Medicaid expenditures are on HCBS
83% of ID/DD expenditures on non-ICF/MR (As defined by Medicaid, intermediate care facilities for
people with ID/DD – institutions with 4 or more people)
2,077 receiving services in their home or the family’s home, 157 in 1-3 resident family foster care, and 847
in congregate care settings, mostly group homes.
Delaware also ranks 4th
among the states in supporting meaningful work experiences, with 49% of individuals in
supportive or competitive employment, compared to the national average of 21%.
People with developmental disabilities make up the majority of those with HCBS waivers and expenditures for this
population tend to be higher than for other populations using HCBS services due to the overall higher level of care
typically needed. As of federal FY 2009, HCBS waivers for people with developmental disabilities made up 80% of
Delaware’s total HCBS waiver expenditures. 36
Table 20: HCBS Waiver Expenditures, Delaware, FY 2005 - 2009
FY 2005 FY 2009 Change
HCBS Waiver Expenditures – ID/DD $53,603,630 $89,329,061 66.6%
Total HCBS Waiver Expenditures $70,734,741 $111,574,094 57.7%
ID/DD Waiver Expenditures as % of Total 75.8% 80.1%
The federal fiscal year is used in this table. Source: Medicaid HCBS Waiver Expenditures: FY 2004 through FY 2009. Thomson Reuters, 2010
The Division of Long-term Care Residents Protection reports that there are 147 licensed neighborhood homes for
people with ID/DD in Delaware, with a total of 600 beds. These homes are defined as five or fewer residents. The
vast majority of these beds, 417 (70%), are in New Castle County. The Arc of Delaware has 84 group homes
throughout the state that can house 332 individuals with ID/DD: 27 of these have subsidies from the HUD Section
811 program to reduce operating costs. In addition, United Cerebral Palsy has three houses with a capacity of 16.
In January 2012, DDDS reported supporting 554 beds in neighborhood homes for people with ID/DD.
Table 21: Licensed Group Homes and Beds for People with Developmental Disabilities, Delaware, 2011
New Castle Kent Sussex Total
Homes Beds Homes Beds Homes Beds Homes Beds
Developmental Disabilities
100 417 19 76 28 107 147 600
Source: DHSS, Division of Long-term Care Residents Protection
Nationally, there have been some programs supporting homeownership for people with ID/DD, to varying levels of
success. The ARC of Delaware supports 14 individuals who are homeowners, but report challenges with
maintenance, housekeeping, and the overall responsibility of homeownership. Homeownership for this population
is very much a niche product dependent upon the unique situation of each individual and their support systems.
Whether in homeownership or a rental unit, supportive services are essential for people living in the community,
particularly financial management and credit review.
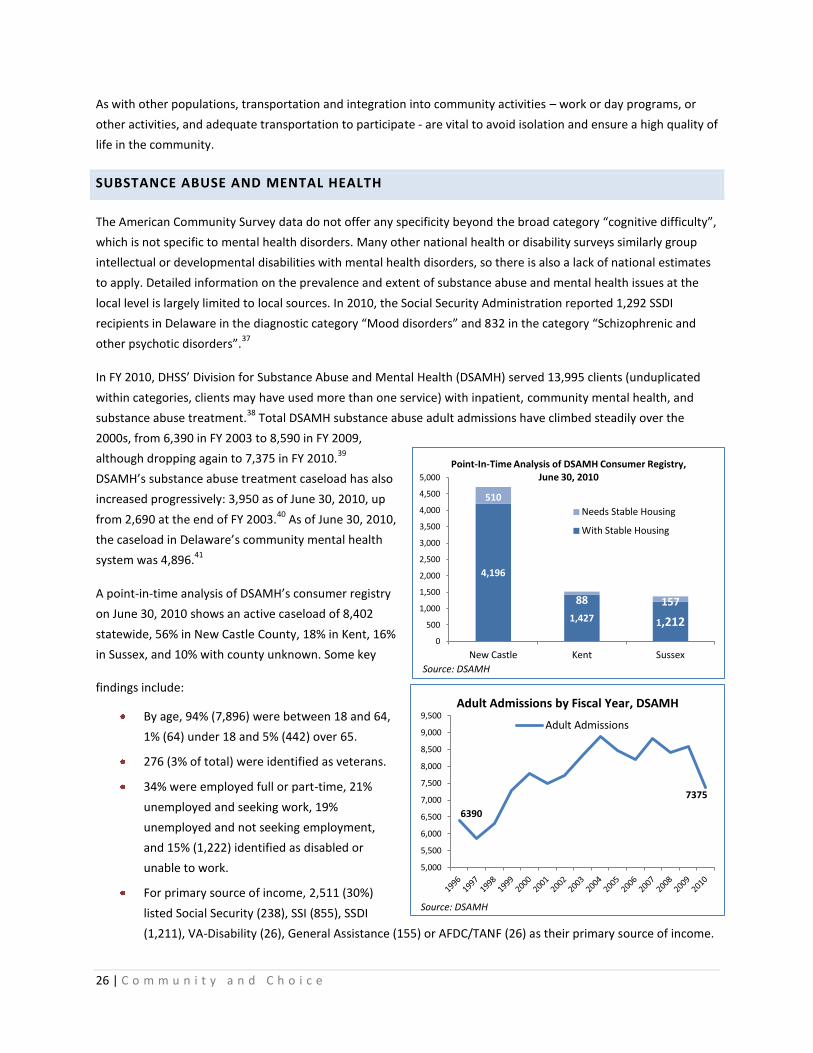
26 | C o m m u n i t y a n d C h o i c e
As with other populations, transportation and integration into community activities – work or day programs, or
other activities, and adequate transportation to participate - are vital to avoid isolation and ensure a high quality of
life in the community.
SUBSTANCE ABUSE AND MENTAL HEALTH
The American Community Survey data do not offer any specificity beyond the broad category “cognitive difficulty”,
which is not specific to mental health disorders. Many other national health or disability surveys similarly group
intellectual or developmental disabilities with mental health disorders, so there is also a lack of national estimates
to apply. Detailed information on the prevalence and extent of substance abuse and mental health issues at the
local level is largely limited to local sources. In 2010, the Social Security Administration reported 1,292 SSDI
recipients in Delaware in the diagnostic category “Mood disorders” and 832 in the category “Schizophrenic and
other psychotic disorders”.37
In FY 2010, DHSS’ Division for Substance Abuse and Mental Health (DSAMH) served 13,995 clients (unduplicated
within categories, clients may have used more than one service) with inpatient, community mental health, and
substance abuse treatment.38
Total DSAMH substance abuse adult admissions have climbed steadily over the
2000s, from 6,390 in FY 2003 to 8,590 in FY 2009,
although dropping again to 7,375 in FY 2010.39
DSAMH’s substance abuse treatment caseload has also
increased progressively: 3,950 as of June 30, 2010, up
from 2,690 at the end of FY 2003.40
As of June 30, 2010,
the caseload in Delaware’s community mental health
system was 4,896.41
A point-in-time analysis of DSAMH’s consumer registry
on June 30, 2010 shows an active caseload of 8,402
statewide, 56% in New Castle County, 18% in Kent, 16%
in Sussex, and 10% with county unknown. Some key
findings include:
By age, 94% (7,896) were between 18 and 64,
1% (64) under 18 and 5% (442) over 65.
276 (3% of total) were identified as veterans.
34% were employed full or part-time, 21%
unemployed and seeking work, 19%
unemployed and not seeking employment,
and 15% (1,222) identified as disabled or
unable to work.
For primary source of income, 2,511 (30%)
listed Social Security (238), SSI (855), SSDI
(1,211), VA-Disability (26), General Assistance (155) or AFDC/TANF (26) as their primary source of income.
4,196
1,427 1,212
510
88 157
0
500
1,000
1,500
2,000
2,500
3,000
3,500
4,000
4,500
5,000
New Castle Kent Sussex
Point-In-Time Analysis of DSAMH Consumer Registry, June 30, 2010
Needs Stable Housing
With Stable Housing
Source: DSAMH
6390
7375
5,000
5,500
6,000
6,500
7,000
7,500
8,000
8,500
9,000
9,500 Adult Admissions by Fiscal Year, DSAMH
Adult Admissions
Source: DSAMH
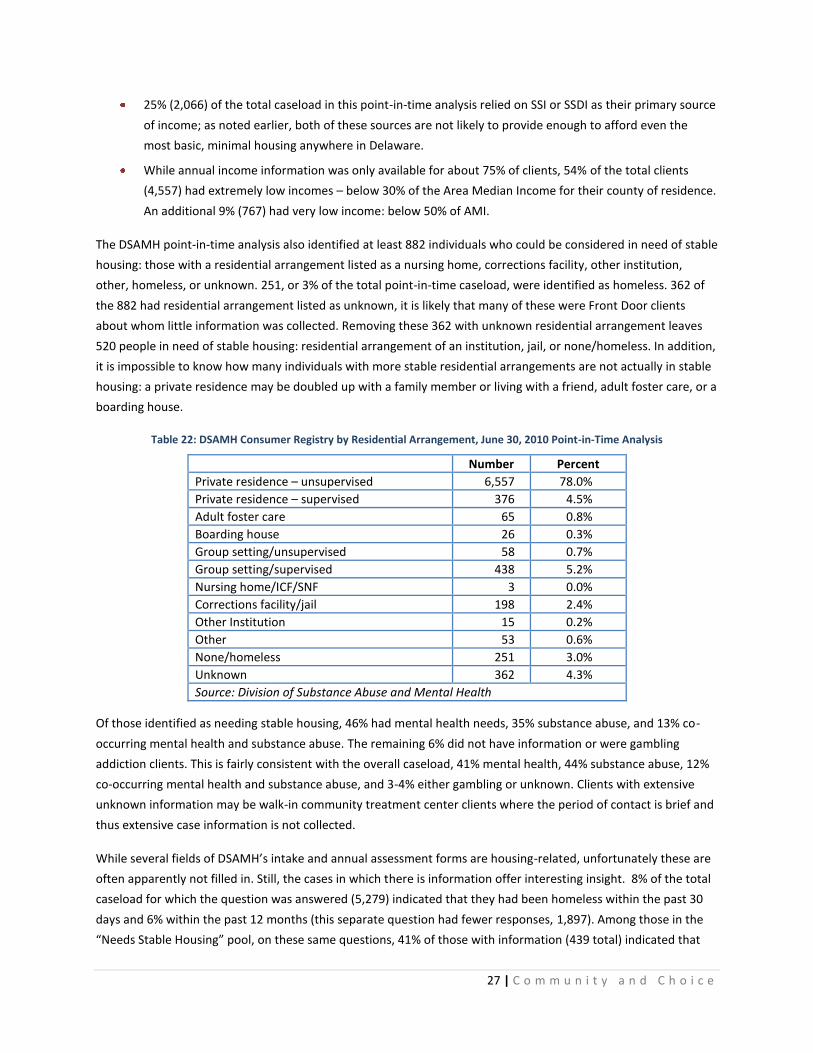
27 | C o m m u n i t y a n d C h o i c e
25% (2,066) of the total caseload in this point-in-time analysis relied on SSI or SSDI as their primary source
of income; as noted earlier, both of these sources are not likely to provide enough to afford even the
most basic, minimal housing anywhere in Delaware.
While annual income information was only available for about 75% of clients, 54% of the total clients
(4,557) had extremely low incomes – below 30% of the Area Median Income for their county of residence.
An additional 9% (767) had very low income: below 50% of AMI.
The DSAMH point-in-time analysis also identified at least 882 individuals who could be considered in need of stable
housing: those with a residential arrangement listed as a nursing home, corrections facility, other institution,
other, homeless, or unknown. 251, or 3% of the total point-in-time caseload, were identified as homeless. 362 of
the 882 had residential arrangement listed as unknown, it is likely that many of these were Front Door clients
about whom little information was collected. Removing these 362 with unknown residential arrangement leaves
520 people in need of stable housing: residential arrangement of an institution, jail, or none/homeless. In addition,
it is impossible to know how many individuals with more stable residential arrangements are not actually in stable
housing: a private residence may be doubled up with a family member or living with a friend, adult foster care, or a
boarding house.
Table 22: DSAMH Consumer Registry by Residential Arrangement, June 30, 2010 Point-in-Time Analysis
Number Percent
Private residence – unsupervised 6,557 78.0%
Private residence – supervised 376 4.5%
Adult foster care 65 0.8%
Boarding house 26 0.3%
Group setting/unsupervised 58 0.7%
Group setting/supervised 438 5.2%
Nursing home/ICF/SNF 3 0.0%
Corrections facility/jail 198 2.4%
Other Institution 15 0.2%
Other 53 0.6%
None/homeless 251 3.0%
Unknown 362 4.3%
Source: Division of Substance Abuse and Mental Health
Of those identified as needing stable housing, 46% had mental health needs, 35% substance abuse, and 13% co-
occurring mental health and substance abuse. The remaining 6% did not have information or were gambling
addiction clients. This is fairly consistent with the overall caseload, 41% mental health, 44% substance abuse, 12%
co-occurring mental health and substance abuse, and 3-4% either gambling or unknown. Clients with extensive
unknown information may be walk-in community treatment center clients where the period of contact is brief and
thus extensive case information is not collected.
While several fields of DSAMH’s intake and annual assessment forms are housing-related, unfortunately these are
often apparently not filled in. Still, the cases in which there is information offer interesting insight. 8% of the total
caseload for which the question was answered (5,279) indicated that they had been homeless within the past 30
days and 6% within the past 12 months (this separate question had fewer responses, 1,897). Among those in the
“Needs Stable Housing” pool, on these same questions, 41% of those with information (439 total) indicated that

28 | C o m m u n i t y a n d C h o i c e
they had been homeless within 30 days and 12% (91 total) within the past 12 months. Of the total caseload with
responses to the question “How many places has the client lived in the past 90 days?” (1,877), 9.5% had 2 or more
residential arrangements in the past 90 days. Of those for whom annual income information was available (284),
74% of those needing stable housing had income below 30% of the county Area Median Income.
Table 23: Individuals with Substance Abuse or Mental Health Conditions Identified as in Need of Stable Housing, DSAMH
Point-in-Time Analysis, June 30, 2010
Number
Needs stable housing 882
County
Kent 88
New Castle 510
Sussex 157
Unknown 127
Income
<30% of AMI 209
30 – 50% of AMI 8
>50% of AMI 67
Unknown 598
Modality
Mental health 406
Substance abuse 306
Co-occurring 116
Age
<18 47
18 – 64 789
65 or over 46
Homeless history Homeless w/in 30 days 180
Veteran status Veterans 30
Primary source of income
Social Security 11
SSI/SSDI 94
General Assistance 26
Family/friends 39
None 272
Note: Subheadings may not add up to total due to lack of data for some clients.
Source: Division of Substance Abuse and Mental Health
While the use of these data is hindered by the large number of “unknown” fields, the estimate of approximately
500 people with mental illness or substance abuse disorders in immediate need of affordable housing is our best
possible estimate from a direct source at the moment covering the entire population. Working to narrow this to
people with severe and persistent mental illness, we can look at discharge data from the Delaware Psychiatric
Center (DPC) and information on chronic homelessness. In calendar year 2010, 344 people were discharged from
DPC, an estimated 7% to homeless status (shelter or transitional housing, half of those discharged to transitional
housing were estimated to be transitioning to homeless status). In FY 2010, 648 unduplicated clients were served
at DPC: assuming 7% of clients in a given year would be homeless without housing support, 45 people would have
needed housing assistance in FY 2010. Combining these with rough estimates based on the 2011 Point-in-Time
Study, approximately 200 people with severe mental illness may need housing assistance over the course of a year,
and there is likely duplication across these estimates and across years. As of June, 2011, two of the larger nonprofit
service providers also had total waiting lists of 184 individuals (Connections: 112, NAMI-DE: 72).
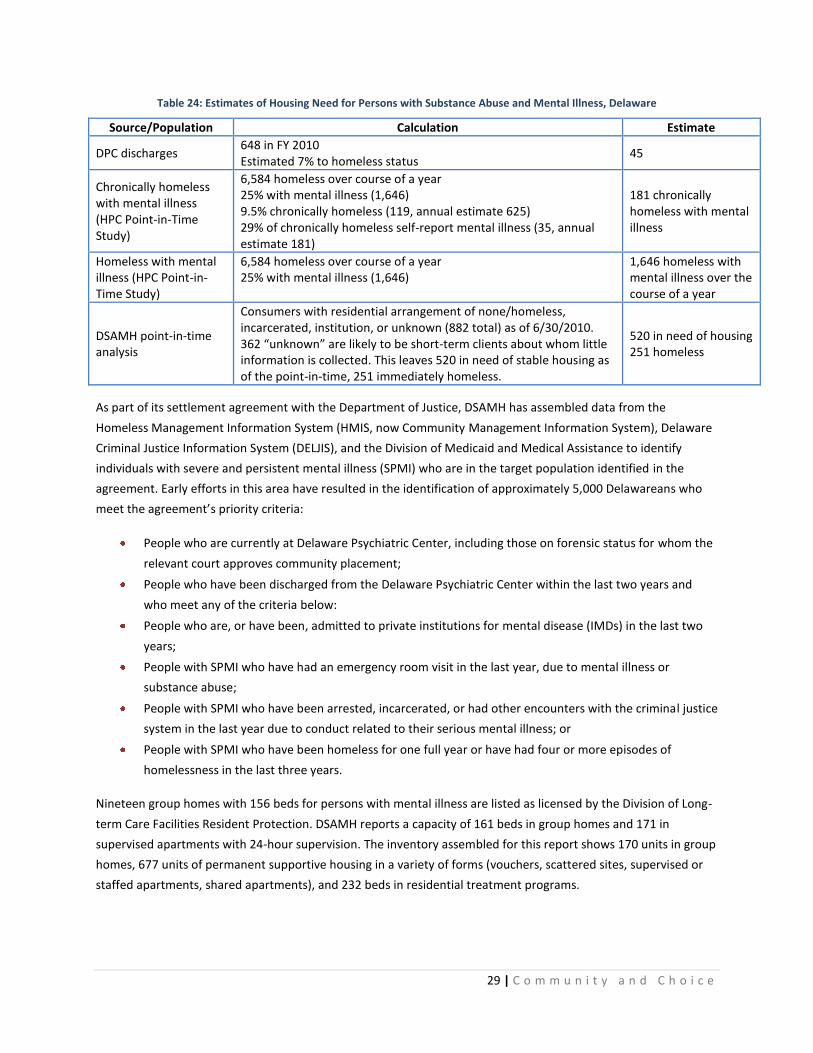
29 | C o m m u n i t y a n d C h o i c e
Table 24: Estimates of Housing Need for Persons with Substance Abuse and Mental Illness, Delaware
Source/Population Calculation Estimate
DPC discharges 648 in FY 2010 Estimated 7% to homeless status
45
Chronically homeless with mental illness (HPC Point-in-Time Study)
6,584 homeless over course of a year 25% with mental illness (1,646) 9.5% chronically homeless (119, annual estimate 625) 29% of chronically homeless self-report mental illness (35, annual estimate 181)
181 chronically homeless with mental illness
Homeless with mental illness (HPC Point-in-Time Study)
6,584 homeless over course of a year 25% with mental illness (1,646)
1,646 homeless with mental illness over the course of a year
DSAMH point-in-time analysis
Consumers with residential arrangement of none/homeless, incarcerated, institution, or unknown (882 total) as of 6/30/2010. 362 “unknown” are likely to be short-term clients about whom little information is collected. This leaves 520 in need of stable housing as of the point-in-time, 251 immediately homeless.
520 in need of housing 251 homeless
As part of its settlement agreement with the Department of Justice, DSAMH has assembled data from the
Homeless Management Information System (HMIS, now Community Management Information System), Delaware
Criminal Justice Information System (DELJIS), and the Division of Medicaid and Medical Assistance to identify
individuals with severe and persistent mental illness (SPMI) who are in the target population identified in the
agreement. Early efforts in this area have resulted in the identification of approximately 5,000 Delawareans who
meet the agreement’s priority criteria:
People who are currently at Delaware Psychiatric Center, including those on forensic status for whom the
relevant court approves community placement;
People who have been discharged from the Delaware Psychiatric Center within the last two years and
who meet any of the criteria below:
People who are, or have been, admitted to private institutions for mental disease (IMDs) in the last two
years;
People with SPMI who have had an emergency room visit in the last year, due to mental illness or
substance abuse;
People with SPMI who have been arrested, incarcerated, or had other encounters with the criminal justice
system in the last year due to conduct related to their serious mental illness; or
People with SPMI who have been homeless for one full year or have had four or more episodes of
homelessness in the last three years.
Nineteen group homes with 156 beds for persons with mental illness are listed as licensed by the Division of Long-
term Care Facilities Resident Protection. DSAMH reports a capacity of 161 beds in group homes and 171 in
supervised apartments with 24-hour supervision. The inventory assembled for this report shows 170 units in group
homes, 677 units of permanent supportive housing in a variety of forms (vouchers, scattered sites, supervised or
staffed apartments, shared apartments), and 232 beds in residential treatment programs.
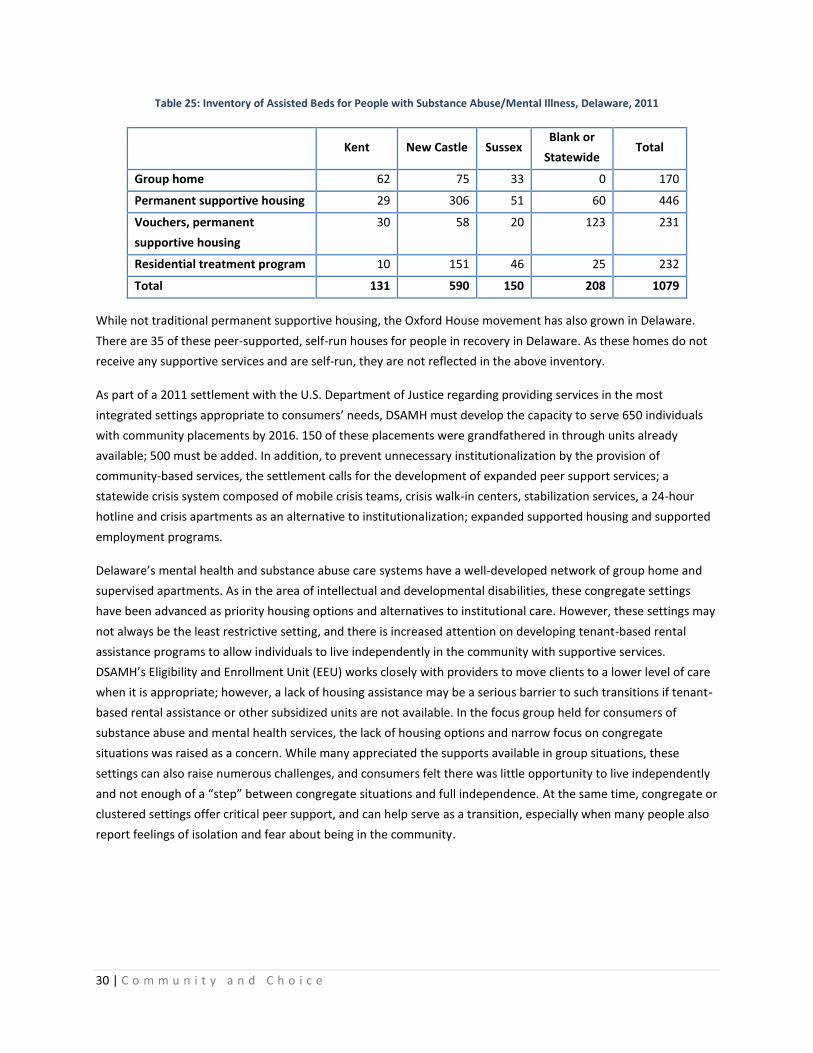
30 | C o m m u n i t y a n d C h o i c e
Table 25: Inventory of Assisted Beds for People with Substance Abuse/Mental Illness, Delaware, 2011
Kent New Castle Sussex Blank or
Statewide Total
Group home 62 75 33 0 170
Permanent supportive housing 29 306 51 60 446
Vouchers, permanent
supportive housing
30 58 20 123 231
Residential treatment program 10 151 46 25 232
Total 131 590 150 208 1079
While not traditional permanent supportive housing, the Oxford House movement has also grown in Delaware.
There are 35 of these peer-supported, self-run houses for people in recovery in Delaware. As these homes do not
receive any supportive services and are self-run, they are not reflected in the above inventory.
As part of a 2011 settlement with the U.S. Department of Justice regarding providing services in the most
integrated settings appropriate to consumers’ needs, DSAMH must develop the capacity to serve 650 individuals
with community placements by 2016. 150 of these placements were grandfathered in through units already
available; 500 must be added. In addition, to prevent unnecessary institutionalization by the provision of
community-based services, the settlement calls for the development of expanded peer support services; a
statewide crisis system composed of mobile crisis teams, crisis walk-in centers, stabilization services, a 24-hour
hotline and crisis apartments as an alternative to institutionalization; expanded supported housing and supported
employment programs.
Delaware’s mental health and substance abuse care systems have a well-developed network of group home and
supervised apartments. As in the area of intellectual and developmental disabilities, these congregate settings
have been advanced as priority housing options and alternatives to institutional care. However, these settings may
not always be the least restrictive setting, and there is increased attention on developing tenant-based rental
assistance programs to allow individuals to live independently in the community with supportive services.
DSAMH’s Eligibility and Enrollment Unit (EEU) works closely with providers to move clients to a lower level of care
when it is appropriate; however, a lack of housing assistance may be a serious barrier to such transitions if tenant-
based rental assistance or other subsidized units are not available. In the focus group held for consumers of
substance abuse and mental health services, the lack of housing options and narrow focus on congregate
situations was raised as a concern. While many appreciated the supports available in group situations, these
settings can also raise numerous challenges, and consumers felt there was little opportunity to live independently
and not enough of a “step” between congregate situations and full independence. At the same time, congregate or
clustered settings offer critical peer support, and can help serve as a transition, especially when many people also
report feelings of isolation and fear about being in the community.
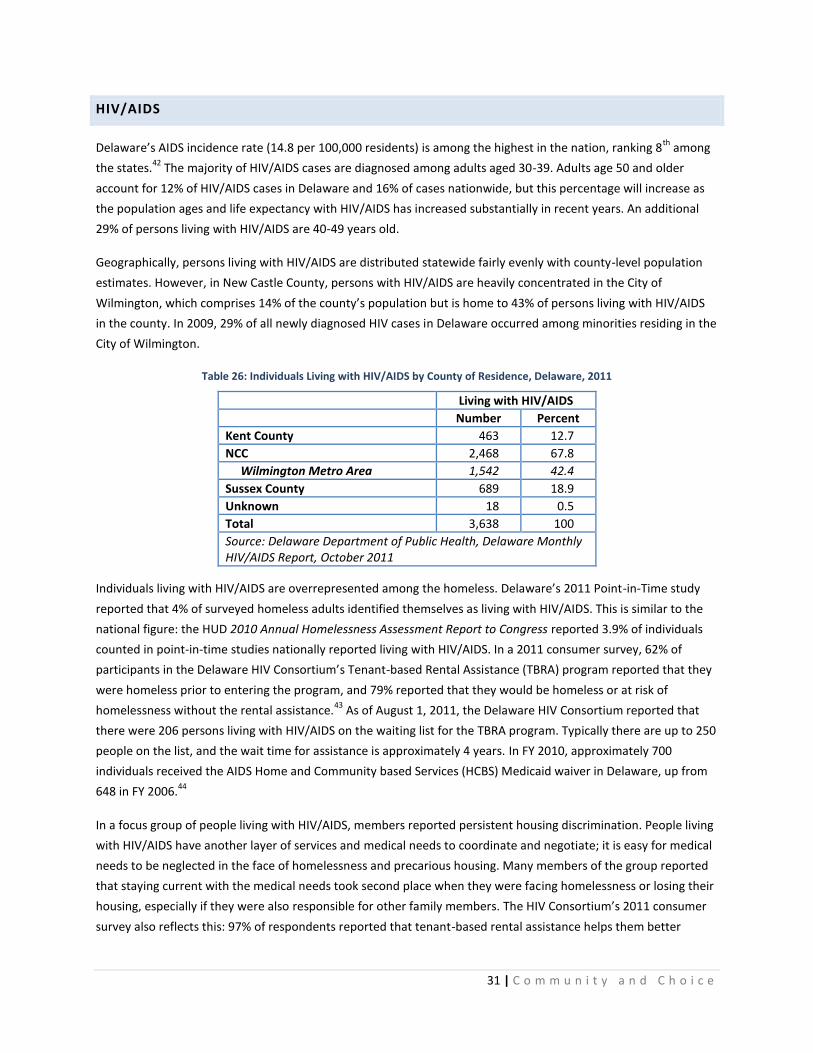
31 | C o m m u n i t y a n d C h o i c e
HIV/AIDS
Delaware’s AIDS incidence rate (14.8 per 100,000 residents) is among the highest in the nation, ranking 8th
among
the states.42
The majority of HIV/AIDS cases are diagnosed among adults aged 30-39. Adults age 50 and older
account for 12% of HIV/AIDS cases in Delaware and 16% of cases nationwide, but this percentage will increase as
the population ages and life expectancy with HIV/AIDS has increased substantially in recent years. An additional
29% of persons living with HIV/AIDS are 40-49 years old.
Geographically, persons living with HIV/AIDS are distributed statewide fairly evenly with county-level population
estimates. However, in New Castle County, persons with HIV/AIDS are heavily concentrated in the City of
Wilmington, which comprises 14% of the county’s population but is home to 43% of persons living with HIV/AIDS
in the county. In 2009, 29% of all newly diagnosed HIV cases in Delaware occurred among minorities residing in the
City of Wilmington.
Table 26: Individuals Living with HIV/AIDS by County of Residence, Delaware, 2011
Living with HIV/AIDS
Number Percent
Kent County 463 12.7
NCC 2,468 67.8
Wilmington Metro Area 1,542 42.4
Sussex County 689 18.9
Unknown 18 0.5
Total 3,638 100
Source: Delaware Department of Public Health, Delaware Monthly HIV/AIDS Report, October 2011
Individuals living with HIV/AIDS are overrepresented among the homeless. Delaware’s 2011 Point-in-Time study
reported that 4% of surveyed homeless adults identified themselves as living with HIV/AIDS. This is similar to the
national figure: the HUD 2010 Annual Homelessness Assessment Report to Congress reported 3.9% of individuals
counted in point-in-time studies nationally reported living with HIV/AIDS. In a 2011 consumer survey, 62% of
participants in the Delaware HIV Consortium’s Tenant-based Rental Assistance (TBRA) program reported that they
were homeless prior to entering the program, and 79% reported that they would be homeless or at risk of
homelessness without the rental assistance.43
As of August 1, 2011, the Delaware HIV Consortium reported that
there were 206 persons living with HIV/AIDS on the waiting list for the TBRA program. Typically there are up to 250
people on the list, and the wait time for assistance is approximately 4 years. In FY 2010, approximately 700
individuals received the AIDS Home and Community based Services (HCBS) Medicaid waiver in Delaware, up from
648 in FY 2006.44
In a focus group of people living with HIV/AIDS, members reported persistent housing discrimination. People living
with HIV/AIDS have another layer of services and medical needs to coordinate and negotiate; it is easy for medical
needs to be neglected in the face of homelessness and precarious housing. Many members of the group reported
that staying current with the medical needs took second place when they were facing homelessness or losing their
housing, especially if they were also responsible for other family members. The HIV Consortium’s 2011 consumer
survey also reflects this: 97% of respondents reported that tenant-based rental assistance helps them better

32 | C o m m u n i t y a n d C h o i c e
manage their health, and 98% reported having had recent contact with a case manager and utilizing Ryan White
funded services.
In 2006, an extensive consumer survey was conducted by the Delaware HIV Consortium’s Planning Council. 280
people living with HIV/AIDS were interviewed on their service needs and access. 24% of those interviewed
reported service access issues related to affordable housing, with service access issues defined as either “used but
still has unmet need” or “needed but couldn’t get”.45
30% reported that they lived with family when they preferred
not to, in facilities, or on the streets – all situations in which an individual needs housing. 18% reported being
homeless at least one night in the past 12 months.
In addition to specific housing needs, the consumer survey also reflected widespread needs in other basic areas,
like dental care (35%), medications (20%), transportation (20%) and food (19%). 42% of those interviewed were
unemployed and unable to work; 26% were able to work but still unemployed. Most tellingly, 64% had income
below the federal poverty level. The top 5 supportive services identified by consumers as needed priorities were:
HIV case management
Help paying for household bills
Transportation to medical appointments
Help finding affordable housing; and
Food programs.
Delaware’s stock of permanent supportive housing includes 34 units for people living with HIV/AIDS, all in New
Castle County. The Delaware HIV Consortium’s statewide tenant-based rental assistance (TBRA) program typically
serves about 125 households at a time, approximately 150 over the course of a year. About 70% of households
live in New Castle County, the remaining 30% split between Kent and Sussex Counties.
SENSORY DISABILITIES
The 2008-2010 American Community Survey estimated 29,720 individuals in Delaware had a hearing difficulty and
20,172 had a vision difficulty. Both were much more common among persons 65 and older: 13.8% of the
population 65 and over reported hearing difficulty and 6.9% reported vision difficulty, compared to 2.1% and 1.9%,
respectively, for persons 18-64 years old. The ACS estimates for Delaware and the United States are similar.
Table 27: Percent of Population With Sensory Disabilities, U.S. and Delaware, 2008-2010
Under 18 18 – 64
65 and over
Total
Hearing Difficulty
United States 0.6% 2.1% 15.4% 3.4%
Delaware 0.8% 2.1% 13.8% 3.4%
Delaware – Number 1,558 11,268 16,894 29,720
Vision Difficulty
United States 0.7% 1.8% 7.2% 2.2%
Delaware 0.7% 1.9% 6.9% 2.3%
Delaware - Number 1,370 10,398 8,404 20,172
Source: U.S. Census Bureau, 2008-2010 American Community Survey
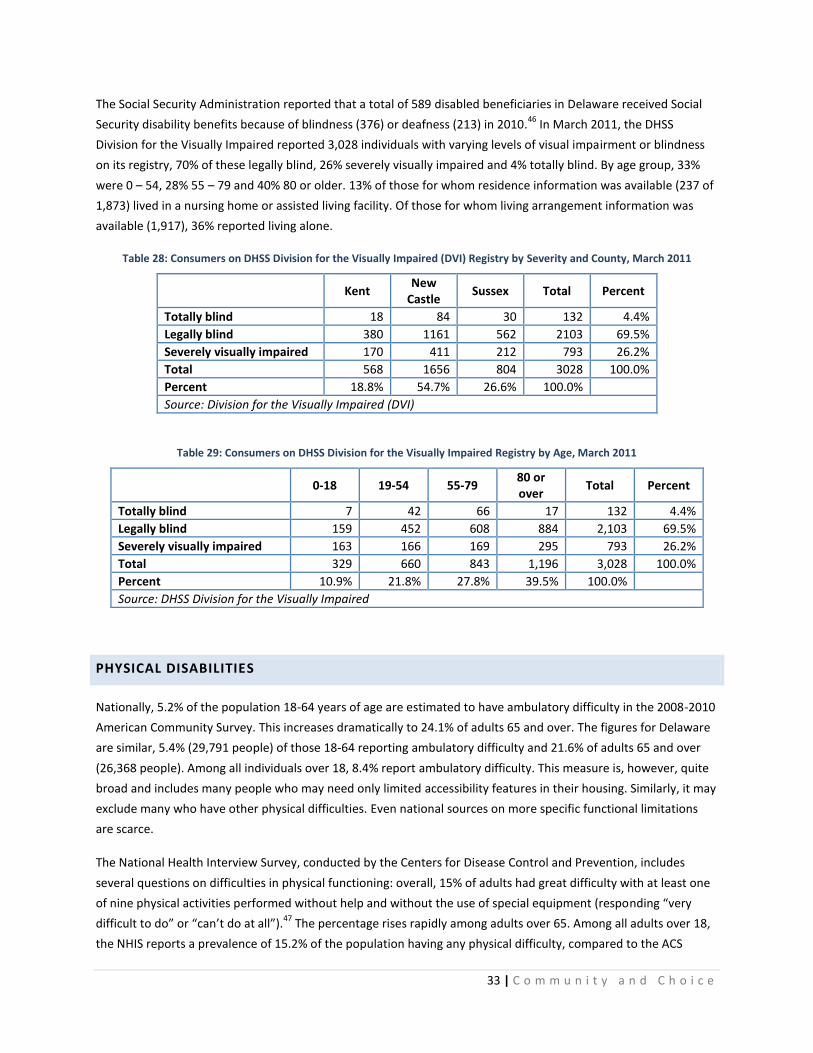
33 | C o m m u n i t y a n d C h o i c e
The Social Security Administration reported that a total of 589 disabled beneficiaries in Delaware received Social
Security disability benefits because of blindness (376) or deafness (213) in 2010.46
In March 2011, the DHSS
Division for the Visually Impaired reported 3,028 individuals with varying levels of visual impairment or blindness
on its registry, 70% of these legally blind, 26% severely visually impaired and 4% totally blind. By age group, 33%
were 0 – 54, 28% 55 – 79 and 40% 80 or older. 13% of those for whom residence information was available (237 of
1,873) lived in a nursing home or assisted living facility. Of those for whom living arrangement information was
available (1,917), 36% reported living alone.
Table 28: Consumers on DHSS Division for the Visually Impaired (DVI) Registry by Severity and County, March 2011
Kent
New Castle
Sussex Total Percent
Totally blind 18 84 30 132 4.4%
Legally blind 380 1161 562 2103 69.5%
Severely visually impaired 170 411 212 793 26.2%
Total 568 1656 804 3028 100.0%
Percent 18.8% 54.7% 26.6% 100.0%
Source: Division for the Visually Impaired (DVI)
Table 29: Consumers on DHSS Division for the Visually Impaired Registry by Age, March 2011
0-18 19-54 55-79
80 or over
Total Percent
Totally blind 7 42 66 17 132 4.4%
Legally blind 159 452 608 884 2,103 69.5%
Severely visually impaired 163 166 169 295 793 26.2%
Total 329 660 843 1,196 3,028 100.0%
Percent 10.9% 21.8% 27.8% 39.5% 100.0%
Source: DHSS Division for the Visually Impaired
PHYSICAL DISABILITIES
Nationally, 5.2% of the population 18-64 years of age are estimated to have ambulatory difficulty in the 2008-2010
American Community Survey. This increases dramatically to 24.1% of adults 65 and over. The figures for Delaware
are similar, 5.4% (29,791 people) of those 18-64 reporting ambulatory difficulty and 21.6% of adults 65 and over
(26,368 people). Among all individuals over 18, 8.4% report ambulatory difficulty. This measure is, however, quite
broad and includes many people who may need only limited accessibility features in their housing. Similarly, it may
exclude many who have other physical difficulties. Even national sources on more specific functional limitations
are scarce.
The National Health Interview Survey, conducted by the Centers for Disease Control and Prevention, includes
several questions on difficulties in physical functioning: overall, 15% of adults had great difficulty with at least one
of nine physical activities performed without help and without the use of special equipment (responding “very
difficult to do” or “can’t do at all”).47
The percentage rises rapidly among adults over 65. Among all adults over 18,
the NHIS reports a prevalence of 15.2% of the population having any physical difficulty, compared to the ACS
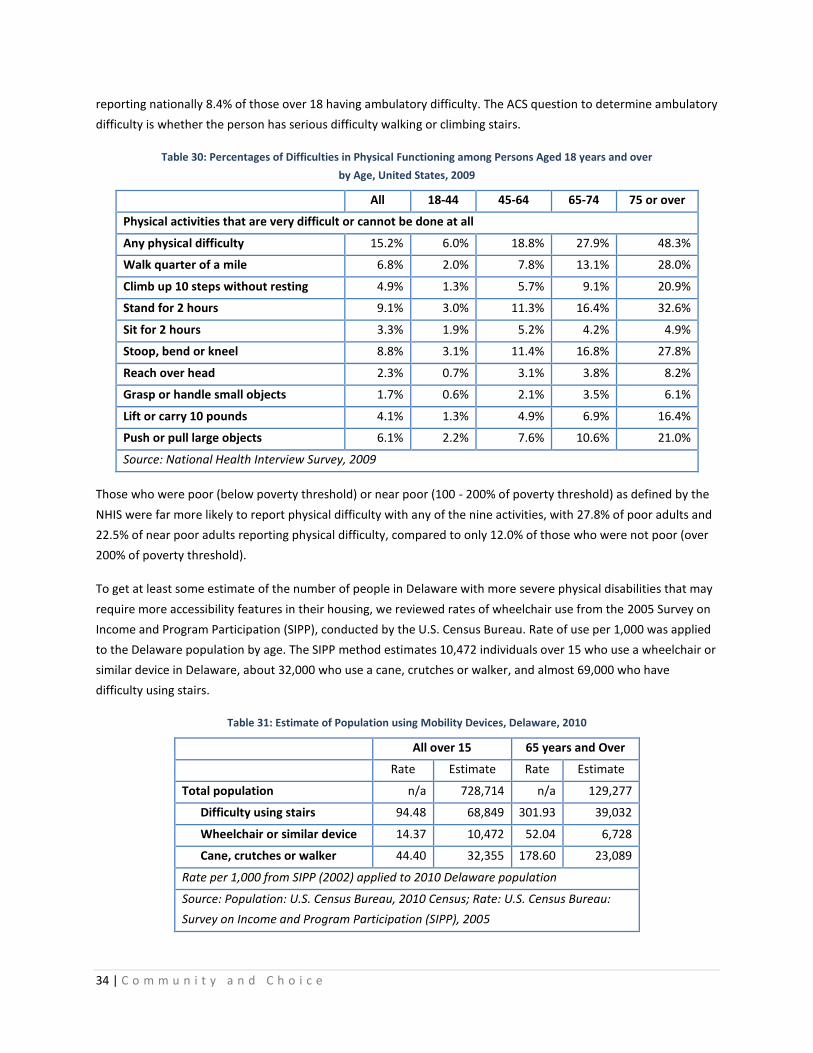
34 | C o m m u n i t y a n d C h o i c e
reporting nationally 8.4% of those over 18 having ambulatory difficulty. The ACS question to determine ambulatory
difficulty is whether the person has serious difficulty walking or climbing stairs.
Table 30: Percentages of Difficulties in Physical Functioning among Persons Aged 18 years and over
by Age, United States, 2009
All 18-44 45-64 65-74 75 or over
Physical activities that are very difficult or cannot be done at all
Any physical difficulty 15.2% 6.0% 18.8% 27.9% 48.3%
Walk quarter of a mile 6.8% 2.0% 7.8% 13.1% 28.0%
Climb up 10 steps without resting 4.9% 1.3% 5.7% 9.1% 20.9%
Stand for 2 hours 9.1% 3.0% 11.3% 16.4% 32.6%
Sit for 2 hours 3.3% 1.9% 5.2% 4.2% 4.9%
Stoop, bend or kneel 8.8% 3.1% 11.4% 16.8% 27.8%
Reach over head 2.3% 0.7% 3.1% 3.8% 8.2%
Grasp or handle small objects 1.7% 0.6% 2.1% 3.5% 6.1%
Lift or carry 10 pounds 4.1% 1.3% 4.9% 6.9% 16.4%
Push or pull large objects 6.1% 2.2% 7.6% 10.6% 21.0%
Source: National Health Interview Survey, 2009
Those who were poor (below poverty threshold) or near poor (100 - 200% of poverty threshold) as defined by the
NHIS were far more likely to report physical difficulty with any of the nine activities, with 27.8% of poor adults and
22.5% of near poor adults reporting physical difficulty, compared to only 12.0% of those who were not poor (over
200% of poverty threshold).
To get at least some estimate of the number of people in Delaware with more severe physical disabilities that may
require more accessibility features in their housing, we reviewed rates of wheelchair use from the 2005 Survey on
Income and Program Participation (SIPP), conducted by the U.S. Census Bureau. Rate of use per 1,000 was applied
to the Delaware population by age. The SIPP method estimates 10,472 individuals over 15 who use a wheelchair or
similar device in Delaware, about 32,000 who use a cane, crutches or walker, and almost 69,000 who have
difficulty using stairs.
Table 31: Estimate of Population using Mobility Devices, Delaware, 2010
All over 15 65 years and Over
Rate Estimate Rate Estimate
Total population n/a 728,714 n/a 129,277
Difficulty using stairs 94.48 68,849 301.93 39,032
Wheelchair or similar device 14.37 10,472 52.04 6,728
Cane, crutches or walker 44.40 32,355 178.60 23,089
Rate per 1,000 from SIPP (2002) applied to 2010 Delaware population
Source: Population: U.S. Census Bureau, 2010 Census; Rate: U.S. Census Bureau:
Survey on Income and Program Participation (SIPP), 2005

35 | C o m m u n i t y a n d C h o i c e
At every level of need, physical accessibility both in the home and public spaces is a major challenge for persons
with physical disabilities, and is sorely lacking in both the general and assisted housing stock, even for those who
may need only some accessibility features (such as a no-step entry). Focus groups and interviews all made this
point repeatedly: even in the other focus groups not specific to physical disability, the need for basic accessibility
across all types of housing was mentioned.
Using the 2005-2007 American Community Survey, HUD’s CHAS data provides some estimates of persons with a
mobility or self-care disability with housing problems at the state level by income.48
In this data, a housing problem
is defined as cost-burden, inadequate plumbing or kitchen facilities, or overcrowding. The vast majority of
households with a housing problem are cost-burdened. By these estimates, there were 4,550 renter and 6,155
owner households with income below 50% of median and at least one member with a mobility or self-care
disability, with close to 6,500 total having a housing problem. As this is a sample survey looking at a small
subpopulation, these numbers should be approached with caution, but the trend is clear: lower income
households, both homeowners and renters, who have at least one member with a mobility or self-care disability
are very likely to have a housing problem. 72% of renter households and 75% of owner households with extremely
low incomes and a mobility or self-care disability had a housing problem.
Table 32: Households with Mobility or Self-Care Disabilities with Housing Problems, Delaware, 2005-2007
Total
households
Households w/at least one member with a mobility or self-care disability
Percent of Households
Households w/at least one member with a mobility or self-care disability and a housing
problem
Percent of all households with
a mobility or self-care
disability that have a housing
problem
Renter households
Total renter households
85,100 8,155 9.6 4,000 49.0
<30% AMI 19,470 3,125 16.1 2,260 72.3
30-50% AMI 15,140 1,425 9.4 975 68.4
50-80% AMI 18,850 1,580 8.4 490 31.0
>80% AMI 31,640 2,025 6.4 275 13.6
Owner households
Total owner households
236,645 22,855 9.7 6,900 30.2
<30% AMI 13,625 1,935 14.2 1,445 74.7
30-50% AMI 21,090 4,220 20.0 1,780 42.2
50-80% AMI 35,685 4,785 13.4 1,765 36.9
>80% AMI 166,245 11,915 7.2 1,910 16.0
Source: HUD 2005-2007 CHAS Data
The Division of Aging and Adults with Physical Disabilities estimates a need for housing assistance for
approximately 650 people: a mix of current residents in private and state-run long-term care facilities to transition
to the community referrals from Adult Protective Services and the Aging and Disability Resource Center. The
majority of these are likely people with physical disabilities and/or who need assistance with ADLs or IADLs to live
36 | C o m m u n i t y a n d C h o i c e
independently. Most would need accessible units in addition to supportive services. More specifically, the estimate
of 650 includes:
300 (Diversions and transitions from LTC facilities from FY 13 - 17)
100 (Transitions from DHSS LTC Facilities)
250 (Other referrals from APS, ADRC, and other sources from FY 13-17)
The lack of information about housing accessibility was also frequently mentioned in the focus groups, for both
assisted and market-rate housing. While most multifamily sites have some fully accessible units, these units may
often be occupied by persons who do not have a disability. People with a disability have a right to displace a non-
disabled tenant to another non-accessible unit in order for them to occupy the accessible one; however, they may
not be aware of this right. In addition, many units have some but not full accessibility, so thus are not subject to
that requirement and the accessibility features may not be tracked or documented anywhere. In addition, a
significant percentage of the rental housing in Delaware, as in the nation as a whole, is not in multifamily sites but
single-family dwellings, which are even less likely to have basic accessibility features (no step entry, clear passage).
A central source of information about detailed accessibility features in rental housing, both assisted and market-
rate, including current vacancy information, was often noted as a need.
YOUTH AGING OUT OF FOSTER CARE
As of December 31, 2010, there were 670 children in foster care in Delaware, down from 875 at the end of 2008
and 684 in 2009. By age group, 29% (196) were 5 years old or younger, 19% (127) 6-10 years, 25% (168) 11-15
years, and 27% (179) 16 or older. As of March 2011, DSCYF reported 211 youth aged 17 or over, with an average
of 180 days left until they turn 18. Of these 211, 102 were 17.5 or older and thus aging out within the next six
months from the date of report. At that time, there were also 97 youth aged 15 and 137 youth aged 16 currently in
foster care, suggesting that the recent total of about 100 youth aging out every year is likely to continue for at
least the next couple of years.
Youth in and aging out of foster care face immense challenges in the transition to independent living and,
unfortunately, are at high risk of homelessness, substance abuse and mental health issues. Among those 18-24
years old currently participating in an Independent Living Program with the DSCYF, only 30% had graduated high
school, and the unemployment rate for this group is 66 percent. 10% of individuals surveyed in the January 2011
Point-in-Time Study of homelessness in Delaware reported that they had some history with the foster care system;
11.7% of the 2,428 individuals who had contact with service providers reporting into the Homeless Information
Management System (HMIS) in calendar year 2010 reported that they had ever been in the foster care system.
The inventory of housing assistance for transitioning youth has grown substantially in the past several years. West
End Neighborhood House’s Life Lines program has 22 beds for transitioning youth, the 801 shelter in Dover has an
additional 6. The Murphey School, also in Dover, also offers extensions for youth aged 16-18 who are within one
year of high school graduation. The largest source of housing assistance for this population will likely be the new
State Rental Assistance Program (SRAP), which in its first year (FY 2012) anticipates serving 40-50 transitioning
youth with housing vouchers.
37 | C o m m u n i t y a n d C h o i c e
Over a five year period, assuming:
approximately 100 youth age out per year, 75 needing housing assistance;
current capacity to serve approximately 75 via SRAP and Life Lines; and
youth can remain in Independent Living programs and receive housing assistance until they are 24,
Approximately 300 units are likely needed to serve this population if the current rate of about 100 youth per year
aging out continues.
PRIORITIZING HOUSING CHOICE AND COMMUNITY CARE
Four main factors call for improving access to community-based services and supports. First, people over 60 years
of age will continue to grow as a percent of the overall population, which will lead to significant increases in
demand for long term care and supportive services. The aging of the baby boomer generation and extensive in-
migration of older households to retire in southern Delaware means that in 2010, 20.5% of the population in
Delaware was over 60 years of age; by 2040, this is projected to increase to 30.5%. Older individuals, especially
those over 75, are far more likely to need long-term services and supports.
Secondly, this aging population and increased demand for long-term services may herald financial crisis for public
programs that are already overextended: the vast majority of long-term care services are paid for with public
programs. Over decades, these systems have developed in ways that assume institutional care over supports to
serve people in their homes. The median annual cost of a private room in a nursing home in Delaware is $89,060;
30 hours a week of home care may cost $32,760.49
In 2009, Delaware ranked 50th
among the states on the percent
of Medicaid spending for older people and adults with physical disabilities going to Home and Community based
Services (HCBS), at 13.2%.50
Nationally, 36% of spending for these populations was directed to HCBS. Even if
housing assistance is also required, serving people in their homes and communities can be considerably less
expensive than facility-based care. Delaware recognizes that this dichotomy must change and the State must
develop more community-based alternatives for Medicaid long-term services and supports in lieu of institutional
care.
In addition, numerous surveys, both national and local, reflect people’s desire to remain in their communities as
long as possible. People want services to support them in their homes and to remain in their homes as long as
possible. Further, many measures of quality of life are far improved when high-quality services are delivered in
peoples’ homes and communities rather than institutional settings.
Finally, systems not only should be built around community-based care and the assumption that people canlive in
the community with appropriate supports, they must prioritize care in the community. In 1999, the U.S. Supreme
Court rejected the state of Georgia’s appeal to enforce institutionalization of individuals with disabilities in a 6-3
ruling in the case Olmstead v. L.C. While the process of deinstitutionalization was in progress in many states, this
ruling brought attention to the sometimes slow pace, significant number of individuals still in institutions
nationwide, and ongoing preference for institutional settings for persons with disabilities who could live in less
restrictive settings. The 'integration mandate' of the Americans with Disabilities Act requires public agencies to
38 | C o m m u n i t y a n d C h o i c e
provide services "in the most integrated setting
appropriate to the needs of qualified individuals with
disabilities." The Olmstead case upheld the ADA’s
integration mandate, and thus, like the ADA, applies
to all qualified disabilities.
As background on the Olmstead decision and its
implications, one type of discrimination forbidden by
the Americans with Disabilities Act (ADA) is the
needless segregation of people with disabilities. It
requires state and local governments to “administer
services, programs, and activities in the most
integrated setting appropriate to the needs of
qualified individuals with disabilities.” (28 C.F.R. §
35.130(d)). Referred to as the ADA’s “integration
mandate”, this means that publicly funded programs
for people with disabilities thus must deliver services
in ways that do not discriminate, such as by
needlessly keeping people with disabilities away
from the mainstream of their communities. People
must be able to receive services in the most
integrated setting possible considering their needs:
the “most integrated setting” is one that “enables
individuals with disabilities to interact with non-
disabled persons to the fullest extent possible.”
While group homes and other congregate settings
may not be institutions, the day-to-day routines,
rules and systems of these programs may result in
segregation. Supportive housing – integrated
throughout the community, with the option for
people to live independently while still receiving the
support they need – is usually a far more integrated
setting and an option that is currently limited on the
continuum of housing for people with disabilities in
Delaware. While congregate and clustered settings in
the community, with the benefits they offer of peer
support and sense of community, should remain an
option for those who prefer them, we need to
similarly ensure there are independent settings
available as well.
Settlement Agreement between State of
Delaware and U.S. Department of Justice
While this report reviews needs and provides
general recommendations for people with
disabilities in Delaware, people with serious
mental health conditions are at the center of a
recent Settlement Agreement between the United
States Department of Justice (USDOJ) and State of
Delaware, signed on July 15, 2011. This Settlement
Agreement is the result of an extensive
investigation by the USDOJ which resulted in
multiple findings and subsequent negotiations to
revise Delaware’s service delivery system for
people with serious and persistent mental illness
(SPMI).
The USDOJ findings were based on the federal
Americans with Disabilities Act and Olmstead legal
decisions and the Agreement mandates that the
State meet both of these federal standards.
Specifically on the subject of housing, the State is
required to identify 650 newly funded and
integrated housing units over the next four years.
The Agreement’s Implementation Timeline (p. 13)
states:
E. Supported Housing
1. By July 11, 2011, the State will provide
housing vouchers or subsidies and bridge
funding to 150 individuals. Pursuant to Part
II.E.2.d, this housing shall be exempt from the
scattered-site requirement.
2. By July 1, 2012 the State will provide housing
vouchers or subsidies and bridge funding to a
total of 250 individuals.
3. By July 1, 2013 the State will provide housing
vouchers or subsidies and bridge funding to a
total of 450 individuals.
4. By July 1, 2014 the State will provide housing
vouchers or subsidies and bridge funding to a
total of 550 individuals.
5. By July 1, 2015 the State will provide housing
vouchers or subsidies and bridge funding to a
total of 650 individuals.

39 | C o m m u n i t y a n d C h o i c e
PRIORITIZING COMMUNITY CARE IN DELAWARE
In recent years, DHSS and its divisions have been working steadily to reduce institutional bias and the number of
beds and individuals in state-run facilities. The Delaware Psychiatric Center (DPC) and mental health and substance
abuse care systems have been particularly in focus. Since FY 2003, the average daily census at the DPC has reduced
from 240 to 183 in FY 2010. In July 2011, DHSS announced a five-year strategy to expand community services,
housing, supported employment opportunities and a statewide crisis team, agreed upon with the U.S. Department
of Justice at the conclusion of their three year investigation into conditions in the DPC. As part of this agreement,
the population at the DPC must be further reduced to 125. In fall 2011, DSAMH was developing an RFP to facilitate
the discharge of individuals who have been institutionalized, most for more than five years. A contracted service
provider will provide full services for these consumers, everything excluding significant physical health care
emergencies: housing, preventative health care, and any periodic in-patient services.
DHSS initiatives to prioritize
community care and transition
people living in institutions to the
community have resulted in
significant declines in the number of
people in state-supported
institutions. Since 1996, the average
daily census for all DHSS long-term
care facilities (Governor Bacon
Health Center, Delaware Hospital for
the Chronically Ill, and the Emily P.
Bissell Hospital), excluding the
Delaware Psychiatric Center and
Stockley Center, fell from 520 to 380
in 2011, close to 30%. Over that same time period, the average daily census at the DPC fell from 337 to 162 (-52%)
and at the Stockley Center, from 303 to 68 (-78%).
From FY 2012 – 2014, DHSS intends to further reduce the number of beds in public long-term care facilities by 114
beds spread across three facilities, with the primary reduction at the Delaware Hospital for the Chronically Ill. In
total, 92 residents will be impacted, with the majority being moved between buildings as wings or buildings are
closed. 18 will be transitioned into homes in the community with appropriate support.
Other initiatives linked to prioritizing community care in mental health services include the expansion of peer
specialist programs and a partnership between DSAMH’s Mobile Crisis service and local hospitals. In this
partnership, Mobile Crisis was granted access to their Emergency Departments to evaluate consumers with
psychiatric and substance abuse crises. The important first contact helps to reduce the number of involuntary
commitments and create immediate links to community behavioral health services. As of fall 2011, DHSS reports
being on target for all milestones for the first year of the settlement agreement with the Department of Justice.
Total DSAAPD 380
DPC
162
Stockley 68
0
100
200
300
400
500
600
1996 1997 1998 1999 2000 2001 2002 2003 2004 2005 2006 2007 2008 2009 2010 2011
Average Daily Census in DHSS Institutions 1996-2011
Source: Delaware Department of Health and Social Services
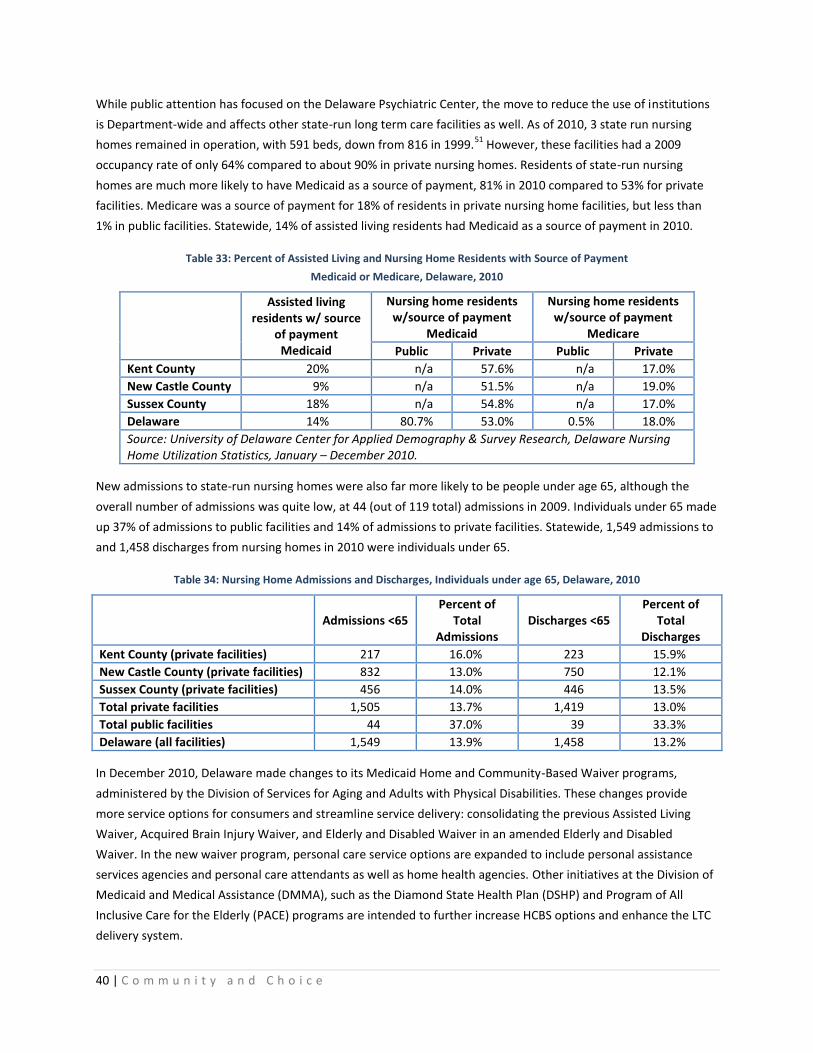
40 | C o m m u n i t y a n d C h o i c e
While public attention has focused on the Delaware Psychiatric Center, the move to reduce the use of institutions
is Department-wide and affects other state-run long term care facilities as well. As of 2010, 3 state run nursing
homes remained in operation, with 591 beds, down from 816 in 1999.51
However, these facilities had a 2009
occupancy rate of only 64% compared to about 90% in private nursing homes. Residents of state-run nursing
homes are much more likely to have Medicaid as a source of payment, 81% in 2010 compared to 53% for private
facilities. Medicare was a source of payment for 18% of residents in private nursing home facilities, but less than
1% in public facilities. Statewide, 14% of assisted living residents had Medicaid as a source of payment in 2010.
Table 33: Percent of Assisted Living and Nursing Home Residents with Source of Payment
Medicaid or Medicare, Delaware, 2010
Assisted living residents w/ source
of payment Medicaid
Nursing home residents w/source of payment
Medicaid
Nursing home residents w/source of payment
Medicare
Public Private Public Private
Kent County 20% n/a 57.6% n/a 17.0%
New Castle County 9% n/a 51.5% n/a 19.0%
Sussex County 18% n/a 54.8% n/a 17.0%
Delaware 14% 80.7% 53.0% 0.5% 18.0%
Source: University of Delaware Center for Applied Demography & Survey Research, Delaware Nursing Home Utilization Statistics, January – December 2010.
New admissions to state-run nursing homes were also far more likely to be people under age 65, although the
overall number of admissions was quite low, at 44 (out of 119 total) admissions in 2009. Individuals under 65 made
up 37% of admissions to public facilities and 14% of admissions to private facilities. Statewide, 1,549 admissions to
and 1,458 discharges from nursing homes in 2010 were individuals under 65.
Table 34: Nursing Home Admissions and Discharges, Individuals under age 65, Delaware, 2010
Admissions <65 Percent of
Total Admissions
Discharges <65 Percent of
Total Discharges
Kent County (private facilities) 217 16.0% 223 15.9%
New Castle County (private facilities) 832 13.0% 750 12.1%
Sussex County (private facilities) 456 14.0% 446 13.5%
Total private facilities 1,505 13.7% 1,419 13.0%
Total public facilities 44 37.0% 39 33.3%
Delaware (all facilities) 1,549 13.9% 1,458 13.2%
In December 2010, Delaware made changes to its Medicaid Home and Community-Based Waiver programs,
administered by the Division of Services for Aging and Adults with Physical Disabilities. These changes provide
more service options for consumers and streamline service delivery: consolidating the previous Assisted Living
Waiver, Acquired Brain Injury Waiver, and Elderly and Disabled Waiver in an amended Elderly and Disabled
Waiver. In the new waiver program, personal care service options are expanded to include personal assistance
services agencies and personal care attendants as well as home health agencies. Other initiatives at the Division of
Medicaid and Medical Assistance (DMMA), such as the Diamond State Health Plan (DSHP) and Program of All
Inclusive Care for the Elderly (PACE) programs are intended to further increase HCBS options and enhance the LTC
delivery system.
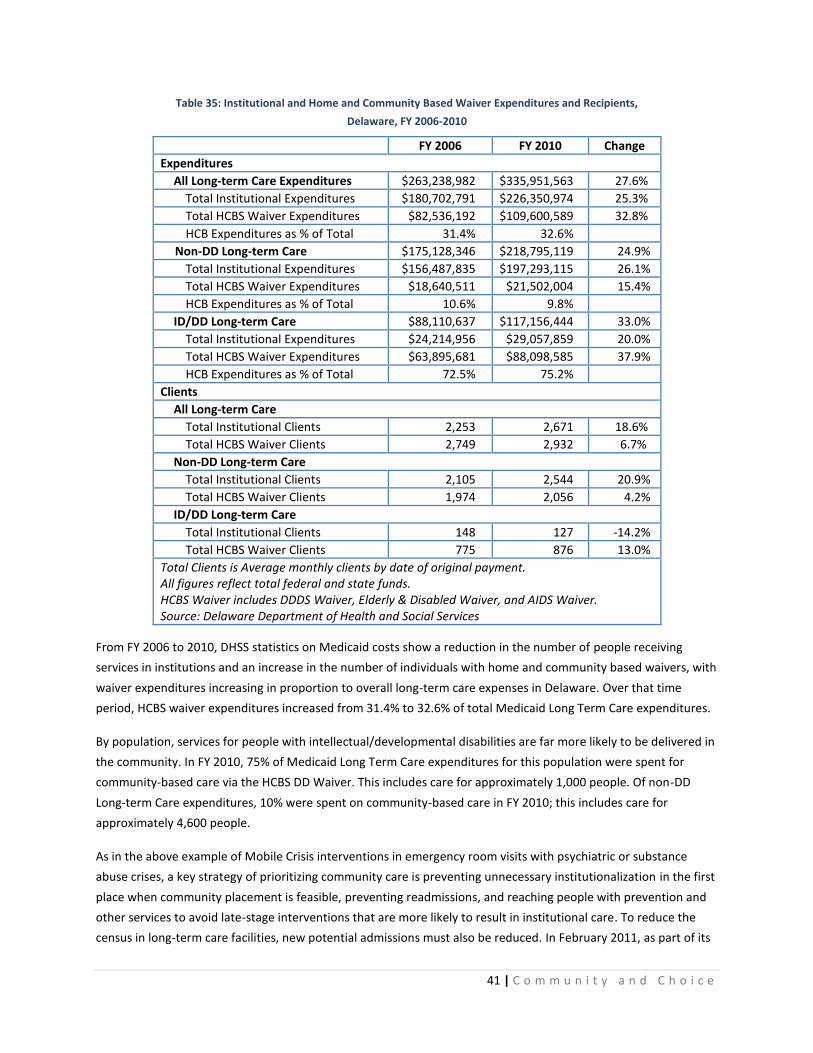
41 | C o m m u n i t y a n d C h o i c e
Table 35: Institutional and Home and Community Based Waiver Expenditures and Recipients,
Delaware, FY 2006-2010
FY 2006 FY 2010 Change
Expenditures
All Long-term Care Expenditures $263,238,982 $335,951,563 27.6%
Total Institutional Expenditures $180,702,791 $226,350,974 25.3%
Total HCBS Waiver Expenditures $82,536,192 $109,600,589 32.8%
HCB Expenditures as % of Total 31.4% 32.6%
Non-DD Long-term Care $175,128,346 $218,795,119 24.9%
Total Institutional Expenditures $156,487,835 $197,293,115 26.1%
Total HCBS Waiver Expenditures $18,640,511 $21,502,004 15.4%
HCB Expenditures as % of Total 10.6% 9.8%
ID/DD Long-term Care $88,110,637 $117,156,444 33.0%
Total Institutional Expenditures $24,214,956 $29,057,859 20.0%
Total HCBS Waiver Expenditures $63,895,681 $88,098,585 37.9%
HCB Expenditures as % of Total 72.5% 75.2%
Clients
All Long-term Care
Total Institutional Clients 2,253 2,671 18.6%
Total HCBS Waiver Clients 2,749 2,932 6.7%
Non-DD Long-term Care
Total Institutional Clients 2,105 2,544 20.9%
Total HCBS Waiver Clients 1,974 2,056 4.2%
ID/DD Long-term Care
Total Institutional Clients 148 127 -14.2%
Total HCBS Waiver Clients 775 876 13.0%
Total Clients is Average monthly clients by date of original payment. All figures reflect total federal and state funds. HCBS Waiver includes DDDS Waiver, Elderly & Disabled Waiver, and AIDS Waiver. Source: Delaware Department of Health and Social Services
From FY 2006 to 2010, DHSS statistics on Medicaid costs show a reduction in the number of people receiving
services in institutions and an increase in the number of individuals with home and community based waivers, with
waiver expenditures increasing in proportion to overall long-term care expenses in Delaware. Over that time
period, HCBS waiver expenditures increased from 31.4% to 32.6% of total Medicaid Long Term Care expenditures.
By population, services for people with intellectual/developmental disabilities are far more likely to be delivered in
the community. In FY 2010, 75% of Medicaid Long Term Care expenditures for this population were spent for
community-based care via the HCBS DD Waiver. This includes care for approximately 1,000 people. Of non-DD
Long-term Care expenditures, 10% were spent on community-based care in FY 2010; this includes care for
approximately 4,600 people.
As in the above example of Mobile Crisis interventions in emergency room visits with psychiatric or substance
abuse crises, a key strategy of prioritizing community care is preventing unnecessary institutionalization in the first
place when community placement is feasible, preventing readmissions, and reaching people with prevention and
other services to avoid late-stage interventions that are more likely to result in institutional care. To reduce the
census in long-term care facilities, new potential admissions must also be reduced. In February 2011, as part of its
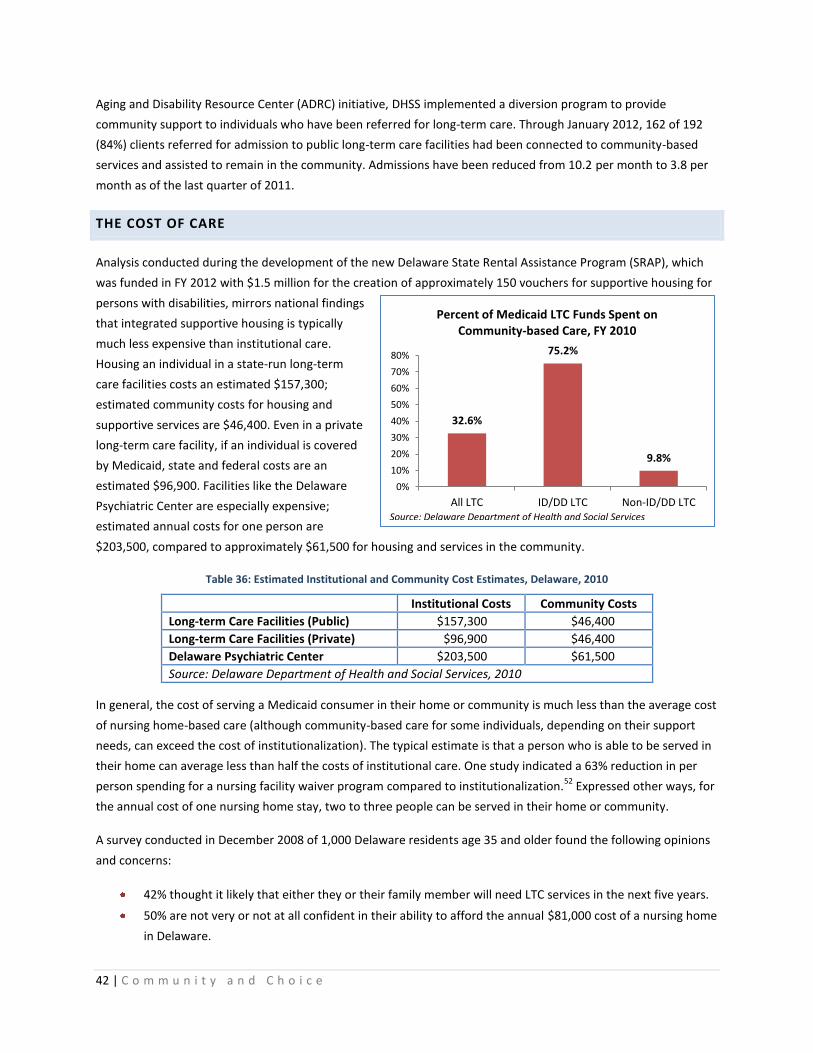
42 | C o m m u n i t y a n d C h o i c e
Aging and Disability Resource Center (ADRC) initiative, DHSS implemented a diversion program to provide
community support to individuals who have been referred for long-term care. Through January 2012, 162 of 192
(84%) clients referred for admission to public long-term care facilities had been connected to community-based
services and assisted to remain in the community. Admissions have been reduced from 10.2 per month to 3.8 per
month as of the last quarter of 2011.
THE COST OF CARE
Analysis conducted during the development of the new Delaware State Rental Assistance Program (SRAP), which
was funded in FY 2012 with $1.5 million for the creation of approximately 150 vouchers for supportive housing for
persons with disabilities, mirrors national findings
that integrated supportive housing is typically
much less expensive than institutional care.
Housing an individual in a state-run long-term
care facilities costs an estimated $157,300;
estimated community costs for housing and
supportive services are $46,400. Even in a private
long-term care facility, if an individual is covered
by Medicaid, state and federal costs are an
estimated $96,900. Facilities like the Delaware
Psychiatric Center are especially expensive;
estimated annual costs for one person are
$203,500, compared to approximately $61,500 for housing and services in the community.
Table 36: Estimated Institutional and Community Cost Estimates, Delaware, 2010
Institutional Costs Community Costs
Long-term Care Facilities (Public) $157,300 $46,400
Long-term Care Facilities (Private) $96,900 $46,400
Delaware Psychiatric Center $203,500 $61,500
Source: Delaware Department of Health and Social Services, 2010
In general, the cost of serving a Medicaid consumer in their home or community is much less than the average cost
of nursing home-based care (although community-based care for some individuals, depending on their support
needs, can exceed the cost of institutionalization). The typical estimate is that a person who is able to be served in
their home can average less than half the costs of institutional care. One study indicated a 63% reduction in per
person spending for a nursing facility waiver program compared to institutionalization.52
Expressed other ways, for
the annual cost of one nursing home stay, two to three people can be served in their home or community.
A survey conducted in December 2008 of 1,000 Delaware residents age 35 and older found the following opinions
and concerns:
42% thought it likely that either they or their family member will need LTC services in the next five years.
50% are not very or not at all confident in their ability to afford the annual $81,000 cost of a nursing home
in Delaware.
32.6%
75.2%
9.8%
0%
10%
20%
30%
40%
50%
60%
70%
80%
All LTC ID/DD LTC Non-ID/DD LTC
Percent of Medicaid LTC Funds Spent on Community-based Care, FY 2010
Source: Delaware Department of Health and Social Services
43 | C o m m u n i t y a n d C h o i c e
51% of respondents with incomes less than $50,000 a year say they plan on relying on government
programs to pay for their LTC.53
In December 2009, the percentage of all nursing facility residents for which Medicaid was the primary payor was
just under 57%, representing about 2,421 Medicaid residents.54
The 2,421 Medicaid nursing facility residents
translates into a 1.8% prevalence rate of institutionalization among Delaware's elderly age 65 and older.
Assuming a constant rate of institutionalization, by year 2030, the number of nursing home residents paid by the
DMMA will increase to 4,626. On an annualized cost basis, this translates into well over $150 million more in new
Medicaid-funded nursing home stays or a combined total of over $320 million spent on nursing homes per year.
This also assumes the annual cost of nursing home services remains static at $70,000; it may be more realistic to
assume the cost of care will gradually increase over time and, thus, push institutional spending to even higher
levels.
As the need for supportive services and care increases, the cost savings of transitioning to a model that prioritizes
community care can be reinvested in expanding community services and serving more individuals. This transition
does not always result in immediate or visible cost savings, as reducing census in long-term care facilities means
that revenues from Medicaid that supported those beds are also reduced; it may also take substantial reductions
before facilities, facility costs, and staff may be reduced. The greatest advantage is in the avoidance of future costs:
building a community-based system of care that prioritizes remaining in the community will help avoid further
expansion of institutional settings and the higher costs associated with institutional care.
MONEY FOLLOWS THE PERSON INITIATIVE
The Money Follows the Person demonstration grant program was created in 2005 to assist states in rebalancing
their long-term care systems and help Medicaid enrollees who have lived in long-term care institutions for at least
three months transition from institutions to community based care. Community residences are defined as homes,
apartments, and small group homes with four or fewer unrelated individuals. 43 states and the District of
Columbia are now participating. Delaware’s MFP program began in 2008. Since then (as of 12/31/11), 60
individuals have transitioned from institutions to the community. The lack of affordable housing has been a major
barrier to transitions, frequently the only barrier, and demand for the program is high. In calendar year 2011
through 6/8/11, Delaware’s MFP program had 63 new referrals and 58 people waiting to be discharged and in the
pipeline to transition – waiting on housing. An additional 81 referrals had been assessed and reviewed by the
nurse and transition care team, and these individuals will also all likely be in need of housing. Nationally, while
older adults living in nursing facilities made up the majority of those eligible for MFP in 2007 (75%), the largest
group of MFP participants through June 2010 has been people with physical disabilities under age 65 who had
lived in nursing homes.55
By the end of 2010, almost 12,000 people had transitioned from institutions to the community through MFP
nationally.56
With the Affordable Care Act health care reform initiative, Money Follows the Person was extended
an additional five years through 2016. To date, national evaluation suggests that post-transition outcomes in the
MFP program are positive. Two 2011 reports from Mathematica Policy Research using data on outcomes for MFP
participants in 25 states who transitioned before March 2010 show that:
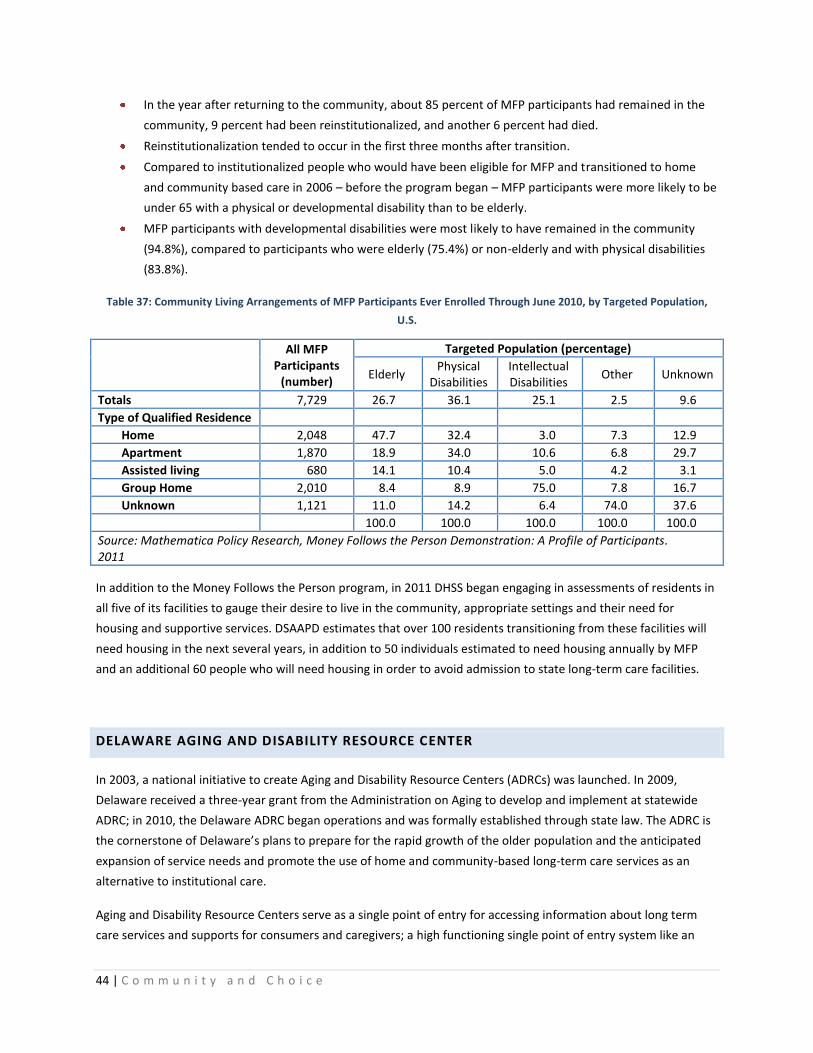
44 | C o m m u n i t y a n d C h o i c e
In the year after returning to the community, about 85 percent of MFP participants had remained in the
community, 9 percent had been reinstitutionalized, and another 6 percent had died.
Reinstitutionalization tended to occur in the first three months after transition.
Compared to institutionalized people who would have been eligible for MFP and transitioned to home
and community based care in 2006 – before the program began – MFP participants were more likely to be
under 65 with a physical or developmental disability than to be elderly.
MFP participants with developmental disabilities were most likely to have remained in the community
(94.8%), compared to participants who were elderly (75.4%) or non-elderly and with physical disabilities
(83.8%).
Table 37: Community Living Arrangements of MFP Participants Ever Enrolled Through June 2010, by Targeted Population,
U.S.
All MFP
Participants (number)
Targeted Population (percentage)
Elderly Physical
Disabilities Intellectual Disabilities
Other Unknown
Totals 7,729 26.7 36.1 25.1 2.5 9.6
Type of Qualified Residence
Home 2,048 47.7 32.4 3.0 7.3 12.9
Apartment 1,870 18.9 34.0 10.6 6.8 29.7
Assisted living 680 14.1 10.4 5.0 4.2 3.1
Group Home 2,010 8.4 8.9 75.0 7.8 16.7
Unknown 1,121 11.0 14.2 6.4 74.0 37.6
100.0 100.0 100.0 100.0 100.0
Source: Mathematica Policy Research, Money Follows the Person Demonstration: A Profile of Participants. 2011
In addition to the Money Follows the Person program, in 2011 DHSS began engaging in assessments of residents in
all five of its facilities to gauge their desire to live in the community, appropriate settings and their need for
housing and supportive services. DSAAPD estimates that over 100 residents transitioning from these facilities will
need housing in the next several years, in addition to 50 individuals estimated to need housing annually by MFP
and an additional 60 people who will need housing in order to avoid admission to state long-term care facilities.
DELAWARE AGING AND DISABILITY RESOURCE CENTER
In 2003, a national initiative to create Aging and Disability Resource Centers (ADRCs) was launched. In 2009,
Delaware received a three-year grant from the Administration on Aging to develop and implement at statewide
ADRC; in 2010, the Delaware ADRC began operations and was formally established through state law. The ADRC is
the cornerstone of Delaware’s plans to prepare for the rapid growth of the older population and the anticipated
expansion of service needs and promote the use of home and community-based long-term care services as an
alternative to institutional care.
Aging and Disability Resource Centers serve as a single point of entry for accessing information about long term
care services and supports for consumers and caregivers; a high functioning single point of entry system like an
45 | C o m m u n i t y a n d C h o i c e
ADRC is one of the key dimensions of a high performing long term care system identified in a recent report by the
AARP.57
On this facet of care, the functionality of an ADRC or single point of entry, Delaware ranked 7th
among the
states on a composite score encompassing formal marketing, range of services provided, service planning,
transition services, and others.
Operated by the Division of Services for Aging and Adults with Physical Disabilities (DSAAPD), the ADRC offers
information and assistance with available resources, options counseling to help people decide what services would
be best for them, and service enrollment support to find and enroll in the services they need. It also provides
support to hospital discharge planners to improve and increase hospital-to-home transitions. These transition
points are especially critical as “people are vulnerable to breakdowns in care and poor communication among
service providers at these times.”58
Options counseling and service enrollment support are offered to people in
their homes, nursing facilities, hospitals and other locations; the ADRC call center has staff available by phone and
email. In 2012, the ADRC plans to expand call center support to 24-hour service.
Since its launch, the ADRC has already experienced high demand. From October 2010 – October 2011, the ADRC
responded to over 28,000 phone calls and emails and in just October 2011, provided in-person support to 161
people in their homes, nursing homes or hospitals.
RENTAL HOUSING NEEDS
CHALLENGES QUANTIFYING NEEDS
Coming to a summarized number of units of accessible rental housing and rental assistance needed in the state is
extremely challenging. With numerous variables in the type of need, and little available information about
inventory, a straightforward gap analysis comparing the available inventory to identified needs is not possible.
Identifying needs is challenging as there is limited reliable, detailed data available beyond that collected by service
systems such as the Department of Health and Social Services. These of course do not include all people with
disabilities in Delaware, and especially when it comes to physical disabilities, information is limited. Sources of data
like the American Community Survey use fairly general questions that do not include any information about the
severity of a disability or need for accessibility features, and in addition, disability fields are not cross-tabulated
with many other fields of interest, such as tenure and detailed income fields. There is no easy way to define how
many people in Delaware require accessible housing, and, more importantly, how many people in Delaware need
accessible housing and do not currently have it, or that same information specific to affordable accessible housing.
Collecting information on accessibility within the existing housing stock is similarly challenging. There are no
national or local sources tracking accessibility features in the existing housing stock. At best, we have local
information on the number of fully accessible units in subsidized or income-restricted rental housing, but even that
is incomplete.
Still, by assembling local data and using national data to make some estimates for Delaware, we are able to get
some sense of the population in need and the scope and nature of those needs.
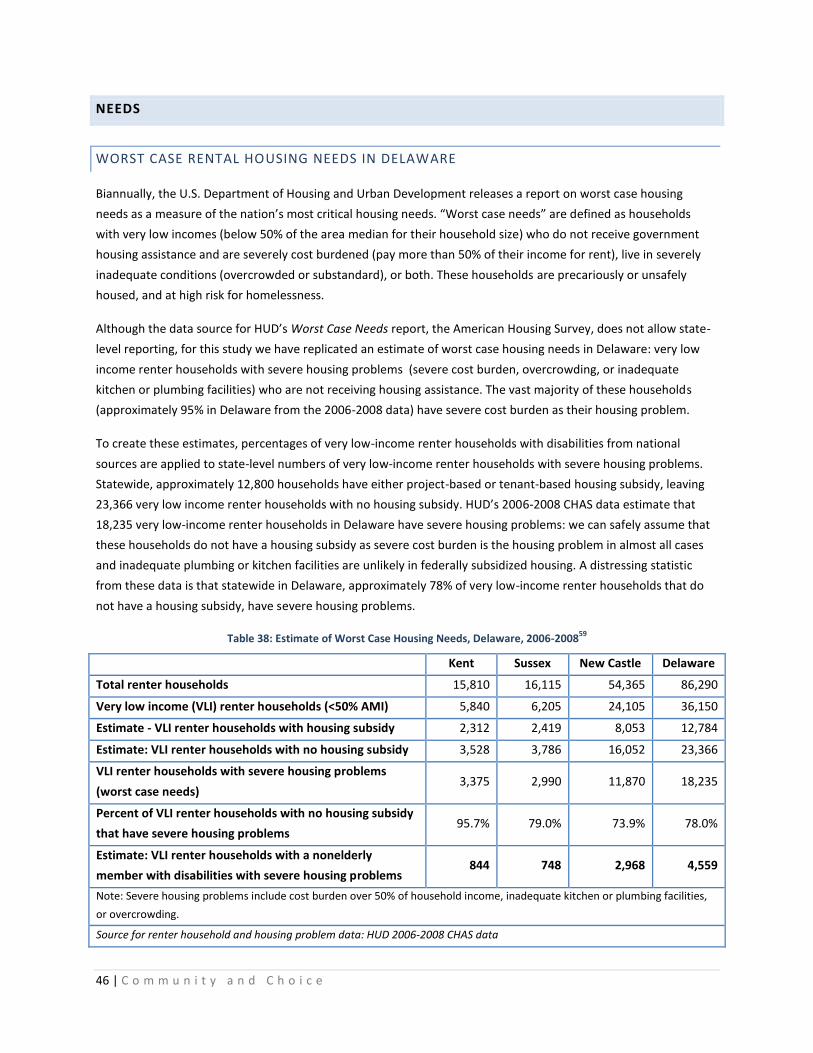
46 | C o m m u n i t y a n d C h o i c e
NEEDS
WORST CASE RENTAL HOUSING NEEDS IN DELAWARE
Biannually, the U.S. Department of Housing and Urban Development releases a report on worst case housing
needs as a measure of the nation’s most critical housing needs. “Worst case needs” are defined as households
with very low incomes (below 50% of the area median for their household size) who do not receive government
housing assistance and are severely cost burdened (pay more than 50% of their income for rent), live in severely
inadequate conditions (overcrowded or substandard), or both. These households are precariously or unsafely
housed, and at high risk for homelessness.
Although the data source for HUD’s Worst Case Needs report, the American Housing Survey, does not allow state-
level reporting, for this study we have replicated an estimate of worst case housing needs in Delaware: very low
income renter households with severe housing problems (severe cost burden, overcrowding, or inadequate
kitchen or plumbing facilities) who are not receiving housing assistance. The vast majority of these households
(approximately 95% in Delaware from the 2006-2008 data) have severe cost burden as their housing problem.
To create these estimates, percentages of very low-income renter households with disabilities from national
sources are applied to state-level numbers of very low-income renter households with severe housing problems.
Statewide, approximately 12,800 households have either project-based or tenant-based housing subsidy, leaving
23,366 very low income renter households with no housing subsidy. HUD’s 2006-2008 CHAS data estimate that
18,235 very low-income renter households in Delaware have severe housing problems: we can safely assume that
these households do not have a housing subsidy as severe cost burden is the housing problem in almost all cases
and inadequate plumbing or kitchen facilities are unlikely in federally subsidized housing. A distressing statistic
from these data is that statewide in Delaware, approximately 78% of very low-income renter households that do
not have a housing subsidy, have severe housing problems.
Table 38: Estimate of Worst Case Housing Needs, Delaware, 2006-200859
Kent Sussex New Castle Delaware
Total renter households 15,810 16,115 54,365 86,290
Very low income (VLI) renter households (<50% AMI) 5,840 6,205 24,105 36,150
Estimate - VLI renter households with housing subsidy 2,312 2,419 8,053 12,784
Estimate: VLI renter households with no housing subsidy 3,528 3,786 16,052 23,366
VLI renter households with severe housing problems
(worst case needs) 3,375 2,990 11,870 18,235
Percent of VLI renter households with no housing subsidy
that have severe housing problems 95.7% 79.0% 73.9% 78.0%
Estimate: VLI renter households with a nonelderly
member with disabilities with severe housing problems 844 748 2,968 4,559
Note: Severe housing problems include cost burden over 50% of household income, inadequate kitchen or plumbing facilities,
or overcrowding.
Source for renter household and housing problem data: HUD 2006-2008 CHAS data
47 | C o m m u n i t y a n d C h o i c e
Recent research from the National Low Income Housing Coalition (NLIHC) comparing rates of disability prevalence
and housing needs in the American Housing Survey (AHS), the data source used in HUD’s Worst Case Needs report,
and the American Community Survey (ACS), show that despite efforts to coordinate survey questions on disability,
the ACS still shows higher rates of disability than the AHS, from 38 to 99% higher for the six different disability
questions, and the disparity tends to be highest for nonelderly renters.60
Thus, in the above estimate, we applied a
percentage of very low income renter households with disabilities from the ACS to the Delaware number of very
low-income renter households with severe housing problems. This estimate suggests there are approximately
4,500 very low-income renter households with severe housing problems with disabilities in Delaware.
Considering these data inconsistencies, even though recent adjustments to HUD’s Worst Case Needs reports have
improved the quality of data on worst case needs among households with disabilities, the national number of
987,000 nonelderly very low income renter households with worst case housing needs and disabilities is likely still
an underestimate. Comparison figures estimated with the American Community Survey are 1.31 million, and
adjusting for the higher rates of disability prevalence shown in more detailed national surveys like the National
Health interview Survey (NHIS) and Survey of Income and Program Participation (SIPP) suggest the number may be
closer to 2 million.61
A subsequent multivariate analysis attempting to create state-level estimates using AHS data
and ACS geography suggests that 61% of adult nonelderly households with disabilities in Delaware have worst case
housing needs, or approximately 5,000 households: in line with the estimate of 4,559 produced in Table 37.
SUMMARY OF DELAWARE LOCAL DATA
It is difficult to summarize the diverse housing needs of people with diverse disabilities into one number or even
one table. For purposes of this report, we are most concerned with the number of people or households in need of
affordable accessible rental housing or rental assistance. In addition, by population these estimates may come
from widely different sources and reflect different levels of need: one estimate may be of people actually
homeless, one of people who are housed but need rental assistance with supportive services to live independently.
The following table summarizes the data on needs gathered from local sources for this report.
The below table suggests a total need for assistance for approximately 1,950 individuals or households. These are
conservative estimates, as the case of the DSAMH point-in-time analysis is a good example. While 882 DSAMH
clients were identified as in need of stable housing in that analysis, over 2,000 listed SSI or SSDI as their primary
source of income. These individuals are highly likely to be precariously housed, cost-burdened and in need of
rental assistance, or doubled-up with family or friends when they would prefer to and could live independently.
DDDS is currently serving 1,923 people with intellectual or developmental disabilities who are currently stably
housed with family or friends, but as their families age, many of these people may also need housing assistance.
DDDS estimates 150 people may be at risk due to aging caregivers and need housing assistance in the near future.
In addition, we have very limited information about people with disabilities who may be similarly precariously
housed in the community or in private nursing homes and able to transition to the community. The estimated
need from LTC facilities suggests a need for at least 650 either assisted accessible units or market-rate accessible
units with tenant-based rental assistance. 250 of these are estimated to be referrals from Adult Protective
Services, the Aging and Disability Resource Center, or other sources.

48 | C o m m u n i t y a n d C h o i c e
Table 39: Summary of Local Data on Housing Needs
Population Need Source
People with HIV/AIDS 250 on TBRA waiting list Delaware HIV Consortium
People with
Intellectual/Developmental
Disabilities (ID/DD)
150 individuals estimated at-risk due to aging
caregivers
DHSS: Division of
Developmental Disabilities
Services (DDDS)
Substance Abuse/Mental
Health
882 DSAMH consumers in need of stable housing
(nursing home, corrections facility, other
institution, unknown, or homeless)
406: Mental Health
306: Substance Abuse
116: Co-occurring MH/SA
54: Unknown
DHSS: Division of Substance
Abuse and Mental Health
(DSAMH) point-in-time
analysis
Elderly and Adults with
Physical Disabilities
300 (Diversions and transitions from LTC facilities
from FY 13 - 17)
100 (Transitions from DHSS LTC Facilities)
250 (Other referrals from APS, ADRC, and other
sources from FY 13-17)
Likely all (650) fully accessible units
DHSS: Division of Service for
Aging and Adults with
Physical Disabilities
(DSAAPD)
Estimates from HUD’s CHAS data (Table 31 above) show 2,260 extremely low-income (<30% AMI) renter
households and 1,445 owner households with at least one member with a mobility or self-care disability with a
housing problem (cost burden, overcrowding or substandard conditions) in Delaware. Expanded to include very
low-income households (<50% AMI), there are 3,235 renter households and 3,225 owner households with income
below 50% AMI, at least one member with a mobility or self-care disability, and a housing problem in Delaware.
Youth aging out of foster care are an additional high-risk population; estimates of the number of youth expected to
be aging out of the foster care system provided by the Department of Services for Children, Youth and their
Families suggest a need for approximately 300 units of rental assistance.
DEMAND FOR ASSISTED ACCESSIBLE UNITS
Caseworkers and advocates regularly report great difficulty locating accessible affordable rental housing. However,
rental housing owners and developers also report vacancies and difficulty filling fully accessible units. Some sample
review of data from people in the Money Follows the Person (MFP) program suggest that the issue may be more
one of a need for subsidy and a mismatch in unit locations and sizes.
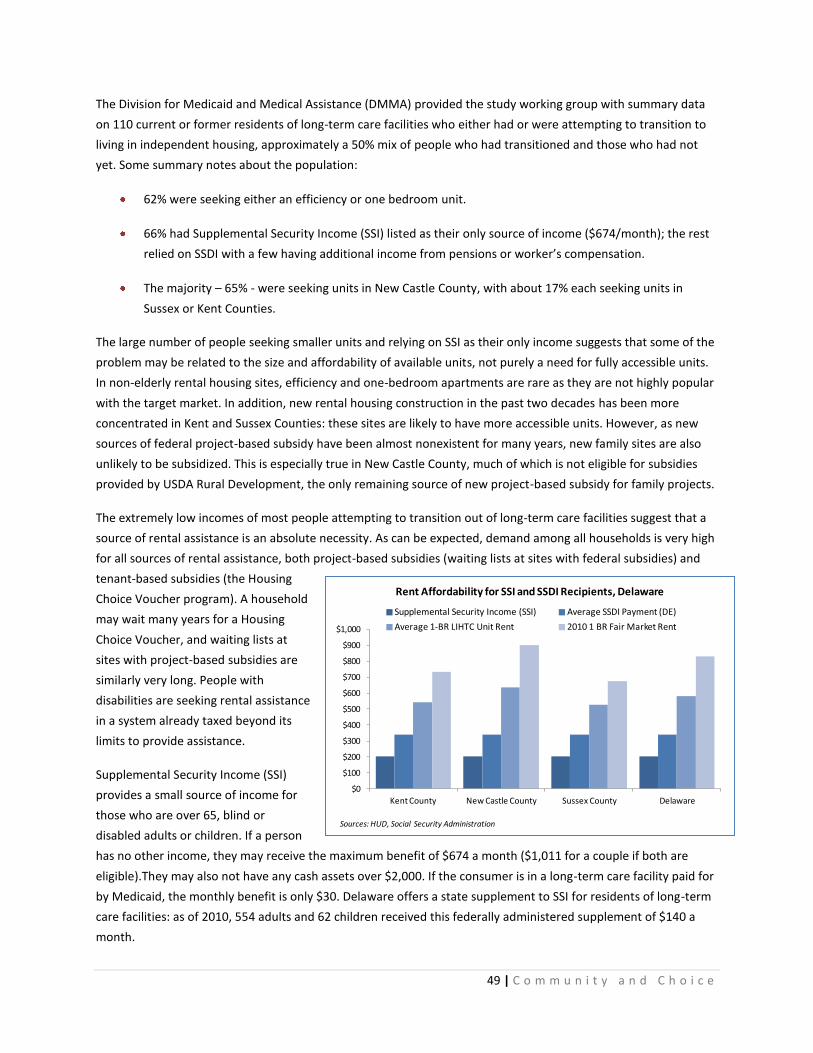
49 | C o m m u n i t y a n d C h o i c e
The Division for Medicaid and Medical Assistance (DMMA) provided the study working group with summary data
on 110 current or former residents of long-term care facilities who either had or were attempting to transition to
living in independent housing, approximately a 50% mix of people who had transitioned and those who had not
yet. Some summary notes about the population:
62% were seeking either an efficiency or one bedroom unit.
66% had Supplemental Security Income (SSI) listed as their only source of income ($674/month); the rest
relied on SSDI with a few having additional income from pensions or worker’s compensation.
The majority – 65% - were seeking units in New Castle County, with about 17% each seeking units in
Sussex or Kent Counties.
The large number of people seeking smaller units and relying on SSI as their only income suggests that some of the
problem may be related to the size and affordability of available units, not purely a need for fully accessible units.
In non-elderly rental housing sites, efficiency and one-bedroom apartments are rare as they are not highly popular
with the target market. In addition, new rental housing construction in the past two decades has been more
concentrated in Kent and Sussex Counties: these sites are likely to have more accessible units. However, as new
sources of federal project-based subsidy have been almost nonexistent for many years, new family sites are also
unlikely to be subsidized. This is especially true in New Castle County, much of which is not eligible for subsidies
provided by USDA Rural Development, the only remaining source of new project-based subsidy for family projects.
The extremely low incomes of most people attempting to transition out of long-term care facilities suggest that a
source of rental assistance is an absolute necessity. As can be expected, demand among all households is very high
for all sources of rental assistance, both project-based subsidies (waiting lists at sites with federal subsidies) and
tenant-based subsidies (the Housing
Choice Voucher program). A household
may wait many years for a Housing
Choice Voucher, and waiting lists at
sites with project-based subsidies are
similarly very long. People with
disabilities are seeking rental assistance
in a system already taxed beyond its
limits to provide assistance.
Supplemental Security Income (SSI)
provides a small source of income for
those who are over 65, blind or
disabled adults or children. If a person
has no other income, they may receive the maximum benefit of $674 a month ($1,011 for a couple if both are
eligible).They may also not have any cash assets over $2,000. If the consumer is in a long-term care facility paid for
by Medicaid, the monthly benefit is only $30. Delaware offers a state supplement to SSI for residents of long-term
care facilities: as of 2010, 554 adults and 62 children received this federally administered supplement of $140 a
month.
$0
$100
$200
$300
$400
$500
$600
$700
$800
$900
$1,000
Kent County New Castle County Sussex County Delaware
Rent Affordability for SSI and SSDI Recipients, Delaware
Supplemental Security Income (SSI) Average SSDI Payment (DE)
Average 1-BR LIHTC Unit Rent 2010 1 BR Fair Market Rent
Sources: HUD, Social Security Administration
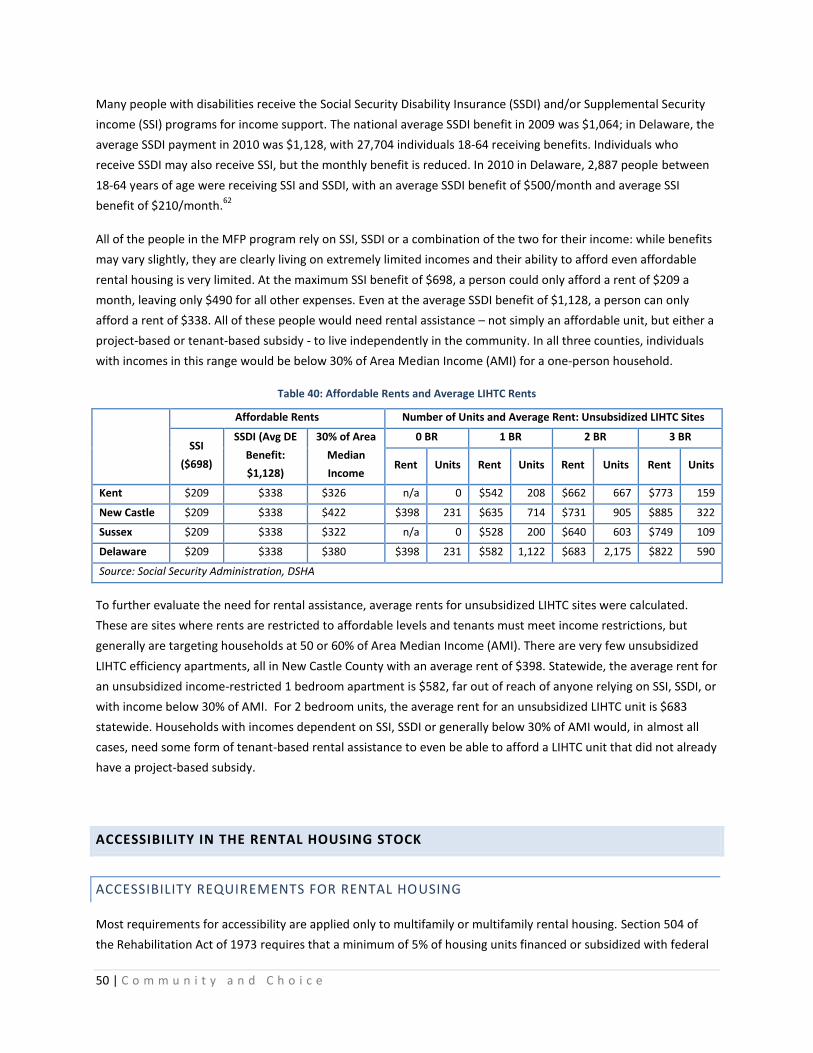
50 | C o m m u n i t y a n d C h o i c e
Many people with disabilities receive the Social Security Disability Insurance (SSDI) and/or Supplemental Security
income (SSI) programs for income support. The national average SSDI benefit in 2009 was $1,064; in Delaware, the
average SSDI payment in 2010 was $1,128, with 27,704 individuals 18-64 receiving benefits. Individuals who
receive SSDI may also receive SSI, but the monthly benefit is reduced. In 2010 in Delaware, 2,887 people between
18-64 years of age were receiving SSI and SSDI, with an average SSDI benefit of $500/month and average SSI
benefit of $210/month.62
All of the people in the MFP program rely on SSI, SSDI or a combination of the two for their income: while benefits
may vary slightly, they are clearly living on extremely limited incomes and their ability to afford even affordable
rental housing is very limited. At the maximum SSI benefit of $698, a person could only afford a rent of $209 a
month, leaving only $490 for all other expenses. Even at the average SSDI benefit of $1,128, a person can only
afford a rent of $338. All of these people would need rental assistance – not simply an affordable unit, but either a
project-based or tenant-based subsidy - to live independently in the community. In all three counties, individuals
with incomes in this range would be below 30% of Area Median Income (AMI) for a one-person household.
Table 40: Affordable Rents and Average LIHTC Rents
Affordable Rents Number of Units and Average Rent: Unsubsidized LIHTC Sites
SSI
($698)
SSDI (Avg DE
Benefit:
$1,128)
30% of Area
Median
Income
0 BR 1 BR 2 BR 3 BR
Rent Units Rent Units Rent Units Rent Units
Kent $209 $338 $326 n/a 0 $542 208 $662 667 $773 159
New Castle $209 $338 $422 $398 231 $635 714 $731 905 $885 322
Sussex $209 $338 $322 n/a 0 $528 200 $640 603 $749 109
Delaware $209 $338 $380 $398 231 $582 1,122 $683 2,175 $822 590
Source: Social Security Administration, DSHA
To further evaluate the need for rental assistance, average rents for unsubsidized LIHTC sites were calculated.
These are sites where rents are restricted to affordable levels and tenants must meet income restrictions, but
generally are targeting households at 50 or 60% of Area Median Income (AMI). There are very few unsubsidized
LIHTC efficiency apartments, all in New Castle County with an average rent of $398. Statewide, the average rent for
an unsubsidized income-restricted 1 bedroom apartment is $582, far out of reach of anyone relying on SSI, SSDI, or
with income below 30% of AMI. For 2 bedroom units, the average rent for an unsubsidized LIHTC unit is $683
statewide. Households with incomes dependent on SSI, SSDI or generally below 30% of AMI would, in almost all
cases, need some form of tenant-based rental assistance to even be able to afford a LIHTC unit that did not already
have a project-based subsidy.
ACCESSIBILITY IN THE RENTAL HOUSING STOCK
ACCESSIBILITY REQUIREMENTS FOR RENTAL HOUSING
Most requirements for accessibility are applied only to multifamily or multifamily rental housing. Section 504 of
the Rehabilitation Act of 1973 requires that a minimum of 5% of housing units financed or subsidized with federal
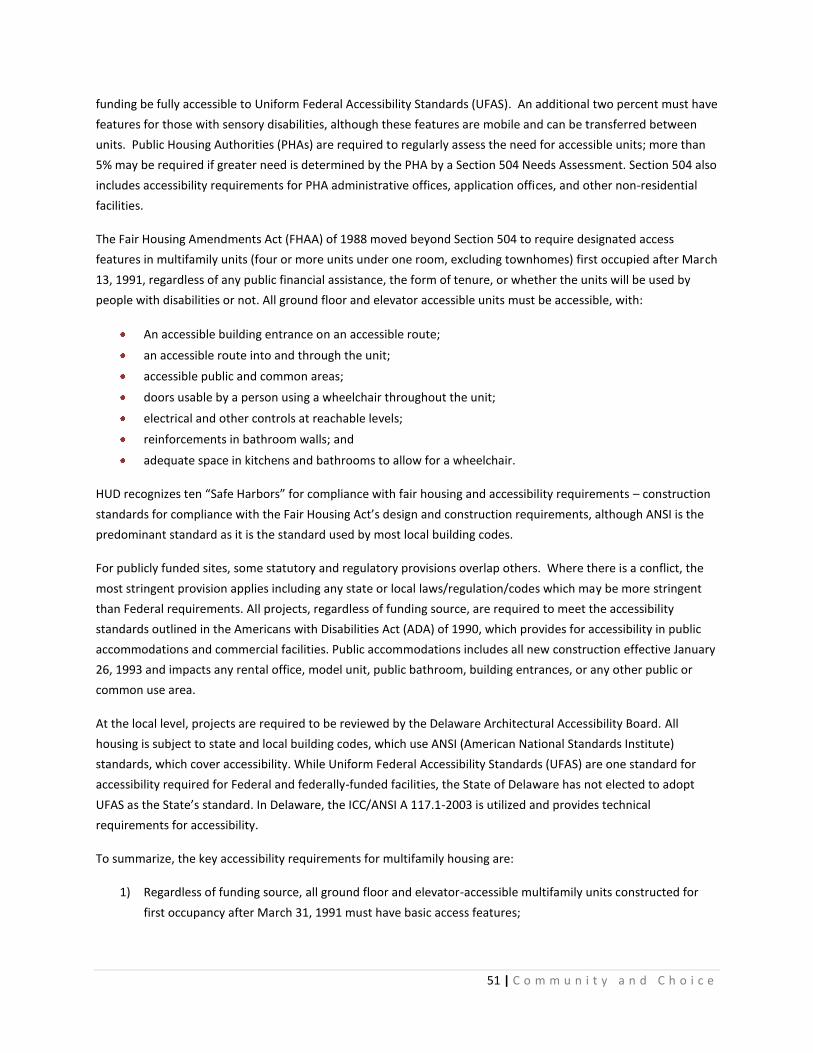
51 | C o m m u n i t y a n d C h o i c e
funding be fully accessible to Uniform Federal Accessibility Standards (UFAS). An additional two percent must have
features for those with sensory disabilities, although these features are mobile and can be transferred between
units. Public Housing Authorities (PHAs) are required to regularly assess the need for accessible units; more than
5% may be required if greater need is determined by the PHA by a Section 504 Needs Assessment. Section 504 also
includes accessibility requirements for PHA administrative offices, application offices, and other non-residential
facilities.
The Fair Housing Amendments Act (FHAA) of 1988 moved beyond Section 504 to require designated access
features in multifamily units (four or more units under one room, excluding townhomes) first occupied after March
13, 1991, regardless of any public financial assistance, the form of tenure, or whether the units will be used by
people with disabilities or not. All ground floor and elevator accessible units must be accessible, with:
An accessible building entrance on an accessible route;
an accessible route into and through the unit;
accessible public and common areas;
doors usable by a person using a wheelchair throughout the unit;
electrical and other controls at reachable levels;
reinforcements in bathroom walls; and
adequate space in kitchens and bathrooms to allow for a wheelchair.
HUD recognizes ten “Safe Harbors” for compliance with fair housing and accessibility requirements – construction
standards for compliance with the Fair Housing Act’s design and construction requirements, although ANSI is the
predominant standard as it is the standard used by most local building codes.
For publicly funded sites, some statutory and regulatory provisions overlap others. Where there is a conflict, the
most stringent provision applies including any state or local laws/regulation/codes which may be more stringent
than Federal requirements. All projects, regardless of funding source, are required to meet the accessibility
standards outlined in the Americans with Disabilities Act (ADA) of 1990, which provides for accessibility in public
accommodations and commercial facilities. Public accommodations includes all new construction effective January
26, 1993 and impacts any rental office, model unit, public bathroom, building entrances, or any other public or
common use area.
At the local level, projects are required to be reviewed by the Delaware Architectural Accessibility Board. All
housing is subject to state and local building codes, which use ANSI (American National Standards Institute)
standards, which cover accessibility. While Uniform Federal Accessibility Standards (UFAS) are one standard for
accessibility required for Federal and federally-funded facilities, the State of Delaware has not elected to adopt
UFAS as the State’s standard. In Delaware, the ICC/ANSI A 117.1-2003 is utilized and provides technical
requirements for accessibility.
To summarize, the key accessibility requirements for multifamily housing are:
1) Regardless of funding source, all ground floor and elevator-accessible multifamily units constructed for
first occupancy after March 31, 1991 must have basic access features;
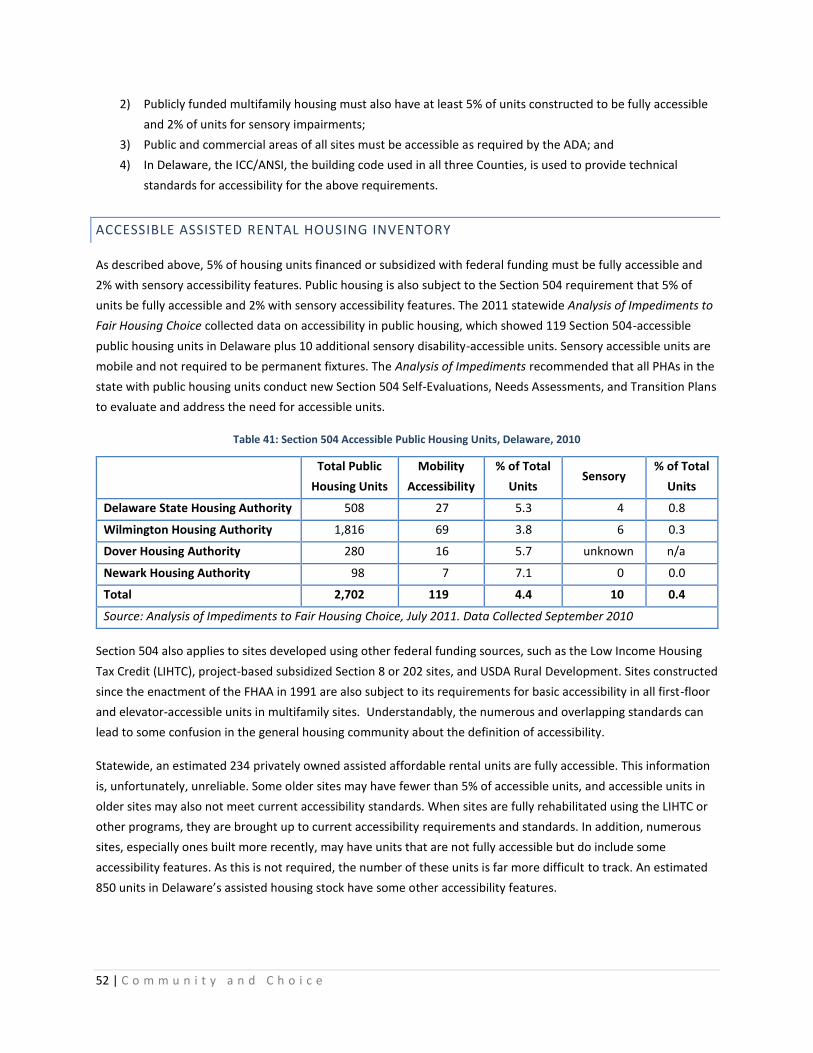
52 | C o m m u n i t y a n d C h o i c e
2) Publicly funded multifamily housing must also have at least 5% of units constructed to be fully accessible
and 2% of units for sensory impairments;
3) Public and commercial areas of all sites must be accessible as required by the ADA; and
4) In Delaware, the ICC/ANSI, the building code used in all three Counties, is used to provide technical
standards for accessibility for the above requirements.
ACCESSIBLE ASSISTED RENTAL HOUSING INVENTORY
As described above, 5% of housing units financed or subsidized with federal funding must be fully accessible and
2% with sensory accessibility features. Public housing is also subject to the Section 504 requirement that 5% of
units be fully accessible and 2% with sensory accessibility features. The 2011 statewide Analysis of Impediments to
Fair Housing Choice collected data on accessibility in public housing, which showed 119 Section 504-accessible
public housing units in Delaware plus 10 additional sensory disability-accessible units. Sensory accessible units are
mobile and not required to be permanent fixtures. The Analysis of Impediments recommended that all PHAs in the
state with public housing units conduct new Section 504 Self-Evaluations, Needs Assessments, and Transition Plans
to evaluate and address the need for accessible units.
Table 41: Section 504 Accessible Public Housing Units, Delaware, 2010
Section 504 also applies to sites developed using other federal funding sources, such as the Low Income Housing
Tax Credit (LIHTC), project-based subsidized Section 8 or 202 sites, and USDA Rural Development. Sites constructed
since the enactment of the FHAA in 1991 are also subject to its requirements for basic accessibility in all first-floor
and elevator-accessible units in multifamily sites. Understandably, the numerous and overlapping standards can
lead to some confusion in the general housing community about the definition of accessibility.
Statewide, an estimated 234 privately owned assisted affordable rental units are fully accessible. This information
is, unfortunately, unreliable. Some older sites may have fewer than 5% of accessible units, and accessible units in
older sites may also not meet current accessibility standards. When sites are fully rehabilitated using the LIHTC or
other programs, they are brought up to current accessibility requirements and standards. In addition, numerous
sites, especially ones built more recently, may have units that are not fully accessible but do include some
accessibility features. As this is not required, the number of these units is far more difficult to track. An estimated
850 units in Delaware’s assisted housing stock have some other accessibility features.
Total Public
Housing Units
Mobility
Accessibility
% of Total
Units Sensory
% of Total
Units
Delaware State Housing Authority 508 27 5.3 4 0.8
Wilmington Housing Authority 1,816 69 3.8 6 0.3
Dover Housing Authority 280 16 5.7 unknown n/a
Newark Housing Authority 98 7 7.1 0 0.0
Total 2,702 119 4.4 10 0.4
Source: Analysis of Impediments to Fair Housing Choice, July 2011. Data Collected September 2010
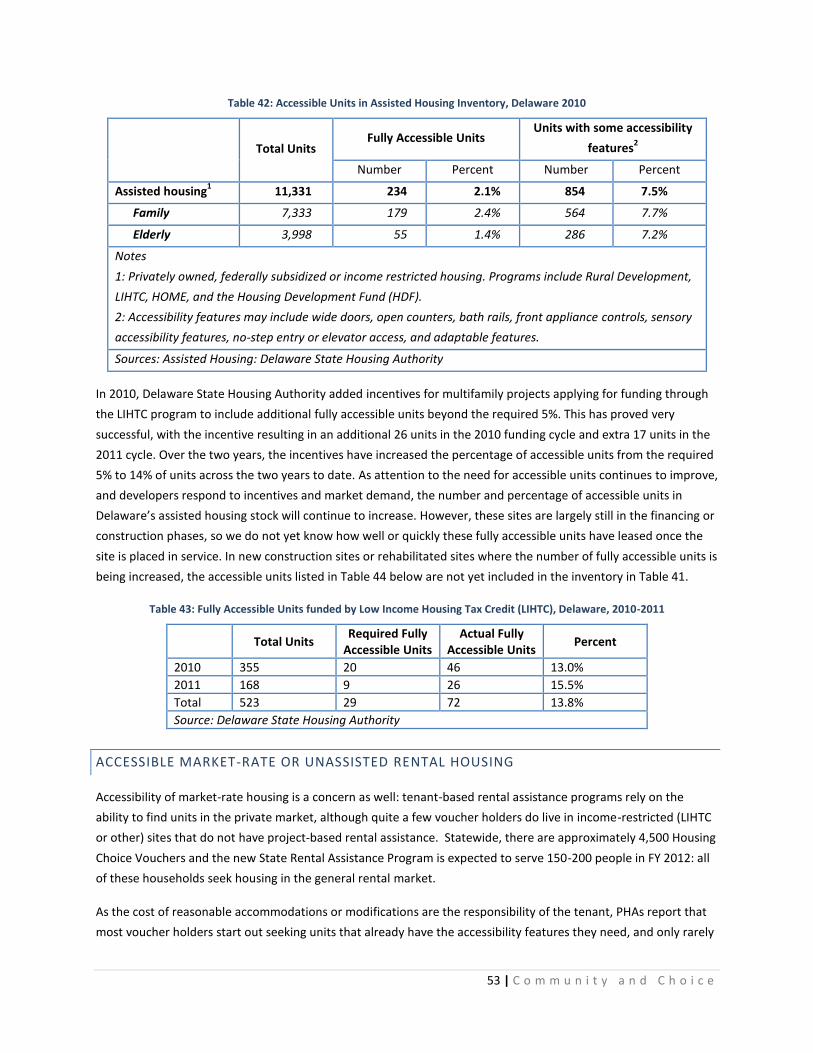
53 | C o m m u n i t y a n d C h o i c e
Table 42: Accessible Units in Assisted Housing Inventory, Delaware 2010
Total Units Fully Accessible Units
Units with some accessibility
features2
Number Percent Number Percent
Assisted housing1 11,331 234 2.1% 854 7.5%
Family 7,333 179 2.4% 564 7.7%
Elderly 3,998 55 1.4% 286 7.2%
Notes
1: Privately owned, federally subsidized or income restricted housing. Programs include Rural Development,
LIHTC, HOME, and the Housing Development Fund (HDF).
2: Accessibility features may include wide doors, open counters, bath rails, front appliance controls, sensory
accessibility features, no-step entry or elevator access, and adaptable features.
Sources: Assisted Housing: Delaware State Housing Authority
In 2010, Delaware State Housing Authority added incentives for multifamily projects applying for funding through
the LIHTC program to include additional fully accessible units beyond the required 5%. This has proved very
successful, with the incentive resulting in an additional 26 units in the 2010 funding cycle and extra 17 units in the
2011 cycle. Over the two years, the incentives have increased the percentage of accessible units from the required
5% to 14% of units across the two years to date. As attention to the need for accessible units continues to improve,
and developers respond to incentives and market demand, the number and percentage of accessible units in
Delaware’s assisted housing stock will continue to increase. However, these sites are largely still in the financing or
construction phases, so we do not yet know how well or quickly these fully accessible units have leased once the
site is placed in service. In new construction sites or rehabilitated sites where the number of fully accessible units is
being increased, the accessible units listed in Table 44 below are not yet included in the inventory in Table 41.
Table 43: Fully Accessible Units funded by Low Income Housing Tax Credit (LIHTC), Delaware, 2010-2011
Total Units
Required Fully Accessible Units
Actual Fully Accessible Units
Percent
2010 355 20 46 13.0%
2011 168 9 26 15.5%
Total 523 29 72 13.8%
Source: Delaware State Housing Authority
ACCESSIBLE MARKET-RATE OR UNASSISTED RENTAL HOUSING
Accessibility of market-rate housing is a concern as well: tenant-based rental assistance programs rely on the
ability to find units in the private market, although quite a few voucher holders do live in income-restricted (LIHTC
or other) sites that do not have project-based rental assistance. Statewide, there are approximately 4,500 Housing
Choice Vouchers and the new State Rental Assistance Program is expected to serve 150-200 people in FY 2012: all
of these households seek housing in the general rental market.
As the cost of reasonable accommodations or modifications are the responsibility of the tenant, PHAs report that
most voucher holders start out seeking units that already have the accessibility features they need, and only rarely
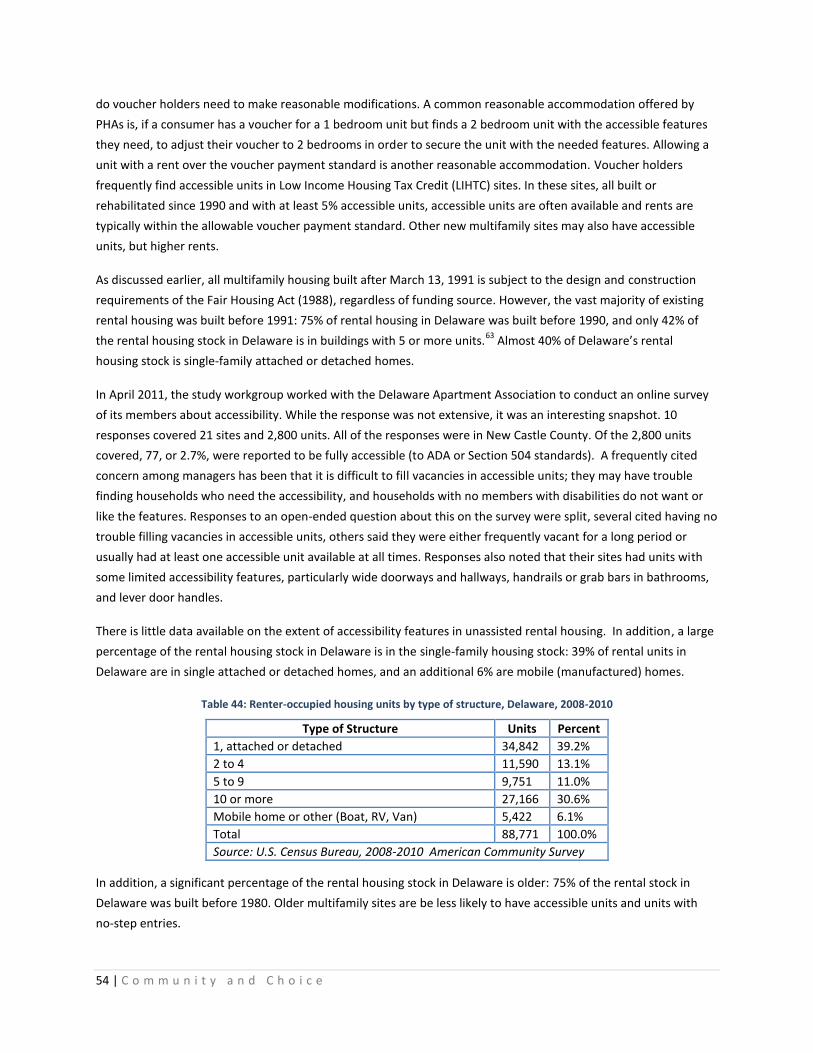
54 | C o m m u n i t y a n d C h o i c e
do voucher holders need to make reasonable modifications. A common reasonable accommodation offered by
PHAs is, if a consumer has a voucher for a 1 bedroom unit but finds a 2 bedroom unit with the accessible features
they need, to adjust their voucher to 2 bedrooms in order to secure the unit with the needed features. Allowing a
unit with a rent over the voucher payment standard is another reasonable accommodation. Voucher holders
frequently find accessible units in Low Income Housing Tax Credit (LIHTC) sites. In these sites, all built or
rehabilitated since 1990 and with at least 5% accessible units, accessible units are often available and rents are
typically within the allowable voucher payment standard. Other new multifamily sites may also have accessible
units, but higher rents.
As discussed earlier, all multifamily housing built after March 13, 1991 is subject to the design and construction
requirements of the Fair Housing Act (1988), regardless of funding source. However, the vast majority of existing
rental housing was built before 1991: 75% of rental housing in Delaware was built before 1990, and only 42% of
the rental housing stock in Delaware is in buildings with 5 or more units.63
Almost 40% of Delaware’s rental
housing stock is single-family attached or detached homes.
In April 2011, the study workgroup worked with the Delaware Apartment Association to conduct an online survey
of its members about accessibility. While the response was not extensive, it was an interesting snapshot. 10
responses covered 21 sites and 2,800 units. All of the responses were in New Castle County. Of the 2,800 units
covered, 77, or 2.7%, were reported to be fully accessible (to ADA or Section 504 standards). A frequently cited
concern among managers has been that it is difficult to fill vacancies in accessible units; they may have trouble
finding households who need the accessibility, and households with no members with disabilities do not want or
like the features. Responses to an open-ended question about this on the survey were split, several cited having no
trouble filling vacancies in accessible units, others said they were either frequently vacant for a long period or
usually had at least one accessible unit available at all times. Responses also noted that their sites had units with
some limited accessibility features, particularly wide doorways and hallways, handrails or grab bars in bathrooms,
and lever door handles.
There is little data available on the extent of accessibility features in unassisted rental housing. In addition, a large
percentage of the rental housing stock in Delaware is in the single-family housing stock: 39% of rental units in
Delaware are in single attached or detached homes, and an additional 6% are mobile (manufactured) homes.
Table 44: Renter-occupied housing units by type of structure, Delaware, 2008-2010
Type of Structure Units Percent
1, attached or detached 34,842 39.2%
2 to 4 11,590 13.1%
5 to 9 9,751 11.0%
10 or more 27,166 30.6%
Mobile home or other (Boat, RV, Van) 5,422 6.1%
Total 88,771 100.0%
Source: U.S. Census Bureau, 2008-2010 American Community Survey
In addition, a significant percentage of the rental housing stock in Delaware is older: 75% of the rental stock in
Delaware was built before 1980. Older multifamily sites are be less likely to have accessible units and units with
no-step entries.
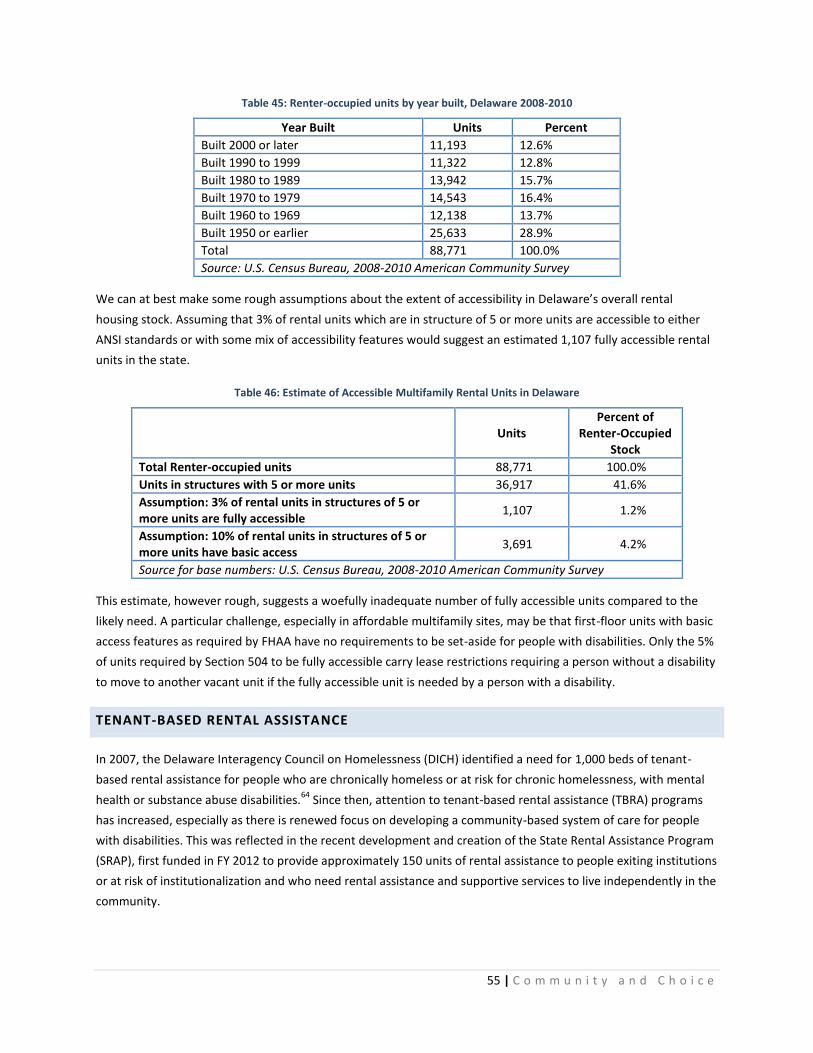
55 | C o m m u n i t y a n d C h o i c e
Table 45: Renter-occupied units by year built, Delaware 2008-2010
Year Built Units Percent
Built 2000 or later 11,193 12.6%
Built 1990 to 1999 11,322 12.8%
Built 1980 to 1989 13,942 15.7%
Built 1970 to 1979 14,543 16.4%
Built 1960 to 1969 12,138 13.7%
Built 1950 or earlier 25,633 28.9%
Total 88,771 100.0%
Source: U.S. Census Bureau, 2008-2010 American Community Survey
We can at best make some rough assumptions about the extent of accessibility in Delaware’s overall rental
housing stock. Assuming that 3% of rental units which are in structure of 5 or more units are accessible to either
ANSI standards or with some mix of accessibility features would suggest an estimated 1,107 fully accessible rental
units in the state.
Table 46: Estimate of Accessible Multifamily Rental Units in Delaware
Units Percent of
Renter-Occupied Stock
Total Renter-occupied units 88,771 100.0%
Units in structures with 5 or more units 36,917 41.6%
Assumption: 3% of rental units in structures of 5 or more units are fully accessible
1,107 1.2%
Assumption: 10% of rental units in structures of 5 or more units have basic access
3,691 4.2%
Source for base numbers: U.S. Census Bureau, 2008-2010 American Community Survey
This estimate, however rough, suggests a woefully inadequate number of fully accessible units compared to the
likely need. A particular challenge, especially in affordable multifamily sites, may be that first-floor units with basic
access features as required by FHAA have no requirements to be set-aside for people with disabilities. Only the 5%
of units required by Section 504 to be fully accessible carry lease restrictions requiring a person without a disability
to move to another vacant unit if the fully accessible unit is needed by a person with a disability.
TENANT-BASED RENTAL ASSISTANCE
In 2007, the Delaware Interagency Council on Homelessness (DICH) identified a need for 1,000 beds of tenant-
based rental assistance for people who are chronically homeless or at risk for chronic homelessness, with mental
health or substance abuse disabilities.64
Since then, attention to tenant-based rental assistance (TBRA) programs
has increased, especially as there is renewed focus on developing a community-based system of care for people
with disabilities. This was reflected in the recent development and creation of the State Rental Assistance Program
(SRAP), first funded in FY 2012 to provide approximately 150 units of rental assistance to people exiting institutions
or at risk of institutionalization and who need rental assistance and supportive services to live independently in the
community.
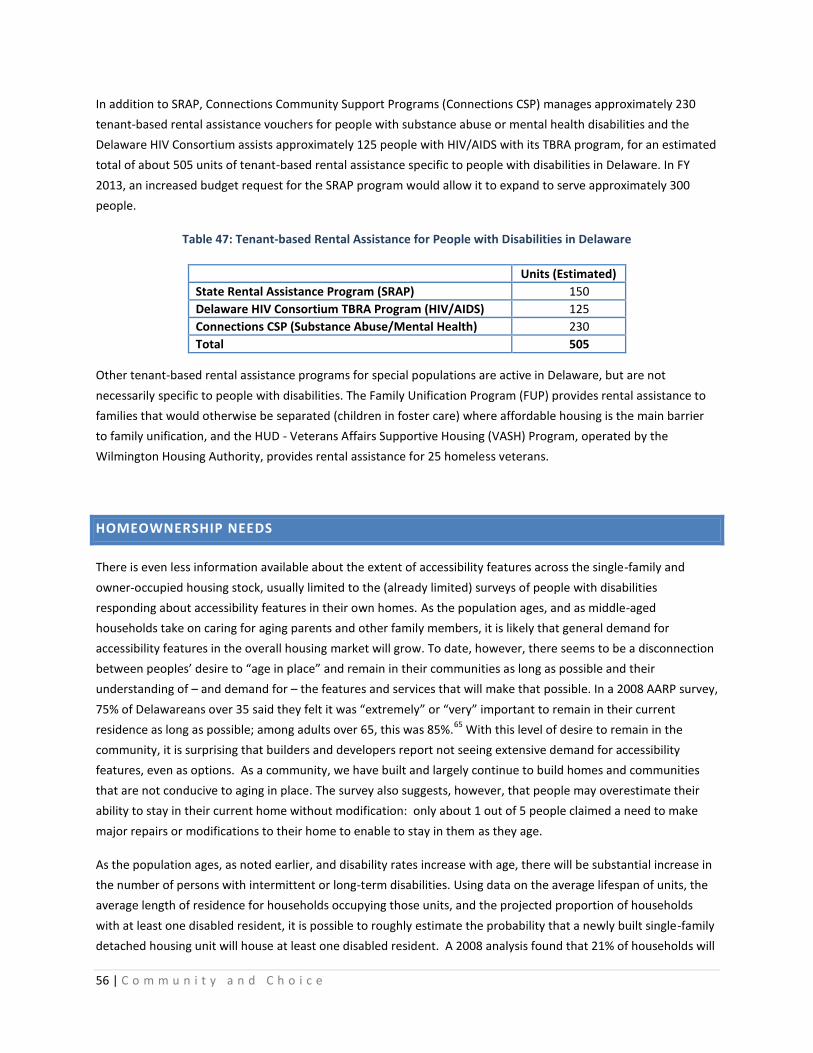
56 | C o m m u n i t y a n d C h o i c e
In addition to SRAP, Connections Community Support Programs (Connections CSP) manages approximately 230
tenant-based rental assistance vouchers for people with substance abuse or mental health disabilities and the
Delaware HIV Consortium assists approximately 125 people with HIV/AIDS with its TBRA program, for an estimated
total of about 505 units of tenant-based rental assistance specific to people with disabilities in Delaware. In FY
2013, an increased budget request for the SRAP program would allow it to expand to serve approximately 300
people.
Table 47: Tenant-based Rental Assistance for People with Disabilities in Delaware
Units (Estimated)
State Rental Assistance Program (SRAP) 150
Delaware HIV Consortium TBRA Program (HIV/AIDS) 125
Connections CSP (Substance Abuse/Mental Health) 230
Total 505
Other tenant-based rental assistance programs for special populations are active in Delaware, but are not
necessarily specific to people with disabilities. The Family Unification Program (FUP) provides rental assistance to
families that would otherwise be separated (children in foster care) where affordable housing is the main barrier
to family unification, and the HUD - Veterans Affairs Supportive Housing (VASH) Program, operated by the
Wilmington Housing Authority, provides rental assistance for 25 homeless veterans.
HOMEOWNERSHIP NEEDS
There is even less information available about the extent of accessibility features across the single-family and
owner-occupied housing stock, usually limited to the (already limited) surveys of people with disabilities
responding about accessibility features in their own homes. As the population ages, and as middle-aged
households take on caring for aging parents and other family members, it is likely that general demand for
accessibility features in the overall housing market will grow. To date, however, there seems to be a disconnection
between peoples’ desire to “age in place” and remain in their communities as long as possible and their
understanding of – and demand for – the features and services that will make that possible. In a 2008 AARP survey,
75% of Delawareans over 35 said they felt it was “extremely” or “very” important to remain in their current
residence as long as possible; among adults over 65, this was 85%.65
With this level of desire to remain in the
community, it is surprising that builders and developers report not seeing extensive demand for accessibility
features, even as options. As a community, we have built and largely continue to build homes and communities
that are not conducive to aging in place. The survey also suggests, however, that people may overestimate their
ability to stay in their current home without modification: only about 1 out of 5 people claimed a need to make
major repairs or modifications to their home to enable to stay in them as they age.
As the population ages, as noted earlier, and disability rates increase with age, there will be substantial increase in
the number of persons with intermittent or long-term disabilities. Using data on the average lifespan of units, the
average length of residence for households occupying those units, and the projected proportion of households
with at least one disabled resident, it is possible to roughly estimate the probability that a newly built single-family
detached housing unit will house at least one disabled resident. A 2008 analysis found that 21% of households will
57 | C o m m u n i t y a n d C h o i c e
have at least one disabled resident in 2050, using physical limitation (long-lasting mobility impairments) as the
measure of disability, and 7% when using the measure of self-care (Activities of Daily Living - ADLs) difficulty.66
There is a 60% probability that a newly built single family detached unit will house at least one disabled resident
during its expected lifetime using the first measure (physical limitation), and a 25% probability using the self-
care/ADLs measure. When visitors are accounted for, the probabilities rise to 91% and 53%.
DEMAND FOR ASSISTANCE WITH ACCESSIBILITY MODIFICATIONS
There are an estimated 6,155 homeowner households with at least one member with a mobility or self-care
disability with income below 50% of AMI (very low income) in Delaware; another 4,785 with income from 50-80%
of AMI (low income).67
These approximately 11,000 homeowner households with low incomes likely have limited
ability to invest in major accessibility renovations if needed.
Households with at least one member with a mobility or self-care disability make up 17% of very low-income
homeowner households in Delaware, and more than half (52%) of these households have housing problems (cost
burden, overcrowding or substandard conditions).68
Quality of life, the ability to get around inside and into their
homes, and ability to live independently for as long as possible could doubtless all be improved for many of these
households with accessibility modifications and/or other housing assistance.
For households who own their home and have a member with a disability, or elderly households, modifications
may be needed either at purchase or after, and are often costly if they are extensive and include a bathroom or
entrance. In the NHIS-Disability Supplement, respondents were asked about features that make it possible for
people with mobility impairments and users of wheeled mobility devices (wheelchairs or scooters) to get around in
their homes. About one third of people who reported using wheelchairs or scooters live in homes that are entirely
on one floor, compared to 44% of people with disabilities who do not use any mobility devices. Most people with
disabilities live in homes with a bedroom, bathroom and kitchen on one floor: 78.4% of wheelchair users and
88.5% of scooter users.69
A 2003 analysis of this data showed that unmet need for home accessibility features is substantial: about 13% of
wheelchair users reported needing automatic or easy-to-open doors and elevators, lifts, or stair glides, and 50% of
people who use wheelchairs must use steps or stairs to get into their home.70
About half reported difficulty
entering or exiting their homes – often due to steps and stairs, but can also include narrow doorways or steep or
irregular entryways. These data also report that about 40 percent of wheelchair users use a walker, and 35 percent
also use a cane, so they may be able to negotiate these barriers. Still, no-step entries would surely improve
mobility and safety for these users as well.
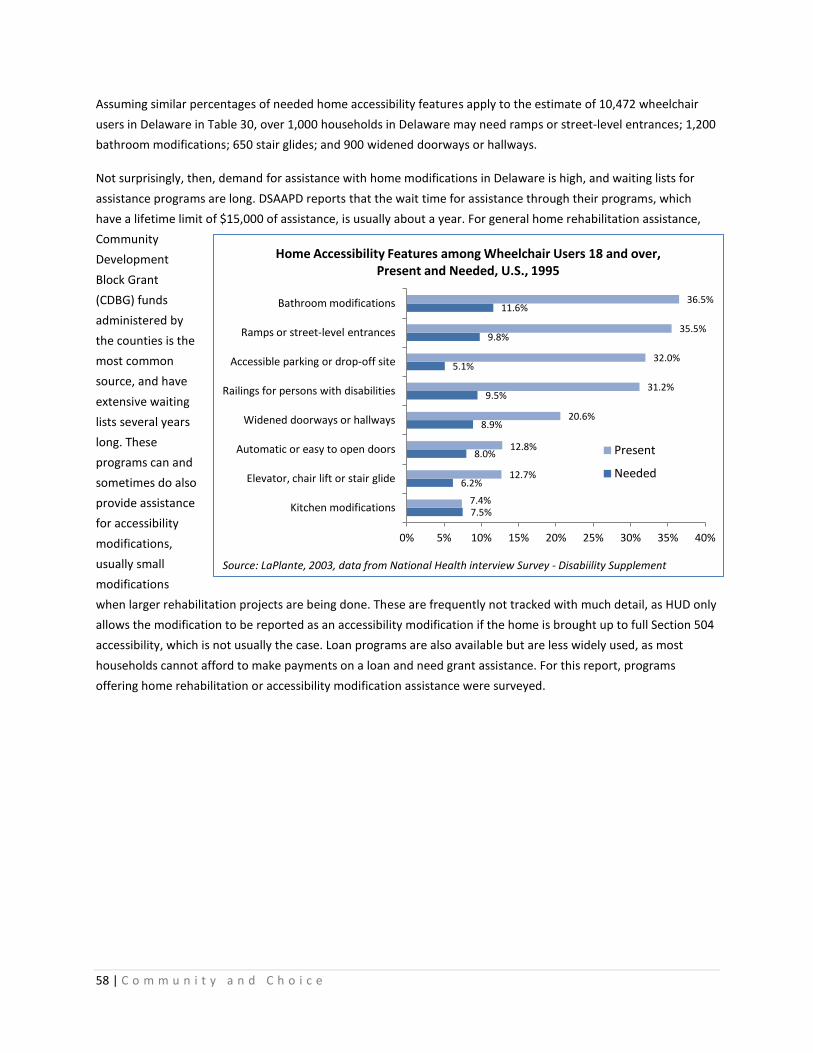
58 | C o m m u n i t y a n d C h o i c e
Assuming similar percentages of needed home accessibility features apply to the estimate of 10,472 wheelchair
users in Delaware in Table 30, over 1,000 households in Delaware may need ramps or street-level entrances; 1,200
bathroom modifications; 650 stair glides; and 900 widened doorways or hallways.
Not surprisingly, then, demand for assistance with home modifications in Delaware is high, and waiting lists for
assistance programs are long. DSAAPD reports that the wait time for assistance through their programs, which
have a lifetime limit of $15,000 of assistance, is usually about a year. For general home rehabilitation assistance,
Community
Development
Block Grant
(CDBG) funds
administered by
the counties is the
most common
source, and have
extensive waiting
lists several years
long. These
programs can and
sometimes do also
provide assistance
for accessibility
modifications,
usually small
modifications
when larger rehabilitation projects are being done. These are frequently not tracked with much detail, as HUD only
allows the modification to be reported as an accessibility modification if the home is brought up to full Section 504
accessibility, which is not usually the case. Loan programs are also available but are less widely used, as most
households cannot afford to make payments on a loan and need grant assistance. For this report, programs
offering home rehabilitation or accessibility modification assistance were surveyed.
7.5%
6.2%
8.0%
8.9%
9.5%
5.1%
9.8%
11.6%
7.4%
12.7%
12.8%
20.6%
31.2%
32.0%
35.5%
36.5%
0% 5% 10% 15% 20% 25% 30% 35% 40%
Kitchen modifications
Elevator, chair lift or stair glide
Automatic or easy to open doors
Widened doorways or hallways
Railings for persons with disabilities
Accessible parking or drop-off site
Ramps or street-level entrances
Bathroom modifications
Home Accessibility Features among Wheelchair Users 18 and over, Present and Needed, U.S., 1995
Present
Needed
Source: LaPlante, 2003, data from National Health interview Survey - Disabiility Supplement
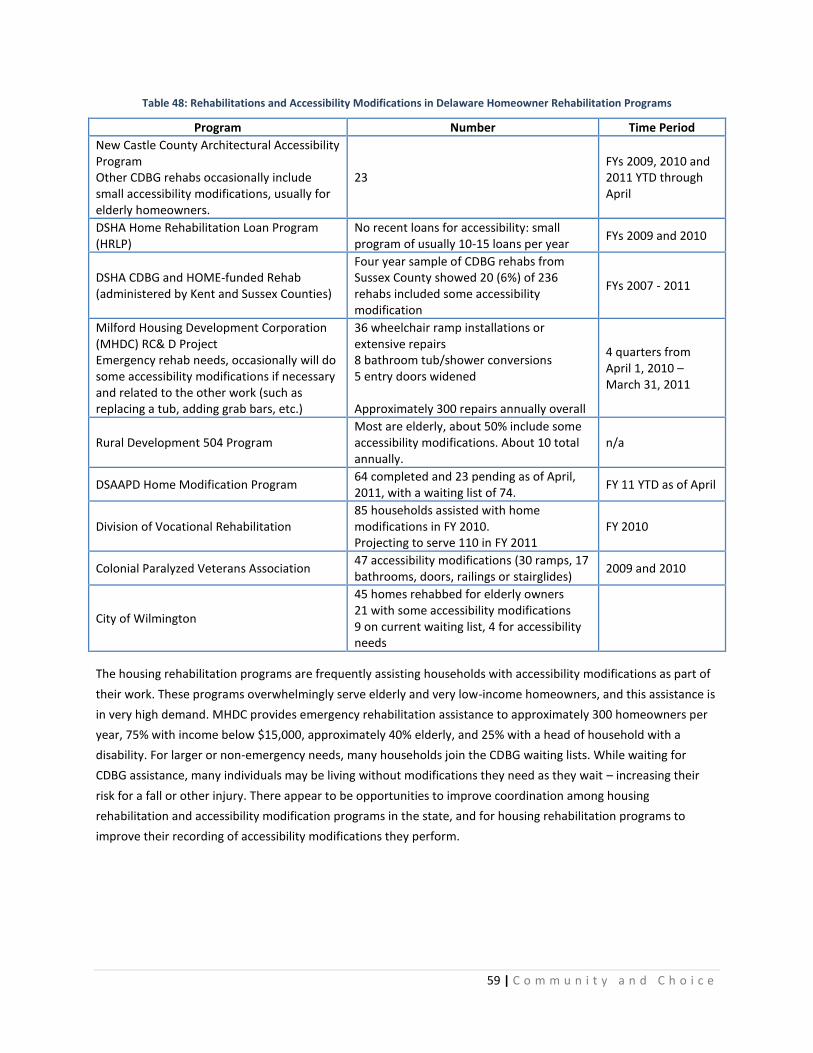
59 | C o m m u n i t y a n d C h o i c e
Table 48: Rehabilitations and Accessibility Modifications in Delaware Homeowner Rehabilitation Programs
Program Number Time Period
New Castle County Architectural Accessibility Program Other CDBG rehabs occasionally include small accessibility modifications, usually for elderly homeowners.
23 FYs 2009, 2010 and 2011 YTD through April
DSHA Home Rehabilitation Loan Program (HRLP)
No recent loans for accessibility: small program of usually 10-15 loans per year
FYs 2009 and 2010
DSHA CDBG and HOME-funded Rehab (administered by Kent and Sussex Counties)
Four year sample of CDBG rehabs from Sussex County showed 20 (6%) of 236 rehabs included some accessibility modification
FYs 2007 - 2011
Milford Housing Development Corporation (MHDC) RC& D Project Emergency rehab needs, occasionally will do some accessibility modifications if necessary and related to the other work (such as replacing a tub, adding grab bars, etc.)
36 wheelchair ramp installations or extensive repairs 8 bathroom tub/shower conversions 5 entry doors widened Approximately 300 repairs annually overall
4 quarters from April 1, 2010 – March 31, 2011
Rural Development 504 Program Most are elderly, about 50% include some accessibility modifications. About 10 total annually.
n/a
DSAAPD Home Modification Program 64 completed and 23 pending as of April, 2011, with a waiting list of 74.
FY 11 YTD as of April
Division of Vocational Rehabilitation 85 households assisted with home modifications in FY 2010. Projecting to serve 110 in FY 2011
FY 2010
Colonial Paralyzed Veterans Association 47 accessibility modifications (30 ramps, 17 bathrooms, doors, railings or stairglides)
2009 and 2010
City of Wilmington
45 homes rehabbed for elderly owners 21 with some accessibility modifications 9 on current waiting list, 4 for accessibility needs
The housing rehabilitation programs are frequently assisting households with accessibility modifications as part of
their work. These programs overwhelmingly serve elderly and very low-income homeowners, and this assistance is
in very high demand. MHDC provides emergency rehabilitation assistance to approximately 300 homeowners per
year, 75% with income below $15,000, approximately 40% elderly, and 25% with a head of household with a
disability. For larger or non-emergency needs, many households join the CDBG waiting lists. While waiting for
CDBG assistance, many individuals may be living without modifications they need as they wait – increasing their
risk for a fall or other injury. There appear to be opportunities to improve coordination among housing
rehabilitation and accessibility modification programs in the state, and for housing rehabilitation programs to
improve their recording of accessibility modifications they perform.
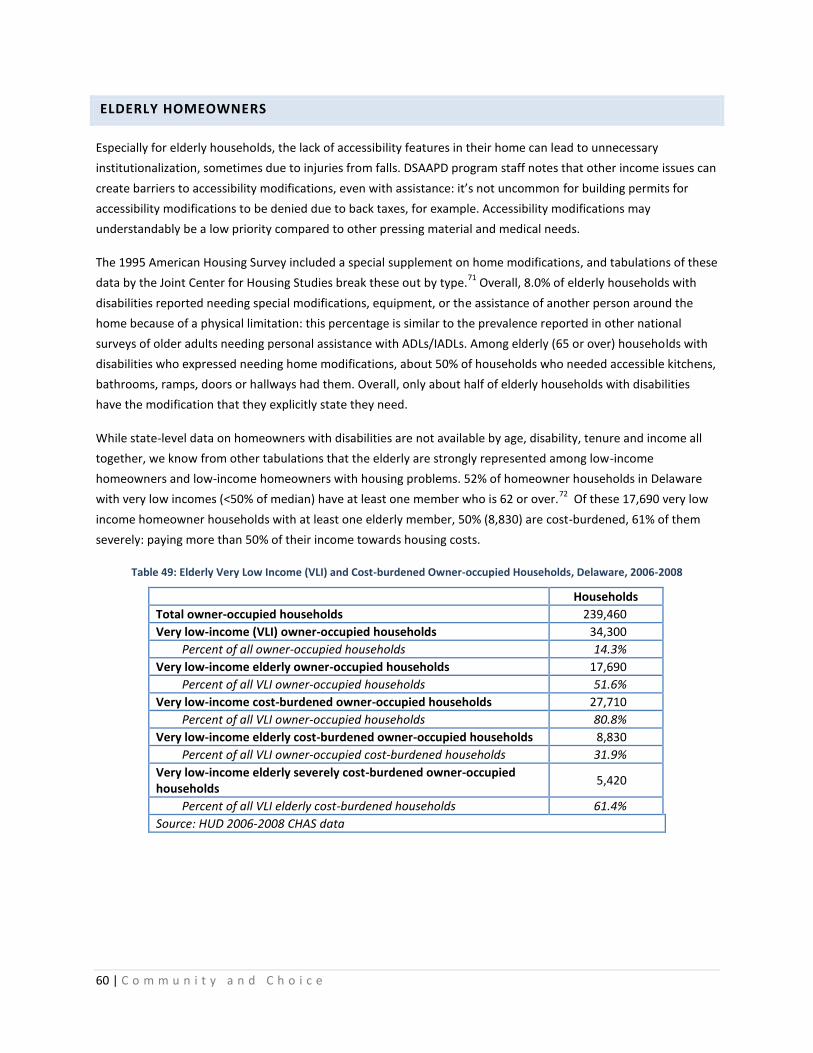
60 | C o m m u n i t y a n d C h o i c e
ELDERLY HOMEOWNERS
Especially for elderly households, the lack of accessibility features in their home can lead to unnecessary
institutionalization, sometimes due to injuries from falls. DSAAPD program staff notes that other income issues can
create barriers to accessibility modifications, even with assistance: it’s not uncommon for building permits for
accessibility modifications to be denied due to back taxes, for example. Accessibility modifications may
understandably be a low priority compared to other pressing material and medical needs.
The 1995 American Housing Survey included a special supplement on home modifications, and tabulations of these
data by the Joint Center for Housing Studies break these out by type.71
Overall, 8.0% of elderly households with
disabilities reported needing special modifications, equipment, or the assistance of another person around the
home because of a physical limitation: this percentage is similar to the prevalence reported in other national
surveys of older adults needing personal assistance with ADLs/IADLs. Among elderly (65 or over) households with
disabilities who expressed needing home modifications, about 50% of households who needed accessible kitchens,
bathrooms, ramps, doors or hallways had them. Overall, only about half of elderly households with disabilities
have the modification that they explicitly state they need.
While state-level data on homeowners with disabilities are not available by age, disability, tenure and income all
together, we know from other tabulations that the elderly are strongly represented among low-income
homeowners and low-income homeowners with housing problems. 52% of homeowner households in Delaware
with very low incomes (<50% of median) have at least one member who is 62 or over.72
Of these 17,690 very low
income homeowner households with at least one elderly member, 50% (8,830) are cost-burdened, 61% of them
severely: paying more than 50% of their income towards housing costs.
Table 49: Elderly Very Low Income (VLI) and Cost-burdened Owner-occupied Households, Delaware, 2006-2008
Households
Total owner-occupied households 239,460
Very low-income (VLI) owner-occupied households 34,300
Percent of all owner-occupied households 14.3%
Very low-income elderly owner-occupied households 17,690
Percent of all VLI owner-occupied households 51.6%
Very low-income cost-burdened owner-occupied households 27,710
Percent of all VLI owner-occupied households 80.8%
Very low-income elderly cost-burdened owner-occupied households 8,830
Percent of all VLI owner-occupied cost-burdened households 31.9%
Very low-income elderly severely cost-burdened owner-occupied households
5,420
Percent of all VLI elderly cost-burdened households 61.4%
Source: HUD 2006-2008 CHAS data
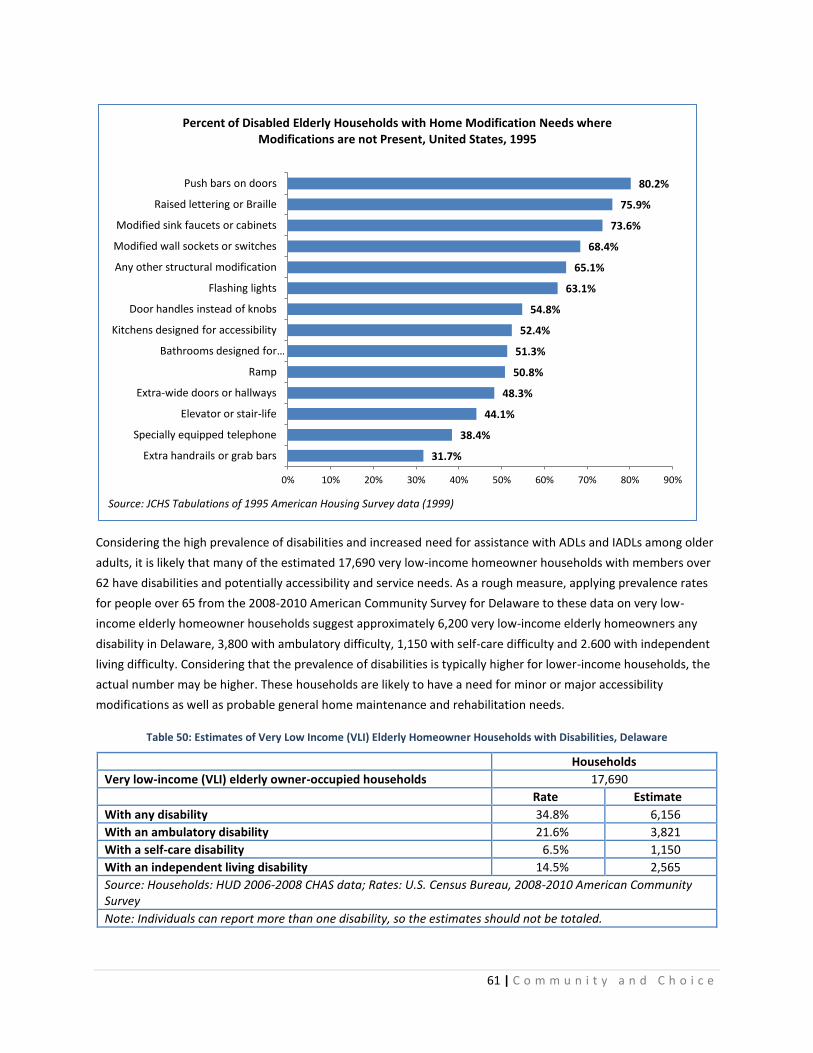
61 | C o m m u n i t y a n d C h o i c e
Considering the high prevalence of disabilities and increased need for assistance with ADLs and IADLs among older
adults, it is likely that many of the estimated 17,690 very low-income homeowner households with members over
62 have disabilities and potentially accessibility and service needs. As a rough measure, applying prevalence rates
for people over 65 from the 2008-2010 American Community Survey for Delaware to these data on very low-
income elderly homeowner households suggest approximately 6,200 very low-income elderly homeowners any
disability in Delaware, 3,800 with ambulatory difficulty, 1,150 with self-care difficulty and 2.600 with independent
living difficulty. Considering that the prevalence of disabilities is typically higher for lower-income households, the
actual number may be higher. These households are likely to have a need for minor or major accessibility
modifications as well as probable general home maintenance and rehabilitation needs.
Table 50: Estimates of Very Low Income (VLI) Elderly Homeowner Households with Disabilities, Delaware
Households
Very low-income (VLI) elderly owner-occupied households 17,690
Rate Estimate
With any disability 34.8% 6,156
With an ambulatory disability 21.6% 3,821
With a self-care disability 6.5% 1,150
With an independent living disability 14.5% 2,565
Source: Households: HUD 2006-2008 CHAS data; Rates: U.S. Census Bureau, 2008-2010 American Community Survey
Note: Individuals can report more than one disability, so the estimates should not be totaled.
31.7%
38.4%
44.1%
48.3%
50.8%
51.3%
52.4%
54.8%
63.1%
65.1%
68.4%
73.6%
75.9%
80.2%
0% 10% 20% 30% 40% 50% 60% 70% 80% 90%
Extra handrails or grab bars
Specially equipped telephone
Elevator or stair-life
Extra-wide doors or hallways
Ramp
Bathrooms designed for …
Kitchens designed for accessibility
Door handles instead of knobs
Flashing lights
Any other structural modification
Modified wall sockets or switches
Modified sink faucets or cabinets
Raised lettering or Braille
Push bars on doors
Percent of Disabled Elderly Households with Home Modification Needs where Modifications are not Present, United States, 1995
Source: JCHS Tabulations of 1995 American Housing Survey data (1999)
62 | C o m m u n i t y a n d C h o i c e
BASIC ACCESSIBILITY NEEDS ACROSS THE POPULATION AND HOUSING STOCK
As the population ages, and disability rates increase with age, there will be substantial increase in the number of
persons with intermittent or long-term disabilities. Nationally, an estimated 21% of households will have at least
one disabled resident in 2050, using physical limitation (long-lasting mobility impairments) as the measure of
disability, and 7% when using the measure of self-care (Activities of Daily Living - ADLs) difficulty. There is a 60%
probability that a newly built single family detached unit will house at least one disabled resident during its
expected lifetime using the first measure (physical limitation), and a 25% probability using the self-care/ADLs
measure. When visitors are accounted for, the probabilities rise to 91% and 53%.73
There are too many flexible variables and too little reliable, detailed data both about specific needs and the
existing housing stock to estimate a certain number or percentage of new housing units in Delaware which must
be accessible and at what level. However, the available data can lead us to several broad conclusions:
1) As the population ages, the likelihood that a housing unit will house people with disabilities, either
temporarily or long-term, increases significantly;
2) Accessibility features are a vital support for all people to age in place and live independently and in the
community as long as possible: by 2040, 30% of Delaware’s population will be over 60; and
3) With many varying levels of physical disability and functional limitations, full accessibility may not be
needed by all, but the greatest majority of people may find benefit from basic access (visitability) and
universal design features that can be supplemented with additional modifications as necessary: no-step
entries, wide doors and hallways, one accessible bathroom and bedroom.
ASSET BUILDING OPPORTUNITIES
As discussed earlier, there are numerous links between disability, especially severe disabilities, and
unemployment, low earnings, poverty, and material hardship. People with disabilities, particularly severe
disabilities, are especially likely to be in poverty long-term. Asset limits for critical income support programs
remain fairly low, further inhibiting people with disabilities’ ability to build assets.
For many households, homeownership is the most tangible opportunity to develop assets. People with disabilities
may also benefit from investing in assistive technology, which can be expensive depending on their needs;
modifications to a home they already own; purchasing a vehicle with modifications; or, like anyone else, being able
to invest in education, starting a small business, or homeownership. However, many people with disabilities are
starting out in such a financially precarious state and with such low incomes that there may be numerous steps
before they can consider or achieve homeownership or other major investments or purchases.
Low-income people face barriers to accessing the financial mainstream, these may be even more pronounced for
people with disabilities with the additional challenges they may face with transportation, communication, and
accessibility. A 2007 survey of taxpayers with disabilities found that 30% reported no savings or investments at all,
compared to 12 percent of taxpayers without disabilities.74
They are also less likely to even have a bank account: a
Government Accountability Office (GAO) report found that more than half of Supplemental Security income (SSI)
63 | C o m m u n i t y a n d C h o i c e
payments were made by check principally because the recipients did not have a bank account for direct deposit.
Two-thirds of SSI recipients reported being unbanked: having no relationship with a traditional bank.
Asset-building programs have gained momentum as strategy to help people escape poverty but have often not
considered the unique needs of people with disabilities. Attention to the need for asset-building strategies and
supports for people with disabilities has only increased in the past few years and formal research and program
evaluation efforts to document best practices are in their infancy. Research has shown that people with disabilities
save successfully in IDA programs, although they are able to save slightly less (in terms of an average net monthly
deposit) than their counterparts without disabilities. People who participated in asset-specific financial education
in conjunction with their IDA program were found to save more. Preliminary research suggests that extra outreach
to people with disabilities and specialized education programs as well as identification of physical access and
participation barriers is important.75
To help people with disabilities to develop assets (of which homeownership may be one opportunity), needs are
similar to those for all people with low incomes. These include:
- Raising asset limits for income and other support programs for people with disabilities;
- Improving access to the financial mainstream for banking, saving and investing;
- Expand IDA programs and include other major purchases that may be important for people with
disabilities, such as assistive technology or modified vehicles;
- Offer financial coaching and case management to help consumers weave asset-building programs
together and use them successfully.
OTHER ISSUES
FOCUS GROUP FEEDBACK
From April – May 2011, the study working group hosted six focus groups to gather feedback from consumers and
others to inform this report. Groups included:
Aging and Physical Disabilities
Intellectual/Developmental Disabilities
Substance Abuse/Mental Health
HIV/AIDS
Housing Developers and Service Providers
Foster Youth
Volunteer facilitators asked a series of general open-ended questions (see Appendix C for script) about housing for
people with disabilities, barriers to housing, the housing system in Delaware, and sources of information about
housing. There was also opportunity for open discussion. The groups were generally very well attended and
included many consumers as well as advocates and service providers. The groups proved a valuable source of
information for the report and provided feedback that influenced the review of needs but especially the report’s
64 | C o m m u n i t y a n d C h o i c e
recommendations. While much of the feedback was specific to the population, themes did emerge across many of
the groups.
In Delaware’s housing system and the housing system for people with disabilities, focus group participants
reported seeing a lack of coordination, and that the systems are exceedingly difficult for consumers to navigate.
Multiple waiting lists and confusing and varying eligibility criteria were particularly noted. While participants
frequently commented that the existing subsidized housing for people with disabilities is incredibly valuable and
improves the housing situation and security of many with disabilities in Delaware, the system also does not
acknowledge the importance of integration as well as accessibility and affordability.
In regards to accessing information about housing, a frequently repeated comment in almost all focus groups was
the fragmented system for information: there is no one person or place to explain all the options and point people
in the right direction the first time. Consumers frequently just get a barrage of phone numbers and lists of
organizations to sort through on their own. Luck and word of mouth from others often finally connect people to
the programs they need and are eligible for.
Persistent stigma associated with disabilities, especially HIV/AIDS and substance abuse and mental health
disabilities, was noted as a major barrier as housing discrimination and source of income discrimination continue.
The critical need for subsidies, either project-based or tenant-based, to reach extremely low incomes was a strong
point among developers and service providers. There is limited development capacity for the development of
specialized projects, and a key part of the problem is developers not understanding the market for housing for
people with disabilities, or its size and depth. This includes both more specialized housing, like permanent
supportive housing, as well as the overall need for basic accessibility features in new housing. To set aside units for
people with disabilities, supportive services, a source of subsidy, and a reliable source of referrals all must come
together for it to “work” for a developer, and these are not areas where they tend to have existing expertise.
Some common items noted in response to a question about what could be done differently in Delaware included:
Increase options – there should be a full continuum of housing opportunities. There is a lack of new
options and housing initiatives in Delaware, and some creative options have not been explored.
Congregate or clustered settings with peer support and independent apartments with tenant-based rental
assistance should both be options. Consumers must have meaningful choices: to live independently, with
family, with roommates, etc. Choices are meaningful when all are realistic, feasible options with sufficient
supports.
Improve coordination among PHAs to benefit consumers, especially unifying and opening waiting lists.
Accessing, getting on and monitoring multiple waiting lists and policies is a major challenge to consumers.
Aging in Place - Think more broadly and strategically about “aging in place” and increasing general (and
perceived) demand for universally designed/adaptable/visitable homes. We tend to think about it in
terms of helping people remain in the homes they have via modifications and services, but we must also
think about aging in place in terms of creating housing that is designed to facilitate aging in place.
Matching people to units – Managers report that they have difficulty filling units; consumer advocates
report that they cannot access accessible units. Access to real-time information on available units with
accessibility and other detail is needed, as is a steady stream of referrals if units are set-aside.
65 | C o m m u n i t y a n d C h o i c e
Transportation – transportation and isolation can be major challenges in more rural areas for group
homes and all community housing situations.
Finally, three major themes across all the groups were:
1) Accessibility and the supports required to live in the community are fluid and unique to the individual. A
range of responses is required to meet a range of needs: young to elderly, different combinations of
needs, different levels of service needs, different living situations;
2) Choices for consumers should include a variety of housing settings and situations. Congregate or clustered
settings which can provide informal peer support and independent apartments with tenant-based rental
assistance should both be options. People must have meaningful choices: to live independently, with
family, with roommates, etc. Choices are meaningful when all are realistic, feasible options with sufficient
supports.
3) Moving to living independently can be a major adjustment for individuals too, with new responsibilities,
new concerns, and household needs. Supporting people to transition to or remain in the community is not
as simple as just getting them into housing, but providing long-term support and ensuring that housing
and services are designed in such a way as to make living in the community realistic, sustainable, and
beneficial to the consumer.
FAIR HOUSING ISSUES AND DISCRIMINATION
In 2005, paired testing in the Chicago metropolitan area conducted as part of a HUD report on discrimination
found that people who were deaf or used wheelchairs when searching for housing to rent faced significant
discrimination.76
People who used the TTY relay system to inquire about advertised rental units were refused
service in one out of four calls. For testers using wheelchairs, one in every four disabled testers was told about
fewer units than similarly qualified testers with no disabilities and both received far less information about the
application process. One in six housing providers refused a request for a reasonable modification that they tester
said they would pay for and 19% of those with on-site parking refused to make the reasonable accommodation of
providing a designated accessible parking space for a wheelchair user. In addition, wheelchair users were denied
the opportunity to inspect any units in three of ten visits.
It should be no surprise, then, that the most common basis of fair housing complaints nationally is disability,
alleged in 44% of complaints filed under the Fair Housing Act and substantially equivalent state and local laws in
2009.77
The most common alleged issues are discrimination in the terms or conditions of the sale or rental of
property (55% of complaints), refusal to rent (24%), and failure to make a reasonable accommodation (22%). In
Delaware as well, disability is the most frequent alleged basis of discrimination, followed by race. 139 (42%) of 327
complaints from January 2000 – August 2010 in Delaware were disability related.78
About one third of the total
cases were located in the Cities of Wilmington or Dover. The Community Legal Aid Society (CLASI) also receives
complaints regarding alleged violations of the Fair Housing Act: between January 2009 and October 2010, CLASI
received 337 complaints alleging discrimination, 163 (48%) of these disability-related. 61 (82%) of the 74 cases
settled through CLASI over this time period involved alleged discrimination on the basis of disability.
66 | C o m m u n i t y a n d C h o i c e
RECOMMENDATIONS
Through the collection of national and state data and the qualitative feedback from the focus groups, the working
group identified four major areas (Accessibility, Affordability, Community Care, and Systems) where there are barriers
to housing for people with disabilities in Delaware and recommendations to address and improve each.
1. Accessibility: Increase the availability of and access to rental and homeownership opportunities with
accessibility features.
1.1. Improve real-time information on available accessible and affordable units for consumers.
1.2. Reduce fair housing barriers to affordable and accessible housing.
1.3. Establish a common vocabulary and set of standards for accessibility features in the affordable housing
industry.
1.4. Increase the prevalence of basic access features in all new homes.
1.5. Expand and coordinate resources for accessibility modifications for homeowners and homebuyers.
2. Affordability: Increase the availability of and access to affordable housing for people with disabilities.
2.1. Increase the availability of Low Income Housing Tax Credit (LIHTC) properties to people with disabilities,
especially those with extremely low incomes.
2.2. Expand incentives for basic access and universal design features in affordable housing.
2.3. Continue to invest in permanent supportive housing.
2.4. Improve asset-building opportunities for people with disabilities.
3. Community: Build a community-based system of care with a range of housing options.
3.1. Prioritize community-based care by redirecting resources from institutional care to community-based
services and providing for housing needs.
3.2. Ensure a range of housing options, meaningful choices and adequate supports for people to live and receive
care in the community.
3.3. Continue to develop and implement diversion and transition strategies to prevent institutionalization and
reduce readmissions.
3.4. Implement the Delaware policy statement Exemplary Practices in Discharge Planning, especially at all state-
operated institutions and prisons, to improve connections to permanent housing and prevent subsequent
homelessness.
3.5. Improve community planning to benefit community quality of life for all residents and foster real integration
for people with disabilities.
4. Systems: Improve the affordable housing and disabilities services systems that serve people with disabilities.
4.1. Continue to build connections between the affordable housing and disabilities services systems.
4.2. Improve triage assessment of consumers’ housing needs and statewide collection of data about these needs.
4.3. Foster and improve coordination among the state’s Public Housing Authorities (PHAs), both among
themselves and with providers of services to people with disabilities.
4.4. Improve the housing system’s communication with consumers and develop more accessible, centralized,
user-friendly sources of information.
4.5. Facilitate input about disability housing needs into the various housing and disability planning processes.
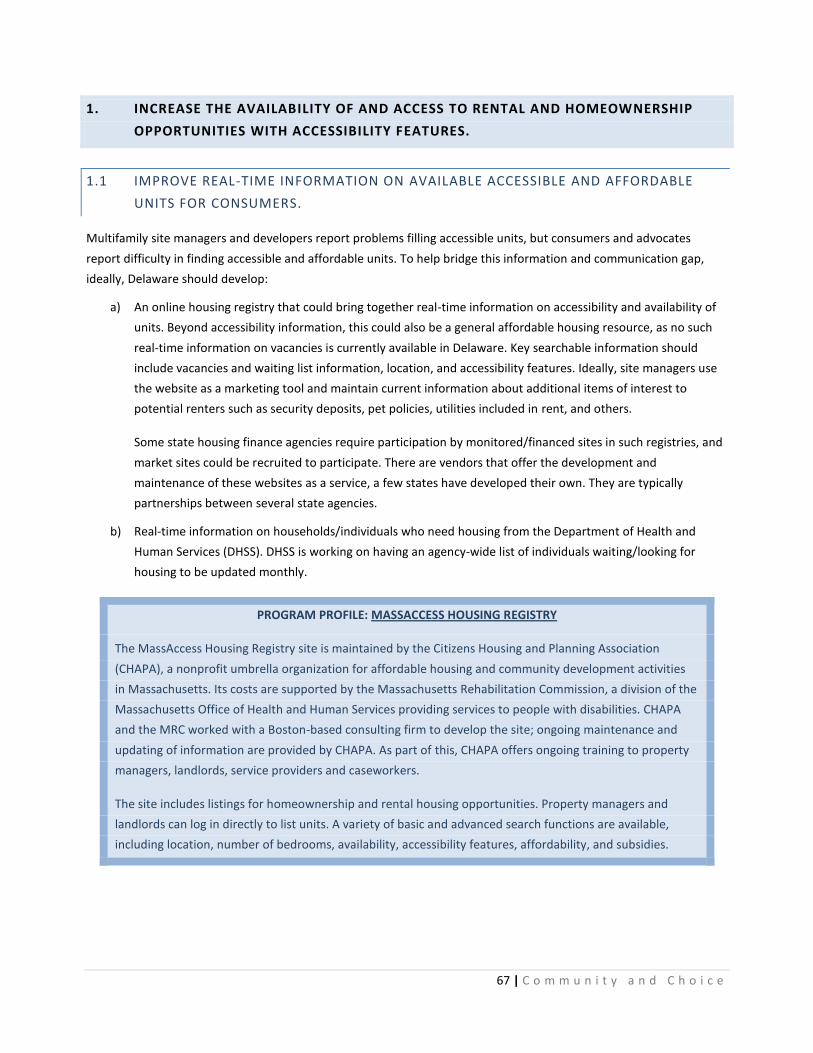
67 | C o m m u n i t y a n d C h o i c e
1. INCREASE THE AVAILABILITY OF AND ACCESS TO RENTAL AND HOMEOWNERSHIP
OPPORTUNITIES WITH ACCESSIBILITY FEATURES.
1.1 IMPROVE REAL-TIME INFORMATION ON AVAILABLE ACCESSIBLE AND AFFORDABLE
UNITS FOR CONSUMERS.
Multifamily site managers and developers report problems filling accessible units, but consumers and advocates
report difficulty in finding accessible and affordable units. To help bridge this information and communication gap,
ideally, Delaware should develop:
a) An online housing registry that could bring together real-time information on accessibility and availability of
units. Beyond accessibility information, this could also be a general affordable housing resource, as no such
real-time information on vacancies is currently available in Delaware. Key searchable information should
include vacancies and waiting list information, location, and accessibility features. Ideally, site managers use
the website as a marketing tool and maintain current information about additional items of interest to
potential renters such as security deposits, pet policies, utilities included in rent, and others.
Some state housing finance agencies require participation by monitored/financed sites in such registries, and
market sites could be recruited to participate. There are vendors that offer the development and
maintenance of these websites as a service, a few states have developed their own. They are typically
partnerships between several state agencies.
b) Real-time information on households/individuals who need housing from the Department of Health and
Human Services (DHSS). DHSS is working on having an agency-wide list of individuals waiting/looking for
housing to be updated monthly.
PROGRAM PROFILE: MASSACCESS HOUSING REGISTRY
The MassAccess Housing Registry site is maintained by the Citizens Housing and Planning Association
(CHAPA), a nonprofit umbrella organization for affordable housing and community development activities
in Massachusetts. Its costs are supported by the Massachusetts Rehabilitation Commission, a division of the
Massachusetts Office of Health and Human Services providing services to people with disabilities. CHAPA
and the MRC worked with a Boston-based consulting firm to develop the site; ongoing maintenance and
updating of information are provided by CHAPA. As part of this, CHAPA offers ongoing training to property
managers, landlords, service providers and caseworkers.
The site includes listings for homeownership and rental housing opportunities. Property managers and
landlords can log in directly to list units. A variety of basic and advanced search functions are available,
including location, number of bedrooms, availability, accessibility features, affordability, and subsidies.
68 | C o m m u n i t y a n d C h o i c e
1.2 REDUCE FAIR HOUSING BARRIERS TO AFFORDABLE AND ACCESSIBLE HOUSING.
Fair housing remains a barrier to securing and maintaining affordable and accessible housing for people with
disabilities. People with disabilities continue to face stigma and its effects in almost all areas, and discrimination in
housing persists.
There is an ongoing need for consumer and landlord education on tenant rights and fair housing laws. Multifamily site
managers report that many accessible units are occupied by households without disabilities, but it is not clear how
informed people are on their right to identify themselves as someone with a disability in order to receive fair housing
accommodations. Similarly, the public and housing providers need to be educated about the need for
accommodations for persons with disabilities. Education and training on fair housing responsibilities should be
tailored to specific audiences, such as multifamily managers, landlords, elected officials and local government leaders
and staff. The Division on Human Relations and its partners should continue and expand fair housing training in the
state.
Source of Income discrimination is a common fair housing issue for people with disabilities (SSI, SSDI, housing
assistance like HOPWA). Adding Source of Income as a protected class in the state’s fair housing laws would benefit
this population. While the City of Wilmington’s fair housing code protects “economic status”, it is not enforced. Well
over 100,000 families, people with disabilities and senior citizens rely heavily on some form of non-wage income in
Delaware (2005-2009 American Community Survey): non-wage income includes any lawful subsidy or benefit, such as
SSI, SSDI, TANF, child support, and other federal and state or local public assistance or rental assistance. Source of
income discrimination protection can be very important to protect voucher holders, improve voucher placement
rates, and improve housing opportunities for households relying on federal, state or local income supports or rental
assistance. At least 11 other states and many other jurisdictions protect source of income. Fair housing advocates and
legislators should consider and advance legislation to add source of income as a protected class in the state’s fair
housing laws.
For people with substance abuse or mental health disabilities, registry as a sex offender creates additional barriers as
it precludes their consideration for publicly subsidized housing. The Delaware Interagency Council on Homelessness
(DICH) worked with the Department of Corrections to develop a process to assess low-risk sex offenders, which would
allow for case-by-case assessments of these individuals rather than a blanket prohibition that prevents any
consideration of them. Implementation of this assessment process would improve housing options for people with
disabilities who are low-risk registered sex offenders and may be currently institutionalized, homeless, or at high risk
for institutionalization or homelessness. There may be opportunities to improve access for other offenders as well via
similar partnerships.
1.3 ESTABLISH A COMMON VOCABULARY AND SET OF STANDARDS FOR ACCESSIBILITY
FEATURES.
Throughout the course of our community outreach for this study, we received repeated comments as to the major
challenge posed by confused and differing understandings of key terms. Different agencies and developers use terms
differently and sometimes inconsistently. This is particularly an issue for “visitability” (referred to as basic access in
this report) and “universal design”, where no clear regulated standards exist. For adaptability and accessibility, HUD’s
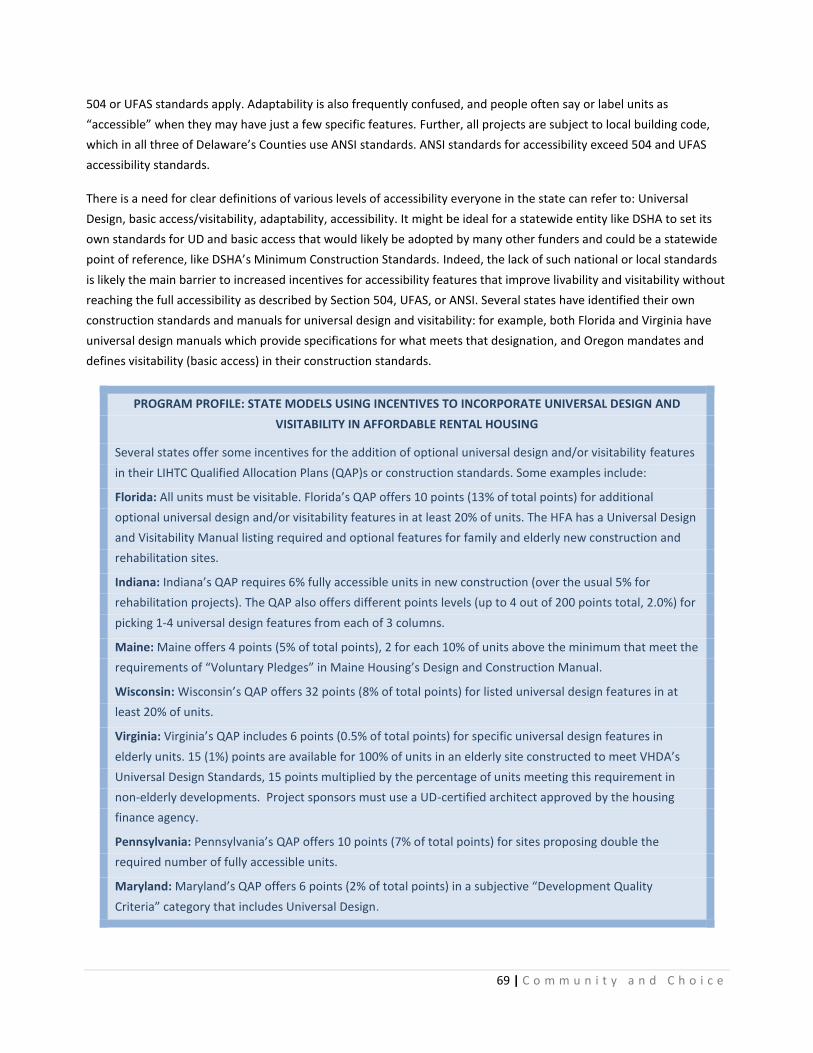
69 | C o m m u n i t y a n d C h o i c e
504 or UFAS standards apply. Adaptability is also frequently confused, and people often say or label units as
“accessible” when they may have just a few specific features. Further, all projects are subject to local building code,
which in all three of Delaware’s Counties use ANSI standards. ANSI standards for accessibility exceed 504 and UFAS
accessibility standards.
There is a need for clear definitions of various levels of accessibility everyone in the state can refer to: Universal
Design, basic access/visitability, adaptability, accessibility. It might be ideal for a statewide entity like DSHA to set its
own standards for UD and basic access that would likely be adopted by many other funders and could be a statewide
point of reference, like DSHA’s Minimum Construction Standards. Indeed, the lack of such national or local standards
is likely the main barrier to increased incentives for accessibility features that improve livability and visitability without
reaching the full accessibility as described by Section 504, UFAS, or ANSI. Several states have identified their own
construction standards and manuals for universal design and visitability: for example, both Florida and Virginia have
universal design manuals which provide specifications for what meets that designation, and Oregon mandates and
defines visitability (basic access) in their construction standards.
PROGRAM PROFILE: STATE MODELS USING INCENTIVES TO INCORPORATE UNIVERSAL DESIGN AND
VISITABILITY IN AFFORDABLE RENTAL HOUSING
Several states offer some incentives for the addition of optional universal design and/or visitability features
in their LIHTC Qualified Allocation Plans (QAP)s or construction standards. Some examples include:
Florida: All units must be visitable. Florida’s QAP offers 10 points (13% of total points) for additional
optional universal design and/or visitability features in at least 20% of units. The HFA has a Universal Design
and Visitability Manual listing required and optional features for family and elderly new construction and
rehabilitation sites.
Indiana: Indiana’s QAP requires 6% fully accessible units in new construction (over the usual 5% for
rehabilitation projects). The QAP also offers different points levels (up to 4 out of 200 points total, 2.0%) for
picking 1-4 universal design features from each of 3 columns.
Maine: Maine offers 4 points (5% of total points), 2 for each 10% of units above the minimum that meet the
requirements of “Voluntary Pledges” in Maine Housing’s Design and Construction Manual.
Wisconsin: Wisconsin’s QAP offers 32 points (8% of total points) for listed universal design features in at
least 20% of units.
Virginia: Virginia’s QAP includes 6 points (0.5% of total points) for specific universal design features in
elderly units. 15 (1%) points are available for 100% of units in an elderly site constructed to meet VHDA’s
Universal Design Standards, 15 points multiplied by the percentage of units meeting this requirement in
non-elderly developments. Project sponsors must use a UD-certified architect approved by the housing
finance agency.
Pennsylvania: Pennsylvania’s QAP offers 10 points (7% of total points) for sites proposing double the
required number of fully accessible units.
Maryland: Maryland’s QAP offers 6 points (2% of total points) in a subjective “Development Quality
Criteria” category that includes Universal Design.
70 | C o m m u n i t y a n d C h o i c e
1.4 INCREASE THE PREVALENCE OF BASIC ACCESSIBILITY FEATURES IN ALL NEW HOMES.
Across the population, the most widespread need is not always for fully accessible units, but units with basic
accessibility features that allow for basic access and essential needs. While there are already requirements for fully
accessible units in publicly funded rental sites and visitability/basic access in all first-floor multifamily units, there are
no requirements at all for the type of housing that makes up the vast majority of the housing stock – single family
attached and detached homes. There are two separate approaches with different goals:
1) To ensure some (5%) fully accessible units are built and set aside for people with disabilities in multifamily
rental sites constructed with public funds and first-floor units in multifamily sites, regardless of tenure, must
have basic access features.
2) To ensure that as many homes as possible, across the entire housing stock, are initially built to be as
accessible as possible for everyone by incorporating a few key features to ensure basic access: one no-step
entry, at least 32 inches of clear passage through the entire first floor, and at least a half-bathroom on the
first floor.
Additionally, either a bedroom on the first floor or a room that can be used as a bedroom can also be included as a
basic access feature. Basic accessibility features will meet the needs of many with physical disabilities, ensure
visitability from friends and family with disabilities, and account for needs that arise from temporary disabilities. In
single-family homes, retrofitting costs for entryways, clear passage and basic bathroom facilities can be very costly to
retrofit.
There are several examples of both mandates and voluntary programs to increase the number of homes built with
basic access or visitability features. From a production standpoint, mandatory programs are far more successful in
producing units than voluntary programs, although mandatory programs are often strongly opposed by related
industry groups and subsequently difficult to enact. In some states and jurisdictions, a compromise has been applying
a mandate only to homes built with public support or financing. However, depending on the size of the jurisdiction
and how much new construction of single-family homes are developed with federal funds, this approach typically
affects very few homes compared to overall development in a community.
Other voluntary programs offer incentives such as fee waivers or streamlined permitting, or certificates that help
prospective homebuyers identify homes built to certain accessibility standards. Others, such as California’s statewide
requirement, simply mandate that developers offer a set of accessibility features as options to homebuyers to ensure
they are available and increase the likelihood that buyers will choose to include them.
The state of Delaware and jurisdictions within the state should consider incentive programs to increase the number of
homes built for basic access or visitability. We understand there are various regional differences and challenges in the
type of foundation commonly used and other considerations, but we should encourage builders, advocates and local
officials to work together to identify creative solutions to these challenges while still developing homes with
accessibility features to meet the needs of the state’s population. In particular, basic access should be incorporated in
proposals to provide incentives for projects that meet other goals, such as access to transportation, affordability, and
mixed income or mixed use development.
Improved understanding of the need for accessible housing both within the housing industry and among consumers
would also likely increase the prevalence of basic access features in new homes. The vast majority of new homes are
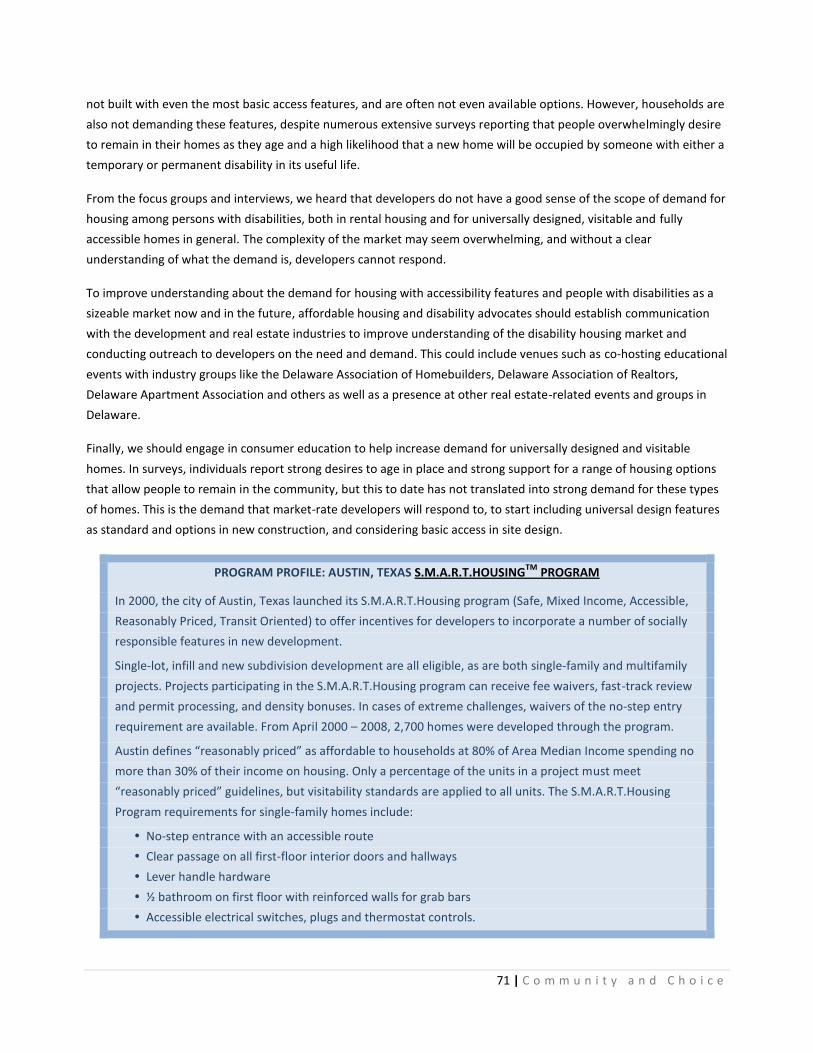
71 | C o m m u n i t y a n d C h o i c e
not built with even the most basic access features, and are often not even available options. However, households are
also not demanding these features, despite numerous extensive surveys reporting that people overwhelmingly desire
to remain in their homes as they age and a high likelihood that a new home will be occupied by someone with either a
temporary or permanent disability in its useful life.
From the focus groups and interviews, we heard that developers do not have a good sense of the scope of demand for
housing among persons with disabilities, both in rental housing and for universally designed, visitable and fully
accessible homes in general. The complexity of the market may seem overwhelming, and without a clear
understanding of what the demand is, developers cannot respond.
To improve understanding about the demand for housing with accessibility features and people with disabilities as a
sizeable market now and in the future, affordable housing and disability advocates should establish communication
with the development and real estate industries to improve understanding of the disability housing market and
conducting outreach to developers on the need and demand. This could include venues such as co-hosting educational
events with industry groups like the Delaware Association of Homebuilders, Delaware Association of Realtors,
Delaware Apartment Association and others as well as a presence at other real estate-related events and groups in
Delaware.
Finally, we should engage in consumer education to help increase demand for universally designed and visitable
homes. In surveys, individuals report strong desires to age in place and strong support for a range of housing options
that allow people to remain in the community, but this to date has not translated into strong demand for these types
of homes. This is the demand that market-rate developers will respond to, to start including universal design features
as standard and options in new construction, and considering basic access in site design.
PROGRAM PROFILE: AUSTIN, TEXAS S.M.A.R.T.HOUSINGTM
PROGRAM
In 2000, the city of Austin, Texas launched its S.M.A.R.T.Housing program (Safe, Mixed Income, Accessible,
Reasonably Priced, Transit Oriented) to offer incentives for developers to incorporate a number of socially
responsible features in new development.
Single-lot, infill and new subdivision development are all eligible, as are both single-family and multifamily
projects. Projects participating in the S.M.A.R.T.Housing program can receive fee waivers, fast-track review
and permit processing, and density bonuses. In cases of extreme challenges, waivers of the no-step entry
requirement are available. From April 2000 – 2008, 2,700 homes were developed through the program.
Austin defines “reasonably priced” as affordable to households at 80% of Area Median Income spending no
more than 30% of their income on housing. Only a percentage of the units in a project must meet
“reasonably priced” guidelines, but visitability standards are applied to all units. The S.M.A.R.T.Housing
Program requirements for single-family homes include:
No-step entrance with an accessible route
Clear passage on all first-floor interior doors and hallways
Lever handle hardware
½ bathroom on first floor with reinforced walls for grab bars
Accessible electrical switches, plugs and thermostat controls.
72 | C o m m u n i t y a n d C h o i c e
1.5 EXPAND AND COORDINATE RESOURCES FOR ACCESSIBILITY MODIFICATIONS FOR
HOMEOWNERS AND HOMEBUYERS.
There is an ongoing need for accessibility rehab assistance, as well as value in improving the coordination among
housing rehab programs (like those funded by federal Community Development Block Grant (CDBG) funding) and
accessibility-specific rehab programs operated by non-housing agencies. Housing rehab programs are often
performing some accessibility modifications, and households getting accessibility modifications from accessibility-
specific programs may have other housing rehab needs. Recommendations in this area include:
a) Consider opportunities to improve coordination between housing rehab and accessibility rehab programs.
The partnership between CDBG and the Weatherization Program in Kent and Sussex Counties, where
Weatherization addresses windows, doors and related items and CDBG addresses other needed repairs, may
be a good model to evaluate.
b) Expand resources for housing rehab and accessibility rehab programs.
c) Identify sources of assistance for homebuyers at the point of purchase, including ranging up to moderate
income. This may be a small niche need, but families with accessibility needs looking to purchase a home are
often very limited by the available stock. A loan that could be used at the point of purchase to make
modifications would be a useful resource.
d) Review and develop standard building requirements for accessibility items (like ramps) between the counties
and municipalities. Operators of rehab programs complain about very different and sometimes burdensome
requirements varying from county to county, which can significantly impact costs.
e) Many single-family homes are vacant, distressed, or entering the rental housing stock due to the foreclosure
crisis and struggling housing market. As we seek ways to keep homes in active use and reduce vacancies, we
should explore incentives to encourage investors to rehabilitate single family homes for accessible rentals.
As the result of the implementation of the Diamond State Health Plan Plus (DSHP Plus) initiative on April 1, 2012,
individuals eligible for Medicaid who are enrolled in the Elderly and Disabled Medicaid Waiver will transition to a
managed care system of delivering long-term care services. The new benefit package will include home modifications
to help people remain in their homes. Many individuals who need wheelchair ramps and are currently on waiting lists
will get them more quickly through DSHP Plus; this may also be an opportunity to coordinate accessibility needs with
other home rehabilitation needs.
Government jurisdictions funding housing rehabilitation and accessibility modifications and nonprofit service
providers of both rehabilitation and accessibility modifications should come together to examine their program
offerings, eligibility requirements, funding, and needs for their services to explore new ways to coordinate and
improve services to consumers.
73 | C o m m u n i t y a n d C h o i c e
2. INCREASE THE AVAILABILITY OF AND ACCESS TO AFFORDABLE HOUSING FOR PEOPLE
WITH DISABILITIES.
2.1 INCREASE THE AVAILABILITY OF LOW INCOME HOUSING TAX CREDIT (LIHTC)
PROPERTIES TO PEOPLE WITH DISABILITIES, ESPECIALLY THOSE WITH EXTREMELY LOW
INCOMES.
For the past two decades, the federal Low Income Housing Tax Credit (LIHTC) program has been the nation’s main
vehicle for providing financing for the new construction and rehabilitation of affordable rental housing. 10-year tax
credits are allocated to the states based on their population; states complete and release an annual Qualified
Allocation Plan (QAP) which governs how the credits are awarded. Developers who are awarded credits then sell those
credits for equity that contributes to making the housing affordable. Then, the housing must remain affordable for a
15-year Compliance Period and subsequent 15-year Extended Use Period. However, the program targets households
at 50 – 60% of Area Median Income, and it is very challenging to create housing for lower-income households using
the LIHTC without another source of rental subsidy. Units in LIHTC sites with other sources of project-based subsidy,
not set aside for people with disabilities, are in extremely high demand and may be difficult for people with disabilities
to access.
On some occasions, the LIHTC has been used to support projects targeted to people with disabilities. However, the
development of set-aside, non-integrated units for people with disabilities is no longer an appropriate strategy. The
settlement agreement between the State of Delaware and the U.S. Department of Justice does not permit the
clustering of people with known disabilities in non-integrated housing, which not only prevents the further
development of such housing but also may challenge the viability of some already existing affordable clustered
housing. In the future, set-aside housing for people with disabilities should be fully integrated into typical housing in
multifamily developments.
One broad strategy to increase the availability and affordability of LITHC sites to people with disabilities and extremely
low incomes is to enact policies requiring, or strongly encouraging, the integration of units for persons with
disabilities. These units need not all be fully accessible but ideally should all be subsidized. There are numerous models
nationally for successfully encouraging the development and set-aside of units for persons with disabilities. Successful
programs also develop the structures to ensure that a steady stream of referrals are available, that consumers are
connected to any supportive services they need to live independently, and units are affordable to the target
population.
There are many ways this can be structured, and many models available. Some states simply require that a percentage
of all units be set aside for people with disabilities with extremely low incomes, and expect developers to identify how
to make the units affordable or make available some state-level source of project-based subsidy for those units.
Instead of a requirement, some states simply provide incentives for developers to include and set-aside affordable
units. In either case, most also require a Memorandum of Understanding between the developer and a local agency
who will be responsible for providing referrals and ensuring that residents have services.
74 | C o m m u n i t y a n d C h o i c e
PROGRAM PROFILE: USING THE LOW INCOME HOUSING TAX CREDIT TO REACH
PEOPLE WITH DISABILITIES AND EXTREMELY LOW INCOMES
In recent years, many states have expanded their efforts to use the LIHTC to create housing for households
with disabilities and extremely low incomes, particularly integrated into regular multifamily projects.
Several states (Alaska, Pennsylvania, North Carolina, Michigan, Minnesota and Massachusetts) require a
set-aside – usually 10% - of units for persons with disabilities and/or extremely low incomes in all projects.
Others simply provide incentives via points or set-asides in their QAP for projects that commit to set-aside a
certain percent of units for these populations. There are many variables, including if and how the units are
made affordable to extremely low income levels, partnership requirements for referrals and services, and
additional accessibility requirements. Many use a “Local Lead Agency” model, where projects are required
to have a partnership with a local lead agency that will handle referrals and ensure supportive services.
Some examples include:
North Carolina: A National Model
North Carolina’s efforts to provide integrated housing for people with disabilities have been a national
model. Since 2002, over 2,200 integrated units of supportive housing have been created. The North
Carolina QAP requires that 10% of units to be targeted to persons with disabilities or the homeless. Project
based subsidies for set-aside units are available through the state’s Key Program. Applicants must
demonstrate a partnership with a local lead agency (to coordinate referrals and services) and a targeting
plan that must be reviewed and certified by the North Carolina Department of Health and Social Services.
Connecticut: Incentives and Provisions for Extra Support
Connecticut’s QAP allows applicants to request up to a 5% increase in developer fee for projects where at
least 15% of units are targeted to special needs populations, to provide services or an internal rent subsidy.
Points are available based on the percentage of units that the project has set-aside, units affordable to
households below 25% of Area Median Income, or sites where the applicant commits to give priority to
recipients of housing assistance and services funded through the Connecticut Supportive Housing PILOTS
Initiative (a program similar to Delaware’s SRAP).
Pennsylvania: A Mandate and Partnership
Pennsylvania’s QAP requires that 10% of units be affordable to households at 20% of Area Median Income,
and half of these units must be accessible. The developer must have an agreement with an agency to
provide referrals and services. The QAP also allows developers of projects setting aside units for persons
with disabilities to increase their developer fee up to 5% to fund an internal rent subsidy or services. In
addition, the HFA has a partnership with the state Office of Mental Health and Substance Abuse Services
(OMHSAS) and has dedicated $50 million in capital and operating subsidy for integrated units for this
population. Tenants must be consumers of OMHSAS services, and the projects use a Local Lead Agency
model through County-based mental health departments to provide referrals and services.
75 | C o m m u n i t y a n d C h o i c e
Upcoming changes to the federal Section 811 program, which was previously used almost exclusively for the
development and housing subsidies for group homes and apartments only for people with disabilities, will further
emphasize integration and coordinating support for special needs units with mainstream affordable housing
development programs at the federal level. As part of these changes, new resources will be available for housing
finance agencies and nonprofit developers to integrate subsidized units for persons with disabilities in multifamily
developments.
A new stream of competitive funds would allow housing finance agencies (HFAs) to use project-based Section 811
subsidies in new or rehabbed multifamily sites financed through the LIHTC, HOME, or housing trust funds. This
program is expected to be available in 2012: to apply, state housing finance agencies must demonstrate extensive
partnerships with the state Medicaid agency to ensure referrals and services.
Nationally, nonprofit developers will also be able to apply directly to HUD for new Section 811 subsidies to provide
project-based subsidy for up to 25% of units in a site for new projects. Delaware’s LIHTC Qualified Allocation Plan
(QAP) should encourage developers to pursue this option, although should consider limiting the maximum percentage
of units to 20%, the level identified as a maximum in the State of Delaware’s recent settlement with the Department
of Justice.
Again, in both of these scenarios, Delaware’s housing and disability services systems must be prepared to ensure that
people get the support they need to live independently and that residents and rental assistance if necessary are
available to ensure units can be filled.
PROGRAM PROFILE: SECTION 811
Section 811 is a critical HUD program that assists the lowest income people with long-term disabilities to
live independently in the community by providing affordable housing linked with voluntary services and
supports. Historically, this has been limited to group homes and other communal settings, such as
independent living apartments where 100% of units are targeted to people with disabilities. Over the 20
years since its creation, Section 811 has created over 30,000 units for people with disabilities, with a
median income of $9,204. Delaware has approximately 300 Section 811 subsidized units.
Over the past decade, the Section 811 program has become less effective, creating fewer than 1,000 new
units per year through an outdated law that did not reflect best practices in disability or supportive housing
policies (Technical Assistance Collaborative). The Frank Melville Supportive Housing Investment Act of 2010,
passed in December 2010, made substantial changes to modernize the program. The legislation also
authorizes $300 million in funding for each fiscal year from 2011 to 2015. The reformed Section 811
program is expected to dramatically increase production by providing stronger incentives to leverage other
sources of capital for 811 units and authorizing state housing finance agencies to create integrated
supportive housing units in affordable rental housing developments with Section 811 Project Based Rental
Assistance. The legislation also permanently transfers Section 811 funded vouchers to the Housing Choice
Voucher program and ensures that other Housing Choice Vouchers appropriated by Congress for non-
elderly people with disabilities continue to be used for that purpose.
76 | C o m m u n i t y a n d C h o i c e
In the new Section 811 program, the Capital Advance/PRAC option remains available for group homes and
independent living apartments, but two new options are created and will be prioritized:
Multifamily Capital Advance/PRAC Option: Nonprofit developers may apply to HUD for Section 811 Capital
Advance gap financing and renewable PRAC for up to 25% of units in a multifamily project. Processing
authority for this program may be delegated to the states from HUD field offices.
Housing Finance Agency (HFA) Model: HFAs may apply to HUD for Section 811 PRAC funds, for 5 year
renewable contracts. HFAs then select projects to include Section 811 units, with criteria for eligible
projects. As above, no more than 25% of units in a property may be set-aside. HFAs must have a written
agreement with their state’s Health and Human Services/Medicaid agency on the target populations,
outreach and referral methods, and supportive service commitments. This will provide operating subsidies
for PRAC units where capital advance funds are not needed: the goal of this new program is to take
advantage of units that are already made affordable to 50 or 60% of AMI with LIHTC, HOME, or state
housing funds.
For more information, visit the Technical Assistance Collaborative’s online resource center on Section 811.
2.2 EXPAND INCENTIVES FOR BASIC ACCESS AND UNIVERSAL DESIGN FEATURES IN
AFFORDABLE HOUSING.
Broader, more flexible, levels of accessibility allow for the greater use of units by households with various accessibility
needs, short-term accessibility needs, and visitation by friends and family with disabilities. Funders should add
incentives for different levels of accessibility – such as livability (“universal design”) and basic access (“visitability”) –
not just full-Section 504-compliance.
In 2010, the Delaware State Housing Authority added five points (out of 135) to its Qualified Allocation Plan (QAP), for
utilization of Low Income Housing Tax Credits, in order to reward applications that proposed to increase the
percentage of units built to full accessibility standards beyond the required 5% to 10, 15 or 20%. In that year, all of the
successfully ranked projects sought these points, for a total of 46 out of 355 units developed fully accessible (13%).
Response in 2011 was similarly strong. In addition to the 5% fully accessible requirement for all projects, Delaware law
requires that all first-floor multifamily new construction units with state funding be adaptable to full accessibility.
While the above incentives for additional fully accessible units have been successful, the QAP and most other
affordable housing funding programs in Delaware do not currently include incentives for the inclusion of other basic
access or additional universal design features. We would encourage public and private funders to consider incentives
to encourage additional basic access and universal design features to meet the needs of households that do not
require full accessibility but could benefit from some additional accessibility features and to improve access and
functionality for all households. In addition, basic access should be considered not only for typical rental and
homeownership units, but also permanent supportive housing and other situations, and developers should be allowed
to budget and pay for these modifications.

77 | C o m m u n i t y a n d C h o i c e
2.3 CONTINUE TO INVEST IN PERMANENT SUPPORTIVE HOUSING.
Best practices in the provision of housing for people who are homeless call for a focus on permanent supportive
housing as the primary means to reduce and end chronic homelessness. Permanent Supportive Housing balances the
provisions of affordable housing with access to services that help people regain their ability to live independently and
become self-sufficient. As reflected in the Delaware Interagency Council on Homelessness (DICH)’s ten‐year plan to
end chronic homelessness (2007), additional investment in new housing should be targeted to permanent supportive
housing as opposed to adding to the state’s system of emergency shelters and transitional housing programs.
Permanent supportive housing allows us to focus our resources and services on preventing and ending homelessness
for Delawareans.
Similarly, federal strategies are focused on permanent supportive housing for individuals and families who are
chronically homeless or at risk for chronic homelessness. Most recently, the federal government has called for an
increase in services related to homelessness prevention, diversion, and rapid re-housing, as appropriate, for other
populations.
Even as the state increases its attention to community‐based housing models, there will still be a need and a role for
permanent supportive housing that focuses on those with the most complex challenges. Delaware should continue to
prioritize permanent supportive housing as one of our important responses to homelessness, including investing in its
development and ensuring operating and/or rental subsidies to support it. There is also some existing housing stock
which is affordable and accessible – developed using the model program described below - that may be at risk. The
terms of the state’s settlement agreement with the U.S. Department of Justice preclude the use of congregate
housing, even when tenants have rights of tenancy and their own units within a congregate arrangement. The housing
and disability communities need to look for ways to preserve this housing stock for other populations who could
benefit from using it.
PROGRAM PROFILE: SAN FRANCISCO DEPARTMENT OF PUBLIC HEALTH
DIRECT ACCESS TO HOUSING (DAH) PROGRAM
The Direct Access to Housing Program (DAH) emerged from a City-sponsored planning process in San
Francisco that brought together consumers, providers, and local policy makers to address the critical need
for safe, affordable housing for people with mental illness, particularly those exiting institutions in the
mental health, substance abuse, and criminal justice systems. DAH is an initiative of the Housing and Urban
Health (HUH) unit within the Community Programs Division of the San Francisco Department of Public
Health. HUH funds and controls access to housing units that are master leased from private owners and
infused with supportive services and professional property management.
Established in 1998, the DAH program provides permanent housing with on-site supportive services for
approximately 600 formerly homeless adults, most of whom have concurrent mental health, substance use,
and chronic medical conditions, in nine Single Room Occupancy (SRO) hotels and one licensed residential
care facility.
78 | C o m m u n i t y a n d C h o i c e
Finding appropriate housing for individuals who have few family or community connections is a major
challenge for staff of these public or community-based organizations. Without access to a stable residential
environment, the trajectory for chronically homeless individuals is invariably up the “acuity ladder” causing
further damage and isolation to the individual and driving health care costs through the roof. The DAH
program was developed in an attempt to reverse this trajectory through the provision of supportive
housing directly targeted toward “high-utilizers” of public health system. DAH is a “low threshold” program
that accepts single adults into permanent housing directly from the streets, shelter, acute hospital or long-
term care facilities. Residents are accepted into the program with active substance abuse disorders, serious
mental health conditions, and/or complex medical problems.
Outcomes: The main goal of the DAH program is to provide housing to a group of people that have rarely, if
ever, maintained stable housing as adults. Since opening the first DAH site in 1998, almost two-thirds of the
residents have remained housed in the DAH program. Of the remaining one-third of the residents who
moved out of the program, half moved to other permanent housing. Use of healthcare services and
resources has also been tracked as a measure of success for the program. While overall healthcare use
remained fairly consistent in terms of outpatient visits, the most expensive and crisis-level situations -
emergency department use and inpatient episodes were both reduced significantly after housing
placement.
2.4 IMPROVE ASSET-BUILDING OPPORTUNITIES FOR PEOPLE WITH DISABILITIES.
Many people with disabilities, facing poverty or very low incomes, have few opportunities to develop assets and to
purchase a home. Homeownership is one of the key tax-advantaged means lower income households use to build
assets and save. However, the services and systems to support asset-building and home purchase are also not always
well-connected to disability services systems, and certainly people with disabilities can and might like to purchase a
home. Beyond buying a home, asset-building has many other benefits, and people with disabilities may need or
choose to use their savings for many other purposes: education, small business, accessibility modifications for existing
homeowners, or purchase of major assistive technology items. Homeownership counseling and financial literacy
programs should all ensure they are actively marketing to and reaching people with disabilities with their services.
Asset limits for key support programs such as Social Security and Medicaid are a major barrier to asset development
for people with disabilities. Individual Development Account (IDA) savings are usually excluded from these asset limits.
Existing IDA programs should allow people with disabilities to save for other major investments, such as a modified
vehicle, home modifications, communications or other assistive technology. The Delawareans Save IDA program
matches savings up to $1,500 per person or $3,000 per household, at $1.50 for each $1.00 saved. Homeownership,
education and training and small business investments are all eligible savings goals. CFED’s Assets & Opportunity
Scorecard lists DE’s IDA policy as weak or minimal, mainly due to the lack of state funding for IDA programs.79
In
addition, the Delawareans Save program, like many IDAs, does not allow some expenses that might be beneficial for
people with disabilities and ultimately allow them to increase their incomes and savings, such as assistive technology
or a modified vehicle.

79 | C o m m u n i t y a n d C h o i c e
The IRS estimates that $1 billion in Earned Income Tax Credit (EITC) refunds go unclaimed by taxpayers with disabilities
annually. Among low-income filers, taxpayers with disabilities also access free tax preparation services at a lower rate
(1.6%) than taxpayers with no disability (3.5%).
Ultimately, asset-building opportunities for people with disabilities will remain severely limited until changes in asset
policies in the federal income support programs occur. There currently two large related policy proposals, the SSI
Savers Act, which would raise asset limits for SSI to $5,000 per individual and $7,500 per couple, index the limits to
inflation, and exclude some funds in qualified tuition programs, education savings accounts, and IDAs; and Achieving a
Better Life Experience (ABLE) Act of 2009, which would create new tax-advantaged ABLE accounts to allow people
with disabilities and their families to save for investments and their care while maintaining eligibility for crucial
benefits. 80
At the state and local level, efforts to improve asset-building opportunities for people with disabilities include:
Improving access to financial literacy, credit repair, asset-building, homeownership counseling and tax
preparation programs for people with disabilities;
Developing specialized loan and savings programs to assist people with disabilities to purchase assistive
technology they need;
Expanding financial case management/coaching services to include specialized assistance to help people with
disabilities weave together the various work incentive and asset-building programs while maintaining
eligibility for the federal income supports they need.
80 | C o m m u n i t y a n d C h o i c e
3. BUILD A COMMUNITY-BASED SYSTEM OF CARE WITH A RANGE OF HOUSING
OPTIONS.
3.1 CONTINUE TO PRIORITIZE COMMUNITY-BASED CARE BY REDIRECTING RESOURCES
FROM INSTUTIONAL CARE TO COMMUNITY-BASED SERVICES AND PROVIDING FOR
HOUSING NEEDS.
People can and should have choices about their environment, activities, services, work, socialization, and
employment: systems must provide services in the least restrictive setting possible. While the process of
deinstitutionalization has been long in progress nationwide, it has sometimes been at a slow pace, with significant
numbers of people remaining in institutions nationally and ongoing preference for institutional settings and systems
that continue to steer people to institutional care. Creating permanent change means transforming systems to truly
prioritize community care and building collaboration across disciplines, sectors and departments.
Providing services to people in their homes and the community not only improves quality of life, but also can reduce
costs. Institutional care is exceedingly expensive, and a growing and aging population will mean a growing number of
people with disabilities, including those who need extensive supportive services. This is happening as demands on
federal and state budgets are especially high. But over time, as systems are more permanently reformed to prioritize
community services and resources can be redirected, serving people in their homes and communities will allow us to
meet growing needs and serve more people while containing costs.
DHSS has already taken many steps towards the development and strengthening of community-based systems of care
for people with disabilities in Delaware. This includes:
Changes to Medicaid managed care and waiver programs to increase the use of home and community based
services (HCBS);
The Money Follows the Person program, a joint program of DSAAPD and the Division of Medicaid and
Medical Assistance to expand nursing home to community transition efforts that was recently extended
through 2016;
Development of the Delaware Aging and Disability Resource Center (ADRC) as a one-stop access point for
aging and disability information and resources, options counseling and service enrollment support;
Efforts to reduce the census in state-run long-term care facilities, including an independent assessment of the
current residents of the five facilities operated by DHSS and a successful diversion program to reduce future
admissions by helping people referred for LTC to remain in the community; and
Numerous initiatives in the Division of Substance Abuse and Mental Health (DSAMH) to expand and enhance
Delaware’s community mental health services, including expanding Mobile Crisis Services and walk-in
centers, supported employment, expand Assertive Community Treatment (ACT) and Intensive Case
Management (ICM) teams, and changes to oversight of psychiatric hospitalizations.
Across DHSS, these initiatives should be continued to support community-based care for people with disabilities and
maximum independence and integration in the community.
81 | C o m m u n i t y a n d C h o i c e
Finally, community-based care may mean different resources, strategies, and housing options for different
populations. For people with developmental and intellectual disabilities, supports for families, family caregivers, and
long-term plans for care as families age is especially critical. For people with substance abuse and mental health
disabilities, developing the capacity of the state’s community mental health system and assessing systems for
institutional biases to prevent unnecessary institutionalization, reduce readmissions, and prevent late-stage
interventions more likely to result in institutionalization are important strategies. For all populations, building a
community-based system of care must include planning and providing for housing needs and housing assistance,
whether through tenant-based assistance, housing assistance added to the package of services from current
community-based care providers, or other methods appropriate for different populations.
3.2 ENSURE A RANGE OF HOUSING OPTIONS, MEANINGFUL CHOICES AND ADEQUATE
SUPPORTS FOR PEOPLE TO LIVE AND RECEIVE CARE IN THE COMMUNITY.
A beneficial housing system will offer a diversity of forms. In particular, housing strategies for persons with disabilities
should ensure a continuum of housing options and choices, from supports that allow living with family, to
independent living in community, to congregate settings, or seeking homeownership when appropriate. There is no
one size fits all, and a range of different housing options must be available and affordable in order for people with
disabilities to have meaningful choices about their housing situation.
Three key strategies to ensuring a range of housing options are to 1) continue to expand tenant-based rental
assistance programs; 2) identify new models to build a continuum of housing options for people with disabilities; and
3) ensure a full range of community supports to create and sustain successful transitions to community care.
Tenant-based Rental Assistance (TBRA)
Delaware should continue to expand programs providing rental assistance for households to rent units in the private
market. Model programs in Delaware have been very successful to date, including the Delaware HIV Consortium’s
longstanding TBRA program for people living with HIV/AIDS and vouchers for people with substance abuse and mental
health disabilities managed by Connections and supported through the Continuum of Care. The successful
development and implementation of the State Rental Assistance Program (SRAP) should continue this trend. While
SRAP was funded to serve 150 households in FY 2011, the need for the program far outstrips available resources. As of
February 2012, DHSS has a pool of 95 SRAP applicants who are still in need of assistance and have not yet been
submitted to DSHA because DHSS has nearly exhausted the number of vouchers reserved for their clients. TBRA will
be in even higher demand as DHSS and the homeless assistance system continue to work to help people with
disabilities to live in the community, transitioning people who are currently in long-term care facilities or congregate
settings.
New Models
To ensure a continuum of housing options and settings, the housing and disability services systems should consider
new models to broaden the housing opportunities available for people with disabilities and ensure the opportunity to
live in the least restrictive and most integrated setting possible. Supports for shared housing and roommate matching
in particular are tools that people with disabilities and advocates identified as potentially useful. Actions to support
82 | C o m m u n i t y a n d C h o i c e
these may include developing programs to link potential roommates and ensuring that various program guidelines
allow for roommate or shared housing situations.
In the Community Living Program model being implemented by United Cerebral Palsy in Delaware, individuals share a
home but live very independently: arranging their own personal care and transportation services and choosing how
they spent their time in employment or volunteer activities. Instead of the round-the-clock staffing often seen in
group homes, a part time house manager will assist with the maintenance of the house, resolving issues, and be a
resource for residents as necessary. It is initially targeting individuals transitioning from institutions.
Supports for New Renters
Another aspect of prioritizing community care is recognizing the full range of supports needed for a successful and
sustainable transition. For people with disabilities who have never – or not for a long time – lived independently,
acquiring and maintaining rental housing (applications, security deposits, lining up resources, utilities, basic household
needs, and navigating transportation) can be just as challenging as moving to homeownership and require ongoing
support in managing new responsibilities and addressing new concerns.
There are some existing examples and recent steps in this area in Delaware. The Assertive Community Treatment
(ACT) model employed by DSAMH and service providers in the substance abuse/mental health field in Delaware
includes these services, and in late 2011 DHSS engaged in two new contracts with nonprofit service providers to
provide housing placement services to 180 DHSS clients statewide. Additionally, the case management provided
through the Money Follows the Person (MFP) program provides a model of intensive case management that includes
assistance locating, securing and transitioning to rental housing. DHSS, DSHA and service providers should explore the
possibility of a network of housing case managers to offer housing counseling for rental housing similar to
homeownership counseling.
PROGRAM PROFILES: ROOMMATE MATCHING AND LISTING SITES AND SERVICES
FindMyRoommate
FindMyRoommate is an online matching service for people with disabilities who are looking for roommates
with whom to share housing and companionship, and possibly paid services and natural supports. It can be
used by people with disabilities independently or with a support person.
People who are looking for a place to live and people who have a home they want to share can create
listings where they describe what they have or what they are looking for. The site offers a closed email
system to facilitate initial contacts between people listing and responding to listings. The service does not
directly match roommates, but provides the means for people to locate each other.
To date, FindMyRoommate has listings services for Minnesota, Connecticut and Indiana, it is available to
states on an annual subscription basis. States may customize the terminology, search features and other
aspects of the site for their state.
Housemate Match
Housemate Match is a program of the Marcus Jewish Community Center of Atlanta (Georgia). The service
pairs older adults who have room in their homes with adults who are seeking a roommate.
83 | C o m m u n i t y a n d C h o i c e
HMM connects two people who are looking to combine personal and financial resources. HMM provides
rooms to rent for those who prefer to share a home rather than living alone and for those who choose to
remain in their home and age in place. This service is more direct: people who are interested, begin by
scheduling an interview with a housing counselor, who helps check references, verify income, and match
roommates. They may be homeowners or renters who wish to share space: Homeowners must be seniors,
and home seekers must be adults with some type of income. Rent and payment arrangements are made
between the individuals.
In 2005, Housemate Match also added an In-Home Caregiving program, which specifically addresses the
needs of homeowners requiring non-medical caregiving services in their homes in exchange for reduced
rent. Services may include things such as transportation, light housekeeping, and meal preparation, and
caregivers are screened and have reference and background checks.
3.3 CONTINUE TO DEVELOP AND IMPLEMENT DIVERSION AND TRANSITION STRATEGIES TO
PREVENT INSTITUTIONALIZATION AND REDUCE READMISSIONS.
A key strategy of prioritizing community care is preventing institutionalization in the first place and reducing
subsequent readmissions. Systems should be structured to quickly redirect people at risk of institutionalization to the
least restrictive community based setting and connect them to the necessary supports to ensure they can remain in
the community as long as possible. These efforts have already proved very successful: in February 2011, DHSS
implemented a diversion program to provide community support to individuals who have been referred for long-term
care. From February to September 2011, 115 out of 139 individuals (83%) who had been referred for long-term care
were able, with connections to services, to remain in the community. Continuing to expand such programs and
ensuring that all populations are covered will help people with disabilities to remain in the community as long as
possible and avoid unnecessary institutionalization by connecting them with appropriate supports.
For the elderly and people with physical disabilities, transitions between care settings and at hospital discharge are
points when people are particularly vulnerable. Care Transitions Delaware is undertaking major initiatives to
strengthen transitions between care settings to improve health outcomes and promote individual choice. DSAAPD is
partnering with hospital and other organizations to build upon existing discharge planning strategies to reduce
hospital readmissions and prevent unnecessary nursing home placements.
For people with psychiatric and substance abuse crises, avoiding involuntary commitment is a strategy to help people
avoid entering the cycle of institutionalization. Hotlines, mobile crisis teams and walk-in crisis centers all allow people
in crisis to receive services without being removed from their homes or community. In a new partnership, DSAMH’s
Mobile Crisis services have partnered with some local hospitals to evaluate consumers with psychiatric and substance
abuse crises in their Emergency Departments to reduce the number of involuntary commitments and create
immediate links to community behavioral health services. Assertive Community Treatment (ACT) teams also provide a
range of coordinated services to people in their homes and communities, and have been found to reduce
hospitalization rates and durations of stays and in assisting people to access mainstream resources to secure and
sustain housing and employment. ACT teams have been the center of Delaware’s mental health service delivery
system since 1988, but there is a need for more funding and services, as well as a need to ensure that diversion
strategies and coordinated services to support community care are in place for all populations.
84 | C o m m u n i t y a n d C h o i c e
3.4 IMPLEMENT THE DELAWARE POLICY STATEMENT EXEMPLARY PRACTICES IN
DISCHARGE PLANNING, ESPECIALLY AT STATE-OPERATED INSTITUTIONS AND PRISONS,
TO IMPROVE CONNECTIONS TO PERMANENT HOUSING AND PREVENT SUBSEQUENT
HOMELESSNESS.
The 2007 Delaware Interagency Council on Homelessness (DICH) 10-Year Plan to End Chronic Homelessness identified
the lack of consistent and applied formal discharge policies and procedures as a major barrier to preventing and
ending homelessness. The plan recommended a collaborative group come together to review and strengthen
discharge and aftercare planning strategies to ensure that appropriate linkages with housing and community-based
care are in place to prevent subsequent homelessness. As stated in the 10-Year Plan, “No person should leave a
hospital, nursing home, or residential treatment program without an identified transitional or permanent place to live
(not an emergency shelter), the necessary entitlements or employment income to pay for it, and the supportive
services needed to sustain it.”81
In 2008, a joint committee of the Delaware Interagency Council on Homelessness and Commission on Community
based Alternatives for People with Disabilities followed through on this recommendation and produced a Delaware
policy statement, Exemplary Practices in Discharge Planning. While the development of uniform policies was a major
step forward, efforts to ensure statewide implementation are ongoing. Implementing effective, uniform discharge
planning is a critical task to preventing unnecessary repeat institutionalizations, homelessness, and ensuring that
people are transitioned to stable, permanent housing with the supports they need to remain in the community. It is
especially important that these standards are implemented in state-supported institutions and prisons, which are
most likely to be serving people at high risk of homelessness.
3.5 IMPROVE COMMUNITY PLANNING TO BENEFIT COMMUNITY QUALITY OF LIFE FOR ALL
RESIDENTS AND FOSTER REAL INTEGRATION FOR PEOPLE WITH DISABILITIES.
Integration into the community means more than just the physical location of a home. It must include access to public
or private transportation that is accessible, within reasonable range of a person’s home, and affordable, and allow for
involvement in community activities such as work, volunteer and civic engagement, recreation, worship and shopping.
Transportation can be particularly challenging and isolating, and connections to transportation are especially
important for housing for persons with disabilities. Transportation is a critical and expensive variable which can
undermine an affordable housing opportunity. People with disabilities are among those (also including the elderly,
children, and the poor) who are effectively disenfranchised by habitual automobile-oriented planning and
development. When housing is not wisely located in areas with convenient public transportation this exacerbates all
the problems that may make daily life difficult for people with disabilities.
Beyond transportation, for community-based solutions to work, there must be adequate community. People with
disabilities and their allies recognize unresolved conflicts between goals, such as independent living, on the one hand,
the need for support, on the other, without which life can be accompanied by a tremendous sense of isolation and
anxiety. Compact, mixed use development can provide for more walkable neighborhoods, convivial streetscapes, and
a diversity and energy that are welcoming and reassuring, helping to foster human contact and mutual aid. The
National Council on Disability identifies the following features for livable communities:
85 | C o m m u n i t y a n d C h o i c e
Provides affordable, appropriate, accessible housing;
Ensures accessible, affordable, reliable safe transportation;
Adjusts the physical environment for inclusiveness and accessibility;
Provides work, volunteer and educational opportunities;
Ensures access to key health care and support services; and
Encourages participation in civic, cultural, social and recreational activities.
The Poverty and Race Research Action Council also provides a checklist for affirmatively furthering fair housing in
programs such as the Department of Housing and Urban Development (HUD)’s new Sustainable Communities
Initiative. Among the recommendations are:
Develop a regional fair share housing plan with target numbers for each municipality, based on HUD’s worst
case needs housing study, since this is the "most basic way of applying fair housing principles to a
comprehensive regional plan." (The current Fair Share Housing Measure developed by the Delaware Housing
Coalition is based on the these needs.)
Ensure strong income targeting in all housing allocations so that affordable housing is targeted to higher
opportunity communities and new transit or economic development areas.
Encourage inclusionary principles, setting aside low income units, in new planned transit oriented
development as "the most reliable way to ensure equitable location of low income housing"
Direct limited housing development and preservation funds to affirmatively further fair housing, requiring
"new low income housing assets in low poverty, high opportunity areas with high achieving schools,
preferably in locations reasonably well served by public transportation and free from adverse environmental
impacts such as air, water and noise pollution from industrial facilities, major highways, bus depots, etc. and
contamination due to prior or adjoining land uses.
Community planning and design that successfully incorporate these features contribute to quality of life for all
residents, not only people with disabilities.

86 | C o m m u n i t y a n d C h o i c e
4. IMPROVE THE AFFORDABLE HOUSING AND DISABILITIES SERVICES SYSTEMS THAT
SERVE PEOPLE WITH DISABILITIES.
4.1 CONTINUE TO BUILD AND IMPROVE CONNECTIONS BETWEEN AND WITHIN THE
AFFORDABLE HOUSING AND DISABILITIES SERVICES SYSTEMS.
Efforts to expand rental housing opportunities for people with disabilities must focus on prioritizing integrating people
and affordable units into the community. A blend of tenant-based and project-based rental assistance strategies will
ensure both that vouchers are available for people to choose their own homes as well as that affordable units are set-
aside for people with disabilities in typical multifamily developments.
A key part of both of these strategies is the development of connections and communications between the disability
services and housing systems. To function effectively, these programs must ensure that people who choose to live in
the community receive the supportive services and housing assistance they need from these two diverse systems in a
coordinated way. In addition, at the most basic level, we have to be sure that there are units for people to live in, and,
when developers set-aside units for people with disabilities, that there are people to live in the units. This requires a
high level of partnership and interaction between a number of agencies: the partnership between DSHA, DHSS and the
Department of Services for Children, Youth and their Families (DSCYF) in the implementation of the new State Rental
Assistance Program (SRAP) is an excellent example of these initiatives.
PROGRAM PROFILE: DELAWARE STATE RENTAL ASSISTANCE PROGRAM (SRAP)
SRAP was developed as a partnership between the Delaware State Housing Authority, Department of
Health and Human Services, and Department of Services for Children, Youth and their Families. The
program provides rental assistance to low-income Delawareans who require affordable housing and
supportive services to life safely and independently in the community. Target populations include people
living in state-run long-term care facilities, kids exiting foster care, and homeless individuals and families. A
key advocacy point for the program has been the cost savings associated with helping people to live stably
in the community as opposed to institutions or moving in and out of service systems: these families and
individuals are often in the state’s care ultimately due to a lack of affordable housing. Providing rental
assistance via SRAP is estimated to cost $8,000-$10,000 per household annually.
With its experience in the administration of the federal Housing Choice Voucher (Section 8) program, DSHA
administers the rental subsidies (reviewing applications, approving participants, inspecting rental units,
making payments to landlords, annual tenant recertification and ongoing compliance), and DHSS, DSCYF
and their partners and contractors screen and refer applications to DSHA and fulfill the program’s
supportive services component through the provision of home-based care.
SRAP was first funded in the 2011 legislative session to begin operation in FY 2012, with $1.5 million in
funding expected to serve 150-200 households. In August 2011, the program became operational. DSHA
and its partners supporting SRAP are requesting an increase to $3 million for the program in FY 2013.
87 | C o m m u n i t y a n d C h o i c e
4.2 IMPROVE TRIAGE ASSESSMENT OF CONSUMERS’ HOUSING NEEDS AND STATEWIDE
DATA COLLECTION ON THESE NEEDS.
Improving discharge policies and initial housing needs assessment at intake and annual recertification is a
homelessness prevention strategy. Members of the study working group have worked together and with DHSS to
reformat a model federal housing needs assessment matrix into one that can be used in Delaware. Ideally, this
assessment should be incorporated into the intake process across all key DHSS divisions. Expanded assessment of
consumers’ housing needs at initial intake should improve quality of services and improve identification of individuals
who are precariously housed and at risk of homelessness.
If implemented uniformly across all DHSS Divisions, the new assessment form could be an incredibly valuable source
of information on housing needs. Currently, the DHSS Divisions all use different registry systems tailored to their
population. They may have extensive housing information or little to no housing information; or they may have fields
for housing questions that are often not recorded. Uniform questions and measures across all Divisions will greatly
improve the availability and quality of data about the housing needs of DHSS’ clients. Implementation of the new
assessment form across DHSS will be challenging, but is vital to both improving services and improving the data
available on housing needs long-term. Beyond DHSS, a uniform housing assessment could also be implemented in all
systems and institutions which frequently serve people with disabilities, including the Department of Corrections
(DOC) and Department of Services for Children, Youth and their Families (DSCYF).
For some populations, peer support programs may also be a source of ongoing qualitative information about housing
needs. Peer-operated resource centers which provide supports to people with mental health and substance abuse
problems are regularly in touch with people who need housing, have lost their housing, and other housing issues.
These programs, staffed and managed by people who themselves have disabilities, have their ‘ear to the ground’
regarding the needs of people with similar problems in ways that service providers might not.
In addition, to facilitate future efforts to assess the housing needs of people with disabilities, the state should improve
the collection and maintenance of information about the baseline inventory of housing targeting specific populations.
While DHSS Divisions maintain information about housing where they provide assistance, some populations have large
networks of supportive housing that is not assisted by DHSS and thus little or no information on the entire inventory
may be available. An assessment of existing resources is a critical part of assessing needs; information about the
existing inventory of supportive housing should be easily accessible and maintained. We encourage DSAMH, DSAAPD
and DDDS to develop, maintain and centralize inventory information for their target populations.
4.3 FOSTER AND IMPROVE COORDINATION AMONG THE STATE’S PUBLIC HOUSING
AUTHORITIES (PHAS), BOTH AMONG THEMSELVES AND WITH PROVIDERS OF SERVICES
TO PEOPLE WITH DISABILITIES.
Efforts to improve coordination and interchangeability among DE’s Public Housing Authorities (PHAs) on their waiting
lists and eligibility requirements would benefit consumers. This was a repeated comment in almost all focus groups: it
is extremely challenging to navigate and get transportation to get on multiple waiting lists, understand different
eligibility requirements and monitor one’s status on multiple lists.
88 | C o m m u n i t y a n d C h o i c e
Public housing authorities are critical partners in the effort to prevent and end homelessness and critical providers of
housing for people with disabilities and low incomes. A main recommendation from the U.S. Interagency Council on
Homelessness is that PHAs review and streamline their administrative policies and procedures to reduce barriers and
improve access for people with disabilities and who are homeless. This may include things like reducing background
and credit checks, how communication with people without a permanent mailing address is handled, documentation
requirements, waiting list management, and sharing information across public agencies. In Delaware, a very small
state with five public housing authorities where many households are willing to take a unit wherever they can,
reviewing and streamlining policies and procedures is not only important for each PHA but across all PHAs. Improving
the portability of vouchers across Delaware’s PHAs, a recommendation in the 2011 Analysis of Impediments to Fair
Housing Choice, is also an important improvement to benefit consumers.
Coordination with service providers may also improve access and service to consumers. For example, allowing people
with disabilities who are transient to list their service provider’s address and phone number as a point of contact may
improve notification when they reach the top of the waiting list. Currently, if attempts to reach them by phone or mail
are unsuccessful, people go to the bottom of the list. For people with disabilities who are housed, using their service
provider as a kind of emergency contact who can step in to resolve problems before they result in eviction may also
help people to remain housed once they do get assistance. As another example, DHSS has recently engaged with the
Wilmington Housing Authority in a pilot diversion program to assist residents at risk of being evicted due to
housekeeping issues, frailty and late rent issues. WHA will contact DHSS when residents who are elderly are having
housekeeping or rent issues potentially leading to eviction. A DHSS contractor will do an assessment to determine the
resident’s needs and connect the resident to services to prevent eviction.
The study working group understands that some of these are large, challenging, and long-term issues, but given the
size of the state and small number of public housing authorities, improved coordination to benefit consumers and
potentially also improve efficiency in the delivery of services is an important endeavor.
4.4 IMPROVE THE HOUSING SYSTEM’S COMMUNICATION WITH CONSUMERS AND
DEVELOP MORE ACCESSIBLE, CENTRALIZED, USER-FRIENDLY SOURCES OF
INFORMATION.
Delaware’s housing system is difficult for consumers to navigate (multiple waiting lists, eligibility requirements, etc.)
and to even get there, consumers face a fragmented system for information: there is no one to explain all the options
and point people in the right direction the first time. Those who are successful usually end up finding the right
program through long trial and error, word of mouth, or luck. Many specific populations have their own resource
directories, which have different or incomplete housing information, and housing-specific directories can be so
comprehensive that they leave people adrift in options.
Three key resources on housing and services are the DSHA Housing Services Directory, the Delaware 211 website and
phone system, and DSAAPD’s new Aging and Disability Resource Center. A cooperative initiative to ensure these
resources share and report the same timely information and give people as much detail as possible about potential
providers and eligibility requirements. For example, the 211 website is not searchable by County; both the 211
website and ADRC give little detail about what services different providers offer and listings should be reviewed for
appropriateness. DSHA’s Housing Services Directory includes very comprehensive and annually updated housing
89 | C o m m u n i t y a n d C h o i c e
information, but it is a static publication, not a searchable website. We recommend the providers of these various
directories and referral services work to improve coordination and links between their services.
4.5 FACILITATE INPUT ABOUT DISABILITY HOUSING NEEDS INTO THE VARIOUS HOUSING
AND DISABILITY PLANNING PROCESSES.
The Housing Subcommittee of the Governor’s Commission on Community-based Alternatives, which has served as the
working group for this report, should be kept active as a venue to continue communication between the disability and
housing systems. It should also be a central location to facilitate input about the housing needs of people with
disabilities and priorities for meeting those needs into the many planning processes in both the housing and disability
systems. Each field alone has numerous different planning processes, including:
Comprehensive Plans created by Counties and municipalities to guide land use, which include a Housing
Element on housing needs;
5-Year Consolidated Plans and annual Action Plans created by HUD-funded jurisdictions (the Delaware State
Housing Authority, New Castle County and Cities of Wilmington, Newark and Dover)
Annual Plans developed by the five public housing authorities (PHAs);
Strategic plans and other plans developed by Divisions in the Department of Health and Social Services
(DHSS), such as the State Plan on Aging; and
Strategic plans developed by nonprofit service providers and affordable housing providers;
All plans should be strongly encouraged to include elements, where relevant, to advance the priorities and
recommendations in this report to:
Increase the availability of and access to rental and homeownership opportunities with accessibility features;
Increase the availability of and access to affordable housing for people with disabilities;
Build a community-based system of care with a range of housing options; and
Improve the affordable housing and disabilities services systems that serve people with disabilities.
90 | C o m m u n i t y a n d C h o i c e
APPENDIXES
APPENDIX A: QUESTIONS USED TO IDENTIFY DISABILITY IN MAJOR NATIONAL DATA
SOURCES
Current Population Survey (BLS Employment Data)
In the CPS, persons are classified as having a disability if there is a response of “yes” to any of these questions. The
disability questions appear in the CPS in the following format:
This month we want to learn about people w ho have physical, mental or emotional conditions that cause serious
difficulty with their daily activities. Please answer for household members who are 15 years and older.
Is anyone deaf or does anyone have serious difficulty hearing?
Is anyone blind or does anyone have serious difficulty seeing even when wearing glasses?
Because of a physical, mental or emotional condition, does anyone have serious difficulty concentrating,
remembering or making decisions?
Does anyone have serious difficulty walking or climbing stairs?
Because of a physical, mental or emotional condition, does anyone have difficulty doing errands alone such as
visiting a doctor’s office or shopping?
http://www.bls.gov/cps/cpsdisability_faq.htm
American Community Survey (2008 and later)
Source: Review of Changes to the Measurement of Disability in the 2008 American Community Survey. Matthew W.
Brault, U.S. Census Bureau, 2009.
http://www.census.gov/hhes/www/disability/2008ACS_disability.pdf
The American Community Survey and U.S. Census exclude the group quarters population, which includes college
dormitories, prisons, long term care facilities and other institutions.
Is this person deaf or does he/she have serious difficulty hearing?
Is this person blind or does he/she have serious difficulty seeing even when wearing glasses?
Because of a physical, mental or emotional condition, does this person have serious difficulty concentrating,
remembering or making decisions?
Does this person have serious difficulty walking or climbing stairs?
Does this person have difficulty dressing or bathing?

91 | C o m m u n i t y a n d C h o i c e
Because of a physical, mental or emotional condition, does this person have difficulty doing errands alone
such as visiting a doctor’s office or shopping?
2000 Census
Source: Disability and American Families, 2000. Qi Wang, U.S. Census Bureau, July 2005.
http://www.census.gov/prod/2005pubs/censr-23.pdf
Does this person have any of the following long-lasting conditions:
a. Blindness, deafness, or a severe vision or hearing impairment?
b. A condition that substantially limits one or more basic physical activities, such as walking, climbing stairs,
reaching, lifting or carrying?
Because of a physical, mental or emotional condition lasting 6 months or more, does this person have any difficulty in
doing any of the following activities:
a. Learning, remembering or concentrating?
b. Dressing, bathing or getting around inside the home
c. Going outside the home alone to shop or visit a doctor’s office? (answer if this person is 16 years old and
over)
d. Working at a job or business? (answer if this person is 16 years old and over)
2009 American Housing Survey (HUD Worst Case Needs)
1) Are you deaf or have serious difficulty hearing?
2) Are you blind or have serious difficulty seeing, even when wearing glasses?
3) Because of a physical, mental or emotional condition, does anyone in this household have serious difficult
concentrating, remembering or making decisions?
4) Does anyone in this household have serious difficulty walking or climbing stairs?
5) Does anyone in this household have serious difficulty dressing or bathing?
6) [For all household members 15 years old and older] Because of a physical, mental or emotional condition,
does anyone in this household have difficulty doing errands alone such as visiting a doctor’s office or
shopping?

92 | C o m m u n i t y a n d C h o i c e
APPENDIX B: GLOSSARY OF ACCESSIBILITY TERMS
Accessible: Accessible features are permanently fixed in place and noticeable. An accessible housing unit might
include items such as wide doors, lower countertop segments, or grab bars in the bathroom, for example. Publicly-
financed affordable housing is subject to several different accessibility requirements which may vary depending on the
funding source. These may affect the percentage of units and the specific construction standards. Construction
standards for accessibility are usually exceeded by American National Standards Institute (ANSI) standards, those used
in the building code for all three counties in Delaware. In this report, “fully accessible” is used to denote a unit built to
the most stringent accessibility requirements applicable to the site.
Adaptable: Adaptable features are those that can be adjusted in a short time by unskilled labor without involving
structural or material changes. Adaptable units look the same as other units in the building except that accessible
features can be easily added to match an individual’s needs. Examples of adaptable features include counter tops or
closet rods that are supported by adjustable supports rather than built into the wall at a fixed level, or removable
panels on under-sink cabinets that can allow for wheelchair access. In a multifamily site, units constructed with basic
access features to comply with the requirements of the Fair Housing Amendments Act (1988) could be considered
adaptable: they have a no-step entry, basic space to allow for someone who uses a wheelchair to maneuver, and
reinforced bathroom walls to allow for grab bars.
Assistive Technology: Assistive technology includes devices for personal use created specifically to enhance the
physical, sensory, and cognitive abilities of people with disabilities and to help them function more independently.
Examples of assistive technology include flashing doorbells or TTY technology for people with auditory impairments.
Basic Access: Basic accessibility is similar to the concept of visitability described below. It includes the most basic
features to allow someone with a disability to enter and have basic use of a home: one no-step entrance, 32 inch door
clearance through the first floor, and at least a half-bathroom. Additional modifications can then be made to suit the
person’s specific needs, but these most basic features will generally ensure a person with a mobility disability can get
into a home and have basic use of its facilities. These are the most necessary and some of the most expensive to
correct with home modifications. Some local policies or incentives on basic access may also include placement of
electrical controls at reachable levels, reinforced bathroom walls to allow for future placement of grab bars, and
specific amounts of space in bathrooms and kitchens.
Universal Design: Universal design incorporates the characteristics necessary for people with physical limitations into
the design of common products and building spaces, making them easier and safer for everyone to use and more
widely marketable and profitable. An example of universal design is the use of lever handles on doors. As opposed to
doorknobs which can be difficult for people with limited use of their hands, lever handles are useable by all people.
Universal design features improve the livability of a home for all users, with or without disabilities.
Visitability: Visitability refers to homes designed to meet the accessibility needs of both its residents and any
anticipated guests with disabilities. Bathrooms with doors wide enough to accommodate wheelchair users is an
example of a visitable feature. Generally, visitability refers to three key features: an accessible, wide no-step entrance,
at least 32 inches clear passage space through interior doors, and at least a half-bathroom on the first floor with space
93 | C o m m u n i t y a n d C h o i c e
to accommodate a wheelchair. These features make the home vistable to guests with disabilities while also allowing
the resident to stay in the home over time as the resident’s physical needs change.
Source: Adapted from the Technical Assistance Collaborative

94 | C o m m u n i t y a n d C h o i c e
APPENDIX C: FOCUS GROUP PROTOCOL
Facilitator Welcome and introduction of facilitator and observer.
Facilitator Description of focus group process and structure.
Facilitator Remind participants that they may refuse participation at any time and are under no obligation to respond to any questions that make them feel uncomfortable.
Participants Questions and clarification of information overview provided.
Facilitator Announce that audio tape is about to be turned on. Remind participants not to mention any names. If names are mentioned accidentally, they will be deleted from the tape and will not appear in any transcripts. Once transcribed, tapes will be erased.
Observer Start audio tape recording.
Facilitator Lead introductions of each participant. State first name only.
Facilitator Lead the group through the following topics starting with open-ended questions, and using more directed questions to clarify responses by group members:
What is the first word that comes to mind when you think of housing for people with disabilities?
How high of a priority is housing for people with disabilities?
What are the positives about housing in Delaware for people with disabilities?
What are the biggest barriers for people with disabilities in obtaining housing in Delaware?
How would you describe the housing system in Delaware?
How would you describe the housing system for people with disabilities?
Where do people with disabilities obtain information on housing?
If you could identify one thing to do differently or in a better way to increase housing for people with disabilities --- what would it be?
Facilitator Is there anything that we should have talked about but did not?
(This would also be a time for the facilitator to pose questions suggested by participants on the registration form.)
Facilitator Thank participants for taking part in the focus group. Solicit and respond to any questions.
Facilitator Provide contact information should participants have any further questions at a later time.
Facilitator Adjourn.
Focus Groups:
Aging and Physical Disabilities – April 20, 2011 (10 participants)
Intellectual/Developmental Disabilities – April 20, 2011 (15 participants, est.)
Substance Abuse/Mental Health – May 19, 2011 (25 participants)
HIV/AIDS – April 28, 2011 (10 participants)
Developers/Providers – May 24, 2011 (6 participants)
Foster Youth – May 18, 2011
95 | C o m m u n i t y a n d C h o i c e
APPENDIX D: KEY HOUSING TERMS
(substantially drawn from the Homeless Planning Council’s Glossary of Housing Terms)
Affordable Housing: Housing is "affordable" when the occupant(s) pays no more than 30% of their total income on rent and utilities; or, if the occupant(s) owns their own home, they pay no more than 35% of their total income on their mortgage payment, insurance, taxes and utilities.
Area Median Income (AMI): Usually, the state or county-level Area Median Income figures set annually by the
Department of Housing and Urban Development (HUD) for use as income limits in related programs.
Chronically Homeless Person (As defined by HUD): An unaccompanied homeless individual with a disabling condition or a family with at least one adult member who has a disabling condition who has either been continuously homeless for a year or more OR has had at least four (4) episodes of homelessness in the past three (3) years. A disabling condition is defined as: (1) a disability as defined in Section 223 of the Social Security Act; (2) a physical, mental, or emotional impairment which is expected to be of long-continued and indefinite duration, substantially impedes an individual’s ability to live independently, and of such a nature that the disability could be improved by more suitable conditions; (3) a developmental disability as defined in Section 102 of the Developmental Disabilities Assistance and Bill of Rights Act; (4) the disease of acquired immunodeficiency syndrome or any conditions arising from the etiological agent for acquired immune deficiency syndrome; or (5) a diagnosable substance abuse disorder. The term ―homeless‖ in this case means a person sleeping in a place not meant for human habitation (e.g., living on the streets), in an emergency homeless shelter, or in a Safe Haven as defined by HUD.
Cost-burden: A household spending 30% or more of their income for rent. A household is considered “severely cost
burdened” when they are spending 50% or more of their income for rent.
Extremely Low Income (ELI): Is defined as at or below 30% of the area wide median income.
Homeless (as defined by HUD): As defined by the McKinney Act (42 U.S.C 11302), a homeless person is a person sleeping in a place not meant for human habitation or in an emergency shelter; and a person in transitional housing for homeless persons who originally came from the street or an emergency shelter. The programs covered by this NOFA are not for populations who are at risk of becoming homeless. The definition of homeless person from the HEARTH Act will not be in effect for the FY2010 CoC Competition.
Housing Choice Vouchers (HCV): A HUD program, usually administered by local housing authorities, that provides rental assistance. A household with a voucher usually has to pay only 30% of their income for rent and utilities. The vouchers cover the remaining housing costs.
Housing First: A consumer-driven housing model that offers permanent housing to those without homes. It is based on the belief that helping people access affordable permanent housing should be the central goal in ending homelessness. Housing First has an immediate and primary focus on quick access to and sustainability of permanent housing, and often is offered simultaneously with support services. The housing is not time-limited, and is not contingent on compliance with services or regulations.
Low Income: Households whose incomes are between 51% and 80% of the area median income (AMI), as determined by HUD, based on family size.
Moderate Income: Households whose incomes are between 81% and 120% of the area median income (AMI), as determined by HUD, based on family size.
Public Housing Authority (PHA): There are five in Delaware – Delaware State Housing Authority, Dover Housing Authority, New Castle County Housing Authority, Newark Housing Authority, and Wilmington Housing Authority.
96 | C o m m u n i t y a n d C h o i c e
Permanent Supportive Housing (As defined by HUD - in terms of their programs): Permanent housing for homeless persons with disabilities is another type of supportive housing. It is long-term community-based housing, which includes supportive services for homeless persons with disabilities. The intent of this type of supportive housing is to enable this special needs population to live as independently as possible in a permanent setting. The supportive services may be provided by the organization managing the housing or coordinated by the applicant and provided by other public or private service agencies.
Safe Havens: offer low-demand, indefinite-length-of-stay, supervised housing alternatives for persons with substance use and/or mental health conditions who need a place to stay that does not tie compliance with rules or service expectations to the maintenance of housing.
Section 811: A HUD program that provides capital grants and project-based rental assistance to non-profit sponsored housing developments for people with disabilities. It allows persons with disabilities to live as independently as possible in the community by increasing the supply of rental housing with the availability of supportive services. The program also provides project rental assistance, which covers the difference between HUD-approved operating costs of the project and tenants’ contribution toward rent.
Supplemental Security Income (SSI): A federal financial benefit program sponsored by the Social Security Administration (SSA), available to financially needy individuals with disabilities who have been qualified by SSA as having a disability, which prevents them from engaging in productive employment.
Supportive Housing: Housing with services that enable participants to live more independently than they would otherwise be able to. The types of services depend on the needs of the residents. Services may be short term, sporadic, or ongoing indefinitely.
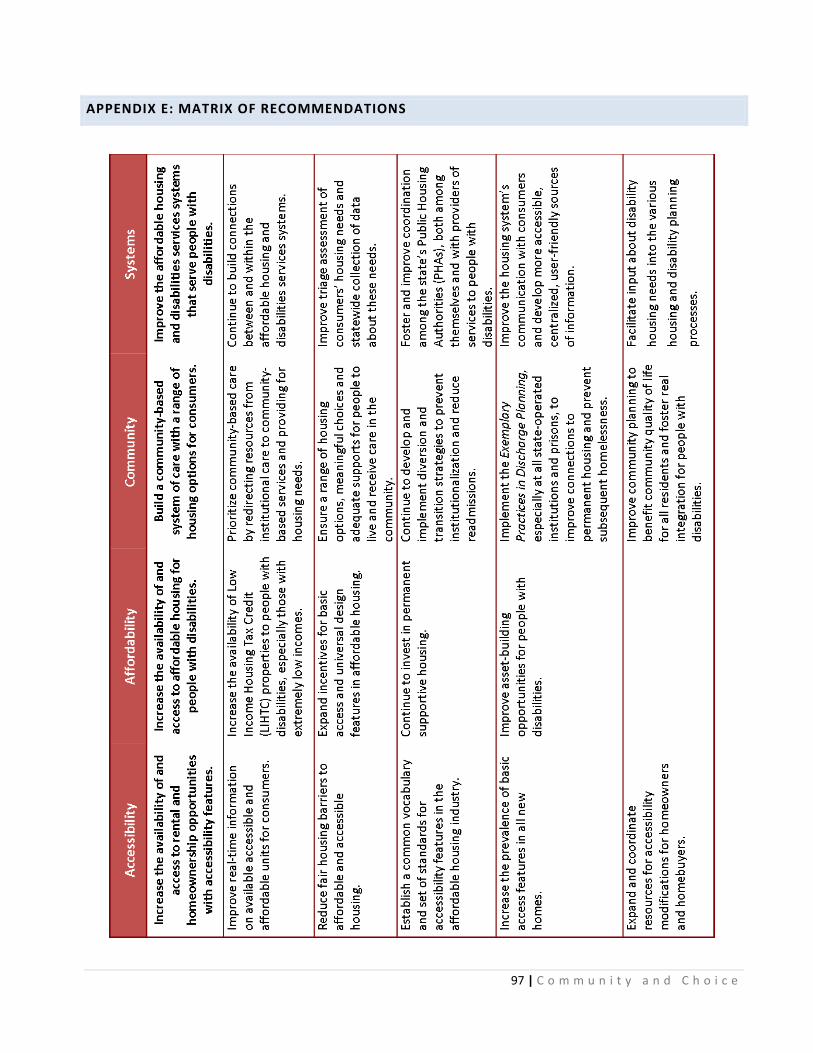
97 | C o m m u n i t y a n d C h o i c e
APPENDIX E: MATRIX OF RECOMMENDATIONS
98 | C o m m u n i t y a n d C h o i c e
ENDNOTES
1 U.S. Census Bureau, 2010 American Community Survey.
2 Brault, Matthew. Americans with Disabilities: 2005, Current Population Reports, P70-117, U.S. Census Bureau, Washington, DC.
2008. http://www.census.gov/hhes/www/disability/sipp/disable05.html 3 Brault, Matthew. Review of Changes to the Measurement of Disability in the 2008 American Community Survey. U.S. Census
Bureau, Washington, DD. 2009. http://www.census.gov/hhes/www/disability/2008ACS_disability.pdf 4 Brault, Matthew. Disability Status and the Characteristics of People in Group Quarters: A Brief Analysis of Disability Prevalence
Among the Civilian Noninstitutionalized and Total Populations in the American Community Survey. U.S. Census Bureau, Washington, DC. 2008. http://www.census.gov/hhes/www/disability/GQdisability.pdf 5 Brault, Matthew. Americans with Disabilities: 2005, Current Population Reports, P70-117, U.S. Census Bureau, Washington, DC.
2008. http://www.census.gov/hhes/www/disability/sipp/disable05.html 6 Adams, P., Martinez, M., and Vickerie, J. Summary health statistics for the U.S. population: National Health Interview Survey, 2009.
National Center for Health Statistics. Vital Health Statistics 10(248). 2010. 7 U.S. Census Bureau, 2010 American Community Survey.
8 Delaware Population Consortium, 2010 Population Projection series.
http://stateplanning.delaware.gov/information/dpc_projections.shtml 9 Out of Reach 2011. National Low Income Housing Coalition, 2011. http://nlihc.org/oor/oor2011/
10 U.S. Department of Housing and Urban Development, 2006-2008 Comprehensive Housing Affordability Strategy (CHAS) Data.
http://www.huduser.org/portal/datasets/cp.html 11
U.S. Department of Housing and Urban Development, Office of Policy Development & Research. Worst Case Housing Needs 2009 Report to Congress. http://www.huduser.org/portal/publications/affhsg/wc_HsgNeeds09.html 12
Ibid. 13
Mullin & Lonergan Associates. Delaware State Consortium Analysis of Impediments to Fair Housing Choice, 2011. http://www.destatehousing.com/FormsAndInformation/pubs.php and Delaware State Housing Authority. 14
Delaware State Housing Authority 15
von Schrader, S., Erickson, W. A., Lee, C. G. (2010, March 17). Disability Statistics from the Current Population Survey (CPS). Ithaca, NY: Cornell University Rehabilitation Research and Training Center on Disability Demographics and Statistics (StatsRRTC). http://www.disabilitystatistics.org 16
U.S. Census Bureau, 2008-2010 American Community Survey. 17
Brault, Matthew. Americans with Disabilities: 2005, Current Population Reports, P70-117, U.S. Census Bureau, Washington, DC. 2008. http://www.census.gov/hhes/www/disability/sipp/disable05.html 18
U.S. Census Bureau Poverty Thresholds. http://www.census.gov/hhes/www/poverty/data/threshld/index.html 19
U.S. Census Bureau, 2008-2010 American Community Survey. 20
Homeless Planning Council of Delaware, 2011 Point in Time Study Report. http://www.hpcdelaware.org/documents/2011_PIT_Data_Presentation.pdf 21
U.S. Social Security Administration, 2010 Annual Statistical Supplement. Washington, DC. 2011. http://www.ssa.gov/policy/docs/statcomps/supplement/ 22
Cooper, Emily, Ann O’Hara, and Andrew Zovistoski. Priced Out 2010: The Housing Crisis for People with Disabilities. Boston: Technical Assistance Collaborative. 2011. http://www.tacinc.org/downloads/Priced%20Out%202010/PricedOut2010.pdf 23
She, Peiyun. and Gina Livermore. “Long-term Poverty and Disability Among Working-Age Adults.” Journal of Disability Policy Studies 19, no. 4, 2009: 244-256. 24
Livermore, Gina and Hill, S. Changes in Health Care Expenditures and the Employment of People with Disabilities, 1987-1997. Paper prepared for the National Institute for Disability and Rehabilitation Research. Washington, DC: Cornell University Institute for Policy Research. 25
She, Peiyun. and Gina Livermore. “Material Hardship, Disability and Poverty Among Working-Age Adults.” Social Science Quarterly 88, no. 4, 2007: 970-989. 26
She, Peiyun. and Gina Livermore. “Material Hardship, Disability and Poverty Among Working-Age Adults.” Social Science Quarterly 88, no. 4, 2007: 970-989.
99 | C o m m u n i t y a n d C h o i c e
27
The CPS covers individuals 16 years of age and older in the civilian nonstitutionalized population. 28
Brault, Matthew. Americans with Disabilities: 2005, Current Population Reports, P70-117, U.S. Census Bureau, Washington, DC. 2008. http://www.census.gov/hhes/www/disability/sipp/disable05.html 29
U.S. Department of Housing and Urban Development, Office of Policy Development and Research. 2009 Worst Case Housing Needs of Persons with Disabilities: Supplemental Findings of the Worst Case Housing Needs 2009: Report to Congress. Washington, DC. March 2011. http://www.huduser.org/Publications/pdf/WorstCaseDisabilities03_2011.pdf 30
Ibid. 31
U.S. Department of Housing and Urban Development, A Picture of Subsidized Households: 2008. http://www.huduser.org/portal/picture2008/index.html 32
U.S. Department of Housing and Urban Development. The 2010 Annual Homeless Assessment Report to Congress. Washington, DC. 2011. http://www.hudhre.info/documents/2010HomelessAssessmentReport.pdf 33
Homeless Planning Council of Delaware, Calendar Year 2010 Homelessness Statistical Report from the Homeless management Information System (HMIS). 2011. http://www.hpcdelaware.org/documents/CY10_Narrative_Report.pdf 34
U.S. Social Security Administration. Annual Statistical Report on the Social Security Disability Insurance Program, 2010. Washington, DC. 2011. SSA Publication 13-11827. http://www.ssa.gov/policy/docs/statcomps/ssi_asr/2010/ssi_asr10.pdf 35
United Cerebral Palsy. The Case for Inclusion 2011: An Analysis of Medicaid for Americans with Intellectual and Developmental Disabilities. Washington, DC, 2011. http://medicaid.ucp.org/pdf/Case_For_Inclusion_Report_2011.pdf 36
Eiken, Steve; Burwell, Brian; Gold, Lisa and Stredl, Kate. Medicaid HCBS Waiver Expenditures: FY 2004 through FY 2009. Thomson Reuters, 2010 http://www.hcbs.org/files/193/9645/HCBSWaivers2009.pdf 37
U.S. Social Security Administration, Annual Statistical Report on the Social Security Disability Insurance Program, 2010. Washington, DC. 2011. SSA Publication 13-11827. http://www.ssa.gov/policy/docs/statcomps/ssi_asr/2010/ssi_asr10.pdf 38
DSAMH, DSAMH Five Year Glance, SFY 2005 – 2010. http://www.dhss.delaware.gov/dhss/dsamh/files/dsamh_5yr_glance_2010.pdf 39
DSAMH, Division Funded Adult Admissions by Fiscal Year and Client Demographics - State Fiscal Years 1996 – 2010. http://www.dhss.delaware.gov/dhss/dsamh/files/aod_adult_admissions_summary_2010.pdf 40
DSAMH, Delaware Substance Abuse Treatment Caseload. http://www.dhss.delaware.gov/dhss/dsamh/files/2010_caseload.pdf 41
DSAMH, Delaware Community Mental Health Caseload. http://www.dhss.delaware.gov/dhss/dsamh/files/08cmhccaseload.pdf 42
Delaware Department of Health and Social Services, Division of Public Health. 2010 Delaware HIV/AIDS Surveillance Report. http://www.dhss.delaware.gov/dhss/dph/dpc/files/2010hivepiprofile.pdf 43
Delaware HIV Consortium, Tenant based Rental Assistance Program 2011 Evaluation Report: Consumer Survey Responses and Analysis. November 2011. 44
Delaware Department of Health and Social Services. 45
Delaware HIV Consortium Planning Council. 2008 Gaps Analysis of Needs and Barriers. 46
Social Security Administration, Annual Statistical Report on the Social Security Disability Insurance Program, 2010. Washington, DC. 2011. SSA Publication 13-11827. http://www.ssa.gov/policy/docs/statcomps/di_asr/2010/di_asr10.pdf 47
Ward BW, Barnes PM, Freeman G, Schiller JS. Early release of selected estimates based on data from the 2010 National Health Interview Survey [online]. Hyattsville, MD: National Center for Health Statistics. 2011. http://www.cdc.gov/nchs/nhis.htm. 48
HUD’s CHAS data are estimates developed using the American Community Survey data. Due to the change in questions related to disability in the 2008 American Community Survey, disability-related statistics are not included in the 2006-2008 estimates, so the 2005-2007 estimates are used here. In addition, only mobility and self-care disabilities are included. 49
Reinhard, Susan C., Enid Kassner, Ari Houser and Robert Mollica. Raising Expectations: A State Scorecard on Long-term Services and Supports for Older Adults, People with Physical Disabilities and Family Caregivers. September 2011. http://www.longtermscorecard.org 50
Ibid. 51
Bedford, Rebecca and Tibor Toth. Delaware Nursing Home Utilization Statistics: January – December 2010. Newark, DE: University of Delaware Center for Applied Demography and Survey Research, April 2011. http://www.dhss.delaware.gov/dhss/dph/hsm/files/2010nhstatsrpt.pdf 52
Kitchener, M., Ng, T., Miller, N., & Harrington, C.; Institutional and Community-Based Long-Term Care: A Comparative Estimate of Public Costs; Journal of Health & Social Policy, Vol. 22 (2), 2006.
100 | C o m m u n i t y a n d C h o i c e
53
Bridges, Katherine and Danielle Goodwin. AARP. The Road Ahead: AARP Survey on Community Services in Delaware, March 2009. http://www.aarp.org/home-garden/livable-communities/info-04-2009/de_hcbs_09.html 54
American Health Care Association, compilation of OSCAR data, December 2009. http://www.ahcancal.org/research_data/oscar_data/Pages/default.aspx 55
Lipton, Debra and Susan Williams. Money Follows the Person Demonstration Program: A Profile of Participants. The National Evaluation of the Money Follows the Person (MFP) Demonstration Grant Program: Reports from the Field. Number 5: January 2011. Princeton, NJ: Mathematica Policy Research. http://www.mathematica-mpr.com/publications/PDFs/health/MFPfieldrpt7.pdf 56
John Schurrer and Audra Wenzlow. A First Look at How MFP Participants Fare after Returning to the Community. The National Evaluation of the Money Follows the Person (MFP) Demonstration Grant Program: Reports from the Field. Number 7: July 2011. Princeton, NJ: Mathematica Policy Research. http://www.mathematica-mpr.com/publications/PDFs/health/mfpfieldrpt5.pdf 57
Reinhard, Susan C., Enid Kassner, Ari Houser and Robert Mollica. Raising Expectations: A State Scorecard on Long-term Services and Supports for Older Adults, People with Physical Disabilities and Family Caregivers. September 2011. http://www.longtermscorecard.org 58
Ibid. p. 102 59
VLI renter households with housing subsidy calculated using information on public housing and Housing Choice Voucher residents from data reported by the Delaware Public Housing Authorities in September 2010 for the statewide Analysis of Impediments to Fair Housing Choice, the number of HUD- and RD-subsidized multifamily units (Project-based Section 8, Section 202, and USDA RD 515 Rental Assistance) from DSHA’s Preservation Database, occupancy of HUD-subsidized units from HUD’s Picture of Subsidized Households Data, 2008; and Occupancy of RD-subsidized units, RD Multifamily Occupancy Report 2010. Estimate on worst case housing needs produced using percentage of nonelderly very low-income renter households with a disability as reported by the ACS (25.2%). 60
Pelletiere, Danilo and Kathryn P. Nelson. Leveraging the AHS to Better Estimate Housing Needs of Persons with Disabilities. Paper prepared for presentation at the American Housing Survey User Conference, Washington, DC. March 8, 2011. 61
Ibid. 62
Social Security Administration, Annual Statistical Report on the Social Security Disability Insurance Program, 2010. Washington, DC. 2011. SSA Publication 13-11827. http://www.ssa.gov/policy/docs/statcomps/di_asr/2010/di_asr10.pdf 63
U.S. Census Bureau, 2008-2010 American Community Survey. 64
Delaware Interagency Council on Homelessness, Breaking the Cycle: Delaware’s Ten Year Plan to End Chronic Homelessness and Reduce Long-term Homelessness. 2007. http://www.destatehousing.com/FormsAndInformation/Publications/delaware_ten_yr_plan.pdf 65
Houser, Ari, Wendy Fox-Grage and Mary Jo Gibson. Across the States: Profiles of Long-Term Care and Independent Living, Delaware. Washington, D.C.: AARP Public Policy Institute, 2009. 66
Smith, Stanley, Rayer, Stefan and Smith, Eleanor. “Aging and Disability: Implications for the Housing Industry and Housing Policy in the United States”, Journal of the American Planning Association 74, no. 3. 2008: 289-306. 67
U.S. Department of Housing and Urban Development, 2005 – 2007 CHAS Data. Compiled by the Delaware State Housing Authority. http://www.huduser.org/portal/datasets/cp.html 68
Ibid. 69
Mitchell P. LaPlante, Demographics of Wheeled Mobility Device Users. Paper presented at the conference on Space Requirements for Wheeled Mobility, October 9-11, 2003. http://www.ap.buffalo.edu/ideaproto/Space%20Workshop/Papers/Mitchell%20LaPlante/Demographics%20of%20Wheeled%20Mobility%20-%20Mitchell%20P%20LaPlante.pdf 70
Ibid. 71
Louie, Josephine. The Housing Modifications for Disabled Elderly Households. Joint Center for Housing Studies of Harvard University, September 1999. http://www.jchs.harvard.edu/sites/jchs.harvard.edu/files/louie_w98-8.pdf 72
U.S. Department of Housing and Urban Development, 2006-2008 CHAS Data. http://www.huduser.org/portal/datasets/cp.html 73
Smith, Stanley, Rayer, Stefan and Smith, Eleanor. “Aging and Disability: Implications for the Housing Industry and Housing Policy in the United States”, Journal of the American Planning Association 74, no. 3. 2008: 289-306. 74
Internal Revenue Service, Department of the Treasury, Characteristics of Disabled Taxpayers Ages 18 to 59: Study of Filing Patterns and Preferences for Receiving Tax Information and Services. Pub. 4640. Washington, DC: IRS. 2009.
101 | C o m m u n i t y a n d C h o i c e
75
Lombe, M., Huang, J., Putnam, M. & Cooney, K. (2010). Exploring saving performance in an IDA for people with disabilities: Some preliminary findings. Social Work Research 24(2), 83-93. 76
U.S. Department of Housing and Urban Development, Office of Policy Development & Research. Discrimination Against Persons with Disabilities: Barriers at Every Step. Washington, DC: The Urban Institute. 2005. http://www.hud.gov/offices/fheo/library/dss-download.pdf 77
U.S. Department of Housing and Urban Development, The State of Fair Housing: Annual Report on Fair Housing FY 2009. 2010. http://www.hud.gov/content/releases/fy2009annual-rpt.pdf 78
Mullin & Lonergan Associates. Delaware State Consortium Analysis of Impediments to Fair Housing Choice. Dover, DE: Delaware State Consortium, 2011. http://www.destatehousing.com/FormsAndInformation/Publications/impediment_part0.pdf 79
CFED, 2011 Assets & Opportunity Scorecard. http://cfed.org/scorecard/ 80
Lowe, Serena and Reid, Alexander. “Federal Legislative Efforts to Expand Savings Options for Individuals with Disabilities,” in Opportunities for Community Development Finance in the Disability Market, 55 – 62. Boston: Federal Reserve Bank of Boston, 2010. http://www.bos.frb.org/commdev/cdevfin-disability-market/index.htm 81
Delaware Interagency Council on Homelessness, Breaking the Cycle: Delaware’s Ten-Year Plan to End Chronic Homelessness. 2007. http://destatehousing.com/FormsAndInformation/Publications/delaware_ten_yr_plan.pdf p. 33.


