Embed Size (px)
Citation preview
COMMUNICATION APPREHENSION IN THE WORKPLACE
AND ITS EFFECTS ON EMPLOYEE JOB SATISFACTION
by
AMBER LYNNE BYRON, B.A.
A THESIS
IN
COMMUNICATION STUDIES
Submitted to the Graduate Faculty of Texas Tech University in
Partial Fulfillment of the Requirements for
the Degree of
MASTER OF ARTS
Approved
Kenneth David Roach Chairperson of the Committee
Bolanle A. Olaniran
Robert Allen Stewart
Accepted
John Borrelli Dean of the Graduate School
May, 2005
ii
ACKNOWLEDGEMENTS
First of all, I need to thank Marc, my fiancé, for always being there for me and
supporting me through this project. He has been there from the very beginning, and has
seen the many ups and downs of this project. Through it all, he has been there to
encourage me and to offer support, as well as new and creative ideas to get things done.
As always, he has been and will continue to be my rock. When the stress of this project
seemed too much to bear, he was there to encourage me to keep going. He stayed up
with me during my all nighters to get my deadlines completed, and without him, this
project would not be what it is. For all that he has done, and all the support and love he
has shown me, I would like to say thank you, and I love you.
I would also like to thank Buddy and Shonie for all of their help with this project.
When this project was in its conception stages, they were there to help me in any way that
they could. Even when the first plan did not go through as we all hoped that it would,
they were there thinking of an alternative plan that eventually turned into the product that
I have today. No matter what the situation, I know their love and support are no more
than a phone call away.
Next, I would like to thank my Mom, Sandy. She has always been there to
encourage me through all of the decisions that I have made in my life, and graduate
school is no exception. She always let me know that I could do anything that I wanted to
do, and has always been there to support me in anyway that she could. While working on
this project, she continually called me and offered her support, and was there when I need
to just vent and try to get my thoughts together.
iii
I would like to thank my committee members, Dr. Olaniran and Dr. Stewart.
Through this project, they have shown me great patience, and have often offered to help.
This project has benefited through the wisdom they have shared with me. I would like to
thank you for the support that you have both shown me, either through emails or in
person, that helped me to stay focused, and know that there was always someone there to
turn to when I was lost and needed help.
Finally, I would also like to show my appreciation to Dr. Roach. Since the first
day I met Dr. Roach, he has been encouraging me and supporting me no matter what the
dilemma might be. Through this project, he has been there to guide me and show me the
correct way to conduct a valid research study. Although some of the steps taken in this
research study were not the greatest time savers, they were the key steps to making this a
reliable research study. From working under him, I have learned what it takes to truly
complete a full blown research project, and I have a great deal of respect for those who
do this for a living. This is by no means an easy thing to complete, and I have learned so
much from working under Dr. Roach about completing a well thought out project. I will
forever be grateful for the guidance and support that he has shown me through the course
of this project. He is the true embodiment of patience.
iv
TABLE OF CONTENTS
ACKNOWLEDGEMENTS�.����������������������.. ii ABSTRACT �����������������������������. vi LIST OF TABLES �������������������������.....viii CHAPTER I. INTRODUCTION������������������������. 1 Communication Apprehension����������������.. 2 Types of Communication Apprehension�������������3 Job Interviews��� ��������������������5 Public Speaking Visualization����������������... 9 Instructional Level�����...��������������� 13 Communibiological Apprehension����������..���� 19 Behavioral Patterns of Communication Apprehension�������24 Coping Strategies���������������������. 28 Job Satisfaction���������������������� 31 Employer Immediacy�������������������... 34 Employee Turnover��� ����������������... 36 Predicting Satisfaction�������������������. 38 Giving Employees a Voice/Employee Participation��� ����..39 Job Satisfaction Across Cultures���������������. 40 University Faculty��������������������... 41 Rehabilitation Professionals����������������� 42
Research Questions��������������������. 45 FairMount Minerals�������������������� 47 Products�������������������������47 II METHODOLOGY AND DISCUSSION��������������� 50 Participants�����������������������... 50 Instruments�����������������������.. 50 Procedures�����������������������... 53 Analysis������������������������... 53 Discussion������������������������ 64 Limitations���������������..��������. 67 Future Research����������������������70 REFERENCES���������������������������� 72 APPENDICES A: DEMOGRAPHIC QUESTIONNAIRE�����������������. 77 B: PERSONAL REPORT OF COMMUNICATION APPREHENSION-24���� 80 C: JOB DESCRIPTION INDEX��������������������� 83 D: SITUATIONAL COMMUNICATION APPREHENSION MEASURE����.. 85
vi
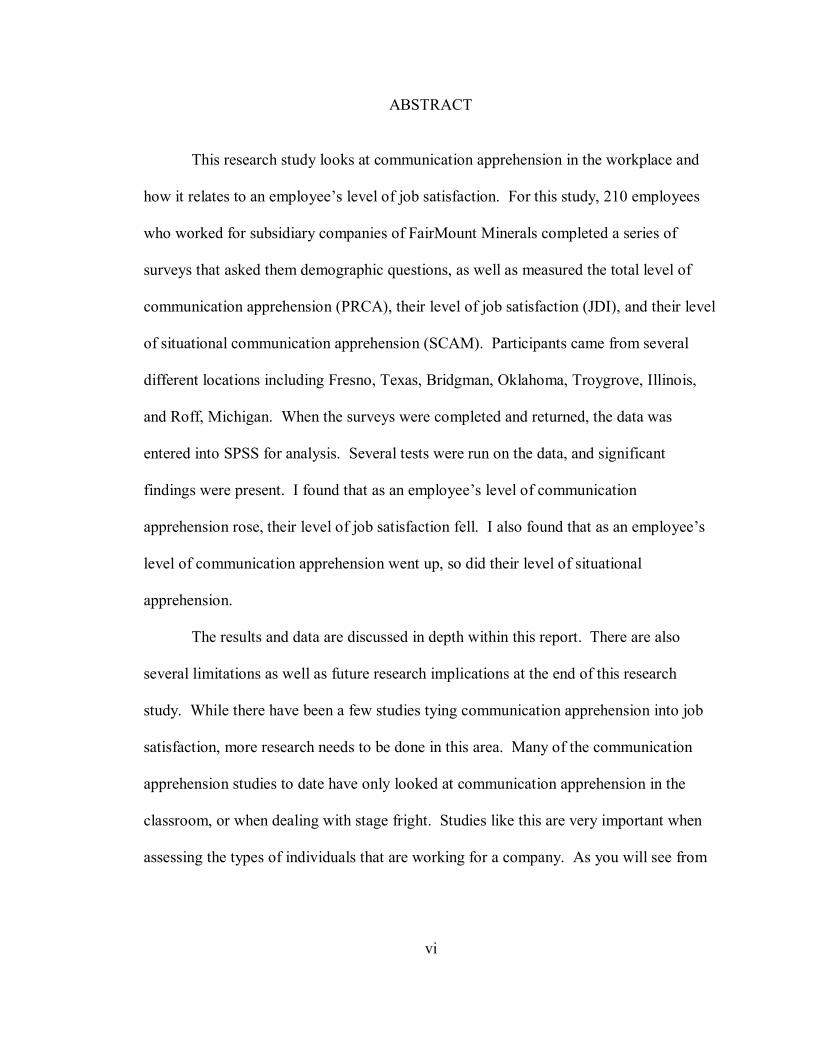
ABSTRACT
This research study looks at communication apprehension in the workplace and
how it relates to an employee�s level of job satisfaction. For this study, 210 employees
who worked for subsidiary companies of FairMount Minerals completed a series of
surveys that asked them demographic questions, as well as measured the total level of
communication apprehension (PRCA), their level of job satisfaction (JDI), and their level
of situational communication apprehension (SCAM). Participants came from several
different locations including Fresno, Texas, Bridgman, Oklahoma, Troygrove, Illinois,
and Roff, Michigan. When the surveys were completed and returned, the data was
entered into SPSS for analysis. Several tests were run on the data, and significant
findings were present. I found that as an employee�s level of communication
apprehension rose, their level of job satisfaction fell. I also found that as an employee�s
level of communication apprehension went up, so did their level of situational
apprehension.
The results and data are discussed in depth within this report. There are also
several limitations as well as future research implications at the end of this research
study. While there have been a few studies tying communication apprehension into job
satisfaction, more research needs to be done in this area. Many of the communication
apprehension studies to date have only looked at communication apprehension in the
classroom, or when dealing with stage fright. Studies like this are very important when
assessing the types of individuals that are working for a company. As you will see from

vii
the information provided in this report, this type of information can tell a company why
they have a high rate of turnover, or why employees keep putting in for a job change.
viii
LIST OF TABLES
1: Age �����������������........................................................ 54 2: Age Frequencies ��������������������������54 3: Number of Years Left with the Company ����������������. 55 4: Cultural Background ������������������������. 56 5: Educational Levels ������������������������� 57 6: Job Titles ����������������������������... 58 7: Descriptive Statistics ����������������������......... 61
1
CHAPTER I
INTRODUCTION
Everyone has had an experience when they have felt nervous talking to someone
else. This could be as simple as talking to a new person, or giving a speech to a room full
of people. We have all experienced what is known as communication apprehension. A
great deal of the research that has been done in the area of communication apprehension
revolves around the classroom; giving speeches or presentations to our peers in order to
receive a grade. But what happens when we graduate from school and enter the
workplace, but are still plagued with communication apprehension? Does it affect the
jobs we hold, the satisfaction we experience, or the confidence we hold in the workforce?
The general purpose of this study is to look at how communication apprehension affects
employees. Although there have been some studies done on communication
apprehension in the workplace, there is still many aspects that deserve to be looked at. I
hope that through this study, we can begin to see the effect that communication
apprehension has on employees, and find suitable ways to deal with it. I also hope that
through this study, other research can begin to find out just how communication
apprehension manipulates us in the workplace. I will begin this project by reviewing
what communication apprehension is, and what its characteristics are. I will then give an
overview of job satisfaction, and its role in the workplace. I will attempt to show the
need for this study, and provide research questions that delve into the relationship
between communication apprehension and its relationship to job satisfaction. After I
present my research questions, I will outline my study by showing the method in which I
2
gathered my data as well as the respondents that participated in this study. I will then
describe the data I collected and go over the instruments used to analyze it. This will be
followed by a discussion of what was found from these results and some concluding
statements.
Communication Apprehension
The most widely accepted definition of communication apprehension was given
by McCroskey in 1977 as �fear or anxiety with either real or anticipated communication
with another person or persons� (McCroskey, 1977; see also Opt & Loffredo, 2000;
Greene & Sparks, 1983; Winiecki & Ayres, 1999; Pitt, Berthon, & Robson, 2000; Ayres
& Heuett, 1997; Ayres, Hopf & Will, 2000). Although some definitions may vary, all
seem to include ideas of distress, fear and anxiety, or negative reactions toward
interacting with others (Smith, Nelson, & Smeltzer 1994; McGuire, Stauble, Abbott, &
Fisher, 1995; Beatty & Beatty, 1976).
Aside from having many different definitions of communication apprehension,
there are also many different levels of communication apprehension to explore. In recent
literature, communication apprehension has been discussed as having the distinction of
both trait and state anxiety. An article by McCroskey, Richmond, and Davis (1986)
posed that there are actually four types of communication apprehension, Traitlike CA;
Context-Based CA; Audience-Based CA; and Situational CA. With these four
distinctions, there is no longer the dichotomy of an individual only having trait CA, or
only having state CA, but now there is a continuum on which those characteristics can
3
fall. McCroskey has been attributed with believing that to view all human behavior as
being solely traitlike or statelike disregards that connection that the two sources share.
Let�s look briefly at the four levels of communication apprehension as explained by
McCroskey, Richmond and Davis.
Types of Communication Apprehension
Traitlike CA is defined as, �a relatively enduring, personality-type orientation
toward a given mode of communication across a wide variety of contexts.� (McCroskey,
Richmond & Davis, 1982, p. 172) A person�s traits are very unlikely to change over
time, and therefore, they would experience the same type of communication
apprehension over a long period of time. There are three varieties of traitlike CA that
have been tested throughout the literature, CA involving oral communication, CA
involving writing, and CA involving singing. Since these are all different types of
traitlike CA, the results of an individual measured on any one of these traits is likely to
stay the close to the same over a long period of time, if the condition is left untreated
according to McCroskey, Richmond, and Davis (1982).
The next type of communication apprehension is context-based CA. This is
defined as, �a relatively enduring, personality-type orientation toward communication in
a given type of context.� (McCroskey, Richmond & Davis, 1982, p. 172) On the
continuum, context-based CA is one step removed from a pure form of traitlike CA. This
type of communication apprehension assumes that an individual can have a high level of
communication apprehension, for example, when delivering a public speech, but have
little or no apprehension in another situation involving communication, such as group
4
meetings. Context-based CA can also be broken down into four different levels for
further study. Those levels include, �public speaking, dyadic situations (e.g., job
interviews), small group discussions, and meetings or classes.� (McCroskey, Richmond
& Davis, 1982, p. 172) As with traitlike CA, it is expected that an individual�s results
will remain virtually unchanged over an extend period of time if no treatment is
administered.
Another level of communication apprehension is audience-based CA. Audience-
based CA is defined as, �a relatively enduring orientation toward communication with a
given person or group of people.� (McCroskey, Richmond & Davis, 1982, p. 172) This
type of apprehension is not brought on by an individual�s personality, but instead, by the
situation in which an individual finds him or herself. Although this type of CA is also
viewed as enduring, it can change if the behavior of the person or group changes.
The last type of communication apprehension is Situational CA. This is at the
other end of the continuum from traitlike CA. This is the most state-like type of
communication apprehension as defined in the current article. Situational CA is defined
as �a transitory orientation toward communication with a given person or group of
people.� (McCroskey, Richmond & Davis, 1982, p. 173) This type of communication
apprehension represents a type of apprehension or anxiety that is felt only once in a
particular situation, for example, when your supervisor calls you into his or her office and
asks you to explain a specific behavior.
By knowing not only your employee�s level of communication apprehension, but
what type of communication apprehension they have, you, as the manager, can better deal
with issues that may arise in the work place. You can also ensure that the tasks that an
5
employee is doing during the work day are not things that are going to cause them a great
amount of discomfort, in turn impacting their level of job satisfaction.
There have been many different research articles that look at communication
apprehension in many different contexts. In the following pages, I will discuss several
different areas of research that have focused on an individual�s apprehension level, and
show the results that the researches have obtained.
Job Interviews
With definitions as broad as what we have looked at so far, it is no wonder that
communication apprehension has been studied in a variety of different contexts. Some of
these include the apprehension that is experienced in a job interview. An individual�s
level of communication apprehension can have a great impact on how they react in
certain situations. This is no different in the area of job interviews, which is usually
thought of as being a high anxiety type of situation. To find out a little more about what
a person with high communication apprehension thinks during an employment interview,
Ayres, Keereetaweep, Chen and Edwards (1998), developed several focus groups of
individuals to discuss what goes through their mind before, during, and after an
interview. In total, six focus groups were formed, three groups were those identified as
having high communication apprehension, and three group were made up of those
identified as having low communication apprehension.
The participants came from students enrolled in a public speaking class, and each
of them either scored one standard deviation above or below the mean on the Personal
Report of Communication Apprehension in Employment Interviews (PRCAEI). Those
6
who have high communication apprehension were put in groups separate from those who
have low communication apprehension because in general, those with high levels of
apprehension are less likely to speak out in conversations. It was thought that if the
participants were grouped with others like themselves, they would be more willing to
share their experiences and feelings about the employment interview process.
The focus group was aimed at finding out information on a wide range of topics
including what makes you apprehensive (or not apprehensive) during an interview, to
what do you think about during an interview, to what do you think about after an
interview. The answers received from those with high communication apprehension
were much different than the answers provided by the group with low communication
apprehension. When asked to give examples of why they felt apprehensive about
interviews, those with high apprehension levels stated that they were concerned about
being judged, they felt a great deal of pressure about performing in that type of situation,
they did not feel they had enough time to adequately explain their qualifications, and they
were afraid of saying the wrong thing. On the other hand, those with low levels of
apprehension state very different answers. They were concerned with being thoroughly
prepared for the interview and being able to explain why they wanted the job in which
they were applying for. �In general, high CA�s seemed worried about what others are
going to think of them while low CA�s concentrate on what they are going to do and why
they are going to do it.� (Ayres, Keereetaweep, Chen, & Edwards, 1998, p. 5)
When asked about how they prepare for an interview, those with high
communication apprehension stated they do not really prepare for them. Only one person
in the high apprehensive group revealed that they do some research on the company
7
before going into the interview. Overall, they seemed more concerned with how they
looked. They spent the majority of their time before the interview making sure that they
looked professional. Those with low apprehension also stated that they try to look nice
and dress professionally for their interviews, but they also revealed that they do research
on the company before hand, learn about interviews by taking classes, and try to prepare
responses to possible interview questions before hand.
The overall theme was that individuals with high communication apprehension
seemed to avoid thinking about an interview, while those with low apprehension tried to
prepare for all of the different aspects that may come up during the interview.
The next area that the focus groups were asked to talk about is what type of
thoughts went through their mind right before an interview. Those with high
apprehension reported that they tried to tell themselves that the interview process is
something that they have to go through. They also admitted that more negative thoughts
ran through their minds than positive thoughts. Some of these included, �I won�t do
well�, and �I don�t know why I am doing this.� (Ayres, Keereetaweep, Chen, & Edwards,
1998, p. 5) Again, those with low apprehension levels reported the complete opposite,
they tried to visualize the interview and think about the possible questions that would be
asked.
This lead into what the participants actually thought about during the interview.
Again, the high apprehensives were still concerned about being perceived negatively, and
had many thoughts about how nervous they were. The low apprehensives were trying to
anticipate questions, and were thinking about how to tailor their answers in a way that
would appeal to the interviewer.
8
Finally, the focus groups were asked about their thoughts following the interview.
Both high and low CA�s reported that they tried not to think about the interview after it
was over. Those who did think about the interview did it in different way though. The
few high apprehensives who reported thinking about the interview usually had negative
evaluative thoughts, and in turn why they should not get the job. The low apprehensive�s
who thought about the interview afterwards tried to pinpoint what they did wrong in
efforts to improve their performance next time. �In effect, high CA�s are self-absorbed
and fail to come to grips with the situation. Low CA�s examine the situation and work on
how to deal with its unique demands.� (Ayres, Keereetaweep, Chen, & Edwards, 1998, p.
7)
Another study by Ayres, Ayres, Baker, Colby, De Balsi, Dimke, Docken, Grubb,
Hopf, Mueller, Sharp and Wilcox (2001), looked at the effects of performance
visualization on employment interviews. They looked at 27 individuals who applied for a
paid summer position as an orientation counselor at a mid-western college. Each
participant filled out the Personal Report of Communication Apprehension in
Employment Interviews, as well as the Job Interview Self-Statement Schedule. Finally
they measured state CA with a five-point instrument created by Spielberger, Gorsuch,
and Lushene. After these instruments were filled out, the job applicants were asked to
watch a 25-minute performance visualization video. In this video, the applicants were
able to watch experienced interviewers and interviewees participate in a scripted
interview. After watching the video, they were asked to fill out the same instruments
again. It was found that watching the performance visualization video did in fact help
reduce the applicant�s level of trait and state CA. Ayres et al, (2001), also found that
9
when the visualization video was not used, those individuals who had a high level of
communication apprehension were usually ranked lower on a general screening
interview, but if they watched the video there was no significant difference in the ranking
of those with high communication apprehension to those who had low communication
apprehension.
Public Speaking Visualization
A new area in public speaking research that is starting to gain attention is that of
visualization, and the benefits that it can bring to those who have anxiety about public
speaking. Elkins stated in his 1996 article that the fear of public speaking is a learned
condition, much like the reactions of Pavlov�s dogs. But what makes a student
apprehensive towards giving a speech?
An article published by Pertaub, Slater, and Barker (2002), looks at how the
reaction of an audience can affect the anxiety level of a speaker. For this research
experiment, the researchers choose to use a virtual audience as part of the virtual reality
exposure therapy. Participants were given five minutes to deliver a speech in front of a
small virtual audience. The audience could be programmed to respond to the speaker in a
variety of different ways including being static throughout the presentation, being
positive and engaged audience, or being a negative, inattentive audience.
The participants consisted of 40 members that were split into three groups. Each
group was given the opportunity to perform their speech two times. Group one gave their
presentation in front of the static audience, and then again repeated the speech in front of
the same audience. Group two gave their first speech to a friendly audience, and then
10
gave their second speech to the negative audience. Group three gave their first speech to
the hostile group, and then gave their second speech to the friendly group. Between each
speech, the participant was asked to complete a questionnaire on their overall response to
the presentation they just performed.
Because there were significant results from the data collected after the first
presentation, the researchers decided to treat this experiment as a between-group design
and not a with-in group design. Two variables were taken into account, the first being the
audience it self, and the second was the level of immersion that the participant received.
Half of the subjects viewed their audience by using a head-tracked head-mounted display.
This placed the participant into �a full stereo version of the seminar room.� (Pertaub,
Slater, & Barker, 2002, p. 70) The other half of the participants viewed their audience on
a standard desktop monitor.
The seminar room that the participants were viewing consisted of eight men all
dressed in suits as if attending a formal business meeting. The men were seated in a
semi-circle around a table facing the speaker. The men were �continuously animated,
displaying random autonomous behaviors such as twitches, blinks, and nods that were
consciously designed to foster the illusion of a real-life presence.� (p. 71) They were also
programmed to display other types of expressions such as yawning or even walking out
of the room. In the negative scenario, the audience members were programmed to do
such things as fall asleep on the table, look away from the speaker, put their feet up on
the desk, and slouch in the chairs. The audience in the more supportive group gave the
speaker encouraging head nods, smiles, and faced the speaker. Sometimes they were
even programmed to give the speaker a standing ovation at the end of the presentation.
11
The room was also set up to look like the room in which the participants went into to fill
out their questionnaires. Aside from some of the nonverbal cues that the audience gave
the speaker, they were also programmed to give different verbal responses like, �I see�,
�That�s interesting�, or, �That�s absolute nonsense.� (71) All of this was designed to
help give the speaker the most real simulated experience as possible. An operator
working the virtual animation machine, that was unseen by the participants, was in
control of when to use the vocal comments, and when to have the audience give certain
nonverbal cues. This also helped to add to the level of reality experience by the
participants.
The participants came from staff and student volunteers from a university in
London (Pertaub, Slater, & Baker, 2002). They were asked to come to the Department of
Computer Science on two different occasions. During their first visit, they were asked to
fill out two different surveys, the Personal Report of Confidence as a Speaker (PRCS)
and The Fear of Negative Evaluation (FNE). Finally, they were asked to complete the
SCL-90-R, �a standard symptom checklist that was used to screen for potentially
confounding conditions.� (p. 72) With this test, the researchers were looking for signs of
any major psychological disorders, including anxiety or depression. After all of the tests
were completed, the participants were asked to prepare a five minute presentation that
would be delivered several days later. It could be on any topic of their choice. The
participant�s were told that they would be giving the speech twice to a virtual audience,
but they were not told any more about the program then that. When they returned several
days later to give their presentations, they were asked to complete two more surveys
before beginning their presentations. One of the surveys dealt with their level of anxiety
12
when preparing for the presentation and the second one dealt with their experience of
social situations.
The participant�s that gave their presentation using the virtual head set were
placed in a darkened room with the door shut. The participant�s who were using the
computer monitor were also placed in a darkened room with a 21 inch monitor. All
participants were given headphone and a microphone. For ethical reasons, the subjects
who gave their final talk to the negative audience were asked to give a very small talk to
the positive audience so that all participants were able to leave under positive conditions.
No data was collected or used from this final talk.
When the speaker began giving their speech, the operator of the computer
program, which was listening from another room, controlled the verbal and nonverbal
responses of the audience members. In the case of the static audience, the operator was
only there to listen to the speech. After their speech, they were asked to fill out several
questionnaires that dealt with the experience of their speech. After the experiment was
complete, the participants were given a chance to speak at length about the experience in
a debriefing session.
After analyzing all of the data collected, the researcher�s found that those
participants who gave their presentation to a room full of negative people had a higher
level of anxiety than those who gave their talk to the more supportive audience; even
though they knew the audience was virtual and not real. As could be expected, there was
a greater immersion level for the participants using the head set than for those using the
computer monitor. There was also a greater immersion level for women as a whole than
for men. The researchers hypothesized that this could be due to the fact that the women
13
did not play as many video games as men, and therefore, were a little more impressed
with the experience. This was only hypothesized though, and is something that will be
looked into in future research (Pertaub, Slater, & Baker, 2002).
Although there are many factors that effects a speakers communication
apprehension in the classroom, such as peers, topics, or evaluations, the article above
certainly does draw a strong connection to the level of audience participation in that
experience. The participants in the above study had many of the same apprehension
symptoms that many of our current speech students deal with in an actual classroom
setting. Some of them included butterflies, nausea, sweaty palms, and dry mouth.
Performance visualization can play a key role in helping individuals overcome their
speaking anxiety, and in turn affect other areas of their life, including the jobs they apply
for and get.
Instruction Level
The amount of instruction that a student receives in the classroom has also been
shown to have an effect on their level of communication apprehension. A study by
Rubin, Rubin, and Jordan (1997), looked at two basic questions; does the skills training
offered by the general public speaking class affect a students� level of communication
apprehension, and secondly; �do those who remain enrolled in the basic course at the end
of the semester differ from those who drop out in terms of their initial levels of
communication apprehension and competence.� (Rubin, Rubin, & Jordan, 1997, p. 104)
To collect data for this study, the researchers administered the PRCA-24 and the Self-
Perceived Communication Competence measure to a total of 884 students who were
14
currently enrolled in and attending the first week of school at a large Midwestern
university. In total, the students were enrolled in 41 sections of a basic communication
course. Towards the end of the semester, the measures were given again. This time, out
of the 884 students that originally completed the measures, only 517 were available to fill
out the measure a second time. Correlations were then run on the data to see if there
were any significant differences. The researchers found that there was a negative
correlation between communication competence and communication apprehension. It
appears that there is a relationship between the amount of training that a student receives
and their level of communication apprehension.
Several researchers have also looked at the communication apprehension of
students in a master�s of business administration program (Burk, 2001). The uniqueness
of this study comes from the fact that the majority of the research that has been done in
classrooms about communication apprehension has come from public speaking related
classes. The researcher of this article thought that a group of accounting majors would be
a unique sample to test for communication apprehension. For this research study, Burk
looked at several different research questions, but he was mainly interested in looking at
whether an MBA student�s level of communication apprehension is different from that of
the national average. He looked at several different variables to help determine if there
was a difference in the apprehension levels of MBA students� to the national average
including prior work experience, the completion of communication classes,
extracurricular activities, specialization within the department, culture, and the
participants major as an undergraduate (Burk, 2001, p. 52).
15
The participants for this study came from students enrolled in an MBA program at
a large Midwestern university. A total of 121 surveys were sent out and 95 were
returned, with 85 of them being complete. The incomplete questionnaires were not used
in this study. Of the surveys used in this study, those responding that they were from the
United States were grouped into one section while those stating that they were from a
country other than the United States were grouped into another category. Burk believed
that an individual�s cultural background may have a significant impact on their level of
communication apprehension. The undergraduate majors were also split up into three
categories; �business-related, math-related, or other majors.� (Burk, 2001, p. 54) Most of
the students who stated their undergraduate majors where in the business-related fields
had specific majors of �accounting, finance, management, etc.� (Burk, 2001, p. 54) The
math-related majors were from areas like, �engineering, math, computer science, and
technology.� (Burk, 2001, p. 54) Any other majors listed were compiled into the other
major category. Of these students, no more than three had the same major. After
collecting the PRCA from all of the participating students, Burk found that the student�s
scores, 64.93, were comparable with the national average. On a positive note, Burk
inferred, that based on previous research, students with high communication
apprehension do not necessarily drop out of school. They may continue to stay in school
and continue on for higher education because they are staying in an environment that is
comfortable and familiar to them. They know and are ready for the communication
encounters that they will be faced with in an academic setting and are comfortable
continuing on with their higher education, and not dropping out of school, as some other
research studies have suggested.
16
Another similar study looked at communication apprehension experienced by
accounting students (Borzi & Mills, 2001). Since the 1980�s there has been a push on
accounting students to focus not only on their accounting skills, but also on their
communication and interpersonal skills. With a lack of interpersonal skills, a student
who is technically advanced may never be asked back for a second job interview. The
researchers of this article �surveyed upper-level accounting students to determine
whether new curriculum programs and activities are reducing the level of communication
apprehension.� (Borzi & Mills, 2001 p. 195) 289 students enrolled in upper division
accounting courses were surveyed using the PRCA, the Shyness inventory, and the
Receiver Apprehension Survey, as well as a group of demographic questions.
Participation in the study was completely voluntary. In line with the study discussed
above, the researchers found that accounting majors had a lower apprehension score than
the students who were not accounting majors. Both the Receiver Apprehension Survey
and the Shyness Inventory were found to not be significant. The researchers did find that
female accounting majors had lower levels of communication apprehension than did
females from other, non-accounting majors. On the other hand, male accounting majors
had higher apprehension levels than males in non-accounting majors. The data collected
also indicated that although the overall apprehension levels were lower than expected, the
students had a high level of group apprehension. Although the apprehension levels were
lower than expected, some interesting data still come out of this research study. The
researchers concluded that although the apprehension levels of accounting students is
decreasing, there still needs to be more investigation on the students level of interpersonal
skills. This is essentially what is holding many graduates back when looking for jobs.
17
A similar study was done by looking at accounting students, but the sample was
narrowed down even further by looking at nontraditional students in the accounting field
(Elias, 1999). For the purpose of this study, a nontraditional student was classified as a
student 25 years or older. Two different types of communication apprehension were
tested using two different measures. First, Elias looked at written apprehension by
administering an instrument developed by Daly and Miller in 1975. Secondly, Elias
looked at the nontraditional students� level of oral communication apprehension by
administering the PRCA. Demographic information was also gathered from each
student. A total of 126 students participated in the study, all on a voluntary basis. Based
on the results of the surveys administered, the average writing scores of the nontraditional
students was higher than the national norms reported for the test. This was also the case
for the oral communication aspect of the study. In contradiction to the study done by
Borzi and Mills (2001), Elias found an increased level of communication apprehension
among the women surveyed. Elias stated that research has shown that women are treated
differently in the classroom, and are not called on as often, thus leading to an increase in
communication apprehension. As an overall population, the nontraditional students were
less apprehensive than traditional college students. The nontraditional students may be
less apprehensive as a whole due to the fact that they have a little more experience with
what is required in the accounting field, and feel more comfortable with the material than
the younger students do.
A study about communication apprehension looked at classroom apprehension in
Nigerian classrooms. This study was done by Olaniran and Roach (1994). Because
culture, and the way a child is raised, has a large impact on their communication skills,
18
the focus of this article looked at the effects of communication apprehension in the
Nigerian classrooms. Participants for this study volunteered from three different high
schools in Nigeria. There were 110 participants in total. Data was collected from using
non-translated forms of the PRCA and the Classroom Apprehension Scales. Several
demographic questions were also asked of each participant. Since English is the national
language in Nigeria, and students from kindergarten up through high school are taught in
English, translation was not a concern for the researchers. After collecting data and
running their analysis, the researchers concluded that on average, Nigerian students
scored lower on both the communication apprehension scale as well as on the classroom
communication apprehension scales. There was also an effect on communication
apprehension if the course was in the students� area of interest (or major). The
researchers state that there is a great deal of pressure on students to perform verbally
when called upon in the classroom setting. Because of this pressure, students would be
more concerned with doing well in their course of major interest, and thus,
communication apprehension would increase (Olaniran & Roach, 1994, p. 387).
Roach, (1999) looked at teaching assistant�s communication apprehension, and
the effect that the TA�s apprehension had on their students. Among other things, the
study looked at if their CA was �related to student ratings of the instructor, student
perceptions of affective and cognitive learning, student perceptions of teaching assistant
power base use.� (Rocah, 1999, p. 172) Participants for this study came from a
�stratified random sample� of a group of participants who mailed in responses to a survey
used in a prior research study (Roach, 1999, p. 173). From this sample, 29 TA�s allowed
surveys to be distributed to their students. Subject matter for the courses came from a
19
wide variety of subjects, including biology, math, sociology, and communication studies.
Other areas of education were also surveyed.
The numbers from this study provided some interesting results. After running
correlations, Roach found that there was a significant relationship between a teaching
assistants willingness to communicate as well as the students perception of the TA�s
nonverbal immediacy. This presents several different scenarios. If a TA has a high level
of communication apprehension, they may be more apt to ignore classroom problems,
and ignore the situation. They are also viewed as less immediate or approachable by their
students. This in itself has a large impact on a students learning process.
Communibiological Apprehension
Studies have even been done linking a person�s heart rate with their level of
communication apprehension (Booth-Butterfield, 1987). To test this, the researcher fist
randomly selected twenty two sections of undergraduate courses at a large Midwestern
university. No specific course was pointed out. The instructors of these courses were
asked to have their students� complete different measures of trait-communication
apprehension as well as socio-evaluative anxiety measures during class. Trait-
communication apprehension was measured by The Form Trait Scale, and the socio-
evaluative measure used was the Y-2 Trait Anxiety Scale. Some demographic
information was also collected. Out of all the sections, 409 students completed both
measures. The researcher then took the data, and selected participants for the next stage
of the experiment. Participants were chosen based on three different criteria; they had to
have an elevated level of socio-evaluative anxiety, an elevated level of context based
20
communication apprehension, and an elevated level of trait-communication
apprehension. Those who met all three criteria were contacted and asked to participate in
a �biofeedback experiment� (Booth-Butterfield, 1987, p. 390). �Of the 151 students
contacted, 53 volunteered. Of these volunteers, 38 actually showed up and completed the
experiment� (Booth-Butterfield, 1987, p. 390). Of the group that showed up for the
experiment, 17 were considered to be highly apprehensive, while 21 were classified as
low on the apprehension scale. As soon as the participants arrived, a pulse rate monitor
was placed on them in order to get a baseline heart rate. After this was done, the
participants were informed that they were to prepare a two minute presentation that they
would present to a professor of public speaking. They were told that they would be
judged on content as well as delivery style. They were able to pick a topic from a pre-
made list of five topics that was placed on a podium in front of them. Each participant
was given only thirty seconds to plan their presentation before being asked to begin their
presentation. For analyzation purposes, the presentation was split into four thirty second
segments, 30, 60, 90, and 120. Once the participants completed their presentation, they
were asked to complete a state � communication apprehension measure. They were then
debriefed and paid a minimal fee for their participation.
The difference in heart rate between those with high apprehension and low
apprehension is quite drastic. Those with low apprehension levels showed a dramatic
increase in their heart rate when they were presented with the idea of having to perform a
speech. But within the first thirty seconds of their two minute speech, their heart rate was
back to their base rate. Those with high apprehension levels also experienced a sharp
jump in their heart rate when asked to given a presentation, but their decline back to their
21
base rate was much slower than those with a low level of apprehension. �This group
shows the rapid rise to confrontation and then the gradual recover through adaptation.�
(Booth-Butterfield, 1987, p. 395) Although when the heart rates were graphed out, there
was a similar appearance between those with high apprehension and low apprehension,
there is clearly a difference in the way that an individual responds to the prospect of
giving a presentation. This study helped to show a strong connection between a person�s
level of apprehension, and the physical reaction that takes place within the body.
When looking at all of these different forms of anxiety, it is important to note the
difference between actual anxiety and worry. Kelly (2004) noted that worry is generally
classified as �a stream of negative thoughts.� (p. 370) On the other hand, anxiety is
classified as a state that �tends to include somatic tension, fear, and subjective sense of
unease� (Kelly, 2004, p. 370). It is apparent with all the different contexts that we find
communication apprehension, that it is something that plagues many people, and is
something that warrants this amount of research. But within communication
apprehension, there are levels. These levels play a major part in how a person with
communication apprehension acts in situations, and is important to look at when
discussing communication apprehension.
As noted previously, there has been an extensive amount of research done on all
the different areas that people experience communication apprehension. Another aspect
of communication apprehension that is starting to receive a lot of attention is the
communibiological perspective. This perspective contends that apprehension is not just a
personality trait that is learned from social interactions, but is something that is inborn. If
22
this is the case, it would mean that communication apprehension is something completely
independent of the social learning process (Beatty, McCroskey, & Heisel, 1998).
Many research studies are starting to become available that look at the
communibiological side of apprehension. One such article that found a tie in to the
communibiological paradigm was done by Beatty and Valencic in 2000. The purpose of
their study was two fold; first, they hypothesized that students who were required to plan
more for their presentation would have a higher level of state anxiety than those who did
not have to plan as much, and secondly, �both public speaking apprehension scores
(Context-based CA) and demand for speech planning skills should contribute unique
variance to the prediction of anticipatory (state) anxiety scores� (Beatty & Valencic,
2000, p. 64). In their study, they looked at sixty three undergraduate students that were
enrolled in two different sections of an upper level communication class. The students
were asked to fill out the PRCA-24 to gage their level of public speaking apprehension.
Before delivering their presentation, each student was also asked to fill out a state anxiety
measure developed by O�Neil, Spielberger and Hansen in 1969. Each student was
randomly assigned to present either a directive or a nondirective assignment. Before the
students gave their presentation, they were asked to indicate how much preparation was
needed to prepare their presentation. Low demand tasks were considered to be more
directive. The students presenting a directive presentation were given between 10 and 15
minutes to deliver their presentation; most of the topics revolved around journal articles.
Those who were chosen to give a more nondirective presentation were asked to discuss a
topic that was covered in class that week. There was no minimum time limit for the
presentation, but they were asked to keep the presentation to less than thirty minutes. To
23
make sure that �the performance task described as demanding performance planning did
in act require more ability than the task described as less demanding,� each student was
asked to fill out three Likert-type items (Beatty & Valencic, 2000, p. 66). The questions
asked students to respond to things like whether their visual aids were effectively
prepared, whether the assignment required them to organize material, and whether the
assignment required them to know what would be interesting to the audience. This
helped to check the validity of the experiment. �The results of the present study indicated
that while (trait) public speaking apprehension predicted anticipatory state anxiety scores,
reduced demand for pre-performance planning skills did not significantly affect anxiety
experienced immediately preceding a performance.� (Beatty & Valencic, 2000, p. 67)
While the hypothesis of this study could not be supported, the researchers were able to
find a strong tie between their results and the communibiological model of
communication apprehension. They were able to find a link to the study done by Beatty,
McCroskey, and Heisel (1998) that shows that the neurobiological system accounted for
�a substantial portion of variance in anticipatory anxiety.� (p. 68)
I believe it is important to look at the communnibiological perspective when
addressing communication apprehension in the workplace. A person�s biology is what
makes up their characteristics. By knowing if a person has a high level of
communication apprehension, you will be better able to decide if they will fit the position
in which a company is hiring for. I am not proposing that managers use an individual�s
level of communication apprehension as a discriminating factor in a job interview, but
instead, if that individual qualifies for the desired position, but has high communication
apprehension, then possibly the position could be adapted to better fit that individual.
24
This would be done much in the same way that a position would be adapted to fit
someone with a physical disability.
Let�s turn our attention now to different behavioral patterns that are present in
those with high communication apprehension as well as low communication
apprehension.
Behavioral Patterns of Communication Apprehension
McCroskey and Richmond (1977) define high communication apprehension as �a
person for whom apprehension about participating in communication outweighs the
individual�s projection of gain from communicating in a given situation.� (p. 40) Ayres
and Heuett (1997) outline a barrage of effect that having a high level of communication
apprehension causes. They state in their research, that an individual with a high level of
communication apprehension prefer jobs with as little communication as possible, and
they are not generally as dominant as those with a low level of communication
apprehension. These individuals usually did not volunteer to lead the group. They are
also characteristically not assertive or responsive. Usually people with high
communication apprehension do not like the way in which they express themselves and
meet people.
Communication apprehension can also play a part in a person�s level of self
esteem. McCroskey, Daly, Richmond, and Falcione (1977) found that individuals who
have a high level of communication apprehension also have a low level of self esteem.
As far as school work is concerned, they usually view school negatively and tend to drop
classes which require large amount of communication, such as speech classes. In
25
addition to this, those with high communication apprehension are viewed to be less
skillful, and additional training is often offered to these individuals (Greene, Rucker,
Zauss, & Harris, 1998). Winieck and Ayres (1999) found that those with high levels of
communication apprehension tend to hold lower level jobs than those with less
apprehension. Winieck and Ayres (1999) also found that the length of time a person in
employed in a company has no bearing on their level of apprehension. This means that a
person could work for the same company for the majority of their life, and still feel
apprehensive in their job. Another very interesting observation came from this research.
Those with high levels of communication apprehension also have lower levels of pay.
The researchers could not say for sure if the individual wanted to be considered for a
promotion, but the data did show that in general their pay scale was lower than those with
low levels of communication apprehension. A possible reason given for this was that the
employees with a higher level of communication apprehension were typically not sought
out for input or suggestions. This does not necessarily mean that they did not have
anything to contribute to the company, but because their level of apprehension was so
high, they were generally not sought out to give new ideas to the company, and therefore
remained unnoticed.
There are several different behavioral patterns that are associated with high levels
of communication apprehension. The first behavior that is common in people with high
communication apprehension is avoidance. If someone or something makes us
uncomfortable, it is easiest to simply avoid that person or the situation entirely.
Sometimes avoidance is not possible. A person could find themselves in a situation that
makes them uncomfortable without any warning. In this case, that individual might
26
resort to using a withdrawal technique. If a person is forced to speak to someone that
they are uncomfortable around, they may only answer questions by agreeing with that
person. The same would hold true in a classroom situation. They would not offer up any
answers unless they were called upon to do so, or if they find themselves having to give
an impromptu speech, chances are it would be very brief. The third type of behavioral
pattern that is observed with individuals who have high communication apprehension is
that of communication disruption. An individual who has this type of behavioral pattern
could be observed as having disfluencies in their verbal interactions, or having unnatural
nonverbal behaviors. A less common form of behavior among those with high
communication apprehension is that of over communication. Although only a small
portion of those affected with high apprehension uses this behavior, it is still a sign. This
type of individual tends to want to try to succeed even though they feel uncomfortable in
doing so. These individuals are often seen as having poor communication skills instead
of having high communication apprehension (McCroskey & Delay 1984). Some studies
have also found that individuals with high levels of communication apprehension tend to
interact less frequently with small groups, and when they do interact, their quality of
contribution is usually far less substantial than that of their peers who do not suffer from
high communication apprehension (McCroskey, 1976).
McCroskey and Richmond (1976), speculated that, �people exhibiting typical
behaviors of high communication apprehensives would be perceived less positively than
people exhibiting behaviors typical of low communication apprehensives.� (p. 14) They
found support in general for this in that individuals with high levels of communication
apprehension were perceived in a less positive light, then their social counterparts. In
27
1976, McCroskey also found that communication apprehension also affects an
individual�s housing arrangement. He found that those with high levels of
communication apprehension tend to live in housing arrangements were communication
is limited. This research helps to prove that all area�s of a person�s life is affected by
having a high level of communication apprehension.
On the other side, there are individuals with almost no anxiety about speaking at
all. These individuals are referred to as having low communication apprehension and are
characterized as being extraverts, or preferring intuition over sensing, and thinking over
feeling (Opt & Loffredo, 2000). These people usually are seeking out chances to
communicate with others (Richmond & McCroskey, 1985). Ayres and Heuett (1997)
point out that these individuals are highly confident in their communication abilities.
These individuals usually flock to the jobs requiring a lot of communication, and are
usually the leaders of the pack. Those with low levels of communication apprehension
are not afraid to speak up in a group or a meeting, and usually enjoy voicing their
opinion. Research has also found that individuals with low communication apprehension
also have high levels of self esteem. This is not the case for those with high
communication apprehension. Individuals with low apprehension are also known to
disclose more about themselves than other individuals (McCroskey & Richmond, 1977).
McCroskey has even gone so far as to call individuals with high communication
�handicapped� (1976).
As you can see, there are many more behavioral markers to identify those with
high communication apprehension than there really for those with low communication
apprehension. From the research examined above, it is clear to see that researchers have
28
spent a great deal of time trying to find out why people experience communication
apprehension. The causes for communication apprehension range from genetics to
learned behaviors (Ayres, Hopf, & Will, 2000). Whatever the reason, many people suffer
from it in their daily lives, and it is important to find the extent to which individuals are
affected by communication apprehension.
Having high communication apprehension in the workplace can cause several
problems. The initial problem, as we have seen is in getting a job in the first place. Once
an individual with high communication does find a suitable place to work, then there can
be issues between coworkers, as well as managers. Some duties may be ignored due to
the fact that it makes the employee uncomfortable. There can also be issues with
coworkers if the employee with high communication apprehension uses avoidance
strategies on a daily basis. This can lead to tasks being unaccomplished, and lead to a
feeling that the employee is not interested in being a team player.
Coping Strategies
With as many different research studies that have been done over what
communication apprehension is and why people suffer from it, it is no wonder that there
are also several articles that look at how to deal with communication apprehension.
Many of the coping strategies that are available can be used by those who have severe
communication apprehension as well as by those who only feel apprehensive on specific
occasions.
One very common form of therapy for communication apprehension, as well as a
wide range of other psychological problems, is Rational Emotive Behavior Therapy
29
(REBT). REBT was created in 1955 by Dr. Albert Ellis, who is the Founder and
President of the Institute of Rational Emotive Therapy, located in New York City. In
1997, Dr. Ellis sat down with Lata McGinn to answer a few questions about REBT and
how it has been used to treat people. According to Dr. Ellis, the underlying foundation
behind Rational Emotional Behavior Therapy states that all people are born with �self-
defeating tendencies.� (p. 309) As humans, we have the choice to feel healthy emotions
when something negative happens, like being disappointed or frustrated. We also have
the choice of having unhealthy emotions such as being depressed, self-pitying, or self-
doubting. Dr. Ellis states that the emotion that we choose depends on our belief system.
Because of this, the REBT system is much more philosophical than other types of
treatments available. REBT helps you change your basic outlook on situations. So
instead of thinking �I have to do well on this speech�, you change to a preference such as,
�I would like to do well, but I do not have to.� �And if people use a whole variety of
cognitive, emotive, and behavioral techniques which REBT shows them how to use, then
by working very hard against their upbringing and their biology, they could make
themselves significantly less disturbed.� (McGinn, 1997, p. 309)
The basics of REBT is knowing your alphabet. You start with �G�, which stands
for your goals. You simply list out what your goal for that event is, it could be to do
well, to have a good time, to get along with others, whatever it is that you want to
accomplish. Then you move onto �A�. This stands for activating the events that could
stand in the way of you achieving your goal. �B� is your belief system. You begin telling
yourself about your goal using your belief system. This includes both the negative, or
unhealthy, side of your belief system, and the healthy, rational side of your belief system.
30
�C� stands for the emotional and/or behavioral consequences which is usually the
disturbance standing in your way of achieving your goal. They could be feelings like
nervousness, or they could be behaviors like �procrastination, or compulsive thinking.�
(McGinn, 1997, p. 310) The last letter is �D�. This stands for �disputing, questioning,
challenging your irrational beliefs until you change them back to preferences.� (p. 310)
There are many examples where REBT has helped people make it through many
difficult times. An article by Weinrach, Ellis, MacLaren, DiGiuseppe, Vernon, Wolfe,
Malkinson, and Backx, (2001), asked several members of the Institute of Rational
Emotive Therapy to give examples of when they personally used REBT on themselves
and had success with the therapy. Several people from the institute gave responses of
how changing the way they though about a situation made it easier to get through a fight
with a relative, or made the pain of having to undergo surgery more bearable. But there
are those who try to use REBT with little success, even if they are the experts in the field.
One such instance came from an employees at the institute. She moved to New York
City from Colorado to work at the institute. Because of the drastic culture change from
Colorado to New York City, she found herself depressed, and barely able to get out of
bed. Although she tried to use REBT to overcome her depression, she was unable to
�identify core irrational beliefs to dispute.� (Weinrach, et al, 2001 p. 266)
From the testimonies that were provided in Weinrache�s article, it is clear to see
that REBT is not applicable in every situation. When treating communication
apprehension, it is important to look at what treatment will be the most effective for that
particular person in that particular situation. This type of therapy can be useful when
employees are interviewing for a job as well. Some of the techniques discussed above
31
could play a very beneficial role when trying to calm down apprehension levels before
going into a job interview.
Some of the more common types of treatment for communication apprehension
include systematic desensitization, skills training, and cognitive modification (Hopf &
Ayres, 1992). Often these treatments are even combined to help produce the desired
results in individuals. Systematic desensitization helps individuals to cope with public
speaking by reducing their level of anxiety by replacing feelings for anxiousness with
feelings of relaxation and calmness. With systematic desensitization, you participate in a
series of deep breathing exercises that help you relax all the muscles in your body, while
you visualize yourself giving a speech, or participating in any other type of
communication activity. Skill�s training assumes that people become apprehensive
about giving presentations because they lack adequate training to perform speeches
(Ayres, et al, 1993). This approach deals with trying to teach individuals the skills they
need in order to compile and deliver a good presentation. Cognitive modification
assumes that individuals approach public speaking with the wrong frame of mind (Ayres,
et al, 1993). This theory states that an individual will feel more apprehensive if they
approach the presentation with negative thoughts in their mind. Cognitive modification
aims at changing those negative thoughts and turning them into positive thoughts. There
have been studies that support each of these types of coping strategies, and even some
that support a combination of them (Hopf & Ayres, 1992).
Job Satisfaction
32
If an employee is working in a job where they feel a high amount of apprehension
on a daily basis, then they may feel a change in their attitude towards their job
satisfaction. There have been many articles published on job satisfaction. In this section,
we will look at some of those articles and also look at how communication apprehension
is affected.
In contrast to communication apprehension, there is no one overarching theme to
define job satisfaction. A general definition is �the overall attitude of liking or disliking a
job.� (Jepsen & Sheu, 2003) What we do know for a fact is that the level of satisfaction
that a person feels at his or her job can play a major part in the level of satisfaction they
experience on a daily basis. This is why job satisfaction is so important in our society.
�You will succeed or fail based on what your employees do.� (Foy, 2004) The bottom
line is that if employees are not satisfied in their position, they will not perform to the
best of their abilities. This will have a great impact on how well or how poorly a
company does. Job satisfaction as a whole is a very broad term, and many different
factors play a role in an individual�s level of job satisfaction at his or her job. Some of
these factors include an employee�s perception of his or her supervisor, their rate of pay,
their frequency of promotion, their perception of their co-workers, and of course, the
actual job itself. Some studies have also found that self-esteem and an employee�s
orientation to communication can also play a role in their level of job satisfaction
(Falchion, McCroskey, and Daly, 1977).
Job Satisfaction is a broad topic that encompasses many different aspects. There
have been two main theories that have tried to help explain what job satisfaction is and
how it can be addressed in an organization. The first theory was developed by Herzeberg
33
in 1959, and is called the motivator-hygiene theory. In short, his theory contends that job
satisfaction and job dissatisfaction are not the reverse of each other, but instead are two
completely different concepts. Herzeberg argues that the opposite of job satisfaction is
not dissatisfaction but no satisfaction, and the opposite of job dissatisfaction is no
dissatisfaction. The main difference pointed out between the two is that job satisfaction
is something that an individual feels about the content of their job, and dissatisfaction is
the result of the feelings that an individual has regarding the context or environment in
which their work is accomplished. The motivator in this theory refers to the variables
that relate to the actual content of the job, such as recognition or achievement. The
motivators work more with the satisfaction side of a job. The hygiene aspect refers to the
variables that relate to the context of the job and include aspects such as employee
benefits. The hygiene variable works more with the dissatisfaction side of a job.
Another method of describing job satisfaction is presented in an article by Hazer
(1976). This theory is loosely called the traditional theory, and in contrast to the theory
described above, it views job satisfaction and job dissatisfaction as being on the same
playing field. The traditional theory looks at the feelings an individual has about their job
as a whole, including both job related factors and environment related factors. This
theory also includes a spectrum of neutrality, indicating that an individual is neither
satisfied nor dissatisfied with their position. According to the traditional theory,
satisfaction and dissatisfaction are polar opposites. Hazer states that �No one person is
responsible for this theory; it has evolved over time as the traditional view.� (Hazer,
1976, p. 13)
34
The research field is divided when it comes to choosing a definition for job
satisfaction. Many feel that there is more evidence to support the motivator-hygiene
theory, while others feel the evidence supports the traditional theory. Still there is
another group that contends that neither one is correct. This camp believes that there
cannot be just one simple attitude towards a persons work.
As noted earlier, communication apprehension can even play a key role in the
workplace. It is surprising to many people that your personal fear or anxiety about
communicating with others can effect more than just yourself. A study done by Cole and
McCroskey (2003) found that �Supervisors who were seen as apprehensive or verbally
aggressive were seen as far less credible than those who were less apprehensive or
verbally aggressive.� (p. 104) So as a manager, if you have a high level of
communication apprehension, you run the risk of being seen as less credible by your
employees. This in turn will have an effect on your level of job satisfaction. In the next
several pages, I will examine some of the work that has been done with apprehension in
the workplace and the effect that it has had on employee�s job satisfaction
Employer Immediacy
Of the many factors that influence job satisfaction, one of these factors is the
immediacy of an employer. Along the same lines as the study done by Cole and
McCroskey, (2003), Richmond and McCroskey (2000) looked at how an employers level
of immediacy effects employees. �Immediacy is indicated by such behaviors as looking
at someone, leaning toward someone, touching someone (in a non-threatening manner),
sitting near someone, speaking in an animated way toward someone, and smiling at
35
someone.� (p. 86) Participants for this study came from adult volunteers who were
enrolled in extended learning courses in three different areas. Each volunteer was given a
survey with instructions to give the survey to four different people at varying levels in
their organization. Several different surveys were used, including The Self-Report of
Immediacy Behavior to look at participant�s perceptions of their own immediacy, source
credibility measures were used to look at three dimensions, competence, goodwill, and
trustworthiness, of source credibility. Two levels of interpersonal attraction, namely
social and task, were also measured along with the Generalized Attitude Scale to
determine the participants attitude toward their supervisor. Along with these surveys, the
researchers asked the participants to fill out an instrument designed to gage a
participant�s level of motivation, as well as the Generalized Belief Scale to look at job
satisfaction.
After running correlations, the researchers found that �supervisors who were perceived as
high in nonverbal immediacy were also perceived as credible and attractive.� (Richmond
& McCroskey, 2000, p. 93) They found that credibility and attractiveness were
positively related to an employee�s job satisfaction. So, if an employee finds his or her
employer to be more credible, then they will be more satisfied in their job, and more
willing to stay with the company.
A study done by Falchione, McCroskey, and Daly, (1977), found that a
subordinates �satisfaction with immediate supervision is closely associated with
perceptions of supervisor communication behavior, credibility, attractiveness, and
attitude homophily, and to a lesser extent with oral communication apprehension and
self-esteem.� (p. 363) Many aspects were taken into consideration when this study was
36
developed, including employee communication apprehension, self esteem, perceived
supervisor credibility, perceived supervisor attractiveness, perceived homophily, and
perceived supervisor listening, understandingness, and communication (Falchione,
McCroske, & Daly, 1977, p. 366). The goal of the researchers was to determine how
closely each of the above variables was associated with job satisfaction, if employee
satisfaction can be predicted based on the above variables, and what combination of the
variables above could be used to predict job satisfaction.
For their experiment, measures for all of the above variables were administered to
211 employees working at a federal research establishment. A second population of 189
elementary and secondary teachers from several different schools in three different states
were also surveyed. After the analysis was run on all of the data (each population was
analyzed separately) it was found that an individuals PRCA score was a significant
predictor of their level of supervisor satisfaction. It was also found that an individual�s
level of sociability was a predictor of the employee�s level of satisfaction with their work.
Several other correlations were found, but they were specific to their sample, and were
not parallel with the other sample. They also found that an employee with high
communication apprehension or low self esteem is more likely to be satisfied with their
employer�s behavior no matter what the behavior is.
Employee Turnover
It is also important to look at why employees leave a company in the first place
when looking at job satisfaction. There are many things that contribute to an employee
wanting to leave his or her job. A few of these characteristics include wanting higher pay
37
and finding a better career opportunity (Leininger, 2004). Both of these make up a large
portion of what constitutes as job satisfaction. In the computer technology world, low job
satisfaction, low levels of organizational commitment, and stress were all reported among
employees when asked why they would leave their current position (Sumner &
Niederman, 2003-04). Their study focused primarily on gender, and looked at if that
played a role in an individual leaving his or her position. The participants for this survey
came from alumni who graduated from Saint Louis University. Another set of surveys
were also sent to alumni from Southern Illinois University in Edwardsville. All
participants received a mail survey to complete and send back. The participants were
asked to respond to several different things including their starting and ending salary at
their last job, the time difference between when they first thought about leaving a job and
when they actually left, and what the extent of their job search is like, among other things
(Sumner & Niederman, 2003-04, p. 33). Many interesting findings came from the data
collected including the fact that there was as much as a $9000 difference in the amount
that men made over the amount that was made by women. Strangely enough, the women
reported more financial satisfaction than the men. When comparing satisfaction levels
between an employee�s current job and their past job, both men and women reported
having a higher level of satisfaction in their current position. The authors concluded that
the lower levels of job satisfaction indicated in the participants prior job provides reason
for why they left that position. This article helps to show a strong tie to job satisfaction
and pay level. An individual�s level of pay is very influential in their overall satisfaction
and willingness to stay with a company. Communication apprehension can also play a
major role when talking about pay levels, especially in a new position. When in
38
negotiations with potential employers, level of pay is always something that is discussed,
and those discussions can often bring a great amount of apprehension, especially if the
potential employee is not necessarily receiving the compensation that he or she thinks
that he or she deserves.
Predicting Satisfaction
A study done by Richmond, McCroskey, and Davis (1982) looked at several
factors in hopes of predicting a person�s level of job satisfaction. They looked at a wide
array of factors including innovativeness, communication apprehension, tolerance for
disagreement, and management style. For this study, they looked at four different
samples. The first sample was made up of participants who were enrolled in a graduate
course titled �Communication in the Educational Organization� (Richmond, McCroskey,
& Davis, 1982, p. 174), and were also secondary teachers. These participants came from
a variety of different states. The second sample came from managers working at a
company that manufactured kitchen and bathroom accessories. Another sample came
from a group of supervisors who were employees of the state of Pennsylvania. The final
sample consisted of �subjects who were bank managers, cashiers, and upper management
employees in the Federal Reserve System in the state of Virginia.� (Richmond,
McCroskey, & Davis, 1982, p. 175) The researchers of this study stressed the fact that
the first sample was predominately female, while the other three consisted mainly of male
subjects. To test all of the variables that the researchers were looking at in this study,
several items were used including the Job Description Index (JDI), the Tolerance for
Disagreement scale (TED), the Innovativeness Scale (IS), the Personal Report of
39
Communication Apprehension (PRCA), the Management Communication Style (MCS),
the Supervision Scale (SS), and finally the Administration Scale (AS). After the data was
all compiled and analyzed, the findings were presented. The teacher and banker samples
were large enough to be able to duplicate some findings that are consistent with previous
research. It was found in this study that there was a strong relationship between
innovativeness and satisfaction with an employees work. A significant relationship was
also found between innovativeness and satisfaction with an employee�s supervisor in the
banker sample. There was also evidence linking an employee�s communication
apprehension level to their satisfaction with their supervisors. This was present across all
four samples, but only the teacher sample was significant. There was no significant
relationship found between an employee�s level of tolerance for disagreement and their
satisfaction level for any of the samples observed. Being that the results in this study are
consistent with data collected in other studies, it seems that there is some type of
generalizability across organizations.
Giving Employees a Voice/Employee Participation
As managers, it is important to know if employees are content, and if they are not,
then the key is to find ways to identify the problems, and also find ways to solve them
that will make everyone enjoy their working environment. Foy (2004) suggests many
different ideas to helping employees have a voice in what goes on in the company. Foy
suggests that for those employees who would like to remain anonymous, having a
suggestion box where employees can write on a note card what they perceive to be a
problem in the company. Based on the suggestions and/or questions that are asked, the
40
manager will then post responses to the comments either on a bulltein board or send out
responses via email to all members in the company. This is a great way to help
employees feel like they have a say in what is going on, but without the risk of offending
the boss. There are also several other suggestions mentioned in the article including
having open door meeting times for employees to come in and talk to the boss, doing
employee surveys, and simply walking around to see how peoples days are going. By
simply knowing that the manager cares about how all the employees are doing can
sometimes make the biggest difference in whether an employee is satisfied in his or her
job or not.
Job Satisfaction Across Cultures
A 1997 study by Lancy and Sheehan looked at the satisfaction level of academic
staff members both nationally and internationally. The countries that were looked at in
this study were Australia, Germany, Hong Kong, Israel, Mexico, Sweden, UK, and the
USA. Job satisfaction for this research study was spread across several different
variables including, �teaching, professional relationships, job security, promotion
prospects, academic freedom, and management.� (Lancy & Sheehan, 1997, p. 309)
Across the board, most of the academics were satisfied with their job, with those in the
USA being the most satisfied, and those in Germany being the least satisfied (but still in
the range of satisfaction). While satisfaction levels were reasonably high across the
board for the different variables examined, there was a low level of satisfaction in regards
to the prospect for promotion. Germany again had the lowest level of satisfaction in
relation to the chance for promotion. When looking at the satisfaction with the courses
41
that they taught, respondents from the USA and Israel indicated the greatest level of
satisfaction, and Germany reported the lowest level of satisfaction. When looking at their
job as a whole, participants from the USA and Sweden reported high satisfaction levels,
while those in Germany, Mexico, Australia, and the UK reported that less than 50 percent
were satisfied with their job. Of course, it is important to look at each individual culture
and compare that to the satisfaction levels, but there does seem to be some interesting
trends emerging, at least in the academic community.
University Faculty
A similar study to the one previously sited was done by Terpstra and Honoree
(2004). In their study, the researchers looked at the general satisfaction levels of 500
faculty members from 100 different four-year universities in regards to their level of pay.
When looking at the level of satisfaction concerning pay, the researchers also looked at
the department that the employees were in as well as the geographic location they lived
in. Two main questions were asked of the participants; �In general, how satisfied are you
with your job?� and �In general, how satisfied are you with your pay?� (Terpstra &
Honoree, 2004, p. 530-531) Both of these questions were answered on a Likert-type
scale that ranged from 1 (very satisfied) to 5 (very unsatisfied). The participant was also
asked what discipline they belonged to, and were given a list of predetermined answers to
chose from. When analyzing their results, the researchers found a mean score of 2.06 in
terms of general job satisfaction, and 2.83 for pay satisfaction. On a 1-5 scale, this shows
that overall, employees were satisfied with their job, but were less satisfied with their
pay. Those identified as working in the sciences had the lowest level of satisfaction in
42
terms of pay. When broken down geographically, those living in the Mountain states had
the lowest level of job satisfaction (mean = 2.57) and those living in the Mid Atlantic
states had the lowest level of pay satisfaction (mean = 3.23). Based on this research, it
would seem that institutions of higher education might want to reconsider their pay scale
for their faculty members since an individuals level of pay has been strongly tied to their
level of job satisfaction.
Rehabilitation Professionals
A study done by Randolph, Doisy, and Doisy (2005) looked at both the intrinsic
and extrinsic factors that could affect the satisfaction levels of those working in the
rehabilitation community. This included occupational therapists, physical therapists, and
speech language pathologists (Randolph, Doisy, & Doisy, 2005, p. 49). Surveys were
mailed out to organization members from all of the professions listed above. From the
1500 surveys that were mailed back, 328 were deemed usable. Along with the survey,
employees were asked to identify specific extrinsic and intrinsic job factors. Extrinsic
factors where defined as things that could be provided by the employer, including
schedules, benefits, pay, and child care. Intrinsic factors were defined as things
controlled by outside forces, but still have an impact of job satisfaction. Some examples
of these include, career advancement, support by administration, and communication
with management (Randolph, Doisy, & Doisy, 2005, p. 53-54). After analyzing the
collected data, it was found that intrinsic factors had a greater impact on an employee�s
level of satisfaction as compared to extrinsic factors. The authors concluded that
management does not necessarily have to spend all of their time being concerned with the
43
extrinsic factors in a job, but instead should place a little more emphasis on the intrinsic
factors that the employees desire.
Early research indicates that those satisfied the most in their jobs are not those
paid hourly, or even those paid by salary. The most satisfied workers that America has
are those who are self employed (Bradley & Roberts, 2004). This could be due to many
different factors including the satisfaction of having your own business, or being able to
work in the industry in which you have a passion for. There could also be a high
satisfaction rate among those who are self employed due to the fact that they are
automatically in a position of power when they start their own business. According to
McCroskey (1979), ��few high CA�s advance to top positions in organizations.� This is
usually due to the increased amount of communication that those positions require. In
fact, it is unlikely that an individual will ever even reach a position of power or high
status within a company due to the fact that highly apprehensive individuals are less
likely to be offered employment, or even an interview (McCroskey, 1979). No matter
how people find satisfaction within their job, there is still a large gap in the literature
connecting communication apprehension to job satisfaction. Given the large portion of
our society suffering from anxiety in their daily lives, it is important that we look at how
these people are affected by their anxiety in their jobs.
After reviewing the literature, I have found that although there is some research
on communication apprehension in the workplace as it relates to job satisfaction, the
44
research that has been done is not comprehensive, and could use further investigation. I
have read a few articles that touch on the possibility that there could be a major
difference in the workplace concerning employees with a high level of communication
apprehension and those who have a low level. These articles indicate that those
individuals who have a high level of communication apprehension may be the first ones
to be let go from a company or possibly not receive a promotion or a raise because they
are not as outspoken as other individuals in a company.
For this project, I looked at FairMount Minerals. I decided to look at this
company because of the many different job positions they have. There are employees
who only work with customers, and then there are employees who never have to talk to
anyone except for the person working next to them. I felt that this company was large
enough to give me a good variety of people to look at in assessing communication
apprehension as it is related to employee job satisfaction.
The main location of FairMount Minerals that I looked at is actually a subsidiary
company called Santrol, located in Fresno, Texas. I was granted access to survey several
other locations including Bridgman, Oklahoma, Troygrove, Illinois, and Roff, Michigan.
At all of these locations, I was able to survey all the employees who were willing to
participate in my study, from plant managers to maintenance workers. For this research
study, I used several different measures that looked not only at an employee�s level of
communication apprehension, but also at their level of job satisfaction. I kept all of the
surveys confidential from the employers in the company so I would be able to receive
honest answers from employees on their level of job satisfaction. The employees where
asked to leave no identifying marks on the survey of any kind that could be traced back to
45
them. This was made clear in the instructions provided with the survey. The following
research study looked at the following questions:
RQS #1: How does an employee�s communication apprehension relate to his or her job satisfaction?
Based on some of the research that has been done in the area of behavioral
patterns of those with communication apprehension, such as the study done by Winieck
and Ayres (1999), stating that those with high communication apprehension tend to hold
lower levels of jobs and have a lower level of pay, I presented the following hypothesis to
see if employee�s at FairMount Minerals hold some of the same patterns as found in the
previous research.
H 1: Individual�s with high self reported levels of communication apprehension will be more likely to consider changing organizations.
Although an individual�s level of communication apprehension may have a great
deal of effect on their level of job satisfaction, there also may be other factors that
contribute to this. Therefore, I also looked at how an employee�s level of state anxiety
affects their level of job satisfaction.
RQS #2: How does an employee�s level of communication apprehension relate to his or her level of state anxiety?
Because we have seen how a particular situation, such as a classroom setting, can
affect an individual�s level of communication apprehension, I also posed the following
hypotheses to explore the relationship between state anxiety and job satisfaction.
H 2: Individuals with high self-reported levels of state anxiety will have low levels of self reported job satisfaction.
H 3: Individuals with high self-reported levels of state anxiety will be more
likely to consider changing jobs.

46
I think it is important for employers to know what is going on with their
employees. If an employer is overlooking an employee just because he or she has a high
level of communication apprehension, they could be missing a great opportunity to
improve their company. Just because an employee has a high level of communication
apprehension does not mean that they do not have a lot to invest into a company and its
success. Employers need to understand these differences in people and know how to
work with all levels of communication apprehension. By knowing where an employee is
on an apprehension scale, and employer can better handle situations that come up in the
workplace, as well as understand whey employees act a certain way in particular
situations.
I believe we can also learn a lot by knowing how an employee�s level of job
satisfaction relates to their level of communication apprehension. It could be possible
that those individuals with high levels of communication apprehension do not try to get
better jobs because they are afraid of being rejected. This information could be very
useful to employers. If they are finding that they have a high level of turnover, it could
be because they are hiring the wrong type of people to do a specific job. I believe that
this information could have an endless amount of use in the workplace. And it is
something that every employer could be capable of finding out.
By knowing an employees level of comfort in his or her job, an employer could
make any necessary adjustments in order to increase productivity as well as maintain an
enjoyable working environment. I believe that this study could be the first step in helping
employers know what is going on with their employees.
47
FairMount Minerals
FairMount Minerals was founded in 1986 by a small group of entrepreneurs.
They began with only two locations, one in Chardon, Ohio, and one in Wedron, Illinois.
Today, they are the third largest industrial sand producer in the United States. The
company consists of eight active mining facilities, as well as the second largest
commercial Foundry resin-coated sand producer with three manufacturing facilities.
As common as sand may be, almost every major manufacturing division uses
some form of this product. It is the goal of FairMount Minerals, as well as their
subsidiary companies, to provide the best product and service to all of its customers.
They currently serve several large industry divisions, including, glass, foundry, golf
course, landscape, oil and gas, industrial coatings, abrasives, play sand, including their
colored quartz line, and filtration. (www.fairmountminerals.com)
Products
FairMount Minerals produces a wide variety of manufactured sand products, or
proppants. Each type of manufactured sand is designed to serve a different job. When
companies go out to extract oil and natural gas from the earth, the majority of the time the
will need to frac the rock. Most of the wells that were just overflowing with oil do not
exist any more, but there is still a great deal of natural resources tightly packed within the
rock layers of the earth. To extract the oil and gas from the rock layers, a process of
fracing must occur. To frac a rock means to create fractures in it to help relieve the
pressure that is trapping the natural resources below the surface of the earth. These
fractures are created by using high powered air to help break the tension within the rock
48
structures. The problem that companies are facing is that when the fractures are made,
they tend to close back up very quickly due to the pressure underground. This is where
the products produced by FairMount Minerals come in. The different proppants that are
manufactured are designed to be placed in the fractured rock structures to hold them
open. They create a solid barrier to keep the rocks from closing up while at the same
time remaining porous enough for oil or gas to pass through. They are also designed to
stay in the rock and not flow back to the top while the natural resource is being extracted.
The type of proppant that you need will depend on where you are drilling, what depth
you are using the proppant at, and what the temperature is. For example, if you are
drilling in Canada, where the weather tends to be colder than in Texas, then you would
use PolarProp, since it is better suited for drilling in cold weather. Some times a
combination of different proppants is need to achieve the desired results. Many
companies will use two or three different types of resin coated sand in a specific order
depending on where they are drilling and the desired goal they are trying to achieve.
Whether you are looking for a low cost resin-coated sand, or a light weight ceramic
FairMount Minerals can supply exactly the product you need to get the job done. All of
the manufactured sands produced at the various locations of FairMount Minerals are
designed to provide flow back control, resist crushing, and minimize embedment. Their
products range from the Super LC, which is designed to be the economical replacement
for all 20/40 FRAC Sands (20/40 refers to the size of the grain of sand), to the HyperProp
G2 which is designed to produce high long term flow rates at high closures, to OptiProp
G2 which is the most technologically advanced resin coated product that is offered at the
49
Santrol location. It is designed to provide extra resistance to stress cycling, and also
allow for flow back.
The manufactured sand and resin industry is a rapidly growing industry that
requires many of its employees to be on call 24 hours a day, 7 days a week to assist
clients and customers with their orders. The process of receiving this product is also very
intricate. The treated sand cannot be exposed to any elements, and must be transported
either by covered trucks or on rail road cars. If the proppants are exposed to the
elements, they could be damaged, causing major problems for those trying to use the
products. The growth of this industry is really starting to pick up. In the next year alone,
Santrol expects to see a 60% increase in their amount of business. This is on top of the
rapid growth that the company has experienced in the past several years.
50
CHAPTER II
METHODOLOGY
Participants
For this study, I went to several different subsidiary companies of FairMount
Minerals and surveyed as many of their employees as are willing to participate.
Participants were both male and female, and of many different cultural and educational
backgrounds. The age range of the employees who participated in this study was from 17
to 82 years old. As you can see, there was a wide variety of participants in this survey. I
was able to get participants from several different departments in the company, including
customer service representatives, sales representatives, CPAs, research associates, plant
managers, lab technicians, receptionists, and many other departments. By having
participants from this many departments, I was able to get a clearer picture of what was
going on in the company at the time the survey was taken. I believe it is important not to
segment out only one or two different departments. By doing this, you would not be
getting a true representation of the entire company. In total, there were 210 participants
from all four locations. The participants were picked solely on the fact that they worked
under the umbrella of FairMount Minerals. All the employees were asked to voluntarily
participate, and no employee was denied the opportunity to participate in the research
study.
Instruments
51
To gather my data, I used several different surveys. First of all, I asked the
participants to fill out a short demographic survey, (appendix A). I was looking to see
how long each individual has worked at the company, as well as their educational
background, and the department they are currently working in. I also included several
open ended questions asking my respondents to describe why they left a certain
department, or if they would ever consider changing jobs and or organizations. I consider
this information to be very important when looking at job satisfaction.
Next, I used the PRCA-24, (appendix B) to assess each employee�s level of
communication apprehension (Richmond & McCroskey, 1985). The PRCA-24 is a
measure consisting of 24 items on a Likert-type scale ranging form 1 (strongly agree) to 5
(strongly disagree). The test contains four different components that are all important
when looking at communication apprehension. These components are group, meeting,
interpersonal, and public. The total range in scores is from 24 being very low
apprehension to 120 being very apprehensive. Some of the questions include, �I dislike
participating in group discussions�, �Usually I am calm and relaxed while participating in
meetings�, �While participating in a conversation with a new acquaintance, I feel very
nervous�, and �I have no fear of giving a speech.� All of these questions help to obtain
an individual�s overall level of communication apprehension. This test has been proven
to have very good validity and reliability levels. For this study, I found an alpha
reliability coefficient of .95. . Scores for the PRCA ranged from 24 to 50 being
classified as having low CA, 50 to 65 as being average CA, 65 to 80 as being moderately
high CA, and 80 and above as being high CA
52
I also used a survey to gage how satisfied an individual is in his or her position
within the company. The job satisfaction survey that I used is a modified version of the
Job Description Index, (appendix C) that was originally created by Smith, Kendall, and
Hulin. (1969) The modified version comes from a master�s thesis project by Martha
Mathews in 1983. Instead of the participants answering �yes�, �no�, or �?�, which was
used on the original survey, the scale was changed to a Likert-type scale. This helped to
increase the reliability of the scale. The scale ranged from 1 (strongly disagree) to 7
(strongly agree). As with the PRCA-24, this scale was also broken down into several
different subscales; work, pay, promotion, superiors, and coworkers. This scale ranged
from 5, being very unsatisfied, to 105, being very satisfied. Questions for this measure
included, �My supervisor is easy to please�, �It is easy to make enemies with my co-
workers�, �My work is boring�, and �My pay is good.� When reliability tests were run, I
found an alpha reliability coefficient of .86.
The final survey that was used was also created by McCroskey (1978), and is
called the Situational Communication Apprehension Measure (SCAM). The situational
communication measure is designed to look at how apprehensive an employee is in
particular situations (appendix D). The SCAM is also a Likert-type measure with its
scale running from 1 (extremely inaccurate) to 7 (extremely accurate). The SCAM asks
respondents to think about the last time they interacted with someone who had a
supervisory role over them, and answer the questions based on that interaction. Some of
the questions on this measure include, �I was disturbed�, �I felt jumpy�, �I felt satisfied�,
and �I was cheerful.� For the purpose of this study, the scale ranged from 33, having a
low level of situational apprehension to 135, having a high level of situational
53
apprehension. When running reliability tests on this survey, I found an alpha of .88. The
range for this instrument was 39 to 65 being classified as being low, 66 to 91 as being
moderate, and 92 and above as being high.
Procedures
In order to get my survey to employees working all over the United States, I relied
on the help of Mr. Syed Akbar. He is a chemist that works for the Santrol branch in
Fresno, Texas, located just outside of Houston. I sent the completed survey to Mr. Akbar
via email, and from there, he printed off copies and distributed them to the employees at
his plant. He also emailed the survey to the other locations, and the managers at those
plants did the same. When the employees were finished with the survey, they were given
back to Mr. Akbar, either in person as was the case with the employees in Fresno, or by
mail. On a trip to Houston, I was able to pick up several of the packages personally. The
surveys that arrived after I was there were mailed to me in Lubbock.
After all of the surveys were collected, the data was entered in to SPSS for
analyzation. With the open ended questions, I was able to create a spread sheet
separating out positive, neutral, and negative answers that were given. This created a
more efficient way of finding the emergent themes that were present. Correlations and
ANOVA�s were run on the data to determine if any significant results were present.
Analysis
Some interesting demographic information was discovered when entering the data
from the participants.
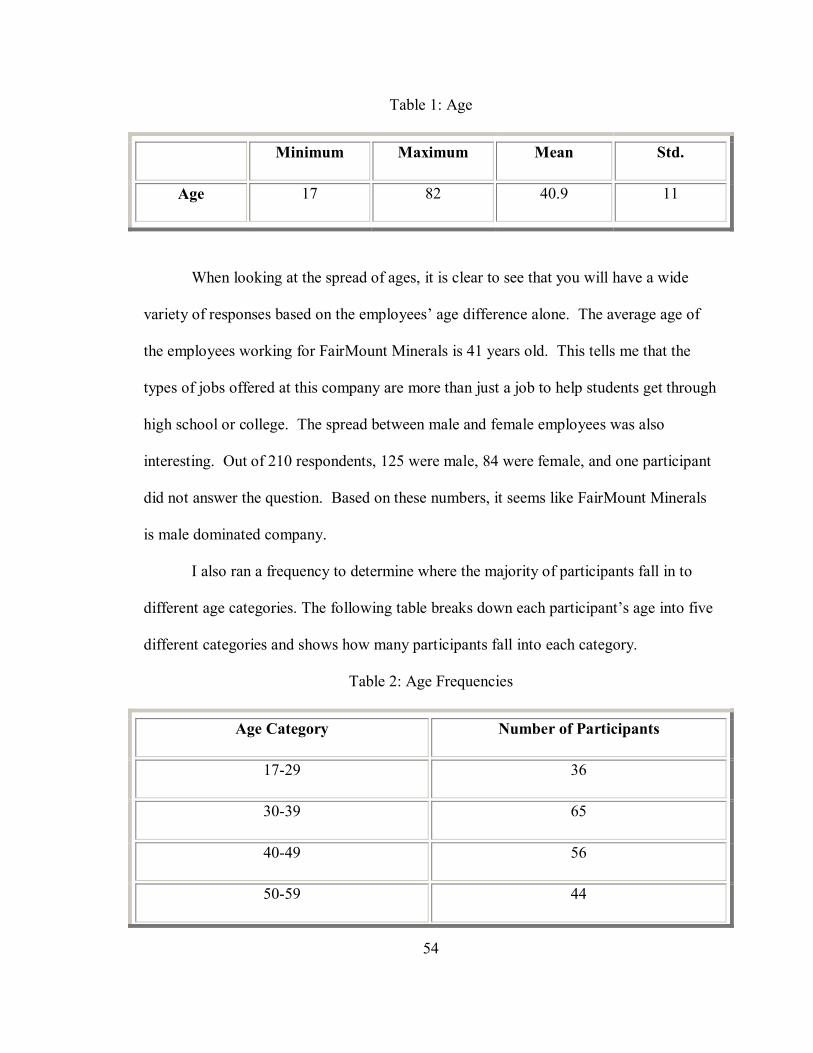
54
Table 1: Age
Minimum Maximum Mean Std.
Age 17 82 40.9 11
When looking at the spread of ages, it is clear to see that you will have a wide
variety of responses based on the employees� age difference alone. The average age of
the employees working for FairMount Minerals is 41 years old. This tells me that the
types of jobs offered at this company are more than just a job to help students get through
high school or college. The spread between male and female employees was also
interesting. Out of 210 respondents, 125 were male, 84 were female, and one participant
did not answer the question. Based on these numbers, it seems like FairMount Minerals
is male dominated company.
I also ran a frequency to determine where the majority of participants fall in to
different age categories. The following table breaks down each participant�s age into five
different categories and shows how many participants fall into each category.
Table 2: Age Frequencies
Age Category Number of Participants
17-29 36
30-39 65
40-49 56
50-59 44
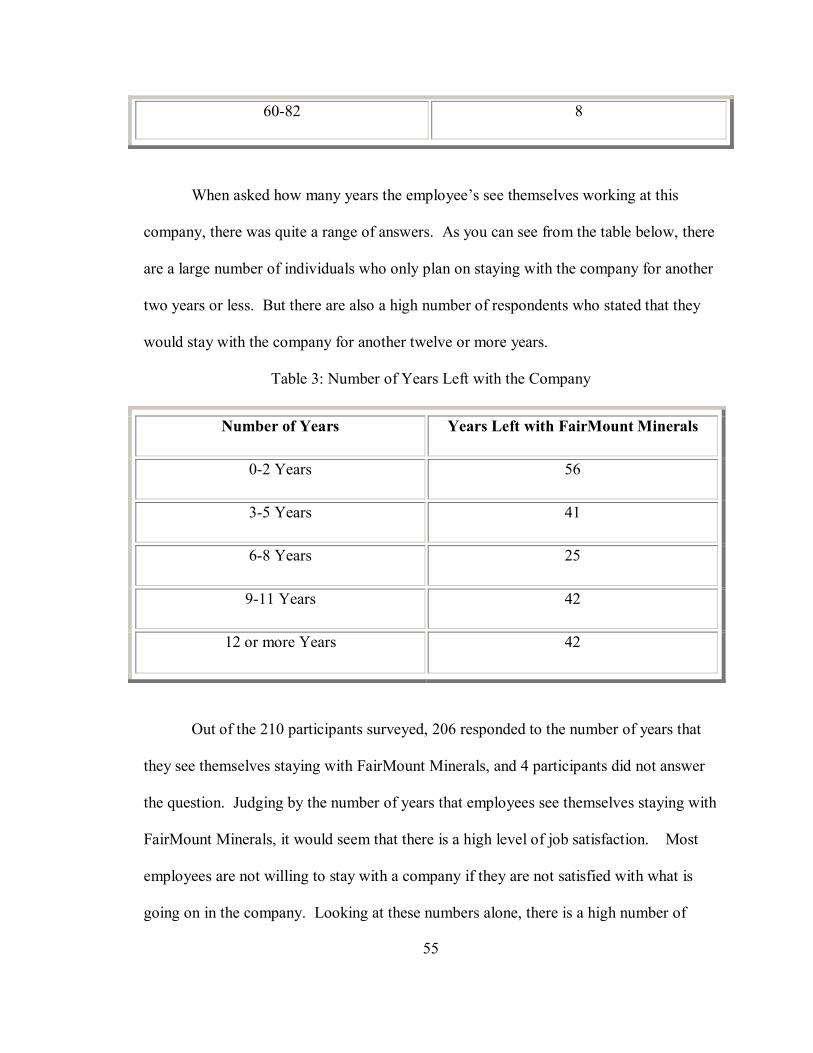
55
60-82 8
When asked how many years the employee�s see themselves working at this
company, there was quite a range of answers. As you can see from the table below, there
are a large number of individuals who only plan on staying with the company for another
two years or less. But there are also a high number of respondents who stated that they
would stay with the company for another twelve or more years.
Table 3: Number of Years Left with the Company
Number of Years Years Left with FairMount Minerals
0-2 Years 56
3-5 Years 41
6-8 Years 25
9-11 Years 42
12 or more Years 42
Out of the 210 participants surveyed, 206 responded to the number of years that
they see themselves staying with FairMount Minerals, and 4 participants did not answer
the question. Judging by the number of years that employees see themselves staying with
FairMount Minerals, it would seem that there is a high level of job satisfaction. Most
employees are not willing to stay with a company if they are not satisfied with what is
going on in the company. Looking at these numbers alone, there is a high number of
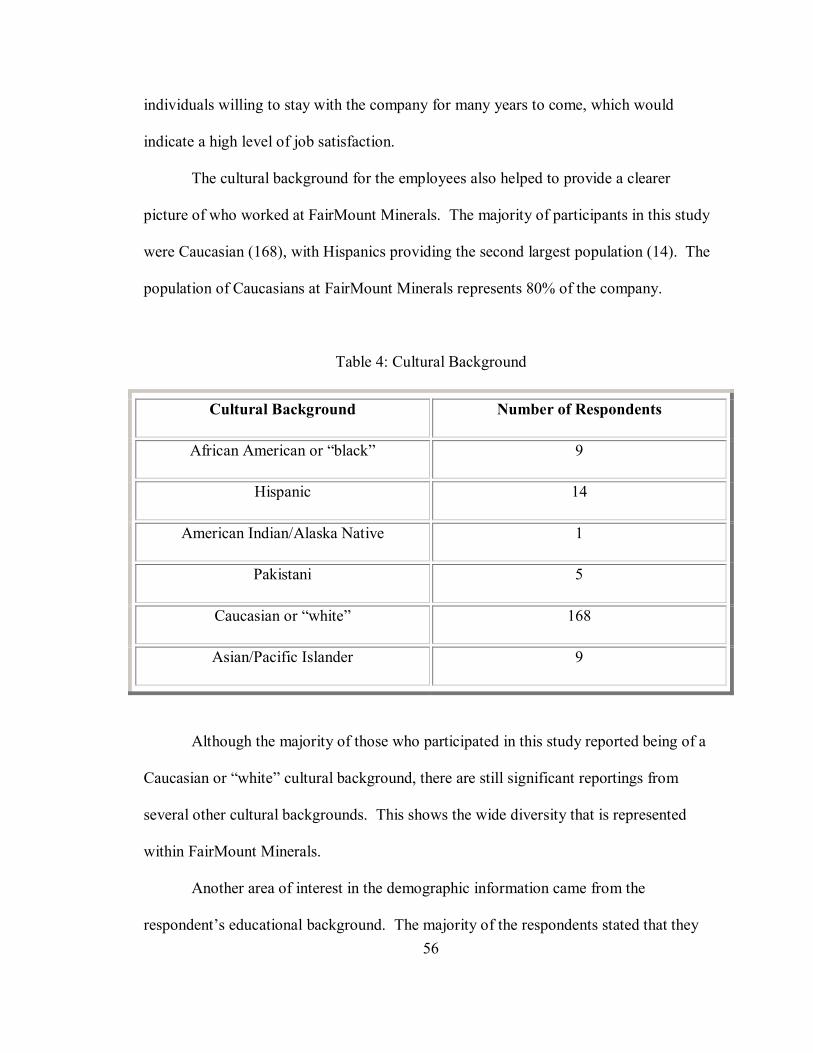
56
individuals willing to stay with the company for many years to come, which would
indicate a high level of job satisfaction.
The cultural background for the employees also helped to provide a clearer
picture of who worked at FairMount Minerals. The majority of participants in this study
were Caucasian (168), with Hispanics providing the second largest population (14). The
population of Caucasians at FairMount Minerals represents 80% of the company.
Table 4: Cultural Background
Cultural Background Number of Respondents
African American or �black� 9
Hispanic 14
American Indian/Alaska Native 1
Pakistani 5
Caucasian or �white� 168
Asian/Pacific Islander 9
Although the majority of those who participated in this study reported being of a
Caucasian or �white� cultural background, there are still significant reportings from
several other cultural backgrounds. This shows the wide diversity that is represented
within FairMount Minerals.
Another area of interest in the demographic information came from the
respondent�s educational background. The majority of the respondents stated that they
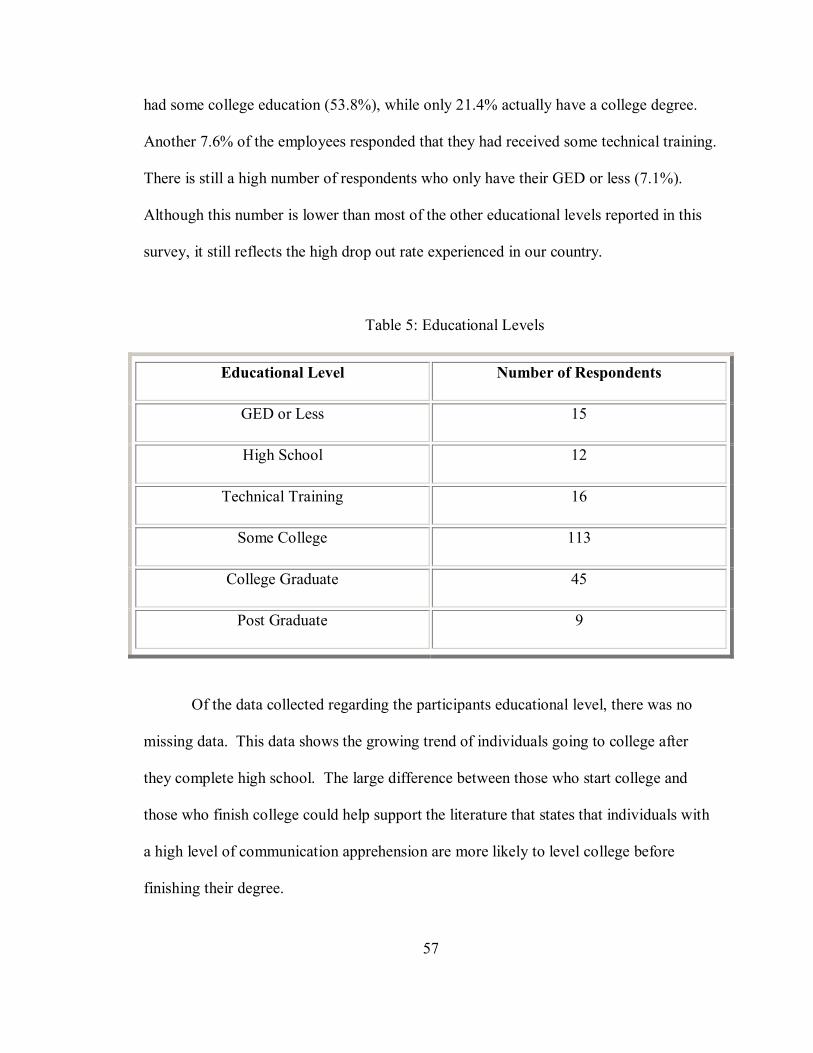
57
had some college education (53.8%), while only 21.4% actually have a college degree.
Another 7.6% of the employees responded that they had received some technical training.
There is still a high number of respondents who only have their GED or less (7.1%).
Although this number is lower than most of the other educational levels reported in this
survey, it still reflects the high drop out rate experienced in our country.
Table 5: Educational Levels
Educational Level Number of Respondents
GED or Less 15
High School 12
Technical Training 16
Some College 113
College Graduate 45
Post Graduate 9
Of the data collected regarding the participants educational level, there was no
missing data. This data shows the growing trend of individuals going to college after
they complete high school. The large difference between those who start college and
those who finish college could help support the literature that states that individuals with
a high level of communication apprehension are more likely to level college before
finishing their degree.
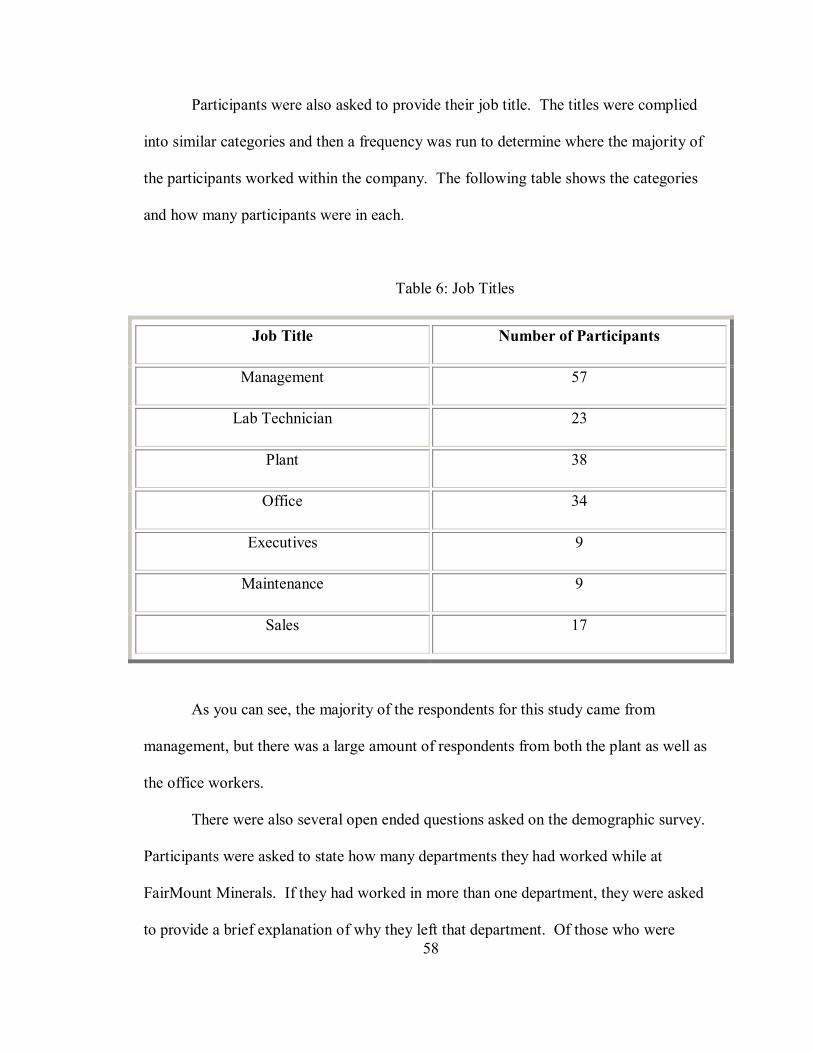
58
Participants were also asked to provide their job title. The titles were complied
into similar categories and then a frequency was run to determine where the majority of
the participants worked within the company. The following table shows the categories
and how many participants were in each.
Table 6: Job Titles
Job Title Number of Participants
Management 57
Lab Technician 23
Plant 38
Office 34
Executives 9
Maintenance 9
Sales 17
As you can see, the majority of the respondents for this study came from
management, but there was a large amount of respondents from both the plant as well as
the office workers.
There were also several open ended questions asked on the demographic survey.
Participants were asked to state how many departments they had worked while at
FairMount Minerals. If they had worked in more than one department, they were asked
to provide a brief explanation of why they left that department. Of those who were
59
satisfied with their positions before leaving that particular department, no explanation
was given as to why they did not return to that department. Some employees responded
that they were transferred under the decision of management, or they left the department
for maternity leave, while one responded indicated that they were displeased with the
department, and put in for a transfer. It is unknown from the data collected why the
participant was unsatisfied. There were many positive responses to why employees left
one department to work in another. Eight individuals responded that they received a
promotion, while others indicated that they were �moved up�. Out of the 202 employees
who responded to the question, 31 indicated that they had worked in two different
departments, while another six stated that they had worked in three departments. The
largest number of department that one person had worked in was seven. This subject
stated that he has either been transferred or moved into the different departments.
Employees were also asked if they would ever consider changing jobs. This was
to be viewed as a job change within the company. When asked to state yes or no as to
whether they would consider changing jobs, 79 indicated that yes, they would change
jobs, while another 128 indicated that they would not change jobs. Three participants did
not respond to the question. When asked why they would change jobs, the majority of
the respondents answered that they would change for more money. This hits at the fact
that there may be some dissatisfaction with the pay scale.
When asked if they would ever consider changing organizations, 76 participants
answered yes, they would change, while 125 answered no, they would not change
organizations. Several of the respondents who stated they would change organizations
state they would change due to a lack of advancement opportunities provided by the
60
company. Others stated that they would leave if it improved their status, provided them
with more pay, or as one respondent stated, �If I discovered an opportunity more
supportive and closely matched to my dream job.� There were a few respondents who
disagreed with some of the respondents who stated there was no room for advancement.
Several respondents stated that they would stay due to the advancement opportunities.
One respondent even stated that, �I'm very happy at my job, like the challenges I get, like
the people I work with, and I think I have a good chance for a excellent career.�
Several other Likert-type questions also provided some interesting data.
Respondents were asked to respond on a 1 to 5 scale if they considered their job to be fast
paced (1 being strongly agree and 5 being strongly disagree). With a response mean of
1.7, the majority of the respondents either strongly agree or agree that their jobs are fast
paced. When asked if they were busy the majority of the time while at work, the mean
answer was 1.6, indicating that most of the respondents felt like they were busy most of
the time. Another question asked if the respondents felt like they had more work than
they could get done. The mean for this question was 2.1, meaning that they agree they
have more work than they feel like they can get done. Finally, the respondents were
asked if they felt like there was time to socialize while they were at work. The mean
score for this question was 3.8. This leans more towards disagreeing that there is time to
visit and socialize while working. This supports the findings that they have more work
than they feel they can get done. Based on the answers to these questions, there seems to
be some strong indication that there may be a low level of job satisfaction within the
company. Below you will find a table with the descriptive statistics that I found from the
data collected.
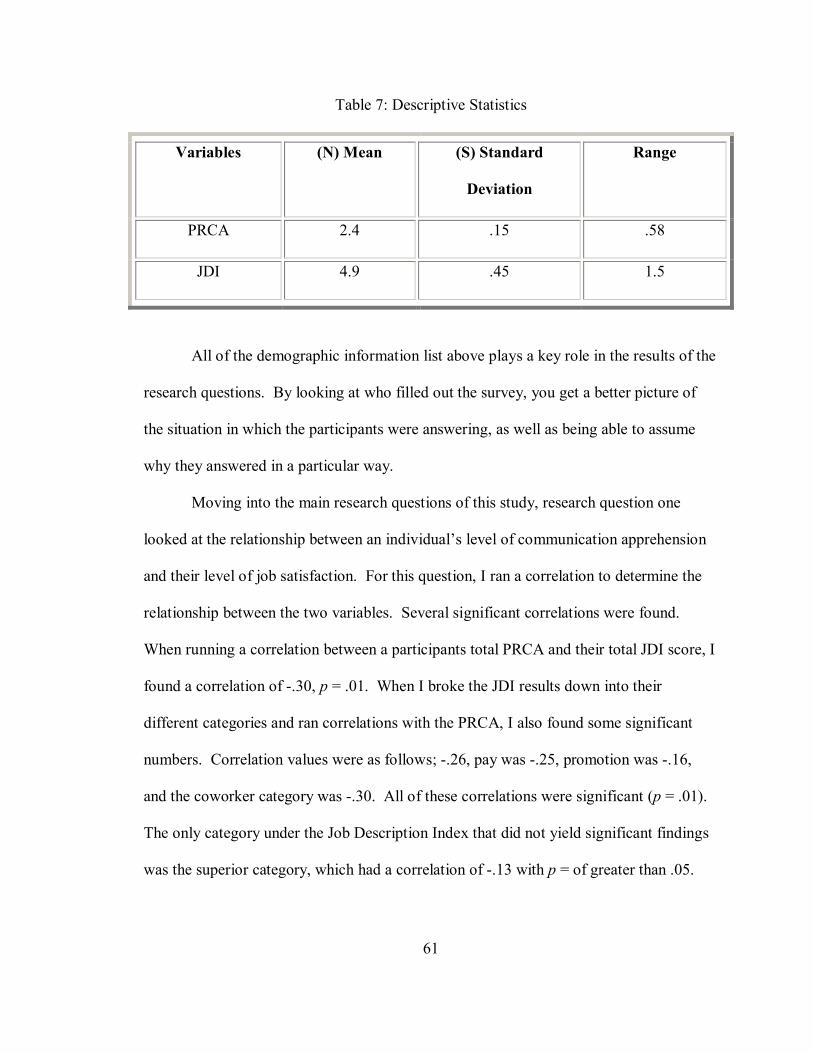
61
Table 7: Descriptive Statistics
Variables (N) Mean (S) Standard
Deviation
Range
PRCA 2.4 .15 .58
JDI 4.9 .45 1.5
All of the demographic information list above plays a key role in the results of the
research questions. By looking at who filled out the survey, you get a better picture of
the situation in which the participants were answering, as well as being able to assume
why they answered in a particular way.
Moving into the main research questions of this study, research question one
looked at the relationship between an individual�s level of communication apprehension
and their level of job satisfaction. For this question, I ran a correlation to determine the
relationship between the two variables. Several significant correlations were found.
When running a correlation between a participants total PRCA and their total JDI score, I
found a correlation of -.30, p = .01. When I broke the JDI results down into their
different categories and ran correlations with the PRCA, I also found some significant
numbers. Correlation values were as follows; -.26, pay was -.25, promotion was -.16,
and the coworker category was -.30. All of these correlations were significant (p = .01).
The only category under the Job Description Index that did not yield significant findings
was the superior category, which had a correlation of -.13 with p = of greater than .05.
62
For my first hypothesis, I looked at whether individuals with high self reported
levels of communication apprehension would be more likely to consider changing
organizations. For this question, I decided to run an ANOVA. Results from this test
produced no significant findings among the respondents, (F[1/197] = .05, p = .83)when
using and employees level of communication apprehension as my dependent variable and
whether or not the employee would consider changing organizations as my independent
variable. There were almost no difference between those who answered yes, they would
change organizations (mean = 58.1), and those who said no, they would not change
organizations (mean = 58.6).
Research question two looked at the relationship between an employee�s level of
communication apprehension and their level of state anxiety. For this question, I ran
another correlation to determine if there was a relationship between the two variables. I
found there was a significant positive correlation between the two variables (r=.34, p=
.01). I also found an interesting negative correlation between an employees total SCAM
score and their job satisfaction with their coworkers (r= -.55, p= .01). This suggests that
as an employee�s situational apprehension rises, their satisfaction with their coworkers
decreases. This could indicate that the coworkers have a role in the level of situational
apprehension the employee�s feel while they are at work.
Though individual correlations suggest that communication apprehension and
situational anxiety are both significantly related to job satisfaction, a linear regression
model (with communication apprehension and situational apprehension as predictor
variable for job satisfaction) indicates that only situational apprehension is a significant
predictor of variance in job satisfaction (F[2/200]=127.5, p=.00). Beta weights were also
63
determined for both PRCA and SCAM totals. For the total PRCA score, the beta weight
was -.05, p = .32 and the beta weight for the total SCAM score was -.73, p = .00. This
shows that the majority of the influence that is received by job satisfaction comes from
situational communication apprehension. This may be due in part to the fact that while
an employee may feel apprehension at work, they have a chance daily to leave their jobs
and go to an environment that is comfortable and stress free. This provides them with an
outlet to get away from the situation that is causing them anxiety.
Hypothesis two looked at an individual�s level of self reported state anxiety with
their level of self reported job satisfaction. This hypothesis predicted that there would be
a low level of job satisfaction if there was a high level of state anxiety. To determine if
this was true for FairMount Minerals, I found a negative correlation between the two
variables (r= -.75, p= .01). When I broke down the Job Description Index into its
separate categories, I also found significant correlations between the subcategories and
the total for situational communication apprehension. The subcategories include; work
(r= -.51, p= .01), pay (r= -.57, p= .01), promotion (r= -.48, p= .01), and finally supervisor
(r= -.57, p= .01).
Finally, hypothesis three looked at whether individuals with high self reported
levels of state anxiety would be more likely to consider changing jobs. To test this
hypothesis, I ran a t-test between the participant�s level of state anxiety and their
likelihood of changing jobs. This test produced significant findings (t(201) = 2.5, p =
.013). For the employees who answered �yes, they would consider changing jobs,� I
found a mean of 63.9, and for the employee�s who answered �no, they would not
consider changing jobs�, I found a mean of 58.4.
64
Discussion
The numbers from this study proved to be very interesting and very significant on
many levels. Research question one asked �How does an employee�s level of
communication apprehension relate to their job satisfaction�. Because I found a negative
correlation between the total of an employee�s communication apprehension and their
total job satisfaction, this shows that if their level of communication apprehension rises,
then they have a tendency of having a lower level of job satisfaction. This means that it
may be important for employers to watch how their employees are responding in
different situations, and to monitor their apprehension levels. When and employee starts
to lose their level of job satisfaction, it is often difficult to rebuild it, or to establish it in
the first place. By trying to deal with apprehensive situations as they arise, an employer
may be able to retain an employee�s overall level of satisfaction.
Hypothesis one supposed that �Individuals with high self reported levels of
communication apprehension will be more likely to consider changing organizations.�
This hypothesis was not supported by the data collected. After running an ANOVA, I
found that the mean score for those who said yes, they would consider changing
organizations and those who said no, they would not consider changing organizations
was almost equal. The mean for those who answered yes was 52.1, and the mean for
those who said no was 58.6. This shows basically an even split between those who
would and those who would not consider changing organizations. Basically, employers
need to deal with this situation on a case by case basis. If an employer knows that an
employee has a high apprehension level, they may want to keep a closer watch on those
65
employees to ensure that their level of job satisfaction is not falling. This could possibly
be done by increasing the number of job evaluations that are given each year. By
increasing the number of evaluations, employers will get more feedback on what is going
on with their employees and how they are feeling with their work. This will also help to
ensure that problems are caught before they escalate to a situation in which the employee
feels that they need to leave the organization. These findings are also consistent with
some of the literature that suggests that even though an employee may be apprehensive,
they are not necessarily willing to leave their job due to their level of apprehension about
the unknown. This also helps to support some of the research on job interviews that
states that those individual�s who have a high level of communication apprehension will
not likely be invited back for a second interview. Knowing this before you leave a
position can impact your decision on wheather to stay or leave a job. The apprehension
that they feel about changing jobs, or the possibility of not being able to find another job
may out weigh the apprehension that they feel about staying in their current job.
Research question two asked, �How does an employee�s level of communication
apprehension relate to their level of state anxiety?� For this question, I ran a correlation
to see if there was a relationship between an employee�s level of communication
apprehension and their level of state anxiety. This correlation yielded a positive
correlation between the total for PRCA and the total for SCAM of .34. This means that
as an employees level of communication apprehension rises, so does their level of state
anxiety. So, if an employee is in a working situation in which their apprehension about
communication is high, they are likely to have high state anxiety or an increased level of
anxiety in situations like their work situation, or even in similar situations. The data is
66
showing that there is a tie to the level of anxiety that they are feeling at work, and the
level of anxiety that they are feeling about similar situations in general.
Hypothesis two posed that, �Individuals with high self reported levels of state
anxiety will have low levels of self reported job satisfaction�. For this hypothesis, I
found a negative relation of -.75 between state anxiety and job satisfaction. This means
that as an employee�s level of situational apprehension rises, his or her level of job
satisfaction usually decreases. So, similarly to the communication apprehension, as an
employee becomes more nervous performing a particular task, their level of satisfaction
towards that task, and their satisfaction to the job in general, is greatly reduced. The
opposite of this situation is not necessarily true. If an employee feels a low level of job
satisfaction, then we cannot always assume that their level of situational apprehension
will rise. Several different outcomes may be present if an employee has a low level of
job satisfaction. It may simply be that they do not like certain aspects of their job. I do
not feel that there is enough evidence to make the claim that if an employee�s level of job
satisfaction is low, then their level of state anxiety is high. This again shows yet another
reason why it is important for employers to identify those individuals within their
organization that have high levels of apprehension, and monitor those individuals.
Although individuals may not leave a job due to situational apprehension, it is clear that
their job satisfaction is greatly affected. Many times we find that although an employee
may be apprehensive at their job, the apprehension that they feel does not out weigh the
fear that they would feel if they decided to leave their position and find a new job.
Nonetheless, if situational apprehension can be identified, employers have a better chance
of adjusting the position in which the individual is working in to make it a less
67
apprehensive environment. This in turn would help to raise job satisfaction, or prevent it
from falling in the first place.
Hypothesis three stated that, �Individuals with high self reported levels of state
anxiety will be more likely to consider changing jobs.� For this hypothesis, I ran an
ANOVA to see if there was a relationship between state anxiety and the likelihood of an
employee working for FairMount Minerals to change jobs. For the employees who
answered yes, they would consider changing jobs, I found a mean of 63.9, and those who
said no, they would not consider changing jobs, I found a mean of 58.4. Based on the F
value as well as the P value, this means that people with higher levels of state anxiety are
more likely to consider changing jobs than those who have a lower level of state anxiety.
This is very interesting because it shows that when a person gets apprehensive enough
about performing a task, they would rather take on the possibility of having an entirely
different job, then to have to go on performing that task. This shows just how great a
person�s fear of communication can be. They would rather change jobs, and be doing
work that they do not know how to do, rather than perform a job that causes them to have
a high level of communication apprehension. This also ties into the literature that
describes the traits of those with high communication apprehension. An individual who
becomes so apprehensive that they are willing to leave their jobs are showing signs of
withdrawal that were discussed by McCroskey and Delay (1984).
Limitations
All research studies have their limitation, and being that this is the first major
research study that I have ever done, it is no exception. The biggest limitation that I
68
found personally was that it was very difficult to keep track of surveys when they were
being done in other cities. This caused me to heavily rely on Mr. Syed Akbar, and the
mail system to make sure nothing was out of place. Unfortunately, there were some
miscommunications as to how the surveys were to be separated, and therefore, I was not
able to run any type of comparisons between the different plants due to the fact that the
surveys were not kept separate, and there was no place on the survey for participants to
indicate which plant they were coming from.
Another large limitation that I ran into was in using the Situational
Communication Apprehension Measure. When copying the form onto my survey, the
final three questions were left off. These questions were, �I was pleased�, �I felt good�,
and �I was unhappy.� Because of this, a new coding formula had to be created to
calculate the SCAM scores for the participants. Because of the missing questions, there
was some doubt as to the reliability of the measure. Typically, the SCAM has an alpha
reliability of between .85 to .90. When I ran my own reliability tests, I found that the
SCAM measure used for this study had an alpha coefficient of .88, which is in the range
of the original alpha scores. Because of this, I do not believe that the reliability of this
test was at all interfered with, and the integrity of this study was not damaged.
I also found a limitation in the population that I surveyed. Many of the answers
given could have been influenced by the region in which the participants live. A wider
sample range with a larger number of participants would help to identify if that was the
case. I would, of course, expect a different range of answers across employee�s in
different industries and in different companies. Each company will have its own
structure and unique set of individuals who work there. I do still feel that it is necessary
69
to know where your employee�s fall on a communication apprehension scale, but I would
expect a certain amount of variance between different industries in these areas.
A final limitation that I would like to report is that no cross tabs were conducted
in this research project. It would have been beneficial to run cross tabs between
communication apprehension and the ages of the participants. This would have shown if
there were any statistical significance between the two variables.
Based on the data that I have found in this research study, I would recommend
that managers begin to take notice of where their employee�s are on an apprehension
scale. The manner in which this could be done will depend on factors within each
individual company, but if time and resources permit, I believe that it would be of value
to have employees fill out both the PRCA as well as the SCAM since both instruments
had an affect on employee job satisfaction. It would also be beneficial for employee�s to
periodically fill out a job satisfaction measure to help managers in determining the mood
of their employee�s. Even though we have seen from the data in this study that not all
employee�s who have a high level of communication apprehension are willing to leave
their job, there is still incentive for managers to consider implementing this type of
program into their companies. Although an employee may be doing a decent job as they
are now, with a low level of job satisfaction, just imagine what they could be doing if
their level of job satisfaction was raised even just a little bit. By simply taking the time to
implement part, or even all, of a project like this, managers would not only be boosting
employee moral, but helping the productivity level within their company at the same
time.
70
Future Research
There are endless uses for a study like this in the future. From here, the test could
be made more specific to find out exactly what aspects of a job tend to make people feel
more apprehensive, and the level of apprehension on each of those job tasks. This study
would be very easy to replicate in other companies, no matter how large or small. It is
good for employers to know where their employees fall on an apprehension scale. After
doing this test, FairMount Minerals now knows that their apprehensive employees have a
greater tendency of changing jobs. This can be looked at if there are employees who are
always putting in for a job change. For example, there is one employee who has changed
jobs seven times. This employee answered no, they would not be likely to change
organizations, but they would be likely to change jobs. This might serve as a red flag for
the company to look at exactly why an employee is requesting a job change, and try to
evaluate if there are certain areas of the job they are in now that are causing them to be
more apprehensive. The participants as a whole had a moderately high PRCA score of
64, which could be the cause of all of the job changes that are taking place within the
company.
Another area that could be examined further would focus on those employees who
had a college degree. It may be beneficial to see if an employee�s degree title matches up
with their job title or job description. This may also help to predict their level of job
satisfaction. It could also help determine the length of time an individual is willing to
stay at the company. If they have just been unable to find a job in their chosen
profession, chances are that they will not be willing to stay in a job that is not related
specifically to their training for very long.
71
This type of research has many different possibilities for employers to explore. A
survey like this could be given in a variety of different contexts. The survey could also
be modified in order to serve the specific needs of the employer at a given time. When
hiring for a position, it may be beneficial to have the applicant fill out the PRCA-24 with
their application, so you know from the get go where they stand in the different
categories explored by the measure, and where the applicant would best fit within the
company. This helps to ensure that each employee has a chance for success and
satisfaction within the organization. It would also be beneficial for employers to
implement some type of coping strategies in their company for those with high
communication apprehension levels. These strategies would also be beneficial if the
company had other factors that were causing apprehension, such as the threat of lay offs
or impending corporate changes. These types of programs could also serve as a
preventative method to help employees deal with changes that are inevitable. If
employer�s can catch this type of anxiety before it begins, then they will not have to
worry about a drop in their employee�s level of job satisfaction. The coping strategies
described in this report will not only help the employee�s deal with the anxiety that they
are feeling, but will also provide the company with better and more productive
employees.
72
REFERENCES
Ayres, J., et al. (1993). Two empirical tests of a videotape designed to reduce public speaking anxiety. Journal of Applied Communication Research, 132-147.
Ayres, J., & Heuett, B. (1997). The relationship between visual imagery and public
speaking apprehension. Communication Reports, 10 (1), 87-94. Ayres, J., Hopf, T., & Will, A. (2000). Are reductions in CA an experimental artifact? A
Solomon four-group answer. Communication Quarterly, 48 (1), 19-26. Ayres, J., Keereetaweep, T., Chen, P., & Edwards, P. (1998). Communication
apprehension and employment interviews. Communication Education, 47, 1-17. Ayres, J., Ayres, F., Baker, A., Colby, N., De Blasi, C., Dimke, D., Docken, L., Grubb, J.,
Hopf, T., Mueller, R., Sharp, D., Wilcox, A. (2001). Effects of performance visualization on employment interviews. Communication Quarterly, 49 (2), 160-171.
Beatty, M., & Beatty, P. (2001). Interpersonal communications anxiety. Theory into
Practice, 15, 368-372. Beatty, M., McCroskey, J., & Heisel, A. (1998). Communication apprehension as
temperamental expression: A communibiological paradigm. Communication Monographs, 65, 197-219.
Beatty, M., & Valencic, K. (2000). Context-based apprehension versus planning
demands: A communibiological analysis of anticipatory public speaking anxiety. Communication Education, 49 (1), 58-71.
Booth-Butterfield, S. (1987). Action assembly theory and communication apprehension:
A psychophysiological study. Human Communication Research, 13 (3), 386-398. Bradley, D., & Roberts, J. (2004). Self-employment and job satisfaction: Investigating
the role of self-efficacy, depression, and seniority. Journal of Small Business Management, 42 (1), 37-58.
Borzi, M., & Mills, T. (2001). Communication apprehension in upper level accounting
students: An assessment of skill development. Journal of Education for Business, 76 (4), 193-198.
73
Burk, J. (2001). Communication apprehension among master�s of business administration students: Investigating a gap in communication education. Communication Education, 50 (1), 51-58.
Cole, J., & McCroskey, J. (2003). The association of perceived communication
apprehension, shyness, and verbal aggression with perceptions of source credibility and affect in organizational and interpersonal contexts. Communication Quarterly, 51 (1), 101-110.
Daly, J., & McCroskey, J. (1984). Avoiding communication. Beverly Hills, CA: Sage
Publications, Inc. Elias, R. (1999). An examination of nontraditional accounting students� communication
apprehension and ambiguity tolerance. Journal of Education for Business, 75 (1), 38-41.
Elkins, M. (1996). I will fear no audience: General semantics applied to a communication
apprehensive public speaking laboratory. Etc., 53, 69-84. Falchion, R., McCroskey, J., & Daly, J. (1977). Job satisfaction as a function of
employees� communication apprehension, self-esteem, and perceptions of their immediate supervisors. Communication Yearbook,1, 363-375.
Foy, N. (2004). They love me, they love me not. Strategic Finance, 85 (8), 50-54. Greene, J., Rucker, M., Zauss, E., & Harris, A. (1998). Communication anxiety and the
acquisition of message-production skill. Communication Education, 47, 337-347. Greene, J., & Sparks, G. (1983). The role of outcome expectations in the experience of a
state of communication apprehension. Communication Quarterly, 31 (3), 212-219.
Hazer, J. (1976). Job satisfaction: A possible integration of two theories. Training and
Development Journal, 30, (7), 12-14. Herzberg, F. (1965). The motivation to work among finishing supervisors. Personnel
Psychology, 18, 393-402. Hopf, T. & Ayres, J. (1992). Coping with public speaking anxiety: An examination of
various combinations of systematic desensitization, skills training, and visualization. Journal of Applied Communication Research, 20, 183-198.
Jepsen, D., & Sheu, H. (2003). General job satisfaction from a developmental
perspective: Exploring choice�Job matches at two career stages. The Career Development Quarterly, 52 (2), 162-179.
74
Kelly, W. (2004). Examining the relationship between worry and trait anxiety. College
Student Journal, 38, 3, 370-3. Lacy, F. & Sheehan, B. (1997). Job satisfaction among academic staff: An international
perspective. Higher Education, 34, 305-322. Leininger, J. (2004). The key to retention: Committed employees. China Business
Review, 31 (1), 16-17, 38-39 Ja/F. McCroskey, J. (1976). The effects of communication apprehension on nonverbal
behavior. Communication Quartley, 24, 39-44. McCroskey, J. (1976). The effects of communication apprehension on the perception of
peers. Western Speech Communication, 40, 14-21. McCroskey, J. (1977). Oral Communication apprehension: A summary of recent theory
and research. Human Communication Research, 4, 78-96. McCroskey, J., Daly, J., Richmond, V., & Falcione, R. (1977). Studies of the relationship
between communication apprehension & self-esteem. Human Communication Research, 3 (3), 269-277.
McCroskey, J., Richmond, V. (1977). Communication apprehension a s a predictor of
self-disclosure. Communication Quarterly, 25- 40-43. McCroskey, J. & Richmond, V. (1979). The impact of communication apprehension on
individuals in organizations. Communication Quarterly, 27, 55-61. McCroskey, J., Richmond, V., and Davis, L. (1986). Apprehension about
communicating with supervisors: A test of a theoretical relationship between types of communication apprehension. Western Journal of Speech Communication, 50, 171-182.
McGinn, L. (1997). Albert Ellis on Rational Emotive Behavior Therapy. American
Journal of Psychotherapy, 51, 309-16. McGurie, J., Stauble, C., Abbot, D., & Fisher, R. (1995). Ethical issues in the treatment
of communication apprehension: A survey of communication professionals. Communication Education, 44, 98-109.
Mathews, M. (1983). Communication apprehension and job position as variables
affecting job satisfaction. Unpublished master�s thesis, Texas Tech University.
75
Olaniran, B., & Roach, K. (1994). Communication apprehension and classroom apprehension in Nigerian classrooms. Communication Quarterly, 4 (4), 379-389.
Opt, S., & Loffredo, D. (2000). Rethinking communication apprehension: A Myers-
Briggs perspective. The Journal of Psychology, 134 (5), 556-570. Pertaub, D., Slater, M., & Barker, C. (2002). An experiment on public speaking anxiety
in response to three different types of virtual audience. Presence: Teleoperators & Virtual Environments, 11, (1), 68-79.
Pitt, L., Berthon, P., & Robson, M. (2000). Communication apprehension and perceptions
of salesperson performance: A multinational perspective. Journal of Managerial Psychology, 15 (1), 68-78.
Randolph, D., Doisy, E. & Doisy M. (2005). Predicting the effect of extrinsic and
intrinsic job satisfaction factors on recruitment and retention of rehabilitation professionals. Jorunal of Healthcare Management, 50 (1) 49-60.
Richmond, V., & McCroskey, J. (1985). Communication: Apprehension, avoidance, and
effectiveness. Scottsdale, Arizona, Gorsuch Scarisbrick, Publishers. Richmond, V. & McCroskey, J. (2000). The impact of supervisor and subordinate
immediacy on relational and organizational outcomes. Communication Monographs, 67, 85-95.
Richmond, V, McCroskey, J., & Davis, L. (1982). Individual differences among
employees, management communication style, and employee satisfaction: Replication and extension. Human Communication Research, 8, 170-188.
Roach, K. (1999). The influence of teaching assistant willingness to communicate and
communication anxiety in the classroom. Communication Quarterly, 47 (2), 166-182.
Rubin, R., Rubin, A., & Jordan, F. (1997). Effects of instruction on communication
apprehension and communication competence. Communication Education, 46, 104-114.
Smith, D., Nelson, S., & Smeltzer, L. (1994). Boundaries and banners in business
communication: Does the personal report of communication apprehension measure the apprehension of managers as communicators? The Bulletin, 57 (1), 27-32.
Smith, P., Kendall, L., & Hulin, C. (1969). The measurement of satisfaction in work and
retirement. Chicago: Rand McNally & Co.
76
Sumner, M., & Niederman, F. (2003-2004). The impact of gender differences on job satisfaction, job turnover, and career experiences of information systems professionals. Journal of Computer Information Systems, 44 (2), 29-31.
Terpstra, D, & Honoree, A. (2004). Job satisfaction and pay satisfaction levels of
university faculty by discipline type and by geographic region. Education, 124 (3) 528-538.
Weinrach, S., Ellis, A., MacLaren, C., DiGiuseppe, R., Vernon, A., Wolfe, J., Malkinson,
R., & Backx, W. (2001). Rational emotive behavior therapy success and failures: Eight personal perspectives. Jorunal of Counseling & Development, 79, 259-268.
Winiecki, K., & Ayres, J. (1999). Communication apprehension and receiver
apprehension in the workplace. Communication Quarterly, 47 (4), 430.440.
77
APPENDIX A
DEMOGRAPHIC QUESTIONNAIRE
78
You are asked to participate in a research project being conducted in the Department of Communication Studies at Texas Tech University. Participation is voluntary. All responses will remain anonymous and collected data will be studied in aggregate. Any questions regarding this project should be directed to Amber Byron or Dr. David Roach, Department of Communication Studies, Texas Tech University, Lubbock, Texas, 79409, USA. 806-742-3911. Please fill out the questionnaire completely and accurately. Your participation is appreciated. 1. Are you: Male_____ Female_____ 2. Age:_____ 3. How many years have you worked at FairMount Minerals?_________ 4. What is your current job title at FairMount Minerals? _________________________ 5. (a) How many departments have you worked in including the one you are in now? (b) If more than one: Please list the other departments you have worked in. (c) Please provide a brief description of why you left the department. For the following statements, please make whether you: (1) strongly agree (2) agree (3) are undecided (4) disagree (5) strongly disagree 6. I consider my job to be very fast paced. 1 2 3 4 5 7. I am busy the majority of the time I am at work. 1 2 3 4 5 8. I often feel I have more work than I can get done. 1 2 3 4 5
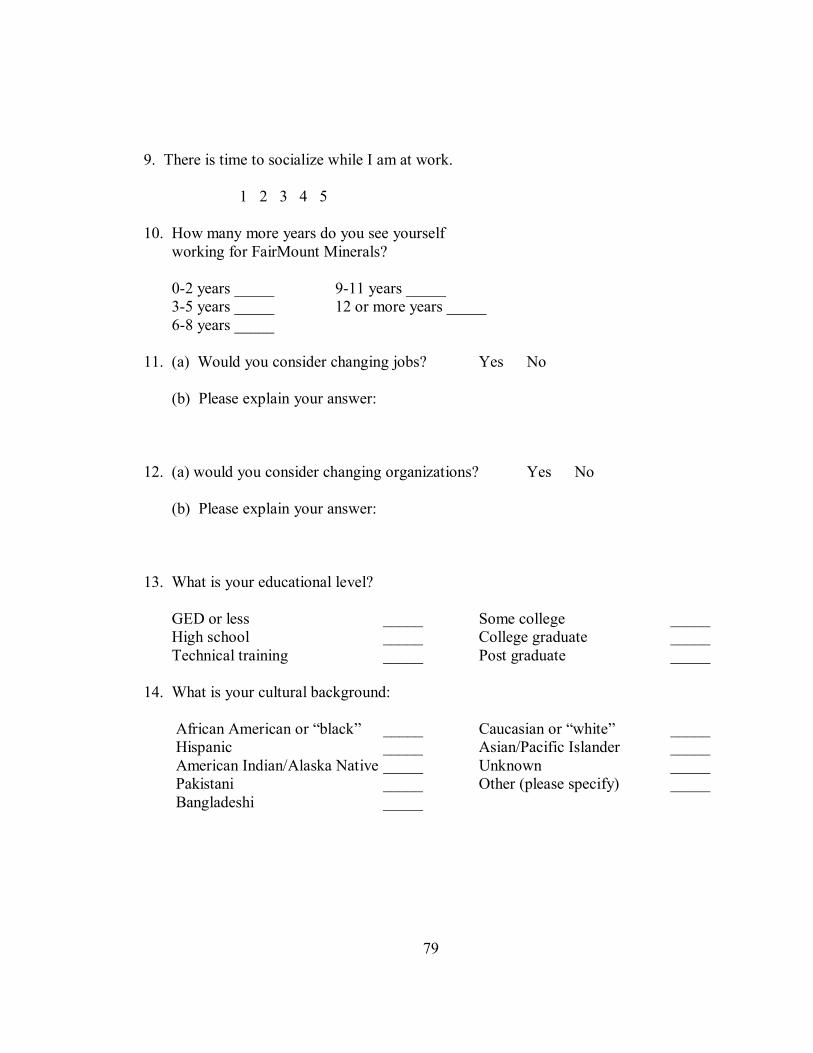
79
9. There is time to socialize while I am at work. 1 2 3 4 5 10. How many more years do you see yourself working for FairMount Minerals? 0-2 years _____ 9-11 years _____ 3-5 years _____ 12 or more years _____ 6-8 years _____
11. (a) Would you consider changing jobs? Yes No (b) Please explain your answer: 12. (a) would you consider changing organizations? Yes No (b) Please explain your answer: 13. What is your educational level? GED or less _____ Some college _____ High school _____ College graduate _____ Technical training _____ Post graduate _____ 14. What is your cultural background: African American or �black� _____ Caucasian or �white� _____ Hispanic _____ Asian/Pacific Islander _____
American Indian/Alaska Native _____ Unknown _____ Pakistani _____ Other (please specify) _____ Bangladeshi _____
80
APPENDIX B
PERSONAL REPORT OF
COMMUNICATION APPREHENSION-24
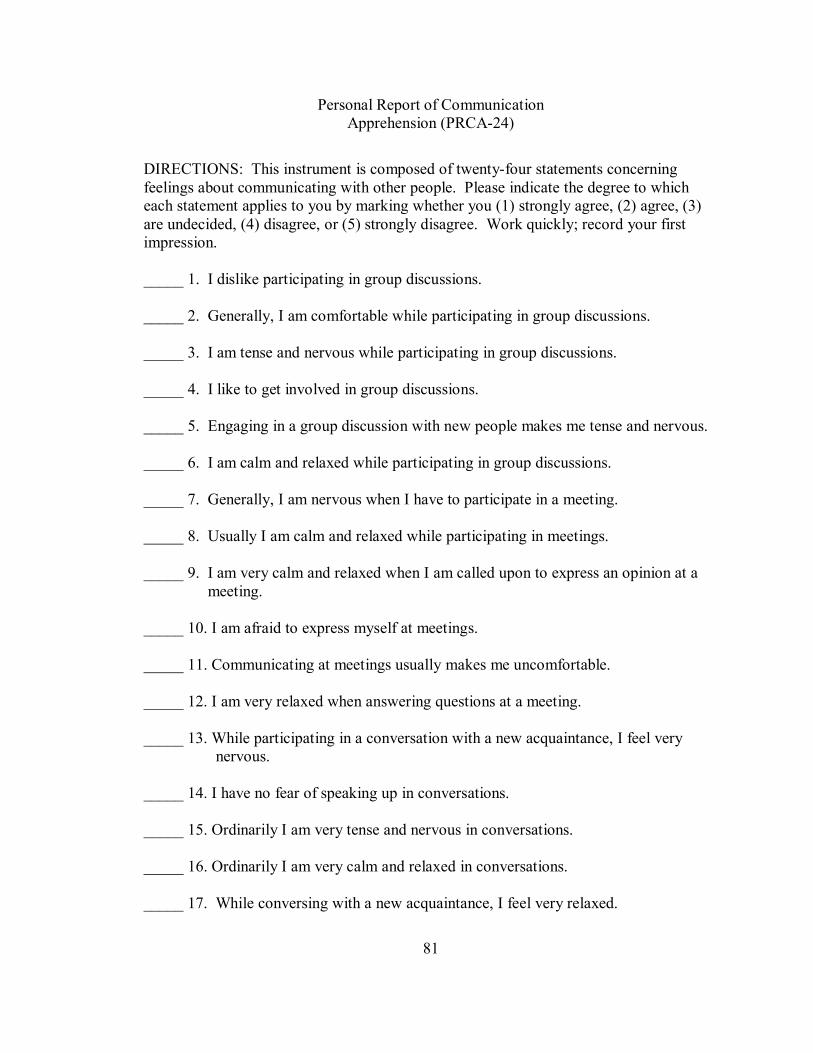
81
Personal Report of Communication Apprehension (PRCA-24)
DIRECTIONS: This instrument is composed of twenty-four statements concerning feelings about communicating with other people. Please indicate the degree to which each statement applies to you by marking whether you (1) strongly agree, (2) agree, (3) are undecided, (4) disagree, or (5) strongly disagree. Work quickly; record your first impression. _____ 1. I dislike participating in group discussions. _____ 2. Generally, I am comfortable while participating in group discussions. _____ 3. I am tense and nervous while participating in group discussions. _____ 4. I like to get involved in group discussions. _____ 5. Engaging in a group discussion with new people makes me tense and nervous. _____ 6. I am calm and relaxed while participating in group discussions. _____ 7. Generally, I am nervous when I have to participate in a meeting. _____ 8. Usually I am calm and relaxed while participating in meetings. _____ 9. I am very calm and relaxed when I am called upon to express an opinion at a
meeting.
_____ 10. I am afraid to express myself at meetings. _____ 11. Communicating at meetings usually makes me uncomfortable. _____ 12. I am very relaxed when answering questions at a meeting. _____ 13. While participating in a conversation with a new acquaintance, I feel very nervous. _____ 14. I have no fear of speaking up in conversations. _____ 15. Ordinarily I am very tense and nervous in conversations. _____ 16. Ordinarily I am very calm and relaxed in conversations. _____ 17. While conversing with a new acquaintance, I feel very relaxed.
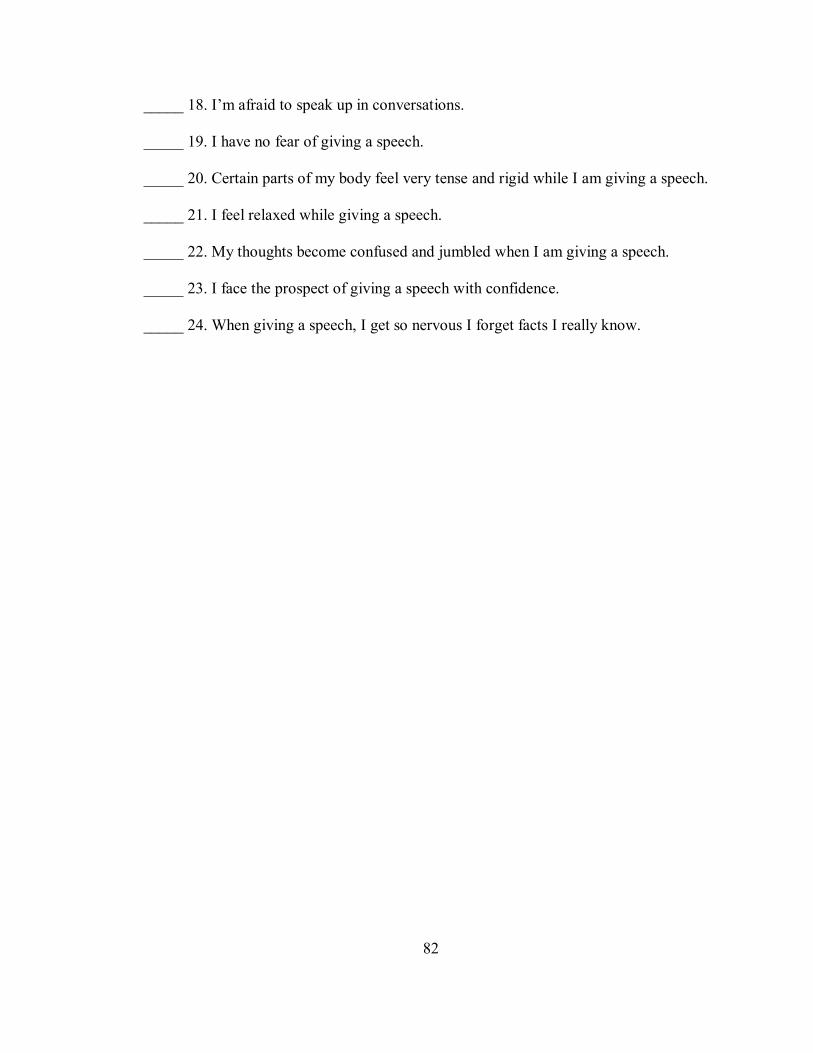
82
_____ 18. I�m afraid to speak up in conversations. _____ 19. I have no fear of giving a speech. _____ 20. Certain parts of my body feel very tense and rigid while I am giving a speech. _____ 21. I feel relaxed while giving a speech. _____ 22. My thoughts become confused and jumbled when I am giving a speech. _____ 23. I face the prospect of giving a speech with confidence. _____ 24. When giving a speech, I get so nervous I forget facts I really know.

83
APPENDIX C
JOB DESCRIPTION INDEX
84
Job Description Index
The following items ask you to indicate how satisfied you are with each aspect of your job listed below. Write the appropriate number in the blank using the following scale: 1 = Strongly disagree 5 = Somewhat agree 2 = Disagree 6 = Agree 3 = Somewhat disagree 7 = Strongly agree 4 = Neutral or uncertain _____ My supervisor is easy to please. _____ My work is fascinating. _____ It is easy to make enemies with my co-workers. _____ There is good opportunity for advancement in my work. _____ My work is boring. _____ My pay is good. _____ My supervisor is polite. _____ My co-workers are intelligent. _____ My job is a dead end job. _____ I am underpaid in my job. _____ There is a good chance for promotion in my job. _____ My supervisor is stubborn. _____ My pay is barely enough to live on. _____ My work gives me a sense of accomplishment. _____ My co-workers are slow.
85
APPENDIX D
SITUATIONAL COMMUNICATION
APPREHENSION MEASURE
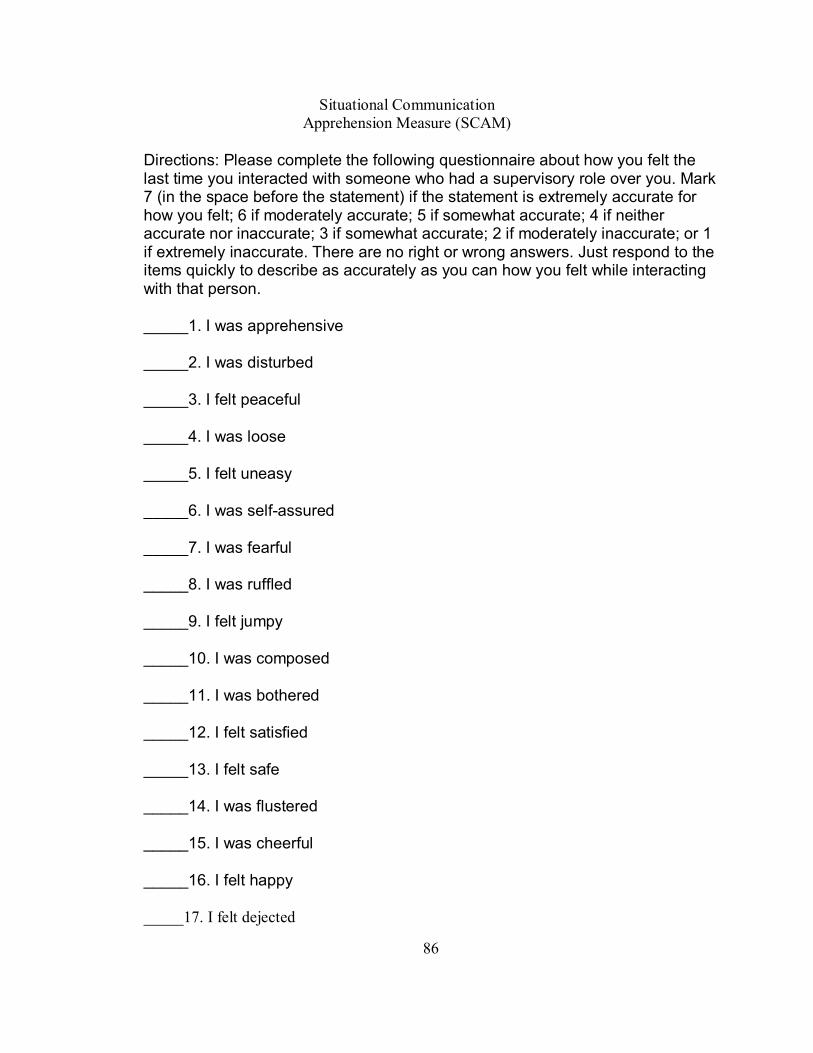
86
Situational Communication Apprehension Measure (SCAM)
Directions: Please complete the following questionnaire about how you felt the last time you interacted with someone who had a supervisory role over you. Mark 7 (in the space before the statement) if the statement is extremely accurate for how you felt; 6 if moderately accurate; 5 if somewhat accurate; 4 if neither accurate nor inaccurate; 3 if somewhat accurate; 2 if moderately inaccurate; or 1 if extremely inaccurate. There are no right or wrong answers. Just respond to the items quickly to describe as accurately as you can how you felt while interacting with that person.
_____1. I was apprehensive
_____2. I was disturbed
_____3. I felt peaceful
_____4. I was loose
_____5. I felt uneasy
_____6. I was self-assured
_____7. I was fearful
_____8. I was ruffled
_____9. I felt jumpy
_____10. I was composed
_____11. I was bothered
_____12. I felt satisfied
_____13. I felt safe
_____14. I was flustered
_____15. I was cheerful
_____16. I felt happy
_____17. I felt dejected
PERMISSION TO COPY
In presenting this thesis in partial fulfillment of the requirements for a master�s
degree at Texas Tech University or Texas Tech University Health Sciences Center, I
agree that the Library and my major department shall make it freely available for research
purposes. Permission to copy this thesis for scholarly purposes may be granted by the
Director of the Library or my major professor. It is understood that any copying or
publication of this thesis for financial gain shall not be allowed without my further
written permission and that any user may be liable for copyright infringement.
Agree (Permission is granted.)
________Amber Byron____________________________ __May 9, 2005_____ Student Signature Date Disagree (Permission is not granted.) _______________________________________________ _________________ Student Signature Date