Embed Size (px)
Citation preview

Communication and fair distribution
Astri Drange Hole∗
May 29, 2007
Abstract
The paper analyses the impact of communication about fairnesson individual distribution decisions, and it focuses on three fairnessideals; strict egalitarianism, liberal egalitarianism and libertarianism.A dictator game experiment with production and two treatments, onewith and one without pre-play communication, is run. In the com-munication phase the individuals face three hypothetical distributionsituations involving three fairness ideals. They are asked to choosethe fairness ideal they think will imply the fairest distribution in thehypothetical situations. The decision is communicated to the oppo-nents in the distribution phase. The study compares data from thetwo treatments and tests if communication about fairness has an effectand how this effect works. Three models of how communication af-fects distribution are estimated; the integrity model, the compromisemodel and the self-serving model.
1 Introduction
Most people show both self- and other-regarding behaviour when they arefacing a distribution problem. They are willing to give up income to avoid
∗Bergen University College and the Norwegian School of Economics and Business Ad-ministration, Bergen, Norway. e-mail: [email protected] and [email protected]. I would like tothank Bertil Tungodden, Robert Sugden, Alexander W. Cappelen, Erik Ø. Sørensen, Pe-ter Moffatt, Gorm Grønnevet, Kjetil Bjorvatn, and seminar participants at NHH and theFirst Oslo Workshop on Experimental and Behavioural Economics for valuable comments.I am grateful to Jan Tore Ynnesdal for technical assistance, and to Daniel Frøyland andJørgen Krog Sæbø for their research assistance.
1

large deviations from what they consider fair. However people disagreeon what constitutes a fair distribution of income and many are involved indiscussions concerning fairness. A central question then is if and how thisdebate, which goes on both publicly and privately, affects people’s attitudeto fairness matters and their opinion of what is fair.In the paper it is assumed that when people make a distribution decision,
they are guided by selfish considerations as well as fairness considerations,and the decision they make depends on their overall fairness considerationand the weight they attach to fairness considerations. I study a distribu-tive situation where the individuals differ in how much they invest and intheir rate of return to investment. Investment is clearly within individualcontrol and rate of return clearly beyond individual control. I assume thatan individual endorses either strict egalitarianism, liberal egalitarianism orlibertarianism. The three fairness ideals differ with respect to which factorsone should hold people responsible for.The aim of the paper is to test if communication has an impact on peo-
ple’s involvement in matters concerning fairness and on their assessment offairness, and experimental methods are applied to generate adequate data. Iestimate three models of how communication affects people’s overall fairnessconsideration. The three models are the integrity model, the compromisemodel and the self-serving model.In the integrity model an individual’s overall fairness consideration is not
affected by communication. The model predicts that an individual is com-mitted to his own fairness ideal when he makes his proposal in the distributionphase. In the compromise model an individual takes his opponent’s fairnessideal into account when he proposes a distribution. The model predicts thatan individual’s overall fairness consideration fall somewhere between his ownand his opponent’s fairness ideal. In the self-serving model an individualalso takes his opponent’s fairness ideal into account when he proposes a dis-tribution, but he does this only when the opponent’s fairness ideal justifiesa larger share to himself than his own fairness ideal.I also test two hypotheses on how communication affects the weight people
attach to fairness considerations. The two hypotheses are the discursivehypothesis and the affiliation hypothesis. The discursive hypothesis claimsthat discussing fairness triggers more generous behaviour in general, and theaffiliation hypothesis claims that people make higher offers to others if theyendorse the same fairness ideal as themselves.An experiment with two treatments is run. In the first treatment there is
2

no pre-play communication while in the second treatment individuals are al-lowed to communicate.1 The participants in the treatment without pre-playcommunication, the control group, play a dictator game where the distribu-tion phase is preceded by a production phase, while the participants in thetreatment with pre-play communication, the experimental group, play a dic-tator game where the distribution phase is preceded by a production phaseand a communication phase.Communication may have different effects on individual behaviour. In the
literature there has been a focus on how communication can enhance coordi-nation in games with strategic interaction (Joseph Farrell and Matthew Ra-bin, 1996, Vincent P.Crawford, 1990, 1998, David Sally 1995, Tore Ellingsenand Magnus Johannesson, 2004b), how communication can cause people tomake self-serving distortion of justice (Linda Babcock, George Loewenstein,Samuel Issacharoff and Colin Camerer, 1993, 1995, Babcock and Loewen-stein, 1997) and how communication can narrow the social distance betweensubjects and elicit a commitment to act less selfishly (Sally, 1995, Johannes-son and Erik Mohlin, 2005, Ellingsen and Johannesson, 2004a, 2005).This paper makes a contribution to the last two issues. I test if commu-
nication causes people to bias their overall fairness consideration in favourof themselves, and also if communication makes people less selfish and moreinvolved in fairness matters. In addition the current paper differs from pre-vious studies on communication in the way communication is organized. InSally (1995) the communication variables are verbal interaction, length ofverbal interaction, written messages and prewritten promises. Ellingsen andJohannesson (2004a, 2004b, 2005) and Johannesson and Mohlin (2005) ap-ply free form communication where no restrictions are put on the contentof the message and the experimenters do not propose what it may contain.In Babcock et al. (1993, 1995) and Babcock and Loewenstein (1997) thereare restrictions on the content, but no specific alternatives are proposed. Inthe current study reduced form web based communication is applied, whichmakes it possible to analyse the communication data quantitatively. In thecommunication phase the players face three hypothetical distribution situa-tions and three different principles of what constitutes a fair distribution ofincome. They do not know that the hypothetical distributive situations arelike the situations which appear later in the experiment. The implications of
1The data from the treatment without communication is also analysed in AlexanderW. Cappelen, Astri Drange Hole, Erik Ø. Sørensen and Bertil Tungodden (forthcoming).
3

the three principles in each of the three hypothetical distributive situationsare also presented for the players, and they are asked to choose the prin-ciple that they think will imply the fairest distribution in the hypotheticalsituations. The decision that a player makes in the communication phaseis communicated to his opponents in the distribution phase. Hence thecommunication variables are the chosen fairness ideal and the distributiveimplication of this.The structure of the paper is as follows. In section 2 the fairness ideals
and the model are presented. Section 3 describes the experimental design.In section 4 the results are reported, and section 5 concludes.
2 Theory
I study a situation where individuals differ in how much money they investand in their rate of return on investment. The amount of investment, qi, iswithin individual control and the rate of return on investment, ai, is beyondindividual control. The individual rate of return on investment is eitherhigh or low, and thus the income generated by an individual i is given bythe product xi = aiqi. I always consider a two-person setting and theindividuals are referred to as person 1 and person 2. My main focus ison how to distribute total income X(a,q) = x1(a1, q1) + x2(a2, q2), wherea = (a1, a2) and q = (q1, q2), and each individual is to propose an amountof income y to himself and (X − y) to his opponent. I assume that theindividuals are motivated by a desire for income and fairness. A fairnessideal, mk(i)(a,q), specifies the amount that individual i holds to be his fairincome.
2.1 The fairness ideals
It is assumed that an individual endorses either strict egalitarianism, liberalegalitarianism or libertarianism. According to the strict egalitarian fairnessideal total income should always be distributed equally amongst the indi-viduals (see, for example, Kai Nielsen, 1985). Hence, inequalities arisingfrom differences in both investment and rates of return should be eliminated;that is, individuals should not be held responsible for either their investmentchoice or their rate of return.
mSE(a,q) = X(a,q)/2 (1)
4

The strict egalitarian view is closely related to the inequality-aversionmodels in the experimental literature, that assume that people dislike un-equal outcomes (see Fehr and Schmidt, 1999).Liberal egalitarianism, on the other hand, defends the view that people
should only be held responsible for their choices (Roemer, 1998). A reason-able interpretation of this fairness ideal is to view the fair distribution asgiving each person a share of the total income equal to his share of totalinvestment.
mLE(a,q) =qi
qi + qjX(a,q) (2)
This principle is equivalent to what has been described as the accountabilityprinciple (James Konow, 1996, 2000). It implies that if two persons makethe same choice, then the fair solution is to give them the same income.Inequalities due to differences in rate of return should be eliminated; thatis, individuals should be held responsible for their investment choice butnot for their rate of return. Hence liberal egalitarianism implies that anunequal distribution of income due to different investment is acceptable, butan unequal distribution of income due to different rate of return is not.The libertarian fairness ideal lies at the opposite extreme to strict egali-
tarianism and does not assign any value to equality. According to libertari-anism, the fair distribution is simply that each person is entitled to what hehas produced (Robert Nozick, 1974).
mL(a,q) = aiqi (3)
Therefore, the libertarian solution may involve an unequal distribution ofincome due to differences in both investment and the rate of return; that is,individuals should be held responsible for both their investment choice andtheir rate of return.2
Even though the three fairness ideals provide different solutions to thedistributive problem, it is important to notice that on average they instructindividuals to offer the same amount to the other person. In any distributivesituation and for any fairness ideal k, the fair solution would be that person
2From equation (1)-(3) we can find that the fair private return from investment, dmk(i)
dqi
is ai2 under strict egalitarianism,
¡3ai4 +
aj4
¢under liberal egalitarianism if individual i and
individual j make equal investments and ai under libertarianism. The different fair privatereturns from investment provide different incentives to the individual in the productionphase. I return to this issue in section 4.1.2.
5
1 offers X−mk to person 2 and person 2 offers mk to person 1, which impliesthat the average fair offer in the distribution situation is X/2.
2.2 Distributive behaviour
Standard economic theory assumes that individuals exclusively pursue theirmaterial self-interest and do not care about fairness per se. However, I as-sume that the individuals have preferences that respond to both monetarypayoffs and the perceived fairness of the outcome. In the following analysisit is important to distinguish between a fairness ideal, denoted mk and anoverall fairness consideration, denoted m∗. mk is the fairness ideal an indi-vidual would endorse if there was no communication, where k denotes strictegalitarianism, liberal egalitarianism, or libertarianism. m∗ is what an indi-vidual considers fair when proposing a distribution after the communication.Hence when proposing a distribution of total income an individual i is mo-
tivated by a desire for income and by fairness considerations, and maximizesthe following utility function:3
Ui(y;a,q) = y − βi2[y−m∗i (a,q)]
2
X(a,q), (4)
where the marginal disutility of deviating from the overall fairness con-sideration, m∗
i , is increasing with the size of the deviation from this fairamount.4
The parameter βi > 0 determines the weight individual i gives to fairnessconsiderations. If βi = 0, individual i assigns no importance to fairnessconsiderations, and keeps all the money. X −m∗
i is individual i´s fair offerto individual j. Given an interior solution the optimal proposal in relativeterms for an individual depends on his overall fairness consideration and theweight he attaches to fairness considerations:
y∗
X(a,q)=
m∗i
X(a,q)+1
βi(5)
3The first element in the utility function captures the self-regarding motive and thesecond element captures the other-regarding motive (see also Ernst Fehr and Klaus M.Schmidt, 1999; Gary E. Bolton and Axel Ockenfels, 2000; and Cappelen et al., forthcom-ing.)
4A robustness test of the particular functional form is given in the appendix, section6.1.
6

2.3 Communication
What determines the overall fairness considerationm∗? Individual i and theopponent individual j have an opportunity to exchange information aboutfairness ideals before they propose a distribution, and the information ex-change can be dealt with in different ways. Individual i´s overall fairnessconsiderationm∗
i may be influenced by his own fairness idealmk(i) and by his
opponent’s fairness ideal mk(j). Accordingly pre-play communication maypotentially have different effects on individual behaviour. I present threemodels for how an individual may react to communication; the integritymodel, the compromise model and the self-serving model.
The integrity model: m∗i = mk(i) (6)
The compromise model: m∗i = αim
k(i) + (1− αi)[X −mk(j)] (7)
The self-serving model: m∗i = αim
k(i)+(1−αi)max{mk(i),X−mk(j)} (8)It follows that if mk(i) > X −mk(j) the self-serving model and the com-
promise model coincide, and if αi = 1, all three models coincide.In the integrity model an individual’s overall fairness consideration is
not affected by communication. The model predicts that an individualis committed to his own fairness ideal when he makes his proposal in thedistribution phase.In the compromise model an individual takes his opponent’s fairness ideal
into account when he proposes a distribution. The model predicts that anindividual’s overall fairness consideration falls somewhere in between his ownand his opponent’s fairness ideal. More formally individual i´s overall fairnessconsideration is a convex combination of his and his opponent’s fairness ideal,where the parameter αi represents the importance individual i assigns to hisown fairness ideal mk(i).5
Alternatively, an individual’s reaction to communication may be self-serving. It is well known from the literature that information exchangemay cause individuals to make self-serving distortion of justice. They bias
5The following example illustrates this. In a distributive situation where aiqi = 4 ∗ 200NOK, ajqj = 2 ∗ 100 NOK and X = 1000 NOK the fairness ideals instruct individuali to keep 800 NOK
¡mL¢, 667 NOK
¡mLE
¢and 500 NOK
¡mSE
¢. If individual i
is a libertarian, individual j is a strict egalitarian and αi = 0.6, the compromise modelpredicts that individual i0s overall fairness consideration is, m∗i = 0.6∗800 NOK +0.4∗500NOK= 680 NOK.
7
their overall fairness consideration in favour of themselves (David M. Messickand Keith Sentis 1983, Babcock et al.1993, 1995, Babcock and Loewenstein1997, Konow 2000, 2005, Jason Dana, Roberto A.Weber and Jason Xi Kuang2004). In the self-serving model an individual also takes his opponent’s fair-ness ideal into account when proposing a distribution, but he does this onlywhen the opponent’s fairness ideal justifies a larger share to himself than hisown fairness ideal. More formally individual i´s overall fairness consider-ation is a convex combination of his own and his opponent’s fairness idealwhen the opponent’s fairness ideal is more favourable to individual i thanhis own.6
Given an interior solution, the optimal proposal for each model is asfollows:
y∗
X(a,q)=
mk(i)
X(a,q)+1
βi(9)
y∗
X(a,q)= αi
mk(i)
X(a,q)+ (1− αi)
∙1− mk(j)
X(a,q)]
¸+1
βi(10)
y∗
X(a,q)=
mk(i)
X(a,q)+ (1− αi)max
½0, 1− mk(j)
X(a,q)− mk(i)
X(a,q)
¾+1
βi(11)
If there is no opportunity to exchange information about fairness as intreatment 1, individual i has no knowledge about individual j´s fairnesspreferences, and we assume that the optimal proposal is in line with theintegrity model.
3 Experimental design
The experiment is a version of a one-shot dictator game with productionand two treatments; one without and one with pre-play communication. At
6The following example illustrates this. In a distributive situation where aiqi = 2∗100NOK, ajqj = 4 ∗ 200 NOK and X = 1000 NOK the fairness ideals instruct individuali to keep 200 NOK
¡mL¢, 333 NOK
¡mLE
¢and 500 NOK
¡mSE
¢. If individual i
is a libertarian, individual j is a strict egalitarian and αi = 0.6, the self-serving modelpredicts that individual i’s overall fairness consideration is, m∗ = 0.6∗200 NOK +0.4∗500NOK= 320 NOK. If on the other hand individual i is a strict egalitarian, individual j islibertarian and αi = 0.6, the self-serving model predicts that individual i’s overall fairnessconsideration is, m∗ = 0.6 ∗ 500 NOK +0.4 ∗ 500 NOK= 500 NOK.
8

the beginning of the experiment the participants in the treatment withoutpre-play communication, the control group, were given information abouthow the production phase and the distribution phase would proceed, whilethe participants in the treatment with pre-play communication, the exper-imental group, were also given information about how the communicationphase would proceed. Both groups were also given information about howthe outcome of the experiment would be determined.In the communication phase the participants in the experimental group
faced three hypothetical distribution situations and three different princi-ples of what constitutes a fair distribution of income. The implications ofthe three principles in each of the three hypothetical distributive situationswere also presented to them. They were asked to choose the principle theythought would imply the fairest distribution in the hypothetical situations.The participants were also told that the alternative they chose would becommunicated to other participants later in the experiment, but that thedecision made in this phase would not restrict their choices later in the ex-periment. The decision that a player made in the communication phase wascommunicated to his opponents in the distribution phase. The design of thecommunication phase prevented strategic behaviour in the production phaseand thus also any clear incentive to report wrongly.In the production phase each participant was given credits equal to 300
Norwegian krone (NOK), approximately 50 US dollars. Production dependedon factors both within and beyond individual control; investment was clearlywithin individual control and the rate of return on investment clearly beyondindividual control. In the production phase each participant in both theexperimental and the control group was randomly assigned a low or a highrate of return. Participants with a low rate of return would double the valueof any investment they made, while those who were assigned a high rate ofreturn would quadruple their investment. The participants were asked todetermine how much they wanted to invest in two different one-shot games.Before they made their investment choice, they were told that they would bepaired with players with different rates of return. Their choice alternativeswere limited to 0 NOK, 100 NOK and 200 NOK, and the total amountinvested in the two games could not exceed the initial credit they received.The design with two games was chosen to expose the participants to differentsituations in the distribution phase. Any money they chose not to invest wasadded to their total earnings from the experiment, and thus they faced agenuine investment choice.
9
In the distribution phase each participant was given information aboutthe other participant’s rate of return, investment level, and total contributionbefore they were asked to propose a distribution of the total income producedby the two. The experimental group was also told which fairness principletheir opponent had chosen in the communication phase and the implicationsof this principle in this particular distribution situation. They were alsoreminded of their own choice in the communication phase. The participantswere not informed about the outcome of the first game before the second gamewas completed, i.e. they considered the two one-shot games simultaneously.For each participant one of the two proposals (the participant’s own or thatof the opponent) in one of the two games was randomly selected to determinethe final outcome. The total earnings from the experiment were given by thefinal outcome plus the amount of money not invested. Given that we assumethat people’s fairness ideals are defined on the final distribution of outcome,the chosen elicitation procedure is incentive-compatible.At the end of the experiment, the participants were assigned codes and
instructed to mail their codes and bank account numbers to the accountsdepartment of the Norwegian School of Economics and Business Adminis-tration. Independently, the research team mailed a list including the codesand the total payment to the accounts department, who then disbursed theearnings directly to each participants’ bank accounts. This procedure en-sured that neither the participants nor the research team were in a positionto identify how much each participant earned in the experiment.The participants were all recruited among first-year students at the Nor-
wegian School of Economics and Business Administration. In the invitationthey were told that they would initially receive 300 NOK to use in an experi-ment that would last about 40 minutes and that their total earnings from theexperiment would depend on their choices. They were not informed aboutthe purpose of the experiment. The hourly opportunity cost for most of thesestudents would be about 100 NOK, while the average payout was 447 NOKfor the control group and 442 NOK for the experimental group. Each studentwas only permitted to participate once. In the first treatment we had onesession with 20 participants, one session with 12 participants and four ses-sions with 16 participants, comprising a total of 96 participants, while in thesecond treatment we had one session with 12 participants and five sessionswith 16 participants, comprising a total of 92 participants. The participantswere in the same computer lab during a session, but all communication wasanonymous and conducted through a web-based interface.
10

In the distribution phase the paired players could differ with respect toboth their rate of return and their investment, which implies that there werefour different categories of distributive situations in the experiment.7 Wehave a reasonably even distribution of observations in the four categories inthe two treatments. As shown in table 1 there are 94 observations whereplayers are identical with respect to both their rate of return and their in-vestment. In this situation all three fairness ideals imply the same fair distri-bution, namely that both players get an equal share of the total income. Inthe situation where the players have the same rate of return but differ in theirinvestment there are 92 observations. In this situation the liberal egalitar-ian and the libertarian fairness ideals coincide, whereas strict egalitarianismwould imply a different view of the fair distribution. In the situation wherethe players have made the same investment but differ in their rate of return,there are also 92 observations. In these situations both the strict egalitarianand the liberal egalitarian would consider an equal split a fair distribution,while the libertarian would consider an unequal split a fair distribution.
Table 1: Number of observations in each category Investment Rate of return Same Different TotalSame 94 92 186 Different 92 96 188 Total 186 188 374
Finally, there are 96 observations in the situation where the players differin both dimensions. In this situation strict egalitarianism and libertarianismimply the same fair offer if the player with a high rate of return is the playerwith a low investment (100 NOK). If this is not the case, all the fairnessideals imply different offer in this situation.
7The players in the experimental group could also differ with respect to the fairnessideal they had reported in the communication phase. This is commented on in section4.1.3
11
4 Results
In this section I present some descriptive statistics before I present the resultsof the statistical tests and the regression estimates.
4.1 Descriptive statistics
The presentation of the descriptive analysis is divided into three parts. Ipresent data from the distribution phase first, then data from the productionphase and the communication phase are presented.
4.1.1 Statistics from the distribution phase
Table 2 gives the major statistical features of the data from the distributionphase.
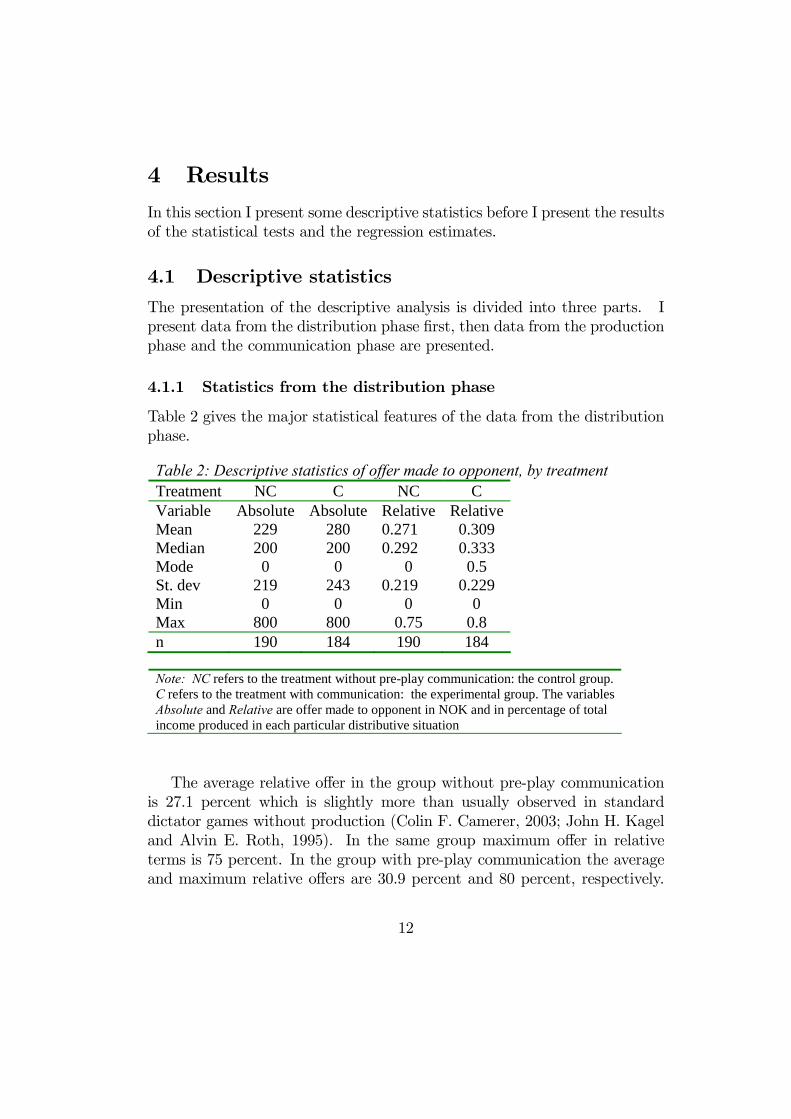
Table 2: Descriptive statistics of offer made to opponent, by treatment Treatment NC C NC C Variable Absolute Absolute Relative RelativeMean 229 280 0.271 0.309 Median 200 200 0.292 0.333 Mode 0 0 0 0.5 St. dev 219 243 0.219 0.229 Min 0 0 0 0 Max 800 800 0.75 0.8 n 190 184 190 184 Note: NC refers to the treatment without pre-play communication: the control group. C refers to the treatment with communication: the experimental group. The variables Absolute and Relative are offer made to opponent in NOK and in percentage of total income produced in each particular distributive situation
The average relative offer in the group without pre-play communicationis 27.1 percent which is slightly more than usually observed in standarddictator games without production (Colin F. Camerer, 2003; John H. Kageland Alvin E. Roth, 1995). In the same group maximum offer in relativeterms is 75 percent. In the group with pre-play communication the averageand maximum relative offers are 30.9 percent and 80 percent, respectively.
12

Zero is the minimum offer in both groups, and it is also the most frequentoffer in the control group, while in the experimental group the most frequentrelative offer is 0.5.8
Figure 1 shows the cumulative distribution of relative offers made..2
.4.6
.81
EDF(
Rel
ativ
e)
0 .2 .4 .6 .8Relative
Figure 1: Cumulative distribution of offer in relative terms, by treatment Note: Offers are calculated relative to total income produced in each particular distributive
situation. The dotted and the straight lines are for the control and the experimental group, respectively.
As can be seen from the figure there are more masses around the lowervalues of offer in the control group than in the experimental group. 50percent of the offers in the control group were 0.25 of total income or less and5.8 percent of the offers are 0.5 of total income or more. The correspondingpercentages for the experimental group are 39.1 and 9.8. In figure 1 it isalso interesting to notice that 27.2 percent of the observations in the controlgroup are participants who shared the production equally, and 30.5 percentof the observations are participants who offered nothing to the opponent. Forthe experimental group the corresponding percentages are 31.5 and 26.6.The impression from figure 1 and table 2 is that people on average are
more generous when there is a pre-play communication phase than if not.The fact that the most frequent amount taken by a player in a game is 600
8The full distributions of offer are shown in the appendix, section 6.2.
13
NOK in the control group and 400 NOK in the experimental group alsosupports this impression.9
4.1.2 Statistics from the production phase
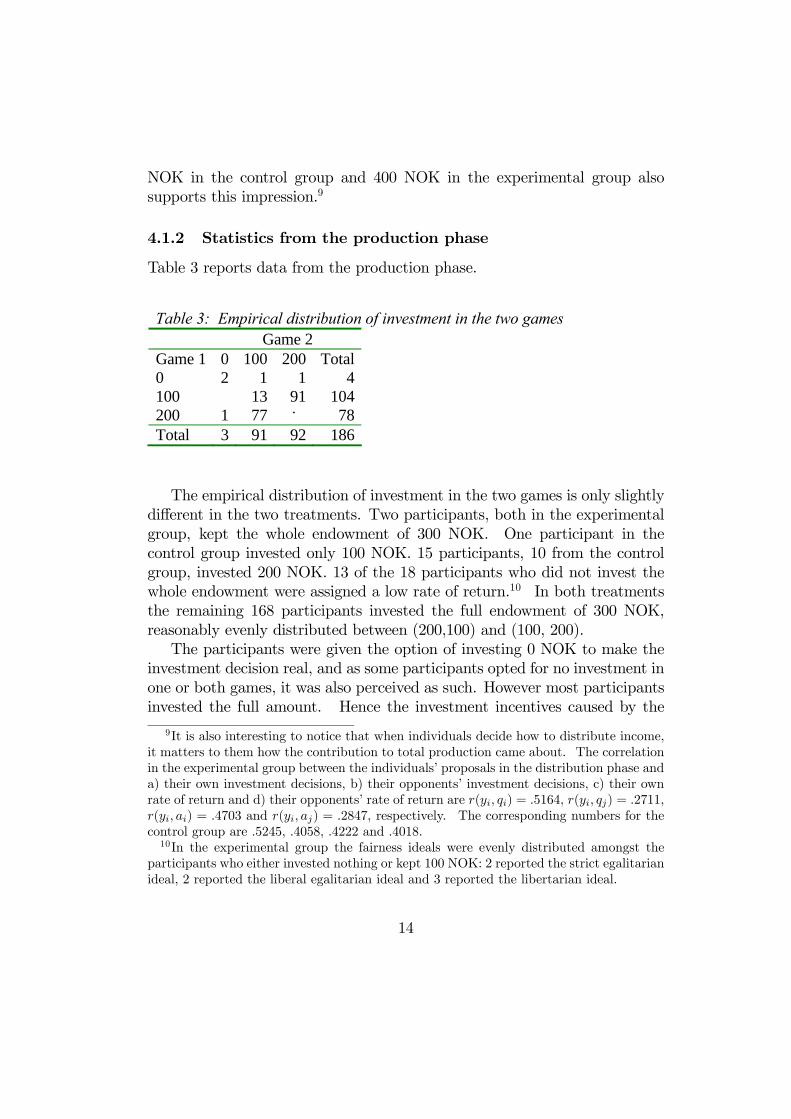
Table 3 reports data from the production phase.
Table 3: Empirical distribution of investment in the two games Game 2 Game 1 0 100 200 Total0 2 1 1 4100 13 91 104200 1 77 . 78Total 3 91 92 186
The empirical distribution of investment in the two games is only slightlydifferent in the two treatments. Two participants, both in the experimentalgroup, kept the whole endowment of 300 NOK. One participant in thecontrol group invested only 100 NOK. 15 participants, 10 from the controlgroup, invested 200 NOK. 13 of the 18 participants who did not invest thewhole endowment were assigned a low rate of return.10 In both treatmentsthe remaining 168 participants invested the full endowment of 300 NOK,reasonably evenly distributed between (200,100) and (100, 200).The participants were given the option of investing 0 NOK to make the
investment decision real, and as some participants opted for no investment inone or both games, it was also perceived as such. However most participantsinvested the full amount. Hence the investment incentives caused by the
9It is also interesting to notice that when individuals decide how to distribute income,it matters to them how the contribution to total production came about. The correlationin the experimental group between the individuals’ proposals in the distribution phase anda) their own investment decisions, b) their opponents’ investment decisions, c) their ownrate of return and d) their opponents’ rate of return are r(yi, qi) = .5164, r(yi, qj) = .2711,r(yi, ai) = .4703 and r(yi, aj) = .2847, respectively. The corresponding numbers for thecontrol group are .5245, .4058, .4222 and .4018.10In the experimental group the fairness ideals were evenly distributed amongst the
participants who either invested nothing or kept 100 NOK: 2 reported the strict egalitarianideal, 2 reported the liberal egalitarian ideal and 3 reported the libertarian ideal.
14

three fairness ideals do not seem to have affected the choices in the productionphase.
4.1.3 Statistics from the communication phase
Table 4 reports the distribution of reported fairness ideals in the communica-tion phase. Only 15 participants reported strict egalitarianism as the fairestideal, while the remaining 77 participants were evenly distributed betweenthe liberal egalitarian and libertarian ideals.
Table 4: Reported fairness ideals Fairness ideal Frequency PercentStrict egalitarianism 15 16.3 Liberal egalitarianism 39 42.4 Libertarianism 38 41.3 Total 92 100
Table 5 gives the number of observations of participants who have re-ported the same fairness ideal as their opponent in the communication phaseand the number of observations of participants who have reported a differentfairness ideal to their opponent.
Table 5: Observations by reported fairness ideal and the implication of the ideal Implication Fairness ideal Same Different TotalSame 60 . 60 Different 70 54 124 Total 130 54 184
The number of observations where the distributive implications of thefairness ideals reported by a participant and his opponent are the same andthe number of observations where the distributive implication of the fair-ness ideals reported by a participant and his opponent are different are alsoreported in table 5. There are 124 observations of participants who havereported different fairness ideal than their opponent in the communication
15

phase. For 70 of these observations the different ideals imply the same fairdistribution, while for 54 observations the different ideals imply different fairdistribution. In the next section the variation in data reported in table 5 isutilized in order to test the effect of communication on distribution.
4.2 Analysis
The participants in the experimental group offer more to their opponent inthe distribution phase than the participants in the control group. In thissection I test if the difference is statistically significant.
4.2.1 Does communication matter?
I test if pre-play communication is more than just cheap talk (Crawford andJoel Sobel, 1982; Rabin, 1990; Farrell and Rabin, 1996). When individ-uals make their decision in the distribution phase the first order conditionequation (5) in section 2.2 predicts that both the weight (βi) they attach tofairness considerations and their overall fairness consideration (m∗
i ) matter.Hence if communication has an effect on distributive behaviour, this may beexplained by a change in both factors. I test first if communication has aneffect on βi. Next I test if communication has an effect on m∗
i .
Effect on the weight attached to fairness Two hypotheses on howcommunication may affect the individual weight attached to fairness consid-erations are tested: the discursive hypothesis and the affiliation hypothesis.The discursive hypothesis is that individuals who have had the opportunityto exchange information about fairness give more importance to the mat-ter than individuals who have not had this opportunity. The idea is thatdiscussing fairness triggers a greater concern for fairness in general. Theaffiliation hypothesis is that individuals make higher offers to opponents whoendorse the same fairness ideal as themselves than to opponents who endorsea different fairness ideal.
The discursive hypothesis The individual weights attach to fairnessconsiderations are unobserved, but as the three fairness ideals on averageinstruct individuals to distribute total income equally, any difference in aver-age offer to opponent between the control group and the experimental group
16

should reflect a difference in the average weight attached to fairness consid-erations.11
I perform a two-sample t test of the null hypothesis that the populationmeans of offer made to opponent in relative and absolute terms are the samefor the control group and the experimental group. It is assumed that the twopopulations have unequal variances, and a one-tailed test is applied. Table6 reports the results of the tests.
Table 6: Test of the null hypothesis that the mean offers are the same in the two treatments
Variable Absolute RelativeDifference - 50.79 - 0.038 p-value 0.035 0.053 Note: The variables Absolute and Relative are offer made to opponent in NOK and in percentage of total income produced in each particular distributive situation. Difference refers to the difference between the population means of offer made to opponent in the control group and in the experimental group.
The data seems to support the discursive hypothesis. For offer made toopponent in absolute terms the null hypothesis can be rejected at 5 percentlevel, and for offer made to opponent in relative terms the null hypothesiscan be rejected at 10 percent level. Despite the fact that the informationexchange is non-binding and has no monetary pay-off implication, the partic-ipants act on average more generously when they have changed informationabout hypothetical distribution situations compared to not having had thisopportunity. Hence communication increases the weight individuals attachto fairness considerations.I now turn to a robustness analysis of this observation. The difference
in average offer to opponent between the experimental group and the controlgroup is not necessarily a good measure of the average weight attached tofairness considerations between the groups, if the two groups are unequallyrestricted by corner solutions or subjects in the experimental group behave
11This is correct if people do not behave opportunistically and if the two groups areequally restricted by corner solutions, which I return to shortly. See also the appendix,section 6.3.
17

opportunistically. I will consider each of the two issues in turn. First,the number of corner solutions in each group may serve as a proxy for howrestricted the two groups are. There are 49 corner solutions in the ex-perimental group and 58 in the control group. Hence the issue of cornersolutions is not important in this analysis. Second, to deal with the prob-lem of opportunistic behaviour I provide a more refined test of the discursivehypothesis.There are 130 observations where the reported fairness ideal of both play-
ers implies the same distribution (see table 5). Hence the three first orderconditions equations (6)-(8) in section 2.3 coincide and the optimal proposalis in line with the integrity model. Accordingly, if there is a difference inthe average offer between the control group and the players in the experi-mental group whose reported fairness ideals imply the same distribution, thedifference can only be due to a change in the weight attached to fairnessconsiderations.I perform a two-sample t test of the null hypothesis that the population
means of offer made to opponent in absolute and relative terms are the samefor the control group and for the group of players in the experimental groupwhose reported fairness ideal implies the same distribution. The t test is one-tailed, and I assume that the two populations have unequal variances. Table7 reports the results of the tests. For offer made to opponent in absoluteterms the null hypothesis can be rejected at 5 percent level, and for offermade to opponent in relative terms the null hypothesis can be rejected at 10percent level. Hence the conclusion that the data supports the discursivehypothesis seems to be robust.
Table 7: Test of the null hypothesis that the mean offers are the same in the two groups
Variable Absolute RelativeDifference - 47.97 - 0.037 p-value 0.039 0.073 Note: The variables Absolute and Relative are offer made to opponent in NOK and in percentage of total income produced in each particular distributive situation. Difference refers to the difference between the population means of offer made to opponent in the control group and the group of players in the experimental group who reported fairness ideal that implied the same distribution.
18

The affiliation hypothesis The affiliation hypothesis is tested on asubset of the full sample. I compare the 60 observations of participants whohave reported the same fairness ideal as their opponent in the communicationphase with the 70 observations of participants who have reported a differentfairness ideal as their opponent but with the same distributive implication(see table 5). Accordingly the only difference between the two groups is thatin group 1 the players endorse the same fairness ideal as their opponents andin group 2 the players endorse a different fairness ideal than their opponents.I perform a two-sample t test of the hypothesis that the population meansof offer to opponent are the same for group 1 and group 2. The t test Irun assumes that the two populations have unequal variances. The alter-native hypothesis is one-sided. The result is reported in table 8. The nullhypothesis can not be rejected. In fact the sign contradicts the alternativehypothesis. There is no affiliation effect. An individual offers on averagemore to an opponent who endorses a different fairness ideal than himself evenwhen restricted to the situations were the distributive implications are thesame.
Table 8: Test of the null hypothesis that the mean offers are the same in the two groups
Variable Absolute RelativeDifference - 92.23 - 0.061 p-value 0.983 0.932 Note: The variables Absolute and Relative are offer made to opponent in NOK and in percentage of total income produced in each particular distributive situation. Difference refers to the difference between the population means of offer made to an opponent who endorses the same fairness ideal and an opponent who endorses a different fairness ideal with the same distributive implication.
Effect on the overall fairness consideration To test the effect of com-munication on the overall fairness consideration, I estimate the three modelspresented in section 2.3. The amount of money a player keeps in the distribu-tion phase relative to total income is regressed on the distributive implicationof his and his opponent´s choice of fairness ideal in the communication phase.Since there is an unobserved weight attached to fairness considerations, whichis assumed to be uncorrelated with the fairness ideal an individual endorses,
19
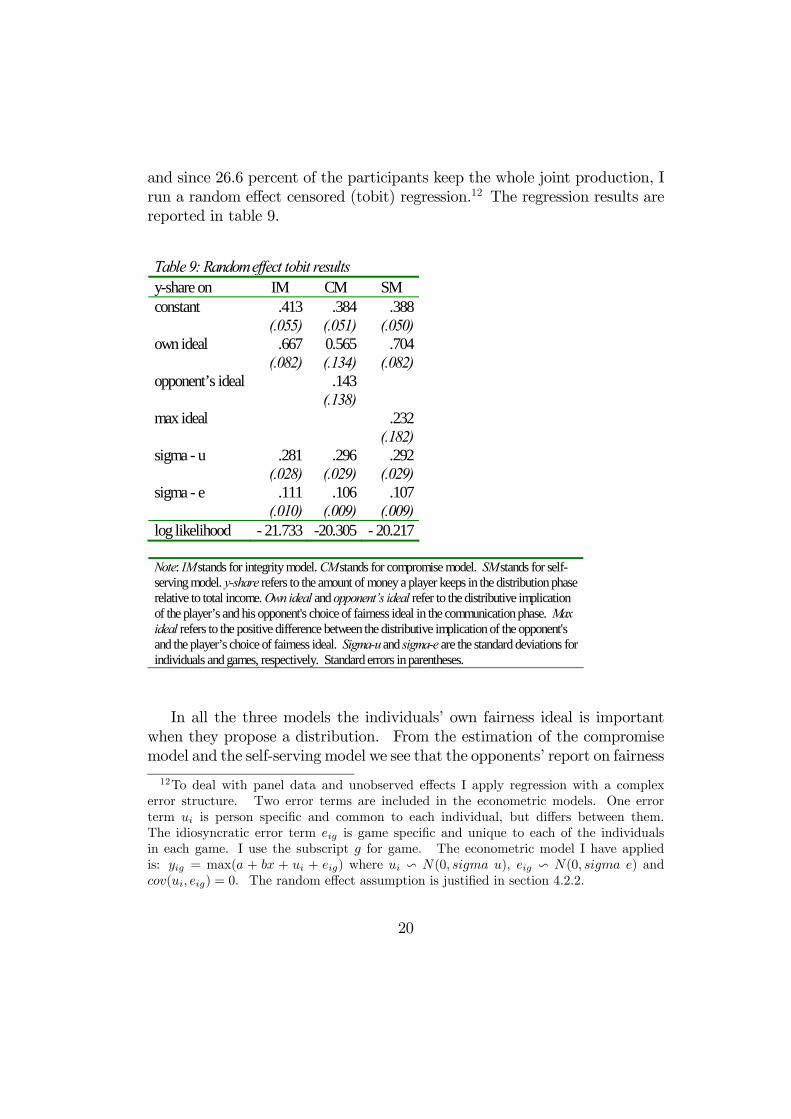
and since 26.6 percent of the participants keep the whole joint production, Irun a random effect censored (tobit) regression.12 The regression results arereported in table 9.
Table 9: Random effect tobit results y-share on IM CM SM constant .413 .384 .388 (.055) (.051) (.050)own ideal .667 0.565 .704 (.082) (.134) (.082)opponent’s ideal .143 (.138)max ideal .232 (.182)sigma - u .281 .296 .292 (.028) (.029) (.029)sigma - e .111 .106 .107 (.010) (.009) (.009)log likelihood - 21.733 -20.305 - 20.217 Note: IM stands for integrity model. CM stands for compromise model. SM stands for self- serving model. y-share refers to the amount of money a player keeps in the distribution phase relative to total income. Own ideal and opponent’s ideal refer to the distributive implication of the player’s and his opponent's choice of fairness ideal in the communication phase. Max ideal refers to the positive difference between the distributive implication of the opponent's and the player’s choice of fairness ideal. Sigma-u and sigma-e are the standard deviations for individuals and games, respectively. Standard errors in parentheses.
In all the three models the individuals’ own fairness ideal is importantwhen they propose a distribution. From the estimation of the compromisemodel and the self-serving model we see that the opponents’ report on fairness
12To deal with panel data and unobserved effects I apply regression with a complexerror structure. Two error terms are included in the econometric models. One errorterm ui is person specific and common to each individual, but differs between them.The idiosyncratic error term eig is game specific and unique to each of the individualsin each game. I use the subscript g for game. The econometric model I have appliedis: yig = max(a + bx + ui + eig) where ui v N(0, sigma u), eig v N(0, sigma e) andcov(ui, eig) = 0. The random effect assumption is justified in section 4.2.2.
20
in the communication phase also seems to be important for the individualswhen they propose a distribution.Hence there seems to be an effect of communication on an individual’s
overall fairness consideration. The individuals take the opponent’s reportedfairness ideal into account when they propose a distribution. The effect ofthe opponent’s report on fairness is strongest in the self-serving model, whichalso has the highest log likelihood value.The estimated values of the parameters in the three models are not fully
in accordance with the assumed restrictions on the parameters in the the-oretical models, which probably reflects that there is a certain degree ofheterogeneity in the population with respect to how people deal with com-munication. The opportunity to exchange information about fairness idealsmay motivate some individuals to bias their overall fairness considerationsin favour of themselves, while others may be encouraged to show integrityand commit to their own reported fairness ideal, and still others may preferan overall fairness consideration that is a compromise solution, somewherein between their own and their opponent’s reported fairness ideal.
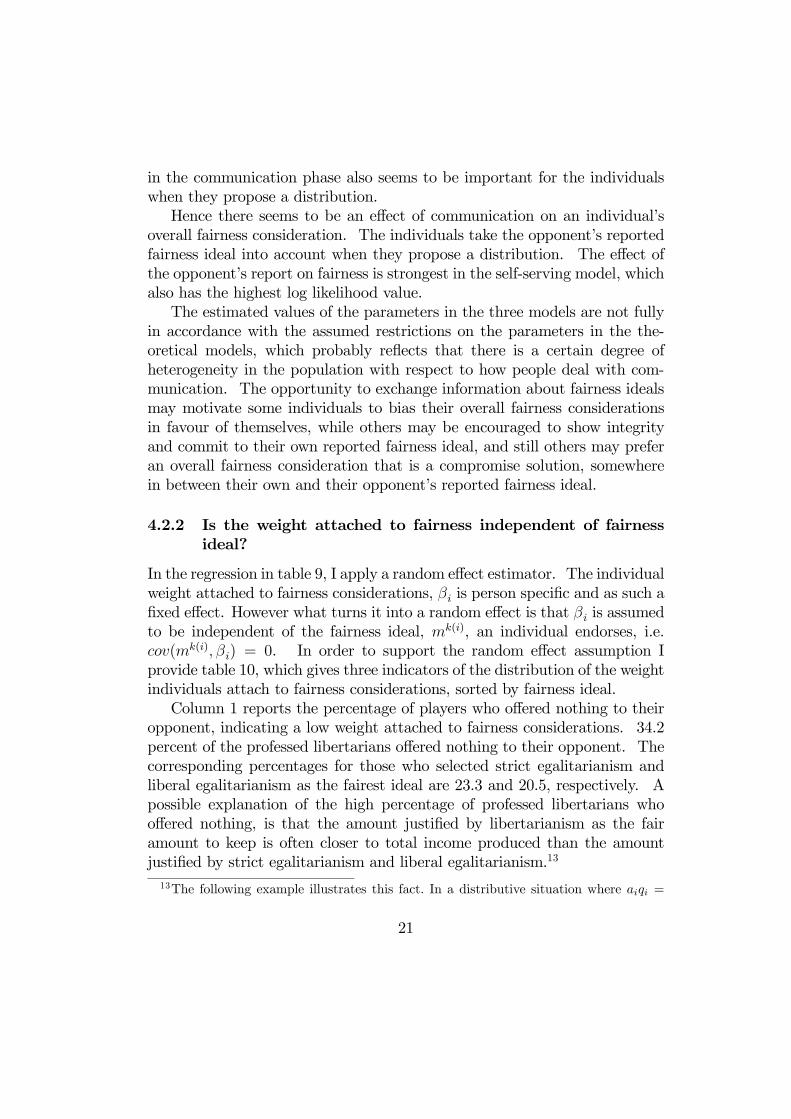
4.2.2 Is the weight attached to fairness independent of fairnessideal?
In the regression in table 9, I apply a random effect estimator. The individualweight attached to fairness considerations, βi is person specific and as such afixed effect. However what turns it into a random effect is that βi is assumedto be independent of the fairness ideal, mk(i), an individual endorses, i.e.cov(mk(i), βi) = 0. In order to support the random effect assumption Iprovide table 10, which gives three indicators of the distribution of the weightindividuals attach to fairness considerations, sorted by fairness ideal.Column 1 reports the percentage of players who offered nothing to their
opponent, indicating a low weight attached to fairness considerations. 34.2percent of the professed libertarians offered nothing to their opponent. Thecorresponding percentages for those who selected strict egalitarianism andliberal egalitarianism as the fairest ideal are 23.3 and 20.5, respectively. Apossible explanation of the high percentage of professed libertarians whooffered nothing, is that the amount justified by libertarianism as the fairamount to keep is often closer to total income produced than the amountjustified by strict egalitarianism and liberal egalitarianism.13
13The following example illustrates this fact. In a distributive situation where aiqi =
21
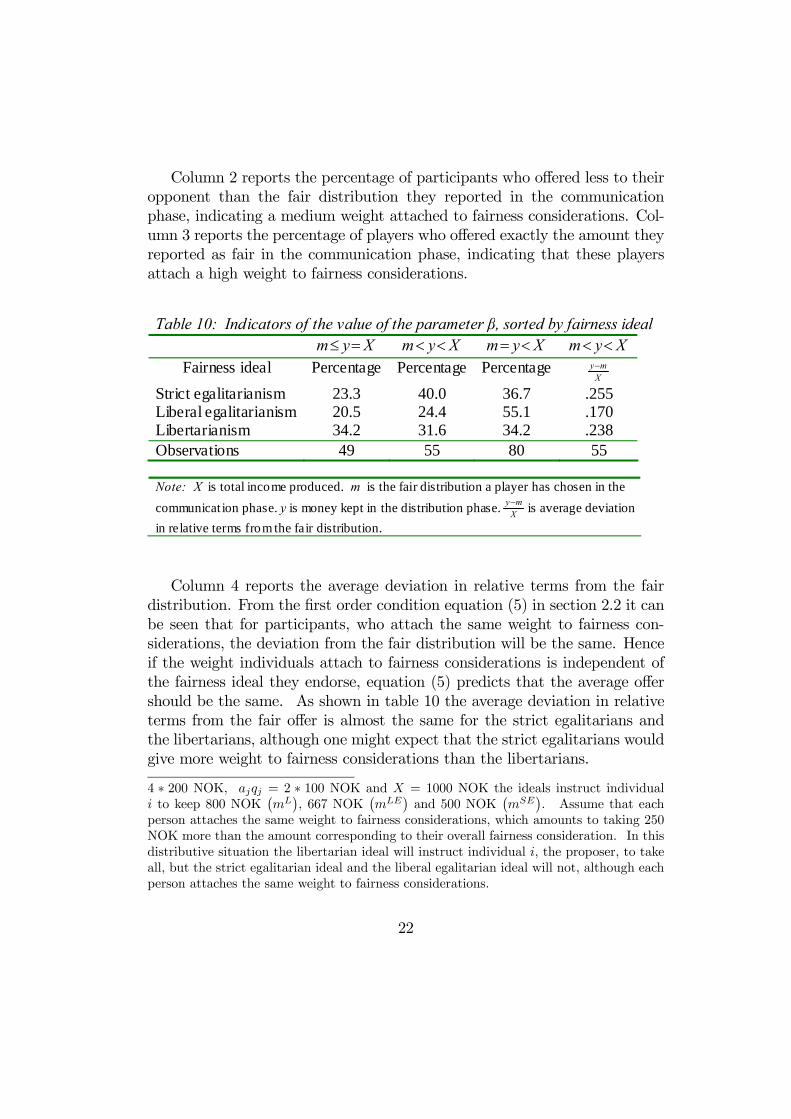
Column 2 reports the percentage of participants who offered less to theiropponent than the fair distribution they reported in the communicationphase, indicating a medium weight attached to fairness considerations. Col-umn 3 reports the percentage of players who offered exactly the amount theyreported as fair in the communication phase, indicating that these playersattach a high weight to fairness considerations.
Table 10: Indicators of the value of the parameter β, sorted by fairness ideal Xym =≤ Xym << Xym <= Xym <<
Fairness ideal Percentage Percentage Percentage X
my− Strict egalitarianism 23.3 40.0 36.7 .255 Liberal egalitarianism 20.5 24.4 55.1 .170 Libertarianism 34.2 31.6 34.2 .238 Observations 49 55 80 55 Note: X is total income produced. m is the fair distribution a player has chosen in the communicat ion phase. y is money kept in the distribution phase. X
my− is average deviation in relative terms from the fair distribution.
Column 4 reports the average deviation in relative terms from the fairdistribution. From the first order condition equation (5) in section 2.2 it canbe seen that for participants, who attach the same weight to fairness con-siderations, the deviation from the fair distribution will be the same. Henceif the weight individuals attach to fairness considerations is independent ofthe fairness ideal they endorse, equation (5) predicts that the average offershould be the same. As shown in table 10 the average deviation in relativeterms from the fair offer is almost the same for the strict egalitarians andthe libertarians, although one might expect that the strict egalitarians wouldgive more weight to fairness considerations than the libertarians.
4 ∗ 200 NOK, ajqj = 2 ∗ 100 NOK and X = 1000 NOK the ideals instruct individuali to keep 800 NOK
¡mL¢, 667 NOK
¡mLE
¢and 500 NOK
¡mSE
¢. Assume that each
person attaches the same weight to fairness considerations, which amounts to taking 250NOK more than the amount corresponding to their overall fairness consideration. In thisdistributive situation the libertarian ideal will instruct individual i, the proposer, to takeall, but the strict egalitarian ideal and the liberal egalitarian ideal will not, although eachperson attaches the same weight to fairness considerations.
22

The general picture emerging from table 10 given that we should expectsome noise in the data, is that for the integrity model there are no largesystematic differences in the distribution of the weight attached to fairnessbetween the fairness ideals, indicating that the weight individuals attach tofairness considerations is independent of the fairness ideal they endorse, andif so the random effect assumption may to a certain extent be justified.14
5 Concluding remarks
The aim of this paper has been to analyse the effect of communication onthe individual weight attached to fairness considerations and on individualassessment of fairness in situations involving production. The informationexchange in the communication phase is non-binding and it has no monetarypay-off implication, but it comes out as more than cheap talk, pre-play com-munication has a statistically significant effect on individual behaviour in thedistribution phase. Individuals, who have had the opportunity to exchangeinformation about fairness ideals, act on average more generously than indi-viduals who have not had this opportunity. The information exchange hasan impact on both the weight individuals attach to fairness considerationsand on their overall fairness considerations. The weight individuals attachto fairness considerations increases due to communication and the increaseis statistically significant. Regression results indicate that communicationalso has an impact on an individual’s overall fairness considerations and thatthere is a certain degree of heterogeneity in the population with respect tohow most people process information. Some individuals bias their overallfairness consideration in favour of themselves, while others commit to theirown reported fairness ideal, and still others prefer an overall fairness consid-eration that is a compromise solution, somewhere in between their own andtheir opponent’s reported fairness ideal.The paper focuses on three fairness ideals which are the most prominent
in the literature. However, as 30.5 percent of the observations in the con-trol group and 26.6 percent of the observations in the experimental groupare participants who offered nothing to their opponent, one may also putforward the argument that people think it is fair to take all. The most
14The same can be shown for the compromise model and the self-serving model. Thegeneral picture emerging from table 10 is the same when I analyse the 130 observationswhere the reported fairness ideal of both players implies the same distribution.
23
congenial of the three fairness ideals considered in the paper for people whothink it is fair to take all, is libertarianism and thus for this group the fairchoice in the communication phase is libertarianism. This could also be apossible interpretation of the high percentage of professed libertarians in theexperimental group who offered nothing to their opponent.The impact of pre-play communication on individual distributive behav-
iour may potentially be due to framing. There is always the aspect thatvariation in the presentation of a scenario may change behaviour. How-ever simple design, as in the current study, reduces potential framing effects.The framing issue is also a matter of external validity, and further researchis required to gain a better understanding of the context dependent way inwhich people handle decision problems and the extent to which the findingsobtained in the laboratory generalise to real-world settings.
24

6 Appendix
6.1 Robustness test of the estimated parameters: threespecifications of the utility function
I assume quadratic disutility in the deviation from the overall fairness consid-eration because it is more in line with data from dictator game experimentsthan the linear disutility. The symmetric disutility assumption is not crucialin a dictator game like the one in this study because almost all the partic-ipants offer less than what they report to be the fair amount. Alternativeformulations of the loss function are tested below.I examine the effect on the estimated parameters of three specifications of
the utility function. M-1 represents the utility function applied in the mainbody of the paper. The regression results of this specification are reportedin table 9 in section 4.2.1. M-2 defines utility in terms of relative deviationfrom the fairness ideal, and M-3 defines utility in terms of absolute deviationfrom the fairness ideal.
M-1: Ui(y;a,q) = y − βi2[y−m∗i (a,q)]
2
X(a,q)
M-2: Ui(y; a,q) = y − βi2
³y−m∗i (a,q)X(a,q)
´2M-3: Ui(y;a,q) = y − βi
2[y −m∗
i (a,q)]2
Given an interior solution the optimal proposals for the three specificationsof the utility function are:
M-1:y∗
X(a,q)=
m∗i
X(a,q)+1
βi=⇒ y∗
X(a,q)− m∗
i
X(a,q)=1
βi
M-2:y∗
X(a,q)=
m∗i
X(a,q)+
X
βi=⇒ y∗
X(a,q)− m∗
i
X(a,q)=
X
βi
M-3:y∗
X(a,q)=
m∗i
X(a,q)+
1
Xβi=⇒ y∗ −m∗
i =1
βi
25
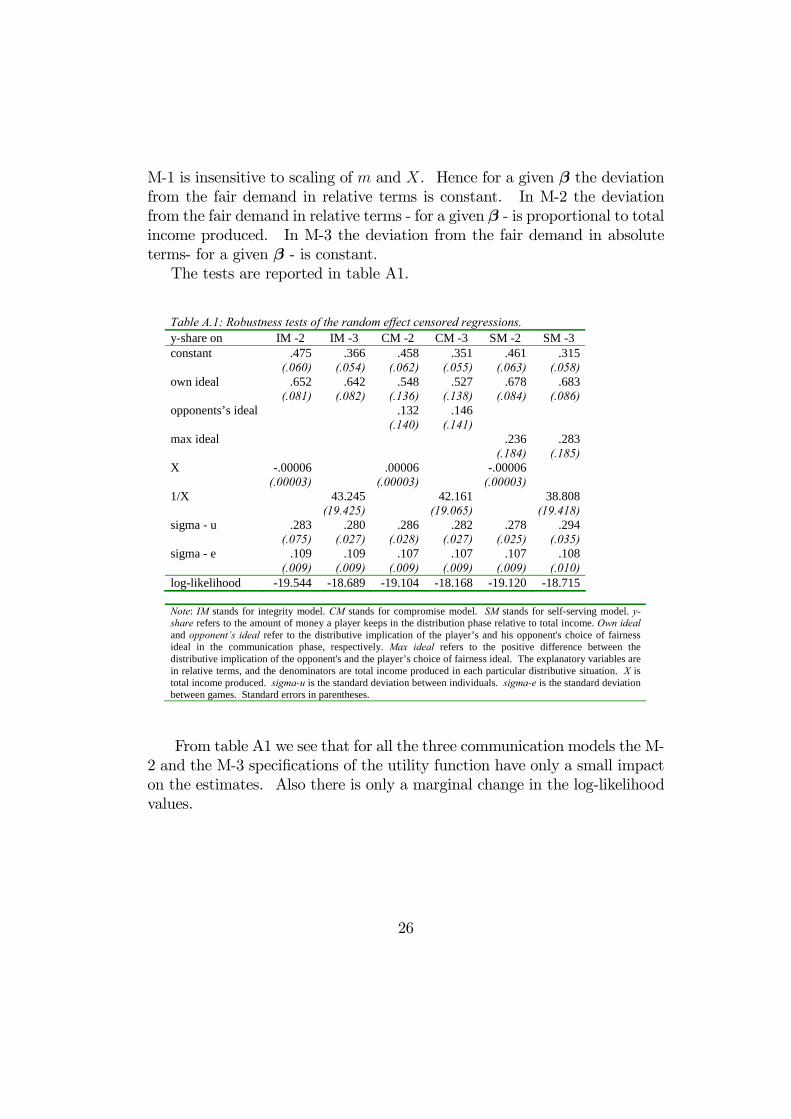
M-1 is insensitive to scaling of m and X. Hence for a given β the deviationfrom the fair demand in relative terms is constant. In M-2 the deviationfrom the fair demand in relative terms - for a given β - is proportional to totalincome produced. In M-3 the deviation from the fair demand in absoluteterms- for a given β - is constant.The tests are reported in table A1.
Table A.1: Robustness tests of the random effect censored regressions. y-share on IM -2 IM -3 CM -2 CM -3 SM -2 SM -3 constant .475 .366 .458 .351 .461 .315 (.060) (.054) (.062) (.055) (.063) (.058) own ideal .652 .642 .548 .527 .678 .683 (.081) (.082) (.136) (.138) (.084) (.086) opponents’s ideal .132 .146 (.140) (.141) max ideal .236 .283 (.184) (.185) X -.00006 .00006 -.00006 (.00003) (.00003) (.00003) 1/X 43.245 42.161 38.808 (19.425) (19.065) (19.418) sigma - u .283 .280 .286 .282 .278 .294 (.075) (.027) (.028) (.027) (.025) (.035) sigma - e .109 .109 .107 .107 .107 .108 (.009) (.009) (.009) (.009) (.009) (.010) log-likelihood -19.544 -18.689 -19.104 -18.168 -19.120 -18.715 Note: IM stands for integrity model. CM stands for compromise model. SM stands for self-serving model. y-share refers to the amount of money a player keeps in the distribution phase relative to total income. Own ideal and opponent’s ideal refer to the distributive implication of the player’s and his opponent's choice of fairness ideal in the communication phase, respectively. Max ideal refers to the positive difference between the distributive implication of the opponent's and the player’s choice of fairness ideal. The explanatory variables are in relative terms, and the denominators are total income produced in each particular distributive situation. X is total income produced. sigma-u is the standard deviation between individuals. sigma-e is the standard deviation between games. Standard errors in parentheses.
From table A1 we see that for all the three communication models the M-2 and the M-3 specifications of the utility function have only a small impacton the estimates. Also there is only a marginal change in the log-likelihoodvalues.
26

6.2 Full distribution of offer in absolute and relativeterms
Table A2 gives the empirical distribution of offer made to opponent in NOKin the experimental group and in the control group.
Table A2: Empirical distribution of offer in absolute terms, by treatment Frequency Percent Cumulative Offer NC C NC C NC C
0 58 49 30.53 26.63 30.53 26.631 2 1.09 27.72
50 2 1.09 28.80100 15 8 7.89 4.35 38.42 33.15150 3 1.58 40.00 200 39 32 20.53 17.39 60.53 50.54250 1 0.53 61.05 267 4 2.17 52.72300 25 11 13.16 5.98 74.21 58.70333 2 1.09 59.78350 2 1.09 60.87400 23 32 12.11 17.39 86.32 78.26500 6 5 3.16 2.72 89.47 80.98533 3 1.63 82.61550 1 0.54 83.15600 8 16 4.21 8.17 93.68 91.85650 1 1 0.53 0.54 94.21 92.39667 2 1.09 93.48700 3 1 1.58 0.54 95.79 94.02750 1 0.53 96.32 800 7 11 3.68 5.98 100 100
190 184 100 100 Note: NC refers to the treatment without pre-play communication: the control group. C refers to the treatment with communication: the experimental group.
27

Figure A1 shows the empirical distribution of the offer made to the op-ponent in the percentage of total income produced in each particular distrib-utive situation, in the experimental group and in the control group.
Figure A1: Empirical distribution of offer in relative terms, by treatment
01
02
03
0P
erc
en
t
0 .2 .4 .6 .8Offer in relative terms
No communication
01
02
03
04
0P
erc
en
t
0 .2 .4 .6 .8Offer in relative terms
Communication
28

6.3 Self-serving bias and corner solutions
In this section I explain how self-serving behaviour and restrictions by cornersolutions can interfere with the measure of the difference in average weightattached to fairness considerations.
6.3.1 Self-serving bias
An individual’s reaction to communication may be self-serving. There isa possibility that an individual opportunistically chooses the fairness idealthat benefits him most in any particular distributive situation. If there isself-serving bias at work, the difference in average offer to opponent betweenthe experimental and the control group is not necessarily a good measure ofthe difference in average weight attached to fairness considerations betweenthe two groups. The following example illustrates this fact. To make theexample as simple as possible I assume extreme self-serving behaviour.Consider two groups, a control group and an experimental group, and a
situation where individual i is an egalitarian and individual j is a libertarianin both groups. The individuals in both groups also attach the same weightto fairness considerations which amounts to taking 100 NOK more than theamount corresponding to their overall fairness consideration. Moreover as-sume that everyone in the experimental group behaves opportunistically.Suppose that the individuals face a distributive situation where aiqi =
4 ∗ 200 NOK, ajqj = 2 ∗ 100 NOK and X = 1000 NOK. The libertarianideal instructs individual i, the proposer, to keep 800 NOK and the strictegalitarian ideal instructs individual i, the proposer, to keep 500 NOK. Inthis distributive situation individual i in the control group offers 400 NOK,while individual j offers 700 NOK. The average offer is 550 NOK. In theexperimental group, due to extreme self-serving, individual i offers 100 NOKand individual j offers 400 NOK, and the average offer is 250 NOK.With self-serving bias at work the difference in average offer between the
the control group and the experimental group is 300 NOK. This indicates adifference in the average weight attached to fairness considerations betweenthe two groups, which - since everyone takes 100 NOKmore than the amountcorresponding to their overall fairness consideration, does not exist. Hencein this example the difference in average offer to opponent between the twogroups is not a good measure of the difference in the average weight attachedto fairness considerations between the two groups.
29

6.3.2 Corner solutions
Communication may cause changes in the prevalence of fairness ideals in sucha way that the experimental group and the control group are not equallyrestricted by corner solutions, and if so the difference in average offer toopponent between the two groups is not necessarily a good measure of thedifference in average weight attached to fairness considerations between thetwo groups. The following example illustrates this fact.Consider two groups - a control group and an experimental group - and
a situation where communication has caused a change in the prevalence offairness ideals in such a way that everyone in the experimental group is alibertarian, and everyone in the control group is a strict egalitarian. The indi-viduals in both groups also attach the same weight to fairness considerationswhich amounts to taking 300 NOK more than the amount corresponding totheir overall fairness consideration.Suppose that the individuals face a distributive situation where aiqi =
4 ∗ 200 NOK, ajqj = 2 ∗ 100 NOK and X = 1000 NOK. The libertarianideal instructs individual i, the proposer, to keep 800 NOK and the strictegalitarian ideal instructs individual i, the proposer, to keep 500 NOK. Inthis distributive situation individual i in the experimental group offers 0NOK, which is a corner solution, and individual j offers 500 NOK. Theaverage offer is 250 NOK. In the control group individual i offers 200 NOKand individual j offers 200 NOK, and the average offer is 200 NOK.The difference in average offer between the experimental group and the
control group is 50 NOK. This indicates a difference in the average weightattached to fairness considerations between the two groups, which - sinceeveryone takes 300 NOKmore than the amount corresponding to their overallfairness consideration, does not exist. Hence in this example the differencein average offer to opponent between the two groups is not a good measureof the difference in the average weight attached to fairness considerationsbetween the two groups.
30
References
[1] Babcock, Linda; Loewenstein, George; Issacharoff, Samuel;and Camerer, Colin. "Self-serving assessment of Fairness and Pre-trial Bargaining " Journal of Legal Studies, 1993, 22 (1): 135-59.
[2] Babcock, Linda; Loewenstein, George; Issacharoff, Samuel andCamerer, Colin. "Biased Judgement of Fairness in Bargaining" Amer-ican Economic Review, 1995, Vol. 85 No 5: 1337-1343.
[3] Babcock, Linda and Loewenstein, George. "Explaining Bargain-ing Impasse: The Role of Self-Serving Biases" Journal of EconomicPerspectives, 1997, Vol. 11 No 1: 109-126.
[4] Bolten, Gary E. and Ockenfels, Axel. “ERC: A Theory of Equity,Reciprocity, and Competition”The American Economic Review, 2000,Vol. 90 Issue 1: 166-193.
[5] Camerer, Colin. Behavioral Game Theory: Experiments in StrategicInteraction. Princeton: Princeton University Press, 2003.
[6] Cappelen, Alexander W.; Hole, Astri Drange; Sørensen, ErikØ.; Tungoddden, Bertil. "The pluralism of fairness ideals: Anexperimental approach" Forthcoming in The American Economic Re-view.
[7] Crawford, Vincent P. and Sobel, Joel. "Strategic InformationTransmission" Econometrica, 1982, 50,1431-51.
[8] Crawford, Vincent P."Explicit Communication and Bargaining Out-comes" American Economic Review. Papers and Proceeding, 1990, 80,213-219.
[9] Crawford, Vincent P. "A Survey of Experiments on Communictionvia Cheap Talk" Journal of Economic Theory,1998, 78, 286-298.
[10] Dana, Jason; Weber, Roberto A.; and Kuang, Jason Xi. "Ex-ploiting moral wriggle room: Behavior inconsistent with a preference forfair outcome" Mimeo, Carnegie Mellon University, 2004.
[11] Ellingsen, Tore and Johannesson, Magnus. "Promises, Threats,and Fairness" Economic Journal, 2004a, 114, 397-420.
31

[12] Ellingsen, Tore and Johannesson, Magnus. "Is There a Hold-upProblem" Scandinavian Journal of Economics, 2004b, 106, 475-494).
[13] Ellingsen, Tore and Johannesson, Magnus. "Does impartial de-liberation breed fair behaviour?" Rationality and Society, 2005, 17(1)116-136.
[14] Farrell, Joseph and Rabin, Matthew. "Cheap Talk" Journal ofEconomic Perspectives, 1996, Vol. 10, No 3, 103-118.
[15] Fehr, Ernst and Smith, Klaus M. "A theory of fairness, competition,and cooperation" The Quarterly Journal of Economics, 1999, (817-868).
[16] Frohlich, Norman; Oppenheimer, Joe; and Kurki, Anja. "Mod-elling other-regarding preferences and an experimental test" PublicChoice, 2004, 119; 91-117.
[17] Johannesson, Magnus and Mohlin, Erik. "Communication: Con-tent and Relationship" Forthcoming in Journal of Economic Behaviorand Organization, 2005.
[18] Kagel, John H. and Roth, Alvin E. Handbook of ExperimentalEconomics. Princeton: Princeton University Press 1995.
[19] Konow, James. “A positive theory of economic fairness" Journal ofEconomic Behavior and Organization, 1996, vol. 31, 13-35.
[20] Konow, James. “Fair Shares: Accountability and Cognitive Disso-nance in Allocation Decisions,” American Economic Review, 2000, vol.90, no. 4 (September), pp. 1072-1091.
[21] Konow, James. “Fair and Square: The Four Sides of DistributiveJustice,” Journal of Economic Behavior and Organization, 2001, vol.46, no. 2 (October), pp. 137-164.
[22] Konow, James. “Which is the Fairest One of All: A Positive Analysisof Justice Theories,” Journal of Economic Literature, 2003, 41(4), pp.1188-1239.
[23] Konow, James. “Blind Spots: The Effects of Information and Stakeson Fairness Bias and Dispersion,” Social Justice Research, 2005, vol. 18,no. 4 (December), pp. 349-390.
32

[24] Messick, David M. and Sentis, Keith. "Fairness, preferences andfairness bias" In David M. Messick and Karen S. Cook, eds., Equity The-ory: Psychological and Sociological Perspectives. New York: Praeger,1983 pp. 61-94.
[25] Nielsen, Kai. Equality and Liberty. Totowa, NJ: Roman and Allan-held, 1985.
[26] Norzick, Robert. Anarchy, State and Utopia. New York: Basic Books,1974.
[27] Rabin, Matthew. "Communication between Rational Agents" Journalof Economic Theory, 1990, 51, 144-170. (Corrigendum, 1992, Vol 58, pp.110-1).
[28] Rabin, Matthew. "Cognitive dissonance and social change" Journalof Economic Behavior and Organization, 1994, 23, pp. 111-194.
[29] Roemer, John E. Equality of Opportunity. Harvard University Press.1998.
[30] Sally, David. "Conversation and cooperation in social dilemmas. AMeta analysis of experiments from 1958-1992. Rationality and Society,1992.
33