Embed Size (px)
Citation preview

Deepening intra-Commonwealth trade and investment – and using these opportunities to empower women and young people as entrepreneurs – can help drive economic growth, create jobs and increase the prosperity of Commonwealth citizens. The theme of Commonwealth Trade Review 2018 is ‘Strengthening the Commonwealth Advantage: Trade, Technology, Governance’. This edition presents new empirical findings, rich insights and practical recommendations on how to boost the ‘Commonwealth advantage’ in trade and investment.
Part 1 - Commonwealth trade and investment trends
Part 2 - The Commonwealth in multilateral and regional trade
Part 3 - Harnessing digitisation for Commonwealth trade, investment and prosperity
Part 4 - Deepening the Commonwealth advantage through 21st-century trade governance
CO
MM
ON
WE
ALT
H T
RA
DE
RE
VIE
W 2018
Strengthening the Commonwealth AdvantageTrade, Technology, Governance
Commonwealth Trade Review 2018
Strengthening the Commonwealth Advantage
Trade • Technology • Governance
Commonwealth Trade Review 2018

Commonwealth SecretariatMarlborough HousePall MallLondon SW1Y 5HXUnited Kingdom© Commonwealth Secretariat 2018
All rights reserved. No part of this publication may be reproduced, stored in a retrieval system, or transmitted in any form or by any means, electronic or mechanical, including photocopying, recording or otherwise without the permission of the publisher.
Published by the Commonwealth SecretariatDesigned by Nova Techset Private Limited, Bengaluru & Chennai, IndiaCover design by Earth Creative Strategies, London, UKPrinted by Hobbs the Printers Ltd, Totton, UK
Views and opinions expressed in this publication are the responsibility of the authors and should in no way be attributed to the institutions to which they affiliated or to the Commonwealth Secretariat.
Wherever possible, the Commonwealth Secretariat uses paper sourced from sustainable forests or from sources that minimise a destructive impact on the environment.
Copies of this publication may be obtained from
Publications SectionCommonwealth SecretariatMarlborough HousePall MallLondon SW1Y 5HXUnited KingdomTel: +44 (0)20 7747 6534Fax: +44 (0)20 7839 9081Email: [email protected]: www.thecommonwealth.org/publications
A catalogue record for this publication is available from the British Library.
ISBN (paperback): 978-1-84929-180-4ISBN (e-book): 978-1-84859-971-0
Introduction
The Commonwealth is an association of 53 independent countries, comprising large and small, developed and developing, landlocked and island economies. As the main intergovernmental body of the association, the Commonwealth Secretariat works with member governments to deliver on priorities agreed by Commonwealth Heads of Government and promotes international consensus building. It provides technical assistance and advisory services to members, helping governments achieve sustainable, inclusive and equitable development. The Secretariat’s work programme encompasses areas such as democracy, rule of law, human rights, governance and social and economic development.

Foreword

Foreword \ v
Profound changes are taking place
in the global trade landscape,
including the technologies and
governance frameworks that
underpin and support contemporary
trade in goods, services and the
digital economy. This dynamic
environment presents challenges,
and also enormous opportunities
to expand and deepen trade,
investment and innovation among
the 53 member countries of our
growing Commonwealth family.
Strengthening the Commonwealth
Advantage: Trade, Technology,
Governance has been prepared ahead
of the Commonwealth Heads of
Government Meeting in April. Building
on the 2015 Commonwealth Trade
Review, this second review presents
new empirical findings, rich insights
and practical recommendations on
how to boost the ‘Commonwealth
advantage’ in trade and investment.
Deepening intra-Commonwealth
trade and investment – and using these
opportunities to empower women
and young entrepreneurs – can help
drive economic growth, create jobs
and increase the prosperity of our
citizens. These factors combine towards
success in achieving the internationally
agreed goals of the 2030 Agenda
for Sustainable Development.
The theme for this year’s
Commonwealth Heads of Government
Meeting is ‘Towards a Common
Future’. This review demonstrates
that economic and governance ties
in the Commonwealth, interwoven
as they are, provide ready and
robust foundation fabric from
which collectively as a family of
nations we can tailor a future that
is fairer, more sustainable, more
prosperous and more secure.
Trade and investment flows among
our members are strong and continue
to grow. Despite the unexpected
contraction in world trade since our 2015
Trade Review, intra-Commonwealth
trade in goods and services, and
productive ‘greenfield’ investment,
is growing fast and projected to
exceed US$1 trillion by 2020.
Increasing use of new digital
technologies, including greater
digitisation, is already transforming
trade-led sustainable development
prospects for many of our poorest
members. When combined with the
impact of many shared inheritances,
including the Common Law that
provides the basis for international
law, there is a Commonwealth
effect and advantage that yields
multiple tangible commercial
benefits for traders and investors.
This publication is the product of
drawing together an impressive range
of inputs and expertise on international
trade policy issues from throughout
the Commonwealth. Our ambition
through collective Commonwealth
action is for our most capacity-
constrained members, namely the
least developed countries, small states
and sub-Saharan African countries,
to share with more economically
developed nations in the prosperity
and other fruits yielded by more open
and inclusive trade and investment.
When the leaders of our member
countries gather in London for the 2018
Commonwealth Heads of Government
Meeting, with representatives of
business and commerce alongside,
we can expect to see significant new
impetus added to driving forward the
many opportunities for trade and
investment analysed in this review. By
seizing these opportunities, we will
collectively be better placed to deepen
and make more of our Commonwealth
advantage for more inclusive prosperity –
building together in ways that are fairer,
more secure and more sustainable
towards our common future.
The Right Hon Patricia Scotland QC
Secretary-General of the Commonwealth

Acknowledgements
Acknowledgements \ vii
The 2018 Commonwealth Trade Review
was prepared by a team comprising
Brendan Vickers (team leader), Jodie
Keane and Kirthika Selvakumar under the
supervision of Teddy Y. Soobramanien,
Acting Head of International Trade
Policy Section, who also contributed
to the drafting of the report. Cyrus
Rustomjee was chief consultant on
the project, reviewing the initial drafts
and helping revise various sections.
The team are grateful for the
support of Paulo Kautoke, Director
of Trade, Oceans and Natural
Resources Directorate at the
Commonwealth Secretariat.
This publication benefited from
substantive background papers
prepared by Sangeeta Khorana and
Inmaculada Martínez-Zarzoso, James
MacGregor and Badri Narayanan.
Jane Kennan, Kirthika Selvakumar and
Richard Itaman undertook extensive
data analysis for this publication.
Valuable comments on a draft
version of the report were received
from experts attending a peer review
meeting in London on 15 February
2018.
The external peer reviewers of this
publication were Mohammad A.
Razzaque and Christopher Stevens.
Comments, contributions and helpful
inputs were also received from Salamat
Ali, Philip De Pass, Steven Fevrier,
Sunday Oghayei and Collin Zhuawu.
This report also benefited from
inputs by colleagues in the
Commonwealth Secretariat’s Office
of Civil and Criminal Justice Reform,
especially Steven Malby, Matthew
Moorhead and Richard Briggs.
The Commonwealth Secretariat is
extremely grateful to UNCTAD for their
sharing of data on e-commerce and
investment in the Commonwealth.
The production of this report was
managed by Victoria Holdsworth
and Christina Woollatt. Rita
Broni and Pauline Campbell,
and especially Shaneez Hassan,
provided excellent administrative
support for the project.
The cover, infographics and charts
were done by Earth Consulting.
Financial support from the
Government of the United Kingdom
is gratefully acknowledged.

Contents
Contents \ ix
Introduction iii
Foreword iv
Acknowledgements vi
List of figures xi
List of tables xii
List of boxes xiii
Acronyms and abbreviations xiv
Overview xvi
Executive summary xviii
Key findings and way forward xx
Part 1: Commonwealth trade and investment trends 2
1.1 Introduction 3
1.2 The state of Commonwealth countries’ trade with the world 4
1.3 The state of intra-Commonwealth trade 10
1.4 Prospects for intra-Commonwealth trade 11
1.5 Trends in intra-Commonwealth investment 14
1.6 Conclusion and way forward 19
Annex 20
Endnotes 21
Part 2: The Commonwealth in multilateral and regional trade 22
2.1 Introduction 25
2.2 The Commonwealth and trade multilateralism 26
2.3 The Commonwealth and resisting protectionism 28
2.4 The Commonwealth and an enabling global trading environment 29
2.5 The future of the multilateral trading system 29
2.6 Commonwealth members in regional trade and integration initiatives 31
2.7 Conclusion and way forward 36
Endnotes 37
Part 3: Harnessing digitisation for Commonwealth trade, investment and prosperity 38
3.1 Introduction 41
3.2 Disruptivetechnologies,trade andjobs 42
x \ Commonwealth Trade Review 2018
3.3 Harnessing digitisation for Commonwealth trade and development 43
3.4 Overcoming technology gaps in the Commonwealth 49
3.5 Closing the gaps: implications for growth and development 52
3.8 Conclusion and way forward 53
Annexes 55
Endnotes 59
Part 4: Deepening the Commonwealth advantage through 21st-century trade governance 60
4.1 Introduction 63
4.2 The Commonwealth advantage and trade costs 65
4.3 Governance, trade and economic performance in the Commonwealth 67
4.4 Governance impacts on Commonwealth trade and investment 69
4.5 Conclusion and way forward 74
Annex 76
Endnotes 78
Summary and conclusions 79
References 81
List of figures \ xi
Listoffigures
Figure 1.1 Relative significance of intra-Commonwealth trade in countries’ total trade, 1994–2018 (%) 4
Figure 1.2 Contribution of various country groups to overall Commonwealth trade, 2005–16 (%) 5
Figure 1.3 Growth in exports of goods and services of individual Commonwealth countries, 2005–08, 2009–12, 2013–16 and 2017–20 (projected) (%) 6
Figure 1.4 Export sophistication within the Commonwealth, 2000, 2010 and 2016 7Figure 1.5 Commonwealth LDC trade in goods and services, 2005–16 9Figure 1.6 Intra-Commonwealth trade in goods and services, 2010–16 (US$ million) 11Figure 1.7 Intra-Commonwealth trade in goods by members as a percentage
of total world trade, 2016 (%) 12Figure 1.8 Country shares of intra-Commonwealth exports (left) and imports (right) 13Figure 1.9 Composition of intra-Commonwealth trade in services 14Figure 1.10 Intra-Commonwealth trade in services by members as a percentage
of total world trade, nearest year (%) 15Figure 1.11 Intra-Commonwealth trade prospects by 2020: the impact of the
global trade slowdown, 2010–20 (US$ billion) 16Figure 1.12 Increasing trend of FDI flows to the Commonwealth, 1991–2017
(US$ million) 16Figure 1.13 Top sources of intra-Commonwealth greenfield investment, 2005
and 2016 (US$ billion) 17Figure 1.14 Intra-Commonwealth investment in Commonwealth LDCs, 2003–16 (%) 19Figure 2.1 Aid for Trade net disbursements to Commonwealth developing countries,
2010–15 (US$ million) 27Figure 3.1 Proportion of the population with access to the internet, Commonwealth
members, by country, 2015 (%) 50Figure 3.2 Speed of access to the internet, Commonwealth members, by country 51

xii \ Commonwealth Trade Review 2018
List of tables
Table 1.1 Share of goods and services exports by Commonwealth region, 2016 (%) 7Table 1.2 Commonwealth countries’ trade with China, 2000 and 2016 (%) 10Table 1.3 Share of merchandise exports and imports of Commonwealth countries
by region, 2016 13Table 1.4 FDI in the Commonwealth, 2015–17 (US$ billion, %) 17Table 1.5 Major sources of intra-Commonwealth investment and job creation 18Table 2.1 Commonwealth trade measures (average) since 2008 28Table 3.1 Summary of key emerging technologies by expected timescale for
implementation 41Table 3.2 Digital technology: estimated benefits to the Indian economy 44Table 3.3 B2C e-commerce sales in Commonwealth countries, 2015 45Table 3.4 IPv6 adoption in Commonwealth members (2017) (% of internet use) 52Table 3.5 Increasing broadband coverage: implications for Commonwealth GDP 52Table 3.6 Projected increase in GDP across the Commonwealth from improved
broadband speed, 2017 (US$ billion) 53Table 4.1 Summary of gravity model results 72
List of boxes \ xiii
List of boxes
Box 1.1 Commonwealth countries’ trade in global value chains 8Box 1.2 LDCs’ services trade 9Box 2.1 Aid for Trade disbursements to Commonwealth small states, LDCs and SSA 27Box 2.2 Mega-regional agreements: game-changers in world trade 30Box 2.3 Brexit, the Commonwealth and trade 32Box 2.4 The new EU sugar regime: a sticky end to a sweet deal for the African,
Caribbean and Pacific states? 34Box 2.5 Australia and New Zealand AfT: promoting inclusive prosperity in the Pacific 35Box 3.1 Examples of digitisation transforming the Commonwealth 42Box 3.2 Technological innovation, automation and jobs 43Box 3.3 Tackling the ‘double digital divide’ confronting women 45Box 3.4 Accessing trade-enabling technologies: a role for the WTO’s Information
Technology Agreement? 47Box 3.5 Commonwealth SSA members as global leaders in fintech 48Box 4.1 Examples of legal systems facilitating intra-Commonwealth trade and
investments 64Box 4.2 Commonwealth Small States Trade Finance Facility 65Box 4.3 Reducing trade costs: lessons from Asia-Pacific? 66Box 4.4 World Governance Indicators 67Box 4.5 Findings from some studies on governance, trade and economic
performance 68Box 4.6 Strengthening pan-Commonwealth governance, law and legal capacity 69Box 4.7 Improving logistics performance: a boon for Commonwealth prosperity 73

xiv \ Commonwealth Trade Review 2018
Acronyms and abbreviations
4IR Fourth Industrial Revolution
ACP African, Caribbean and Pacific
ADB Asian Development Bank
AfT Aid for Trade
AI artificial intelligence
APEC Asia-Pacific Economic Cooperation
AU African Union
B2B business-to-business
B2C business-to-consumer
BaTIS Balance of Trade in Services Statistics
BPO business process outsourcing
CARICOM Caribbean Community
CARIFORUM Caribbean Forum
CBR Correspondent Banking Relation
CETA Comprehensive Economic and Trade Agreement
CFTA Continental Free Trade Agreement
CHOGM Commonwealth Heads of Government Meeting
COMESA Common Market for Eastern and Southern Africa
CSME CARICOM Single Market and Economy
CSSTFF Commonwealth Small States Trade Finance Facility
DDA Doha Development Agenda
DFID UK Department for International Development
DRE distributed renewable energy
DSM Dispute Settlement Mechanism
EAC East African Community
EBA Everything But Arms
EPA Economic Partnership Agreement
ESA Eastern and Southern Africa
EU European Union
FDI foreign direct investment
fintech financial technology
FTA free trade agreement
G20 Group of Twenty

Acronyms and abbreviations \ xv
GATS General Agreement on Trade in Services
GDP gross domestic product
GPT general purpose technology
GVC global value chain
ICT information and communication technology
IIA international investment agreement
IoT Internet of Things
IPR intellectual property right
IPv4/6 Internet Protocol version 4/6
ITA Information Technology Agreement
LDC least developed country
LPI Logistics Performance Index
MRTA mega-regional trade agreement
MSME micro-, small and medium-sized enterprise
NTM non-tariff measure
OCCJR Office of Civil and Criminal Justice Reform
OECD Organisation for Economic Co-operation and Development
ODA official development assistance
PACER Pacific Agreement on Closer Economic Relations
PIC Pacific island country
RTA regional trade agreement
RCEP Regional Comprehensive Economic Partnership
SACU Southern African Customs Union
SADC Southern African Development Community
SAFTA South Asian Free Trade Area
SDG Sustainable Development Goal
SIDS small island developing states
SSA sub-Saharan Africa
SVE small vulnerable economy
TFA Trade Facilitation Agreement
TPP Trans-Pacific Partnership
UN United Nations
VCS voluntary coupled support
WGI World Governance Indicator
WTO World Trade Organization

xvi \ Commonwealth Trade Review 2018
Overview
Fundamental changes are taking place in global trade
with implications for all 53 Commonwealth members.
The technology-driven Fourth Industrial Revolution is
escalating the fragmentation of production processes;
trade in intermediate goods and services is growing; and
cross-border relationships between firms, governments and
other stakeholders are shifting. All of these are contributing
to fundamental – and probably irreversible – changes in the
character and composition of global trade. These changes
present risks, but there may also be new opportunities for
more meaningful participation in world trade, particularly
for the Commonwealth’s developing country members.
The Commonwealth is not a formal trading bloc, yet the
53 Commonwealth members enjoy a formidable trade
advantage without any formal collaboration. Historical ties,
familiar administrative and legal systems, the use of largely
one language, English, as the means of communicating
with foreign partners, and large and dynamic diasporas
have contributed to strong trade relationships among its
members. The 2015 Commonwealth Trade Review found
that Commonwealth countries, on average, tend to trade
around 20 per cent more and generate 10 per cent more
investment with each other than with non-member countries.
The 2018 Commonwealth Trade Review explores how
Commonwealth members, individually and collectively, can
strengthen this Commonwealth advantage in two ways:
by harnessing new technologies, especially digitisation,
to trigger new trade and investment opportunities; and
by strengthening certain aspects of their domestic trade
governance regime to reduce trade costs further.
There has never been a time of faster technological innovation
than today, unleashing new opportunities for trade, investment
and innovation among the 53 Commonwealth members.
Equally, there has never been a time potentially more disruptive
to international trade. Technological transformation is already
helping improve prospects for sustainable development across
many Commonwealth member countries. It is also altering
their competitive advantage by eroding limitations owing to
geographic remoteness and distance, lack of connectivity
and other constraints on their economic performance,
output, growth and employment. Digitisation especially
is enabling transformation and change in all economic
sectors, including finance – from mobile money systems
to advanced financial technology – energy, agriculture, the
oceans economy and tourism, among many others.
At the same time, harnessing and sustaining new
economic opportunities arising from a more connected
Commonwealth requires strengthening the domestic
institutions, rules and frameworks that govern trade: from
goods and services to investment and intellectual property.
There is an enormous historical fabric of institutional and
governance ties that influence intra-Commonwealth
commerce, trade and investment. Leveraging these
linkages and bonds offers an immense comparative
advantage and opportunity for Commonwealth members
to further drive down intra-Commonwealth trade costs
and to expand intra-Commonwealth trade and investment.
Commonwealth members already enjoy an advantage
when it comes to efficient contract enforcement, for
instance, and strengthened regional integration and
improvements in trade facilitation are likely to yield
disproportionately high gains for Commonwealth members.
This publication considers the impact of the changing
global trade landscape on Commonwealth members. It
comprises four parts. Part 1 analyses major trends in global
trade since the 2015 Commonwealth Trade Review and the

Overview \ xvii
performance of Commonwealth and intra-Commonwealth
trade and investment. Given the importance of the Sustainable
Development Goals, building productive capacity and creating
jobs in developing countries, special attention is given to the
role of greenfield investment, or new capital investment, in
intra-Commonwealth investment flows. Part 2 examines the
Commonwealth’s role in promoting trade multilateralism and
limiting trade protectionism, and highlights the deepening
influence of regional economic integration across the
Commonwealth. Part 3 discusses the critical impact of
technology on global trade and highlights Commonwealth
experiences in harnessing new technologies for trade. Part 4
considers the role of trade governance in influencing trade,
investment and the costs of trade in the Commonwealth.

xviii \ Commonwealth Trade Review 2018
Executive summaryHighlights
An unprecedented slowdown in world trade growth
has adversely affected all countries, including
Commonwealth members. The combined total
exports of goods and services of all Commonwealth
members were US$3.1 trillion in 2016, compared
with $3.5 trillion prior to the global downturn.
Trade among Commonwealth members – that is, intra-
Commonwealth exports of goods and services – stood
at US$560 billion in 2016, which is a slight reduction
owing to the effects of the global trade slowdown.
On the positive side, intra-Commonwealth trade as
a proportion of global trade is rising and is now 20 per
cent of Commonwealth countries’ total trade with
the world. This underlines the growing significance of
Commonwealth markets for many member countries.
With world trade growth forecast to rebound in
2017–18, the Commonwealth appears on track to
achieve US$700 billion in intra-Commonwealth
trade in goods and services by 2020, while proactive
policy measures can trigger even greater gains.
In terms of foreign direct investment (FDI) flows within
the Commonwealth, productive investment – also
known as greenfield investment – is increasingly
important; it is also considered to have a more positive
impact on economic development than other types
of FDI flows, such as mergers and acquisitions.
Intra-Commonwealth greenfield investment
comprises one-quarter of global greenfield FDI
flows, and members are investing three times more
in each other, creating more jobs, than the global
average. Intra-Commonwealth greenfield investment
is projected to reach almost US$1 trillion ($870
billion) by 2020, under certain conditions.
Greater digitisation in the Commonwealth can improve the
prospects for trade-led sustainable development in many
member countries, especially if measures are taken to
address the gender disparity in digital access and connectivity.
Universal broadband digitisation could add up to US$1 trillion
to the gross domestic product of the Commonwealth.
Business-to-consumer e-commerce sales in Commonwealth
countries were over USS$350 billion in 2015, representing
3.5 per cent of GDP. With an estimated 144 million online
shoppers – or only 6 per cent of the Commonwealth’s
population – there is tremendous potential to increase
digital trade, but this requires significant improvements
in digitisation, regulation, logistics and infrastructure.
Trade governance arrangements in the Commonwealth
contribute to the Commonwealth advantage in trade and
investment. Contract enforcement is already more efficient
among Commonwealth members, requiring 20 per cent
less time than the world average. Improvements to certain
aspects of trade governance, such as trade facilitation,
could also boost Commonwealth countries’ individual and
collective trade performance. For example, a 10 per cent
reduction in the costs incurred for a good to exit a country
can increase intra-Commonwealth exports by 5 per cent.
Commonwealth members, collectively, are less protectionist
than other countries, having applied almost 5 per cent fewer
harmful trade-restrictive measures since the global crisis.
Regional trade agreements (RTAs) are an anchor for intra-
Commonwealth trade, and improved trade governance
at the regional level and the effective implementation
of RTAs can help boost intra-Commonwealth trade and
investment. Trade between Commonwealth countries
is estimated to be more than three times higher when
they belong to an existing RTA than when they do not.

Executive summary \ xix
Main policy messages
Fragmentation of global production processes, the
increasing proportion of intermediate goods and services
in total trade, and the transformation of the technologies,
institutions and governance frameworks that underpin
world trade are fundamentally transforming the global
trade landscape. A steadily increasing proportion of global
trade is now located in global and regional value chains.
These changes present challenges to Commonwealth
trade competitiveness. But they also offer opportunities,
particularly for Commonwealth small states, least developed
countries (LDCs) and sub-Saharan African (SSA) countries, to
overcome barriers to trade, including distance, concentration of
production and exports, and diseconomies of scale. Addressing
the factors that influence these, better understanding,
adapting to and integrating within the emerging and complex
21st-century trade governance framework, and accessing
the technologies that underpin and drive it are increasingly
important priorities among all Commonwealth members.
The Commonwealth is a longstanding champion of free
trade in a transparent, inclusive, fair and open rules-based
multilateral trading system. This system continues to
play a crucial supportive role for developing countries.
Commonwealth developing countries can take advantage
of several World Trade Organization-led initiatives, including
implementation of the Trade Facilitation Agreement,
especially by leveraging international support, and Aid
for Trade initiatives, to strengthen their institutional,
policy and governance capacities for trade. Many can take
advantage of existing trade preferences, including LDC
duty-free and quota-free exports and services waivers.
Commonwealth countries have achieved wide-ranging
successes in harnessing the new digital and other
technologies that underpin and drive contemporary global
trade. Individually, these are helping transform access
to and economic activity in many sectors crucial to their
sustainable development, including finance – from mobile
money payments to advanced financial technology (fintech)
– renewable energy, agriculture, the oceans economy and
tourism, among many others. Collectively they provide an
opportunity and platform, through concerted Commonwealth
action, to systematically harness technology to grow
Commonwealth trade and investment. But much more is
needed for Commonwealth developing countries to access
these technologies and to close gaps, including addressing
the gender disparities in digital access and connectivity.
Strengthening certain aspects of trade governance can help
Commonwealth members expand exports, increase inward
FDI and significantly reduce trade costs. Achieving this requires
a new strategic approach to Commonwealth engagement
with the institutions, networks and governance structures
that underpin 21st-century trade. Recent simulation exercises
suggest that several factors, including strengthened regional
integration and improvements in customs administration
and broader government effectiveness, are likely to yield
disproportionately high gains for Commonwealth members.
Even without any formal arrangements, proactive initiatives
by Commonwealth member countries can generate new
commercial opportunities. For example, Commonwealth
members could focus on achieving improved trade logistics
and implementing trade facilitation measures; tackling
non-tariff barriers; harnessing new technologies, including
for e-commerce, fintech and transforming trade and
productive capacities; utilising the opportunities to develop
regional supply chains in sectors where Commonwealth
regions have comparative advantages; promoting a gender-
responsive approach to the development of trade policy and
to promote women’s economic empowerment; exploiting
the potential of strong and diverse diasporas to catalyse
innovation and investment and to bridge into new markets;
and making use of the Commonwealth as a platform for
establishing and strengthening contacts between traders
and investors, including micro-, small and medium-sized
enterprises (MSMEs) and young entrepreneurs.
At a co-ordinated pan-Commonwealth level, member
countries can strengthen dialogue and cooperation, and
share country experiences and best practices on issues
of physical, digital, regulatory, business-to-business
and supply-side connectivity, all framed by the need for
inclusive and sustainable trade to contribute towards the
achievement of the Sustainable Development Goals.

xx \ Commonwealth Trade Review 2018
Key findings and way forward
Part 1: Commonwealth trade and investment trends
Almost a decade after the global financial crisis in
2008–09, there are signs that the global economic
recovery is gaining some momentum. The World
Bank projected global gross domestic product (GDP)
growth in 2017 at 2.7 per cent, increasing to 2.9 per
cent by 2018; and the WTO has forecast a modest
rebound in world trade growth in 2017, which is
expected to remain solid at 3.2 per cent in 2018.
Despite the improved prospects for the world economy,
including a more positive growth outlook for the
Eurozone, there is still deep uncertainty about near-term
economic and policy developments. The effects of an
unprecedented global trade slowdown between 2012
and 2015 are also inescapable, with implications for
the pace of growth of Commonwealth countries’ trade
with the world and intra-Commonwealth trade.
Commonwealth countries’ trade with the world
Commonwealth trade performance has closely tracked
changes in the global economic and trade landscape,
with combined total exports of goods and services
of Commonwealth members declining from US$3.5
trillion to $3.1 trillion between 2013 and 2015.
Consistently with a longer-term trend, the Commonwealth’s
share in global exports of goods and services declined
marginally between 2013 and 2015, from 15 per cent to
14.8 per cent. This is owing to the growth of many large
non-Commonwealth developing countries, including
China. However, the average share of intra-Commonwealth
trade in Commonwealth countries’ total world trade
has increased to almost 20 per cent in recent years.
Changing dynamics of Commonwealth trade
There have been several modest but perceptible shifts
in the drivers of Commonwealth trade. Commonwealth
developed economies still account for more than
half of total exports, although their share is declining
over time, while Commonwealth Asian members
now account for 41.1 per cent of the combined total
Commonwealth exports of goods and services in 2016.
Commonwealth developed countries were the largest
exporters of services in 2016, valued at US$498 billion, or
54.5 per cent of total Commonwealth services exports.
However, the relative share of Commonwealth Asian
countries’ services exports has risen significantly in recent
years: from 25 per cent of total Commonwealth services
trade in 2005 to 39.6 per cent ($361.6 billion) in 2016.
The Commonwealth Caribbean members are the
most dependent on services exports. In 2016, all but
two countries – Belize and Guyana – depended on the
services sector for over 70 per cent of their exports.
Commonwealth export sophistication
Export sophistication serves as a catalyst for economic
growth, as countries upscale to the production of
more modern services and manufactured goods,

Key findings and way forward \ xxi
in turn ensuring that higher income accrues from
exports. Productivity also tends to increase, with
countries not only producing and exporting new
goods and services, but also increasing the share
of value added in existing goods and services.
Applying a widely used measure of export sophistication
to Commonwealth countries’ merchandise exports
reveals that Commonwealth members have improved
their export sophistication in recent years. However, the
Commonwealth still lags behind the sophistication of
exports of large developing countries including China
and developed countries such as the USA. This may
be attributable to the fact that most Commonwealth
developing countries are largely exporters of natural
resources and primary goods; and the relatively low level
of technological content embodied in these products.
Commonwealth trade with developing countries
Commonwealth countries’ trade with developing
countries has expanded significantly since 2000. The
proportion of total Commonwealth merchandise
imports from developing countries increased from
31 per cent in 2000 to 50 per cent in 2016.
Among developing countries, the fastest growth in
Commonwealth trade has taken place with China. Between
2000 and 2016, China’s total trade with the Commonwealth
grew 8.4 times from US$33 billion to $277 billion. This is a
remarkable increase, given that Commonwealth trade with the
rest of the world increased by only 1.1 times in the same period.
State of intra-Commonwealth trade
In 2016, intra-Commonwealth trade in goods and services
was approximately US$560 billion, a slight reduction
owing to the effects of the global trade slowdown.
In absolute terms, Asian Commonwealth countries continue
to drive intra-Commonwealth trade, accounting for 52
per cent of the total in 2016. Developing Commonwealth
members now account for 29 per cent of intra-Commonwealth
trade, up from just over one-quarter in 2015.
Travel makes up the largest proportion of intra-
Commonwealth trade in services, followed by transportation
and then other business, which is a catch-all for corporate
services. India has moved into the top five providers
of intra-Commonwealth services trade, surpassing
Canada, along with Australia, Singapore and the UK.
Prospects for intra-Commonwealth trade
Using new data on bilateral services trade, and taking
into consideration the prospects for world trade growth,
new estimates are presented for intra-Commonwealth
trade. Intra-Commonwealth trade is projected to reach
US$700 billion by 2020. The adoption of proactive
and pragmatic policy measures by member countries
can further boost intra-Commonwealth trade.
Commonwealth FDI flows in a global context
Overall, global foreign direct investment (FDI) flows into
the Commonwealth are increasing. In 2017, inflows were
estimated at US$250 billion compared to almost $430 billion
in 2016; the latter boost in FDI was due to three merger
and acquisition megadeals in the UK. The accumulated
FDI stock in the Commonwealth is now over $5 trillion.
The Commonwealth is a net recipient of global FDI
flows. Commonwealth member countries held
about one-fifth of global FDI stock in 2016; and this is
considerably more than their share of global GDP, which
is approximately 14 per cent. However, FDI inflows into
the Commonwealth have been uneven: 10 members
received more than 90 per cent of inflows between
2010 and 2016. The top five recipients were the UK,
Singapore, Canada, Australia and India, in that order.
These five countries accounted for nearly 80 per
cent of total FDI flows into the Commonwealth.
In 2015, some US$3.6 trillion outward FDI stocks were
registered in the Commonwealth and it was estimated
that some 20 per cent of these stocks came from intra-
Commonwealth investments – or around $720 billion.
Trends in productive investment in the Commonwealth
In terms of FDI flows within the Commonwealth, productive
investment – also known as greenfield investment – is
increasingly important. It is also considered to have a more
positive impact on economic development than other
types of FDI flows, such as mergers and acquisitions.
It is therefore significant that intra-Commonwealth
greenfield investment is projected to reach almost US$1
trillion ($870 billion) by 2020, under certain conditions.
Intra-Commonwealth investments have substantially
greater job-creating impacts than investments
attracted to the Commonwealth from other
countries, generating 3.3 times more jobs.

xxii \ Commonwealth Trade Review 2018
In 2017, cumulative global greenfield FDI into Commonwealth
countries was estimated at US$2.7 trillion, generating
7.2 million jobs; by comparison, cumulative intra-
Commonwealth greenfield FDI was estimated at $700
billion, creating 1.4 million jobs through 10,000 projects.
Part 2: The Commonwealth in multilateral and regional trade
For most Commonwealth developing countries, and especially
for small states, least developed countries (LDCs) and sub-
Saharan African (SSA) countries, international trade is a crucial
driver of growth, poverty reduction and employment. If these
countries are to achieve the Sustainable Development Goals
(SDGs), they need an enabling global trading environment that
both supports and enhances their participation in world trade.
The Commonwealth and trade multilateralism
The Commonwealth has always championed free trade
in a transparent, inclusive, fair and open rules-based
multilateral trading system as the foundation for economic
growth and sustainable development. The Commonwealth
has emphasised this commitment through an extensive
programme of trade policy support and technical assistance,
consensus-building and global advocacy. Currently, 49 of the
Commonwealth’s 53 countries are members of the WTO,
with The Bahamas undergoing its accession process.
Despite the challenges in concluding the Doha Development
Agenda negotiations, there have been some important
outcomes for the multilateral trading system; these include
the Trade Facilitation Agreement (TFA), which most
Commonwealth members of the WTO have now ratified,
the broader WTO-led Aid for Trade (AfT) initiative, a work
programme for small vulnerable economies and decisions
in support of the world’s poorest countries, including
duty-free market access and services preferences.
The multilateral trading system plays a crucial role in
ensuring transparency and predictability in world trade,
especially given continuing post-crisis uncertainties
and the rise in protectionist measures since 2008.
The Commonwealth and resisting protectionism
Trade protectionism still remains rife in the world economy,
although G20 countries are now demonstrating greater restraint
against adopting harmful measures. The Commonwealth
continues to play a leading role in building awareness and
understanding of the adverse developmental impacts of
protectionism and the benefits of greater trade openness,
especially to support the world’s poorest nations.
Commonwealth members collectively have been less
protectionist than others. Commonwealth countries, on average,
tend to implement fewer harmful non-tariff measures towards
each other and towards the rest of the world, having applied
almost 5 per cent fewer harmful trade-restrictive measures
since the global crisis. There is now also an increasing incidence
of liberalising measures by Commonwealth member countries.
Poorer countries have been affected by global trade
protectionism. The value of LDC exports could have
been 31 per cent higher if post-crisis protectionism had
been avoided. Removing the remaining trade restrictions
against LDCs could help them move towards the SDG
target of doubling their share of global exports by 2020.
The Commonwealth and an enabling global trading environment
Improving national and regional trade facilitation and logistics
can reduce trade costs and boost intra-Commonwealth trade.
At the end of February 2018, 42 of the 49 Commonwealth
WTO members had ratified the WTO’s TFA, which can
potentially increase global merchandise exports by up to
US$1 trillion per annum. Commonwealth developed countries
– Australia, Canada, New Zealand and the UK – remain
strong advocates and leading donors of AfT as a means of
building supply-side capacity in developing countries.
Many Commonwealth members, including several SSA
countries, have made important strides in simplifying
customs procedures and upgrading infrastructure
and systems to expedite goods trade. More than
half of the Commonwealth members ranked on the
World Bank’s Logistics Performance Index improved
their overall scores between 2014 and 2016.
The future of the multilateral trading system
Notwithstanding important instances of progress, trade
multilateralism remains at a crossroads, facing multiple
challenges, including delays in concluding the WTO’s
Doha Round, the proliferation of bilateral and regional
trade deals and the emergence of several plurilateral
initiatives such as the Environmental Goods Agreement
and the Trade in Services Agreement. While the WTO’s

Key findings and way forward \ xxiii
Dispute Settlement Mechanism (DSM) appears to have
worked, there are concerns about the proliferation of
new cases (especially in new areas, such as renewable
energy) and the capacity to manage these. And, while the
DSM is formally available to all WTO members, accessing
the system is challenging for small states and LDCs,
given their human and financial resource limitations.
As WTO membership has increased to 164 members,
there is an opportunity to take stock of these challenges,
the pressure they place on the system and the ability of
the system to manage these challenges. How to address
new issues at the WTO – from e-commerce and micro-,
small and medium-sized enterprises to the role of trade
in climate change mitigation and adaptation – and the
implications for the most capacity-constrained members
needs better understanding and consideration.
Commonwealth members in regional trade and integration initiatives
Efforts to promote deeper regional integration have
accelerated in some Commonwealth regions. In SSA,
the 55 African Union Member States intend to launch a
Continental Free Trade Agreement this year; the Pacific
countries have concluded the Pacific Agreement on
Closer Economic Relations Plus; and in Asia, there is some
progress on the Regional Comprehensive Economic
Partnership negotiations and practical measures to
improve transport connectivity. Commonwealth members
comprise more than half of the eleven parties to the
Comprehensive and Progressive Agreement for Trans-
Pacific Partnership, which was signed in March. Post-Brexit
bilateral trade deals involving the UK and interested
Commonwealth members are also possible in the future,
which would help boost intra-Commonwealth trade.
Although the 2030 Agenda is silent on the issue, regional
integration can contribute in many ways to achieving the
SDG targets. More effective regional cooperation and
integration can facilitate the free movement of goods,
services, investment and people; enable the competitive
production of exports; and strengthen participation in
and upgrading of regional and global value chains.
RTAs exert a strong effect on intra-Commonwealth
trade, compared to the global average. Trade between
Commonwealth members is more than three times higher
when they belong to an existing regional trade agreement
(RTA), highlighting the importance of effective regional
integration for boosting the Commonwealth advantage.
Part 3: Harnessing digitisation to boost Commonwealth trade, investment and prosperity
Technology has historically served as a critical driver of
globalisation, underpinning the rapid expansion in world
trade and helping transform prospects for sustainable
development across the Commonwealth.
New technologies are altering their competitive advantage,
eroding constraints owing to lack of connectivity, remoteness,
distance and other limitations in accessing global trade
and financial markets. However, securing the gains from
rapidly evolving new technologies while navigating their
potential disruptive effects, including pressure on jobs,
trade and economic activity, presents challenges for all
Commonwealth member countries, as well as other countries.
Disruptive technologies, trade and jobs
Digitisation is enabling transformation and change in all
economic sectors. Global market penetration of the core
technologies underpinning digitisation – mobile telephony,
internet usage and cloud computing – is occurring at
unprecedented speed. The costs of these technologies are also
declining rapidly at an estimated rate of over 10 per cent annually.
Mobile phones are now owned or used by two-thirds of
the global population, or almost 5 billion people, with many
countries in Africa ‘leapfrogging’ landline telephony to mobile
connectivity with enormous developmental gains. Internet
access has also accelerated rapidly. The number of internet
users has more than tripled in a decade – from 1 billion in 2005
to an estimated 3.2 billion at the end of 2015. Yet several
billion citizens in the world’s poorest and most vulnerable
developing countries have no access to the internet; and
despite the potential opportunities unleashed by new
technologies, there remains a significant gender disparity
between women and men in mobile phone usage and access,
digital connectivity and participation in the digital economy.
Technological innovation will be key to tackling unemployment,
especially among young people, across the Commonwealth.
xxiv \ Commonwealth Trade Review 2018
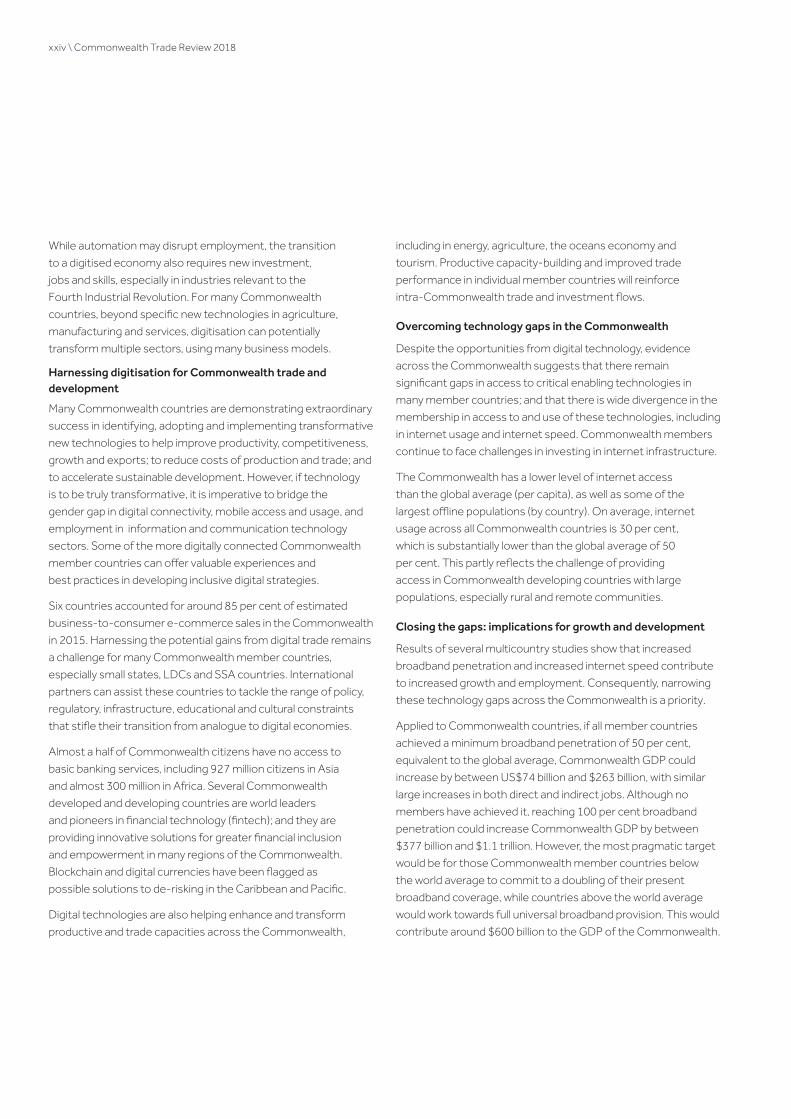
While automation may disrupt employment, the transition
to a digitised economy also requires new investment,
jobs and skills, especially in industries relevant to the
Fourth Industrial Revolution. For many Commonwealth
countries, beyond specific new technologies in agriculture,
manufacturing and services, digitisation can potentially
transform multiple sectors, using many business models.
Harnessing digitisation for Commonwealth trade and development
Many Commonwealth countries are demonstrating extraordinary
success in identifying, adopting and implementing transformative
new technologies to help improve productivity, competitiveness,
growth and exports; to reduce costs of production and trade; and
to accelerate sustainable development. However, if technology
is to be truly transformative, it is imperative to bridge the
gender gap in digital connectivity, mobile access and usage, and
employment in information and communication technology
sectors. Some of the more digitally connected Commonwealth
member countries can offer valuable experiences and
best practices in developing inclusive digital strategies.
Six countries accounted for around 85 per cent of estimated
business-to-consumer e-commerce sales in the Commonwealth
in 2015. Harnessing the potential gains from digital trade remains
a challenge for many Commonwealth member countries,
especially small states, LDCs and SSA countries. International
partners can assist these countries to tackle the range of policy,
regulatory, infrastructure, educational and cultural constraints
that stifle their transition from analogue to digital economies.
Almost a half of Commonwealth citizens have no access to
basic banking services, including 927 million citizens in Asia
and almost 300 million in Africa. Several Commonwealth
developed and developing countries are world leaders
and pioneers in financial technology (fintech); and they are
providing innovative solutions for greater financial inclusion
and empowerment in many regions of the Commonwealth.
Blockchain and digital currencies have been flagged as
possible solutions to de-risking in the Caribbean and Pacific.
Digital technologies are also helping enhance and transform
productive and trade capacities across the Commonwealth,
including in energy, agriculture, the oceans economy and
tourism. Productive capacity-building and improved trade
performance in individual member countries will reinforce
intra-Commonwealth trade and investment flows.
Overcoming technology gaps in the Commonwealth
Despite the opportunities from digital technology, evidence
across the Commonwealth suggests that there remain
significant gaps in access to critical enabling technologies in
many member countries; and that there is wide divergence in the
membership in access to and use of these technologies, including
in internet usage and internet speed. Commonwealth members
continue to face challenges in investing in internet infrastructure.
The Commonwealth has a lower level of internet access
than the global average (per capita), as well as some of the
largest offline populations (by country). On average, internet
usage across all Commonwealth countries is 30 per cent,
which is substantially lower than the global average of 50
per cent. This partly reflects the challenge of providing
access in Commonwealth developing countries with large
populations, especially rural and remote communities.
Closing the gaps: implications for growth and development
Results of several multicountry studies show that increased
broadband penetration and increased internet speed contribute
to increased growth and employment. Consequently, narrowing
these technology gaps across the Commonwealth is a priority.
Applied to Commonwealth countries, if all member countries
achieved a minimum broadband penetration of 50 per cent,
equivalent to the global average, Commonwealth GDP could
increase by between US$74 billion and $263 billion, with similar
large increases in both direct and indirect jobs. Although no
members have achieved it, reaching 100 per cent broadband
penetration could increase Commonwealth GDP by between
$377 billion and $1.1 trillion. However, the most pragmatic target
would be for those Commonwealth member countries below
the world average to commit to a doubling of their present
broadband coverage, while countries above the world average
would work towards full universal broadband provision. This would
contribute around $600 billion to the GDP of the Commonwealth.

Key findings and way forward \ xxv
Part 4: Deepening the Commonwealth advantage through 21st-century trade governance
There is an enormous historical fabric of institutional and
governance ties that influence intra-Commonwealth
commerce, trade and investment. Strengthening certain
aspects of trade governance – namely the institutional,
policy, regulatory and other factors that influence the
costs of trade, the efficiency of institutions that support
trade and the effectiveness of the inter-relations among
stakeholders participating in trade – can help further
drive down intra-Commonwealth trade costs and
expand intra-Commonwealth trade and investment.
The Commonwealth advantage and trade costs
While Commonwealth countries already enjoy a trade cost
advantage, there are many further avenues to streamline
trade governance and procedures, which would unleash
enormous economic opportunities and could further
strengthen this advantage. For example, on average, small
states’ trade costs are estimated to be at least 50 per cent
higher than those for developing countries as a whole.
Multiple policy initiatives can be taken to reduce
trade costs. They include, among others, improving
logistics performance; improving the efficiency of
land, air and sea transport; streamlining and simplifying
international transit regimes and behind-the-border
regulations; and strengthening trade facilitation.
Commonwealth member countries also have the benefit of a
wide array of tools, toolkits and model laws to help strengthen
the institutional and governance ties that connect membership
and help facilitate intra-Commonwealth trade and investment.
Governance impacts on Commonwealth trade and investment
A model is used to estimate if an improvement in trade-
related governance indicators leads to higher exports
from and between Commonwealth member countries.
Overall, Commonwealth countries’ exports are positively
correlated with FDI flows, intellectual property rights
and trade facilitation variables, while efficient contract
enforcement is important for intra-Commonwealth trade.
The model also presents evidence of the export-enhancing
impact of RTA membership for Commonwealth members.
Trade between Commonwealth members is more than
three times higher when they belong to an existing
RTA, highlighting the importance of effective regional
integration for boosting the Commonwealth advantage.

Part 1: Commonwealth trade and investment trends

The Commonwealth is not a trading bloc, yet there exist tremendous opportunities to boost trade and investment between members. Afteranunprecedentedslowdowninglobaltradegrowthaffectingall economies, there are signs that both world trade and intra-Commonwealth trade are recovering. By adopting proactive policy measures, Commonwealth countries can further expand intra-Commonwealth trade and investment. Part 1 analyses the recent performance of Commonwealth world trade and trends in intra-Commonwealthflowsofgoods,servicesandinvestment.
Therearefivemajorfindingswithpolicyimplicationsfor Commonwealth member countries:
• Intra-Commonwealth exports of goods and services stood at US$560 billion in 2016, with a rising share of intra-Commonwealth trade in members’ total world trade of approximately 20 per cent.
• Althoughtheglobaltradeslowdownadverselyaffectedintra-Commonwealth trade, the Commonwealth is on track to achieve US$700 billion in trade by 2020, although proactive policy measures could trigger even greater gains.
• Globalforeigndirectinvestment(FDI)flowstotheCommonwealthingeneral are on an increasing trend, with FDI stock now exceeding US$5 trillion.
• Intra-Commonwealthproductiveinvestment(‘greenfieldinvestment’)isprojectedtoreachalmostUS$1trillionby2020,undercertainconditions.
• In2017,cumulativeintra-CommonwealthgreenfieldFDIwasestimatedatUS$700billion,creating1.4millionjobsthrough10,000projects.

Total intra-Commonwealthgreenfield investment
US$700 billion
SNAPSHOT OF CUMULATIVE INTRA-COMMONWEALTH GREENFIELD INVESTMENT, 2003–2016
After the massive slump in world trade growth affecting most countries, intra-Commonwealth trade and greenfield investment is on track to exceed
US$1 trillionby 2020...
Source: Data from fDi Markets, Financial Times
Top source country
U N I T E D K I N G D O MTop destination country
I N D I ATotal jobs createdTotal number of projects
10,000 1.4 million
while proactive policy measures can trigger even greater gains

1.1 Introduction
Almost a decade after the global financial crisis in 2008–09,
there are signs that the global economic recovery is
gaining some momentum. The World Bank projected
global gross domestic product (GDP) growth in 2017 at 2.7 per
cent, increasing to 2.9 per cent by 2018 (World Bank, 2017b);
and the World Trade Organization (WTO) has forecast a
modest rebound in world trade growth in 2017, which is
expected to remain solid at 3.2 per cent in 2018 (WTO, 2018).
The effects of an unprecedented global trade slowdown
between 2012 and 2015 are, however, inescapable, with
implications for the pace of growth of Commonwealth trade
with the world and intra-Commonwealth trade. World GDP
growth in 2016 recorded its lowest level since the crisis. The
pace of growth in world trade has also been sluggish, with
world trade volumes growing a mere 1.4 per cent on average
between 2010 and 2015. The developing world continues to
power global economic growth; and this trend has accelerated
especially in the post-crisis era. However, despite the improved
prospects for the world economy, including a more positive
growth outlook for the Eurozone, there is still deep uncertainty
about near-term economic and policy developments. Since
the global crisis, there has also been a progressive weakening
in the hitherto longstanding relationship between trade
and GDP, making the prognosis for recovery uncertain.
Part 1 of the Commonwealth Trade Review 2018
analyses the recent performance of Commonwealth
world trade and trends in intra-Commonwealth
flows of goods, services and investment.

4 \ Commonwealth Trade Review 2018
1.2 The state of Commonwealth countries’ trade with the world
1.2.1 Volumes and trends
Despite historical trends, both global
economic growth and global trade growth
have decelerated in recent years. The
pace of global trade slowed substantially
between 2015 and 2016, with growth in
merchandise trade volumes declining
from 2.8 per cent to 1.6 per cent. This
marked the third consecutive year
in which trade volumes remained
below 3 per cent (WTO, 2017a).
The Commonwealth’s trade
performance has closely tracked these
changes in the world economy. The combined total exports of goods and services of Commonwealth countries rebounded from the global financial crisis of 2008–09 and grew significantly between 2010 and 2014 before being hit by the global trade slowdown that occurred in 2012–15.
The global trade slowdown, coupled
with a reduction in the US dollar
value of international trade flows,1
has affected the performance of all
countries in the world, including the
Commonwealth. Because of the global
trade slowdown, the value of total
Commonwealth trade declined by
US$200 billion in terms of the average
annual value 2014–16 compared with
2011–13. This means the combined total exports of goods and services of all Commonwealth members was $3.1 trillion in 2016, compared with $3.5 trillion prior to the global slowdown.
The Commonwealth’s share of global exports of goods and services declined marginally between 2013 and 2015, from 15 per cent to 14.8 per cent. This is consistent with a
longer-term trend, which has seen
the Commonwealth’s share of world
exports consistently, although
marginally, decline since 2005.
The Commonwealth’s share of
global trade is declining because
of the growth of many large non-
Commonwealth developing countries,
including China. The evidence
suggests that some Commonwealth
members will continue to face
challenges in maintaining their
global competitiveness. Within this
context, closer scrutiny of intra-
Commonwealth trade is required.
This is because the average share
of intra-Commonwealth trade in
Commonwealth countries’ total world
trade has increased to almost 20 per
cent in recent years (Figure 1.1).
1.2.2 Changing dynamics of Commonwealth trade
In tandem with changes in the
size and relative proportion of the
Commonwealth’s trade with the
world, there have been several
modest but perceptible shifts in
the drivers of Commonwealth
trade since 2005 (Figure 1.2).
Commonwealth developed economies still account for more than half of total exports, although their share is declining over time. The UK
is the biggest exporter of goods and
services; its combined exports were
US$734 billion in 2016, representing
a quarter of all Commonwealth
exports. The Commonwealth’s second
largest exporter, Canada, exported
$474 billion in 2016, comprising
16 per cent of Commonwealth exports.
Commonwealth developed countries’
share of total Commonwealth
exports has declined, particularly
between 2005, when their share
20%
19%
18%
17%
16%
15%
14%
13%
12%
11%
10%1994 1996 1998 2000 2002 2004 2006 2008 2010 2012 2014 2016
Share of Commonwealth in global trade
Share of intra-Commonwealth in Commonwealth total trade
S o u rce : Co m m o nw e a l t h S e c re t a r i at (c a l c u l ate d f ro m U N CTA D St at d at a )
F I G U R E 1 . 1R E L AT I V E S I G N I F I CA N C E O F I N T RA- CO M M O N W E A LT H T RA D E I N CO U N T R I ES ’ TOTA L T RA D E , 1 9 9 4 – 2 0 1 8 ( % )

Part 1: Commonwealth trade and investment trends \ 5
was 59.3 per cent, and 2010 (51.4
per cent), and has subsequently
remained just above half the total
of Commonwealth exports.
Commonwealth Asian members – Bangladesh, Brunei Darussalam, India, Malaysia, Pakistan, Singapore and Sri Lanka – accounted for 41.1 per cent of the combined total Commonwealth exports of goods and services in 2016. This
represents a significant increase
from 31.4 per cent in 2005. India,
Singapore and Malaysia are the
dominant contributors, accounting for
38 per cent of total Commonwealth
exports and 93 per cent of
Commonwealth Asian exports.
Among the Commonwealth’s members in sub-Saharan Africa (SSA), South Africa and Nigeria exported 62 per cent of goods and services, or 4 per cent of total Commonwealth exports, in 2016. However, the share of
these two countries has progressively
declined over time, from 76 per cent
of Commonwealth SSA exports and
6 per cent of total Commonwealth
exports, respectively, in 2005.
Other SSA members have increased
their regional share over the same period.
This includes Ghana, which more than
trebled its share of the region’s exports,
from 2.4 per cent (2005) to 8.1 per cent
in 2016; Tanzania, whose share more
than doubled, from 1.8 per cent to 4.9
per cent; and Kenya, whose regional
share increased from 3.3 per cent to
5 per cent between 2005 and 2016.
Commonwealth SSA countries,
particularly Nigeria and South Africa,
are highly dependent on merchandise
exports, which comprised 90 per
cent and 84 per cent, respectively,
of their export baskets in 2016.
Merchandise exports also comprised
over 90 per cent of the total for
Lesotho, Malawi and Swaziland.
Commonwealth developed countries were the largest exporters of services in 2016, valued at US$498 billion, or 54.5 per cent of total Commonwealth services exports. However, the relative
share of Commonwealth Asian countries’
services exports has risen significantly
in recent years: from 25 per cent of total
Commonwealth services trade in 2005
to 39.6 per cent ($361.6 billion) in 2016.
The largest Commonwealth exporters
of services in 2016 were the UK ($327.1
billion, or 45 per cent of its total exports),
India ($161.8 billion, or 38 per cent of its
total exports) and Singapore ($149.6
billion, or 29 per cent of total exports).
SSA members exported just $41 billion
in services, contributing 4.5 per cent of
total Commonwealth services exports.
The Commonwealth Caribbean members are the most dependent on services exports. In 2016, all but
two countries – Belize and Guyana –
depended on the services sector
for over 70 per cent of their exports.
Commonwealth Pacific members have
similarly high proportions, with the
exception of Papua New Guinea, whose
exports in 2016 comprised almost
entirely merchandise trade. For four
countries, services exports exceeded
70 per cent of total exports: Tuvalu
(94 per cent), Vanuatu (88 per cent),
F I G U R E 1 . 2CO N T R I B U T I O N O F V A R I O U S CO U N T RY G RO U P S TO O V E RA L L CO M M O N W E A LT H T RA D E , 2 0 0 5 – 1 6 ( % )
70%
60%
50%
40%
30%
20%
10%
0%
2005 2006 2007 2008 2009 2010 2011 2012 2013 2014 2015 2016
Developed
Developing
Asia
Africa
Caribbean
Pacific islands
N o te : D e r i ve d f ro m i n d i v i d u a l - co u n t r y d at a t h at a re i n m a ny c as e s U N CTA D e s t i m ate s. Th i s i s t h e c as e fo r a l m o s t a l l co u n t r i e s fo r 2 0 1 6 .S o u rce : Co m m o nw e a l t h S e c re t a r i at (c a l c u l ate d f ro m U N CTA D St at d at a )

6 \ Commonwealth Trade Review 2018
Tonga (78 per cent) and Samoa (74
per cent). Figure 1.3 presents growth
in exports of goods and services for
individual Commonwealth countries.
Overwhelmingly, it is the developed
economies that account for most
of the Commonwealth’ s trade in
services, followed by Asia, as shown
by Table 1.1. Services exports have
been stronger and more resilient, with
an observed rebound since the global
trade slowdown. In comparison with
the structure of world trade, where
services exports constituted 23.6 per
cent of global exports in 2016, the
Commonwealth has a substantially
higher orientation towards services
trade, at around 30 per cent.
Small states, which constitute almost two-thirds of the Commonwealth’s membership, have a steadily declining share of global trade. Small states are
among the most open economies in
the world, and their average export-to-
GDP ratio remains high at 50 per cent,
whereas the global average is around 30
per cent.2 Small states depend crucially
on international trade for growth,
poverty reduction and employment.
Yet their relative trade openness has
made them particularly vulnerable to
trade and other shocks. Their trade
costs are estimated to be on average
at least 50 per cent higher than those
for developing countries as a whole
(Razzaque and Keane, 2015). Their
competitiveness has been affected
by disproportionately large preference
erosion owing to multilateral and regional
trade liberalisation initiatives, particularly
since these countries typically have
highly concentrated exports.
Commonwealth Caribbean small
states’ share of global trade in goods
and services declined from 0.5 per
30
20
10
0
-10
Sw
azila
ndG
uyan
aTo
nga
Bru
nei D
arus
sala
mN
iger
iaS
t Vin
cent
and
the
Gre
nadi
nes
St K
itts
and
Nev
isG
rena
daD
om
inic
aC
anad
aS
eych
elle
sM
alay
sia
Sai
nt L
ucia
Sri
Lan
kaN
ew Z
eala
ndTa
nzan
iaP
apua
New
Gui
nea
Cyp
rus
Cam
ero
on
Ant
igua
and
Bar
bud
aA
ustr
alia
The
Gam
bia
Jam
aica
Mau
riti
usU
nite
d K
ingd
om
Moz
amb
ique
Be
lize
Zam
bia
The
Bah
amas
So
uth
Afr
ica
Pak
ista
nB
arba
dos
Gha
naB
ots
wan
aK
enya
Sin
gap
ore
Nam
ibia
So
lom
on
Isla
nds
Kir
ibat
iR
wan
da
Ban
glad
esh
Mal
awi
Mal
taIn
dia
Uga
nda
Leso
tho
Trin
idad
and
To
bago
Average 2009-12Average 2005-08 Average 2013-16 Average 2017-20 (estimated)
N o te : Th e s e d at a a re fo r p e rce n t c h a n g e i n vo l u m e o f e x p o r t s o f g o o d s a n d s e r v i ce s. S i e r ra Le o n e i s n o t i n c l u d e d ow i n g to e x t re m e l y h i g h va r i at i o n s i n g row t h rate s. I n fo r m at i o n i s n o t ava i l a b l e fo r Fi j i , N a u r u , S a m o a , Tu va l u a n d Va n u at u .S o u rce : Co m m o nw e a l t h S e c re t a r i at (c a l c u l ate d f ro m I M F Wo r l d Eco n o m i c O u t l o o k d at a O c to b e r 2 0 1 7 )
F I G U R E 1 . 3G RO W T H I N E X P O RTS O F G O O D S A N D S E R V I C ES O F I N D I V I D UA L CO M M O N W E A LT H CO U N T R I ES, 2 0 0 5 – 0 8 , 2 0 0 9 – 1 2 , 2 0 1 3 – 1 6 A N D 2 0 1 7 – 2 0 ( P ROJ ECT E D ) ( % )

Part 1: Commonwealth trade and investment trends \ 7
cent in 1980 to 0.18 per cent in 2005
and has declined further to around
0.1 per cent in recent years. The share
of Pacific small states’ total exports
has been below 0.1 per cent of global
exports since 1980, and in a narrow
band of between 0.4 per cent and 0.6
per cent of global exports since 2005.
1.2.3 Commonwealth export sophistication
Export sophistication can be a
catalyst for economic growth, as
countries upscale to produce more
modern services and manufactured
goods, which ensure that higher
income accrues from exports.
However, export sophistication
requires a conducive macroeconomic
policy environment that supports
human capital development,
among other determining factors
(see Anand et al., 2012).
Measures of export sophistication
seek to identify and rank the implied
productivity of a country’s exports,
by broadly capturing the collective
factors that determine a country’s
export basket. A quantitative index
of export sophistication (abbreviated
to EXPY), developed by Hausmann,
Hwang and Rodrik (2007), ranks
the sophistication of traded goods
based on the average income of the
basket of exports produced by each
country. It therefore measures relative
productivity by assuming that higher
average incomes generated reflect a
greater sophistication of exports.3
Applying this measure to
Commonwealth countries’ merchandise
exports reveals that Commonwealth
members have improved their export
sophistication in recent years, although
the absolute value is below that of
other large developing countries
including China and developed countries
such as the USA (Figure 1.4). The
focus of the export sophistication
approach is on the income generated
by trade, with an assumption
that knowledge and technology
spillovers are embedded within the
more sophisticated products.
lg (E
XPY
)
Commonwealth India China USA9.2
9.3
9.4
9.5
9.6
9.8
9.9
10
10.1
9.7
2000 2010 2016
S o u rce : Co m m o nw e a l t h S e c re t a r i at (c a l c u l at i o n s u s i n g d at a f ro m W I TS)
F I G U R E 1 . 4E X P O RT S O P H I ST I CAT I O N W I T H I N T H E CO M M O N W E A LT H , 2 0 0 0 , 2 0 1 0 A N D 2 0 1 6
TA B L E 1 . 1S H A R E O F G O O DS A N D S E R V I C ES E X P O RTS B Y CO M M O N W E A LT H R EG I O N , 2 0 1 6 ( % )
Region
Percentage US$ million
Goods Services Goods Services
Commonwealth total 70 30 2,091,018 916,034
Developed 67 33 1,031,020 498,112
Africa 80 20 170,226 41,528
Asia 70 30 865,911 364,439
Caribbean 59 41 13,991 9,917
Pacific 83 17 9,870 2,037
Note: Six countries have no 2016 data (Cameroon, Guyana, Kiribati, Nauru, Sierra Leone, Trinidad and Tobago).
Source: Commonwealth Secretariat (calculated from UNCTADStat data)

8 \ Commonwealth Trade Review 2018
For many Commonwealth developing
countries, low levels of export
sophistication may be attributable to
the fact that most Commonwealth
developing countries are largely exporters
of natural resources and primary goods;
and the relatively low level of technological
content embodied in these products.
However, in view of recent trends in
Commonwealth export sophistication,
which can also be indicative of
export diversification processes, a
deeper appreciation of 21st-century
trade, typically organised within
global value chains (GVCs) and the
variables that influence productive
engagement, is required (Box 1.1).
The intensification of GVC
mechanisms has meant that products
are increasingly being produced
through complex cross-border
production networks, which has
redefined countries’ comparative
advantage in terms of trade in tasks
rather than in entire products (WTO,
2014). There are opportunities
for Commonwealth members to
expand their trade and value added
by taking advantage of existing
trade fragmentation processes, and
strategic initiatives to benefit from
future fragmentation processes.
By participating in international
production networks, countries
that have hitherto been unable to
do so can also gain access to new
technologies and new sources of
foreign direct investment (FDI).
In relation to future fragmentation
processes, the major shifts anticipated
within global trade are increasingly
within the services sectors. Several
interlinked factors are contributing to
the rising influence of services in world
trade; these include the transition from
analogue to digital economies, including
greater digitisation and digital trade,
which largely comprises data flows (Part
3); the growing intensity of services trade
within economies (or ‘servicification’);
an increase in the share of trade in
intermediate goods and services within
global trade; and the complementarity
of trade and investment. The rise
of GVCs has demonstrated that
goods trade and services trade
are deeply interconnected.
Recent advances in the measurement
of trade in services using the same
approach as used to measure GDP –
B O X 1 .1
C O M M O N W E A LT H C O U N T R I E S ’ T R A D E I N G LO B A L VA L U E C H A I N S
GVCs are not a new phenomenon, but they have increasingly been used to describe and explain trade. A value chain is defined as the full range of activities that are required to bring a product or service from conception, through the different phases of production (involving a combination of physical transformation and the input of various producer services), delivery to final consumers and final disposal after use.
An increasing proportion of global trade is conducted through GVCs, which are increasingly coordinated by large international firms with operations that span multiple jurisdictions. Often these production networks have a strong regional dimension. The spread of these production networks can offer new trade opportunities (Keane and Baimbill-Johnson, 2017).
A gravity model was used to explore the influence of variables on Commonwealth members’ current trade in GVCs, as indicated by trade in parts and components within dominant subsectors, compared with the global average. The findings of the gravity model are contained in the annex to this chapter and include the following:
• Distance exerts an even greater penalty on Commonwealth GVC exports than the global average. This means there are major gains to be reaped by enhancing connectivity and reducing trade costs for Commonwealth member countries.
• Connectivity improvements induced by improvements in international telecommunication have the potential to increase Commonwealth trade in GVCs by almost four times the global average.
• There are major gains from improvements in logistics performance indices in destination, rather than origin, markets for Commonwealth members.
The significance of these variables for Commonwealth trade and investment flows are further explored in Parts 3 (technology) and 4 (governance).
Source: Adapted from Sturgeon et al. (2017) and Farole (2017)

Part 1: Commonwealth trade and investment trends \ 9
and hence moving away from the
uncomfortable juxtaposition of gross
numbers for trade and value-added
estimates of GDP (Low, 2016) – now
allow much clearer estimation of the
relative contribution of services to
overall trade. Together with accelerating
recognition of the untapped advantages
from trade in services for growth, trade
and investment, and the proliferation of
new opportunities to develop services
exports to support existing and future
GVC fragmentation processes, these
factors are all rapidly transforming
appreciation of the contribution
made to total trade by services.
However, despite these advancements,
data limitations and capacity constraints
severely limit opportunities for
Commonwealth developing countries
and small states to leverage emerging
opportunities to accelerate trade
in services. Data limitations prevail
across all the modes of supply included
in the General Agreement on Trade
in Services (GATS), especially Mode
1 (cross-border trade, particularly
digital trade) and Mode 3 (commercial
presence), presenting particularly
acute limitations for African countries
in disaggregating data at sectoral level.
Least developed countries (LDCs),
which currently comprise 14 of the
Commonwealth’s 52 member countries,
also face particular challenges (Box 1.2).
B O X 1 . 2
L D C S ’ S E R V I C E S T R A D E
Approximately one-fifth of Commonwealth members are LDCs. Because of this, the Commonwealth Secretariat is a partner of the LDC IV Monitor. This group comprises eight academic institutions and think-tanks. It monitors the progress of the LDCs against the commitments made by the international community, as well as by LDCs themselves, under the Istanbul Programme of Action.
In the LDC IV Monitor report Achieving the Istanbul Programme of Action by 2020: Tracking Progress, Accelerating Transformations, analysis of recent export performance suggests the services export basket of LDCs has become more concentrated over time. While travel (tourism) is the main source of services revenue and registers a net surplus, Mode 4 (presence of natural persons) is an important source of net exports but cannot be satisfactorily measured. The value of LDCs’ participation in royalties and licence fees remains negligible and in some cases has declined. This may be a reason for concern, since many island LDCs often rely on foreign fishing vessels. ‘Other commercial services’ (e.g. communication, construction) provided by the LDCs have progressively shrunk (WTO, 2015). Overall, the LDCs’ services trade deficit has increased in recent years.
The available evidence suggests increasing specialisation within services sectors at low levels of income. As emphasised by Rodrik (2015), the profound implications of these trends for the achievement of structural economic transformation remain underexplored within the literature. In addition, there is no historical precedent. Although this pattern is now becoming more apparent among LDCs, it has been the case for some Commonwealth small states for several decades.4
Source: LDC IV Monitor 2016
0
20,000
40,000
60,000
80,000
100,000
120,000
2005 2006 2007 2008 2009 2010 2011 2012 2013 2014 2015 2016
Imports Exports
S o u rce : Co m m o nw e a l t h S e c re t a r i at (c a l c u l ate d f ro m U N CTA D St at G o o d s a n d S e r v i ce s ( B P M 6 ) )
F I G U R E 1 . 5CO M M O N W E A LT H L D C T RA D E I N G O O DS A N D S E R V I C ES, 2 0 0 5 – 1 6 , U S $ M I L L I O N

10 \ Commonwealth Trade Review 2018
1.2.4 Commonwealth trade with developing countries
South–South trade involving Commonwealth members continues to grow. Commonwealth countries’
merchandise trade with developing
countries has expanded significantly
since 2000. The share of total
Commonwealth merchandise imports
from developing countries grew
from 31 per cent of total imports
in 2000 to 50 per cent in 2016.
Among developing countries, the fastest growth in Commonwealth trade has taken place with China.
Between 2000 and 2016, China’s total
trade with the Commonwealth grew
8.4 times from US$33 billion to $277
billion. This is a remarkable increase,
given that Commonwealth trade
with the rest of the world increased
only 1.1 times in the same period.
Between 2000 and 2016, Commonwealth
Asian countries’ imports from China
increased from 4.8 per cent to 17.6 per
cent of total imports, and exports to China
increased from 3.2 per cent to 9.2 per cent
of total exports. Similar rapid increases
in Commonwealth trade with China
have occurred among Commonwealth
members in SSA, the Caribbean and the
Pacific (Table 1.2). However, only Pacific
members appear to have taken greater
advantage of growing trade relations
with China, by expanding both imports
and exports, assisted by these countries’
much more favourable geographical
position in relation to emergent
Asian countries, including China.
In 2016, the largest Commonwealth
exporters to China by volume
comprised Australia, Singapore, the
UK, India, Canada and Malaysia. By
value, India’s total imports from China,
aggregating US$62 billion, represented
the largest among Commonwealth
countries. Australia ranked as the
largest Commonwealth exporter to
China, with exports aggregating $60
billion. Singapore and Malaysia also
recorded large exports to China, of $42
billion and $24 billion, respectively.
Australia is the only developed
Commonwealth country whose share
of exports, at 31.6 per cent, exceeds
its share of imports from China, at
23.4 per cent. Among Commonwealth
developing countries, the relative
shares of imports from and exports to
China differ widely. Nigeria, for example,
imported a substantial 25.1 per cent
of its total imports from China in 2016,
but exported only 2.8 per cent of its
total exports to China. Solomon Islands
imported 24.3 per cent of its total
imports from China while exporting 61.6
per cent of its total exports to China.
1.3 The state of intra-Commonwealth trade
Although world trade growth has
resumed, the global trade slowdown
affected intra-Commonwealth trade
performance between 2013 and 2016.
Intra-Commonwealth trade in goods and services in 2016 was around US$560 billion, a slight reduction from previous years (Figure 1.5).
Intra-Commonwealth trade
accounts for a large proportion of the
merchandise trade of small states
in Southern Africa, especially the
Southern African Customs Union
(SACU) members, the Pacific and
the Caribbean (Figure 1.7). Overall,
Commonwealth trade accounts for
between 6 and 65 per cent of
members’ total trade in goods.
In absolute terms, however, Asian Commonwealth countries continue to drive intra-Commonwealth trade in goods, accounting for 52 per cent of the total in 2016 (Table 1.3). Developing Commonwealth
members now account for 29 per
cent of intra-Commonwealth trade,
up from just over one-quarter in
2015. At the individual country
level, in 2016 Asian Commonwealth
members, including Singapore,
Malaysia and India, recorded
the largest shares of intra-
Commonwealth exports, comprising
19.4 per cent, 17.7 per cent and
14.2 per cent, respectively.
TA B L E 1 . 2CO M M O N W E A LT H CO U N T R I ES ’ T RA D E W I T H C H I N A , 2 0 0 0 A N D 2 0 1 6 ( % )
Commonwealth region
Imports from China (% of total imports)
Exports to China (% of total exports)
2000 2016 2000 2016
Developed 4.2 12.6 1.3 9.8
Developing 4.5 17.4 2.8 8.8
Africa 3.8 18.1 1.2 6.9
Asia 4.8 17.6 3.2 9.2
Caribbean 1.0 5.9 0.1 1.0
Pacific 1.8 12.4 6.5 16.4
Commonwealth total 4.3 14.9 1.9 9.3
Source: Commonwealth Secretariat (calculated using UNCTADStat data)

Part 1: Commonwealth trade and investment trends \ 11
Australia and the UK also contributed 10
per cent and 9.6 per cent of total intra-
Commonwealth exports (Figure 1.8).
South Africa’s intra-Commonwealth
export share of 7.3 per cent is the largest
from an SSA member country. The UK,
India and Singapore constitute by far
the largest importers from within the
Commonwealth. A large proportion
of imports into Australia, Malaysia
and Canada are also undertaken
on an intra-Commonwealth basis.
SSA Commonwealth members
have maintained their share of
intra-Commonwealth trade at
around 16 per cent in recent years.
Similarly, the Caribbean and Pacific
countries have also maintained their
shares at around 1 per cent each.
In relation to the composition of
intra-Commonwealth services trade,
travel comprises the largest share of
intra-Commonwealth trade in services,
followed by transportation and then
other business, which is a catch-all
for corporate services (Figure 1.9).
In relation to intra-Commonwealth
services exports, expressed as a
percentage of total world trade, the
highest proportions are accounted for
by the Pacific (Figure 1.10). The UK’s
share of intra-Commonwealth services
exports within the categories analysed
(as indicated in Figure 1.6) is around the
same as that of Canada: approximately
11.5 per cent of its total services exports
are destined for Commonwealth
trade partners. Intra-Commonwealth
services trade accounts for between
11 and 50 per cent of total services
exports by member countries.
1.4 Prospects for intra-Commonwealth trade
Since the 2015 Commonwealth Trade
Review, new sources of bilateral services
trade data have become available. The
Organisation for Economic Co-operation
and Development (OECD) and WTO
have developed an experimental data
set on bilateral services trade flows.
Despite certain gaps, this database
appears to be the best possible source
of information. This OECD-WTO BaTIS
data set is used to provide an updated
estimate of intra-Commonwealth
trade in services. Because the new
data set contains information only
up to 2012 a figure for 2016 is derived
based on previous growth rates (while
taking into account the global trade
slowdown between 2012 and 2016).
However, a major challenge is that,
in recent times, particularly during
2015 and 2016, the world economy
has seen an unprecedented decline
in global trade growth. An analysis of
the growth rate of trade in goods and
services from UNCTADStat shows that
Commonwealth global trade declined
considerably. However, it was not only
Commonwealth global trade that
was affected; during 2015 and 2016,
global trade in goods and services
fell by US$3.1 trillion. More than 180
economies experienced an absolute
decline in their exports in 2015, and
116 reported falling exports in 2016.
Given this unprecedented decline
in global trade, it is extremely
challenging to make a medium- to
long-term projection for global
and Commonwealth trade flows.
The current pace of trade recovery
could be more subdued, since
there are concerns about US policy
reversals, trade protectionism
and popular discontent about
globalisation and dubiety of its
benefits in many countries.
To update the Commonwealth
trade projections, a cautious
approach is adopted. The WTO’s
2010 2011 2012 2013 2014 2015 2016
100
200
300
400
500
600
700
Services Goods
S o u rce : Co m m o nw e a l t h S e c re t a r i at (c a l c u l ate d u s i n g U N CTA D St at a n d p ro j e c t i o n s d e r i ve d f ro m O EC D -W TO B a T I S d at a )
F I G U R E 1 . 6I N T RA- CO M M O N W E A LT H T RA D E I N G O O DS A N D S E R V I C ES, 2 0 1 0 – 1 6 ( U S $ M I L L I O N )

12 \ Commonwealth Trade Review 2018
NauruSwaziland
LesothoBotswana
NamibiaTuvalu
Papua New GuineaTonga
FijiKiribatiMalawiSamoa
VanuatuSolomon Islands
ZambiaMozambique
UgandaBrunei Darussalam
DominicaGrenada
MauritiusSri Lanka
St Vincent and the GrenadinesRwanda
BangladeshSeychelles
BarbadosGuyana
TanzaniaNew Zealand
KenyaAntigua and Barbuda
GhanaSierra Leone
CameroonSt Kitts and Nevis
South AfricaSingapore
MalaysiaAustralia
MaltaSaint Lucia
JamaicaIndia
PakistanNigeria
The BahamasThe Gambia
United KingdomTrinidad and Tobago
BelizeCyprus
Canada
0% 10% 20% 30% 40% 50% 60% 70% 80% 90% 100%
Exports
Imports
S o u rce : Co m m o nw e a l t h S e c re t a r i at (c a l c u l ate d u s i n g U N CTA D St at d at a )
F I G U R E 1 . 7I N T RA- CO M M O N W E A LT H T RA D E I N G O O DS B Y M E M B E RS AS A P E RC E N TAG E O F TOTA L W O R L D T RA D E , 2 0 1 6 ( % )

Part 1: Commonwealth trade and investment trends \ 13
latest projections for developed and
developing countries in the medium
term are used. It is assumed that
Commonwealth trade will grow at
the same rate, with the same rate of
expansion for intra-Commonwealth
trade. It is assumed that the
global trade recovery expected in
2017 and 2018, amid major policy
uncertainties, is sustained into 2020.5
With these assumptions and caveats
about the global trade situation, the
results from the projection exercise
show that intra-Commonwealth
trade is broadly on a growth track,
although it might take a few more years
to reach US$1 trillion, as predicted
in the 2015 Commonwealth Trade
Review. In this scenario, intra-
Commonwealth trade is projected
to reach $700 billion by 2020, while
proactive policy measures can trigger
even greater gains (Figure 1.11).
Sri Lanka
New Zealand
Bangladesh
South Africa
Canada
Malaysia
Australia
Singapore
India
United Kingdom
Bangladesh
New Zealand
Nigeria
Canada
South Africa
United Kingdom
Australia
India
Malaysia
Singapore
0% 2% 4% 6% 8% 10% 12% 14% 16% 18% 20% 0% 2% 4% 6% 8% 10% 12% 14% 16% 18% 20%
S o u rce : Co m m o nw e a l t h S e c re t a r i at (c a l c u l ate d u s i n g U N CTA D St at d at a )
TA B L E 1 . 3S H A R E O F M E RC H A N D I S E E X P O RTS A N D I M P O RTS O F CO M M O N W E A LT H CO U N T R I ES B Y R EG I O N , 2 0 1 6
F I G U R E 1 . 8CO U N T RY S H A R ES O F I N T RA- CO M M O N W E A LT H E X P O RTS ( L E F T ) A N D I M P O RTS ( R I G H T ) , 2 0 1 6 ( % )
Commonwealth group
Exports Imports
Share of Commonwealth total (%)
Value of intra-Commonwealth exports (US$ million)
Share of Commonwealth total (%)
Value of intra-Commonwealth
imports (US$ million)
All Commonwealth 100 354,063 100 351,598
Developed 29 104,029 35 124,341
Africa 16 57,882 16 55,623
Asia 52 185,708 47 165,106
Caribbean 1 2,823 1 3,473
Pacific 1 3,621 1 3,057
Source: Commonwealth Secretariat (calculated using UNCTADStat)

14 \ Commonwealth Trade Review 2018
1.5 Trends in intra-Commonwealth investment
1.5.1 CommonwealthFDIflowsinaglobal context
Global FDI fell by 16 per cent in 2017,
to an estimated US$1.52 trillion, from
$1.8 trillion in 2016. This is in stark
contrast with world GDP and trade
growth, which saw improvements
in 2017 (UNCTAD, 2018).
Overall, global FDI flows into the Commonwealth are increasing (Figure 1.12). In 2017, inflows
were estimated at US$250 billion
compared to almost $430 billion in
2016; the latter boost in FDI was
owed to three merger and acquisition
megadeals in the UK (UNCTAD, 2018).
The accumulated FDI stock in the
Commonwealth is now over $5 trillion.6
The Commonwealth is a net recipient of global FDI flows. Commonwealth
member countries held about one-fifth
of global FDI stock in 2016; and this
is considerably more than their share
of global GDP, which is approximately
14 per cent (Table 1.4). However, FDI
inflows into the Commonwealth have
been uneven: 10 members received
more than 90 per cent of inflows
between 2010 and 2016. The top five
recipients were the UK, Singapore,
Canada, Australia and India, in that
order. These five countries accounted
for nearly 80 per cent of total FDI
flows into the Commonwealth.
Geographical proximity invariably plays a role in determining the investment relationship between the Commonwealth countries.
For example, Mauritius is the largest
investor in India (accounting for more
than 20 per cent of total FDI inward
stock in India between 2010 and
2015). South Africa has significant
investment in other Commonwealth
SSA countries, such as the SACU
countries, and Mozambique and Nigeria.
In 2015, some US$3.6 trillion outward
FDI stocks were registered in the
Commonwealth and it was estimated
that some 20 per cent of these stocks
came from intra-Commonwealth
investments – or around $720 billion
(UNCTAD, 2017a). Intra-Commonwealth
investment remained steady at 20 per
cent of total outward FDI stock from
the Commonwealth since 2010. Intra-
Commonwealth investment is likely
to remain stable in 2016 at about 20
per cent of total outward FDI stock.
1.5.2 Trends in productive investment in the Commonwealth
In terms of FDI flows within the Commonwealth, productive investment – also known as greenfield investment – is increasingly important, especially to help advance the
Transportation
32%
24%
Travel
2%Communications
1%Construction
4%Insurance
5%Financial
4%Computer and information
2%Royalties/licence fees
23%Other business
1%Personal, cultural and recreational services
2%Government, n.i.e.
S o u rce : Co m m o nw e a l t h S e c re t a r i at (c a l c u l ate d f ro m O EC D -W TO B a T I S d at a )
F I G U R E 1 . 9CO M P O S I T I O N O F I N T RA- CO M M O N W E A LT H T RA D E I N S E R V I C ES, N E A R EST Y E A R ( % )

Part 1: Commonwealth trade and investment trends \ 15
CanadaUnited Kingdom
DominicaBelize
St Kitts and NevisSaint Lucia
CyprusJamaica
CameroonSingapore
Sierra LeoneIndia
St Vincent and the GrenadinesSeychelles
Antigua and BarbudaGrenada
NigeriaTrinidad and Tobago
The BahamasPakistan
MaltaRwanda
MozambiqueSouth Africa
MalaysiaTanzania
GhanaNamibia
KenyaAustralia
GuyanaZambiaUganda
BarbadosLesotho
MauritiusSri LankaVanuatu
BangladeshMalawiTonga
Brunei DarussalamBotswana
Papua New GuineaKiribatiSamoa
SwazilandFiji
New ZealandSolomon Islands
0% 10% 20% 30% 40% 50% 60%
N o te : Th e G a m b i a was n o t i n c l u d e d at t h e t i m e o f t h e a n a l y s i s.S o u rce : Co m m o nw e a l t h S e c re t a r i at (c a l c u l ate d f ro m O EC D -W TO B a T I S d at a )
F I G U R E 1 . 1 0I N T RA- CO M M O N W E A LT H T RA D E I N S E R V I C ES B Y M E M B E RS AS A P E RC E N TAG E O F TOTA L W O R L D T RA D E , N E A R EST Y E A R ( % )

16 \ Commonwealth Trade Review 2018
Sustainable Development Goals (SDGs), build productive capacity and create jobs. A greenfield investment
initiates a new venture under which a
parent company builds its operations in
a foreign country from the ground up.
It includes construction of production
and processing facilities, building of
new distribution hubs and offices, and
developing new project sites. The
economic impact of greenfield FDI is
considered more positive than other
types of FDI, for example flows emanating
from mergers and acquisitions. This
is because it represents new capital
investment and leads to an increased
number of jobs in the host economy.
This Review uses the latest data from fDi
Markets (The Financial Times) to analyse
intra-Commonwealth greenfield FDI.
This is currently the only data source on
bilateral greenfield investment flows.
It is also the most comprehensive
online database of cross-border
greenfield investments, giving
information on investment projects,
capital investment and job creation.
Greenfield FDI can be significant for
economic development because of
its direct impact on employment;
therefore, it is critical to examine the
flows of such investment and where it is
showing results in the Commonwealth.
However, some caution is necessary
when interpreting the greenfield FDI
data, because they capture investment
project announcements, which are
only actualised in the future.
Estimated
Projection in 2015 Commonwealth Trade Review
1,200
1,000
800
600
400
200
02010 2011 2012 2013 2014 2015 2016 2017 2018 2019 2020
S o u rce : Co m m o nw e a l t h S e c re t a r i at ’s p ro j e c t i o n e xe rc i s e b as e d o n W TO t ra d e g row t h e s t i m ate s
F I G U R E 1 . 1 1I N T RA- CO M M O N W E A LT H T RA D E P RO S P ECTS B Y 2 0 2 0 : T H E I M P ACT O F T H E G LO B A L T RA D E S LO W D O W N , 2 0 1 0 – 2 0 ( U S $ B I L L I O N )
500
400
300
200
100
01991 1993 1995 1997 1999 2001 2003 2005 2007 2009 2011 2013 2015 2017
N o te : 2 0 1 7 i s b as e d o n p re l i m i n a r y e s t i m ate s.S o u rce : U N CTA D
F I G U R E 1 . 1 2I N C R E AS I N G T R E N D O F F D I F LO W S TO T H E CO M M O N W E A LT H , 1 9 9 1 – 2 0 1 7 ( U S $ M I L L I O N )

Part 1: Commonwealth trade and investment trends \ 17
In the Commonwealth alone, cumulative greenfield investments from the world created 7.2 million jobs in nearly 50,000 projects between 2003 and 2016. Commonwealth member countries are investing more in each other than the rest of the world is; the rate of growth in intra-Commonwealth greenfield FDI is greater than the comparable
rate of growth in greenfield FDI into Commonwealth countries from the rest of the world. In total,
the percentage change in intra-
Commonwealth greenfield investment
between 2003 and 2016 is 2.9 times
higher than greenfield investments
by Commonwealth countries in the
rest of the world, suggesting that
Commonwealth countries invest
almost three times more in each
other than in other countries.
Cumulative greenfield investment
over the duration 2003–177 into
the Commonwealth was valued
at US$2.8 trillion in 2017 and
generated 7.2 million jobs, while intra-
Commonwealth greenfield investment
generated total cumulative intra-
Commonwealth greenfield FDI – defined
as both the destination and source being
Commonwealth members – generated
1.4 million jobs through 10,000 projects,
with capital investments of almost
$700 billion. Intra-Commonwealth
investment comprises around 24 per
cent of total greenfield investment.
The top sources of intra-Commonwealth
investment are the UK, followed by
India and Malaysia and Singapore.
Figure 1.13 clearly shows a dramatic
rise in the increased prominence of
12%Australia
26%Canada
11%Malaysia
19%India
14%Malaysia
11%Australia
7%Canada
6%India
4%Singapore
2%South Africa
1%Others
14%Singapore
4%South Africa
5%Others
38%UK
26%UK
N o te : B as e d o n to t a l va l u e o f g re e n f i e l d i nve s t m e n t ( U S $ b i l l i o n ) .S o u rce : Co m m o nw e a l t h S e c re t a r i at (c a l c u l ate d u s i n g f D i M a r ke t s ( Th e Fi n a n c i a l Ti m e s ) d at a )
F I G U R E 1 . 1 3TO P S O U RC ES O F I N T RA- CO M M O N W E A LT H G R E E N F I E L D I N V EST M E N T, 2 0 0 5 ( L E F T ) A N D 2 0 1 6 ( R I G H T ) ( U S $ B I L L I O N )
TA B L E 1 . 4F D I I N T H E CO M M O N W E A LT H , 2 0 1 5 – 1 7 ( U S $ B I L L I O N , % )
FDIflows(US$ billion)
Share in world FDI inflows(%)
Inward FDI stock (%)
Share in world inward FDI stock
(%)
Share of world GDP
(%)
2017 250 16 5,793 20 -
2016 428 22 5,542 19 14
2015 255 13 5,151 19 14
Note: 2017 is based on preliminary estimates.
Source: UNCTAD

18 \ Commonwealth Trade Review 2018
intra-Commonwealth investment
driven by India. In comparison, the
share contributed by Australia has
remained relatively stable. A decline in
intra-Commonwealth investment is
apparent for Canada, between 2005
and 2016. Table 1.5 summarises the
available data on job creation derived
from the project investments.
Majordestinationsofintra-
Commonwealthgreenfieldinvestment
Between 2005 and 2016, India remained
the top recipient of greenfield FDI
from the Commonwealth, more than
doubling the amount it received over 10
years. In 2016, Bangladesh, Singapore,
Nigeria and Sri Lanka emerged as the
other major destinations attracting
such FDI from the Commonwealth,
whereas Canada, Malaysia, Pakistan
and Tanzania lost ground in relative
terms. India is the leading country
for attracting greenfield FDI, not only
from the Commonwealth but also
from the world. In 2015, it overtook
China for the first time as the biggest
destination for greenfield FDI.
While greenfield FDI contributes to
economic development and growth,
high-growth economies attract more
investments, creating a virtuous
cycle of growth and investment.
Using simple trend analysis, cumulative intra-Commonwealth greenfield investment is estimated to reach approximately US$870 billion by 2020 under certain conditions.
While several Commonwealth
developing countries are becoming
increasingly attractive destinations
for global FDI, the broader global
investment environment for LDCs
as a whole remains structurally
weak, in large part because of the
aforementioned economic slowdown
and fall in commodity prices since
2014. Since most LDCs are commodity
exporters, and depend heavily on the
economic performance of advanced
economies, their recovery from the
global slowdown is likely to be slower
than those of the countries upon which
they depend. Intra-Commonwealth
FDI inflows to LDCs, however, have
proved resilient to these impacts.
While the percentage of global FDI to
LDCs declined by as much as 13 per
cent in 2016, intra-Commonwealth LDC
FDI investment fell by only 2 per cent in
the same period, suggesting a greater
concentration of intra-Commonwealth
investment in LDCs in comparison with
inflows to LDCs from the rest of the
world. This pattern can be seen from
Figure 1.14. An average of 13 per cent of
intra-Commonwealth FDI was invested
in Commonwealth LDCs between 2003
and 2016, aggregating a total of US$81
billion over this period; and the number
of Commonwealth FDI projects to these
member countries has increased by 1.6
times since 2003, or 160 per cent. Five
Commonwealth LDCs – Bangladesh,
Mozambique, Uganda, Tanzania and
Zambia – have received 89 per cent of
this total. Papua New Guinea, which
is the highest recipient of FDI flows
among Commonwealth small states,
recorded a remarkable total of $9
billion in intra-Commonwealth FDI
investment between 2003 and 2016.
While analysis suggests no relationship
between greenfield investment and the
presence of policy instruments such as a
bilateral investment treaty, other policy
variables such as contract enforcement
and the protection of minority investors
may exert an influence. Because
greenfield investment is the creation
of new capital, investment policy
frameworks will influence investors’
decisions. Recent trends are suggestive
of the Commonwealth advantage in
practice and the continued development
of intra-Commonwealth trade and
investment networks, building on
TA B L E 1 . 5M A J O R S O U RC ES O F I N T RA- CO M M O N W E A LT H I N V EST M E N T A N D J O B C R E AT I O N
No. of FDI projects
No.ofjobscreated
No. of FDI projects
No.ofjobscreated
Majorsources 2005 2016
United Kingdom 137 34,949 251 29,845
Canada 76 17,306 72 5,566
Australia 49 10,828 100 10,047
Malaysia 19 5,575 15 10,183
India 65 6,647 97 10,252
Singapore 26 8,529 51 16,817
South Africa 16 3,172 54 4,814
Others 25 2,961 86 5,509
Total 413 89,967 726 93,033
Source: fDi Markets (The Financial Times)
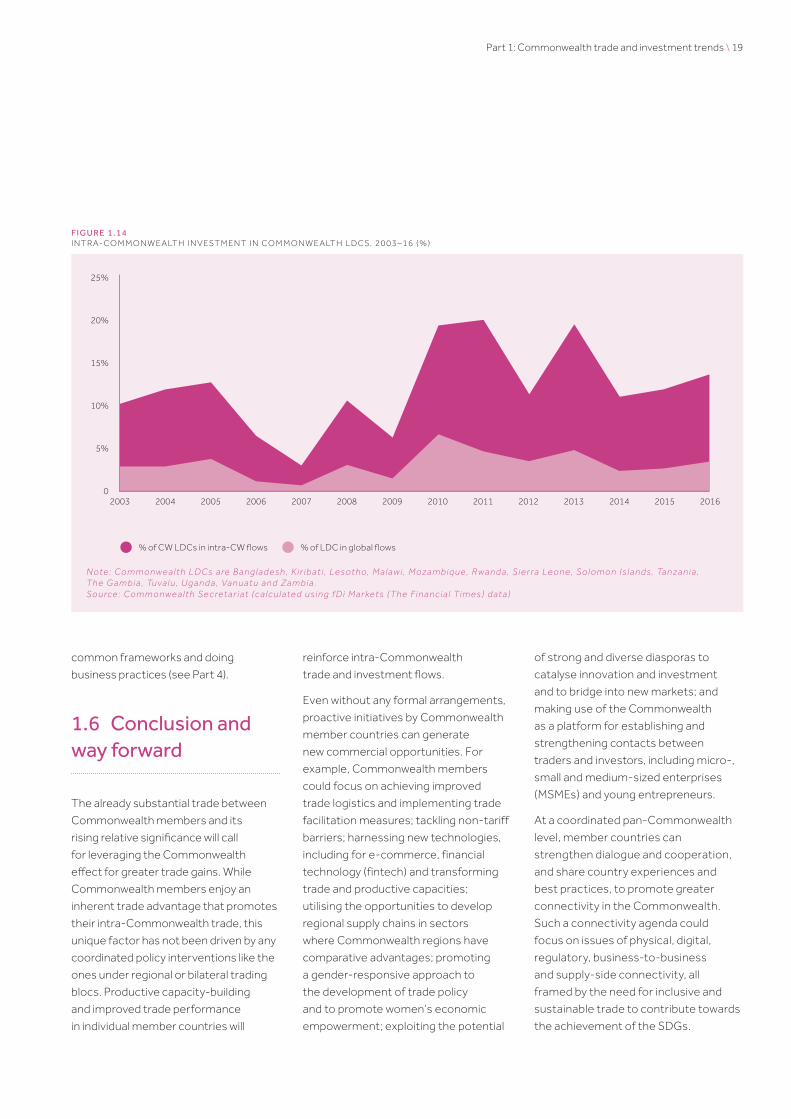
Part 1: Commonwealth trade and investment trends \ 19
common frameworks and doing
business practices (see Part 4).
1.6 Conclusion and way forward
The already substantial trade between
Commonwealth members and its
rising relative significance will call
for leveraging the Commonwealth
effect for greater trade gains. While
Commonwealth members enjoy an
inherent trade advantage that promotes
their intra-Commonwealth trade, this
unique factor has not been driven by any
coordinated policy interventions like the
ones under regional or bilateral trading
blocs. Productive capacity-building
and improved trade performance
in individual member countries will
reinforce intra-Commonwealth
trade and investment flows.
Even without any formal arrangements,
proactive initiatives by Commonwealth
member countries can generate
new commercial opportunities. For
example, Commonwealth members
could focus on achieving improved
trade logistics and implementing trade
facilitation measures; tackling non-tariff
barriers; harnessing new technologies,
including for e-commerce, financial
technology (fintech) and transforming
trade and productive capacities;
utilising the opportunities to develop
regional supply chains in sectors
where Commonwealth regions have
comparative advantages; promoting
a gender-responsive approach to
the development of trade policy
and to promote women’s economic
empowerment; exploiting the potential
of strong and diverse diasporas to
catalyse innovation and investment
and to bridge into new markets; and
making use of the Commonwealth
as a platform for establishing and
strengthening contacts between
traders and investors, including micro-,
small and medium-sized enterprises
(MSMEs) and young entrepreneurs.
At a coordinated pan-Commonwealth
level, member countries can
strengthen dialogue and cooperation,
and share country experiences and
best practices, to promote greater
connectivity in the Commonwealth.
Such a connectivity agenda could
focus on issues of physical, digital,
regulatory, business-to-business
and supply-side connectivity, all
framed by the need for inclusive and
sustainable trade to contribute towards
the achievement of the SDGs.
25%
20%
15%
10%
5%
02003 2004 2005 2006 2007 2008 2009 2010 2011 2012 2013 2014 2015 2016
N o te : Co m m o nw e a l t h L D Cs a re B a n g l a d e s h , K i r i b at i , Le s o t h o, M a l a w i , M oza m b i q u e , R wa n d a , S i e r ra Le o n e , S o l o m o n I s l a n d s, Ta n za n i a , Th e G a m b i a , Tu va l u , U g a n d a , Va n u at u a n d Za m b i a .S o u rce : Co m m o nw e a l t h S e c re t a r i at (c a l c u l ate d u s i n g f D i M a r ke t s ( Th e Fi n a n c i a l Ti m e s ) d at a )
F I G U R E 1 . 1 4I N T RA- CO M M O N W E A LT H I N V EST M E N T I N CO M M O N W E A LT H L D CS, 2 0 0 3 – 1 6 ( % )

20 \ Commonwealth Trade Review 2018
Annex
CO M M O N W E A LT H G V C P A RT I C I P AT I O N A N D E N A B L E RS
Variables
Commonwealth Global
Log of non GVC exports Log of GVC exports Log of non GVC exports Log of GVC exports
Log of GDP of exporter country (2005 US$)
−0.04** 0.79*** 0.02*** 0.36***
(0.02) (0.08) (0.01) (0.02)
Log of distance 0.11 −1.34*** −0.07*** −0.65***
(0.08) (0.32) (0.02) (0.06)
Common language 0.07 0.00 0.03 0.71***
(0.05) (0.20) (0.02) (0.07)
Log of ITU in origin −0.01 0.23*** −0.01 0.06***
(0.01) (0.04) (0.00) (0.01)
Log of ITU in destination −0.00 0.01 −0.01 0.02
(0.01) (0.04) (0.01) (0.02)
Log of LPI in origin 0.16 0.88 −0.26*** 1.85***
(0.16) (0.62) (0.05) (0.13)
Log of LPI in destination −0.11 1.05* −0.05 0.04
(0.15) (0.62) (0.07) (0.18)
Log of time zone difference
−0.08 0.49** −0.02 0.22***
(0.05) (0.22) (0.01) (0.04)
Log of total exports 1.02*** 0.49*** 1.03*** 0.52***
(0.01) (0.04) (0.00) (0.01)
1 for contiguity 0.12 0.72 −0.11* 1.29***
(0.15) (0.64) (0.06) (0.19)
1 if origin is GATT/WTO member
−0.12 1.14 0.04* 0.07
(0.17) (0.70) (0.02) (0.06)
1 if destination is GATT/WTO member
0.18 1.31 0.20 0.15
(0.20) (0.82) (0.13) (0.37)
1 for RTA 0.04 0.94** −0.08*** 0.63***
(0.09) (0.38) (0.02) (0.07)
Constant −0.65 −17.44*** −0.39* −3.86***
(0.85) (3.50) (0.23) (0.65)
Observations 1090 1104 18341 18640
Note: GVCs are defined as vertically fragmented trade and identified through trade in parts and components and comprise the following: electronics, autos, apparel, footwear, textiles and clothing.
Source: Sturgeon et al., 2017; Farole, 2017

Part 1: Commonwealth trade and investment trends \ 21
Endnotes
1 Between 2013 and 2015, the US
dollar value of global exports of
goods and services declined from
US$23.4 trillion to $20.6 trillion.
Notwithstanding positive increases
in trade volumes, significant
fluctuations in global commodity
prices and exchange rates in recent
years have combined to significantly
reduce the US dollar value of
international trade flows. These
fluctuations have been influenced
by several factors: slowing economic
growth in China, divergent monetary
policies across leading economies,
volatility in financial markets and
resilient fuel production in the
USA, among others (WTO, 2015).
2 Three-year average between 2014
and 2016; compared with 55.25 per
cent for Commonwealth small states
2010–12 and 59.87 per cent 2006–08.
Based on total GDP (current US$
million) and total exports of goods
and services (current US$ million).
3 EXPY is a measure of the
productivity level associated
with a country’s exports.
4 The profound implications of GVCs
for the achievement of structural
economic transformation continue
to be explored within the literature.
Structural economic transformation
can be broadly defined as the
reallocation of economic activity
across three broad sectors
(agriculture, manufacturing and
services), which accompanies
the process of economic growth
(Kuznets, 1966). This is no longer the
case since the ascendency of GVCs.
5 Global growth in merchandise trade
was estimated to be 3.6 per cent
in 2017, according to the upper
range of the estimates provided
by the WTO (WTO, 2017c). These
estimates were revised to 3.9 per
cent in September 2017, with the
developing world estimated at
5.8 per cent and Asia between 6.7
and 7.0 per cent. The projection
exercise uses the WTO’s estimates
for the developed and developing
world in light of the composition of
the Commonwealth and the fact
that the global rebound in trade
is being driven primarily by Asia.
6 According to UNCTAD (2018),
preliminary data on the value of
announced greenfield FDI projects
show a decline of 32 per cent to
US$571 billion (-17 per cent by
number of projects), their lowest level
since 2003. If confirmed, the drop in
greenfield project announcements
would be a negative indicator for
the longer term. Of particular
concern is the near halving of the
value of project announcements in
developing economies, although the
fall in project numbers was limited
to 23 per cent (UNCTAD, 2018).
7 Data are available up until
the last quarter of 2017.
Part 2: The Commonwealth in multilateral and regional trade

International trade is a crucial driver of growth, development and prosperity. To achieve the Sustainable Development Goals (SDGs), Commonwealth developing countries need an enabling global trading environment that both supports and enhances their participation in world trade. Part 2 explores recent dynamics in multilateral and regional trade, and how Commonwealth member countries, individually and collectively, are pursuing stronger trade-led growth and development.
Therearethreemajorfindingswithpolicyimplicationsfor Commonwealth member countries:
• The Commonwealth and its members remain at the forefront of global advocacy to promote free trade in a transparent, inclusive, fair and open rules-based multilateral trading systemtohelpachievetheSDGs,asreflectedinthefirst-everCommonwealth statement delivered to the World Trade Organization’s 11th Ministerial Conference in December 2017.
• Commonwealth members, compared with non-Commonwealth countries, are less protectionist, applying on average 3.5 per cent lessharmfulmeasuresthatdiscriminateagainstforeignfirms.
• Commonwealth developed countries remain strong advocates and leading donors of Aid for Trade (AfT) as a means to help developing countries with supply-side capacity-building, with the UK committing approximately US$1 billion to multilateral and regional AfT initiatives.

Overall, Commonwealth countries are less protectionist and apply even fewer harmful measures against other Commonwealth members
Commonwealth countries apply fewer harmful measures
Globally Commonwealth
5% less3.5% less

2.1 Introduction
For most Commonwealth developing countries, and especially
for small states, LDCs and SSA countries, international
trade is a crucial driver of growth, poverty reduction and
employment. If these countries are to achieve the SDGs,
they need an enabling global trading environment that
both supports and enhances their participation in world
trade. The Commonwealth is committed to free trade in a
transparent, inclusive, fair and open rules-based multilateral
trading system and, through practical support to member
countries, is contributing significantly to this process. Indeed,
faced with the prospect of rising protectionist
sentiments in many countries, the Commonwealth
is emerging as both an important buffer against
protectionism and a significant exemplar of global
leadership in deepening integrative trade practices,
for mutual benefit among its members.
Part 2 of the Commonwealth Trade Review examines
the Commonwealth’s role in promoting trade
multilateralism and limiting trade protectionism,
and highlights the deepening influence of regional
economic integration across the Commonwealth.

26 \ Commonwealth Trade Review 2018
2.2 The Commonwealth and trade multilateralism
The Commonwealth has always
championed a multilateral trading
system that is transparent, inclusive, fair,
open and rules-based, and that provides
a multilateral foundation to support
economic growth and sustainable
development. The Commonwealth has
emphasised this commitment through
an extensive programme of trade policy
support and technical assistance to the
most capacity-constrained members;
through consensus-building; and as
a leading advocate for deepening
and extending the benefits of rules-
based trade multilateralism for the
world’s smallest and poorest nations.
Currently, 49 of the Commonwealth’s
53 countries are members of
WTO, with The Bahamas currently
undergoing its accession process.
The Commonwealth’s contributions
to strengthening and promoting free
trade in a transparent, inclusive, fair and
open rules-based multilateral trading
system, including through a mix of policy
proposals to the G20, supportive actions
by individual country members and
collective Commonwealth advocacy,
have escalated. Most recently, the
Commonwealth made significant –
indeed historic – progress in contributing
the collective perspectives of its 53
member countries to multilateral
decision-making within the WTO, issuing
for the first time a Commonwealth
Statement to the WTO at its 11th
Ministerial Conference in Buenos Aires
in December 2017. The statement
anchors Commonwealth-wide support
for a rules-based multilateral trading
system at the highest governing level
of world trade, conveying a powerful
signal to the WTO members that,
notwithstanding the Commonwealth’s
diverse membership and economic
interests, there are important
commonalities that unite its members
and facilitate consensus-building on
complex issues, such as the multilateral
trading system. It also offers an example,
spanning almost a third of the WTO’s
membership, showing that such
unity of purpose can be achieved.
Despite the challenges in concluding
the Doha Development Agenda (DDA)
negotiations, some progress is being
made, both through the multilateral
trading system and through other
initiatives, including those taken by
the Commonwealth and its member
countries. For example, the Trade
Facilitation Agreement (TFA), adopted in
2013, represents the largest multilateral
trade arrangement secured in the
past 20 years. Most Commonwealth
members of the WTO have now
ratified this landmark agreement.
The broader WTO-led AfT initiative
shows that trade multilateralism can be
responsive to the concerns of the most
capacity-constrained members and can
help address their development needs,
especially in addressing the supply-
side capacity and other trade-related
constraints facing Commonwealth small
states, LDCs and SSA countries (Box
2.1). The WTO’s 2017 Global Review
of Aid for Trade focused on the theme
of ‘Promoting Trade, Inclusiveness
and Connectivity for Sustainable
Development’, underscoring the
importance of both physical and digital
connectivity for enabling greater trade
in goods and in services, as well as
achieving the SDGs (e.g. platforms
for delivering education and training,
tele-medicine, e-Government services,
and news and information). Part 3 of
the Review highlights that there are still
significant gaps in access to and use of
critical information and communication
technologies (ICTs) in many
Commonwealth member countries.
Commonwealth global advocacy
could support the establishment
of an Aid-for-e-Trade initiative to
enable developing countries to better
participate in the digital economy,
accelerate access to trade-enabling
technologies and empower women
and young people as entrepreneurs
and traders (see Part 3; Box 3.3).
Specific groups of WTO member
countries, including small vulnerable
economies (SVEs), have also made
important advances within the
multilateral trade system, opening new
channels to address their concerns and
the limitations they face in integrating
into the global economy. For example,
the WTO has established a dedicated
Working Group for SVEs within its
Committee on Trade and Development,
facilitating progress with the challenges
and opportunities faced by small
economies when linking into GVCs in
goods and services, and in identifying
ways to reduce trading costs.
Building on the positive momentum
achieved at the WTO’s Ninth Ministerial
Conference in Bali in 2013, the Nairobi
Package, adopted by trade ministers at
the WTO’s 10th Ministerial Conference
in 2015, also delivered several notable
achievements, including a special
safeguard mechanism enabling
developing countries to temporarily
increase tariffs on agriculture products
in the event of import surges or
price declines; a decision on export
subsidies and other elements of export
competition; a decision on cotton and
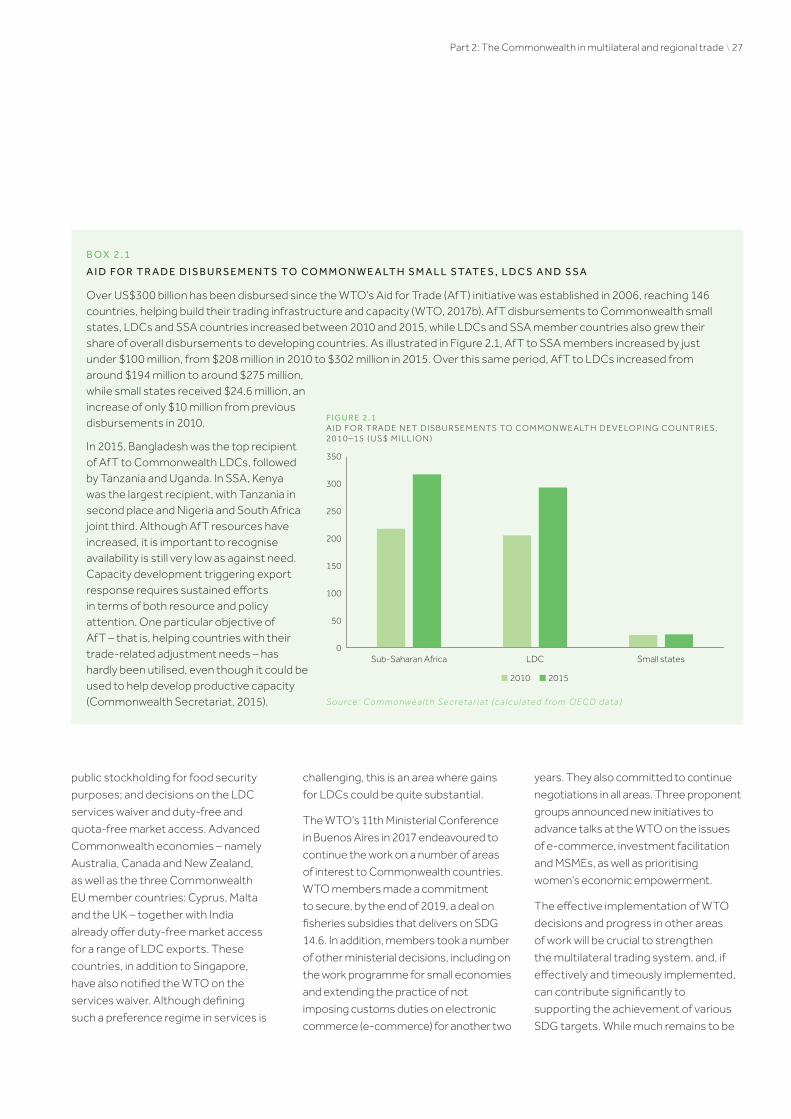
Part 2: The Commonwealth in multilateral and regional trade \ 27
public stockholding for food security
purposes; and decisions on the LDC
services waiver and duty-free and
quota-free market access. Advanced
Commonwealth economies – namely
Australia, Canada and New Zealand,
as well as the three Commonwealth
EU member countries: Cyprus, Malta
and the UK – together with India
already offer duty-free market access
for a range of LDC exports. These
countries, in addition to Singapore,
have also notified the WTO on the
services waiver. Although defining
such a preference regime in services is
challenging, this is an area where gains
for LDCs could be quite substantial.
The WTO’s 11th Ministerial Conference
in Buenos Aires in 2017 endeavoured to
continue the work on a number of areas
of interest to Commonwealth countries.
WTO members made a commitment
to secure, by the end of 2019, a deal on
fisheries subsidies that delivers on SDG
14.6. In addition, members took a number
of other ministerial decisions, including on
the work programme for small economies
and extending the practice of not
imposing customs duties on electronic
commerce (e-commerce) for another two
years. They also committed to continue
negotiations in all areas. Three proponent
groups announced new initiatives to
advance talks at the WTO on the issues
of e-commerce, investment facilitation
and MSMEs, as well as prioritising
women’s economic empowerment.
The effective implementation of WTO
decisions and progress in other areas
of work will be crucial to strengthen
the multilateral trading system, and, if
effectively and timeously implemented,
can contribute significantly to
supporting the achievement of various
SDG targets. While much remains to be
B O X 2 .1
A I D FO R T R A D E D I S B U R S E M E N T S TO C O M M O N W E A LT H S M A L L S TAT E S , L D C S A N D S S A
Over US$300 billion has been disbursed since the WTO’s Aid for Trade (AfT) initiative was established in 2006, reaching 146 countries, helping build their trading infrastructure and capacity (WTO, 2017b). AfT disbursements to Commonwealth small states, LDCs and SSA countries increased between 2010 and 2015, while LDCs and SSA member countries also grew their share of overall disbursements to developing countries. As illustrated in Figure 2.1, AfT to SSA members increased by just under $100 million, from $208 million in 2010 to $302 million in 2015. Over this same period, AfT to LDCs increased from around $194 million to around $275 million, while small states received $24.6 million, an increase of only $10 million from previous disbursements in 2010.
In 2015, Bangladesh was the top recipient of AfT to Commonwealth LDCs, followed by Tanzania and Uganda. In SSA, Kenya was the largest recipient, with Tanzania in second place and Nigeria and South Africa joint third. Although AfT resources have increased, it is important to recognise availability is still very low as against need. Capacity development triggering export response requires sustained efforts in terms of both resource and policy attention. One particular objective of AfT – that is, helping countries with their trade-related adjustment needs – has hardly been utilised, even though it could be used to help develop productive capacity (Commonwealth Secretariat, 2015).
F I G U R E 2 . 1A I D F O R T RA D E N ET D I S B U RS E M E N TS TO CO M M O N W E A LT H D E V E LO P I N G CO U N T R I ES, 2 0 1 0 – 1 5 ( U S $ M I L L I O N )
0
50
100
150
200
250
300
350
Sub-Saharan Africa LDC Small states
2010 2015
S o u rce : Co m m o nw e a l t h S e c re t a r i at (c a l c u l ate d f ro m O EC D d at a )

28 \ Commonwealth Trade Review 2018
done for these initiatives to bear fruit and
bring meaningful benefits to the world’s
poorest nations, these achievements
are not insignificant given the slow
progress in the DDA negotiations.
In addition, the multilateral trading
system plays a crucial role in ensuring
transparency and predictability
in the global trading system. This
is important given the continued
uncertainty in the global economic
and trading landscape, especially
with the proliferation of protectionist
measures over the past decade since
the onset of the global financial crisis.
2.3 The Commonwealth and resisting protectionism
A decade after the global financial
crisis, trade protectionism remains rife
in the world economy, stifling trade
flows and the potential for achieving
trade-led sustainable development.
Following the steady increase in trade-
restrictive measures by G20 economies
since the 2008 crisis, most of these
countries are now demonstrating
greater restraint, despite continuing
economic uncertainties. Building
on its longstanding support for
an open, inclusive, rules-based
multilateral trading system and the
many successes in advancing
developing countries’ interests in
world trade, the Commonwealth
can play – and indeed is already
playing – a significant role to build
awareness and understanding
of the adverse developmental
impacts of greater protectionism
and to promote global advocacy
for increased trade openness and
reduced trade protectionism.
But the Commonwealth has a further
rationale – and indeed a compelling
credibility – in advocating reduced
protectionism: Commonwealth
members themselves are, on average,
demonstrating less inclination to
practice trade protectionism than
non-Commonwealth countries. While
the impacts of tariff changes can be
measured easily, non-tariff measures
(NTMs) are harder to monitor. However,
an analysis of the frequency and
extent of use of harmful NTMs, using
data collected from the Global Trade
Alert, suggests that Commonwealth
countries, on average, tend to be less
protectionist towards each other
and also less protectionist towards
the rest of the world. As Table 2.1
highlights, Commonwealth members
have tended to apply almost 3.5 per
cent fewer ‘red’ measures than non-
Commonwealth countries. This finding
is commensurate with and sustains the
Commonwealth advantage, whereby
trade costs, on average, are lower
between Commonwealth partners.
Deeper analysis of the data suggests
that a handful of countries account
for more than 80 per cent of the ‘red’
measures imposed by Commonwealth
members, several of which may indeed
have been adopted for legitimate
public policy purposes. There is
now also an increasing incidence of
‘green’ measures by Commonwealth
member countries and these tend
to liberalise market access. By
contrast, small states – which are
among the world’s most open and
Implementing jurisdiction Affectedjurisdiction Greena Amberb Redc
Commonwealth Non-Commonwealth 63 15 91
Commonwealth Commonwealth 49 11 67
Commonwealth All 57 14 81
Non-Commonwealth Non-Commonwealth 211 31 324
Non-Commonwealth Commonwealth 154 22 214
Non-Commonwealth All 197 28 296
All Non-Commonwealth 525 85 794
All Commonwealth 203 31 278
All All 249 40 370
aLiberalising measures are government interventions that benefit foreign commercial interests by liberalising market access.
bInterventions that almost certainly include discrimination against foreign commercial interests but cannot be documented with an official statement, or are announced interventions that, if implemented, would almost certainly involve discrimination of foreign firms.
cInterventions that have been implemented and almost certainly discriminate against foreign commercial interests.
Source: Commonwealth Secretariat (calculated from the Global Trade Alert data; http://www.globaltradealert.org/global_dynamics/flow_all)
TA B L E 2 . 1CO M M O N W E A LT H T RA D E M E AS U R ES ( A V E RAG E ) S I N C E 2 0 0 8
Part 2: The Commonwealth in multilateral and regional trade \ 29
trade-dependent economies –
and other capacity-constrained
Commonwealth developing countries
have rarely initiated harmful NTMs,
but instead been affected by global
trade protectionism. According to
one estimate, the loss of exports
LDCs have incurred as a result of
protectionist measures since the
crisis has been US$264 billion (Evenett
and Fritz, 2015). In other words, the
value of LDC exports could have
been 31 per cent higher if post-crisis
protectionism had been avoided.
Commonwealth members – working
individually, collectively and with
international partners – can further
assist these poorest and most
vulnerable economies, including
by championing the immediate
removal of remaining trade
restrictions against LDCs. This
will help the LDCs move towards
the SDG target of doubling their
share of global exports by 2020.
2.4 The Commonwealth and an enabling global trading environment
The WTO’s TFA, which entered into
force on 22 February 2017 following its
ratification by two-thirds of the WTO
membership, presents a significant
opportunity to revive world trade
growth. Implementation of the TFA
will also contribute to improving
domestic trade governance, which is
an important determinant of export
success for many Commonwealth
members – and deepens the
Commonwealth advantage in trade
and investment (Part 4). At the
end of February 2018, 42 of the 49
Commonwealth WTO members
had ratified the agreement.
The TFA contains provisions for
expediting the movement, release and
clearance of goods, including goods
in transit. It also sets out measures
for effective cooperation between
customs and other appropriate
authorities on trade facilitation and
customs compliance issues. Through
the TFA Facility, developing countries
and LDCs can access the technical
assistance and capacity-building
needed to implement the agreement.
Commonwealth developed countries
such as Australia, Canada, New
Zealand and the UK have been strong
advocates and leading donors of AfT as
a means to help developing countries
with supply-side capacity-building.
The UK, for example, has contributed
approximately US$1 billion to help
developing countries and LDCs boost
their regional and world trade. Most
recently, at the WTO’s 11th Ministerial
Conference in 2017, the UK announced
an additional £18 million (around US$25
million) of support to assist the world’s
poorest countries strengthen their
trade capacity. The UK Department for
International Development’s (DFID’s)
inaugural Economic Development
Strategy, launched in January 2017,
prioritises and seeks to strengthen
the UK’s approach to AfT.
Improving trade facilitation and logistics
at national and regional levels can
significantly reduce trade costs and
boost intra-Commonwealth trade, with
the greatest benefits expected to accrue
to those poorest and smallest countries
facing high trade costs owing to distance
from markets or their landlocked status.
The TFA is estimated to have the
potential to increase global merchandise
exports by up to US$1 trillion per annum,
while also reducing WTO members’
trade costs by an average of 14.3 per
cent; and gains are expected to accrue
to African countries and LDCs (WTO,
2015). Besides reduced trade costs,
additional benefits accruing to traders
include greater predictability, reduced
time and delays, and reduced complexity.
Many Commonwealth members have
already made important strides in
simplifying customs procedures and
upgrading infrastructure and systems
to expedite goods trade. More than
half of the Commonwealth members
ranked on the World Bank’s Logistics
Performance Index (LPI) improved
their overall scores between 2014
and 2016.1 In SSA, Botswana, Kenya,
Mozambique, Rwanda and Tanzania
significantly raised their scores,
with Botswana in particular rapidly
strengthening logistics performance
and advancing from 120th place to
57th in the overall LPI ranking. While
many other Commonwealth developing
countries in the SSA, Caribbean and
Pacific regions rank in the third and
fourth quartiles of the LPI framework,
underlining their acute trade capacity
challenges, new Commonwealth
initiatives are needed, to help better
share knowledge and experience
of successes in improving logistics
capacity and to enable these countries
to make similar progress (Part 4).
2.5 The future of the multilateral trading system
Notwithstanding important instances
of progress, the outcome of the WTO’s
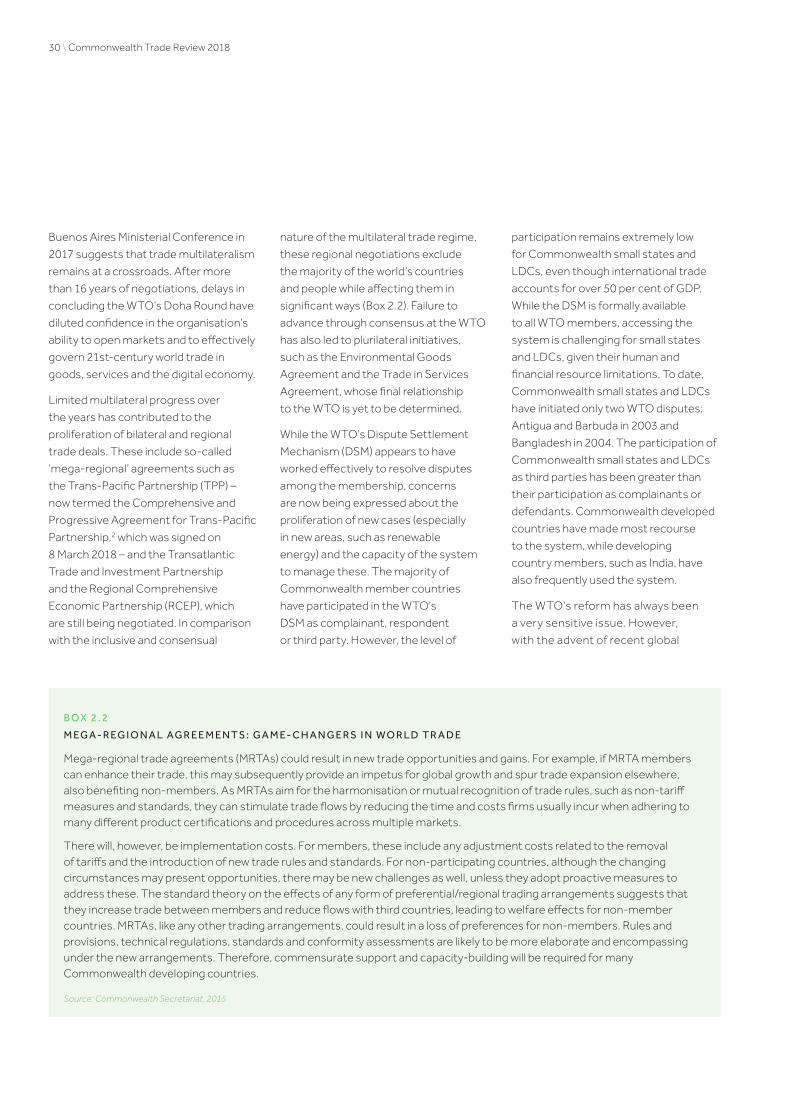
30 \ Commonwealth Trade Review 2018
Buenos Aires Ministerial Conference in
2017 suggests that trade multilateralism
remains at a crossroads. After more
than 16 years of negotiations, delays in
concluding the WTO’s Doha Round have
diluted confidence in the organisation’s
ability to open markets and to effectively
govern 21st-century world trade in
goods, services and the digital economy.
Limited multilateral progress over
the years has contributed to the
proliferation of bilateral and regional
trade deals. These include so-called
‘mega-regional’ agreements such as
the Trans-Pacific Partnership (TPP) –
now termed the Comprehensive and
Progressive Agreement for Trans-Pacific
Partnership,2 which was signed on
8 March 2018 – and the Transatlantic
Trade and Investment Partnership
and the Regional Comprehensive
Economic Partnership (RCEP), which
are still being negotiated. In comparison
with the inclusive and consensual
nature of the multilateral trade regime,
these regional negotiations exclude
the majority of the world’s countries
and people while affecting them in
significant ways (Box 2.2). Failure to
advance through consensus at the WTO
has also led to plurilateral initiatives,
such as the Environmental Goods
Agreement and the Trade in Services
Agreement, whose final relationship
to the WTO is yet to be determined.
While the WTO’s Dispute Settlement
Mechanism (DSM) appears to have
worked effectively to resolve disputes
among the membership, concerns
are now being expressed about the
proliferation of new cases (especially
in new areas, such as renewable
energy) and the capacity of the system
to manage these. The majority of
Commonwealth member countries
have participated in the WTO’s
DSM as complainant, respondent
or third party. However, the level of
participation remains extremely low
for Commonwealth small states and
LDCs, even though international trade
accounts for over 50 per cent of GDP.
While the DSM is formally available
to all WTO members, accessing the
system is challenging for small states
and LDCs, given their human and
financial resource limitations. To date,
Commonwealth small states and LDCs
have initiated only two WTO disputes:
Antigua and Barbuda in 2003 and
Bangladesh in 2004. The participation of
Commonwealth small states and LDCs
as third parties has been greater than
their participation as complainants or
defendants. Commonwealth developed
countries have made most recourse
to the system, while developing
country members, such as India, have
also frequently used the system.
The WTO’s reform has always been
a very sensitive issue. However,
with the advent of recent global
B O X 2 . 2
M EG A - R EG I O N A L A G R E E M E N T S : G A M E- C H A N G E R S I N W O R L D T R A D E
Mega-regional trade agreements (MRTAs) could result in new trade opportunities and gains. For example, if MRTA members can enhance their trade, this may subsequently provide an impetus for global growth and spur trade expansion elsewhere, also benefiting non-members. As MRTAs aim for the harmonisation or mutual recognition of trade rules, such as non-tariff measures and standards, they can stimulate trade flows by reducing the time and costs firms usually incur when adhering to many different product certifications and procedures across multiple markets.
There will, however, be implementation costs. For members, these include any adjustment costs related to the removal of tariffs and the introduction of new trade rules and standards. For non-participating countries, although the changing circumstances may present opportunities, there may be new challenges as well, unless they adopt proactive measures to address these. The standard theory on the effects of any form of preferential/regional trading arrangements suggests that they increase trade between members and reduce flows with third countries, leading to welfare effects for non-member countries. MRTAs, like any other trading arrangements, could result in a loss of preferences for non-members. Rules and provisions, technical regulations, standards and conformity assessments are likely to be more elaborate and encompassing under the new arrangements. Therefore, commensurate support and capacity-building will be required for many Commonwealth developing countries.
Source: Commonwealth Secretariat, 2015

Part 2: The Commonwealth in multilateral and regional trade \ 31
challenges, emerging issues and the
organisation’s increasing membership,
which now stands at 164, it has
become necessary to look seriously
into the capacity of the system and
of the organisation to deliver on its
mandate. Reforms, if any, should work
towards strengthening the multilateral
trading system and WTO structures.
The world economy has undergone
tremendous changes during the past
decade and a host of emerging issues
are now influencing global trade. These
issues include the fragmentation of
GVCs, the rise of ‘servicif ication’, the
digitisation of trade, climate change
and growing importance of MSMEs
(Soobramanien and Worrall, 2017).
Whether or not these issues should
be addressed at multilateral level is
debatable but it is important to analyse
and understand the implications in
terms of policies and infrastructure,
especially for the system’s most
capacity-constrained members. There
is no doubt that looking at the future
of the multilateral trading system
without looking at the emerging
issues can give only a partial picture.
2.6 Commonwealth members in regional trade and integration initiatives
In the context of the fragile recovery in
world trade growth, and limited progress
in multilateral rule-making as reflected
most recently at the WTO’s Buenos
Aires Ministerial Conference in 2017,
efforts to promote deeper and more
effective regional integration have
accelerated and have emerged as an
important means for achieving SDG
targets. The 2030 Agenda is, however,
silent on the potential role of regional
integration in promoting inclusive growth
and sustainable development.3 Yet it
is clear that regional integration can
contribute to these goals in many ways.
Regional integration is no longer only
about promoting regional markets
through tariff preferences. Today, it
is also a process whereby deeper and
effective regional cooperation allows
free movement of goods, services,
investment and people to enable
competitive production of exports,
and participation and upgrading in
regional and global value chains.
Strengthened regional cooperation to
address behind-the-border measures,
including technical regulations,
improving connectivity, for example by
strengthening transport infrastructure,
and triggering structural transformation,
including by identifying and developing
new regional value chains, can all
accelerate regional trade, reduce the
costs of trade and increase intra-regional
FDI. Part 4 of this Review presents new
evidence of the export-enhancing
impact of regional trade agreement
(RTA) membership for Commonwealth
members. It is found that trade between
Commonwealth members is more
than three times higher when both
members belong to an existing RTA,
highlighting the importance of effective
regional integration for boosting the
Commonwealth advantage. The results
suggest that intra-Commonwealth
initiatives to strengthen trade
facilitation and further reduce the
costs of intra-Commonwealth trade,
particularly among Commonwealth
countries that are both members of
RTAs, are likely to yield significant gains
to Commonwealth trade (see Part 4).
Since the last Trade Review in 2015 and
in recognition of these advantages,
Commonwealth members have
successfully concluded various bilateral
and RTAs. Through their membership
in the EU, Cyprus, Malta and the
UK concluded a substantive trade
agreement with Canada, comprising the
EU–Canada Comprehensive Economic
and Trade Agreement (CETA), which
entered into force in September 2017.
The CETA is the most ambitious trade
agreement concluded by the EU,
covering goods, services and public
procurement. It brings the number of
EU free trade agreements (FTAs) to
more than 40. Brexit – the UK’s decision
to withdraw from the EU by the end of
March 2019 – might necessitate the
UK replicating or renegotiating many
of these agreements, including the
CETA, to continue to benefit from the
reciprocal market access arrangements
these offer. Since the UK has been a
member of the EU for more than four
decades, including over 20 years in the
Single Market, Brexit will have wide-
ranging economic implications for the
UK, the EU and many Commonwealth
members (Box 2.3). However, there
may also be important opportunities
for the UK in the post-Brexit period
to continue to champion an inclusive
global trading system, establish pro-
development initiatives for the world’s
poorest countries and negotiate
new bilateral trade agreements with
interested Commonwealth members.
Some important trade agreements
involving Commonwealth advanced
and developing economies have also
recently been successfully finalised
after several years of negotiations.
The Southern African Development
Community (SADC)–EU Economic
Partnership Agreement was

32 \ Commonwealth Trade Review 2018
implemented in October 2016, providing
Botswana, Lesotho, Mozambique,
Namibia and Swaziland with duty- and
quota-free access for all goods (except
arms and munitions) into the EU market,
with some exceptions for South Africa.4
Since the economic partnership
agreements (EPAs) are reciprocal
yet asymmetrical agreements, the
SACU partners will remove customs
duties on approximately 86 per
cent of imports from the EU, while
Mozambique will remove 74 per cent of
customs duties on the same imports.
Four other SSA EPA groups involving
Commonwealth members – namely
with Eastern and Southern Africa
(ESA), the East African Community
(EAC), Central Africa and West Africa
– are at varying stages of finalisation
or signature. Some interim EPAs are
being provisionally implemented,
although there is uncertainty about
whether or not full regional EPAs are
indeed feasible or desirable, given
that these reciprocal tariff-cutting
arrangements may conflict with Africa’s
own integration and industrialisation
priorities, as outlined in the African
Union’s (AU‘s) Agenda 2063.
SSA constitutes the largest geographical
grouping in the Commonwealth,
with 19 members, and includes an
overwhelming majority of the world’s
LDCs. African countries have adopted
an ambitious developmental integration
agenda based on three pillars: market
integration, infrastructure development
and industrialisation. In June 2015, 26
countries launched the Tripartite FTA
involving three regional blocs: Common
Market for Eastern and Southern Africa
(COMESA), the EAC and the SADC.
The Framework Agreement for the
Continental FTA (CFTA) was signed
by 44 AU member states on 21 March
2018, creating the world’s largest FTA
according to the number of parties.
Effective implementation of the CFTA
could increase intra-African trade by an
estimated US$35 billion per year by 2022,
particularly if complemented by effective
operationalisation of the AU’s Action
Plan for Boosting Intra-African Trade and
other trade facilitation and infrastructure
plans at the regional level. Indeed,
operationalising these initiatives offers
enormous untapped opportunities
for growing intra-African trade among
both Commonwealth and non-
Commonwealth members, especially
in food products, basic manufactures
and services. Building and diversifying
productive capacity is an overriding
priority as part of the continent’s
structural transformation agenda. It
is estimated that by 2025 Africa could
almost double its current manufacturing
output to $930 billion, with three-
B O X 2 . 3
B R E X I T, T H E C O M M O N W E A LT H A N D T R A D E
Brexit – the UK’s withdrawal from the EU – is the result of a June 2016 referendum in which the UK voted to leave the EU. On 29 March 2017, the UK Government triggered Article 50 of the Lisbon Treaty, commencing the two-year period of withdrawal negotiations that will see the UK formally cease to be a member of the EU on 29 March 2019, followed by a transitional period to 31 December 2020. In the future, the UK will have the autonomy to develop its own independent trade policy. For developing countries, the UK has already announced three important commitments. First, LDCs will continue to enjoy their current Everything But Arms (EBA) terms of access.5 Second, the UK will create its own trade preference scheme to support economic and sustainable development in developing countries. Third, the UK will seek to replicate existing EU trade deals, including the Economic Partnership Agreements (EPAs). Overall, there may be opportunities to enhance further the development-friendly nature of the UK’s future trade regime by simplifying rules of origin, enhancing access for LDC services under the WTO waiver and addressing onerous non-tariff barriers.
UK–Commonwealth trade linkages are strong. Total merchandise trade flows of Commonwealth members involving the UK (i.e. Commonwealth countries’ exports to the UK plus the UK’s exports to other Commonwealth members) expanded from US$57 billion in 2000 to around $85 billion in 2016; and such trade actually reached a peak of US$120 billion in 2012 before being affected by the global trade slowdown. The UK absorbs about 18 per cent of Commonwealth developing countries’ exports to the EU. Several Commonwealth developing countries depend heavily on the UK market for their exports, from beef and bananas, through sugar and fresh vegetables, to textile and apparel products, as well as tourism services.
Source: Vickers and Khorana, 2018

Part 2: The Commonwealth in multilateral and regional trade \ 33
quarters of this growth triggered by
intra-African demand and substituting
imports of manufactured goods (MGI,
2016a). However, there remain many
political, economic and institutional
challenges to deeper integration and
the effective implementation of existing
RTAs, including for the movement
of professionals (Vickers, 2017).
Traditional Commonwealth
development partners, especially
Australia, Canada and the UK, and
emerging donors such as India continue
to provide substantial support for
regional trade and integration initiatives
in Africa. The UK has consistently
recorded the highest level of AfT
disbursements to Africa through
multilateral channels, including through
the African Development Bank and the
World Bank, while bilateral AfT is also
substantial (AAPG, 2016). The UK’s DFID
has also operated or participated in key
regional AfT programmes supporting
trade reforms, regional integration
and trade facilitation in Africa.
In Asia, while the RCEP negotiations
remain complex and challenging,
progress has been made recently.
The 16 countries participating
in the negotiations, including six
Commonwealth members, have
determined an outline agreement.6
Among prominent Asian RTAs,
Singapore, Malaysia and Brunei are
members of the Association of
Southeast Asian Nations, the third-
largest trading bloc in the world, after
the EU and the North American Free
Trade Agreement. In South Asia, four
Commonwealth members – Bangladesh,
India, Pakistan and Sri Lanka – are
implementing the South Asian Free
Trade Area (SAFTA) along with three
non-Commonwealth countries
(Afghanistan, Bhutan and Nepal).
Despite SAFTA being operational
since 2006, trade among South Asian
countries remains low, constituting
approximately 5 per cent of their total
trade. These countries also share few
transport and power connections with
each other. Several regional initiatives
have therefore been launched to
promote greater sectoral cooperation
and improve connectivity. Prominent
examples include the Bangladesh–India–
Nepal 7 Motor Vehicles Agreement and
the Asian Highway project under the
Bangladesh–China–India–Myanmar
corridor. There are also opportunities
for Commonwealth Asian countries
to benefit from China’s Belt and Road
Initiative; some SSA Commonwealth
members could also stand to gain.
Commonwealth small states –
comprising almost two-thirds of the
Commonwealth’s membership – are
also making progress in deepening
regional integration and taking initiatives
to expand intraregional trade. These
countries, especially the Caribbean and
Pacific small island developing states
(SIDS), face unique structural challenges
related to small size and geography.
These challenges include diseconomies
of scale, limited human resource
capacity, inadequate infrastructure,
limited diversification and exports
prone to preference erosion (e.g. sugar;
Box 2.4), high dependence on imported
fossil fuels, disproportionately high trade
costs and vulnerability to external and
endemic shocks. The scale of this last
challenge is evident from recent extreme
weather events in the Caribbean, notably
Hurricane Irma and Hurricane Maria
in 2017, which wrought catastrophic
damage on some of the region’s most
vulnerable countries, including Barbuda
and Dominica; estimates of the damage
caused are over 200 per cent of GDP.
Elsewhere, in 2015, Tropical Cyclone
Pam caused such devastation in the
Pacific that Vanuatu’s graduation
from LDC status was delayed to
December 2020. Accelerated regional
integration can help address many of
the challenges to achieving economic
growth, sustainable development and
greater competitiveness in the SIDS.
The Caribbean Community (CARICOM)
comprises 15 member states with a
total population of 18 million. Twelve
are Commonwealth members: Antigua
and Barbuda, The Bahamas, Barbados,
Belize, Dominica, Grenada, Guyana,
Jamaica, St Kitts and Nevis, Saint
Lucia, St Vincent and the Grenadines,
and Trinidad and Tobago.8 Five of
these Commonwealth members
also belong to a highly integrated
subregional grouping, the Organisation
of Eastern Caribbean States. CARICOM
members are pursuing both functional
cooperation, where important strides
have been made in advancing social
development at the regional level, and
economic integration through the
CARICOM Single Market and Economy
(CSME). The CSME formally provides
for the free movement of goods,
services, capital and labour among its
members, although implementation
challenges and obstacles persist.
To support trade-led development,
CARICOM members are also pursing
external partnerships with advanced
and emerging economies, particularly
China. The latter is increasing its
commercial presence in the Caribbean,
investing significantly in construction
and infrastructure, including, for
example, a new trans-shipment port
in Kingston, Jamaica. Yet several
challenges remain. For example,

34 \ Commonwealth Trade Review 2018
although the Caribbean Forum
(CARIFORUM) EPA was signed in
2008, with substantial EU support for
implementation, non-tariff barriers
and regulations continue to prevent
easy exports of goods and services
to the EU market. A further challenge
for the region’s financial services
sector involves de-risking and the
withdrawal of correspondent banking
relationships from local banks in the
Caribbean by global banks in the USA
and the UK. Canadian banks have,
however, continued their operations,
partly offsetting the harmful effects
from the loss of these arrangements,
while blockchain and digital currencies
have been flagged as possible
solutions to de-risking (see Part 3).
Of the 14 independent Pacific
island countries (PICs), nine are
Commonwealth small states. These
countries span three distinct Pacific
subregions: Melanesia (Fiji, Papua New
Guinea, Solomon Islands, Vanuatu),
Micronesia (Kiribati, Nauru) and
Polynesia (Samoa, Tonga, Tuvalu).
These Commonwealth small states,
together with other PICs, have made
substantial progress in expanding
and deepening regional integration.
This progress has been driven by
multiple and overlapping policy
mandates that recognise the
importance of regional integration.
Some of these decisions taken by
Pacific leaders have emerged from
public consultations undertaken
by the Pacific Islands Forum
Secretariat. This public policy
consultative process takes place
under the Framework for Pacific
Regionalism, which commits PICs
to working together to address
common challenges through deeper
regionalism. The Framework has
also yielded progress on regional
integration through policy work on
labour and business mobility and
harmonisation of business practices.
B O X 2 . 4
T H E N E W E U S U G A R R EG I M E : A S T I C K Y E N D TO A S W E E T D E A L FO R T H E A F R I C A N , C A R I B B E A N
AND PACIF IC STATES?
At the time of the UK’s accession to the European Economic Community in 1974, a Sugar Protocol was negotiated to replace the Commonwealth Sugar Agreement, allowing the continued duty-free access of raw and white sugar for a defined volume of 1.3 million tonnes at guaranteed prices. This tonnage was divided up into fixed country quotas. The EU revoked the Sugar Protocol in its 2009 reforms. These reforms removed the underlying price guarantees but, in addition to unlimited access from LDCs becoming effective at that time, beneficiaries of the Sugar Protocol were also given unlimited access to the EU market. The European Commission further reformed its sugar regime in 2017 by removing quotas on its own production and thus increasing the domestic supply dramatically. This reform came into effect on 1 October 2017 and the sugar market had already started to adjust.
EU production has increased substantially to over 20 million tonnes, dramatically reducing prices to levels that are near and even below world market levels, a world market distorted by subsidies in some of the largest producers. Refiners of imported cane sugar have steadily reduced their requirement for raw sugar as they struggle to compete against the large EU surpluses internally. The consequence for African, Caribbean and Pacific (ACP)/LDC suppliers is that deliveries to the EU market, which peaked at 2.3 million tonnes in 2013/14, were only 1.3 million tonnes in 2016/17. In the first few months of the new regime since 1 October 2017, deliveries were at a rate that would suggest, if annualised, that this will halve again to just 600,000–700,000 tonnes.
In 2013, while urging developing country suppliers to adapt to a more market orientated regime, the EU agreed a support package for its own farmers, voluntary coupled support (VCS). It is estimated that in 2016/17 VCS sustained 3.6 million tonnes of production in the EU that would have not otherwise have been viable. This additional production has contributed to the erosion of both domestic prices and demand for ACP sugar. A further consequence of the increased production has been a sharp rise in EU exports from 1.1 million to 3.5 million tonnes. These exports also compete with ACP/LDC sugar exports in their regional markets.
All ACP/LDC sugar industries are taking steps to adapt to the reforms and are developing new regional markets. However, the relative certainty that the EU market provided, in terms of a remunerative price and reliable offtake, no longer exists.
Source: De Pass, 2018
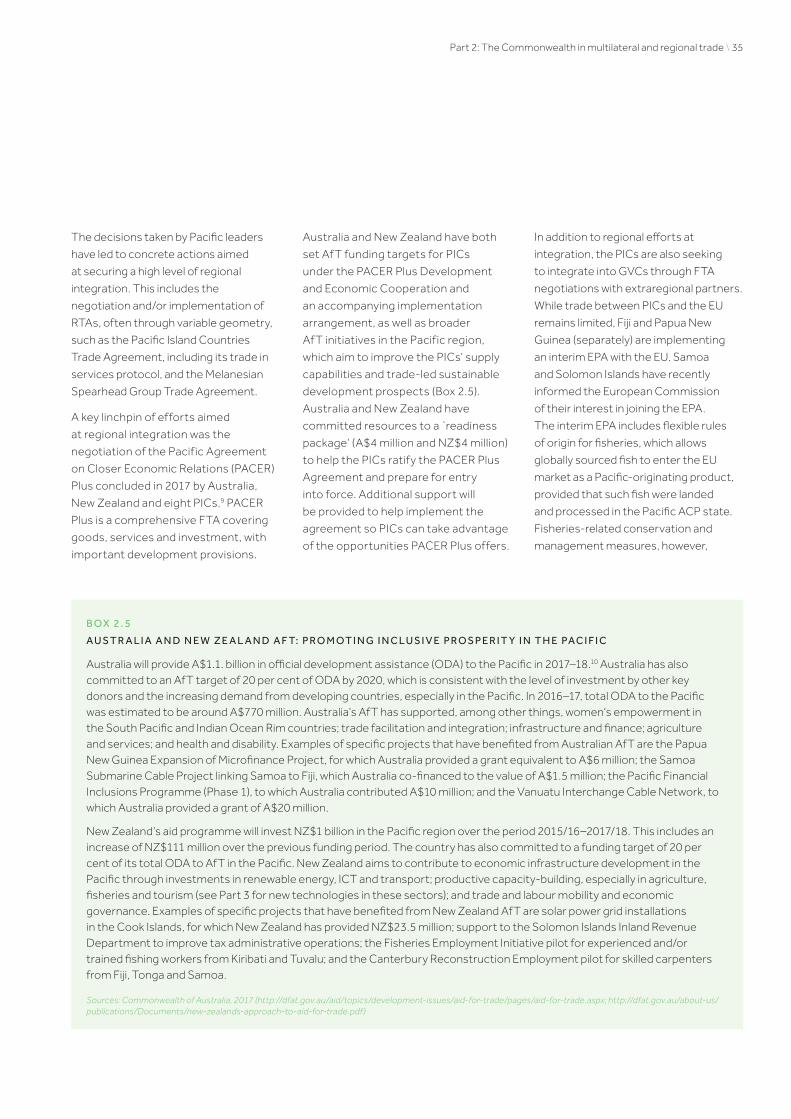
Part 2: The Commonwealth in multilateral and regional trade \ 35
The decisions taken by Pacific leaders
have led to concrete actions aimed
at securing a high level of regional
integration. This includes the
negotiation and/or implementation of
RTAs, often through variable geometry,
such as the Pacific Island Countries
Trade Agreement, including its trade in
services protocol, and the Melanesian
Spearhead Group Trade Agreement.
A key linchpin of efforts aimed
at regional integration was the
negotiation of the Pacific Agreement
on Closer Economic Relations (PACER)
Plus concluded in 2017 by Australia,
New Zealand and eight PICs.9 PACER
Plus is a comprehensive FTA covering
goods, services and investment, with
important development provisions.
Australia and New Zealand have both
set Af T funding targets for PICs
under the PACER Plus Development
and Economic Cooperation and
an accompanying implementation
arrangement, as well as broader
Af T initiatives in the Pacific region,
which aim to improve the PICs’ supply
capabilities and trade-led sustainable
development prospects (Box 2.5).
Australia and New Zealand have
committed resources to a `readiness
package’ (A$4 million and NZ$4 million)
to help the PICs ratify the PACER Plus
Agreement and prepare for entry
into force. Additional support will
be provided to help implement the
agreement so PICs can take advantage
of the opportunities PACER Plus offers.
In addition to regional efforts at
integration, the PICs are also seeking
to integrate into GVCs through FTA
negotiations with extraregional partners.
While trade between PICs and the EU
remains limited, Fiji and Papua New
Guinea (separately) are implementing
an interim EPA with the EU. Samoa
and Solomon Islands have recently
informed the European Commission
of their interest in joining the EPA.
The interim EPA includes flexible rules
of origin for fisheries, which allows
globally sourced fish to enter the EU
market as a Pacific-originating product,
provided that such fish were landed
and processed in the Pacific ACP state.
Fisheries-related conservation and
management measures, however,
B O X 2 . 5
A U S T R A L I A A N D N E W Z E A L A N D A F T: P R O M OT I N G I N C L U S I V E P R O S P E R I T Y I N T H E PA C I F I C
Australia will provide A$1.1. billion in official development assistance (ODA) to the Pacific in 2017–18.10 Australia has also committed to an AfT target of 20 per cent of ODA by 2020, which is consistent with the level of investment by other key donors and the increasing demand from developing countries, especially in the Pacific. In 2016–17, total ODA to the Pacific was estimated to be around A$770 million. Australia’s AfT has supported, among other things, women’s empowerment in the South Pacific and Indian Ocean Rim countries; trade facilitation and integration; infrastructure and finance; agriculture and services; and health and disability. Examples of specific projects that have benefited from Australian AfT are the Papua New Guinea Expansion of Microfinance Project, for which Australia provided a grant equivalent to A$6 million; the Samoa Submarine Cable Project linking Samoa to Fiji, which Australia co-financed to the value of A$1.5 million; the Pacific Financial Inclusions Programme (Phase 1), to which Australia contributed A$10 million; and the Vanuatu Interchange Cable Network, to which Australia provided a grant of A$20 million.
New Zealand’s aid programme will invest NZ$1 billion in the Pacific region over the period 2015/16–2017/18. This includes an increase of NZ$111 million over the previous funding period. The country has also committed to a funding target of 20 per cent of its total ODA to AfT in the Pacific. New Zealand aims to contribute to economic infrastructure development in the Pacific through investments in renewable energy, ICT and transport; productive capacity-building, especially in agriculture, fisheries and tourism (see Part 3 for new technologies in these sectors); and trade and labour mobility and economic governance. Examples of specific projects that have benefited from New Zealand AfT are solar power grid installations in the Cook Islands, for which New Zealand has provided NZ$23.5 million; support to the Solomon Islands Inland Revenue Department to improve tax administrative operations; the Fisheries Employment Initiative pilot for experienced and/or trained fishing workers from Kiribati and Tuvalu; and the Canterbury Reconstruction Employment pilot for skilled carpenters from Fiji, Tonga and Samoa.
Sources: Commonwealth of Australia, 2017 (http://dfat.gov.au/aid/topics/development-issues/aid-for-trade/pages/aid-for-trade.aspx; http://dfat.gov.au/about-us/publications/Documents/new-zealands-approach-to-aid-for-trade.pdf)

36 \ Commonwealth Trade Review 2018
remain unresolved and the negotiations
towards a comprehensive EPA
involving all 15 Pacific ACP countries
have been suspended for three
years starting in September 2016.
2.7 Conclusion and way forward
Notwithstanding rising protectionist
sentiments, modest recovery in world
trade growth and persistent challenges
in global trade governance, the
multilateral trading system continues
to play a pivotal role in supporting
the trade, growth and sustainable
development objectives of many of
the world’s poorest, smallest and
most vulnerable countries. However,
at this crucial juncture, a key priority
for the international community
is to sustain the recovery in world
trade growth and strengthen the
multilateral trading system.
The Commonwealth is actively
contributing towards these goals. The
Commonwealth and its members
remain at the forefront of international
advocacy to promote free trade in a
transparent, inclusive, fair and open
rules-based multilateral trading system;
are extending substantive political,
financial and technical support to a host
of multilateral initiatives, among others
on trade facilitation and AfT; and, in
supporting extensive efforts to deepen
regional integration, are providing large-
scale financial and technical support to
Commonwealth and other countries.
Looking ahead, further consideration
could be given to how Commonwealth
members – working individually,
collectively and with international
partners – can contribute towards
sustaining the world trade recovery;
and to how international trade can
be better harnessed, to play an
effective role in realising the SDGs.
Building on the Commonwealth’s
diverse experiences and crucial
dependence on international trade,
Commonwealth members can
contribute valuable perspectives
within global discourse, through the
WTO, UN, G20 and other multilateral
and regional organisations, on the
role of trade in promoting growth,
jobs and sustainable development.
Given popular discontent about
globalisation in many countries, they
can accompany this with a new global
narrative that trade represents an
abiding force for human advancement.
Part 2: The Commonwealth in multilateral and regional trade \ 37
Endnotes
1 The LPI is an overall metric of supply
chain efficiency. It lists information
on a country’s relative logistics
performance and provides a broad
indication of the challenges and
constraints to improving logistics
performance. The coverage of LPI
extends to 160 countries (in LPI
2016), and is built on more than
5,000 country assessments by
over 1,000 freight forwarders and
logistics professionals worldwide.
The respondents rate the logistics
performances of their country
and eight other countries on a scale
of 1 to 5. The LPI is published every
two years, and covers 2007,
2010, 2012, 2014 and 2016.
2 Commonwealth members
comprise more than half of the 11
parties to the Comprehensive and
Progressive Agreement for TPP.
The USA withdrew from the TPP
in January 2017. In January 2018
the UK government stated it is
exploring becoming a member of
the TPP after Brexit in March 2019
and has held informal discussions
with some of the members.
3 The Addis Ababa Action Agenda,
which mobilises resources to
implement the SDGs, commits
participants to strengthening
regional cooperation and
regional trade and investment
agreements (paragraph 87).
4 The EU has fully or partially
removed customs duties
on 98.7 per cent of imports
coming from South Africa.
5 The EU’s EBA scheme provides
duty-free and quota-free market
access for all LDC-originating
goods except armaments.
6 Joint Leaders’ Statement on the
Negotiations for the Regional
Economic Comprehensive
Partnership, 14 November
2017, Manila, the Philippines.
7 Originally with Bhutan but the
country has withdrawn, citing
environmental objections.
8 CARICOM also includes
Montserrat, a British overseas
territory, Guyana and Suriname
in South America and Haiti
in the French Caribbean.
9 The agreement was signed in
Nuku’alofa in Tonga on 14 June
2017 by Australia, New Zealand
and eight PICs: Cook Islands,
Kiribati, Nauru, Niue, Samoa,
Solomon Islands, Tonga and
Tuvalu. Vanuatu signed in Apia in
Samoa on 7 September 2017. Fiji
and Papua New Guinea are not
part of the agreement, although
they are free to join later.
10 In 2017–18, Australia will provide
A$3.9 billion in total ODA
(Commonwealth of Australia,
2017).

Part 3: Harnessing digitisation for Commonwealth trade, investment and prosperity
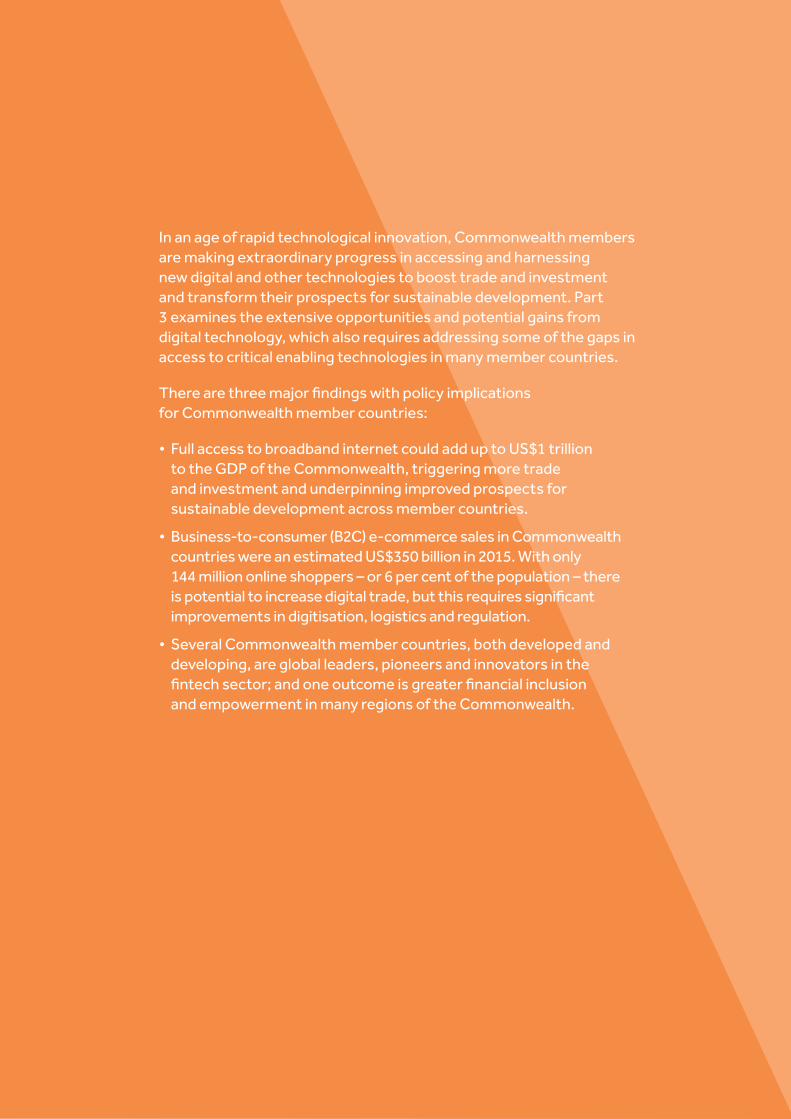
In an age of rapid technological innovation, Commonwealth members are making extraordinary progress in accessing and harnessing new digital and other technologies to boost trade and investment and transform their prospects for sustainable development. Part 3 examines the extensive opportunities and potential gains from digital technology, which also requires addressing some of the gaps in access to critical enabling technologies in many member countries.
Therearethreemajorfindingswithpolicyimplicationsfor Commonwealth member countries:
• Full access to broadband internet could add up to US$1 trillion to the GDP of the Commonwealth, triggering more trade and investment and underpinning improved prospects for sustainable development across member countries.
• Business-to-consumer (B2C) e-commerce sales in Commonwealth countries were an estimated US$350 billion in 2015. With only 144 milliononlineshoppers–or6percentofthepopulation–thereispotentialtoincreasedigitaltrade,butthisrequiressignificantimprovements in digitisation, logistics and regulation.
• Several Commonwealth member countries, both developed and developing, are global leaders, pioneers and innovators in the fintechsector;andoneoutcomeisgreaterfinancialinclusionand empowerment in many regions of the Commonwealth.

This would trigger more trade and investment and help
transform the prospects for sustainable development
Full access to broadbandinternet could add up to
US$1 trillionto the Commonwealth’s GDP

3.1 Introduction
Technology has historically served as a critical driver
of globalisation, underpinning the rapid expansion in
world trade and driving human progress, raising living
standards and welfare, and precipitating transformative
improvements in human health, education and economic
and social development. The 2030 Agenda for Sustainable
Development recognises the catalytic and transformative
role of technology: ‘The spread of information and
communications technology and global interconnectedness
has great potential to accelerate human progress, to bridge
the digital divide and to develop knowledge societies, as
does scientific and technological innovation across areas as
diverse as medicine and energy’ (UN, 2015). The importance
of ICTs is further enshrined in SDG Target 9.c, where the
international community commits to ‘significantly increase
access to information and communications technology
and strive to provide universal and affordable access to
the Internet in least developed countries by 2020’.1
There has never been a time of faster technological
innovation than today, unleashing new opportunities
for trade, investment and innovation among the 53
Commonwealth members. Equally, there has never been a
time potentially more disruptive to international trade. Rapid
developments – such as automation, artificial intelligence
(AI), 3D printing, the Internet of Things (IoT), blockchains and
virtual currencies (Table 3.1) – are fundamentally changing
the way we live and work. The technology-driven Fourth
Industrial Revolution (4IR) is forecast to disrupt traditional
patterns of trade and investment, as well as production,
consumption and supply chains, although the timeline for
achieving scale for many of these new technologies can be
decades rather than months (Brooks, 2018). Nonetheless,
digital technology applications are already generating new
products, services and solutions with direct and indirect
benefits to the Commonwealth’s 2.4 billion citizens (Box 3.1).
Technology’s multiple roles and diverse impacts offer all
Commonwealth countries opportunities to diversify their
economies; to increase productivity, output, growth and
employment; to connect economically with large and
dynamic diasporas; to access global trade and financial
markets; to increase participation in global trade by taking
advantage of the unbundling of production processes
within larger GVCs; and to drive down the costs of trade.
In doing so, technology – especially digital technologies
and new business models that create, exchange and
distribute value – provides untapped new ways of
growing intra-Commonwealth trade and investment,
especially for small states, LDCs and SSA members.
Part 3 of the Commonwealth Trade Review explores the
potential to expand Commonwealth trade by harnessing
new technologies, especially digital technologies.
TA B L E 3 . 1S U M M A RY O F K EY E M E RG I N G T EC H N O LO G I ES B Y E X P ECT E D T I M ES CA L E F O R I M P L E M E N TAT I O N
2–5years 5–10years 10 years+
Machine learning Virtual reality Autonomous vehicles
Software-defined anything Cognitive expert advisors Enterprise taxonomy and ontology management
Natural language question answering Blockchain Brain–computer interface
Blockchain Connected home Human augmentation
Servicisation of cars IoT platform 4D printing
Micro-data centres Smart dust
Source: Various, compiled by MacGregor, 2018
42 \ Commonwealth Trade Review 2018
3.2 Disruptive technologies, trade andjobs
The pace of technological progress
and transformation is unprecedented.
Only 21 general purpose technologies
(GPTs) – defined as single generic
technologies, eventually used widely and
for multiple purposes, which produce
multiple spillover effects – have been
identified in the 11,000-year period to
the end of the 20th century (Lipsey et
al., 2005). Examples include the wheel,
electricity, steamships and the internet.
But no fewer than three new GPTs have
already emerged since 2000, including
nanotechnology, business virtualisation
and AI. Global market penetration of
the core technologies underpinning
digitisation, namely mobile telephony,
the internet and cloud computing, is
occurring at unprecedented speed.
The costs of these technologies are
also declining rapidly at an estimated
rate of over 10 per cent annually,
making them more readily accessible
and available (WeAreSocial, 2017).
Mobile phones are now owned or
used by two-thirds of the world’s
population, almost 5 billion people;
and usage transcends wide disparities
in economic and social status and in
geographical profile. Africa is today
one of the fastest growing ICT markets
in the world, with many countries
‘leapfrogging’ landline telephony to
mobile connectivity. Affordable prices
for handsets and cheaper and better
broadband connections are helping
drive this transformation, resulting in
nearly 700 per cent growth in the mobile
telephone market between 2005 and
2015 (Vickers and Peña-Méndez, 2015).
However, more than 1.7 billion women
in low- and middle-income countries
do not own mobile phones; and a
further gender gap in mobile phone
usage prevents women from reaping
the full benefits of this technology
(GSMA Connected Women, 2015).
Internet access has also accelerated
rapidly. The number of internet users
has more than tripled in a decade – from
1 billion in 2005 to an estimated 3.2
billion at the end of 2015 (World Bank,
2016). It is estimated that 30 per cent of
young people (15–24 years old) in LDCs
are using the internet, and that 35 per
cent of all individuals using the internet
in LDCs are young people (ITU, 2018).
The speed of internet access is also
increasing: in 2016, broadband speed
increased by 2.3 per cent to 6.3 Mbps
(Akamai, 2016). Yet the internet still
remains unavailable to 3.9 billion people
globally, many of whom live in LDCs.
Among the LDCs, only one in six people
currently use the internet (UNCTAD,
2017b). Without universal and affordable
access to the internet, the outlook
for achieving all 17 SDGs is extremely
challenging (UNCTAD, 2017c; ITU, 2018).
B O X 3 .1
E X A M P L E S O F D I G I T I S AT I O N T R A N S FO R M I N G T H E C O M M O N W E A LT H
Five years ago:
… a rural smallholder farmer in Kenya would rely on middlemen and neighbours for information on weather, inputs, finance and prices. Today, digitisation sees rural smallholders using their mobile phones and the internet to connect with traders and access considerably more information from a variety of sources, including accurate local weather data. The result is higher productivity and revenue.
… a rural householder in Bangladesh would probably have relied for energy on paraffin, biomass and occasional diesel generators. Yet widespread government-subsidised solar heating systems for households are increasingly digital and being pooled to form nanogrids, making the households potential prosumers as well as ensuring that payment for energy is activated seamlessly.
… Caribbean and some Pacific islands saw planeloads and shiploads of tourists arriving daily, but less than 5 per cent of the total spend remaining in the destination country. Today, with software apps such as TripAdvisor and Airbnb, the benefits from mass tourism are beginning to genuinely trickle down to the destination.
… sick people living in remote or rural areas in some developed and developing Commonwealth countries, looking for a diagnosis, would have relied on formal healthcare delivered by the government, for which they might have needed to travel – incurring time and travel costs as well as the attendant discomforts. Today, with decentralised models of healthcare, local community representatives and the internet can bring expertise to you in your home, saving people’s money and resources for only the most essential trips.

Part 3: Harnessing digitisation for Commonwealth trade, investment and prosperity \ 43
Cloud computing, or server-based
computing, improves the agility of
businesses by relying on ICT services
provided over the internet, and
promises to reduce costs of software,
hardware, laptops, risk to company
data, and document and data storage.
An explosion in the flow of digital
data, containing flows of information,
searches, communication, video,
transactions and intracompany traffic,
has meant that digital flows now wield
a greater influence on GDP growth
than trade in goods (MGI, 2016b).
Securing the gains from rapidly
evolving new technologies while
navigating their potential disruptive
effects presents a vast challenge for
all Commonwealth member countries,
as well as other countries. Technology
has historically exerted pressure on
jobs, businesses, economic activity
and trade. From the mechanisation of
agriculture to blockchain use in digital
trading transactions, technology
has made some jobs obsolete, and
created anxiety for many more
workers in a range of sectors. On the
one hand, there are many reports
about the demise of jobs owing to
automation; on the other hand, reports
show that, while automation often
replaces human labour, it very rarely
eliminates an entire occupation; for
example, just one of 270 occupations
in the US Labor Census 1950 has
disappeared owing entirely to
automation, namely lift operator
(Bessen, 2016; Kessler, 2017).
Technological innovation will indeed
be key to tackling unemployment,
especially among young people, across
the Commonwealth. The transition
to a digitised economy requires new
investment, jobs and skills, especially
in 4IR-relevant industries. This could
counterbalance the 6–12 per cent
expected automation redundancy, but
would require considerable investment
(Arntz et al., 2016; MacGregor, 2018).
Overall, however, the employment
disruption in Commonwealth
countries – and elsewhere – is
difficult to discern (Box 3.2).
In summary, for many Commonwealth
countries, beyond specific new
technologies in agriculture,
manufacturing and services, digitisation
and the digital technologies that
underpin it have the potential to
transform multiple sectors, using
many business models; and they offer
enormous economic, financial and
developmental benefits. Table 3.2
provides an illustrative example
of the enormous potential across
economic sectors from the application
of digital technologies in India.
3.3 Harnessing digitisation for Commonwealth trade and development
The digitisation of goods and services
offers substantial and largely untapped
opportunities to Commonwealth
small states, LDCs and SSA countries
B O X 3 . 2
T EC H N O LO G I C A L I N N O VAT I O N , A U TO M AT I O N A N D J O B S
In the Commonwealth and elsewhere, technological progress induces both increased and decreased demand for labour. There are small – and possibly positive – effects of technological change on aggregate labour demand and employment, but also evidence of negative effects, with costs often disproportionately borne by certain groups or communities in the form of declining incomes or job losses (WTO, 2017a). For example, technological change has propelled the creation of new industries and the decline of existing ones; precipitated shifts in employment from lower-to higher-productivity industries and sectors; and created new high-value-added employment in new sectors. Yet, through mechanisation, automation and the rapid increase in use of industrial robots, technological change has also replaced labour and reduced demand for labour, particularly in industries in which cognitive or manual tasks can be completed without human intervention. Activities most susceptible to automation involve physical activities in highly structured and predictable environments, as well as the collection and processing of data (e.g. manufacturing, accommodation and food service, and retail trade, and some middle-skill jobs). Key development benefits could include better access to higher-quality, more immediate healthcare, education, information, financial services, leisure activities and commercial opportunities.
Source: MGI, 2017; MacGregor, 2018

44 \ Commonwealth Trade Review 2018
to overcome several barriers to
trade brought about by their lack of
connectivity, high transport costs
and geographical remoteness,
as well as their limited access to
global trade and financial markets.
Many Commonwealth countries
are demonstrating extraordinary
success in identifying, adopting and
implementing these new technologies
to help improve productivity,
competitiveness, growth and exports;
to reduce costs of production and
trade; and to accelerate sustainable
development (e.g. platforms for
delivering education and training,
tele-medicine, e-government
services, and news and information).
Digital trade, where accessible, is
empowering women and young people
as entrepreneurs and traders, allowing
them to access new resources,
to transform their marketing and
distribution processes and to connect
to new suppliers and new markets.
However, if technology is to be truly
transformative, it is imperative to
bridge the gender gap in mobile phone
access and usage, digital connectivity
and employment in ICT sectors in
low- and middle-income countries
(Box 3.3). Some of the more digitally
connected Commonwealth member
countries, such as Australia and the
UK, have experience in developing
inclusive digital strategies. There is an
opportunity for greater knowledge-
sharing within the Commonwealth,
to enable fellow Commonwealth
members to draw on these experiences
to foster and accelerate inclusive and
sustainable development by closing
the digital gender gap and harness
the transformative potential of ICTs
for women’s empowerment.
The section below provides three
examples, among many, of how
Commonwealth countries are already
harnessing transformative technologies
for greater trade, investment and
development: digital trade and
e-commerce, fintech, and enhancing
productive and trade capacities.
3.3.1 Digital trade and e-commerce
Global e-commerce is expanding
rapidly, removing barriers to
transactions in goods and services,
driving down cross-border transaction
costs, transforming distribution and
consumption systems and catalysing
new GVCs. Business-to-business
(B2B) e-commerce alone – hence
excluding e-commerce conducted
with and between either governments
or individuals – is estimated to have
exceeded US$25 trillion (domestic and
cross-border) in 2015 (UNCTAD, 2017b).
Table 3.3 presents the first-ever
estimate of business-to-consumer
(B2C) e-commerce sales in
the Commonwealth. In 2015,
Commonwealth member countries
TA B L E 3 . 2D I G I TA L T EC H N O LO GY: EST I M AT E D B E N E F I TS TO T H E I N D I A N ECO N O M Y
Sector Technology Evolving business modelEstimatedbenefitsto2025,profile(2014 US$)
Agriculture Mobile technology, internet, digital payments, extension services over internet
Information on market prices and extension increasing production and reducing post-harvest losses
Improved incomes for 100 million people, improved nutrition to 300–400 million people, US$45–80 billion
Finance Blockchain, mobile technology
Disintermediation, improved financial access and (through Aadhaar digital biometric identity) facilitated financial access
Higher productivity, higher incomes, US$32–140 billion
Energy IoT, mobile technology Smart metering Electrification, improved investment, greater efficiency, less redundancy, US$50–95 billion
Healthcare Mobile technology, internet Remote health services, digitally enabled healthcare workers, who can tap expert systems
Improved healthcare provision to 400 million people, US$25–65 billion
Education Internet Information access through massive open online courses and other approaches to education through the internet
Higher productivity through better educated workforce, US$60–90 billion
Source: MGI, 2014; MacGregor, 2018

Part 3: Harnessing digitisation for Commonwealth trade, investment and prosperity \ 45
generated around US$354 billion in
sales, representing 3.5 per cent of GDP.2
With only 144 million online shoppers –
or 6 per cent of the Commonwealth’s
population – there appears to be
some potential to increase both
domestic and cross-border sales
in the future, especially by tapping
into a large and dynamic diasporic
community. In developing countries,
particularly in Asia and Africa, B2C
e-commerce is expanding rapidly
(Baker, 2017).3 However, expanding
e-commerce in the Commonwealth
will require significant investment
in digitisation, vastly improved
distribution and delivery systems, and
tackling the range of policy, regulatory,
infrastructure, educational and cultural
constraints that stifle the transition
from analogue to digital economies.
B O X 3 . 3
TA C K L I N G T H E ‘ D O U B L E D I G I TA L D I V I D E ’ C O N F R O N T I N G W O M E N
Despite the potential opportunities unleashed by new technologies, there remains a significant gender disparity between women and men in mobile phone access and usage, digital connectivity and participation in the digital economy.
Women on average are 14 per cent less likely to own a mobile phone than men, which translates into 200 million fewer women than men owning mobile phones in low- and middle-income countries; and this gender gap in mobile phone ownership is most pronounced in South Asia (GSMA Connected Women, 2015). The impact on women’s empowerment is significant, since various surveys suggest that mobile phones can help women feel safer and more connected, save time and enable access to key services such as mobile money, health information or potential education and employment opportunities (ibid).
Mobile technology can also empower women as entrepreneurs in both the formal and the informal economies. For example, vulnerable cross-border traders in many Commonwealth developing countries, particularly women, have limited market information and face multiple barriers to trade, and mobile technology provides them with greater personal security in making payments and receiving money electronically and without the need to carry cash. It also reduces uncertainty and loss of time, by providing mobile-enabled updated market price, customs, tariff and other information related to border procedures.
Digital connectivity is especially a challenge in LDCs, where women are 31 per cent less likely than men to be connected (ONE, 2016; EIU, 2017). According to GSMA Connected Women (2015), closing the 14 per cent gap in women’s mobile access worldwide could unlock an estimated US$170 billion market opportunity for the mobile industry from 2015 to 2020, bringing growth and prosperity to many households.
Women are underrepresented in the digital economy (ITU, 2017). About 100 million people worldwide are employed in ICT services, which provide relatively well-remunerated employment for women. However, the share of women in ICT specialist occupations remains very low, especially in developing countries (UNCTAD, 2017b). A report by PLAN (2018) lays bare the inequality in the digital economy, with fewer than a quarter of employees in ICT being female.
TA B L E 3 . 3B 2 C E- CO M M E RC E SA L ES I N CO M M O N W E A LT H CO U N T R I ES, 2 0 1 5
Country B2C e-commerce, 2015 Online shoppers, 2015
US$ billion % of GDP Million % of population
United Kingdoma 199.8 7.0 39.4 60
Indiab 19.6 0.9 28.2 2
Canadac 47.9 3.1 13.5 37
Australiad 27.8 2.1 9.7 40
Singaporee 2.7 0.9 2.2 40
Malaysiaf 1.5 0.5 2.6 8
Six above 299.3 3.5 95.6 6
Estimate for the Commonwealth
354.0 3.5 144.0 6
aB2C includes small enterprises, source: ONSbB2C, source: IAMAI and IMRB. Shoppers refer to 2014, source: PewcB2C refers to 2013 and shoppers to 2012, source: Statistics CanadadB2C, source: UNCTAD estimate based on ABS data. Shoppers, last 3 months, source: ABSeB2C refers to 2014, source: Singapore Post. Shoppers, source: Statistics SingaporefB2C refers to 2014, source: MITI. Shoppers, source: DOS
Source: UNCTAD estimates based on data from the sources cited in the footnotes

46 \ Commonwealth Trade Review 2018
Deeper analysis of the data reveals
the magnitude of this challenge: six
Commonwealth countries account for
around 85 per cent of B2C e-commerce
sales, while the other members generated
only US$54.7 billion in 2015. Although an
increasing number of Commonwealth
citizens are online, this is often for social
media and entertainment rather than
commercial purposes. Many small states,
LDCs and SSA countries still have a long
way to go to catch up and improve their
e-commerce ecosystems to benefit
from new digital trade opportunities. This
includes reducing the costs of broadband
and increasing access to it; accelerating
access to affordable and accessible energy,
mobile finance and ICT technologies;
increasing technology-related education
and skills development and strengthening
human resource capacities and
technical skills in information-intensive
activities; expanding technological
research and development, including
through closer collaboration between
government, industry and the scientific
and educational sector; and establishing
a supportive and strengthened regulatory
and legal framework for transacting
e-commerce and payments.
Bilateral donors and multilateral
agencies have a key role to play in
providing technical and financial
assistance to help achieve the SDG
target of providing universal and
affordable access to the internet in LDCs
by 2020 – and, by extension, helping
improve the e-commerce ecosystem.
Through the WTO’s Work Programme
on e-commerce, the Commonwealth
can advocate reduced trade barriers
to e-commerce affecting developing
country exporters and the provision
of technical assistance and capacity-
building for the poorest countries.
It can support the establishment
of an Aid-for-e-Trade initiative to
support developing countries in their
initiatives to access the burgeoning
e-commerce ecosystem. The WTO’s
expanded Information Technology
Agreement (ITA) could potentially
also help Commonwealth member
countries access more affordable
information technology products and
equipment to enable greater digital
connectivity and commerce (Box 3.4).
3.3.2 Fintechandfinancialinnovation
Several Commonwealth member
countries, both developed and
developing, are global leaders, pioneers
and innovators in the fintech sector.
Fintech offers significant potential to
enhance efficiencies, reduce costs,
enable more effective risk management
and expand access to financial services
across a range of different areas,
including lending, payments, personal
finance, money transfer and insurance.
Global fintech investments increased
from US$2.5 billion in 2012 to over
$17 billion in 2016. Investment in Asia
represents half of investment, followed
by the traditional fintech ‘hubs’ of
North America and Europe, including
the UK, while Canada and Australia
play an increasingly important role
(Rutherford and Zaman, 2017). People
and organisations in Commonwealth
member countries – from central banks
and regulators to the public and private
sectors, including young entrepreneurs
Digital trade in the Commonwealth in 2015
Improvements in digitisation, infrastructure, logistics andregulation can trigger further opportunities
Source: UNCTAD estimates
Total B2C salesUS$354 billion
Percentageof population
6%
Percentageof GDP
3.5%
Onlineshoppers
144 million

Part 3: Harnessing digitisation for Commonwealth trade, investment and prosperity \ 47
and tech start-ups – are engaging with
the fintech sector in a number of ways.
Almost a half of Commonwealth
citizens have no access to basic banking
services, including 927 million citizens
in Asia and almost 300 million in Africa
(MacGregor, 2018). However, mobile
technologies and the development
of mobile money systems, which
store money in the national currency
as credit on smart cards, and enable
payments online or through mobile
phones, are now transforming access
to finance, enabling the unbanked
to hold or save cash electronically,
improving the array of banking
services and underpinning all pay-
as-you-go services and applications;
these include energy payments for
households and MSMEs, transport
and healthcare provision. Kenya’s
M-Pesa system has led the mobile
money phenomenon to the point of
becoming a global benchmark (Box 3.5).
Fintech, including blockchain and
digital currencies, have been flagged
as possible solutions to de-risking,
which continues to affect a range of
Commonwealth members, particularly
small states in the Caribbean and
Pacific. For example, there have been
proposals to use a blockchain-based
settlement framework to improve
the surveillance of transactions
and even to bypass the need for
correspondent banks altogether
(Rutherford and Zaman, 2017).
With several member countries at the
forefront of global fintech innovation
and implementation, including some
SSA member countries, there is
an opportunity for greater sharing
of knowledge, information and
experiences among Commonwealth
members. Strengthening partnerships
with the private sector, including
young entrepreneurs and tech start-
ups, can accelerate the provision of
financial services in new and inclusive
ways. Commonwealth members,
individually and collectively, can
deploy a ‘regulatory sandbox’ as
a safe environment for financial
institutions and fintech start-ups
to experiment with innovative
financial products or services; and
promoting wider pan-Commonwealth
collaboration through ‘innovation
hubs’ could also deliver great gains.
3.3.3 Enhancing productive and trade capacities
Technological innovations and
applications can help overcome some
of the constraints to building and
transforming productive capabilities
in many small states, LDCs and SSA
countries. Productive capacity is the
fundamental determinant of what a
country is able to produce competitively
and trade in internationally, including
with other Commonwealth members.
While there are many factors that
determine or could enhance a
country’s productive capacity, and
many fall well outside the boundaries
of trade or trade-related policy,5
four examples briefly highlight the
contribution of transformative
technologies in energy, agriculture,
the oceans economy and tourism.
B O X 3 . 4
ACCESSINGTRADE-ENABLINGTECHNOLOGIES:AROLEFORTHEWTO’SINFORMATIONTECHNOLOGYAGREEMENT?
Since 2015, there has been progress to expand multilateral efforts to widen access to IT products, among others by reducing and eliminating tariffs on these products. The ITA is a plurilateral agreement operating under the aegis of the WTO. It was originally concluded by 29 participants in the WTO’s First Ministerial Conference in Singapore in 1996. Since its conclusion, the number of participants has grown to 82 countries, including 11 Commonwealth members,4 representing about 97 per cent of world trade in IT products. Participants are committed to completely eliminating tariffs on IT products covered by the Agreement.
The WTO’s 10th Ministerial Conference in Nairobi in 2015 made further progress, with over 50 members agreeing to an expansion of the Agreement, which now covers an additional 201 products valued at over US$1.3 trillion per year. The initiative has been successful; the WTO’s report on G20 trade measures, issued in November 2017, estimates that the additional import-facilitating measures implemented in the context of the expanded ITA are worth approximately $300 billion.
Source: Commonwealth Secretariat

48 \ Commonwealth Trade Review 2018
Power generation and renewable energy
Power shortages are seen as one
of the most critical impediments
to developing productive and trade
capacities further. While electrification is
comprehensive in Commonwealth
developed country members, only 24
per cent of citizens in Pacific member
countries and 43 per cent of citizens in
SSA have access to electricity. Across the
Commonwealth some 675 million people
or 28 per cent of all Commonwealth
citizens have no access to electricity,
including 301 million people in Africa and
365 million in Asia (MacGregor, 2018).
Renewable energy is growing at an
unprecedented pace globally, with
solar photovoltaic capacity expanding
from 6 GW in 2006 to 303 GW in 2016
(MacGregor, 2018). New models of
distributed renewable energy (DRE),
leveraging technological breakthroughs
enabling mass production of solar
photovoltaics and improvements in battery
storage capacity, are quickly bypassing and
complementing existing electricity grid
infrastructure, bringing access to reliable,
cheap and clean energy to households, to
the rural and urban poor and to previously
off-grid communities in remote areas.
Globally, DRE is expected to deliver 70 per
cent of all new rural electricity connections
by 2030 (IEA and World Bank, 2014).
Commonwealth countries are global
leaders in adoption and innovative
application of these technologies.
Many Pacific members, for example,
are rapidly shifting from dependence
on fossil fuel to renewable energy; and
Tuvalu has set the goal of becoming
entirely dependent on renewable energy
by 2020. If this target is met, Tuvalu will
become the first country in the world
to achieve this goal. In South Asia,
India’s commitment to have 40 per cent
renewable energy in 2030 is expected to
be surpassed by 2025; and Bangladesh
is now the world’s largest market for
solar home systems. Several other
Commonwealth developing countries,
including Guyana, India, Kenya, Tanzania
and Uganda, are rapidly expanding
small-scale renewable systems,
including nano- and microgrids.
Agriculture
Digital technologies, including
blockchains, are transforming agricultural
production, marketing and productivity
across the Commonwealth, empowering
small farmers, enabling connectivity to
agricultural value chains, removing loss
of value through intermediaries, allowing
the development of international and
local trading platforms, and bringing
access to previously inaccessible
information and services, including
commodity information, weather
services and agricultural insurance.
For example, the digital application of
weather insurance helps farmers in East
Africa take averting measures against
episodic shocks (e.g. hailstorms), and
will provide financial assistance when
problems occur. In India, precision
farming (using sensors and geographic
information system-based soil, weather
and water data to guide farming
decisions) and mobile internet-based
farm extension and market information
services are significantly increasing
value in this sector (MGI, 2014).
B O X 3 . 5
C O M M O N W E A LT H S S A M E M B E R S A S G LO B A L L E A D E R S I N F I N T EC H
Mobile technology plays a crucial role in promoting financial inclusion in Africa, where fewer than 20 per cent of households have access to formal financial services. M-Pesa (‘M’ for ‘mobile’, and ‘pesa’ is Swahili for ‘money’) is a Kenyan mobile phone-based money transfer, financing and microfinancing service operated by Safaricom. M-Pesa allows users to deposit, withdraw and transfer money and pay for goods and services easily with a mobile device. The service was established in 2007 with the support of a grant from the UK DFID. Ten years later, M-Pesa had nearly 30 million users in 10 countries, including several Commonwealth member countries: Ghana, India, Lesotho, Mozambique and Tanzania. M-Pesa has also played a major part in bridging the gender gap in mobile ownership in Kenya, which has decreased to only 7 per cent.
Rwanda envisions becoming a cashless economy by 2020, and all government financial transactions being done electronically and via mobile phones by the end of 2018. There are three major mobile operators in Rwanda – MTN, Tigo and Airtel – and they have all successfully launched payments and remittance services (domestic and international) for their customers. It is estimated that there are more than 300 fintech start-ups in Africa. Kenya, Nigeria and South Africa are at the forefront of this start-up activity. Nairobi and envisaged technology hubs such as Konza Techno City, currently under construction using smart city planning principles, are fast gaining a reputation as Africa’s ‘Silicon Savannah’.
Sources: Vickers and Peña-Méndez, 2015; Joseph, 2017; Rutherford and Zaman, 2017

Part 3: Harnessing digitisation for Commonwealth trade, investment and prosperity \ 49
Oceans economy
With the large number of
Commonwealth small and coastal
states, new initiatives are also needed
to access many other digital, satellite
and remote-sensing technologies
that support sustainable development
of the fisheries and other oceans
economy sectors. These include
floating offshore marine cage
operations and submersible nets;
remote monitoring and intelligent
processing of fish stocks; satellite
technologies that enhance maritime
surveillance, detect and respond to
illegal, undisclosed and unreported
fishing and enable traceability
of fish breeds and stocks; and
transport and logistics infrastructure
to ensure rapid transport of
processed fish to global markets.
Globally, ocean renewable energy
technologies are also proliferating.
Several Commonwealth small states
are pioneering energy generation
from these sources, including
Seychelles through wind and solar
energy, and Mauritius through deep
ocean electricity generation.
Tourism
Commonwealth and other SIDS derive
over 30 per cent of employment and
between one-fifth and half of their
GDPs from tourism (UNCTAD, 2014);
and tourism accounts for almost a
half of small states’ services exports.
Digital technologies, including the
development of call centres and
data-processing facilities, are all
enabling Commonwealth developing
countries and small states to expand
the tourism value chain by supporting
travel organisation and booking,
transport, accommodation, food and
beverage provision, the development
of niche craft industries and promotion
of cultural and natural assets.
Expanding the use of these
technologies is also enabling the
expansion of tourism value chains
to include new backward linkages
within traditional and emerging
sectors in the domestic economy,
including agriculture, fisheries,
environmental and oceans economy
activities, for example by sourcing
high-quality agricultural produce,
fish, crustaceans and molluscs for
the domestic tourism industry from
local sources; through conference
and events management; and by
developing new niche tourism markets,
including ecotourism, environmental
tourism and marine-based tourism.
3.4 Overcoming technology gaps in the Commonwealth
Despite the extensive opportunities
and potential gains from digital
technology, evidence from across
the Commonwealth suggests there
remain significant gaps in access to
critical enabling technologies in many
member countries, and that there is
wide divergence in the membership in
access to and use of these technologies
(MGI, 2016b). While the populations of
developed Commonwealth countries
have access to high-speed internet
and reliable electricity, this is not
the case for most Commonwealth
developing countries, especially small
states, LDCs and SSA. The latter
countries experience internet speeds
approximately a third of the average in
developed member countries; and most
have lower levels of internet access
than the global average: SSA (33 per
cent), South Asia (24 per cent) and the
Pacific (15 per cent). The sections below
briefly outline the challenges of access
to and speed of the internet, as well
as internet infrastructure investment
in Commonwealth countries.
3.4.1 Access to the internet
The Commonwealth has a lower level of
internet access than the global average
(per capita), as well as some of the
largest offline populations (by country).
On average, internet usage across all
Commonwealth countries is 30 per cent,
which is substantially lower than the global
average of 50 per cent (Figure 3.1). This
partly reflects the challenge of providing
access in Commonwealth developing
countries with large populations,
especially rural and remote communities,
including Bangladesh, India, Pakistan and
Nigeria. There are also stark differences
both between developed and developing
Commonwealth members and across
the Commonwealth regions.
3.4.2 Speed of internet access
Access to the internet is a critical
enabling technology, providing
the foundational technological
platform for e-commerce, ICT, social
networking and myriad other activities.
Speed of access is also crucial.
Figure 3.2 depicts comparative
data on speed of internet access in
Commonwealth members, by country.
It illustrates that internet speeds are
lowest among the Commonwealth’s
Pacific and SSA members, but also
highlights that several Commonwealth
developing countries, including Kenya,
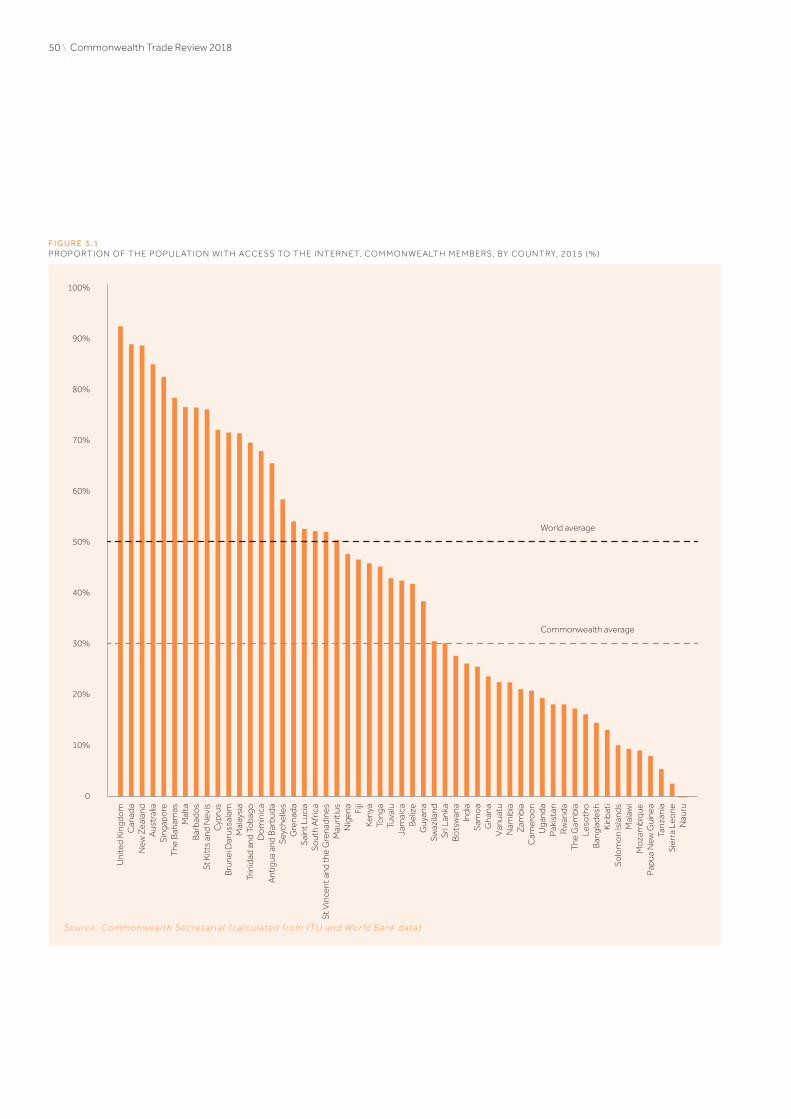
50 \ Commonwealth Trade Review 2018
Uni
ted
Kin
gdo
mC
anad
aN
ew Z
eala
ndA
ustr
alia
Sin
gapo
reT
he B
aham
asM
alta
Bar
bado
sSt
Kitt
s an
d N
evis
Cyp
rus
Bru
nei D
arus
sala
mM
alay
sia
Trin
idad
and
To
bago
Do
min
ica
Ant
igua
and
Bar
buda
Seyc
helle
sG
rena
daS
aint
Luc
iaS
out
h A
fric
aSt
Vin
cent
and
the
Gre
nadi
nes
Mau
ritiu
sN
iger
ia Fiji
Ken
yaTo
nga
Tuva
luJa
mai
caB
eliz
eG
uyan
aSw
azila
ndSr
i Lan
kaB
ots
wan
aIn
dia
Sam
oa
Gha
naV
anua
tuN
amib
iaZ
ambi
aC
amer
oo
nU
gand
aP
akis
tan
Rw
anda
The
Gam
bia
Leso
tho
Ban
glad
esh
Kiri
bati
So
lom
on
Isla
nds
Mal
awi
Moz
ambi
que
Pap
ua N
ew G
uine
aTa
nzan
iaS
ierr
a Le
one
Nau
ru
100%
90%
80%
70%
60%
50%
40%
30%
20%
10%
0
Commonwealth average
World average
S o u rce : Co m m o nw e a l t h S e c re t a r i at (c a l c u l ate d f ro m I T U a n d Wo r l d B a n k d at a )
F I G U R E 3 . 1P RO P O RT I O N O F T H E P O P U L AT I O N W I T H ACC ESS TO T H E I N T E R N ET, CO M M O N W E A LT H M E M B E RS, B Y CO U N T RY, 2 0 1 5 ( % )
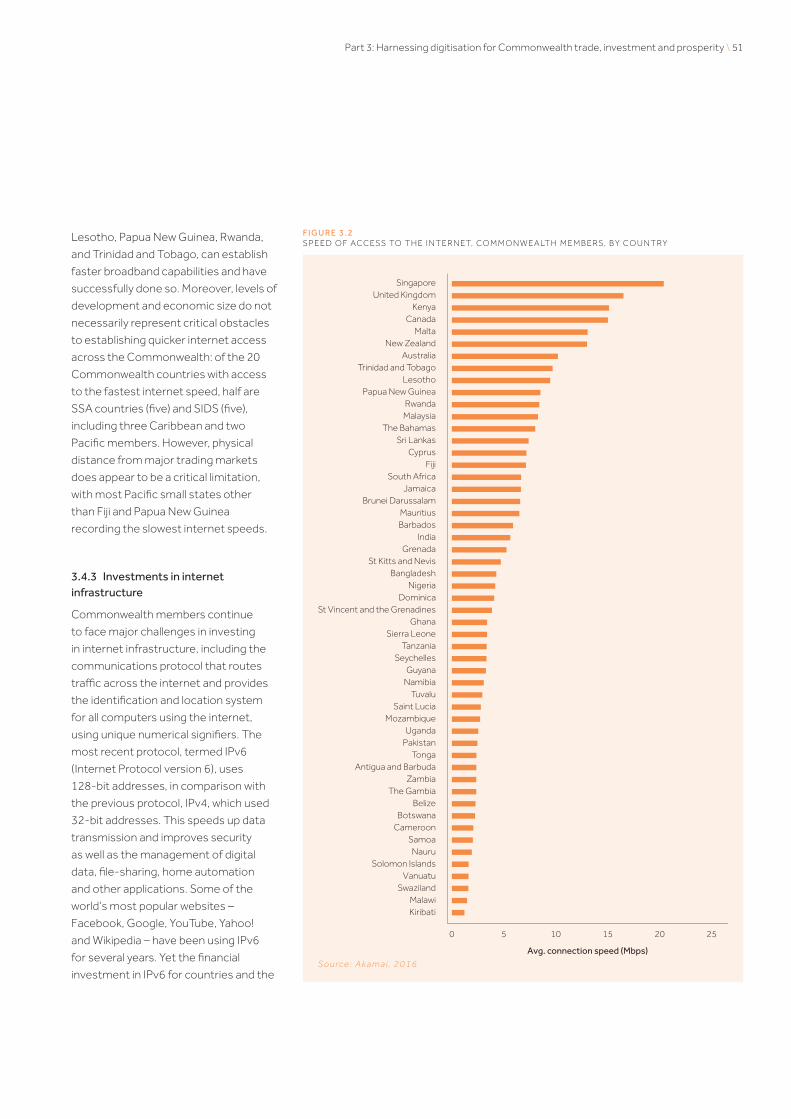
Part 3: Harnessing digitisation for Commonwealth trade, investment and prosperity \ 51
Lesotho, Papua New Guinea, Rwanda,
and Trinidad and Tobago, can establish
faster broadband capabilities and have
successfully done so. Moreover, levels of
development and economic size do not
necessarily represent critical obstacles
to establishing quicker internet access
across the Commonwealth: of the 20
Commonwealth countries with access
to the fastest internet speed, half are
SSA countries (five) and SIDS (five),
including three Caribbean and two
Pacific members. However, physical
distance from major trading markets
does appear to be a critical limitation,
with most Pacific small states other
than Fiji and Papua New Guinea
recording the slowest internet speeds.
3.4.3 Investments in internet infrastructure
Commonwealth members continue
to face major challenges in investing
in internet infrastructure, including the
communications protocol that routes
traffic across the internet and provides
the identification and location system
for all computers using the internet,
using unique numerical signifiers. The
most recent protocol, termed IPv6
(Internet Protocol version 6), uses
128-bit addresses, in comparison with
the previous protocol, IPv4, which used
32-bit addresses. This speeds up data
transmission and improves security
as well as the management of digital
data, file-sharing, home automation
and other applications. Some of the
world’s most popular websites –
Facebook, Google, YouTube, Yahoo!
and Wikipedia – have been using IPv6
for several years. Yet the financial
investment in IPv6 for countries and the
SingaporeUnited Kingdom
KenyaCanada
MaltaNew Zealand
AustraliaTrinidad and Tobago
LesothoPapua New Guinea
RwandaMalaysia
The BahamasSri Lankas
CyprusFiji
South AfricaJamaica
Brunei DarussalamMauritiusBarbados
IndiaGrenada
St Kitts and NevisBangladesh
NigeriaDominica
St Vincent and the GrenadinesGhana
Sierra LeoneTanzania
SeychellesGuyana
NamibiaTuvalu
Saint LuciaMozambique
UgandaPakistan
TongaAntigua and Barbuda
ZambiaThe Gambia
BelizeBotswana
CameroonSamoa
NauruSolomon Islands
VanuatuSwaziland
MalawiKiribati
0 5
Avg. connection speed (Mbps)
10 15 20 25
S o u rce : A ka m a i , 2 0 1 6
F I G U R E 3 . 2S P E E D O F ACC ESS TO T H E I N T E R N ET, CO M M O N W E A LT H M E M B E RS, B Y CO U N T RY

52 \ Commonwealth Trade Review 2018
private sector is not trivial. It includes
upgrading hardware and switching
routers and servers to either dual-
stacked servers or full IPv6, and having
access to the professional and technical
skills of IPv6 certified engineers.
While investment in IPv6 connections
is expanding globally, Commonwealth
uptake of this new protocol technology
has been slow. Only 11 members have
taken substantive steps to adopt IPv6
(Table 3.4). Like the constraints on
increasing internet speed, countries’
levels of development or sizes do not
appear to be binding limitations to
adoption of the new protocol: three
SSA members are among the ten
Commonwealth countries using the new
protocol, and, among all Commonwealth
countries, Trinidad and Tobago has
led this process, with almost a fifth of
internet users now utilising this protocol
for their internet connections.
3.5 Closing the gaps: implications for growth and development
Successfully closing technology
gaps across the Commonwealth
offers enormous potential for growth
and, by implication, greater intra-
Commonwealth trade and investment
flows. Several multicountry studies
suggest that each 10 per cent increase
in broadband penetration increases
GDP growth by 0.9–3.19 per cent, on
average (Quiang et al., 2009; Czernich
et al., 2011; Scott, 2012; Zaballos and
Lopez-Rivas, 2012). When applied
across the Commonwealth as a whole,
the implications are extraordinary.
The GDP of Commonwealth countries
adds up to approximately US$10
trillion. Table 3.5 reveals the expected
GDP impact if all Commonwealth
countries increased their broadband
penetration to 50, 75 or 100 per cent,
making two assumptions: access is
broadband, whether mobile or fixed;
and GDP across all countries reacts
similarly (i.e. no thresholds exist). To
analyse the effect of improvements
in broadband penetration, three
scenarios are considered and the
results reported in MacGregor (2018):
Scenario I: All Commonwealth
countries achieve a minimum level of
broadband penetration of 50 per cent
of the population, equivalent to the
world average, which would necessitate
TA B L E 3 . 4I P V 6 A D O P T I O N I N CO M M O N W E A LT H M E M B E RS ( 2 0 1 7 ) ( % O F I N T E R N ET U S E )
CountriesIPv6 adoption (% of total
internet use)Estimated population
served
Trinidad and Tobago 19.0 179,463
India 16.7 57,609,724
United Kingdom 12.5 7,487,806
Canada 12.1 3,884,410
New Zealand 10.9 439,002
Malaysia 10.4 2,272,747
Australia 4.6 945,580
South Africa 0.5 142,723
Tanzania 0.2 5,907
Cyprus 0.1 844
Kenya 0.1 21,557
All other members 0.0 2,139
Total Commonwealth 10% 72,991,902
Source: Akamai, 2016; Cisco, 2017; WeAreSocial, 2017; World Bank, 2017a
TA B L E 3 . 5I N C R E AS I N G B ROA D B A N D CO V E RAG E : I M P L I CAT I O N S F O R CO M M O N W E A LT H G D P
% increase in GDP for each 10%
broadband (BB) increase
Scenario I: 50% BB
(US$ billion)
Scenario II: 75% BB
(US$ billion)
Scenario III: 100% BB
(US$ billion)
Scenario IV: <50% double BB, 100% BB if >50%
(US$ billion)
0.90 74 163 317
1.38 114 250 486
3.19 263 577 1,124 598
Source: MacGregor, 2018

Part 3: Harnessing digitisation for Commonwealth trade, investment and prosperity \ 53
some 32 member countries catching
up to meet this threshold. This would
increase Commonwealth GDP between
US$74 billion and $263 billion.
Scenario II: All Commonwealth
members achieve 75 per cent
broadband penetration, which would
require 44 countries catching up to
this threshold. This would increase
Commonwealth GDP between
US$163 billion and $577 billion.
Scenario III: All Commonwealth
countries achieve 100 per cent
broadband penetration. This would
increase Commonwealth GDP between
US$317 billion and $1.1 trillion.
While Scenario III might be
regarded as unrealistic, since no
members currently achieve this
standard, it provides an important
perspective on gains that can be obtained
from digitisation: adding up to US$1
trillion to the GDP of the Commonwealth
annually. Scenario I, on the other hand,
can be considered a more rational
target for Commonwealth developing
countries, especially since the
international community has
committed to strive to provide
universal and affordable access to the
internet in LDCs by 2020, although
many challenges persist (ITU, 2018).
The GDP impact for individual
Commonwealth member countries
is presented in Annex 3.1.
From a policy perspective, the most
pragmatic approach and target would
be for the 32 Commonwealth countries
below the world average to commit to
a doubling of their present broadband
coverage, while countries over 50 per
cent would work towards full universal
broadband penetration. This would
contribute around US$600 billion
to the GDP of the Commonwealth
(see Annex 3.1 Scenario IV).
Similarly, there is potential to significantly
increase the Commonwealth’s collective
GDP by achieving increased broadband
speed. The average broadband speed
among Commonwealth members is
5.7 Mbps while the global average is
6.3 Mbps (Czernich et al., 2011). A study
of OECD countries suggests that a
doubling of broadband speed can add 0.3
percentage points to GDP growth, while
similar studies for China and Brazil suggest
that the impacts on GDP are higher, at 2.2
and 4.7 percentage points, respectively
(ITU, 2012; Rohman and Bohlin, 2012).
Applied to all Commonwealth countries,
this suggests that investments in
internet speed could add US$4 billion
to $444 billion to the GDP of the
Commonwealth annually (Table 3.6). The
GDP impact for individual Commonwealth
member countries is presented
in Annex 3.2.
Achieving both increased
broadband penetration and
increased speed can also significantly
enhance employment (Kelly and
Rossotto, 2012). For the German
economy, for example, achieving
these goals is estimated to increase
employment by 960,000 people and
output by more than €170 billion (Katz
et al., 2010). A similar study of African
countries suggests that improving both
broadband penetration and speed can
add 1.3 million direct jobs and 2.4 million
indirect jobs and contribute 6.7 per
cent to African GDP (GSMA, 2016).
3.8 Conclusion and way forward
Many Commonwealth countries
are leveraging the catalytic role of
technology to help improve productivity,
competitiveness, growth and exports;
to reduce costs of production and
trade; and to accelerate sustainable
development. These technologies
are slowly breaking down constraints
owing to limited size, concentration of
production, limited diversification, lack
of interconnectedness, remoteness
and inability to achieve a presence
in both established and emerging
regional and GVCs. But much more
can be done by Commonwealth
members, individually and collectively,
to further leverage technology’s
transformative potential to enhance
Commonwealth trade and investment
and to accelerate access to new
TA B L E 3 . 6P ROJ ECT E D I N C R E AS E I N G D P AC RO SS T H E CO M M O N W E A LT H F RO M I M P RO V E D B ROA D B A N D S P E E D, 2 0 1 7 ( U S $ B I L L I O N )
Speed (Mbps)
GDP increase (US$ billion)
0.3% 2.2% 4.7%
6.3 4 30 65
9 11 80 170
15 28 208 444
Source: MacGregor, 2018

54 \ Commonwealth Trade Review 2018
technologies, particularly among the
poorest, smallest and most vulnerable
Commonwealth members.
The Commonwealth as a whole
can also play a catalytic role,
through several initiatives. First,
a new Commonwealth initiative
can help promote much wider
sharing of country knowledge
and experience of the gains
from digital technologies; and to
share knowledge of emerging
new technologies for sustainable
development and the impacts
these are having in transforming
growth, trade and development.
Second, the Commonwealth
could consider establishing a
Commonwealth Digital Readiness
Framework and an e-Readiness
Framework, to help identify limitations
and constraints on the wider diffusion
and adoption of technologies
that can foster greater digital
connectivity and e-commerce.
Third, new momentum can be
given to Commonwealth global
advocacy, especially emphasising
the particular transformative role
of technology in accelerating the
more equitable participation of
developing countries in global trade,
and the need to accelerate access
to trade-enabling technologies.
Commonwealth advocacy
can encourage multilateral agencies
to accelerate technical and financial
assistance to help Commonwealth
and other LDCs achieve universal
and affordable access to
the internet by 2020.

Part 3: Harnessing digitisation for Commonwealth trade, investment and prosperity \ 55
Annexes
A N N E X 3 . 1P ROJ ECT E D I N C R E AS E I N G D P ( U S $ M I L L I O N ) AC RO SS CO M M O N W E A LT H ( AG A I N ST C U R R E N T DATA ) F RO M I N C R E AS E D P E N ET RAT I O N O F B ROA D B A N D TO T H E P O P U L AT I O N ( 3 . 1 9 P E R C E N T )
Commonwealth countries Population
GDP per capita (US$)
Estimated GDP increase (US$)
Scenario I: 50% BB
Scenario II: 75% BB
Scenario III: 100% BB
Scenario IV: <50% double BB, 100%
BB if already >50%
Antigua and Barbuda 92,738 15,626 - 45 161 161
Australia 24,309,330 49,554 - - 59,330 59,330
The Bahamas 392,718 23,037 - - 635 635
Bangladesh 162,910,864 1,359 25,145 42,803 60,461 10,171
Barbados 285,006 16,096 - - 350 350
Belize 366,942 4,811 47 188 329 234
Botswana 2,303,820 6,630 1,096 2,315 3,533 1,340
Brunei Darussalam 428,874 26,582 - 138 1,047 1,047
Cameroon 23,924,407 1,012 2,264 4,194 6,124 1,597
Canada 36,286,378 42,158 - - 56,266 56,266
Cyprus 1,176,598 16,830 - 207 1,787 1,787
Dominica 73,016 7,196 - 12 54 54
Fiji 897,537 5,160 54 424 793 685
The Gambia 2,054,986 473 102 180 257 53
Ghana 28,033,375 1,523 3,612 7,016 10,421 3,197
Grenada 107,327 9,468 - 69 150 150
Guyana 770,610 4,472 130 405 679 420
India 1,326,801,576 1,706 173,295 353,811 534,327 187,737
Jamaica 2,803,362 5,004 348 1,467 2,585 1,889
Kenya 47,251,449 1,493 985 6,610 12,234 10,265
Kiribati 114,405 1,449 20 33 46 7
Lesotho 2,160,309 1,018 238 414 589 113
Malawi 17,749,826 307 707 1,141 1,575 161
Malaysia 30,751,602 9,637 - 3,721 27,356 27,356
Malta 419,615 26,093 - - 832 832
Mauritius 1,277,459 9,522 - 965 1,935 1,935
Mozambique 28,751,362 383 1,441 2,319 3,198 316
Namibia 2,513,981 4,084 907 1,726 2,545 731
Nauru 10,263 9,944 16 24 33 -
New Zealand 4,565,185 40,528 - - 6,951 6,951
(Continued)

56 \ Commonwealth Trade Review 2018
A N N E X 3 . 1 ( C o n t i n u e d )P ROJ ECT E D I N C R E AS E I N G D P ( U S $ M I L L I O N ) AC RO SS CO M M O N W E A LT H ( AG A I N ST C U R R E N T DATA ) F RO M I N C R E AS E D P E N ET RAT I O N O F B ROA D B A N D TO T H E P O P U L AT I O N ( 3 . 1 9 P E R C E N T )
Commonwealth countries Population
GDP per capita (US$)
Estimated GDP increase (US$)
Scenario I: 50% BB
Scenario II: 75% BB
Scenario III: 100% BB
Scenario IV: <50% double BB, 100%
BB if already >50%
Nigeria 186,987,563 2,166 3,305 35,610 67,915 61,306
Pakistan 192,826,502 1,471 28,956 51,578 74,200 16,288
Papua New Guinea 7,776,115 2,177 2,274 3,624 4,974 427
Rwanda 11,882,766 705 855 1,523 2,191 481
Saint Lucia 186,383 7,397 - 100 210 210
Samoa 97,026 4,040 62 124 187 64
Seychelles 97,026 14,711 - 77 191 191
Sierra Leone 6,592,102 557 556 849 1,141 29
Singapore 5,696,506 52,131 - - 16,954 16,954
Solomon Islands 594,934 2,021 153 249 345 38
South Africa 54,978,907 5,363 - 21,709 45,222 45,222
Sri Lanka 20,810,816 3,908 5,191 11,677 18,162 7,780
St Kitts and Nevis 56,183 16,320 - - 71 71
St Vincent and the Grenadines
109,644 7,030 - 57 119 119
Swaziland 1,304,063 2,858 233 531 828 361
Tanzania 55,155,473 860 6,755 10,538 14,320 810
Tonga 106,915 3,696 6 38 69 57
Trinidad and Tobago 1,364,973 15,377 - 388 2,062 2,062
Tuvalu 9,943 3,442 1 4 6 5
Uganda 40,322,768 633 2,506 4,542 6,578 1,565
United Kingdom 65,111,143 40,222 - - 66,831 66,831
Vanuatu 270,470 2,860 68 130 192 55
Zambia 16,717,332 1,170 1,809 3,368 4,927 1,310
Commonwealth total 263,137 576,938 1,124,275 598,002
Source: MacGregor, 2018
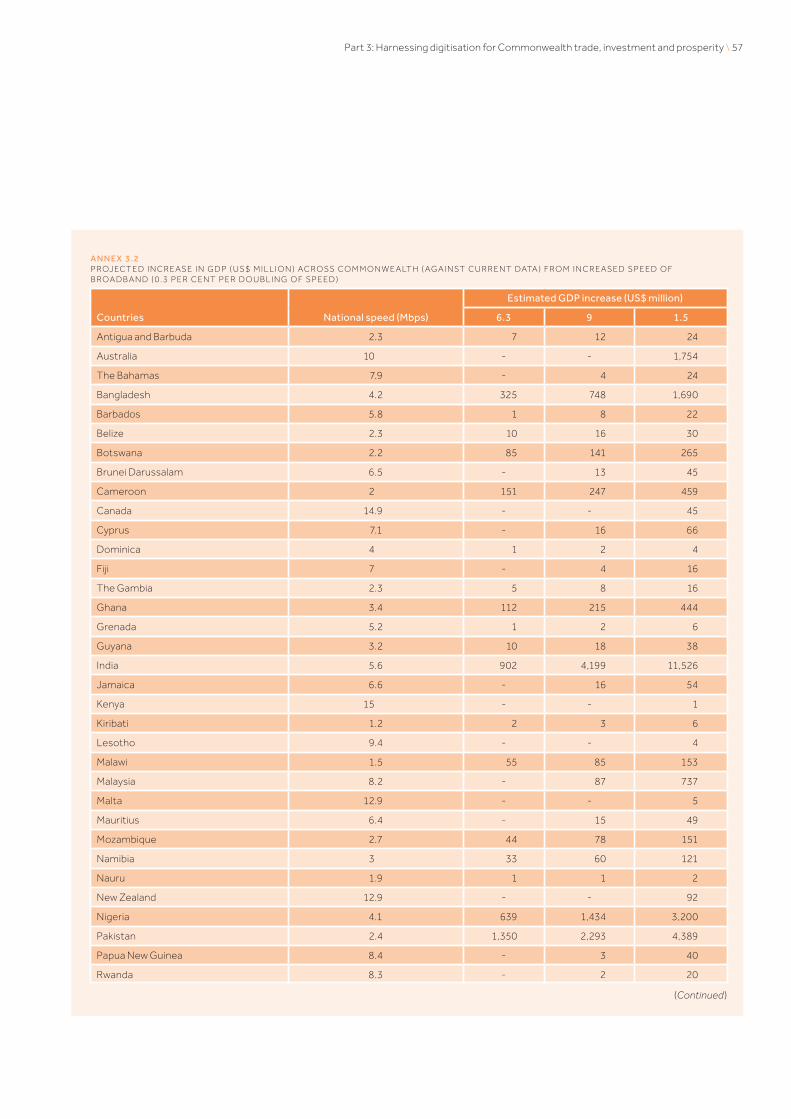
Part 3: Harnessing digitisation for Commonwealth trade, investment and prosperity \ 57
A N N E X 3 . 2P ROJ ECT E D I N C R E AS E I N G D P ( U S $ M I L L I O N ) AC RO SS CO M M O N W E A LT H ( AG A I N ST C U R R E N T DATA ) F RO M I N C R E AS E D S P E E D O F B ROA D B A N D ( 0 . 3 P E R C E N T P E R D O U B L I N G O F S P E E D )
Countries National speed (Mbps)
Estimated GDP increase (US$ million)
6.3 9 1.5
Antigua and Barbuda 2.3 7 12 24
Australia 10 - - 1,754
The Bahamas 7.9 - 4 24
Bangladesh 4.2 325 748 1,690
Barbados 5.8 1 8 22
Belize 2.3 10 16 30
Botswana 2.2 85 141 265
Brunei Darussalam 6.5 - 13 45
Cameroon 2 151 247 459
Canada 14.9 - - 45
Cyprus 7.1 - 16 66
Dominica 4 1 2 4
Fiji 7 - 4 16
The Gambia 2.3 5 8 16
Ghana 3.4 112 215 444
Grenada 5.2 1 2 6
Guyana 3.2 10 18 38
India 5.6 902 4,199 11,526
Jamaica 6.6 - 16 54
Kenya 15 - - 1
Kiribati 1.2 2 3 6
Lesotho 9.4 - - 4
Malawi 1.5 55 85 153
Malaysia 8.2 - 87 737
Malta 12.9 - - 5
Mauritius 6.4 - 15 49
Mozambique 2.7 44 78 151
Namibia 3 33 60 121
Nauru 1.9 1 1 2
New Zealand 12.9 - - 92
Nigeria 4.1 639 1,434 3,200
Pakistan 2.4 1,350 2,293 4,389
Papua New Guinea 8.4 - 3 40
Rwanda 8.3 - 2 20
(Continued)

58 \ Commonwealth Trade Review 2018
A N N E X 3 . 2 ( C o n t i n u e d )P ROJ ECT E D I N C R E AS E I N G D P ( U S $ M I L L I O N ) AC RO SS CO M M O N W E A LT H ( AG A I N ST C U R R E N T DATA ) F RO M I N C R E AS E D S P E E D O F B ROA D B A N D ( 0 . 3 P E R C E N T P E R D O U B L I N G O F S P E E D )
Countries National speed (Mbps)
Estimated GDP increase (US$ million)
6.3 9 1.5
Saint Lucia 2.8 5 9 18
Samoa 2 5 8 15
Seychelles 3.3 4 7 15
Sierra Leone 3.4 10 19 38
Singapore 20 - - -
Solomon Islands 1.6 11 17 30
South Africa 6.6 - 323 1,127
Sri Lanka 7.3 - 57 257
St Kitts and Nevis 4.7 1 3 6
St Vincent and the Grenadines 3.8 2 3 7
Swaziland 1.6 34 53 96
Tanzania 3.3 128 244 501
Tonga 2.4 2 3 6
Trinidad and Tobago 9.6 - - 36
Tuvalu 2.9 0 0 0
Uganda 2.5 115 197 380
United Kingdom 16 - - -
Vanuatu 1.6 7 11 20
Zambia 2.3 100 168 320
Commonwealth total 4,151 10,844 28,354
Source: MacGregor, 2018

Part 3: Harnessing digitisation for Commonwealth trade, investment and prosperity \ 59
Endnotes
1 Similarly, the Istanbul Programme
of Action for the LDCs for the
decade 2011–20 recognises ICT
networks as an infrastructure
priority on a par with water,
electricity and transport.
2 The estimate is based on the top six
economies and then extrapolated
to all Commonwealth members
on the assumption of similar
percentages of population and GDP.
3 One study shows a positive effect
of e-commerce on intra-African
trade, with more than one-third of
Nigerians having purchased goods
from other African countries. South
Africa is the main destination, with
30 per cent of Nigerian cross-border
shoppers buying from the country
compared to Kenya with 2 per cent,
Egypt with 1 per cent and the rest
of the continent with 3 per cent
(Vickers and Peña-Méndez, 2015).
4 The following Commonwealth
members are parties to the
ITA: Australia, Canada, India,
Malaysia, Mauritius, New Zealand,
Singapore and Seychelles, and
Cyprus, Malta and the UK as part
of the European Communities.
5 These include health, education and
skills, social and gender development,
and physical infrastructure (including
transport networks and power
generation), as well as the framework
of laws, institutions and regulations
within which commerce and
investment take place (see Part 4).

Part 4: Deepening the Commonwealth advantage through 21st-century trade governance

The ‘Commonwealth advantage’ is rooted in the historical fabric of institutionalandgovernancetiesthatinfluencecommerce,tradeandinvestmentwithintheCommonwealth.Tradersandinvestorsbenefitfromfamiliar legal and administrative systems, as well as similarities in business, commercial and legislative practice. Part 4 examines how improvements in trade governance can further reduce trade costs and boost intra-Commonwealth trade.
TherearefourmajorfindingswithpolicyimplicationsforCommonwealthmember countries:
• ContractenforcementismoreefficientamongCommonwealthmembers, in general, and requires 20 per cent less time compared to the world average.
• A 10 per cent reduction in the costs incurred for a good to exit a country can increase intra-Commonwealth exports by 5 per cent.
• Every1percentagepointimprovementingovernmenteffectivenesstriggers a greater increase in exports from Commonwealth traders, at 3.4 per cent, compared to the rest of the world, at 2.4 per cent.
• Trade between Commonwealth members is more than three times higher when they belong to an existing regional trade agreement, highlightingtheimportanceofeffectiveregionalintegrationforboostingthe Commonwealth advantage.

Commonwealth courts generally take
20% lesstime than the world average
to enforce contracts… boosting business and
investor confidence
For exporters, lowering transaction costs by
Can increase intra-Commonwealth exports
42 out of 49* Commonwealth WTO members have ratified the Trade Facilitation Agreement*By the end of February 2018
10% 5%

4.1 Introduction
The Commonwealth is not a formal trading bloc, yet there is
evidence to suggest that the 53 Commonwealth members
enjoy an important trade advantage. Commonwealth
members on average tend to trade more between
themselves (about 20 per cent more considering goods
and services together) and generate more FDI flows (10 per
cent more), while bilateral trade costs are estimated to be
19 per cent less, on average (Commonwealth Secretariat,
2015). And, as demonstrated in Part 2, Commonwealth
countries, on average, tend to be less protectionist
towards each other and also less protectionist towards
the rest of the world, having applied fewer harmful
trade-restrictive measures since the global crisis.
Several factors contribute to the Commonwealth
advantage. Among them is an enormous historical
fabric of institutional and governance ties that
influence intra-Commonwealth commerce, trade and
investment. Leveraging these linkages and bonds offers
an immense comparative advantage and opportunity
for Commonwealth members to further drive down
intra-Commonwealth trade costs and to expand
intra-Commonwealth trade and investment.
Traders and investors within the Commonwealth already
benefit from familiar legal and administrative systems in
other member country jurisdictions, as well as the similarities
in business, commercial and legislative practices relating
to the trade in goods, services and investment (Box 4.1).
In every country, the framework of laws, rules and
regulations influences the costs of trade, the efficiency of
the institutions that support trade and the effectiveness
of the inter-relations among stakeholders participating
in trade. By implication, harnessing and sustaining new
economic opportunities arising from a more connected
Commonwealth requires strengthening certain trade
governance and regulatory frameworks – from goods and
services to investment and intellectual property rights
(IPRs) – particularly to enable greater GVC participation
and upgrading processes within regional and global
value chains that characterise 21st-century world trade.
Effective and gainful value chain participation requires a
proactive trade governance agenda in order to stimulate
a virtuous trade–services–investment nexus, especially
to attract greenfield investment to build productive
capacity (see Part 1). Many Commonwealth members,
large and small, are adjusting to this changing landscape
in which trade, finance, investment, tax and other
regulatory compliance regimes closely intersect.1
Part 4 of the Commonwealth Trade Review presents new
empirical evidence on the role of governance in influencing
trade and investment flows in the Commonwealth.

64 \ Commonwealth Trade Review 2018
B O X 4 .1
E X A M P L E S O F L EG A L S Y S T E M S FA C I L I TAT I N G I N T R A - C O M M O N W E A LT H T R A D E A N D I N V E S T M E N T
Largely owing to the common law heritage of almost all legal systems within the Commonwealth, much harmony can be found between Commonwealth countries’ legal systems as they exist today. These harmonies of laws, it is suggested, can have a significant effect on the levels of trade and investment between Commonwealth member countries and may go a long way to explaining the Commonwealth advantage.
Business operators can trade with, and invest in, countries with similar legal frameworks with greater certainty as to the legal ramifications of their activities and also with reduced costs associated with modifying their operations to comply with the foreign country’s legal framework. Accordingly, when choosing which nation to trade with, or invest in, a harmonious legal framework is surely an attractive feature capable of influencing such a decision.
Multiple examples of harmonies of laws between Commonwealth countries can be found. In relation to company law, the first British Companies Act of 1844 was replicated in many affiliated jurisdictions and continues in various updated versions in most Commonwealth member countries. The result of this is the mirroring of key company law provisions between Commonwealth countries; according to the World Bank indices of starting a business, just four of the 53 Commonwealth countries have minimum capital requirements, being Cameroon, Ghana, Malta and Swaziland. In addition, the minimum number of shareholders required has been reduced to one in the Commonwealth countries of Australia, Canada, Cyprus, India, New Zealand and Singapore. Moreover, Commonwealth countries within the Caribbean region have largely based their domestic companies’ legislation on the Canadian Business Corporations Act, which was itself influenced by the UK’s Companies Act.
The Caribbean region also exemplifies the harmonies of insolvency laws between Commonwealth countries. When reforming its insolvency legislation, Barbados copied key provisions of the Canadian Bankruptcy and Insolvency Act and this pattern was replicated by Jamaica, Trinidad and Tobago, St. Kitts and Nevis and St. Vincent and the Grenadines.
Globally, other important harmonies can be found between Commonwealth countries in relation to insolvency legislation. For example, Australia, Cyprus, Malaysia, New Zealand, Singapore and the UK have incorporated a scheme of arrangement mechanism to allow for a court-approved agreement between the insolvent company and its creditors, thereby affording a route for potentially viable companies to survive insolvency. The scheme of arrangement originated within the common law.
Anecdotal evidence for the positive influence of harmonious legal frameworks on trade and investment between countries can be found in the tendency for companies within Commonwealth countries to expand to other Commonwealth countries. For example, the Bank of Nova Scotia has expanded from Canada into 21 Commonwealth regions, representing almost half of the countries in which it operates. Considering the Caribbean region, the Royal Bank of Trinidad and Tobago (now known as the Royal Bank of Canada) has expanded to 16 Caribbean countries, nine of them being members of the Commonwealth.
Another striking example is the way in which Vodafone, a UK telecommunications conglomerate, has been able to capitalise on the common-law legal structure throughout parts of the Commonwealth to establish or acquire control of business ventures. Vodafone is active in South Africa after acquiring majority shareholding of Vodacom. In Ghana, Vodafone bought a majority stake in Ghana Telecom. It entered into partnership in Cameroon with Afrimax, under the name Vodafone Cameroon. In the Asia-Pacific region, it bought BellSouth New Zealand and rebranded it as Vodafone New Zealand and it created a joint venture operation in Australia to create Vodafone-Hutchinson Australia. It also has operations and business alliances in India and in the Caribbean region.
Source: Commonwealth Secretariat

Part 4: Deepening the Commonwealth advantage through 21st-century trade governance \ 65
4.2 The Commonwealth advantage and trade costs
While Commonwealth countries already
enjoy a trade cost advantage, there are
many further avenues to streamline
trade governance and procedures,
which would unleash enormous
economic opportunities and could
further deepen this advantage. There
are many forms of trade costs; and
targeted policy interventions and trade
governance reforms are necessary
to drive down costs in each case. For
example, Commonwealth traders
face costs in getting their goods and
services to the border (e.g. logistics
services, hard infrastructure, such
as seaports and airports, and trade
finance; Box 4.2.); costs at the border;
and ‘behind-the-border’ costs.
Trade costs matter in multiple
ways: they determine the ability of
the most efficient firms to expand
their market share, with high trade
costs increasing the costs of critical
inputs and decreasing returns from
exports; they affect the cost of not
only goods but also services, which
account for a significant proportion
of firms’ total production costs,
including, for example, the costs of
business and professional services,
finance, insurance, transport,
telecommunications, construction
and wholesale, retail and hotel
accommodation. They also have
a direct impact on the ability of
developing countries to achieve
their sustainable development
objectives, with many SDGs involving
services, including education,
transport, telecommunications and
health services (Hoekman, 2016).
Beyond deepening the Commonwealth
advantage, a systematic initiative to
further reduce Commonwealth trade
costs offers important benefits to
the Commonwealth’s poorest and
smallest members. These countries
face disproportionately large trade
cost disadvantages; and reducing
these can help transform their trade,
investment and growth prospects.
For example, on average, small
states’ trade costs are estimated to
be at least 50 per cent higher than
those for developing countries as a
whole (Razzaque and Keane, 2015);
and this factor, coupled with the
disproportionately large geographical
distances that many small states
face in getting their goods to world
markets, has contributed to a secular
decline in their share of global trade
(Part 1). Similarly, the trade costs
of poor countries are substantially
higher than those of other countries
(Arvis et al., 2013) and, among LDCs,
trade costs are much higher than,
for example, prevailing tariff rates
of protection (Hoekman, 2016).
B O X 4 . 2
C O M M O N W E A LT H S M A L L S TAT E S T R A D E F I N A N C E FA C I L I T Y
Access to and the costs of trade finance are critically important for the Commonwealth’s 31 small states, which face the challenges of weak credit ratings, reluctance of global providers to extend the terms of lines of credit, volatile global market conditions, high pricing and short tenors, and absence of domestic export credit agencies. These challenges are compounded by international banks de-risking, which is attributed to regulations to combat money laundering and terrorism financing. The 2013 Commonwealth Heads of Government Meeting (CHOGM) directed the Commonwealth Secretariat to initiate, with the support of the Government of Malta, a focused effort to develop a Commonwealth Small States Trade Finance Facility (CSSTFF). In 2015, Commonwealth Heads of Government welcomed the launch of the voluntary CSSTFF and offers of investment in the facility. Four Commonwealth member countries have pledged to provide anchor capital: India (US$2.5 million), Sri Lanka ($1.5 million), Mauritius ($1 million) and Malta ($250,000) – a total of $5.25 million. Standard Chartered Bank and the Bank of Baroda of India are the facility’s managers.
The facility is structured as a guarantee fund, which will offer risk coverage to providers of trade credit to financial institutions in Commonwealth small and developing states. This enables them to deliver greater volumes of trade finance to their importer and exporter customers. The facility will seek to motivate major banks to offer incremental trade finance access to banks in Commonwealth small states by reducing the risks and costs of their doing business in these markets, which are otherwise not attractive to them. This reduction in risks and costs will be accomplished by the facility by making its guarantee fund available, up to an agreed amount. The facility will be operational in May 2018.
Source: Commonwealth Secretariat
66 \ Commonwealth Trade Review 2018
In the past, trade reforms were almost
entirely focused on reducing tariffs at
the border as the means of lowering
trade costs. However, the intensification
of GVC-driven trade, the dramatic rise
in trade in intermediate goods and
services, and increasing digitisation
and digital trade, as discussed in Part 3,
now require addressing multiple – and
often interlinked – policies to reduce
trade costs, build productive and
supply capabilities, and enhance trade
competitiveness in manufacturing and
services. Services are the backbone
of connectivity – ‘facilitating’ the
physical movement of goods and
people (transport services) and the
exchange of knowledge and information
(communications services) – and
many business and professional
services are now vital inputs for a
competitive manufacturing sector.
The performance of the services
sector matters for economic growth
and the overall productivity of the
economy as a whole (Hoekman, 2017).
Multiple policy initiatives can be taken to
reduce trade costs, including improving
logistics performance, reducing the
costs and improving the efficiency of
land, air and sea transport, streamlining
and simplifying international transit
regimes and behind-the-border
regulations, and strengthening trade
facilitation. Doing so can help all
Commonwealth members tap into and
leverage enormous new opportunities
to expand trade, brought about by
fragmentation, the ascendancy of
GVCs and shifts in the pattern of
global trade towards services trade,
including the contribution of services
not only as end products in themselves
but also as inputs into GVCs.
Commonwealth members, individually
and collectively, could consider working
towards informal targets for reducing
trade costs over a number of years. In
that regard, instructive lessons can be
drawn from the Asia-Pacific Economic
Cooperation (APEC) Forum (Box 4.3).
Initiatives that successfully reduce
trade costs can be of particular benefit
to Commonwealth small states, LDCs
and SSA members. These countries
and their firms can take advantage of
production fragmentation processes,
the transformation to digitalisation
and digital trade, the increasing
outsourcing of services functions
and the general rise in world trade in
intermediate goods and services. By
specialising in niche export markets,
these Commonwealth members can
seek to supply global markets with
comparatively small consignment
sizes, overcoming previous limitations
owing to lack of capacity for large-scale
production and limited economies
of scale. By specialising in services,
including newly outsourced or digitally
enabled services, whether directly or
as inputs into GVCs, they may be able
to overcome disproportionately high
trade costs. Through this process,
many MSMEs can progressively
develop internationalisation strategies,
initially by supplying services to
lead firms; as competitiveness and
reliability improve, they can attract
inward FDI – from both lead firms and
other investors – thereby facilitating
inward transfers of technology,
technical knowledge and skills.
That said, it is also important to
distinguish more carefully between
interventions designed to assist
different types of firms’ participation
in GVCs. This necessarily entails
understanding both what it takes
to attract lead firms’ interest and
incentives for producers to upgrade to
higher-value-added activities. Different
strategies will invariably be required in
view of the nature of GVC participation,
with implications for public policy
(Pathikonda and Farole, 2016). For
B O X 4 . 3
REDUCINGTRADECOSTS: LESSONSFROMASIA-PACIF IC?
The 21 APEC members adopted a common trade facilitation performance target, to reduce trade costs by 10 per cent over a 10-year period from 2001 (Hoekman, 2016). APEC total trade (goods and services) increased by more than 6.7 times to US$20 trillion between 1989 and 2015. APEC’s Trade Facilitation Action Plan, which includes streamlining customs procedures, reached its target of a region-wide reduction in costs at the border by 5 per cent between 2004 and 2006. A further 5 per cent decrease was achieved between 2007 and 2010, which saved businesses in the Asia-Pacific a total of $58.7 billion. Over time, the APEC agenda has broadened its focus to address behind-the-border barriers such as improving regulatory practices and the local business climate.
Source: APEC, ‘Achievements and Benefits’ (https://www.apec.org/About-Us/About-APEC/Achievements-and-Benefits)

Part 4: Deepening the Commonwealth advantage through 21st-century trade governance \ 67
example, MSMEs entering into GVCs
and developing relationships with lead
firms require a conducive environment
that promotes investment and long-
term and contractual relationships
with lead firms. It is recognised that
contractual frictions play an important
role in shaping the integration choices
of firms around the world (Alfaro et
al., 2017); reducing these frictions
can boost trade within GVCs.
The transformation of the global trade
and investment landscape has resulted
in several investment policy-related
challenges for poor and small developing
countries. Two challenges in particular
have emerged: the evolution and
increasing complexity of international
investment agreements (IIAs) and
challenges in effectively negotiating
trade in services and investment
commitments in RTAs. Addressing
these challenges can help these
countries maintain coherent investment
obligations that are consistent across
any overlapping treaty provisions, and
can help make foreign investment
supportive of development.
4.3 Governance, trade and economic performance in the Commonwealth
The concept of governance has gained
immense significance over the years
and comprises the mechanisms,
processes and institutions through
which decisions are made and
authority in a country is exercised.
Governance is a broad concept and
can be defined in different ways.
However, the important elements
of governance would include the
following: the political institutions of
a society (the process of government
selection), state capacity (capacity of
the government to implement policies)
and regulation of economic institutions
(the formal state institutions that
enact and enforce the laws) (Kaufmann
et al., 2005). These dimensions are
best captured in the World Bank’s
World Governance Indicators (WGIs)
(Box 4.4). When comparing the average
values of the governance index for the
period 1996 to 2015 across different
B O X 4 . 4
W O R L D G O V E R N A N C E I N D I C ATO R S
Kaufmann et al. (2007) constructed six aggregate governance indicators. Known as the World Governance Indicators (WGIs), they were developed for the World Bank and are based on 31 underlying data sources that report the perceptions on governance of a large number of survey respondents and assessments worldwide. Details of the underlying data sources, aggregation method and interpretation of the indicators are in Kaufmann et al. (2010). The indicators are normalised onto a 0–100 scale (as in Berden el al., 2014). Each indicator represents a different dimension of governance:
1 Voice and accountability, which measures the extent to which a country’s citizens are able to participate in selecting their
government, as well as the freedom of expression of association and media. This variable best captures most individuals’
notion of how a democratic institution fosters voice and accountability.
2 Political stability, measuring the perceptions of likelihood that a government will not be destabilised or overthrown by
unconstitutional or violent means.
3 Government effectiveness, measuring the quality of public services, the civil service (and its degree of independence), the
policy formation and implementation process, and the overall commitment to implementing policies.
4 Regulatory quality, indicating the ability of the government to formulate and implement sound policies and regulations that
permit and promote private sector development.
5 Rule of law, measuring the extent to which agents have confidence in and abide by the rules of society, and with particular
emphasis on the quality of contract enforcement, police and courts.
6 Control of corruption, measuring the extent to which public power is not exercised for private gain, including both petty and
grand forms of corruption as well as the extent of ‘capture’ by elites and private interests.
68 \ Commonwealth Trade Review 2018
country groups, it is significant
that Commonwealth countries are
doing better than the average world
performance (Gopalakrishnan, 2017).
Governance is an important factor that
shapes a country’s overall economic
performance; this is demonstrated by
the New Institutional Economics (North,
1995; North et al., 2008). Moreover,
the new insights from development
and growth economics, and from
trade theory, have contributed to a
better understanding of the potential
benefits from a role for the state in
the market. This increasing interest
has been accompanied by a wide
range of governance indicators in
the literature, as well as specifically
trade governance indicators; these
include the World Bank’s Doing
Business database and the LPI.
A large theoretical and empirical
literature has cast light on how
governance affects economic growth
and development. Most of these studies
have highlighted that governance and
economic growth are strongly positively
correlated (Kaufmann et al., 1999;
Hall and Jones, 1999; Kaufmann et al.,
2009). Empirical tests conducted by
these studies using some governance
indicators – for instance corruption, the
rule of law and the security of property
rights – find strong evidence of the
effects of these variables on long-term
growth (Box 4.5). However, there has
been debate about whether governance
drives growth or better growth improves
governance. Overall there is mixed
evidence on the relationship between
governance indicators and performance,
and how this affects countries’ economic
performance. The relationship with
development varies across the
dimensions of governance and the
stage of a country’s development.
Strengthening governance, particularly
governance of the institutions,
policies and regulations that influence
commerce, trade and investment,
can significantly reduce trade costs,
increase trade and investment and
boost business confidence in the
B O X 4 . 5
F I N D I N G S F R O M S O M E S T U D I E S O N G O V E R N A N C E , T R A D E A N D EC O N O M I C P E R FO R M A N C E
Han et al. (2014) find that government effectiveness, political stability, control of corruption and regulatory quality have a more significant impact on growth performance than voice and accountability, and rule of law.
Studies that survey connections between governance, economic growth and inequality (Zhuang et al., 2010) report a positive and robust relationship between democratic governance variables, economic growth and income levels (Gerring et al., 2005; Persson and Tabellini, 2006). Han et al. (2014) also report that governance matters for development, and that better governance correlates with faster growth and higher income levels.
Some studies highlight that the quality of institutions is a necessary condition and an important determinant of trade and effective governance (Aron, 2000). Using trade governance indicators, Busse and Hefeker (2007) identify three channels that contribute to positive linkage between trade and institutions, and suggest that trade influences institutions from governance perspective. The linkage emanates from the following processes. First, economic agents in open economies learn from experience in trading partners’ countries by adapting (or imitating) successful institutions and regulations. Second, international competition generates pressure on countries to improve institutional and regulatory settings, as domestic firms/producers are likely to go out of business without reforms. Third, rent-seeking and corruption are harder in open economies, as foreign firms’ participation increases the number of economic agents in the country (Rajan and Zingales, 2003).
Some studies examining the effect of governance indicators on FDI show that government stability, absence of internal and external conflicts, lack of corruption and ethnic tensions, law and order, democratic accountability of the government, and high quality of the bureaucracy are highly significant determinants of FDI inflows (e.g. Busse and Hefeker, 2007).
A review of the literature suggests a lack of unanimous evidence on the possible causal connections between a country’s regime history and economic policy. The arguments advanced, however, tend to be speculative, since the causal pathways are usually difficult to identify and test empirically (Montinola and Jackman, 2002; Keefer, 2003; Bohara et al., 2004; Lederman et al., 2005; Kapstein and Converse, 2008).
Part 4: Deepening the Commonwealth advantage through 21st-century trade governance \ 69
Commonwealth. Commonwealth
member countries have the benefit
of a wide array of tools, toolkits
and model laws to help strengthen
the institutional and governance
ties that connect the membership
(Box 4.6). However, evidence on the
impact of improved governance
on Commonwealth trade – as well
as an understanding of the impact
of specific measures taken by
Commonwealth governments, f irms
and other stakeholders in trade – has
not been systematically explored.
4.4 Governance impacts on Commonwealth trade and investment
In order to contribute towards
developing a new narrative on
21st-century trade governance
within the Commonwealth, this
section presents new empirical
evidence on the relationship
between Commonwealth countries’
trade and certain aspects of trade
governance. Khorana and Martínez-
Zarzoso (2018) explore whether or
not an improvement in trade-related
governance indicators leads to
higher exports from and between
Commonwealth member countries;
and they also examine the effects on
Commonwealth trade of some of the
more conventional ‘good governance’
indicators. The methodology and
findings are outlined below.
B O X 4 . 6
S T R E N G T H E N I N G PA N - C O M M O N W E A LT H G O V E R N A N C E , L AW A N D L EG A L C A PA C I T Y
The Commonwealth Office of Civil and Criminal Justice Reform (OCCJR) was established in 2017. It supports Commonwealth countries in delivering access to justice and sustainable development through the creation of fair and effective national laws; making available good legislative practice from across the Commonwealth through model laws, standards, templates, legal insight and legal networks; and also delivering technical assistance to member countries based on these resources. In supporting common practices across Commonwealth member countries, these initiatives are fostering pan-Commonwealth confidence in the appropriateness and acceptability of Commonwealth laws, regulatory provisions and institutions for the purposes of bilateral trade.
Recent initiatives by the OCCJR include support to member countries seeking to understand and participate in ICT and expand ICT services trade. Recognising that the rapid development of ICT requires modern, effective legal frameworks for promoting ICT growth and trade in ICT services, including effective laws in areas such as telecommunications regulation, privacy and data protection, e-commerce and access to public information, the Commonwealth has developed several model laws and other legal tools, including on computer and computer-related crime, electronic transactions, broadcasting and the protection of personal information. These initiatives help strengthen the legislative and policy frameworks across Commonwealth countries, improving institutional and legislative capacity.
Further examples of collective Commonwealth initiatives to advance growth and trade in economic sectors with wide relevance across the Commonwealth membership include support for the development of anticorruption measures and support in addressing cybercrime. Both issues, when effectively addressed, serve as positive indicators of sound governance. Commonwealth legal tools against corruption already include model legislative provisions on money laundering, terrorism financing, preventive measures and proceeds of crime, as well as a model Act on Integrity in Public Life. Building on these tools, work is currently under way on examining options for the development of Commonwealth benchmarks for the prevention of corruption. Supportive Commonwealth initiatives in preventing and addressing cybercrime include detailed assessments of the threats posed by cybercrime and the necessity for collaboration among Commonwealth countries to develop up-to-date and comprehensive legal frameworks to combat cybercrime. The Commonwealth has also established a Commonwealth Working Group on Virtual Currencies.
Source: Commonwealth Secretariat
70 \ Commonwealth Trade Review 2018
4.4.1 The gravity model
In line with recent empirical studies
that investigate the determinants
of bilateral trade flows (Head and
Mayer, 2014), the research modelling
framework uses the gravity model of
trade. The rationale for the selection
of the gravity framework is that the
model provides a good statistical
fit for most data sets and can be
extended with policy variables. A
gravity model is augmented with
governance indicators, to determine
the role of governance on trade flows.
The hypothesis is that each
governance indicator has an equal
effect on trade. The indicators
included measure domestic regulatory
and institutional quality, logistics
performance and the control of
corruption. However, the model
goes beyond these conventional
indicators in order to also explore
investment, the protection of IPRs and
contract enforcement. Using these
variables, the model tests if, for each
indicator, the results are different for
Commonwealth countries’ exporters
and for intra-Commonwealth trade, in
comparison with the global results.
In addition, the model estimates
the effect on and importance for
Commonwealth countries’ export
performance of trade governance at
the regional and multilateral levels. The
model tests if results for countries with
either RTA or WTO effects differ for
intra-Commonwealth trade, compared
to results for the global average.
The augmented gravity model,
indicators and explanatory notes are in
the annex to this chapter. The results,
as reported by Khorana and Martínez-
Zarzoso (2018), are summarised
in the following sub-sections.
4.4.2 MajorfindingsforCommonwealthtrade and investment
The model estimated the impact
on Commonwealth trade flows of a
number of trade-related governance
indicators. The results reported below
highlight only those variables that
exert the most significant influence
on trade for Commonwealth member
countries compared with the global
average. This means that many of
the ‘good governance’ indicators are
excluded from the discussion. This is
because the effects of improvements
in indicators such as corruption control,
regulatory quality and rule of law are
found to be relatively marginal for intra-
Commonwealth traders. While this
finding may be interpreted positively,
much deeper analysis is required and this
is beyond the scope of the present review.
The model, after controlling for all other
factors, finds that, when two countries
are both Commonwealth members,
there is a positive and significant effect
on trade: Commonwealth country pairs
trade 20 per cent more than any other
country pairs (Table 4.1, column 1).
This means that membership of the
Commonwealth has a positive and
significant effect on trade. These
results validate the evidence from a
similar exercise undertaken for the
2015 Commonwealth Trade Review
(Commonwealth Secretariat, 2015).
The other major finding is the significant
effect that RTA membership has
on intra-Commonwealth trade. As
expected, there is a strong positive
effect on trade creation for all countries
that belong to RTAs. In fact, a country’s
exports are found to be 115 per cent
higher when trading with another
RTA partner compared to partners
outside such arrangements (column
1). However, for Commonwealth
countries, this export-enhancing
effect of RTA membership is especially
pronounced. Commonwealth exporters
trade more than twice (230 per cent)
as much as a result of the RTA effect.
The effect is most significant for intra-
Commonwealth trade, where exports
are boosted by more than three times
(356 per cent) (column 3). The results
suggest that intra-Commonwealth
initiatives to strengthen trade
facilitation and further reduce the
costs of intra-Commonwealth trade,
particularly among Commonwealth
countries that are both members
of RTAs, are likely to yield significant
gains to Commonwealth trade.
Although the model finds that RTA
membership has a more significant
impact on export growth than WTO
membership, the model still underlines
the importance of the multilateral trading
system. The results show that WTO
members trade 20 per cent more with
each other than with non-members
(column 1). However, this trade effect
is even greater for Commonwealth
exporters, at 30 per cent (column 2).
Since WTO membership does not appear
to be a major determinant of intra-
Commonwealth trade, there must be
other factors beyond WTO membership
that exert a far greater influence.
This result is perhaps not surprising, given
that most RTAs often go beyond WTO
commitments when liberalising trade
in goods and in services; moreover, not
all Commonwealth members belong to
the WTO (see Part 2). Nonetheless, the
significance of the RTA effect for intra-
Commonwealth trade deserves further
policy attention. It would seem to suggest
that the rise in intra-Commonwealth
trade can take place at a much faster
pace if the UK succeeds in its stated

Part 4: Deepening the Commonwealth advantage through 21st-century trade governance \ 71
intention of establishing bilateral trade
deals with interested Commonwealth
members in the future. However, this
finding needs to take into consideration
that currently the UK, like Canada, trades
a low proportion of all its goods with other
Commonwealth countries (Part 1; Figure
1.7). A Commonwealth-wide preferential
trade deal would also be extremely
difficult to achieve, as Malta and Cyprus
remain EU members. In addition, the
Commonwealth is an association of very
diverse members in terms of their sizes,
locations and levels of development.
The experience of WTO-led multilateral
trade negotiations suggests that trading
arrangements involving a large number
of diverse countries can be very time-
consuming and often yield marginal gains.
Part 1 of the Review provided an analysis
of the state of intra-Commonwealth
FDI, focusing specifically on greenfield
investment flows. The complementarity
of investment and trade, as opposed
to their substitution, is one of the
features of 21st-century integrated
production networks and GVC-driven
trade. For this reason, the gravity
model also explored the relationship
between trade and investment –
both inward and outbound2 – for
Commonwealth member countries.
It is found that every 10 per cent
increase in inward investment
leads to a 3 per cent increase in
exports, globally. This effect is
slightly less pronounced on an
intra-Commonwealth basis, where
the inbound investment from a
Commonwealth partner triggers
only a 2.5 per cent increase in
intra-Commonwealth exports.
In absolute terms, this is still a large
increase. To further explore the
differential effect between the global
average and the Commonwealth
average, the model examines intra-
Commonwealth outbound investment
and intra-Commonwealth trade. It is
found that a 10 per cent increase in
outbound FDI to an average exporter
country is associated with a 1.4 per
cent increase in exports, and a 1.3
per cent increase for Commonwealth
exporters. However, when both
partners are Commonwealth member
countries, the same increase of 10
per cent in outbound FDI increases
intra-Commonwealth exports by
1.5 per cent. Although this is a small
percentage point differential compared
with the global average, it deserves
further attention in the future given the
evolution of contemporary production
networks across member countries;
it also provides evidence to support
the analysis undertaken in Part 1.
4.4.3 Findings for trade governance
In terms of the governance indicators,
improvements in ‘government
effectiveness’, which can be related to
capacity constraints, are found to have
the strongest and most significant
effect on intra-Commonwealth
exporters (Table 4.1, column 3) and
Commonwealth exporters (column 2)
compared with the global average
(column 1). These results imply that
an increase of 1 percentage point
in the government effectiveness
index increases exports by 3.4 per
cent for Commonwealth exporters
to the world, and almost 3.1 per cent
for intra-Commonwealth exporters.
The increase for any world exporter
is 2.4 per cent, holding all other
factors constant. The findings
on the import side are similar and
significant, although the effects on
trade are lower, at around 1 per cent.
TRADE BETWEEN COMMONWEALTH
COUNTRIES IS MORE THAN 3 TIMES
HIGHER WHEN THEY BELONG TO
AN EXISTING TRADE AGREEMENT
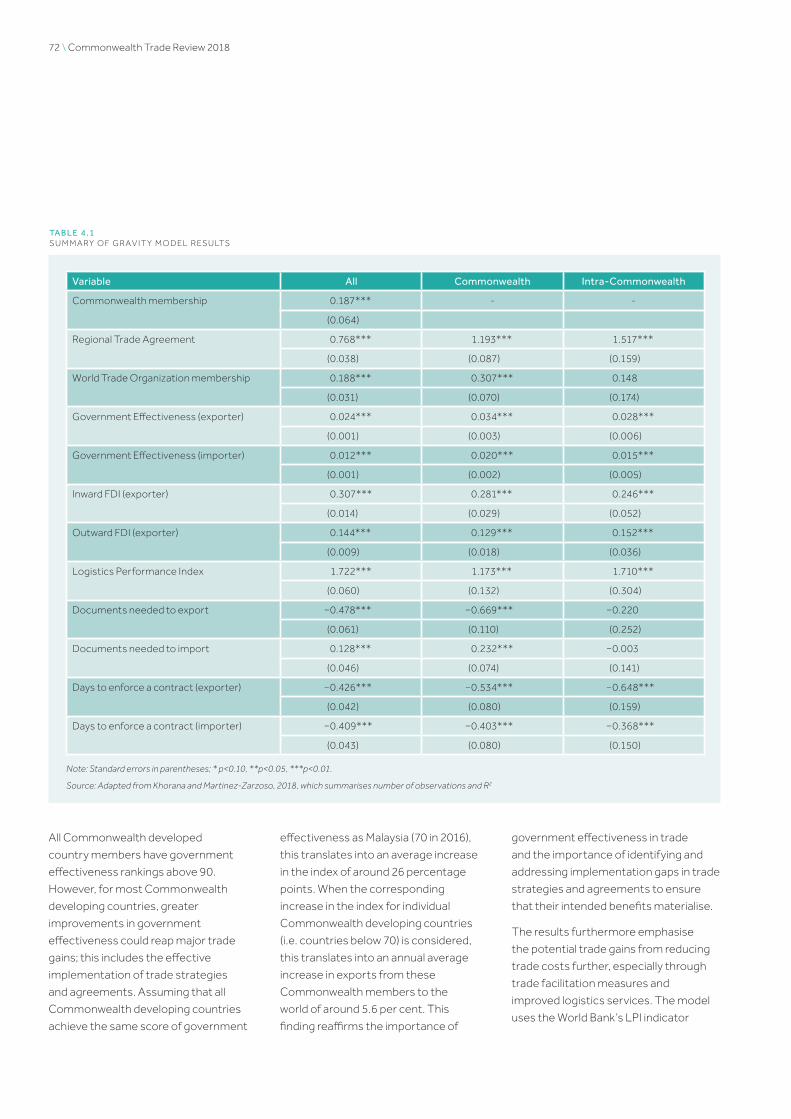
72 \ Commonwealth Trade Review 2018
All Commonwealth developed
country members have government
effectiveness rankings above 90.
However, for most Commonwealth
developing countries, greater
improvements in government
effectiveness could reap major trade
gains; this includes the effective
implementation of trade strategies
and agreements. Assuming that all
Commonwealth developing countries
achieve the same score of government
effectiveness as Malaysia (70 in 2016),
this translates into an average increase
in the index of around 26 percentage
points. When the corresponding
increase in the index for individual
Commonwealth developing countries
(i.e. countries below 70) is considered,
this translates into an annual average
increase in exports from these
Commonwealth members to the
world of around 5.6 per cent. This
finding reaffirms the importance of
government effectiveness in trade
and the importance of identifying and
addressing implementation gaps in trade
strategies and agreements to ensure
that their intended benefits materialise.
The results furthermore emphasise
the potential trade gains from reducing
trade costs further, especially through
trade facilitation measures and
improved logistics services. The model
uses the World Bank’s LPI indicator
TA B L E 4 . 1S U M M A RY O F G RA V I T Y M O D E L R ES U LTS
Variable All Commonwealth Intra-Commonwealth
Commonwealth membership 0.187*** - -
(0.064)
Regional Trade Agreement 0.768*** 1.193*** 1.517***
(0.038) (0.087) (0.159)
World Trade Organization membership 0.188*** 0.307*** 0.148
(0.031) (0.070) (0.174)
Government Effectiveness (exporter) 0.024*** 0.034*** 0.028***
(0.001) (0.003) (0.006)
Government Effectiveness (importer) 0.012*** 0.020*** 0.015***
(0.001) (0.002) (0.005)
Inward FDI (exporter) 0.307*** 0.281*** 0.246***
(0.014) (0.029) (0.052)
Outward FDI (exporter) 0.144*** 0.129*** 0.152***
(0.009) (0.018) (0.036)
Logistics Performance Index 1.722*** 1.173*** 1.710***
(0.060) (0.132) (0.304)
Documents needed to export −0.478*** −0.669*** −0.220
(0.061) (0.110) (0.252)
Documents needed to import 0.128*** 0.232*** −0.003
(0.046) (0.074) (0.141)
Days to enforce a contract (exporter) −0.426*** −0.534*** −0.648***
(0.042) (0.080) (0.159)
Days to enforce a contract (importer) −0.409*** −0.403*** −0.368***
(0.043) (0.080) (0.150)
Note: Standard errors in parentheses; * p<0.10, **p<0.05, ***p<0.01.
Source: Adapted from Khorana and Martinez-Zarzoso, 2018, which summarises number of observations and R2

Part 4: Deepening the Commonwealth advantage through 21st-century trade governance \ 73
as a measure of trade facilitation. For
average world exporters, it finds that a
1 per cent improvement in a country’s
LPI index increases exports by 1.4 per
cent (column 1). However, a similar
improvement in the LPI index increases
intra-Commonwealth exports by 1.6
per cent (column 3). These results
strengthen the case for dedicated
Commonwealth initiatives to improve
trade facilitation among the members;
given the RTA effect, this is especially
the case where Commonwealth
countries belong to the same formal
trading bloc. The 2015 Commonwealth
Trade Review also found substantial
GDP and employment gains for
Commonwealth countries that achieved
the same level of efficiency as South
Africa’s LPI score (see Box 4.7).
Facilitating more efficient trade
requires not only investments in ‘hard’
infrastructure, but also improvements
in ‘soft’ infrastructure in line with the
WTO’s TFA and regional trade facilitation
deals (see Part 2). Improving customs
administration and reducing the number
of documents needed to export and
to import can trigger substantially
higher Commonwealth exports and
intra-Commonwealth trade. The model
finds that a 10 per cent reduction in
the costs incurred for a good to exit
a country is associated with a 6.8 per
cent increase in exports for the average
world exporter (column 1). However,
when the exporter is a Commonwealth
member, the gains in exports increase
to 7.4 per cent (column 2). Where
both countries are Commonwealth
members, intra-Commonwealth exports
increase by 5 per cent (column 3).
The final governance indicator
examined for its impact on
Commonwealth trade is the
enforcement of contracts when
commercial disputes arise. The World
Bank’s enforcing contracts indicator
measures the time and cost for
resolving a commercial dispute through
a local first-instance court, and the
quality and efficiency of the court
system. The efficiency of courts varies
greatly around the world, including the
Commonwealth. For example, enforcing
a contract through the courts can take
less than 10 months in Rwanda, New
Zealand and Singapore but almost
4 years in Bangladesh and India.3
The analysis delivers a significant result:
contract enforcement is more efficient
among Commonwealth members,
in general, and requires 20 per cent
less time than the world average. This
finding is integral to deepening our
understanding of the Commonwealth
B O X 4 .7
I M P R O V I N G LO G I S T I C S P E R FO R M A N C E : A B O O N FO R C O M M O N W E A LT H P R O S P E R I T Y
The 2015 Commonwealth Trade Review examined the impact of improved trade logistics, using the World Bank’s 2014 LPI rankings of Commonwealth member countries. To analyse the effect of improvements in trade logistics, two scenarios were considered:
Scenario I: Each Commonwealth country achieves the same level of LPI score as that of Singapore, which is the best performer among the Commonwealth countries.
Scenario II: Each Commonwealth country with a lower LPI score than South Africa achieves the same score as South Africa; this is chosen because it is seen as an achievable ‘above-average’ score.
The simulation results revealed that, under Scenario I, combined Commonwealth GDP would increase by US$501 billion; under the more realistic Scenario II, it would increase by $177 billion. There would also be substantial employment gains. Without any improvement in trade logistics, abolition of all tariffs on intra-Commonwealth trade results in an increase in combined Commonwealth GDP of $80 billion.
Economists most often report impact in terms of welfare changes. Measured in ‘equivalent variations’, they represent the amount of money consumers would have to pay if they did not obtain the changes in prices and trade quantities foreseen in the scenarios. The aggregate welfare changes are in line with the GDP gains mentioned above, and, in almost all cases, the gains are substantial for Commonwealth countries. Under the more plausible Scenario II, in which each country achieves at least South Africa’s level of efficiency, the total welfare gains in the Commonwealth are US$138 billion, with employment effects of 24 million, and additional intra-Commonwealth exports of $124 billion.
Source: Commonwealth Secretariat, 2015
74 \ Commonwealth Trade Review 2018
advantage, since efficient contract
enforcement increases trade and
investment, reduces trade costs
and boosts business confidence.
In addition to the Commonwealth’s
comparative advantage in contract
enforcement, the results of the model
suggest that there are further trade
gains to be derived from greater
efficiency. For every 10 per cent
reduction in the number of days
taken to enforce a contract, there is a
corresponding 6.4 per cent increase
in intra-Commonwealth exports.
A key underlying reason contributing
to this more efficient structure
of contract enforcement among
Commonwealth member countries
is the overall procedural efficiency
of the legal system. Compared with
other legal systems, such as civil law
systems, the common law system
predominant across the Commonwealth
offers certain advantages. Litigation
procedural rules in the common law
system, for instance, promote the use of
procedural steps such as ‘lists of issues’,
‘position statements’ and ‘statements
of assumed facts’, which help narrow
down the point of dispute. Where there
is no real dispute about facts, a court
may decide questions of law summarily
or on an expedited basis, eliminating
the need for lengthy disclosure,
pleadings and witness statements.
In addition to the reduced time taken
to enforce contracts, certain features
of the common law system – such as
the sanctity of contract and the degree
of legal certainty in proceedings – may
also contribute to the link between
effective contract enforcement and
enhanced trade and investment.
Courts in the common law system will
not, except in limited circumstances,
deny the effect of a contract on the
grounds of unfairness alone, such
as a particularly high contract price.
This is in contrast to civil law systems,
where a good faith principle generally
enables the courts to examine at length
the fairness of contract provisions.
Combined with the common law system
approach to legal certainty through
the notion of legal precedent, sanctity
of contract means that courts are
able to advance contract litigation in
a predictable and efficient manner.
This increase in efficiency and
predictability enables commercial
enterprises in Commonwealth countries
to form reasonable expectations of
the outcome of litigation, increasing
their incentive to engage in business
and trade agreements. In addition,
although not captured directly by
the quantitative findings of the
Review on contract enforcement,
the interoperability of common law
systems can also support effective
enforcement of contracts across
Commonwealth countries. The recently
adopted Commonwealth Model Law
on the Recognition and Enforcement
of Foreign Judgments, for example,
builds on common approaches to the
enforcement of foreign judgments by
courts in Commonwealth countries,
in order to further harmonise the
ways in which a national court can give
effect to the decision of a court from
another country. Resulting confidence
in the recognition and enforcement
of judgements across borders can
be expected to further encourage
enterprises to engage in contracts for
goods and services across borders.
4.5 Conclusion and way forward
Governance ties in the Commonwealth
yield multiple tangible commercial
benefits for traders and investors.
However, Commonwealth members –
working individually, collectively and
with international partners – can
take several steps to strengthen
certain aspects of their 21st-century
trade governance frameworks in
order to further reduce trade costs
and trigger greater flows of intra-
Commonwealth trade and investment.
The first involves greater focus
on trade facilitation. Countries
enhance their connectivity through
investments in both institutional
and physical infrastructures. A
major f inding of Part 4 is that
intra-Commonwealth initiatives to
strengthen trade facilitation and
further reduce the costs of intra-
Commonwealth trade, particularly
among Commonwealth countries
that are both members of RTAs,
are likely to yield signif icant gains to
Commonwealth trade. Enhanced
trade facilitation initiatives can help
Commonwealth members improve
transit times and reduce costs, thereby
improving trade competitiveness and
increasing intra-Commonwealth trade.
Evidence for low-income countries
suggests that improving the availability
of trade-related information,
simplifying and harmonising
documents, streamlining procedures,
and using automated processes can
reduce trade costs by nearly 15 per
cent (Moïsé and Sorescu, 2013).

Part 4: Deepening the Commonwealth advantage through 21st-century trade governance \ 75
Several Commonwealth members
are recognised leaders in the trade
facilitation field. These include
Singapore, which is ranked among the
top five performers globally on the
World Bank’s LPI, and has consistently
been the world-leading performer
among Commonwealth members.
The UK, Canada, Australia and South
Africa are all ranked among the top
20 LPI performers. These countries
offer valuable experiences and best
practices in trade facilitation, providing
opportunities for greater knowledge
sharing within the Commonwealth,
to enable fellow Commonwealth
members to draw on these lessons to
improve their trade competitiveness
and enable greater participation in
regional and global value chains.
The second areas of focus should be
to strengthen the trade–investment–
IPR policy nexus, especially to attract
greenfield investment to upgrade
production capabilities and take
advantage of the opportunities
arising from the fragmentation of
production networks (Part 1).

76 \ Commonwealth Trade Review 2018
Annex
The model in its basic form assumes that trade between
countries is directly related to a country’s size and inversely
to the distance between them. Exports from country i to
country j, Xij, are explained by the economic size (i.e. GDP) of
each country, direct geographical distance between them
and a set of dummies that include shared characteristics
such as common language, common border or colonial
relationships. The specification of the gravity model of trade
in its original multiplicative form for a single year is given by:
X GDP GDP DIST A uij i j ij ij ij=β β β β β0
1 2 3 4
(1)
where GDPi (GDPj) indicates the GDP of the exporter
(importer) and DISTij measures the distance between
the two countries’ capitals (or economic centres).
A high level of income in the exporting country indicates a
high level of production, which increases the availability of
goods for exports. Therefore, β1 is expected to be positive.
The coefficient of Yj, β2, is also expected to be positive, since
a high level of income in the importing country suggests
higher imports. The distance coefficient is expected to be
negative, since it is a proxy of all possible trade cost sources.
Aij represents any other factors aiding or preventing trade
between pairs of countries, and uij is the error term. Usually,
Aij includes dummy variables for trading partners sharing
a common language, colonial ties and a common border,
as well as trading bloc dummy variables that evaluate the
effects of preferential trade agreements. The coefficients
of all these bilateral variables are expected to be positive.
When the gravity model of trade is estimated using
panel data, the time dimension is incorporated into
the model. For estimation purposes, equation (1),
in log-linear form, is augmented with governance
indicators and with time dimension, and written as:
lnX lnGDP lnGDP PClnGDP lnPCGDP
ln
ijt it jt it jt= + + + +
+
β β β β β
β0 1 2 3 4
5 AArea lnArea L NDL LANDL lnDIST
CONTIG
i j i j ij+ + + +
+
β β β β
β6 7 8 9
10
A ( )
( iij ij ij
ijt
COMLANG COLONY
V
) ( ) ( )+ + +
+ +
β β β
β β11 12 13
14 15
RTA
WTO
ijt
AA PS GE RQ RL
CC VA P
it it it it it
it jt
+ + + +
+ + +
β β β β
β β β16 17 18 19
20 21 22� SS GE RQ RL
CC
jt jt jt jt
jt t ijt
+ + +
+ + +
β β β
β δ ε23 24 25
26 (2)
where the variables include:
• lnGDPit and lnGDP
jt as defined above;
• lnPCGDPit and lnPCGDP
jt, the GDP per
capita of an exporter (importer);
• lnAreai and lnArea
j, the area of the corresponding
country in square kilometres;
• lnLANDLi and lnLANDL
j, dummy variables that take
the value of 1 if the country i (j) is landlocked;
• DISTij, the bilateral distance between
the economic centres of i and j;
• CONTIGij, a dummy variable assuming a value of 1 if the two
countries share a common land border (and 0 otherwise);
• COMLANGij, a dummy variable that takes a value of
1 if the two countries share a common language;
• COLONYij, a dummy variable that takes the
value of 1 when countries i and j have ever had a colonial relationship, and 0 otherwise;
• RTAijt
, which takes the value of 1 if countries i and j belong to the same regional integration agreement;
• WTOijt
, which takes the value of 1 if countries i and j are members of the WTO in year t.
The other variables include the six measures
of the WGIs from the World Bank:
• voice and accountability (VA);
• political stability (PS);
• government effectiveness (GE);
• regulatory quality (RQ);
• rule of law (RL);
• control of corruption (CC).
Each variable is specified in equation (2) with the subscript
it or
jt, denoting that these vary by exporter and time
or by importer and time. As in Berden et al. (2014),
the WGI variables are standardised to range between
0 and 100 to aid the interpretation of results.
RTA: As a proxy for regional governance, a dummy variable is
used that takes the value of 1 when a pair of countries
has an RTA in a given year; otherwise 0 is used.

Part 4: Deepening the Commonwealth advantage through 21st-century trade governance \ 77
WTO: As a proxy for global governance, a dummy
variable is used that takes the value of 1 if a pair of trading
countries both belong to the WTO; otherwise 0 is used.
The model tests how the RTA and WTO effects vary for
Commonwealth countries and intra-Commonwealth trade (i.e.
all countries within the Commonwealth group) in comparison
with non-Commonwealth countries to examine if and how
there is an impact on the Commonwealth advantage.
A similar comparison and analysis are carried out for
WGIs, FDI, IPR, LPI and Doing Business indicators.
It should be noted that the gravity model adopted does
not incorporate multilateral resistance. This is whereby
analysis of not just bilateral trade resistance, but also
multilateral trade resistance – the barriers to trade that
each country faces with all its trading partners – are
incorporated. However, it controls for time fixed effects.

78 \ Commonwealth Trade Review 2018
Endnotes
1 The Government of Vanuatu, for
example, has developed draft legislation
to introduce a Trade Governance Act, to
manage intersectoral coordination and
to leverage opportunities for trade and
value addition.
2 It is important to distinguish between
the two investment flows. An inward
direct investment is when a foreign
firm either invests in or purchases
the goods of a local economy. It
comprises the value of the capital
and reserves in the local economy
attributable to a parent enterprise
resident in a different economy.
It can occur when one company
purchases another business, or
establishes new operations for
an existing business. By contrast,
an outward direct investment
happens when a domestic firm
expands its operations into a foreign
country. This can take the form of a
greenfield investment (see Part 1),
but also mergers and acquisitions
transactions or the expansion of an
existing foreign facility. Employing
outward direct investment is a
natural progression for firms if
their domestic markets become
saturated and better business
opportunities are available abroad.
3 The World Bank ‘Doing Business’,
http://www.doingbusiness.org/
data/exploretopics/enforcing-
contracts/why-matters

Summary and conclusionsFundamental changes are taking place in the global trade
landscape with implications for all 53 Commonwealth
member countries. These include the fragmentation of
global production processes, the increasing proportion
of intermediate goods and services in total trade, and
the transformation of the technologies, institutions and
governance frameworks that underpin trade in goods, services
and the digital economy. A steadily increasing proportion of
global trade is now located in global and regional value chains.
These changes present challenges to Commonwealth trade
competitiveness, but there may also be new opportunities
for more meaningful participation in world trade, particularly
for the Commonwealth’s developing country members.
Although trade among Commonwealth members reached
only US$560 billion in 2016, reflecting the effects of the
downturn in global trade, intra-Commonwealth trade as a
proportion of global trade is rising and is now 20 per cent of
Commonwealth countries’ total trade with the world. This
underlines the growing significance of Commonwealth markets
for many member countries, especially the smallest and most
vulnerable countries. Intra-Commonwealth trade in goods and
services, as well as productive greenfield investment among
Commonwealth members, which is significant for job creation,
are broadly on track to reach US$1 trillion in the next few years.
The pace and scale of change in global trade, however,
mean that retaining the Commonwealth advantage cannot
be taken for granted. New Commonwealth initiatives will
be needed to support the smallest and most vulnerable
countries to bolster inward FDI, to strengthen access to
digital trade and to increase opportunities for these countries
to supply intermediate goods and services in regional
and global value chains, particularly those in which other,
large, Commonwealth countries have gained a presence.
Improved market access to major importing countries is
needed for the poorest and smallest countries, to increase
participation in GVCs by these countries, and to provide
adequate and effective support for trade capacity-building.
Even without any formal trading arrangements, proactive
initiatives by Commonwealth member countries can
help generate trade and investment opportunities. For
example, Commonwealth members could focus on
achieving improved trade logistics and implementing trade
facilitation measures; tackling non-tariff barriers; utilising
the opportunities to develop regional supply chains in
sectors where Commonwealth regions have comparative
advantages; promoting a gender-responsive approach to
the development of trade policy and to promote women’s
economic empowerment; exploiting the potential of strong and
diverse diasporas to catalyse innovation and investment and to
bridge into new markets; and making use of the Commonwealth
as a platform for establishing and strengthening contacts
between traders and investors, including MSMEs.
More specifically, this Review explored how Commonwealth
members, individually and collectively, can trigger greater trade
gains in two ways: by harnessing new technologies, especially
digitisation; and by strengthening certain aspects of their
trade governance regime to reduce trade costs further.
Technology, trade and prosperity
Commonwealth members have made extraordinary progress
in accessing and harnessing the new digital and other
technologies that underpin and drive contemporary global
trade. These technologies are slowly breaking down constraints
owing to limited size, concentration of production, limited
diversification, lack of interconnectedness, remoteness
and inability to achieve a presence in both established and
emerging regional and global value chains. Individually, these
are helping transform access to and economic activity in
many sectors crucial to their sustainable development,
including finance – from mobile money payments to
advanced fintech – renewable energy, agriculture, the oceans
80 \ Commonwealth Trade Review 2018
economy and tourism, among many others. Collectively
they provide an opportunity and platform, through
concerted Commonwealth action, to systematically harness
technology to grow Commonwealth trade and investment.
But much more can be done by Commonwealth members,
individually and collectively, to further leverage technology’s
transformative potential to enhance Commonwealth
trade and investment and to accelerate access to new
technologies, particularly among the poorest, smallest
and most vulnerable Commonwealth members. Across
the Commonwealth, the potential gains in trade, growth
and employment are limited by major gaps in key enabling
infrastructure, including access to broadband, poor internet
speed, electrification and access to financial technologies.
Finding practical measures to close these gaps, including
bridging the gender disparity in digital connectivity,
offers very substantial untapped opportunity to deepen
Commonwealth trade, investment and innovation, especially
in the fintech sector, where several Commonwealth
member countries are already world leaders.
Efficientandeffectivetradegovernance
Efforts to strengthen the Commonwealth advantage will
also hinge on the ability of Commonwealth members to
strengthen the institutional, policy, regulatory and other
factors that influence the costs of trade, the efficiency of
institutions that support trade and the effectiveness of the
inter-relations among stakeholders participating in trade.
Strengthening certain aspects of Commonwealth trade
governance can help Commonwealth members expand
exports, increase inward FDI and significantly reduce trade
costs. Achieving this requires a new strategic approach to
Commonwealth engagement with the institutions, networks
and governance structures that underpin 21st-century trade.
Commonwealth members are already taking substantive
steps to strengthen logistics performance, streamline
and simplify international transit regimes and behind-
the-border regulations, and strengthen trade facilitation.
Countries can further enhance their connectivity
through investments in both institutional and physical
infrastructures. This will require more precisely targeted
support for multilateral initiatives including the TFA and
AfT; continued support from Commonwealth developed
country members for these multilateral initiatives; and
ongoing measures across all Commonwealth regions
and countries to reduce trade costs and deepen regional
integration. Commonwealth members already enjoy an
advantage when it comes to efficient contract enforcement,
for instance, and strengthened regional integration
and improvements in trade facilitation are likely to yield
disproportionately high gains for Commonwealth members.
Towards greater Commonwealth co-operation
Many Commonwealth initiatives are helping deepen and
strengthen the institutional and governance ties that connect
Commonwealth members, including the development of
model laws, standards, templates, legal insights and legal
network as well as technical assistance to member countries.
However, with new evidence of the unique and disproportionate
advantages when these tools and modes of support are
implemented in Commonwealth member countries, new
initiatives are needed to scale up these forms of support and
widen access to them among Commonwealth members.
The members could consider strengthening dialogue and
cooperation at the pan-Commonwealth level, and sharing
country experiences and best practices on issues of physical,
digital, regulatory, business-to-business and supply-side
connectivity, all framed by the need for inclusive and sustainable
trade to contribute towards the achievement of the SDGs.
ReferencesAkamai (2016), ‘State of the Internet
report’, available at: https://www.
akamai.com/uk/en/about/our-
thinking/state-of-the-internet-report
(accessed 17 January 2018).
All-Party Parliamentary Group (APPG)
for Trade out of Poverty (2016),
‘Inquiry into the UK’s Africa Free Trade
Initiative’, Final Report, APPG, London.
Anand, R, S Mishra and N
Spatofora (2012), ‘Structural
transformation and sophistication
of production’, IMF Working Paper
12/59, IMF, Washington, DC.
Arntz, M, T Gregory and U Zierahn
(2016), ‘The Risk of Automation for Jobs
in OECD Countries: A Comparative
Analysis’, OECD Social, Employment and
Migration Working Papers 189, OECD
Publishing, Paris, available at: http://
dx.doi.org/10.1787/5jlz9h56dvq7-en
(accessed 19 November 2017).
Aron, J (2000), ‘Growth and institutions:
a review of the evidence’, World
Bank Research Observer, Vol. 15
No. 1, 99–135, available at: https://
doi.org/10.1093/wbro/15.1.99.
Arvis, J-F, Y Duval, B Shepherd and
C Utoktham (2013), ‘Trade Costs in
the Developing world: 1995–2010’,
Policy Research Paper 6309,
World Bank, Washington, DC.
Baker, PR (2017), E-commerce and
Digital Trade. A Policy Guide for
Least Developed Countries, Small
States and Sub-Saharan Africa.
Commonwealth Secretariat, London.
Berden, K, JH Bergstrand and
E Etten (2014), ‘Governance
and Globalisation’, The World
Economy, Vol. 37 No. 3, 353–86.
Bessen, J (2016), ‘How Computer
Automation Affects Occupations:
Technology, Jobs, and Skills’, Law &
Economics Working Paper 15–49, Boston
University School of Law, Boston.
Bohara, AK, NJ Mitchell and CF Mittendor
(2004), ‘Compound Democracy and
the Control of corruption: a Cross-
country Investigation’, Policy Studies
Journal, Vol. 32 No. 4, 481–99.
Bohlin, E (2013), ‘Broadband speed
impact on GDP growth and household
Income: comparing OECD and
BRIC’, paper presented at the ITU
Workshop: New Trends for Building
and Financing Broadband: Policies
and Economies, Manama, Bahrain,
24–25 September, available at: http://
www.itu.int/ITU-D/arb/ARO/2013/
BFB/presentations/S1-Erikpollin.pdf
(accessed 20 November 2017).
Brooks, R (2018), ‘My dated predictions’.
1 January, available at: http://
rodneybrooks.com/my-dated-
predictions (accessed 17 January 2018).
Busse, M and C Hefeker (2007), ‘Political
risk, Institutions and foreign direct
investment’, European Journal of Political
Economy, Vol. 23 No. 2, 397–415.
Cisco (2017), ‘IPv6 Lab’, CISCO, available
at: http://6lab.cisco.com/stats/search.
php (accessed 20 November 2017).
Commonwealth Secretariat
(2015), The Commonwealth in the
Unfolding Global Trade Landscape:
Prospects, Priorities, Perspectives,
Commonwealth Secretariat, London.
Commonwealth of Australia,
Department of Foreign Affairs and
Trade (DFAT) (2017), Australian Aid
Budget Summary 2017–18, DFAT,
Canberra, available at: http://
dfat.gov.au/about-us/corporate/
portfolio-budget-statements/
Documents/2017-18-australian-
aid-budget-summary.pdf (accessed
17 January 2018).
Czernich, N, O Falck, T Kretschmer
and L Woessman (2011), ‘Broadband
infrastructure and economic growth’,
Economic Journal, Vol. 121, 505–32.
De Pass, P (2018) ‘Commentary on
Implications of EU sugar Reform for
ACP Countries’, Commonwealth
Secretariat, London.
Economist Intelligence Unit (EIU) (2017),
The Inclusive Internet Index: Bridging
Digital Divides, EIU, London, available
at: https://theinclusiveinternet.eiu.
com/assets/external/downloads/3i-
bridging-digital-divides.pdf
(accessed 17 January 2018).
Evenett, SJ and J Fritz (2015), ‘Throwing
sand in the Wheels: How protectionism
slowed export-led growth for the
world’s poorest countries’. Report
prepared for the Government of
Sweden revised version), CEPR, London.
Farole, T (2017), ‘Results of GVC gravity
trade model’, World Bank, Washington,
DC.
Financial Times, fDi Markets dataset,
available at: https://www.fdimarkets.
com (accessed 4 November 2017).
Gerring, J, P Bond, W Barndt and
C Moreno (2005), ‘Democracy and

82 \ Commonwealth Trade Review 2018
growth: a historical perspective’,
World Politics, Vol. 57 No. 3, 323–64.
Gopalakrishnan, BN (2017),
‘Governance and Trade in the
Commonwealth Countries’,
Commonwealth Secretariat, London.
GSMA (2016), The Mobile Economy:
Africa 2016, GSMA, London.
GSMA Connected Women (2015),
Bridging the gender gap: Mobile
access and usage in low and middle-
income countries, GSMA, London.
Hall, RE and CI Jones (1999), ‘Why do
some countries produce so much
more output per worker than others’,
Quarterly Journal of Economics,
Vol. 114 No.1, pp. 83–116.
Han, X, H Khan and J Zhuang (2014),
‘Do governance indicators explain
development performance? A cross-
country analysis’, ADB Working Paper No.
417, available at: https://www.adb.org/
sites/default/files/publication/149397/
ewp-417.pdf (accessed 17 January 2018).
Hausmann, R, J Hwang and D
Rodrik (2007), ‘What you export
matters’, Journal of Economic
Growth, Vol. 12 No. 1, 1–25.
Head, K and T Mayer (2014), ‘Gravity
equations: workhorse, toolkit, cookbook’,
in Gopinath, G, E Helpman and K
Rogoff (Eds), Handbook of International
Economics, Vol. 4, Elsevier, Amsterdam.
Hoekman, B (2016), ‘Trade and the SDGs:
Making “Means of Implementation”
a Reality’, Commonwealth Trade
Hot Topics 128, Commonwealth
Secretariat, London.
Hoekman, B (2017), ‘Trade in
services. Opening markets to create
opportunities’, WIDER Working
Paper 2017/31, February 2017,
available at: https://www.wider.unu.
edu/sites/default/files/wp2017-31.
pdf (accessed 17 January 2018).
International Energy Agency (IEA) and
World Bank (2014), Sustainable Energy for
All 2013–2014: Global Tracking Framework
Report, World Bank Washington, DC.
International Telecommunication
Union (ITU) (2012), ‘Impact of
broadband on the economy’,
Broadband Series, Telecommunication
Development Sector, ITU, Geneva.
ITU (2017), ‘Facts and figures 2017’,
ITU, Geneva, available at: https://
www.itu.int/en/ITU-D/Statistics/
Documents/facts/ICTFactsFigures2017.
pdf (accessed 7 January 2018).
ITU (2018), ‘ICTs, LDCs and the
SDGs: achieving universal and
affordable Internet in the least
developed countries’, ITU, Geneva,
available at: http://unohrlls.org/
custom-content/uploads/2018/01/D-
LDC-ICTLDC-2018-PDF-E.pdf
(accessed 17 January 2018).
Joseph, M (2017), ‘M-Pesa: the
story of how the world’s leading
mobile money service was created
in Kenya’, available at: http://www.
vodafone.com/content/index/what/
technology-blog/m-pesa-created.
html (accessed 15 January 2018).
Kapstein, EB and N Converse (2008), The
Fate of Young Democracies, Cambridge
University Press, Cambridge.
Katz, RL, S Vaterlaus, S Zenhäusern
and S Suter (2010), ‘The impact of
broadband on jobs and the German
economy’, Intereconomics, Vol. 1,
26–34.
Kaufmann, D, A Kraay and P Zoido-
Lobatón (1999) ‘Governance’, Policy
Research Working Paper 2196,
World Bank, Washington, DC.
Kaufmann, D, K Aart and M Mastruzzi
(2005), ‘Governance matters IV:
governance indicators for 1996’,
Policy Research Working Paper 3630,
World Bank, Washington, DC.
Kaufmann, D, A Kraay and M Mastruzzi
(2009), ‘Governance matters VIII:
aggregate and individual governance
indicators 1996–2008’, Policy
Research Working Paper 4978,
World Bank, Washington, DC.
Kaufmann, D, A Kraay and M Mastruzzi
(2010), ‘The Worldwide Governance
Indicators: a summary of methodology,
data and analytical issues’, Policy
Research Working Paper 5430,
World Bank, Washington, DC.
Keane, J and R Baimbill-Johnson
(Eds) (2017), Future Fragmentation
Processes: Effectively Engaging with
the Ascendency of Global Value Chains,
Commonwealth Secretariat, London.
Keefer, P (2003), ‘Democratization
and clientelism: why are young
democracies badly governed?’, paper
presented at the annual meeting of the
American Political Science Association,
Philadelphia, PA, 15 August.
Kelly, T and CM Rossotto (Eds) (2012),
Broadband Strategies Handbook,
World Bank, Washington, DC,
available at: http://broadbandtoolkit.
org/Custom/Core/Documents/
BroadbandStrategiesHandbook.
pdf (accessed 17 January 2018).
Kessler, S (2017), ‘Over the last
60 years, automation has totally
eliminated just one US occupation’,
Quartz, 15 March, available at: https://
qz.com/932516/over-the-last-60-
years-automation-has-totally-
eliminated-just-one-us-occupation/.
Khorana, S and I Martínez-Zarzoso
(2018), ‘Trade Governance and
References \ 83
Intra-Commonwealth Trade’,
International Trade Working Paper,
Commonwealth Secretariat, London.
LDC IV Monitor (2016), Achieving the
Istanbul Programme of Action by 2020:
Tracking Progress, Accelerating
Transformations, Commonwealth
Secretariat, London.
Lederman, D, N Loayza and R Soares
(2005), ‘Accountability and corruption:
political institutions matter’, Economics
and Politics, Vol. 17 No. 1, 1–35.
Lipsey, RG, KI Carlaw and CT Bekar
(2005), Economic Transformations:
General Purpose Technologies
and Long Term Economic Growth,
Oxford University Press, Oxford.
Loungani, P, S Mishra, C Papageorgiou
and K Wang (2017), ‘World trade
in services: evidence from a new
dataset’, IMF Working Paper
WP17/77, IMF, Washington, DC.
Low, P (2016), ‘Modes of service delivery
and upgrading in global value chains’,
in Keane, J and R Baimbill-Johnson
(Eds), Future Fragmentation Processes:
Effectively Engaging with the Ascendency
of Global Value Chains, Commonwealth
Secretariat, London, 56–64.
MacGregor, J (2018), ‘Digital
Technologies, Trade and Growth
Prospects in the Commonwealth’,
International Trade Working Paper,
Commonwealth Secretariat, London.
McKinsey Global Institute (MGI)
(2014), ‘India’s tech opportunity:
Transforming work, empowering
people’. MGI, London, available
at: http://www.mckinsey.com/
industries/high-tech/our-insights/
indias-tech-opportunity-transforming-
work-empowering-people
(accessed 17 January 2018).
MGI (2016a), Lions on the Move II,
MGI, London.
MGI (2016b), Digital Globalization: The
New Era of Global Flows, MGI, London.
MGI (2017), A Future that Works:
Automation, Employment and
Productivity, MGI, London.
Moïsé, E and S Sorescu (2012), ‘OECD
Trade Facilitation Indicators: The Potential
Impact of Trade Facilitation on Developing
Countries’ Trade’, Working Party of the
Trade Committee, Trade and Agriculture
Directorate Committee, TAD/TC/
WP(2012)24, OECD, Paris, available at:
https://www.oecd.org/dac/aft/
TradeFacilitationIndicators_
ImpactDevelopingCountries.pdf
(accessed 12 February 2018).
Montinola, GR and RW Jackman
(2002), ‘Sources of corruption: a
cross-country study’, British Journal of
Political Science, Vol. 32 No. 1, 147–70.
North, D (1995), Institutions,
Institutional Change and Economic
Performance, Cambridge
University Press, Cambridge.
North, D, D Acemoglu, F Fukuyama
and D Rodrik (2008), Governance,
Growth, and Development Decision-
Making, World Bank, Washington, DC.
ONE (2016), Making the Connection,
One Foundation, London, available at:
https://s3.amazonaws.com/one.org/
pdfs/making-the-connection-report-
en.pdf (accessed 17 January 2018).
Organisation for Economic
Cooperation and Development
(OECD) and World Trade Organization
(WTO) (2017), Aid for Trade at a
Glance 2017: Promoting Trade,
Inclusiveness and Connectivity for
Sustainable Development, Paris
and Geneva, OECD and WTO.
Pathikonda, V and T Farole (2016),
‘The capabilities driving participation
in global value chains’, Policy
Research Working Paper 7804,
World Bank, Washington, DC.
Persson, T and G Tabellini (2006),
‘Democratic capital: the nexus of
political and economic change’, NBER
Working Paper 12175, National Bureau
of Economic Research, Cambridge, MA.
PLAN (2018), ‘The missing
target’, PLAN International, 18
January, available at: https://plan-
international.org/publications/
missing-target#download-options
(accessed 8 January 2018).
Quiang, CZ-W, C Rossotto and K
Kimura (2009), ‘Economic Impacts
of Broadband’, in World Bank, 2009
Information and Communications
for Development: Extending Reach
and Increasing Impact, World
Bank, Washington, DC, available
at: https://openknowledge.
worldbank.org/handle/10986/2636
(accessed 17 October 2017).
Rajan, RG and L Zingales (2003),
‘The great reversals: the politics
of financial development in the
twentieth century’, Journal of Financial
Economics, Vol. 69 No. 1, 5–50.
Razzaque, MA and J Keane (2015),
‘Delivering Inclusive Global Value
Chains’, Discussion Paper prepared
for Annual Commonwealth and
Francophonie Dialogue with the G20,
Washington, DC, 7 April 2015.
Rohman, IK and E Bohlin (2012),
‘Does broadband speed really
matter as a driver of economic
growth? Investigating OECD
countries’, International Journal
of Management and Network
Economics, Vol. 2 No. 4, 336–56.

84 \ Commonwealth Trade Review 2018
Rutherford, L and S Zaman
(2017), ‘Unleashing the potential
of Fintech: Developing effective
working relationships with the
private sector’, Discussion Note for
the Commonwealth Central Bank
Governors Meeting, October 2017,
Commonwealth Secretariat, London.
Scott, C (2012), ‘Does broadband
Internet access actually spur
economic growth?’ Paper, Berkeley,
available at: https://people.eecs.
berkeley.edu/~rcs/classes/ictd.pdf
(accessed 17 November 2017).
Soobramanien, TY and L Worrall
(Eds) (2017), Emerging Trade Issues
for Small Developing Countries,
Commonwealth Secretariat, London.
Sturgeon, TJ, T Farole, LO Moncada
and C Pietrobelli (2017), ‘Scale, distance
and remoteness in global value chains’,
in Keane, J and R Baimbill-Johnson
(Eds), Future Fragmentation Processes:
Effectively Engaging with the Ascendency
of Global Value Chains, Commonwealth
Secretariat, London, 13–24.
United Nations (2015), Transforming Our
World: The 2030 Agenda for Sustainable
Development, UN, New York.
United Nations Conference on
Trade and Development (UNCTAD)
(2014), The Oceans Economy:
Opportunities and Challenges for
Small Island Develpoing States.
UNCTAD, Geneva and New York.
UNCTAD (2017a), World Investment Report:
Investment and the Digital Economy,
UNCTAD, New York and Geneva.
UNCTAD (2017b), Information
Economy Report: Digitalization,
Trade and Development, UNCTAD,
New York and Geneva.
UNCTAD (2017c), ‘The role of ICTs
in accelerating the achievement
of the SDGs’, paper presented at
CTSD Inter-sessional panel, 23
January, available at: http://unctad.
org/meetings/es/Presentation/
cstd2016_p06_DoreenBogdan_ITU_
en.pdf (accessed 17 January 2018).
UNCTAD (2018), ‘Global FDI flows
slipped further in 2017’, Investment
Trends Monitor 28, UNCTAD, Geneva.
Vickers, B (2017), A Handbook on
Regional Integration in Africa: Towards
Agenda 2063, Commonwealth
Secretariat, London.
Vickers, B and S Khorana (Eds) (2018),
‘Navigating uncertainty: towards a
post-Brexit trade and development
agenda’, Economic Policy Paper series,
Commonwealth Secretariat, London.
Vickers, B and B Peña-Méndez
(2015), ‘Mobile Technology and
Trade in Sub-Saharan Africa’,
Commonwealth Trade Hot Topics 123,
Commonwealth Secretariat, London.
WeAreSocial (2017), ‘Digital in 2017
Global Overview’, available at: https://
wearesocial.com/special-reports/
digital-in-2017-global-overview
(accessed 10 January 2018).
World Bank (2007), World Development
Indicators, World Bank, Washington, DC.
World Bank (2016), World Development
Report 2016: Digital Dividends,
World Bank, Washington, DC.
World Bank (2017), ‘Global economic
prospects’, World Bank, Washington, DC,
available at: http://pubdocs.worldbank.
org/en/997531493655496869/
Global-Economic-Prospects-
June-2017-Highlights-Chapter-1.
pdf (accessed 17 January 2018).
World Trade Organization
(WTO) (2014), World Trade
Report 2015, WTO, Geneva.
WTO (2015), World Trade Report
2015: Speeding Up Trade: Benefits
and Challenges of Implementing
the WTO Trade Facilitation
Agreement, WTO, Geneva.
WTO (2017a), World Trade
Report 2017: Trade, Technology
and Jobs, WTO, Geneva.
WTO (2017b), Aid for Trade Global
Review 2017. Promoting Trade,
Inclusiveness and Connectivity
for Sustainable Development.
Summary Report, WTO, Geneva.
WTO (2017c), ‘Press release: WTO
upgrades forecast for 2017 as trade
rebounds strongly’, 21 September, WTO,
Geneva, available at: https://www.wto.
org/english/news_e/pres17_e/pr800_e.
htm (accessed 17 January 2018).
WTO (2018), ‘Press release: Trade
growth to sustain momentum in
first quarter of 2018, latest trade
indicator suggests’, 12 February,
WTO, Geneva, available at: https://
www.wto.org/english/news_e/
news18_e/wtoi_12feb18_e.htm
(accessed 17 January 2018).
Zaballos, AG and R Lopez-Rivas (2012),
‘Socioeconomic Impact of Broadband
in Latin American and Caribbean
Countries’ Inter-American Development
Bank, Technical Note No. IDB-TN-471,
available at: https://publications.
iadb.org/handle/11319/5754
(accessed 17 January 2018).
Zhuang, J, E de Dios and A Lagman-
Martin (2010), ‘Governance and
institutional quality and the links
with growth and inequality: how Asia
fares’, in Zhuang, J (Ed.), Poverty,
Inequality, and Inclusive Growth in
Asia: Measurement, Policy Issues,
and Country Studies, Anthem
Press and Asian Development
Bank, London and Manila.