Embed Size (px)
Citation preview
CALVIN G. GRAYSON
SECRETARY
COMMONWEALTH OF KENTUCKY
DEPARTMENT OF TRANSPORTATION
Division of Research
533 South Limestone
Lexington, KV 40508
January 3, 1978
MEMORANDUM TO: G. F. Kemper State Highway Engineer Chairman, Research Committee
JULIAN' M. CARROLL
GovERNOR
H.2.65
SUBJECT: Research Report 486; "Heating the 9th-Street Interchange: Construction and
Initial Operation;" KYHPR-71-65; HPR-PL-1(13), Part II.
The report enclosed comes belatedly with respect to the completion of the interchange and the
performance of the deck-heating system during the past winter; it is premature from the standpoint
of including performance through the current winter. The 4-inch snow of November 27, 1977, was melted
satisfactorily even though a few circuits in the pavement (on embankment) drew too much current and
had to be disconnected. Research observations and reporting are expected to continue through FY '82. At least, a fmal,
summary report will be forthcoming. Operating costs and maintenance may be reported in the interim.
~d Enc. cc's: Research Committee
Irvin S. Griffm
(}esp:ctfully su mitted
~H. Havens Director of Research

Technical Report Documentation Page
1. Report No. 2. Government Accession No. 3. Recipient's Catalog No.
4. Title and Subtitle 5. Report Date
HEATING THE 9th·STREET INTERCHANGE: CONSTRUCTION January 1978
AND INITIAL OPERATION 6. Performing Organization Code
8. Performing Organization Report No.
7. Author(s) 486 w. v. Azevedo, A. s. Rahal. and J. H. Havens
9. Performing Organization Name and Address 10. Work Unit No. (TRAIS)
Division of Research Kentucky Bureau of Highways 11. Contract or Grant No.
533 South Limestone KYHPR· 71·65
Lexington, Kentucky 40508 13. Type of Report and Period Covered
12. Sponsoring Agency Name and Address Interim
14. Sponsoring Agency Code
15. Supplementary Notes
Study Title: Heating Coils in Pavements and Bridge Decks
16. Abstract
The 9th-Street interchange was designed and constructed with an automated,
electrical heating system for snow and fee removal. Thls report describes the heating
system, its construction, and initial operation. The heating system was capable of keeping
the interchange free of ice and snow accumulation. The average daily slab temperature
(ell below 32°F (0°C) on on.ly one o(icasion. The average cost of electrical power for
heating the interchange was $905 per day.
17. Key Words 18. Distribution Statement
heating cable snow and ice removal mineral insulated master controller modified slab temperature slab set point
19. Security Clossif. (of this report) 20. SeCurity Clossif, (of this page) 21. No, of Pages 22. Price
Form DOT F 1700.7 IB-721 Reproduction of completed page authorized


Research Report 486
HEATING THE 9th-STREET INTERCHANGE:
CONSTRUCTION AND INITIAL OPERATION
KYHPR-71-65; HPR-PL-1(13), Part II
by
W. Vernon Azevedo Research Engineer
Assaf S. Rahal Research Engineer Chief
and
Jas. H. Havens Director of Research
Division of Research Bureau of Highways
DEPARTMENT OF TRANSPORTATION Couunonwealth of Kentucky
in cooperation with Federal Highway Administration
U. S. DEPARTMENT OF TRANSPORTATION
The contents of this report reflect the views of
the authors who are responsible for the facts and
the accuracy of the data presented herein. The
contents do not necesSarily reflect the official
views or policies of the Federal Highway Administration
or the Kentucky Bureau of Highways. This report
does not constitute a standard, specification, or regulation.
January 1978


INTRODUCTION
The presence of snow or ice on highways, especially
at bridges and interchanges, often results in hazardous
driving conditions. Conventional snow-and-ice removal
may prove inadequate due to the time lag between ice
and snow accumulation and plowing and(or) salting
operations. Also, deterioration of concrete in bridge
decks is often attributed to the use of deicing chemicals.
A number of non-chemical methods of preventing
freezing have been investigated. One solution for the
control of such conditions is a heating system for bridge
decks and pavements. The system must be capable of
melting any snow or ice that might accumulate on the
roadway. Various systems of heating pavements such as
embedded pipes, embedded electrical elements -- have
been tried in the United States, Canada, and Europe.
Analyses of these systems have confirmed their ability
to remove and prevent the accumulation of snow and
ice on bridge decks and pavements (1 ). However, the
installation and operation of these systems is very
expensive as compared to the cost of conventional snow
removal. The 9th-Street interchange in Louisville, I
64-2(87)3, is subject to extreme conditions of driving
due to the use of maximum interstate grades and
superelevations, the height of the ramps, and the
interchange location near the Ohio River. The major
portions of the ramps are elevated, exposing both the
top and bottom surfaces of the ramps to wind currents.
Conventional snow and ice removal would be
undesirable due to potential traffic congestion.
Therefore, an automated, heating system, with manual
override switches, was deemed necessary for this
location. The 9th-Street interchange was first conceived in
1959 (2). Prelhulnary design began in the early 1960's,
and design began in 1964. Hazelet and Erda! of
Louisville were the principal consultants. They engaged
Bosch and Latour of Cincinnati, Ohio, to design the
electrical heating system, controls, and monitors.
The design criteria established by the Department
are summarized ~s follows: 1. three independent, parallel, 20-watt circuits,
with variable controlled inputs, to provide a
total heating capacity of 60 watts/foot2
(645.8 watts/m2), 2. embedded, mineral-insulated (MI) cables,
interrupted at joints and otherwise
sectionalized, 3. prevent icing and clogging of deck drains and
down pipes, 4. provide building to house controls and
monitors, 5. provide TV monitoring throughout,
6. provide ice detectors at strategic points,
7. provide remote-reading temperature sensors
and recorders, 8. provide meters and indicators of circuit
operation, and 9. provide operating and maintenance manuals
and operator tralulng. The contract for the 9th-Street interchange was
awarded April 27, 1973, to the E. Randle Company and
the R. R. Dawson Bridge Company. The electrical
subcontractor was the Marine Electric Company. The
Nelson Electric Company was contracted to
manufacture the heating cables. Work began on the
project May 17, 1973. The interchange was opened to
traffic and the heating system became operational
December 3, 1976. The fmal acceptance of the project
by the Department was March 29, 1977. The final costs
of the heating system are listed in Table 1.
TABLE 1. HEATING SYSTEM: FINAL COSTS
Electrical Distribution System
Roadway Heating and Connectors
Control Building Instrumentation System TV System
Total
The total project cost was $14,130,645.45.
$715,345.00 720,500.00 204,275.00 168,500.00 69,550.00
$1,878,170.00

DESCRIPTION OF SYSTEM
The 9th-Street interchange (Figure I) consists of 4,108.0 feet (1,252.12 m) of welded, steel plate girder (continuous, composite) bridge ramps and 1,161 feet (353.87 m) of grade ramps for a total length of 5,269.0 feet (1,605.99 m). The width of the ramps ranges from 22.0 feet (6.70 m) to 52.0 feet (15.85 m). The decks are 9 inches (229 mm) thick while the pavements are 10 inches (254 mm) thick. Class AA concrete (6.6 bags/yd3 (368.1 kg/m3)) was used in both bridge and ramp sections. The total area of heated pavement is 174,095 feet2 (16,713.95 m2). The bridge ramps can be heated to a maximum of 60 watts/foot2 (645.83 watts/m2) and the grade ramps can be heated to a maximum of SO watts/foot2 (538.20 watts/m2).
All power for the ramp heating system is supplied by a Louisville Gas and Electric (L.G. & E.) underground cable at 13,800 volts, three-phase, ungrounded. There is a 1,200-amp, 500-MVA, alr-type, circuit breaker ahead of the L.G. & E. meter. The main switch-gear, located in the control building, is supplied with 13,200 volts; the remaining power is for auxiliary purposes. The power level is controlled by a motorized, tap-changing-under-load voltage regulator having 32 steps and a range of 2,200 to 13,200 volts. The voltage regulator (Figure 2), positioned behind the control building, may be controlled manually or by automatic response to various sensing devices.
Power from the voltage regulator is distributed through underground, electrical ducts to five substations where transformers reduce the adjusted high voltage to low voltage levels which can be utilized by the ramp-heating system. Each substation (Figure 3) supplies approximately 2,500 KV A. The maximum, secondary voltage at the substations is 480 volts, phase-to-phase, and 277 volts from neutral to ground. Each substation transformer is equipped with two, main buses to feed two sections of pavement. Each bus has three panels, each having 12, three-pole, 100-amp breakers. Each panel is protected by a ground-fault interrupter (GFI). The secondaries are three-phase, undergrounded, wye-type; each phase returns to neutral. The maximum input to any heater circuit is 270 volts.
Distribution cables ((No.-4 wire) (5.95-mm)) from the substations extend in conduit (Figure 4) to steel, wireway units, termed plinth boxes (Figure 5), on the bridge ramps or concrete hand-holes (Figure 6) on the grade ramps. It is here the distribution cables from the substation connect to the cold section of the embedded, roadway-heating cables.
Three types of plinth boxes are employed. The first is the plinth-feeder box, i.e., entrance box. The distribution cables connect to the cold sections of the heating cables in this unit. The second type is the
2
plinth-expansion box. Connections are made in this type of box between cold leads of adjacent bridge sections so that a bypass may be made around the expansion joint (Figure 7). The third type is the plinth-termination box where the phase leads are joined together to complete the wye-neutral connection. The same type of arrangement is made in the concrete hand-holes for the grade ramps. Both the steel, plinth boxes and concrete hand-holes are designed so that the cover may be removed for periodic inspection or repair of the various cables.
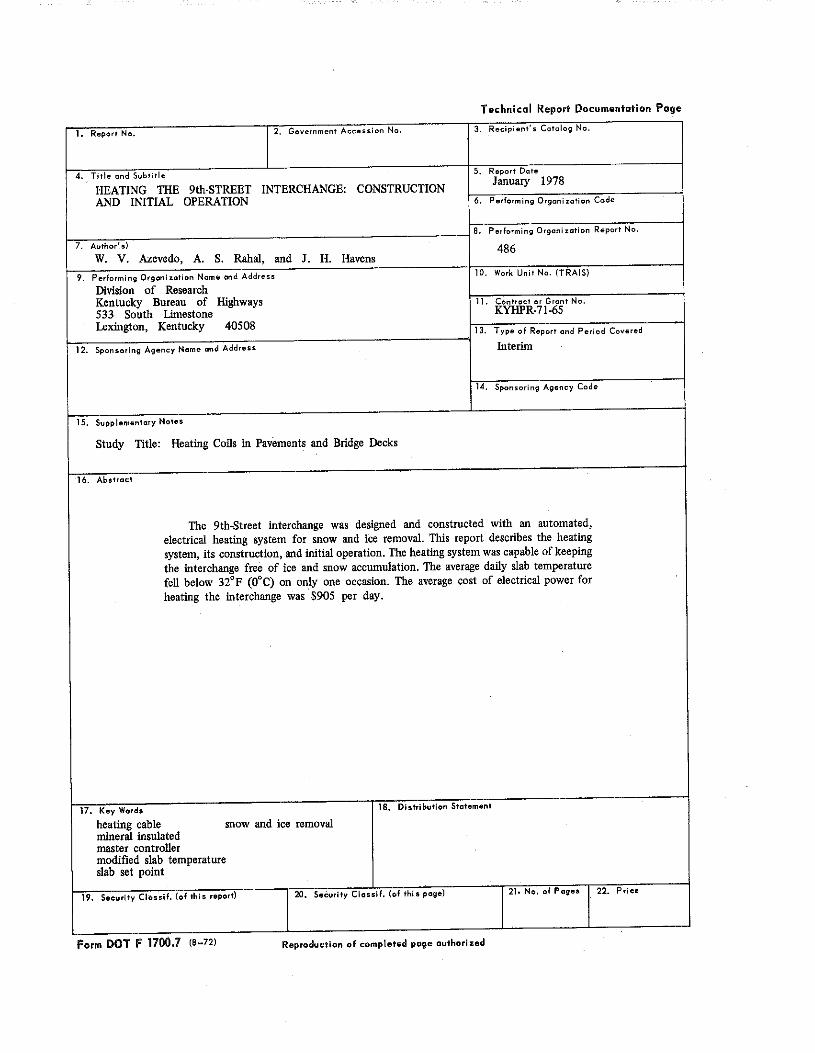
Cold-section cables leave the plinth boxes through ports and are embedded in the lower plinth and curbing concrete. The connection of the hot and cold section of each cable is in the concrete below the curb and gutter. The entrance of the cable to the pavement and position of the cold joint prior to the placement of the concrete is shown in Figure 8. The hot sections of the cables extend various distances across the roadway from the entrance box, then tum to run longitudinally for the length of the ramp unit. At the end of the ramp, they tum and exit on the side opposite their entrance. This pattern continues through three or four ramp sections where the cables exit in the termination box and are joined to complete the neutral "wye" connection. At converging bridge or grade sections, the heating cable is joined to a cold section which passes through a sealed, construction joint box (Figures 9 and 10) to the adjoining pavement and is rejoined to the heating cables.
The 'cable spacing varies to accommodate the reinforcing rod pattern in the respective units. However, the cables are arranged so that each cable is essentially the same length and has the same current for a prevailing voltage, thus assuring uniform heating in the respective units. In addition, phase leads from the three-pole breakers are alternated so that, in the event ·of a three-pole-breaker tripout, three, separate, 6-inch (152-mm), unheated widths alternating with 12-inch (305-mm), heated widths would occur rather than one, 18-inch (457-mm), unheated area.
The heating cables consist of a single, copper (No.-16 wire (1.6-mm))· conductor with magnesium oxide (MgO) insulation in a copper sheath. The cold section, 6 feet (1.83 m), at each end of the heating cable, is No.-6 (5.2-mm), copper wire in a copper sheath.
The system is equipped with closed-circuit television so that the effectiveness of the heated pavement can be monitored visually. Six, pan-and-tilt, zoom-lense TV cameras are mounted on standards above the plinth (Figure II). The housings for the cameras are weatherproof and equipped with window wipers. Shielded, transmission cable extends from each camera to the control room where the six, TV monitors are located.

1-w
FLOODWALL ~~ 1-
"' z <( ::;;
TENTH STREET
"" Figure 1. General Facilities and Location.
... m ... ..,
:;: m :D
l> "' :D 0 ;o: z m
"' -1 -1
"' :D -1 m :D m m -1 m -1
TV-TELEVISION CAMERA-- 8
TC -THERMOCOUPLE 0
DTC- DRAIN THERMOCOUPLE- 0
WS-WEATHER STATION &.
SUB-SUBSTATION 1111

Figure 2. Voltage Regulator.
Figore 3. Typical Substation.
4

Figure 4. Distribution Cables in Coudnit.
5

Figure S.
Figure 6.
6
Typical Plinth Box.
Concrete Handholes, Pavement Section.

Figure 7. Expansion Loop, Expansion Joint.
Figure 8. Position of Cold-Section Junction.
7
Figure 9. Converging Pavement Sections; Jnnction Box at Construction Joint.
Figure 10. Jnnction Box at Constrnction Joint.
II

Figurell. 1V Camera.
Two weather stations are also mounted on
standards above the plinth (Figure 12). Each is capable
of measuring wind speed and direction, outdoor
temperature, and humidity; and each is equipped with
sunshine, rain, and snow detectors.
The system has eleven, thermocouple stations. At
each station there are either six or twelve
thermocouples. Where six are employed, they are in the
drain; where twelve are employed, six are in the gutter
area and six are in the centerline of the deck (Figure
13). One of two surface temperature detectors (Figure
14) can be used for modulation of the voltage regulator.
All drainage troughs and drain pipes are insulated
to prevent icing and clogging. The drain troughs are
insulated with 5/8-inch (16-mm), foamed plastic and
covered with 0.08-inch (2-mm), galvanized steel. The
drain pipes (Figure IS) are insulated with l-inch
(25.4-mm) fiber glass and covered with a O.Dl-inch
(0.2-mm), stainless steel jacket. The control building (Figure 16) is located on Main
Street under the converging sections of Ramps I and
II. It houses the main switchgear, 1V monitors, power
and weather meters, and the Master Controller.
The L. G. & E., 13.8-KV service enters in the
switchgear room. The power is fed through the main
circuit breaker, the main switchgear, and on to the
voltage regulator and then runs underground to the
various substations. The Uninterruptable Power Supply
(Figure 17) is also located in the main switchgear room.
This 20-unit, battery system provides storage of energy
for resetting the voltage regulator and the main circuit
breaker in the event of a power failure.
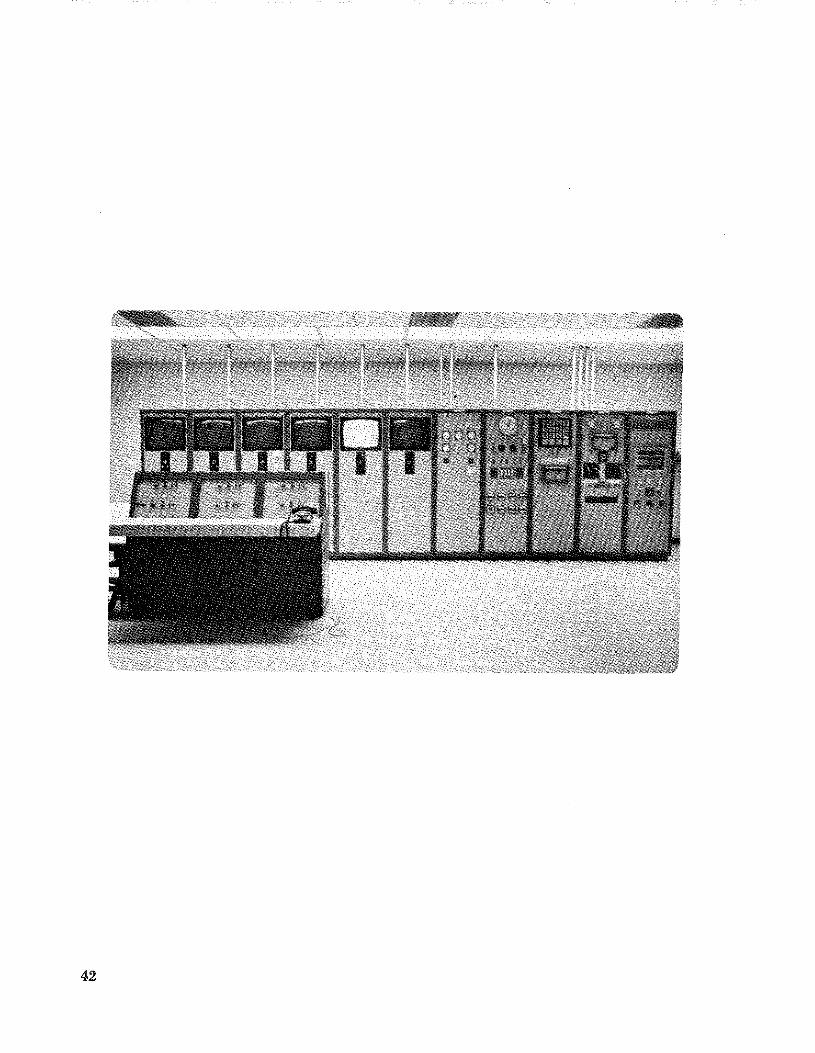
The control room houses the six, television
monitors and various instruments for monitoring the
weather and power levels and for adjusting the heating
system. The individual meters are listed in APPENDIX
A. The TV monitors, power meters, weather
indicators, and thermocouple monitors allow the
operator to stay abreast of current road, weather, and
power conditions at the interchange. The
annunciator-display panel will inunediately indicate the
location of any problem in the electrical system. Two,
failsafe systems protect the electrical heating system
from overheating. One lowers the voltage regulator when
the controlling slab temperature exceeds the set point.
The other failsafe trips the main circuit breaker when
the outdoor temperature is l8°F (-8°C) and the voltage
regulator is on step 33, or when the outdoor
temperature is 75°F (24°C) and the voltage regulator
is on step I.
9

Figure 12.
Figure 13.
lO
Weather Station.
Typical Thermocouple Installation; Centerline of Deck.
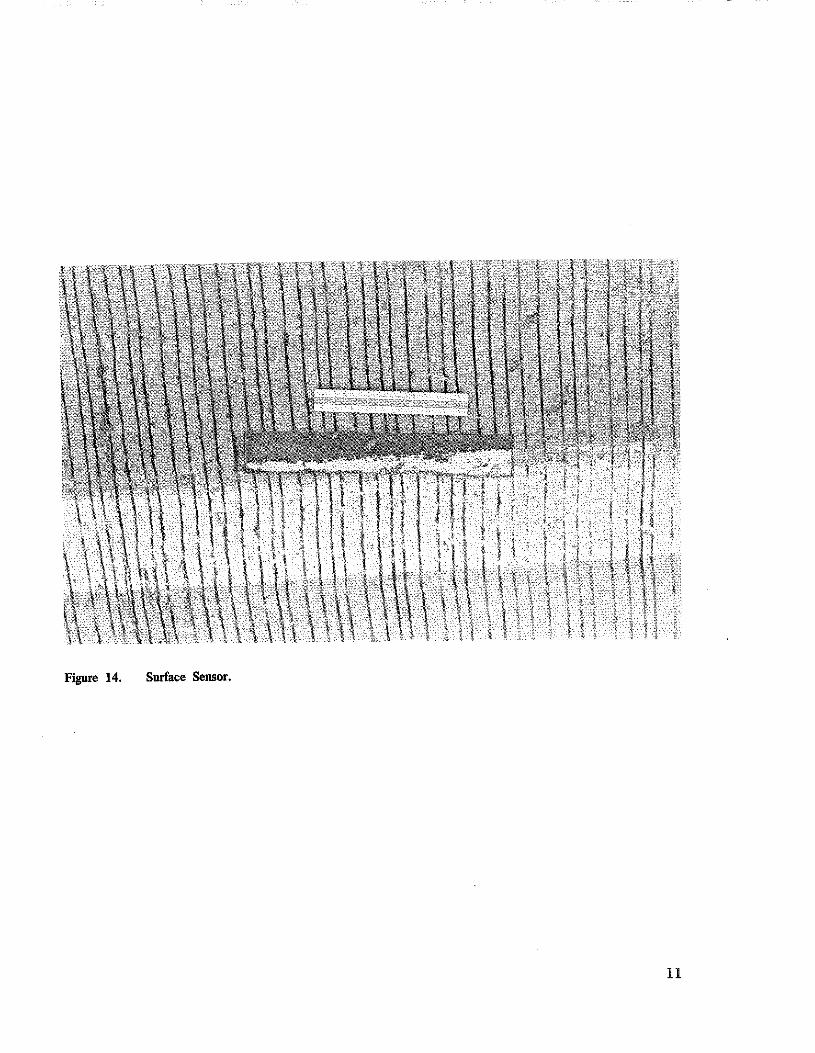
Figure 14. Surface Sensor.
u

Figure 15. Insulated Drain Pipe.
12

Figure 16. Control Building.
Figure 17. Uninterruptable Power Supply.
13
The Master Controller is provided to obtain as full an automatic control as possible. The basic concept is to operate the heating system at a low level of heat when the slab temperature goes above a certain set point. As the temperature drops, slab temperature sensors cause the voltage regulator to increase the voltage into the system. As the temperature increases, the voltage level is reduced. Howevor, various weather parameters, such as barometric pressure, rain, snow, humidity, and others, are programmed into the system so that the system actually operates on the probability of snow and ice rather than the detection of snow or ice. An illustration is given in Figure 18. The slab temperature establishes a base-line condition. As the temperature drops, more heat input goes jnto the slab. The basic, straight-line situation is then changed by the weather factor signal modifiers, represented by the cross-hatched areas between the curve. If weather conditions remain ideal, even though the temperature goes very low, a minimum of heating would be required, as shown by the lower portion of the cross-hatched area. If weather conditions are unfavorable, more heat would be required as shown by the upper portion of the cross-hatched area (3).
There are eleven, signal modifiers affecting the modified slab temperature. The conditions required by the signal modifiers are listed in APPEND IX B. The eight, digital timers on the weather instrumentation console are used by the Master Controller for timing weather condition changes and duration of heating at the various steps. The output of these timers is incorporated into the logic of the Master Controller to automatically establish the amount of power to be delivered to the heating system.
The signal modifiers and slab set point can be set manually on the system control console. The slab set point is a predetermined, slab temperature used by the Master Controller. If the modified, slab temperature as computed by the Master Controller falls below this set point, the Master Controller calls for more heat; if the modified, slab temperature goes above the set point, the controller reduces the amount of heat to the slab. The console is also equipped with two recorders. The Weather Factor Signal Recorder indicates which signal modifiers have been activated by the prevailing weather conditions. The Slab Temperature for Control and Composite Weather Factor Signal Recorder indicates the actual, slab temperature used for control and the modified, slab temperature, as computed by the signal modifiers.
CONSTRUCTION
Original design of the heating cables called for the outer sheath to be stainless steel and of a thickness not
14
less than 22 mils (0.56 mm). The cables in the decks were to be tied at 3-foot (0:91-m) intervals with No.-16 (1.6-mm), stainless steel wire. The cables in the pavements were to be clipped to stainless steel mounting strips which were 10 feet (3.05 m) by I inch (25 mm). The mounting strips were on 3-foot (0.91-m) intervals, and the clips on the strips were on 5 1/2-inch (140-mm) centers. However, due to difficulties in drawing the stainless steel covering, the decision was made to use copper-sheathed, mineral insulated (MI) cable with a minimum, sheath thickness of 24 mils (0.61 mm). This necessitated a means of relieving galvanic action between the copper sheath and the reinforcing steel. To insulate between the copper sheath and the reinforcing steel, the top mat of steel, including the truss bars, in the decks and the entire, reillforcing mats in the pavements were epoxy-coated. Copper, tie wire replaced the stainless steel, tie wire. The stainless steel, mounting strips were replaced by 1/4-inch (6.4-mm), solid, copper rods on 2-foot (0.61-m) intervals. All chair or bar supports were to be epoxy-coated or of a rustproof material.
Mineral-insulated cable is very rugged, and its use is widespread. It can be hammered almost flat without destroying its operating characteristics; however, it still must be handled and installed with great care. A small cut in the sheath would permit moisture to enter and destroy the electrical, insulating properties of the magnesium oxide (3).
The heating cables were delivered to the job site in pre-cut lengths and with the cold sections attached at the factory. The cables were called and packaged in individual, cardboard boxes.
All work, except the concreting, was completed on the decks before cable installation began. Prior to being positioned on the decks, the cables were lubricated with a Dow Corning silicone compound (Figure 19). The lubricant was used to prevent the adherence of the concrete to the surface of the cable. Individual cables were played out from reels and stretched the length of the deck for proper positioning (Figure 20). The heating cables were to be no closer than I 1/2 inches (38 mm) horizontally to any, longitudinal, reinforcing bar or no closer than 4 inches (102 mm) to another heating cable or at a distance not greater than 6 inches (!52 mm) apart. However, some deviations (Figure 21) in this spacing occurred due to variations in cable length as received from the manufacturer. After positioning the cables on the deck, the cables were tied with copper tie wire at 3-foot (0.91-m) intervals (Figures 22 and 23). All electrical connections were made according to conventional, wiring codes. Plywood walkways (Figure 20) were provided for construction workers, preventing damage to the cables prior to the placing of concrete.

UNFAVORABLE WEATHER
IJJ (!)
~ :..J 0 >
~
CONDITIONS
Figure 18. Modified, Slab Temperature CondilioiiS.
IDEAL WEATHER
CONDITIONS
LOW
TEMPERATURE
15

Figure 19.
Figure 20.
16
Lubricating Heating Cables prior to Installation.
Individually Packaged Cables, Reels Used for Installation of Cables aod Plywood Walkways for Workers.

Figure 21. Variations in Cable Spacing due to Improper Lengths.
Figure 22. Workman Securing Heating Cable to Reinforcing Steel.
17

Figure 23. Heating Cables Positioned On Deck and Tied To Reinforcing Steel.
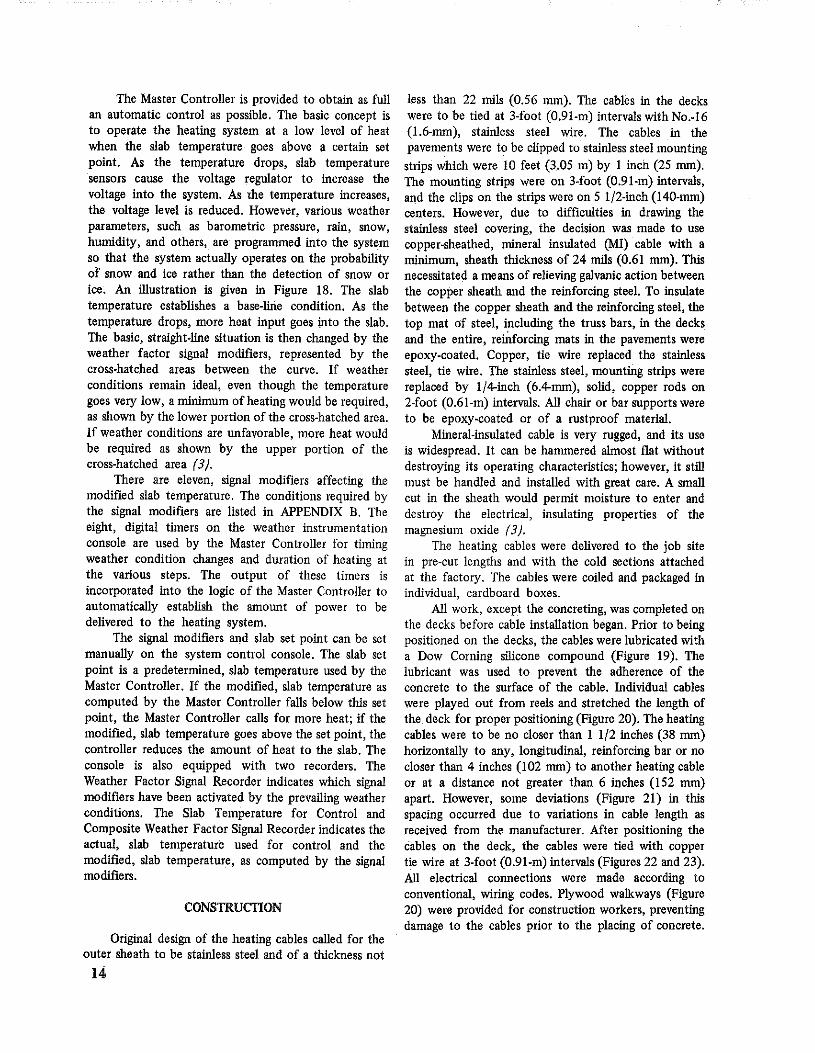
Concrete was placed with a crane and bucket. The finishing machine used was a self-propelled, rail-mounted, Bidwell finishing-machine with a rotating drum, front-mounted auger and a drag-type plate. Concrete was dumped ahead of the finishing machine from approximately 1 1/2 feet (0.46 m) above the heating cables (Figures 24 through 26). No apparent damage or displacement of the heating cables occurred as a result of dropping the concrete from this height (Figure 27). The concrete was partially leveled with specially modified shovels and rakes (Figure 28). Tubing was welded to the sharp edges of these tools to prevent damage to the cables. The concrete was vibrated by hand-held, portable vibrators (Figure 29). Workmen stood on plywood walkways (Figure 24) which were continually backed away as the concreting operation progressed. The concrete was cured in a normal manner.
Each cable assembly was tested for continuity and insulation resistance before, during, and after concreting operations (Figure 30). Each cable assembly was required to measure not less than 200 megohms. Of the I ,800 cables in the system, only one failed during concreting operations. 18
After 30 feet (9.14 m) of concrete had been placed in Ramp 3 (R3-II-IB), resistance in a cable at the gutterline dropped below the required 200 megohms. As concreting continued, the damaged cable was removed from the fresh concrete and a replacement cable was installed in its place (Figures 31 through 33). The replacement cable was tied at irregular intervals with copper wire. The concrete was replaced around the new C)lble and floated by hand. No revibration of the concrete occurred. The completed interchange is shown in two, aerial photos taken December 2, 1977 (Figures 34 and 35).
Upon completion of the interchange, the electrical heating system underwent a full-load test to detennine the integrity of the system. At a time when the outdoor temperature was predicted to be below 20°F (·7°C) for a period of 24 hours or longer, the system was advanced to full load (step 33) at regular intervals. The system was required to maintain a stabilized condition at this load with all heating cables, power, weather, and recording instruments functioning properly. The results of this test are listed in APPENDIX C.
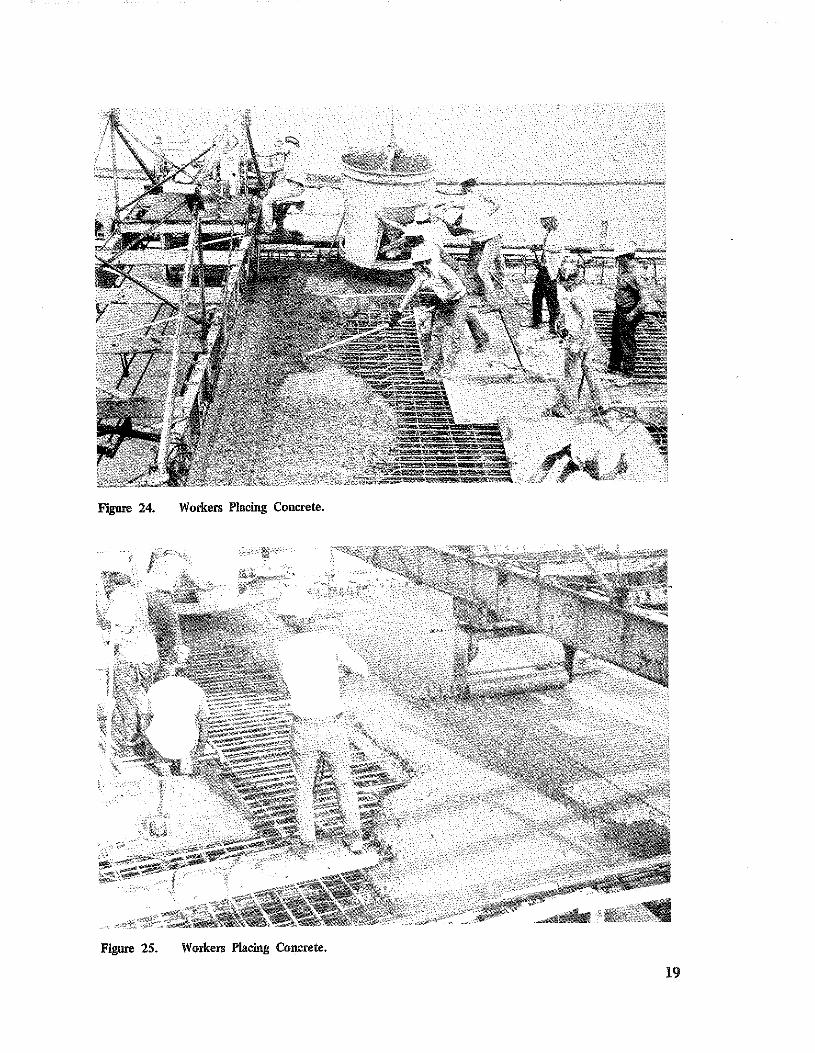
Figure 24. Workers Placing Concrete.
Figure 25. Workers Placing Concrete.
19

Figure 26. Worker Leveling Concrete.
Figure 27. Heating Cables in Fresh Concrete.
20
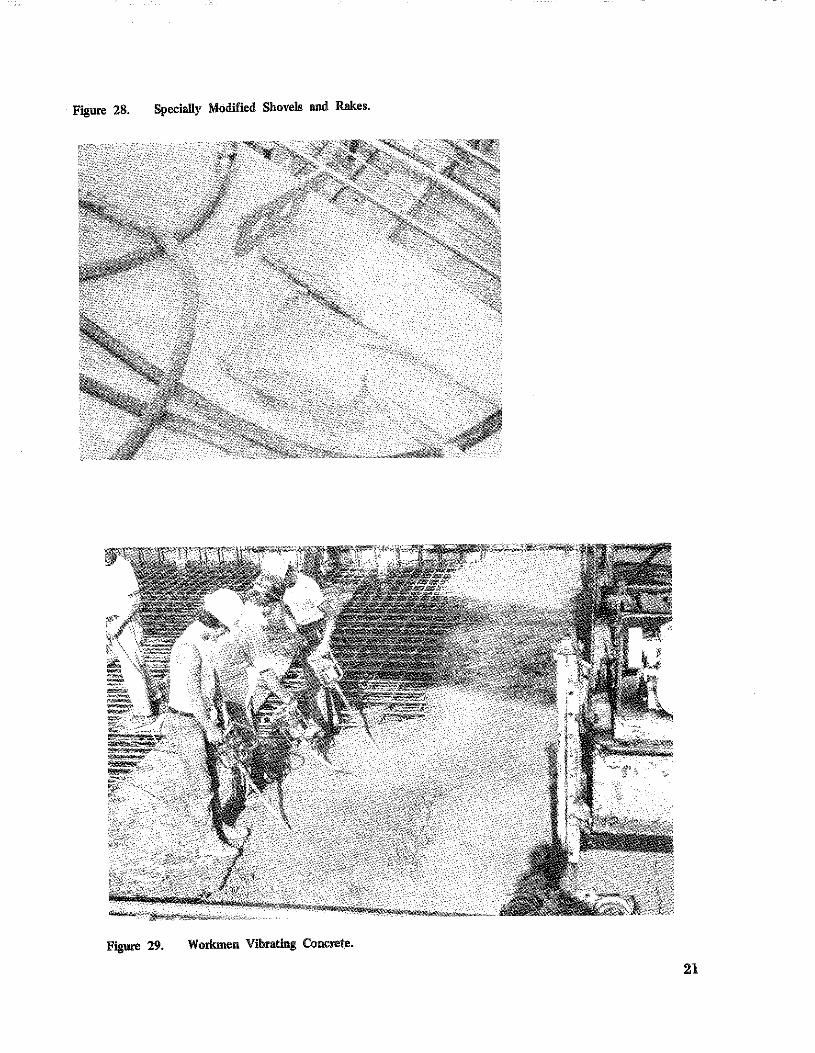
Figure 28. Specially Modified Shovels and Rakes.
Figure 29. Workmen Vibrating Concrete.
21

Figure 30.
Figure 31.
22
Testing Cable Resistance during Concreting Operations.
Workmen Removing Damaged Cable from Fresh Concrete.

Figure 32.
Figure 33. Replacing Concrete around New Heating Cable.
Damaged and Replacement Cable
in Fresh Concrete.
23

..;
~ i " -..
:.e " .s .;
l 1:! .. ll -~ ~ -· "' -.i "' .~ ~
24

Figure 35. 9th-Street Interchange, Looking Upstream.
25

DISCUSSION
The 9th-Street interchange was opened to traffic December 3, 1976. The initial operating season extended through April 16, 1977. The heating system was in operation at various levels throughout this period.
Monthly weather summaries are listed in Table 2. Figures 36 through 39 compare the average, daily, slab temperature to the average, daily, air temperature as recorded at the 9th-Street interchange and the United States Weather Bureau. The position of the thermocouple used in determining the average slab temperature was at the surface of one of the bridge ramps. On only one occasion, January 10, 1977, during the period December 30, 1976, to April 16, 1977, did the average, slab temperature fall below 32'F (O'C). This was the date of the greatest snowfall (7 .8 inches (198 mm)) of the winter season. Visual observations throughout this period indicated that both the deck and pavement sections were kept free of snow and ice accumulation. Figures 40 and 41 show the transition between heated and non-heated pavements during a period of snow accumulation. Both pictures were taken of the same snowfall. The official ground cover for this day was 5 inches (127 mm) of snow. In Figure 40, note the accumulation of snow on the plinth and curb and patches of snow directly above the roadway drains 'in the gutterline. These are non-heated areas. Figure 42 is an aerial view of the entire interchange taken on January II, !977. The photo clearly shows the difference between heated and non-heated sections during severe cold and snow accumulation.
On January 10, 1977, a short circuit in a plinth box caused a portion of one bridge ramp (R4-I-4A) to be without heat for four days (January 10 through January 13). The largest snowfall of the winter season occurred during this period. However, a combination of adjoining, heated pavement and traffic was able to keep this section of pavement clear of ice in the wheel tracks (Figure 43). Inspection of the plinth boxes on this bridge ramp revealed the cause of the short circuit. An apparent build up of heat within the plinth box had melted the insulation on the cables, thus allowing bare wires to come in contact. The damaged wires (No. 6 (5.2 mm)) were replaced with No.-4 (6.0-mm) wires, and heat was restored to the bridge section. An inspection of all plinth boxes followed and a decision was made to ventilate all plinth boxes and separate the cables within the boxes to prevent further damage to the cables from excessive heat (Figure 44). All plinth boxes were opened and have remained open since that date with no further damage occurring. The cost to the Department for repair of the cables was approximately $5,000.
26
Heating the 9th-Street interchange on the probability of snow appears to be an advantage over other roadway heating systems because it does not require. "catch~up" time after a snowfall to clear a pavement but rather keeps the interchange clear as the snow falls.
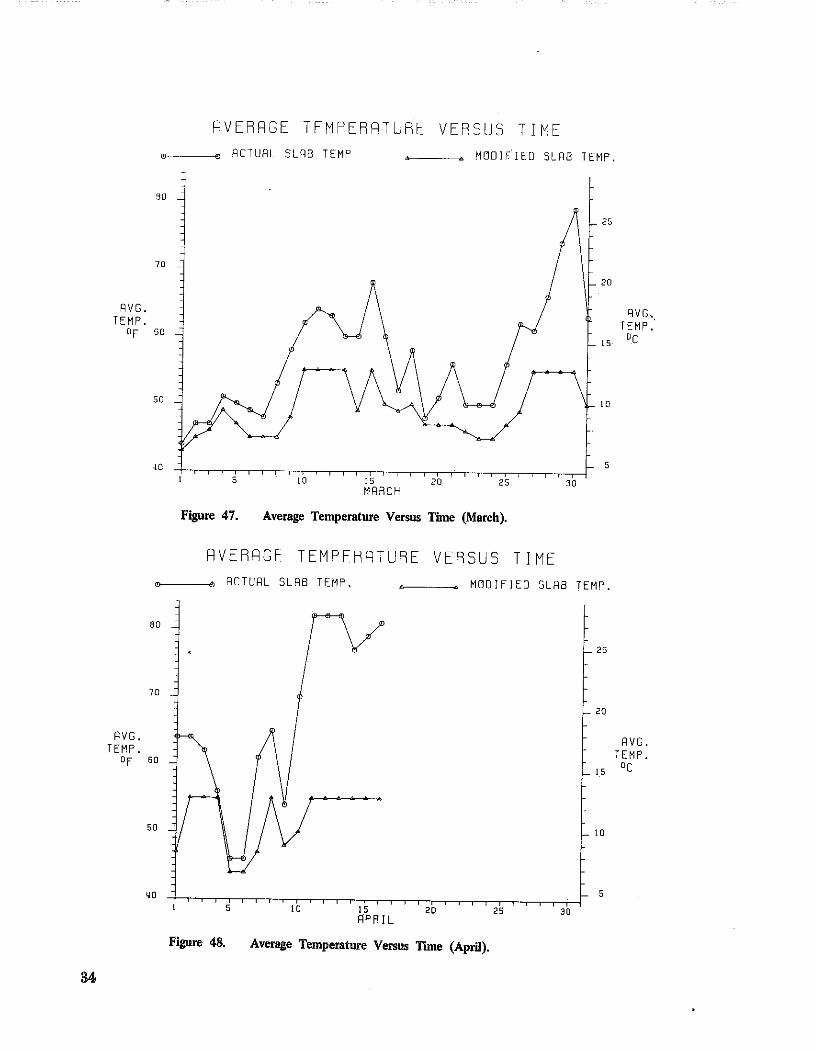
Figures 45 through 48 show the actual slab temperature compared to the modified slab temperature as computed by the Master Controller for the period January I, !977, to April 16, 1977. The average, modified, slab temperature is slightly lower than the average, actual, slab temperature throughout this period, because the heating system is based on the probability rather than the actual occurrence of bad weather. In Figures 45 through 48, any average, modified, slab temperature above SO'F (IO'C) is recorded as 55'F (!3'C).
A slab set point of 38'F (3'C) was adjudged to be the temperature at whiCh, under normal conditions, the Master Controller should call for more heat. This allows for a time lag in which the slab may begin to heat as snow and ice conditions approach. The set point was adjusted to as high as 41 'F (5'C) by the operator when threatening conditions prevailed. Although compensation is made by the signal modifiers for rapidly changing weather conditions, the voltage-raise timer must also be adjusted as is the slab set point. The schedule listed in Table 3 was used as a guide for setting the voltage-raise timer. Care was exercised in adjusting both the slab set point and the voltage-raise timer as a sudden increase in the voltage could damage the cables or thermally shock the concrete.
It must be noted that the above conditions. apply to "automatic operation". The operator may adjust the voltage regulator manually as he deems necessary.
The power usage and costs for the heating system are listed in Table 4. The cost for heating the interchange from December 9, 1976, through April16, 1977, was $0.79/foot2 ($8.50/m2). These costs do not include labor charges for operators who monitor the interchange 24 hours per day throughout the year. An agreement with the electrical subcontractor for maintenance of the system has been estimated to be $50,000 per year.
The cost of operating the heating system is dependent on several factors. The weather greatly determines the power required to heat the pavement. January of 1977 had the lowest, average temperature for any month dating back to 1872. The 19.6 inches (498 mm) of snow made it the snowiest January since 1918 for the Louisville area. Manual settings of the signal modifiers and the slab set potnt may also affect the amount of heat input to the slab. The voltage-raise-and-lower timers affect the power demand

by controlling the time allowed the voltage regulator
for increasing or decreasing the heat input to the slab.
The opinion of the operator, in judging weather
conditions and the probability of snow or ice,
determines the settings for these instruments.
Some time after April 16, 1977, a longitudinal
crack, approximately 310 feet (94 m) iri length, wa•
noted in Ramp 1 (Rl·I·3B-SB) (Figure 49). Some
transverse cracking in this ramp and in Ramp 3
(R3-III-IB) were noted in the fall of 1977 (Figure 50).
The cracking appears to have had no effect on till
integrity of the heating system at this time.
On November 25, 1977, Load Center l·A was
tripped by the ground-fault interrupter (GFI). To restore
power, four breakers, in three panels of Load Center
1-A, had to be opened. Upon checking the resistance
records, these circuits were found to have low
resiStances. The resistance measurements of these
TABLE 2. MONmLY WEAmER SUMMARIES
High Temperature Low Temperature Avelllie Temperature Largest Snowfall/Date Greate~t Accumulation/Date
Total Snowfall
DECEMBER
6S"F (lS"C) 2"F (-17"C) 33.l'F (l"C)
0.9 in. (23 nun)/12-29-76
1.0 ln. (25 mm)/12-29-76 1.1 in. (28 mm)
JANUARY
42"F (6"C) -13"F (-25"C) l8.6"F (-7'C)
7.8 in. (198 mm)/1-9,1Q.-77
9 in. (229 mm)/l·ll-77 19.6 in. (498 mm)
circuits from JQ!y 1976 and September 1977 are listed
in Table Sc The cables in these circuits are in the
pavement section of Ramp 1 (R1·1·3B-SB). Although the
cables from these breakers are adjacent to each other
in sections of the· pavement, neighboring cables have
kept the pavement clear of any snow or ice
accumulation (4 inches (102 mm) recorded November
27, 1977) during the first snowstorms of the winter
season. The heating system at the 9th-Street interchange
has proven functional; but no economic justification has
been attempted. There are no data pertaining to
conventional snow removal costs in the Louisville
District or to actual maintenance costs of the heating
system. Future research efforts will include the
monitoring of deck temperatures at various depths and
the establishment of defmite operational settings for the
logic system of Master Controller.
FEBRUARY MARCH APRIL
75"F (24"C) Sl"F (28"C) 86"F (30'C)
s'F- (-ts'C) 22'F (·6"C) 33'F (l'C)
36.9'F (3'C) 51.7'F (li"C) 60.3°F (16'C)
0.4 in. (10 mm)/2-19,20-77 0.1 ln. (3 mm)/3-22-77 0.8 in. (20 mm)/4-5,6-77
2.0 in. (51 mm){2-3·77 Trrv::e{3·22-77 Trace/46-77
0.8 ln. {20 mm) 0.1 in. (3 mm) 0,8 ln. (20 mm)
RVERRGE TEMPERRTURE VERSUS TIME
40
30
RVG. 20
TEMP. Of
10
0
-10
Figure 36.
AIR-WERTHER SERVICE RIR-EKGINEER'S LOG
10 15 JANUARY
20
Average Temperature Versus Time (January).
SLAB
5
0
-5
AVG. TEMP.
-10 oc
.o.tS
-20
30
27

28
50
50
RVG. 40
TEMP. "F
30
20
10
80
70
RVG. so TEMP.
Of
50
40
RVERRGE TEMPERRTURE VERSUS TIME
5
Figure 37.
RIA-WERTHER SERVICE RIA-ENGINEER'S LOG
10 15 FEBRUARY
20 25
Average Temperature Versus Time (February).
5LR8
RVERRGE TEMPERRTURE VERSUS TIME
Figure 38.
RIA-WERTHER SERVICE RIA-ENGINEER'S LOG
10 15 MARCH
20
Average Temperature Versus Time (March).
5LR8
30
30
15
10
5 RVG.
TEMP. oc
0
-5
-10
25
20
RVG. 15 TEMP.
oc
10
5

80
70
RVG. TEMP.
DF 60
50
YO
AVERAGE TEMPERATURE VERSUS TIME
5
AIR-WERTHER SERVICE RIR-ENGINEER'5 L~G
10 IS RPRIL
20 25
Figure 39. Average Temperature Versus Time (April).
SLAB
25
20
RVG. TEMP.
15 oc
10
5
30
29

Figure 40. Heated Pavement (January 14, 1977).
Figure 41. Non-Heated Pavement (January 14, 1977).
30
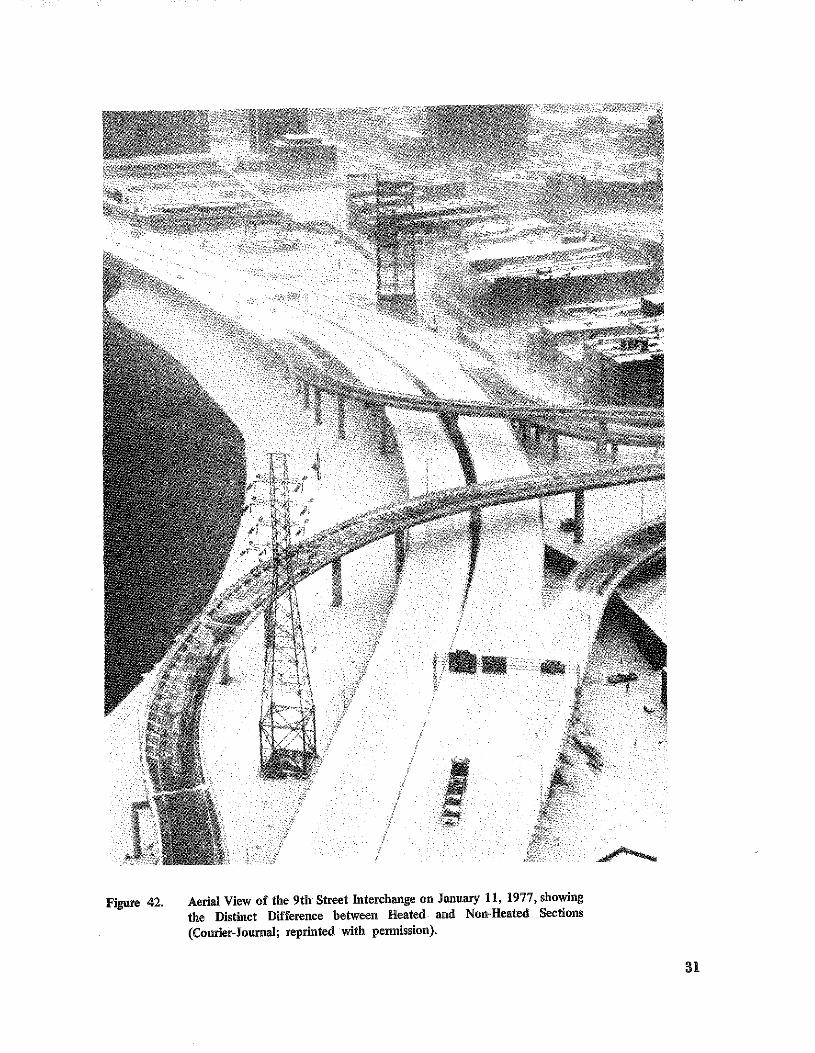
Figure 42. Aerial View of the 9th Street Interchange on January 11. 1977, showing
the Distinct Difference between Heated and Non-Heated Sections
(Courier-Jonmal; reprinted witb permission).
:n

Figure 43. January 14, 1977; R4-I-4A Heating System Inoperative.
Figure 44. Opened Plinth Boxes with Cable Separators. 32

45
40
AVG. fEMP. 3'j
Of
30
25
55
50
AVG. TEMP.
Of 45
40
AVERAGE TEMPERATURE VERSUS TIME
ACTUAL SLAB TEMP MODIFIED SLAB TEMP
5
Figure 45.
I 0 IS JANUARY
20 25
Average Temperature Versus Time (January).
AVERAGE TEMPERATURE VERSUS TIME
6
4
2
0
-2
-4
30
ACTUAL SLAB TEMP. MOGJFJED SLAB TEMP
14
12
10
B
6
4
5 10 tS 20 25 FEBRUARY
Fiilure 46. Average Temperature Versus Time (February).
AVG TEMP
oc
AVG. TEMP.
oc
33
30
70
AVG. TEMP.
"F 60
50
40
80
70
RVG. TEMP.
'F 60
50
34
AVERAGE TEMPERATURE VERSUS TIME ACTUAL SLAB TEMP MODIFIED SLAB TEMP.
5 10 15 20 25 30 MARCH
Figure 47. Average Temperature Versus Time (March).
AVERAGE TEMPERATURE VERSUS TIME ACTUAL SLAB TEMP. MODIFIED SLAB
Figure 48.
I 5 APRIL
Average Temperature Versus Time (April).
25
20
15
10
5
TEMP.
25
20
15
10
5
AVG. TEMP.
oc
RVG. TEMP. oc

TABLE 3. VOLTAGE-RAISE TIMER SETTINGS
Ambient Temperature 0° - 20°F (-18° - -7°C)
Voltage Regnlator Step Voltage Timer Setting
1 - 10 11 - 17 18 - 22 23 - 27
001.0 Minute 003.0 Minute 007.0 Minute 020.0 Minute
Ambient Temperature 2C - 38°F (-6° - 3°C)
Voltage Regulator Step Voltage Timer Setting
1 - 10 002.0 Minute
11 - 15 005.0 Minute
16 - 20 015.0 Minute
21 - 24 020.0 Minute
25 - 27 030.0 Minute
Ambient Temperature Greater Than 38°F (3°C)
Voltage Regulator Step Voltage Timer Setting
1 - 5 6 . 10. 11 and Above
005.0 Minute 010.0 Minute 020.0 Minute
Fastest Possible Settings During Snowmg Conditions
Voltage Regulator Step Voltage Timer Setting
1 • 10 ll - 15 16 - 20 21 - 25 26 and Above
Immediate 002.0 Minnte 004.0 Minute 008.0 Minute 020.0 Minute
35

TABLE 4. POWER USAGE AND COSTS
NUMBER AVERAGE PERIOD OF DAYS KWH KWH/DAY COST
12-9-76 . 1-10-77 32 2,011,200 62,850 $50,765.62 1-11-77 . 2-8-77 29 2,505,600 86,400 63,484.30 2-9-77 . 3-10-77 30 648,000 21,600 16,618.09 3-11-77 • 4-8-77 29 230,400 7,945 5,952.84 4-9-77 • S-10-77* 32 28,800 900 797.36
12-9-76 • S-10-77 !52 5,424,000 35,684 137,618.21
*Heating system tnrned off 4-16-77; billing cycle through 5-10-77.
Fignre 49. Crack Found in Ramp I after April 16, 1977; Photo Taken December I, 1977.
36
AVERAGE COST/DAY
$1,586.43 2,189.11
553.94 205.27
24.92
905.38

TABLE 5. RESISTANCE MEASUREMENTS
RESISTANCE MEASUREMENTS
WAD CENTER PANEL BREAKER JULY 1976 SEPTEMBER 1977
1-A 1 7 too n 2,soo n 8 100 n t,8oo n
1-A 2 7 8 Mil 100 n 1-A 3 3 12s,ooo n 2,400 n
Figure 50. Crack Found in Rllmp 3 in Fall of 1977; Photo Taken December 1, 1977.
REFERENCES
1. Roy Jorgensen and Associates, Non-Chemical Methods of Snow and Ice Control on Highway Structures, National Cooperative Highway Research Program, Report 4, Highway Research Board, 1964.
2. Havens, J. H., Heating the 9th-Street Interchange, Louisville, Kentucky, Division of Research, Kentucky Department of Transportation, September 1974.
3. Bosch and Latour, Preliminary Design Submittal of Electrical Snow Melting, 9th-Street Interchange, Louisville, Kentucky, August 1971.
37

38

APPENDIX A
CONTROL ROOM INSTRUMENTATION
39

40
APPENDIX A
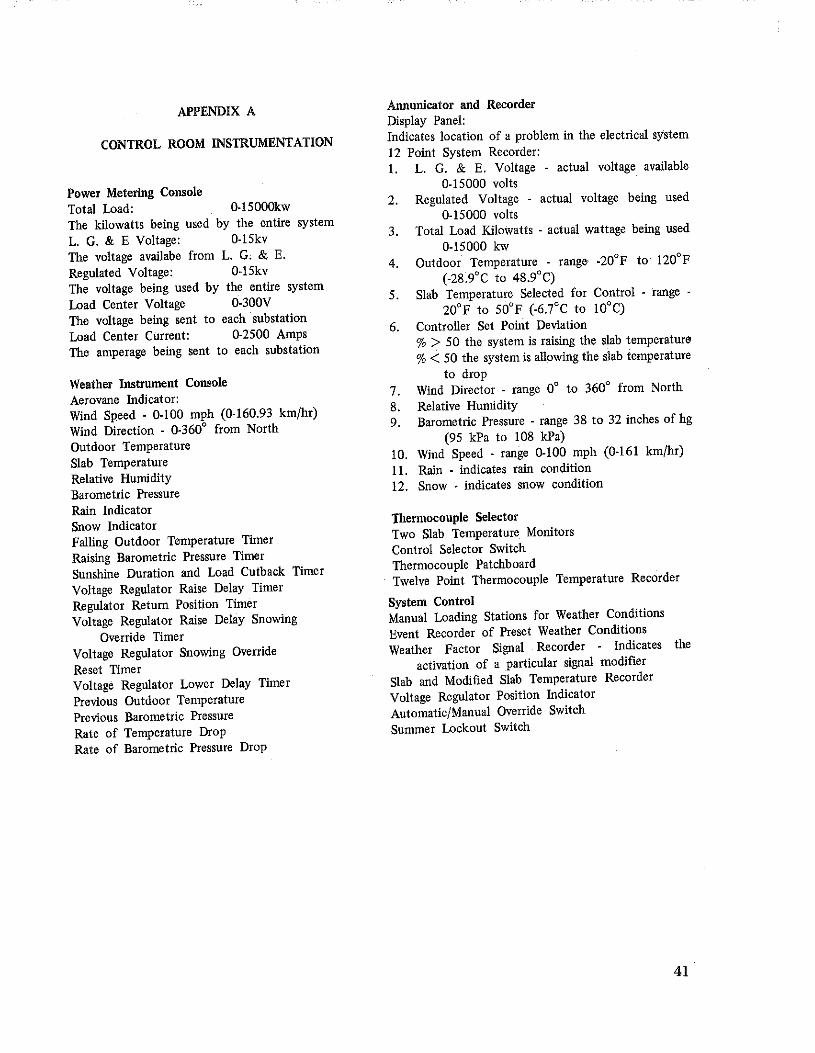
CONTROL ROOM INSTRUMENTATION
Power Metering Console Total Load: 0-15000kw
The kilowatts being used by the entire system
L. G. & E Voltage: 0-15kv
The voltage availabe from L. G, & E.
Regulated Voltage: 0-15kv
The voltage being used by the entire system
Load Center Voltage 0-300V
The voltage being sent to each substation
Load Center Current: 0-2500 Amps
The amperage being sent to each substation
Weather Instrument Console Aerovane Indicator: Wind Speed - 0-100 mph (0-160.93 km/hr)
Wind Direction - 0-360° from North
Outdoor Temperature Slab Temperature Relative Humidity Barometric Pressure Rain Indicator Snow Indicator Falling Outdoor Temperature Timer
Raising Barometric Pressure Timer Sunshine Duration and Load Cutback Timer
Voltage Regulator Raise Delay Timer
Regulator Return Position Timer Voltage Regulator Raise Delay Snowing
Override Timer Voltage Regulator Snowing Override
Reset Timer Voltage Regulator Lower Delay Timer
Previous Outdoor Temperature
Previous Barometric Pressure Rate of Temperature Drop Rate of Barometric Pressure Drop
Annunicator and Recorder Display Panel: Indicates location of a problem in the electrical system
12 Point System Recorder: I. L. G. & E. Voltage - actual voltage available
0-15000 volts 2. Regulated Voltage - actual voltage being used
0-15000 volts 3. Total Load Kilowatts - actual wattage being used
0-15000 kw 4. Outdoor Temperature - rang<> -20°F to· 120°F
(-28.9°C to 48.9°C) 5. Slab Temperature Selected for Control - range
20°F to 50°F (-6.7°C to 10°C)
6. Controller Set Point Deviation % > SO the system is raising the slab temperatur&
% < 50 the system is allowing the slab temperature
to drop 7. Wind Director - range 0° to 360° from North
8. Relative Humidity 9. Barometric Pressure - range 38 to 32 inches of hg
(95 kPa to 108 kPa)
10. Wind Speed - range 0-100 mph (0-161 km/hr)
11. Rain - indicates rain condition
12. Snow - indicates snow condition
Thermocouple Selector Two Slab Temperature Monitors Control Selector Switch Thermocouple Patchboard Twelve Point Thermocouple Temperature Recorder
System Control Manual Loading Stations for Weather Conditions
Event Recorder of Preset Weather Conditions
Weather Factor Signal Recorder - Indicates the
activation of a particular signal modifier
Slab and Modified Slab Temperature Recorder
Voltage Regulator Position Indicator
Automatic/Manual Override Switch
Summer Lockout Switch
41
42

APPENDIX B
MANUAL LOADING STATIONS (MLS)
PRESET WEAdHER CONDITIONS
43

44
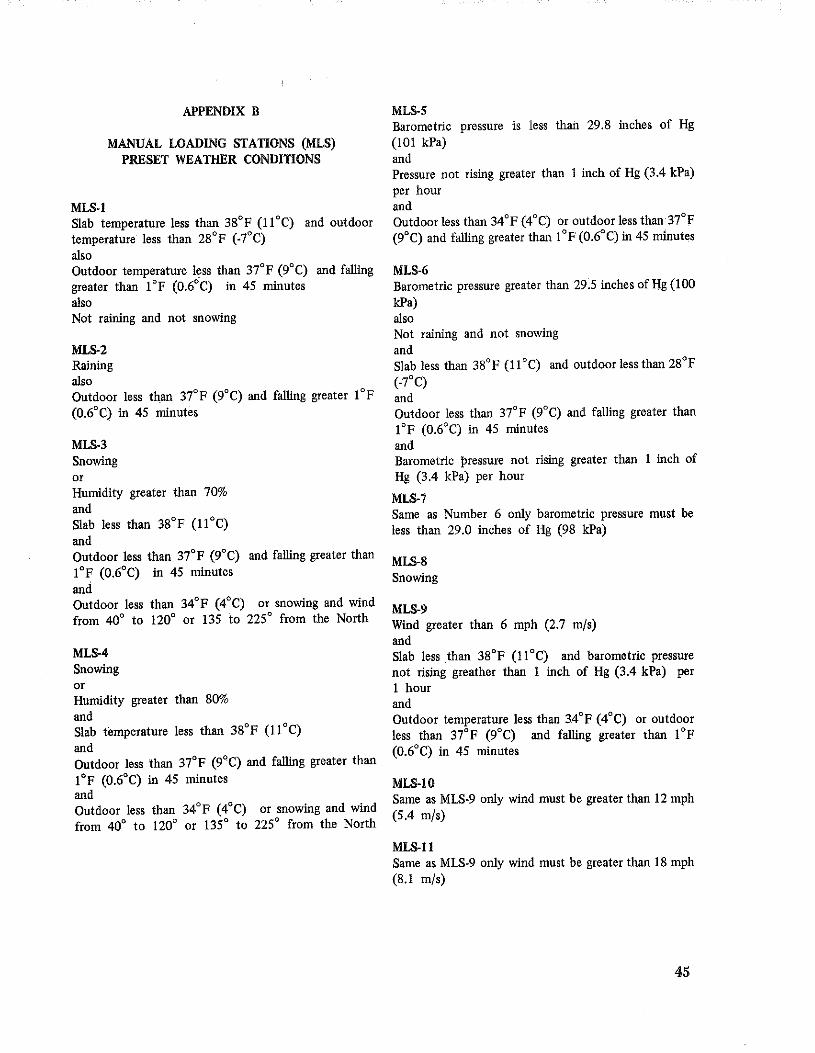
APPENDIX B
MANUAL LOADING STATIONS (MLS) PRESET WEATHER CONDITIONS
MLS-1 Slab temperature less than 38°F (11 °C) and outdoor temperature less than 28 oF ( · 7° C) also Outdoor temperature less than 37°F (9°C) and falling greater than 1 °F (0.6°C) in 45 minutes also Not raining and not snowing
MLS-2 Raining also Outdoor less than 37°F (9°C) and falling greater I °F (0.6°C) In 45 minutes
MLS-3 Snowing or Humidity greater than 70% and Slab less than 38°F (11 °C) and Outdoor less than 37°F (9°C) and falling greater than l°F (0.6°C) in 45 minutes and Outdoor less than 34°F (4°C) or snowing and wind from 40° to 120° or 135 to 225° from the North
MLS-4 Snowing or Humidity greater than 80% and Slab temperature less than 38°F (11 °C) and Outdoor less than 37°F (9°C) and falling greater than I °F (0.6°C) in 45 minutes and Outdoor less than 34 oF ( 4 o C) or snowing and wind from 40° to 120° or 135° to 225° from the North
MLS-5 Barometric pressure is less than 29.8 inches of Hg (101 kPa) and Pressure not rising greater than I inch of Hg (3.4 kPa) per hour and Outdoor less than 34°F (4°C) or outdoor less than 37°F (9°C) and falling greater than I °F (0.6°C) in 45 minutes
MLS-6 Barometric pressure greater than 29.5 inches ofHg (100 kPa) also Not raining and not snowing and Slab less than 38°F (II °C) and outdoor less than 28°F (-70C) and Outdoor less than 37°F (9°C) and falling greater than 1 °F (0.6°C) in 45 minutes and Barometric !>ressure not rising greater than I inch of Hg (3.4 kPa) per hour
MLS-7 Same as Number 6 only barometric pressure must be less than 29.0 inches of Hg (98 kPa)
MLS-8 Snowing
MLS-9 Wind greater than 6 mph (2.7 m/s) and Slab less than 38°F (11 °C) and barometric pressure not rising greather than 1 inch of Hg (3.4 kPa) per I hour and Outdoor temperature less than 34°F (4°C) or outdoor less than 37°F (9°C) and falling greater than I °F (0.6°C) in 45 minutes
MLS-10 Same as MLS-9 only wind must be greater than 12 mph (5.4 m/s)
MLS-ll Same as MLS-9 only wind must be greater than 18 mph (8.1 m/s)
45

46

APPENDIX C
FULL-LOAD TEST RESULTS
47

48

! ~ . :u
t ~ ' e t " '
~~ B a ~ ~
• !!I! ' • ! t'
* '
e: ~ ;: ~ ,, ,. ~ ~ lil ~
~~ ~~ ;;: ~ ~ 9
" ·o
n ,,
~~ w " ,, & '
~· e ~~ - ' "' i ~ ;,~
;;~
!! ••
' ~~ ~~ ,,
h -'-~e
" ~ H
~i, ~§ •'
~~ t· ·' I I ~
~ rr ! IH
l±:
Jk le I I I!
' I ii! I! 11 Ia 1- ~--~ r1 ~~~ ~
., le' • '' . ,, '< I~ ' ~ ~~ ~ ~
k c- lb lk~ • ' ~ IH
'~ . -- t ,_ ; I' l . ~ '' ; \j-- '
if ,! It! ! It In ~ ll i ~ . ~·- ! i ' • i. I· • ' I·~ ' . .
I I! . Ill l rl ll ll I ~ ! l hi !t 1---t-' I II J '.I! I I IH I
! I; It ! ~ -~ ~ ! -~ ~ ! It I~ -~ l
~ ! 15 ,! I!- II I! ~~ ~ ~~gt ~ ~ ~~t
_1 ~~ ,l -i: } ~\~ ~ a ~~i
1~-~ !j I} I~ I~ 1--e t n; t ~:: 1:. e ~ t: ~\>~
' ~~w ! ld ~ I~ t ! ll ! ~ I~ l r '! h
~I ' i. . ' I' ' ' ' I' ' It ' ~H ~ ),': ...
r~-~--~ ('<·~"?
49