Embed Size (px)
Citation preview
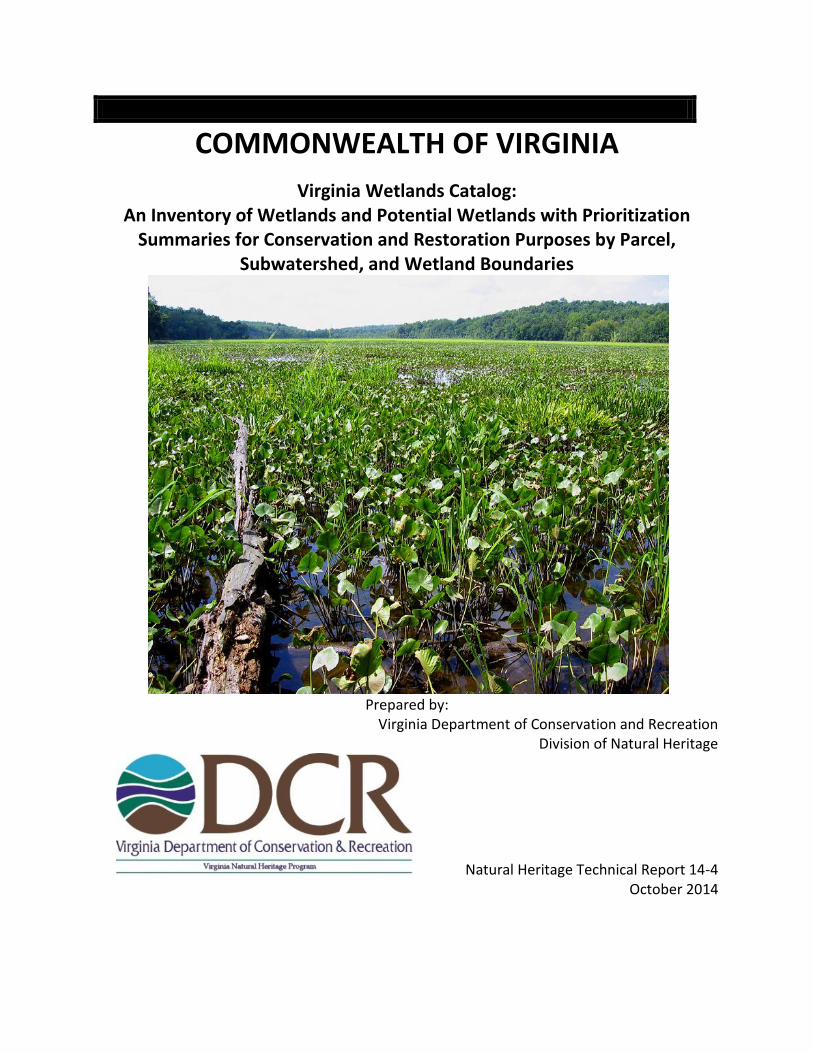
COMMONWEALTH OF VIRGINIA
Virginia Wetlands Catalog: An Inventory of Wetlands and Potential Wetlands with Prioritization
Summaries for Conservation and Restoration Purposes by Parcel, Subwatershed, and Wetland Boundaries
Prepared by:
Virginia Department of Conservation and Recreation Division of Natural Heritage
Natural Heritage Technical Report 14-4 October 2014

Virginia Wetlands Catalog: An Inventory of Wetlands and Potential Wetlands with Prioritization
Summaries for Conservation and Restoration Purposes by Parcel, Subwatershed, and Wetland Boundaries
Natural Heritage Technical Report 14-4
Virginia Department of Conservation and Recreation Division of Natural Heritage
600 East Main Street Richmond, Virginia 23219
(804) 786-7951
This project was funded primarily by the U.S. Department of Agriculture-Natural Resources Conservation Service, with additional funding provided by the Virginia Department of Conservation and Recreation-Division of Natural Heritage, the Virginia Department of
Transportation, and the Nature Conservancy.
Although all data referred to in this documentation have been used by VDCR, no warranty, expressed or implied, is made by VDCR or the original data sources as to the accuracy of the data. The act of distribution shall not constitute any such warranty, and no responsibility is assumed by VDCR in the use of these data. Users must assume responsibility to determine appropriate use of these data, which are not intended to be displayed or analyzed beyond the maximum scale. Feature boundaries in this dataset are not to be used for legal descriptions of these areas. Please contact the proper agency or organization with questions concerning ancillary data sets used in, but not created by, VDCR. The redistribution of this dataset for profit is prohibited.
This document may be cited as follows: Weber, J. T. and J. F. Bulluck 2014. Virginia Wetlands Catalog: An Inventory of Wetlands and Potential Wetlands with Prioritization Summaries for Conservation and Restoration Purposes by Parcel, Subwatershed, and Wetland Boundaries. Natural Heritage Technical Report 14-4. Virginia Department of Conservation and Recreation, Division of Natural Heritage. Richmond, Virginia 49 pp.

Executive Summary The primary funder of the 2014 Virginia Wetlands Catalog (VWC), the U.S. Department of Agriculture--Natural Resources Conservation Service (NRCS), needed a tool for ranking Wetlands Reserve Easements (WRE) under the Agricultural Conservation Easements Program (ACEP) for their values related to wildlife habitat and water quality. Other funders, including the Virginia Department of Conservation and Recreation--Division of Natural Heritage, the Virginia Department of Transportation and the Nature Conservancy, had various needs for a tool that could be used to prioritize wetland parcels for conservation or restoration purposes; that could make project design more efficient; that could be used to assess impacts of proposed projects; and that could be used to identify possible mitigation sites. The VWC was designed to satisfy these various needs. Using ArcGIS, the analysis started with development of a wetlands and streams layer by data overlays of the National Wetlands Inventory, the high-resolution National Hydrography Dataset, 100-year floodplains from the Digital Flood Insurance Rate Map Database, and hydric and likely hydric soils from the Soil Survey Geographic Database. Two separate prioritizations, one focused on conservation and the other on restoration, were then applied to the wetlands and streams layer again by data overlay. The weighted layers used for the conservation prioritization indicated plant and animal biodiversity, significant natural communities, natural lands that provide ecosystem services, natural corridors and stream buffers, proximity to conserved lands, relatively clean watersheds, and drinking water sources. Some of these weighted layers also were used for the restoration prioritization as well as additional layers that indicated degraded watersheds and impaired waters, existing wetland mitigation banks, prior converted and farmed wetlands, and stream reaches with relatively low aquatic biodiversity that potentially could be restored. Statewide parcel and subwatershed data were incorporated into the results. The results include six feature classes in a file geodatabase (FGDB) that are split into conservation and restoration prioritizations and summaries by wetland, parcel, and subwatershed boundaries. These six feature classes include representations embedded in them that portray the vast amounts of data thirty different ways and allow enhanced exploitation of the database. All representations can be viewed easily in the ArcMap document that accompanies the FGDB. The two most important of these representations are Conservation Rank and Restoration Rank, which clearly indicate relative values of wetlands with ranks 1 through 5, with five being most valuable. The VWC provides spatial tools to assist federal and state agencies, and perhaps private corporations, in designing projects efficiently, with reduced impacts, and in identifying wetlands for conservation, restoration, or mitigation purposes.

Table of Contents List of Figures………………………………………………………………………………………….....………………….iv List of Tables…………………………………………………………………………………………………………………..vi
Introduction……………………………………………………………………………………………………………………1
Methods…………………………………….……………………………………………………………..……………………5 Results.…………………………………….………………………………………………………….…..…………………..31
Discussion.……………………………….………………………………………………………….…..…………………..37
Literature Cited……………………….………………………………………………………….…..…………………..39

iv
List of Figures Figure 1. The original Virginia Wetland Restoration Catalog as of
December 2008…………………..…..............................................................................1 Figure 2. The pilot VWC in 2010 using new methodology to identify mitigation
priorities and display them by wetland boundaries.…...………….…………………………2 Figure 3. The pilot VWC in 2010 using new methodology to identify mitigation
priorities and display them by parcel boundaries........……….………………………..…..3 Figure 4. Basic hydrologic unit geography for the Commonwealth of Virginia….……...…5 Figure 5. Parcels data used for the Virginia Wetlands Catalog..………………………..…………6 Figure 6. Developed areas extracted from NLCD combined with areas of
high road density…………………………………………………..………………………………….………7 Figure 7. National Wetlands Inventory data classified by type……………………………….……8 Figure 8. Surface waters from the high-resolution National Hydrography Dataset..……9
Figure 9. One-hundred year floodplains from Digital Flood Insurance Rate Maps..……10
Figure 10. Hydric soils, and soils with hydric potential indicated by flooding, shallow
water tables, or ponding, extracted from Soil Survey Geographic for the study area……………………………………….……………………………………………………………..………..11
Figure 11. Concordance of wetland source layers used to develop the
Wetlands Base Map………………………………..…………………………………………….………..12 Figure 12. Potential wetland additions beyond NWI for the Wetlands Base Map………13 Figure 13. Natural Heritage Conservation Sites ranked by biodiversity significance…..17 Figure 14. Proximity to permanently protected lands being managed for biodiversity Conservation………………………………………………………………..…………………………………18 Figure 15. Protection zones around ground and surface water drinking sources.……...19 Figure 16. Intact Ecological Cores and Landscape Corridors ranked by ecological
integrity from the Virginia Natural Landscape Assessment...…………………..……..20 Figure 17. Species of greatest conservation need form State Wildlife Action Plan…….21

v
Figure 18. Cleanest subwatersheds in terms of runoff containing nitrogen,
phosphorous, and sediments......………………………………………………………………..…..22 Figure 19. Most polluted subwatersheds in terms of runoff due to nitrogen,
phosphorous, and sediments……………………………………………………………………….….24
Figure 20. Impaired Waters weighted by support of aquatic life…………………………….….25 Figure 21. Program sites in the Regulatory In lieu fee and Bank Information Tracking System….…………………………………………………………………………………………….………..…26 Figure 22. Common Land Units and predicted agricultural wetlands………………………...27 Figure 23. “Restoration Candidate ” reaches from the Healthy Waters of Virginia..….28 Figure 24. Methods overview for the Virginia Wetland Catalog…………………………….….30 Figure 25. Conservation rank displayed by wetland boundaries…………………………….….31 Figure 26. Restoration rank displayed by wetland boundaries……………………………….….32 Figure 27. Maximum conservation rank displayed by parcel boundaries, where
parcel data are mapped and available electronically………………………………….….33
Figure 28. Maximum conservation rank displayed by subwatershed boundaries….….34 Figure 29. Maximum restoration rank displayed by parcel boundaries, where
parcel data are mapped and available electronically…………………………………....35 Figure 30. Maximum restoration rank displayed by subwatershed boundaries…….….36
vi
List of Tables Table 1. Accuracy of the WBM when compared to ecological plots …………………………14 Table 2. Accuracy of the WBM when compared to obligate wetland and obligate
upland plant occurrences……………………………………………………………..………………15
Table 3. Variables and weights used for the conservation prioritization..…………………23
Table 4. Variables and weights used for the restoration prioritization….………………….29
Table 5. Area covered by Conservation and Restoration Ranks in square miles……………………………………………………………………………………...........32

1
Introduction
The original Virginia Wetlands Catalog (VWC) (ca. 2006) was known as the Wetland Restoration Catalog, and was developed via a joint project between the Virginia Department of Conservation and Recreation - Division of Natural Heritage (VDCR-DNH), and the Virginia Department of Transportation (VDOT), where VDOT sought a series of maps identifying possible mitigation sites. The project included only one VDOT district and products consisted of a wetland restoration opportunity sites list, corresponding maps in PDF format, and other natural resource information. The project was extended statewide in 2008 with funding assistance from the Virginia Coastal Zone Management Program at the Virginia Department of Environmental Quality (VDEQ). These two early versions of the catalog focused on wetlands adjacent to, overlapping, and/or functionally associated with Natural Heritage Conservation Sites, in order to guide restoration activities to areas with known biodiversity conservation value. The largest conservation sites with greatest biodiversity significance were selected and reviewed against 2002 Virginia Base Mapping Program aerial photography, National Wetland Inventory data, and other GIS datasets. All areas that appeared to be converted wetlands and to have a high potential for restoration were delineated in GIS. A total of 122 wetland restoration opportunity sites were identified, ranging in size from 1 to 2,482 acres (Figure 1).
Figure 1. The original Virginia Wetlands Catalog as of December 2008.

2
In 2010, a more sophisticated methodology was developed for the Technical Coordinating Committee of the Strategic Highway Research Program 2 (SHRP2) with funding from the Transportation Research Board. The SHRP2 sought spatially represented resource information that could be used in early planning stages to guide transportation project designs away from sensitive areas, thus greatly improving the efficiency of the design process. This new approach to a VWC (Weber and Bulluck 2010), which was piloted on the Pamunkey watershed (eastern Virginia), prioritized wetlands for restoration, mitigation, and conservation, and summarized the results by wetland (Figure 2) and parcel (Figure 3) boundaries.
Figure 2. The pilot VWC in 2010 using new methodology to identify mitigation priorities and display them by wetland boundaries.

3
Figure 3. The pilot VWC in 2010, based on new methodology to identify mitigation priorities and display them by parcel boundaries.
The latest version of the catalog, developed between 2012 and 2014 with major funding from the U.S. Department of Agriculture - Natural Resources Conservation Service (NRCS) and additional funds provided by VDCR, VDOT, the Nature Conservancy, and the Virginia Commonwealth University - Center for Environmental Studies (VCU-CES), advanced the pilot methodology and extended coverage to the entire state of Virginia. The process started with development of an expanded Wetlands Base Map (WBM) which had, as its foundation, wetlands from the National Wetlands Inventory (NWI) and streams from the high-resolution National Hydrography Dataset (NHD). To these datasets were added 100-year floodplains from Digital Flood Insurance Rate Maps (DFIRM) and hydric and potentially hydric soils from the Soil Survey Geographic (SSURGO) database. This expanded WBM identifies many more options for wetland and stream mitigation than the earlier catalogs.
The next step in the process was prioritization of the WBM using weighted variables that indicated the significance of wetlands for conservation or restoration values. Development of different prioritizations for conservation and restoration purposes was an improvement over the pilot project. The weighted variables used for the conservation prioritization indicated plant and animal biodiversity, significant natural communities, natural lands that provide

4
ecosystem services, natural corridors and stream buffers, proximity to conserved lands, relatively clean watersheds, and drinking water sources. Some of these weighted layers also were used for the restoration prioritization and to them were added layers that indicated degraded watersheds, impaired waters, existing wetland mitigation banks, prior converted and agricultural wetlands, and stream reaches with relatively low biodiversity that potentially could be restored. To make products more useful, subwatershed and available parcel boundaries were incorporated into the analysis for reference and query purposes and to enable additional summaries.
The resulting attribute tables were quite extensive, allowing various summaries of results such as tallies of the weighted variables, reclassifications of values, and reductions of data to maximum values. The results include six feature classes in a file geodatabase (FGDB) that are split into conservation and restoration prioritizations and summaries by wetland, parcel, and subwatershed boundaries. These six feature classes include embedded representations that summarize data thirty different ways and allow use of the database for other output summaries as well. All representations can be viewed easily in the ArcMap document that accompanies the FGDB. The two most important of these representations are Conservation Rank and Restoration Rank, which clearly indicate relative values of wetlands with ranks 1 through 5, with 5 being most valuable. The VWC provides spatial tools to assist federal and state agencies, and perhaps private corporations, in designing projects efficiently, with reduced impacts, and in identifying wetlands for conservation, restoration, or mitigation purposes.
5
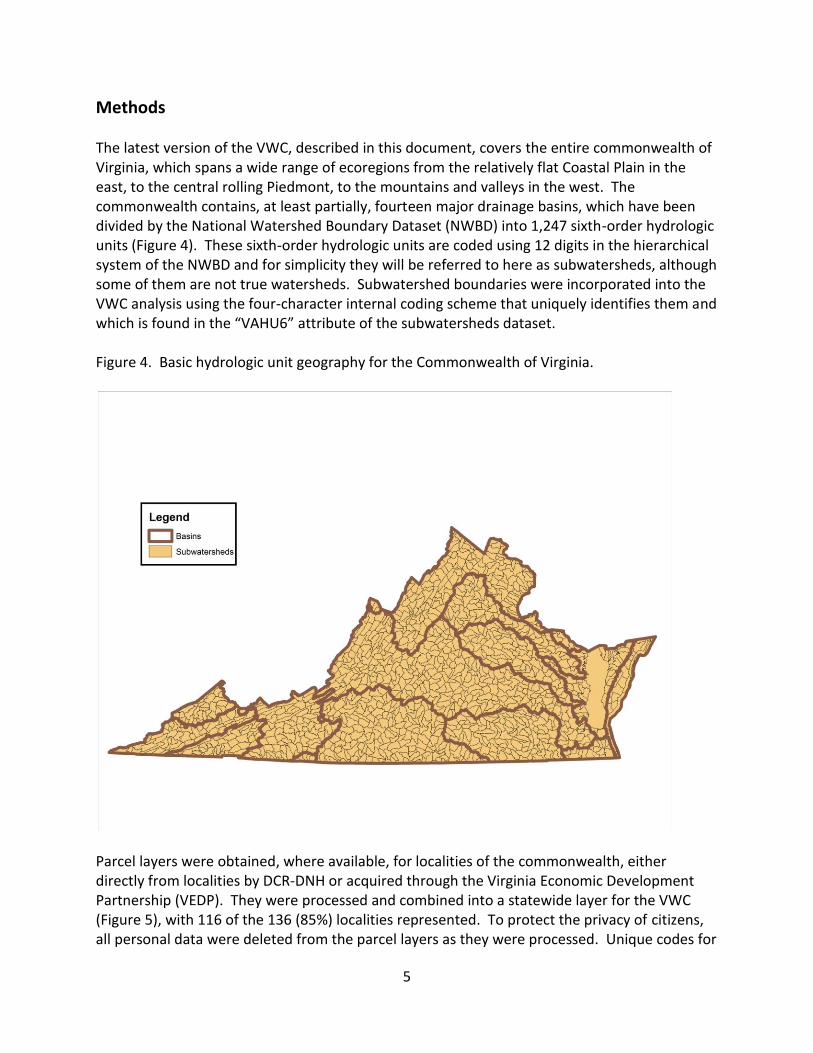
Methods The latest version of the VWC, described in this document, covers the entire commonwealth of Virginia, which spans a wide range of ecoregions from the relatively flat Coastal Plain in the east, to the central rolling Piedmont, to the mountains and valleys in the west. The commonwealth contains, at least partially, fourteen major drainage basins, which have been divided by the National Watershed Boundary Dataset (NWBD) into 1,247 sixth-order hydrologic units (Figure 4). These sixth-order hydrologic units are coded using 12 digits in the hierarchical system of the NWBD and for simplicity they will be referred to here as subwatersheds, although some of them are not true watersheds. Subwatershed boundaries were incorporated into the VWC analysis using the four-character internal coding scheme that uniquely identifies them and which is found in the “VAHU6” attribute of the subwatersheds dataset. Figure 4. Basic hydrologic unit geography for the Commonwealth of Virginia.
Parcel layers were obtained, where available, for localities of the commonwealth, either directly from localities by DCR-DNH or acquired through the Virginia Economic Development Partnership (VEDP). They were processed and combined into a statewide layer for the VWC (Figure 5), with 116 of the 136 (85%) localities represented. To protect the privacy of citizens, all personal data were deleted from the parcel layers as they were processed. Unique codes for

6
parcels were developed by combining the Federal Information Processing Standards (FIPS) codes (each locality has a unique FIPS code) with the Object IDs generated by ArcGIS in the processed layers. For example, the code 085-113 uniquely identifies the 113th record of the Hanover County (FIPS 085) parcel layer. The unique identifiers from the original parcels layers were retained in a field in the VWC database, thus, users that have access to the original parcels data will be able to reference back to those data for ownership details. VDCR will not provide original parcels layers to VWC users. Figure 5. Parcels data used for the Virginia Wetlands Catalog.
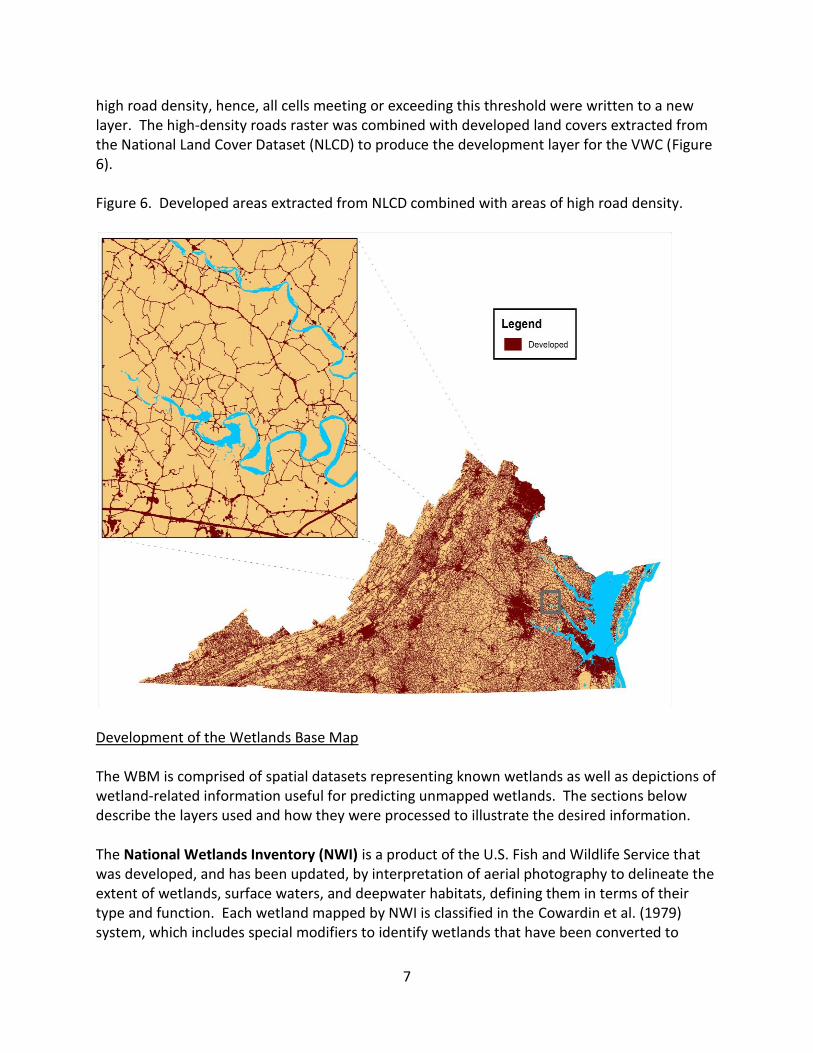
Information about the intensity of development near wetlands may be important for decisions about the conservation or restoration of those wetlands and therefore, development data were incorporated into the VWC. A focal analysis was performed on the Virginia Base Mapping Program dataset of road centerlines (RCL) to identify areas with high road density. The focal analysis was performed with a circular window with a radius of 10 cells to scan the statewide RCL layer and sum the number of road pixels in each window, with that sum being assigned to the central cell of each window. Comparisons of the resulting raster to urban areas in aerial photography revealed that cells with sums greater than or equal to 30 represented areas of
7
high road density, hence, all cells meeting or exceeding this threshold were written to a new layer. The high-density roads raster was combined with developed land covers extracted from the National Land Cover Dataset (NLCD) to produce the development layer for the VWC (Figure 6). Figure 6. Developed areas extracted from NLCD combined with areas of high road density.
Development of the Wetlands Base Map The WBM is comprised of spatial datasets representing known wetlands as well as depictions of wetland-related information useful for predicting unmapped wetlands. The sections below describe the layers used and how they were processed to illustrate the desired information. The National Wetlands Inventory (NWI) is a product of the U.S. Fish and Wildlife Service that was developed, and has been updated, by interpretation of aerial photography to delineate the extent of wetlands, surface waters, and deepwater habitats, defining them in terms of their type and function. Each wetland mapped by NWI is classified in the Cowardin et al. (1979) system, which includes special modifiers to identify wetlands that have been converted to

8
farmland or modified to change water occurrence, distribution, and movement. Wetlands may be excluded from the NWI because of the limitations of aerial imagery as the primary data source used to detect wetlands. Therefore, in this catalog methodology, additional wetland data sources are used to supplement NWI. Figure 7 shows NWI data for the commonwealth classified by type. Figure 7. National Wetlands Inventory data classified by type.
The National Hydrography Dataset (NHD), a product of the U.S. Geological Survey (USGS), is a comprehensive set of spatial data representing the surface water of the United States using common features such as lakes, ponds, streams, rivers, canals, and oceans. The NHD contains a flow direction network that traces water downstream or upstream, enabling detailed analysis of hydrography. While NWI has mapped obvious surface waters with accuracy, narrow streams in heavily forested areas often are missing from the NWI dataset. Lines categorized as “StreamRiver” or “CanalDitch” in the highest resolution (24,000 scale) NHD product were extracted and buffered by 2.5 meters to make polygons (Figure 8) of the same width as Natural Heritage Stream Conservation Units.

9
Figure 8. Surface waters from the high-resolution National Hydrography Dataset.
The Digital Flood Insurance Rate Map (DFIRM) Database, a product of the Federal Emergency Management Agency (FEMA) of the U.S. Department of Homeland Security, portrays 100-year and 500-year floodplains with different zone designations. The data are primarily for insurance rating purposes, but the zone differentiation can be very helpful for other floodplain management purposes. While not entirely wetland, floodplains do contain wetlands and can be excellent choices for mitigation due to the ecosystem services they provide, including flood and erosion control, and sediment retention. The 100-year floodplains, also referred to as the base floodplains, were used to supplement NWI in development of the WBM (Figure 9).

10
Figure 9. One-hundred year floodplains from Digital Flood Insurance Rate Maps.
The Soil Survey Geographic (SSURGO) Database, a product of the U.S. Department of Agriculture, Natural Resources Conservation Service, is the most detailed level of soil mapping done by NRCS and it duplicates the original, paper soil survey maps. SSURGO data are available for selected counties and areas throughout the United States and its territories. SSURGO is designed for use by those knowledgeable of soils data and their characteristics. Lookup tables are available that provide information about soils in the database. Using these additional tables, map units classified as hydric, or partially hydric with additional indicators of hydric conditions, were used to supplement NWI in development of the WBM. Hydric soils are those soils that are sufficiently wet in the upper part, usually within twelve inches (~31 cm) of the surface, to develop anaerobic conditions during the growing season. As a whole, coarse map units classified as partially hydric represented too much non-wetland area and were thus filtered such that only those partially hydric map units with high probability of being wetland were used for the WBM. Specifically, map units classified as partially hydric also had to exhibit one of the following characteristics to be included in the catalog:
frequently flooded
occasionally flooded and somewhat poorly drained

11
a minimum depth to water table of zero to 31 cm during the months of April to June, after removing erroneous zero values that likely resulted from “no data”
a ponding frequency among map units of 75 to 100% An additional NRCS product, called Gridded SSURGO, became available while the WBM was being developed (Soil Survey Staff 2012). Although these data appeared redundant to the hydric and potentially hydric map units already extracted by the above procedures, the 50-100 class of the Potential Wetland Soil Landscapes attribute was incorporated into the soils layer developed for the WBM. The soils map units, from both SSURGO and Gridded SSURGO, used for the WBM are shown in Figure 10. Figure 10. Hydric soils, and soils with hydric potential indicated by flooding, shallow water tables, or ponding, extracted from Soil Survey Geographic for the study area.
Spatial data do not always align properly due to different source inputs, scales, development processes, and other factors, and misalignments can be especially problematic when overlaying linear data such as streams and other narrow surface waters. These misalignments can result in scenarios where wetland areas or stream reach do not get tagged with weights from the misaligned prioritization inputs. For example, the lines representing an Impaired Waters reach

12
may not match exactly with line work for the National Hydrography Dataset (NHD) used to build the WBM, thus, that NHD stream reach will mistakenly not be scored in the catalog as a restoration opportunity. To ensure that the WBM included all wetlands and streams to be prioritized for conservation and restoration opportunities, certain prioritization data layers were themselves incorporated into the WBM. Specifically, these prioritization variables, described below in the methods, included Stream Conservation Units (SCUs) from the Natural Heritage Conservation Sites dataset, Restoration Candidate Reaches from the VCU Healthy Waters dataset, project sites in the Regulatory In lieu fee Bank Information Tracking System, and Impaired Waters. Figure 11 . Concordance of wetland source layers used to develop the Wetlands Base Map.
Each polygon in each wetland source layer, including the four secondary source layers used to minimize misalignments, was attributed with the number “1”. Note this change from the pilot project in which the secondary source features were assigned zero. All eight wetland source layers were combined in a massive union overlay, which computed a geometric union and preserved all features and attributes from the input layers, after dividing each input layer into subsets to facilitate successful processing. A layer of subbasins, i.e. fourth-order hydrologic

13
units coded with 8 digits, was used for this subsetting and it resulted in twenty-five subsets per input layer. The geometric unions were dissolved while summing the “1’s” from overlapping polygons from the various wetland source layers. The resulting layer shows concordance of WBM inputs, or the suggestion, by degree of overlap by multiple wetland source layers, that an area may indeed be wetland (Figure 11). The potential wetlands identified in the WBM, inclusive of NWI wetlands can be viewed in Figure 12. Figure 12. Potential wetland additions beyond NWI for the Wetlands Base Map.
An assessment was conducted on the WBM to determine how accurately it portrayed wetlands throughout the commonwealth. Natural heritage datasets for ecological plots, obligate wetland plant occurrences, obligate upland plant occurrence, and wetland community occurrences were evaluated for use in this assessment. It was determined that the wetland community occurrences were not suitable for this purpose because they could contain too much non-wetland area due to buffer and additional habitat that are allowed in their delineations. The ecological plots dataset included 4,590 georeferenced points with attributes that indicated hydrologic regimes and wetland community classifications. These points were buffered by radii of 5.64 meters to create circles one-hundred square meters in size, an area at least as large as all but one percent of the ecological plots. Polygons that were attributed with

14
codes for estuarine, palustrine, or marine wetlands were selected and categorized as wetland while all other polygons were categorized as non-wetland. The layer was intersected with the WBM and the resulting table was summarized to collapse multiple intersections into one record per ecological plot. The summary table was related to the original plots layer and used to calculate the error matrix in Table 1. Among other confounding factors, the high rate of false positives is likely due to WBM containing floodplains, which are not entirely wetland. Table 1. Accuracy of the WBM when compared to ecological plots.
Ecology Vegetation Plots
Wetland Not
Wetland Total
WB
M
Wet
lan
d
1714 432 2146
No
t W
etla
nd
171 2273 2444
Tota
l
1885 2705 4590
Plots Overall Accuracy: 86.9 %
True Positives: 37.3 %
True Negatives: 49.5 %
False Negatives: 3.7 %
False Positives: 9.4 %
The Natural Heritage element occurrences dataset contained 368 high-accuracy records for obligate wetland plant species, or those species requiring wetland conditions, and 657 high-accuracy records for obligate upland plant species, or those species requiring upland conditions. These data were delineations of actual field-mapped populations of rare plants and did not require buffering. The layer was intersected with the WBM and the resulting table was summarized to collapse multiple intersections into one record per feature. These results are summarized in Table 2.

15
Table 2. Accuracy of the WBM when compared to obligate wetland and obligate upland plant occurrences.
Plant EOs
Obligate Wetland
Obligate Upland Total
WB
M W
etla
nd
360 273 633
No
t W
etla
nd
8 384 392
Tota
l
368 657 1025
Overall Accuracy: 72.6 %
True Positives: 35.1 %
True Negatives: 37.5 %
False Negatives: 0.8 %
False Positives: 26.6 %
As with the Accuracy Assessment using ecological plots, the high rate of false positives was likely due to the WBM containing floodplains, which are not entirely wetland, and stream reaches. Many of the obligate upland EOs intersected streams and floodplains and caused this erroneously high error rate (also see Appendix 2). If we average the results from the two Accuracy Assessments, the overall accuracy of the WBM is 80 %. If disregarding the Accuracy Assessment using upland obligate plants, the combined accuracy based on wetland obligate plant species populations and wetland ecological plots is 92%.

16
Wetland Prioritization
Weighted variables were used to appraise the relative importance of wetlands and potential wetlands in the WBM in separate prioritizations for conservation and restoration values. The weighted variables used for the conservation prioritization indicated plant and animal biodiversity, significant natural communities, natural lands that provide ecosystem services, natural corridors and stream buffers, proximity to conserved lands, relatively clean watersheds, and drinking water sources. Some of these variables also were used for the restoration prioritization and to them were added weighted variables that indicated degraded watersheds, impaired waters, existing wetland mitigation banks, agricultural wetlands, and relatively low biodiversity stream reaches that potentially could be restored. The variables are described in the sections below and in Tables 3 and 4.
Conservation and Restoration Variables
The Natural Heritage Conservation Sites (Sites) layer, developed and maintained by VDCR-DNH, is the commonwealth’s most comprehensive biodiversity database. It contains almost 10,000 locations of natural heritage resources, which are defined as the habitat of rare, threatened, or endangered plant and animal species, unique or exemplary natural communities, and significant geologic formations. Terrestrial conservation sites are delineated with boundaries that contain one or more natural heritage resources, and its associated habitat and buffer or other adjacent land needed for the resource’s conservation. Similarly, Stream Conservation Units identify stream reaches that contain aquatic natural heritage resources and include upstream, downstream, and tributary buffers. Sites and SCUs are given biodiversity ranks )B-ranks) from B1-Outstanding to B5-General for biodiversity significance based on the rarity, quality, and number of resources they contain. These B-ranks were inverted and reassigned to sites as weights from 1 (low) to 5 (highest) for the VWC (Figure 13 and Tables 3 and 4).

17
Figure 13. Natural Heritage Conservation Sites ranked by biodiversity significance.
The Conservation Lands Database, another product developed and maintained by VDCR-DNH, depicts public and private conserved lands, where all tracts are scored based on management intent (e.g. for biodiversity conservation, for recreational values, etc.) and legal protection (i.e. permanent protection, temporary protection, etc.). Five consecutive buffers of 200-meters width each were created around those lands managed for biodiversity and with permanent legal protection. These concentric buffers were assigned weights based on their distance from the associated conserved tract, with the buffers nearest the conserved tract receiving the greatest weight (Figure 14, Tables 3 and 4), and weight decreasing with a buffer’s distance from the tract.

18
Figure 14. Proximity to permanently protected lands being managed for biodiversity conservation.
The Drinking Water Sources Protection Zones layer, a product of the Virginia Department of Health (VDH), maps areas that need to be protected in order to keep drinking water clean. For groundwater intakes, protection zones included areas either within fixed, 1-mile radius delineations around the intakes or within informed delineations around the intakes where that information was available. Protection zones for surface water intakes include watershed delineations extending 5 miles upstream of the surface water intakes (e.g. streams, reservoirs). Drinking Water Protection Zones were assigned a single, moderate weight. (Figure 15, Tables 3 and 4).

19
Figure 15. Protection zones around ground and surface water drinking sources.
Variables Used Only for Conservation Prioritization
The Virginia Natural Landscape Assessment (VaNLA), another product of the VDCR-DNH, is a landscape-scale GIS analysis for identifying, prioritizing, and linking natural habitats in Virginia. Using land cover data derived from satellite imagery, the VaNLA identifies unfragmented natural habitats called ecological cores, large patches of natural land cover (mainly upland forests and forested wetlands, but also marshes, beaches, and dunes where they cover sufficient areas) with at least 100 acres of interior conditions. Ecological cores provide habitat for a wide range of species, from those dependent upon interior forests to habitat generalists, as well as species that inhabit marshes, dunes, and beaches. Ecological cores provide other ecosystem services in terms of open space, recreation, water quality, flood control, sediment retention, crop pollination, and carbon sequestration. Ecological cores were analyzed and assigned ecological integrity scores ranging from General (C5) to Outstanding (C1), with more importance give to large, intact, connected, and biologically diverse areas. These scores were inverted and reassigned as weights from 1 (low) to 5 (high) for the VWC (Figure 16 and Table 3).

20
Figure 16. Intact Ecological Cores and Landscape Corridors ranked by ecological integrity from the Virginia Natural Landscape Assessment.
The VaNLA also includes a network of relatively unfragmented linkages between the highest ranking ecological cores. These linkages, or Landscape Corridors, if restored and/or maintained in natural conditions offer connections between cores of habitat to facilitate the movement of plant populations (i.e. via seeds and pollen movement) and animal populations (i.e. via daily movement patterns, seasonal movement due to differing habitats used, and dispersion or offspring over generations). These landscape corridors provide critical connections so that these populations can respond to both short and long term disturbances to their required habitats. Landscape corridors were also included as a prioritization dataset, where all corridors were assigned a weight of 2.
Virginia’s Species of Greatest Conservation Need were also included in the prioritization, as per the Virginia Wildlife Action Plan, a product of the Virginia Department of Game and Inland Fisheries (VDGIF). These include species from tiers 1 and 2 of the Wildlife Action Plan, as well as any state or federally listed (i.e. threatened or endangered) species, ranked as tier 3 or 4 in the Wildlife Action Plan. These data were clustered into five classes using Jenks natural breaks optimization, to reduce the variance within classes and maximize the variance between classes.

21
Weights were assigned to the classes assigned by the Jenks optimization, where classes with the highest diversity of species received the most weight (Figure 17 and Table 3).
Figure 17 . Species of greatest conservation need form State Wildlife Action Plan.
The Relatively Clean Subwatersheds layer represents the least polluted subwatersheds in terms of runoff containing nitrogen, phosphorous, and sediments. This layer was developed from individual unit area loads (UAL) data, for all land use categories, obtained from the Virginia DCR-Division of Soil and Water Conservation (VDCR-DSWC). After excluding statistical outliers, the mean and standard deviation of each pollutant were calculated and used to rank the pollutants. Values below the means were assigned to class 1, values between the mean and the mean plus one standard deviation (SD) were assigned to class 2, values between the first and second SD above the mean were assigned to class 3, values between the second SD above the mean and the minimum outlier were assigned to class 4, and all outliers were assigned to class 5. These classes were summed for the three pollutants to create a composite value that ranged from three to fifteen. All subwatersheds with a composite value equal to three, meaning below average loads for each of the three pollutants, were exported to a new layer that was subsequently clustered into three classes using Jenks natural breaks optimization. For use as a variable in the prioritization of wetlands for conservation, weights of 1 to 3 were assigned so that the least polluted or cleanest subwatersheds received the highest

22
weights (Figure 18 and Table 3). Subwatersheds with composite values above three, meaning above average loads for each of the three pollutants, were exported to a new layer for use as a variable in the restoration prioritization, described in the next section.
Figure 18. Cleanest subwatersheds in terms of runoff containing nitrogen, phosphorous, and sediments.

23
Table 3. Variables and weights used for the conservation prioritization.
Weights
Variables 1 2 3 4 5
Proximity to Conserved Lands
800-1000 meters
600-800 meters
400-600 meters
200-400 meters
0-200 meters
Conservation Sites
B5-General B4-Moderate B3-High B2-Very High B1-Outstanding
Relatively clean subwatersheds
below average loads of N, P, and sediments
moderately low loads of N, P, and sediments
lowest loads of N, P, and sediments
X X
Ecological Integrity from VaNLA
C5-General C4-Moderate C3-High C2-Very High C1-Outstanding
Species of Greatest Conservation Need
1-2 species 2-6 species 6-17 species 17-30 species 30-42 species
Drinking Water Sources
X X protection zone
X X

24
Variables Used Only for the Restoration Prioritization
The Relatively Polluted Subwatersheds layer represents the most degraded subwatersheds in terms of runoff containing nitrogen, phosphorous, and sediments. As mentioned in the previous section, subwatersheds with composite values indicating above average loads of these pollutants were exported to a new layer for use as a restoration variable. This layer was clustered into three classes using Jenks natural breaks optimization and then assigned weights from 1 to 3 so that the most polluted or degraded subwatersheds received the highest weights (Figure 19 and Table 4).
Figure 19. Most polluted subwatersheds in terms of runoff due to nitrogen, phosphorous, and sediments.
The Impaired Waters of Virginia layer, developed by the VDEQ as required by section 303(d) of the Clean Water Act, portrays waters that are too polluted or otherwise degraded to meet water quality standards. Impaired waters are prioritized for improvement and are attributed with the maximum amount of pollutants, called the Total Maximum Daily Load (TMDL), the waters can receive and still safely meet water quality standards. Impaired waters were

25
included in the VWC because they can benefit from restored wetlands that filter nutrients, retain sediments, and attenuate flooding. All waters (riverine, estuarine and reservoir waters) in categories 4 or 5, defined as impaired or threatened, were extracted from the layer for use in the VWC. Riverine features were buffered by 2.5 meters, to make polygons of the same width as Natural Heritage Stream Conservation Units, and then merged with the estuarine and reservoir layers. The merged layer was weighted using the “Aquatic Life” attribute, which uses the natural background concentrations of specific parameters to determine the levels of aquatic life expected to occur naturally absent human interference. For the VWC restoration prioritization, impaired waters that were “fully supporting” aquatic life were assigned a weight of 2 and impaired waters that were “not supporting” aquatic life were assigned a weight of 4. Impaired waters that were not assessed or had insufficient information were assigned the moderate weight of 3 (Figure 20 and Table 4). Figure 20. Impaired Waters weighted by support of aquatic life.
The Regulatory In lieu fee and Bank Information Tracking System (RIBITS) was developed by the U.S. Army Corps of Engineers to provide information on mitigation and conservation banking and in-lieu fee programs across the country. Mitigation or conservation banking is the restoration, creation, enhancement, or preservation of wetlands to compensate for unavoidable wetland losses in advance of development actions. Banking typically involves the

26
consolidation of small, fragmented wetland mitigation projects into one large contiguous site. Units of restored, created, enhanced or preserved wetlands are expressed as "credits" which may subsequently be withdrawn to offset "debits" incurred at a project development site. In lieu fee mitigation requires permittees to pay fees, which represent the expected costs of replacing wetland functions lost or degraded by projects, to third parties. These fees are typically pooled to finance mitigation projects. Program sites in RIBITS (Figure 21) were added to the VWC as reference features because users might want to target lands adjacent to these restored wetland sites. Figure 21. Program sites in the Regulatory In lieu fee and Bank Information Tracking System.
The Common Land Unit (CLU) and Predicted Agricultural Wetlands layer was developed from NRCS CLU data. This datasets displays farm fields under single ownership with presence of wetlands indicated as either “inventoried” or “certified”, with the latter having supporting documentation. The selection of CLU data was created by intersecting the layer with the WBM. CLU data with certified wetlands were assigned a weight of 5, CLU data with inventoried wetlands were assigned a weight of 3. Agricultural wetlands were also predicted by intersecting agricultural land covers from National Land Cover Data 2006 with the WBM , and

27
these predicted agricultural wetlands were assigned a weight of 1 (Figure 22 and Table 4). Where these features overlapped, the highest weights were retained for the prioritization. Figure 22. Common Land Units and predicted agricultural wetlands.
The Healthy Waters of Virginia layer, a product developed and managed by the VDCR-DSWC, is a summary of the Instar data developed by the VCU-CES, is an ecological approach to invertebrate species, as well as in-stream habitat and conditions of banks. The purpose of the Healthy Waters initiative is to protect streams, creeks, and other waters before they become impaired. Unlike water quality programs that focus on restoring degraded streams, Healthy Waters broadens the scope of preservation efforts to include protecting the ecological integrity and biological diversity in our healthy waters. Stream reaches are classified as “Exceptional”, “Healthy”, “Restoration Candidate”, or “Compromised” base upon how comparable they are to virtual reference streams, of high quality and high native species diversity. The “Exceptional” and “Healthy” streams are incorporated into SCUs of the Natural Heritage Conservation Sites layer and informed the VWC conservation prioritization. “Restoration Candidate” stream reaches were used in the restoration prioritization (Figure 23 and Table 4). These stream reaches are defined as 50-70% comparable to virtual reference streams, and are deemed by the

28
VCU-CES scientists to offer the best opportunities for restoration. Streams considered “Compromised” are less than 50% comparable to virtual reference streams and were not included in the restoration opportunities prioritization. Figure 23. “Restoration Candidate” reaches from the Healthy Waters of Virginia.

29
Table 4. Variables and weights used for the restoration prioritization.
Weights
Variables 1 2 3 4 5
Proximity to Conserved Lands
800-1000 meters
600-800 meters
400-600 meters
200-400 meters
0-200 meters
Conservation Sites
B5-General B4-Moderate B3-High B2-Very High B1-Outstanding
Relatively polluted subwatersheds
above average loads of N, P, and sediments
moderately high loads of N, P, and sediments
highest loads of N, P, and sediments
X X
Common Land Unit and Agricultural Wetlands
predicted farmed wetlands from NLCD
X Inventoried X Certified
Impaired Waters (303d)
X Fully Supporting Aquatic Life
Insufficient Information or Not Assessed
Not Supporting Aquatic Life
X
Healthy Waters
X X restoration candidate
X X
Drinking Water Sources
X X protection zone
X X
Union Analyses After dividing all input layers into twenty-five subsets by subbasin boundaries to facilitate successful processing, separate geometric unions were computed for the conservation and restoration prioritizations. Each of these overlays included the WBM, the reference layers, and the prioritization variables (Figure 24). All of the features and all of the attributes from all of the input layers were preserved in the overlay products. In theory only one geometric union would be necessary to combine all the information from the WBM inputs, the reference layers, and the variables for both the conservation and restoration prioritizations. Although this was how the pilot project was analyzed, the complex variables and statewide extent of the current

30
project made the process too computationally intensive. After reconstituting the subsets into statewide products, the conservation prioritization layer had about thirteen and a half million polygons and the restoration prioritization layer had about fourteen and a half million polygons. The attribute tables of these products were analyzed to develop the various prioritizations and summaries, described below. Figure 24. Methods overview for the Virginia Wetland Catalog.
The conservation and restoration prioritizations were calculated by summing their respective prioritization variables. A composite prioritization was calculated for each by adding a value of one for all polygons that intersected the WBM, which insured that all wetlands in the WBM were represented in the final products. The Jenks Natural Breaks classifier was used, while excluding values of zero and one, to classify the composite prioritizations into these ranks for conservation or restoration: Background (0); General (1); Moderate (2); High (3); Very High (4); and Outstanding (5). Summaries by subwatershed and parcel boundaries were developed by geometrically dissolving the conservation and restoration products while selecting the maximum values for each variable within those boundaries. There are many ways that these data could be summarized, e.g. by mean, sum, or variance within subwatershed or parcel boundaries, and users can calculate such summaries using comparable procedures.

31
Results The results of this project include six feature classes in a file geodatabase (FGDB) that are split into conservation and restoration prioritizations with summaries by wetland, parcel, and subwatershed boundaries for each. These six feature classes include optimal map display settings (i.e. representations) to facilitate interpretations of outputs from many perspectives. The two main representations are Conservation Rank (Figure 25) and Restoration Rank (Figure 26), which clearly indicate relative values of wetlands with these ranks: Background (0); General (1); Moderate (2); High (3); Very High (4); and Outstanding (5). The area covered by each of these ranks for the two prioritizations can be viewed in Table 5 . These rankings can be visually compared to other data in a GIS to make initial predictions as to relative conservation and restoration values of wetlands. However, these data can be used more thoroughly by querying the attribute tables to select those wetlands that meet specific criteria to make determinations. Such queries can be conducted with basic ArcGIS or other GIS software and are described further in the Discussion section. To assist development of queries, a table of field alias names can be found in Appendix 1. Figure 25. Conservation rank displayed by wetland boundaries.

32
Figure 26. Restoration rank displayed by wetland boundaries.
Table 5. Area covered by Conservation and Restoration Ranks in square miles.
Rank Conservation Rank Area Restoration Rank Area
0 34,566 34,566
1 3,282 722
2 2,858 5,220
3 2,021 2,221
4 562 713
5 321 171
As mentioned, these data can be displayed many different ways. In addition to Conservation Rank and Restoration Rank, the data can be displayed by the raw (i.e. not reclassified into five

33
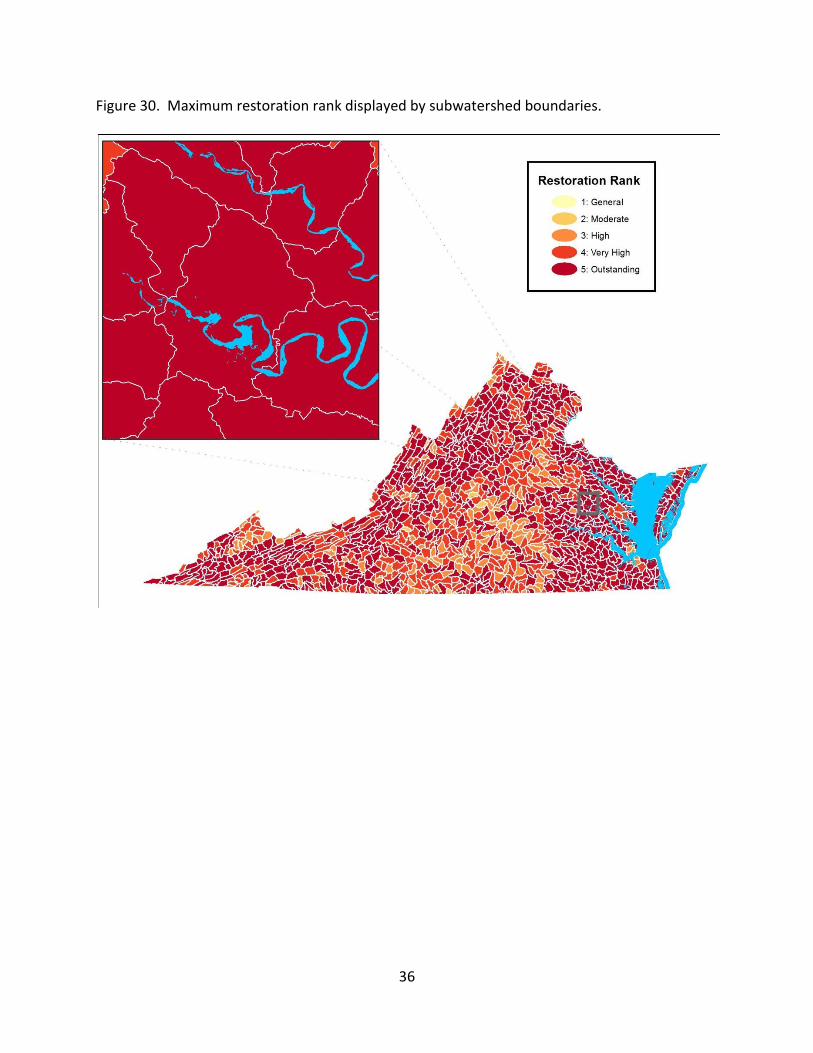
ranks) priorities, by wetland concordance (i.e. the collective overlap of WBM inputs), by development, and by the weighted inputs used in the prioritizations. Summaries by subwatershed and parcel boundaries were developed by geometrically dissolving the conservation and restoration products while selecting the maximum values for each variable within those boundaries (Figures 27, 28, 29, and 30). For example, all individual polygons (i.e. portions of wetlands) within a given subwatershed, each with their own calculated restoration rank, were grouped based on that subwatershed boundary (or, “dissolved” by subwatershed). Then, all polygons within that grouping/subwatershed boundary were assigned the same rank: the rank of the highest ranking individual wetland polygon (or, maximum value) within that subwatershed. So, if the wetland polygon ranks within a subwatershed boundary ranged from 2 to 5, then all wetland polygons in the subwatershed would be assigned the maximum value, a 5. Likewise, this dissolving was also carried out by parcel boundaries. Moreover, there are many ways that these data could be summarized within those boundaries, e.g. by mean, sum, or variance within subwatershed or parcel boundaries, and users can calculate such summaries using comparable procedures. Figure 27. Maximum conservation rank displayed by parcel boundaries, where parcel data are mapped and available electronically.

34
Figure 28. Maximum conservation rank displayed by subwatershed boundaries.

35
Figure 29. Maximum restoration rank displayed by parcel boundaries, where parcel data are mapped and available electronically.
36
Figure 30. Maximum restoration rank displayed by subwatershed boundaries.

37
Discussion The VWC originated in 2006 as a simple tool to identify possible mitigation sites over a limited area of Virginia. Its focus was on restoring agricultural wetlands to improve biodiversity conservation and it received little use. Through several versions since then, the VWC has evolved by broadening its utility and expanding its coverage into the present version, which includes the entire commonwealth, is based on a beyond-NWI basemap, and has prioritizations for both conservation and restoration purposes, driven by a variety of pertinent input data layers. The expanded WBM, which includes potential wetlands and is the foundation of the catalog, provides many more options for wetland and stream mitigation than the earlier catalogs. The new VWC was designed to satisfy the varied needs of its funders and potential users. The NRCS can use the catalog for ranking Wetlands Reserve Easements (WRE) under the Agricultural Conservation Easements Program (ACEP), as well as other work involving wetland and stream restoration or conservation. The VDOT can use the VWC to guide projects away from sensitive wetland areas before significant funds have been committed to transportation design and engineering plans. Use of the VWC in earlier planning stages can enable identification of potential impacts early, avoiding or minimizing those impacts, and thereby making the process more intelligent, efficient, and economical. As another example, TNC can use the VWC to identify wetlands with significant conservation value for protection efforts as well as to identify wetlands with high restoration value for mitigation efforts. The products of the VWC can be interpreted visually, using the many different representations to show the features of interest for specific projects, and compared to other data in a GIS to make determinations. However, these data can be more thoroughly exploited by querying the attribute tables to select those wetlands that meet specific criteria required by a project, by focusing a query on certain ranks of specific prioritization datasets (in italics below), which are retained and available in VWC outputs as table attributes. For example, if an organization was interested in conserving wetlands for rare species and significant habitats, a logical query might select wetlands with the desired levels of biological significance from the conservation prioritization using the attributes for Natural Heritage Conservation Sites and Species of Greatest Conservation Need. If that organization could get funding assistance from VDH if it helped protect drinking water, it also might wish to select wetlands that intersected Drinking Water Sources Protection Zones. Sometimes the benefits of conservation projects can be increased by targeting lands adjacent to existing conserved lands, thus, the organization might want to use the Proximity to Conserved Lands attribute to refine its selection of wetlands. Since the organization wishes to conserve wetlands for rare species and habitats, and it would want those resources to remain viable long into the future, it might want to select wetlands with high ecological integrity that are connected to other natural lands and that are at low risk of being degraded by runoff pollution. These qualities can be selected using the attributes for the VaNLA (i.e. the Natural Land Network) and Non-Point Source Pollution (i.e. subwatersheds with below average levels of polluted runoff). Finally, if the organization wanted high confidence that an area was truly wetland by ignoring potential wetlands, it could refine its selection of wetlands in the basemap using the Wetland Concordance attribute, to focus on wetlands with relative high concordance. Once the organization has selected the desired attributes and levels

38
for use, a single query can be assembled in a GIS to target wetlands meeting the desired criteria. It’s conceivable that the organization could have a set of queries to target different criteria for different types of projects. (Note that queries using the restoration prioritization would function in similar ways.) If the organization had boundaries for multiple project areas in GIS, those boundaries could be used like a cookie cutter to clip the respective portions of the VWC. Once clipped, the attribute tables of the different layers could be analyzed to make comparisons and determinations about where best to conduct wetland conservation or restoration on the ground. Catalog Review Draft Wetland Catalog outputs were reviewed by funders: The Natural Resources Conservation Service (NRCS), the Virginia Department of Transportation (VDOT), the Virginia Department of Conservation and Recreation (DCR) and The Nature Conservancy (TNC). Draft products were also shared with, and feedback welcomed from other likely users of the Catalog: the Virginia Department of Environmental Quality and the U.S. Army Corps of Engineers. Feedback was unanimously positive and all reviewers saw the Catalog as a through and useful tool for assessing wetland conservation and restoration opportunities in Virginia. Responses to reviewer questions and comments are provided in Appendix 2.

39
Literature Cited Soil Survey Staff. The Gridded Soil Survey Geographic (gSSURGO) Database for Virginia. United
States Department of Agriculture, Natural Resources Conservation Service. Available online http://datagateway.nrcs.usda.gov/. January 15, 2014 (FY2014 official release).
Weber, J. T. and J. F. Bulluck 2010. Methodology for Developing a Parcel-based Wetland
Restoration, Mitigation, and Conservation Catalog: A Virginia Pilot. Natural Heritage Technical Report #10-22. Virginia Department of Conservation and Recreation, Division of Natural Heritage. Richmond, Virginia 34 pp.

Appendix 1. Aliases for field names in the VWC file geodatabase.
Field Name Alias
CNTCTYNAME Locality Name
ConsComp Conservation Composite Score
ConsPrior Conservation Priority
ConsReclas Conservation Rank
CPSID1 Conservation Sites ID
CPSID10 Drinking Water ID
CPSID11 Proximity Conserved Lands ID
CPSID2 VaNLA ID
CPSID3 SGCN Tiers 1 and 2 Plus ID
CPSID8 Non-Point Source Pollution ID
CPSweight8 Non-Point Source Pollution Weight
CPSwgt1 Conservation Sites Weight
CPSwgt10 Drinking Water Weight
CPSwgt11 Proximity Conserved Lands Weight
CPSwgt2 VaNLA Weight
CPSwgt3 SGCN Tiers 1 and 2 Plus Weight
HU_12_NAME Subwatershed Name
MAX_ConsComp Max Conservation Composite Score
MAX_ConsPrior Max Conservation Priority
MAX_ConsReclas Max Conservation Rank
MAX_CPSweight8 Max Non-Point Source Pollution Weight
MAX_CPSwgt1 Max Conservation Sites Weight
MAX_CPSwgt10 Max Drinking Water Weight
MAX_CPSwgt11 Max Proximity Conserved Lands Weight
MAX_CPSwgt2 Max VaNLA Weight
MAX_CPSwgt3 Max SGCN Tiers 1 and 2 Plus Weight
MAX_RestComp Max Restoration Composite Score
MAX_RestPrior Max Restoration Priority
MAX_RestReclas Max Restoration Rank
MAX_RPSweight8 Max Non-Point Source Pollution Weight
MAX_RPSweight9 Max Restoration Candidate Reaches Weight
MAX_RPSwgt1 Max Conservation Sites Weight
MAX_RPSwgt10 Max Drinking Water Weight
MAX_RPSwgt11 Max Proximity Conserved Lands Weight

MAX_RPSWGT12 Max Common Land Unit Weight
MAX_RPSwgt5 Max Impaired Waters Weight
MAX_WetSum Max Wetland Concordance
RestComp Restoration Composite Score
RestPrior Restoration Priority
RestReclas Restoration Rank
RPSID1 Conservation Sites ID
RPSID10 Drinking Water ID
RPSID11 Proximity Conserved Lands ID
RPSID12 Common Land Unit ID
RPSID5 Impaired Waters ID
RPSID8 Non-Point Source Pollution ID
RPSID9 Restoration Candidate Reaches ID
RPSweight8 Non-Point Source Pollution Weight
RPSweight9 Restoration Candidate Reaches Weight
RPSwgt1 Conservation Sites Weight
RPSwgt10 Drinking Water Weight
RPSwgt11 Proximity Conserved Lands Weight
RPSWGT12 Common Land Unit Weight
RPSwgt5 Impaired Waters Weight
VAHU6 Subwatershed Code
VWCParID VWC Parel ID
WetSum Wetland Concordance

Appendix 2. Reviewer comments and responses summary What is the suggested scale for using the Virginia Wetlands Catalog map outputs? The Catalog is the result of an enormous analysis of many input datasets, and many of which spatially display very detailed line and polygon data (e.g. the National Hydrography Dataset, parcel-level Conserved Lands data, National Wetlands Inventory, etc.). Due to the varying scales of input datasets, considering the massive GIS layer overlay conducted for the prioritizations, and due to the inherent inaccuracies in all input datasets, when zooming in to fine scales, small odd polygons will be present. With an understanding that these are natural byproducts of such an analysis and may not always represent actual data values on the ground, one can use the Catalog outputs at a scale of 1:24,000 (comparable to USGS topographic maps) for screening and targeting wetland conservation and restoration opportunities. Does the USDA, Farm Service Agency Common Land Unit (CLU) Data included in the Restoration Priorities output include all agricultural wetlands? No. As per the USDA Farm Service Agency, Common Land Unit (CLU) data consists only of agricultural lands with a permanent, contiguous boundary, under common land cover and management practices, and owned by a common landowner or producer association. Hence, these lands only include those of landowners participating in USDA farm programs via coordination with their Farm Service Agency. The CLU lands that intersect with the Wetlands Basemap developed for the Catalog provided an important dataset identifying and prioritizing wetland restoration opportunities, but these do not represent all agricultural wetlands. However, to account for other agricultural wetlands, all wetlands included in the wetlands basemap which intersected with NLCD agricultural land covers were also identified and combined with CLU data, albeit with lower weight than the CLU data Can the wetlands included in the Catalog be attributed with structural characteristics (i.e. forested, scrub/shrub, etc.)? Unfortunately, assigning structural components to each of the wetland polygons in the Basemap was beyond the scope of this project. However, users can easily view the outputs with current forest cover datasets from the Department of Forestry, the National Land Cover Dataset, and/or other land cover classification datasets. Could the wetlands in the Catalog be tagged with tidal wetland class and other wetland subtype designations? No, not comprehensively. Much of the Wetland Basemap identifies predicted wetlands that are not included in the National Wetlands Inventory, and thus wetlands that are not officially designated to certain classes. Field-based determination was outside the scope of the Catalog development and Virginia DCR is not in regulatory position to make these determinations. In the Accuracy Assessment, are the plant species element occurrences that were used all obligate wetland and obligate upland species? Element occurrence data (EOs) indicate the accurate locations of species populations as mapped in the field. The Accuracy Assessment only used EOs for species designated as obligate wetland species or obligate upland species.

The wetland obligate species EOs predicted wetlands in the basemap more accurately than upland species predicted uplands. This is because wetland obligate plant species EOs are mapped within areas that obviously display hydric soils or wetland hydrology. These areas are highly likely to be included in the Wetland Basemap via multiple inputs (e.g. NWI, hydric soils assessment, floodplains). Hence, the mapping of these wetland obligate species include very little to no non-wetland areas. Upland obligate plant species are more likely mapped such that boundaries might include streams and some lower, wet areas that are captured in the Wetlands Basemap via certain basemap inputs. For example, all areas mapped as 100-year floodplains were included in the basemap, but on the ground, small relatively non-wetland areas can be included in areas mapped as floodplains. Thus, if upland obligate plant EOs (mapped via accurate on the ground observations) occur in small relatively upland areas within a 100-year floodplain (which may be mapped via analysis of elevation and hydrology), then the Accuracy Assessment would tag these occurrences as inaccurate mappings of upland species within a wetland basemap area. One must take into account the natural incompatibilities of layers included in the Wetland Basemap inputs versus the field collected EO data. Stated simply, EOs were not created with consideration for the WBM Accuracy Assessment. Can the ecological plots used in the Accuracy Assessment be confidently identified as wetland or non-wetland? Yes. Ecological plots assess vegetation via detailed inventory of plant species present, where these species can be associated with their wetland affinity (e.g. wetland obligate, facultative wetland, etc.). Wetland Hydrology is assessed via observations and measurements of inundation and hydrologic regime, and hydric soils are identified via qualitative analysis of soil samples collected in the plot, as well as observations of drainage class and soil moisture regime. Can the Wetland Catalog be menu driven, so that users can query and select wetlands with certain conservation and/or restoration values? All inputs used in the conservation and restoration rankings are included in wetland catalog outputs, so that a GIS user can query the outputs based on any combination of these inputs as criteria. Still, the Catalog could be made menu-driven to allow such querying in a non-GIS interface (e.g. via a web mapping user interface). However, this was not the purpose of the project. As this GIS-based catalog is used and becomes a component of decision-making and workflows regarding wetland restoration, a menu-driven revision can be scoped and developed as a second phase of the Virginia Wetlands Catalog. Many of the highly ranked restoration areas are in open water areas. Should these be removed from the catalog via exclusion of NWI-designated deepwater habitats and other classes that indicate open water (i.e. unconsolidated bottom)? Indeed, open water and deepwater habitats are not realistic candidates for wetland restoration. The Virginia Department of Environmental Quality requested that the National Hydrography Dataset (NHD) and all Impaired waters (303d streams) be included in the catalog so that it might also be used for prioritizing stream restoration opportunities as well as wetland opportunities. These open water, unconsolidated shore, unconsolidated bottom and riverine areas are included in the Catalog outputs due to the inclusion of these datasets in the wetlands

basemap. Users can exclude these open water features by using selections and definition queries. Why are some developed areas included in the catalog output? Should these be removed? Developed areas were intentionally retained in the Catalog and the Developed representation can be used to display them. A variety of input datasets were used to create the wetlands basemap, and some of these input layers overlap areas classified as developed by the National Land Cover dataset. This overlap was retained in the catalog so that the Catalog outputs could also provide a screening tool for wetland restoration in areas within developed areas. Alternatively, if users wish to exclude these developed areas from the Catalog outputs, a Developed representation was included in the geodatabase to enable users to identify developed areas in Catalog outputs.