Embed Size (px)
Citation preview

Basel II Pillar 3Capital adequacy and risk disclosures as at 31 December 2012
COMMONWEALTH BANK OF AUSTRALIA | ACN 123 123 124 | 13 FEBRUARy 2013


Basel II Pillar 3 1
Table of Contents
1 Introduction 2
2 Scope of Application 3
3 Capital and Risk Weighted Assets 4
3.1 Regulatory Capital 5
3.2 Risk Weighted Assets 7
4 Credit Risk 9
4.1 Credit Risk Exposure – Excluding Equities and Securitisation 9
4.2 Past Due and Impaired Exposures, Provisions and Reserves 17
4.3 Portfolios Subject to Standardised and Supervisory Risk-Weights in the IRB Approaches 22
4.4 Portfolios Subject to Internal Ratings Based Approaches 24
4.5 Credit Risk Mitigation 34
4.6 Securitisation 36
5 Equity Risk 47
6 Market Risk 48
6.1 Traded Market Risk 48
6.2 Non-Traded Market Risk 49
7 Operational Risk 49
8 Appendices 50
8.1 Detailed Capital Disclosures 50
8.2 List of APRA APS 330 Tables 53
8.3 List of Supplemental Tables and Diagrams 55
8.4 Glossary 56
For further information contact:
Investor Relations
Warwick Bryan
Phone: 02 9118 7112
Email: [email protected]

2 Commonwealth Bank of Australia
1 Introduction
The Commonwealth Bank of Australia (the Group) is an
Authorised Deposit-taking Institution (ADI) subject to regulation
by the Australian Prudential Regulation Authority (APRA) under
the authority of the Banking Act 1959.
This document presents information on the Group‟s capital
adequacy and Risk Weighted Assets (RWA) calculations for
credit risk including securitisation exposures and equities,
market risk, interest rate risk in the banking book (IRRBB) and
operational risk according to APRA requirements.
An important component of the Basel Committee on Banking
Supervision‟s (BCBS) revised framework of capital
measurement and capital adequacy, known as Basel II, is the
public disclosure of prudential information (referred to as “Pillar
3” within the framework). These requirements are outlined in
APRA‟s ADI Prudential Standard APS 330 “Capital Adequacy:
Public Disclosures of Prudential Information” (APS 330). The
standard aims to enhance transparency in Australian financial
markets by setting minimum requirements for the disclosure of
information on the risk management and capital adequacy of
ADIs.
The Group is required to report its quarterly assessment of
capital adequacy on a Level 2 basis. APS 330 defines Level 2
as the consolidated banking group excluding the insurance and
funds management businesses and entities through which
securitisation of Group assets are conducted.
The Group is accredited with advanced Basel II status to use
the Advanced Internal Ratings Based Approach (AIRB) for
credit risk and Advanced Measurement Approach (AMA) for
operational risk under Basel II „Pillar One‟ minimum capital
requirements. The Group is also required to assess its traded
market risk and IRRBB requirements under Pillar One.
This report incorporates the BCBS “Revisions to the Basel II
market risk framework” (Basel 2.5) which introduces additional
reporting and capital requirements for securitisation and market
risk.
ASB Bank Limited (ASB) is subject to regulation by the Reserve
Bank of New Zealand (RBNZ). RBNZ applies a similar
methodology to APRA in calculating regulatory capital
requirements. ASB operates under Basel II advanced status and
Level 2 reporting by the Group includes ASB.
The Bank of Western Australia (Bankwest) relinquished its ADI
licence in October 2012 in line with prudential regulations
requiring Australian subsidiaries of major banks to operate under
the same licence as the parent. From 31 December 2012, APRA
has subsequently approved use of the following approaches for
the Bankwest portfolios:
Advanced Internal Ratings Based (AIRB) approach for
material credit risk portfolios;
Interest Rate Risk in the Banking Book (IRRBB); and
Advanced Measurement Approach (AMA) for Operational
Risk.
Throughout this document, comparatives as at 30 June 2012 and
31 December 2011 show Bankwest portfolios using a
Standardised approach.
All disclosures include consolidation of CommBank Europe
Limited and PT Bank Commonwealth, which use the
Standardised Basel II methodology.
The Group has maintained a strong capital position with capital
ratios well in excess of APRA‟s minimum capital adequacy
requirements and the Board approved minimum levels at all times
throughout the period.
The Group‟s Common Equity Tier One (CET1), Tier One and
Total Capital ratios as at 31 December 2012, under the
application of Basel II were 8.3%, 10.5% and 11.2% respectively.
From 1 January 2013, the Group will adopt the Basel III
measurement and monitoring of regulatory capital.
This document is unaudited, however it has been prepared
consistent with information supplied to APRA or otherwise
published.
This document is available on the Group‟s corporate website
www.commbank.com.au.
31 Dec 12 30 Jun 12 31 Dec 11
Summary Group Basel II Capital Adequacy Ratios (Level 2) % % %
Common Equity Tier One 8.3 7.8 7.7
Tier One 10.5 10.0 9.9
Tier Two 0.7 1.0 1.2
Total Capital 11.2 11.0 11.1

Basel II Pillar 3 3
2 Scope of Application
This document has been prepared in accordance with Board
approved policy and semi-annual reporting requirements set out
in APS 330.
APRA adopts a tiered approach to the measurement of an ADI‟s
capital adequacy:
Level 1: the parent bank (Commonwealth Bank of
Australia) and offshore branches (the Bank) and APRA
approved Extended Licenced Entities (ELE);
Level 2: the consolidated banking group excluding the
insurance and funds management businesses and the
entities through which securitisation of Group assets are
conducted; and
Level 3: the conglomerate group including the Group‟s
insurance and funds management businesses (the
Group).
The Group is required to report its semi-annual assessment of
capital adequacy on a Level 2 basis. Additional semi-annual
disclosure of capital ratios relating to material ADIs within the
Group together with CBA‟s own Level 1 capital ratios are
included under APS 330 Table 3g of this report (page 5).
ASB Bank Ltd (ASB)
Commonwealth Bank
of Australia
CommBank Europe
Ltd (CBE)
PT Bank
Commonwealth
(PTBC)
Offshore Branches:
New York, London, New Zealand, Tokyo, Hong
Kong, Singapore, Vietnam, India and China
Commonwealth
Securities Ltd
(CommSec)
Commonwealth Bank
Financial Corporation
Ltd (CBFC)
Banking Entities
Funds Management
China County Banks
Special Purpose
Vehicles
Insurance
Colonial Holding Company Ltd
– Colonial First State Investment Ltd (CFSIL)– Commonwealth Financial Planning Ltd (CFP)– Commonwealth Managed Investments Ltd (CMIL)– Colonial First State Asset Management (Aust) Limited (CFSAMA)– Colonial First State Property Limited (CFSPL)– CFS Managed Property Ltd (CFSMPL)– First State Investment Management (UK) Ltd–First state Investments (Hong Kong) Ltd– First state Investments (Singapore) Ltd– Count Financial Ltd
– Commonwealth
Insurance Ltd (CIL)– Colonial Mutual Life Assurance Society Ltd (CMLA)– ASB Group (Life) Ltd -Sovereign–PT Commonwealth Life
Level 2
Level 3
Level 1
The transfer of regulatory capital and funding within the Group is
subject to restrictions imposed by local regulatory requirements.
In particular, APS 222 “Associations with Related Entities”
establishes prudential limits on the level of exposure that the
Bank may have to a related entity.
The Bank and all of the subsidiaries of the Group are
adequately capitalised. There are no restrictions or other major
impediments on the transfer of funds within the Group.
APS 330 Table 1d – Capital deficiencies in non-consolidated subsidiaries
There continues to be no capital deficiencies in non-consolidated subsidiaries in the Group.

4 Commonwealth Bank of Australia
3 Capital and Risk Weighted Assets
Capital Management
The Group maintains a strong capital position with the capital
ratios well in excess of APRA minimum capital adequacy
requirements (Prudential Capital Ratio (PCR)) and the Board
Approved minimum levels at all times throughout the half year
ended 31 December 2012.
The Group‟s Common Equity Tier One (CET1), Tier One Capital
and Total Capital ratios as at 31 December 2012 were 8.3%,
10.5% and 11.2% respectively.
The Group‟s CET1 and Tier One Capital ratios increased by 49
and 53 basis points respectively on the prior half. This was
primarily driven by capital generated from earnings (net of
dividend) and the benefit delivered from Bankwest being now
reported on using AIRB, IRRBB and AMA approaches in
December 2012. No allowance has been taken into account in
the Basel II capital ratios for the Dividend Reinvestment Plan
(DRP) as it has been anticipated that the DRP will be satisfied in
full by an on market purchase of shares.
The Group‟s Total Capital ratio increased 20 basis points over
the prior half to 11.2% driven by both movement in Tier One
Capital partially offset by the planned redemption of a number of
Lower Tier Two debt instruments.
Capital Initiatives
The following significant initiatives were undertaken during the
half year to actively manage the Group‟s capital:
Tier One Capital
In October 2012 the Group issued $2 billion Perpetual
Exchangeable Resaleable Listed Securities (PERLS VI), Basel
III compliant, additional Tier One security. The proceeds of this
issue were used, to the extent necessary, to refinance the
maturing PERLS IV and otherwise to fund the Group‟s
business; and
The allocation of approximately $929 million ordinary shares in
order to satisfy the DRP in respect of the final dividend for the
2011/2012 financial year, representing a participation rate of
29.6%.
Tier Two Capital
Redemption of three separate subordinated Lower Tier Two
debt issues totalling $711 million.
Summary Group Capital Adequacy and RWA 31 Dec 12 30 Jun 12 31 Dec 11
Total Risk Weighted Assets ($M) 301,611 302,787 297,705
Common Equity Capital ($M) 25,049 23,664 22,837
Tier One Capital ($M) 31,780 30,299 29,473
Total Capital ($M) 33,846 33,238 33,061
Common Equity Tier One (%) 8.3 7.8 7.7
Tier One Capital (%) 10.5 10.0 9.9
Total Capital (%) 11.2 11.0 11.1
Regulatory Capital Framework Comparison
The following table estimates the impact on the Group‟s capital
as at 31 December 2012, of the differences between APRA‟s
prudential requirements for calculating risk weighted assets and
those of the Financial Services Authority (FSA), the UK
regulator.
The Group‟s Common Equity, Tier One and Total Capital ratios
as at 31 December 2012 under the FSA method of calculating
regulatory capital as a percentage of RWA were 11.8%, 14.6%
and 14.7% respectively.
Further details on the differences between APRA and the FSA
are available on the Australian Bankers‟ Association website.
Common
equity
tier one Tier One Total
capital (1)
capital capital
Regulatory Capital Frameworks Comparison % % %
Reported risk weighted capital ratios 8. 3 10. 5 11. 2
RWA treatment - mortgages (2)
and margin loans 1. 3 1. 6 1. 6
IRRBB risk weighted assets 0. 3 0. 4 0. 4
Future dividends (net of Dividend Reinvestment Plan) 0. 9 0. 9 0. 9
Tax impact in EL v EP calculation 0. 1 0. 1 0. 3
Removal of Tier One Hybrid Limits (3) - 0. 2 -
Deferred tax assets 0. 1 0. 1 0. 1
Equity investments 0. 3 0. 3 0. 2
Value of in force (VIF) deductions (4) 0. 5 0. 5 -
Total adjustments 3. 5 4. 1 3. 5
Normalised Basel II FSA equivalent 11. 8 14. 6 14. 7
31 December 2012
(1) Represents Fundamental Tier One Capital net of Tier One deductions.
(2) Based on APRA‟s 20% Loss Given Default (LGD) floor compared to the FSA‟s 10%. For Standardised portfolio, based on APRA‟s risk weights under APS 112
compared to the FSA‟s standard.
(3) APRA imposes a Residual Capital limit of 25% of Tier One Capital under FSA rules this limit is 50% with more flexible transition rules.
(4) VIF at acquisition is treated as goodwill and intangibles and therefore is deducted at Tier One by APRA. FSA allows VIF to be included in Tier One Capital but
deducted from Total Capital.

Basel II Pillar 3 5
3.1 Regulatory Capital
APS 330 Table 2b to 2d – Group regulatory capital position
31 Dec 12 30 Jun 12 31 Dec 11
$M $M $M
Tier One Capital
Ordinary Share Capital and Treasury Shares 26,427 25,498 24,967
Total Reserves (1) 520 767 462
Net Retained Earnings 11,254 10,658 10,161
Non-controlling interests less ASB Perpetual Preference Shares 27 26 23
Total Fundamental Tier One Capital 38,228 36,949 35,613
Deductions from Tier One Capital
Goodwill and other intangibles (excluding software) (2) (8,535) (8,581) (8,546)
Other deductions from Tier One Capital (2,645) (2,720) (2,286)
Tier One Capital deductions - 50% (3) (1,999) (1,984) (1,944)
Total Tier One Capital Deductions (13,179) (13,285) (12,776)
Fundamental Tier One Capital After Deductions 25,049 23,664 22,837
Residual Capital
Innovative Tier One Capital 4,767 3,228 3,229
Non-innovative Residual Tier One Capital 1,964 3,407 3,407
Total Residual Tier One Capital 6,731 6,635 6,636
Total Tier One Capital 31,780 30,299 29,473
Tier Two Capital
Upper Tier Two Capital 1,165 1,217 1,236
Lower Tier Two Capital 2,900 3,706 4,296
Gross Tier Two Capital 4,065 4,923 5,532
Deduction from Tier Two Capital
Tier Two Capital deductions - 50% (3) (1,999) (1,984) (1,944)
Total Tier Two Capital Deductions (1,999) (1,984) (1,944)
Total Tier Two Capital 2,066 2,939 3,588
Total Capital 33,846 33,238 33,061
(1) The Group‟s general reserve, capital reserve and foreign currency translation reserve (excluding balances related to non consolidated subsidiaries) qualify as
fundamental Tier One Capital.
(2) Represents total Goodwill and other intangibles (excluding capitalised computer software costs) which are required to be deducted from Tier One Capital.
(3) Represents 50% Tier One and 50% Tier Two Capital deductions under Basel II rules.
APS 330 Table 3g – Capital ratios
31 Dec 12 30 Jun 12 31 Dec 11
Significant Group ADIs (1)% % %
CBA Level 2 Tier One Capital ratio 10.5 10.0 9.9
CBA Level 2 Total Capital ratio 11.2 11.0 11.1
CBA Level 1 Tier One Capital ratio 10.8 10.7 10.7
CBA Level 1 Total Capital ratio 10.9 11.0 11.2
ASB Tier One Capital ratio 12.2 11.7 11.2
ASB Total Capital ratio 12.2 12.6 12.9
(1) Bankwest relinquished its ADI licence in October 2012 and now operates under the same licence as its parent.

6 Commonwealth Bank of Australia
Regulatory Changes
There are a number of regulatory changes in progress that will
impact the measurement of capital for the Group in regards to
Banking, General and Life Insurance and Conglomerate Groups.
Basel III Regulatory Capital
The Group will adopt the Basel III measurement and monitoring
of regulatory capital from 1 January 2013.
In December 2010, the Basel Committee on Banking
Supervision (BCBS) published a discussion paper on banking
reforms to address issues which led to the Global Financial
Crisis and to position banks for future crises. The objectives of
the capital reforms are to increase the quality, consistency and
transparency of capital, to enhance the risk coverage
framework, and to reduce systemic and pro-cyclical risk. The
major reforms are to be phased in from 1 January 2013 to
1 January 2019.
In September 2012, Australian Prudential Regulation Authority
(APRA) published final standards relating to the implementation
of the Basel III capital reforms in Australia. APRA has adopted a
more conservative approach than the minimum standards
published by the BCBS and a more accelerated timetable for
implementation.
The APRA prudential standards require a minimum CET1 ratio
of 4.5% effective from 1 January 2013. An additional CET1
capital conservation buffer of 2.5% will be implemented on
1 January 2016, bringing the minimum CET1 requirement to 7%.
The BCBS advocates the same minimum requirements, but
implementation is to be phased in over an extended timeframe
up to 1 January 2019.
General and Life Insurers
In October 2012, APRA completed its review of regulatory
capital standards for life insurers and general insurers and
released the final version of all life insurance and general
insurance prudential standards (LAGIC). Implementation of the
majority of the reforms occurred on 1 January 2013.
Superannuation Funds Management
In November 2012, APRA released final prudential standards
that introduce new financial requirements for registered
superannuation trustees. The new requirements are being
implemented on 1 July 2013.
In November 2011, the Australian Securities and Investments
Commission (ASIC) released new financial requirements that
apply to Responsible Entities. These new requirements
became effective on 1 November 2012.
Conglomerate Groups
APRA released a discussion paper titled “Supervision of
Conglomerate Groups” in March 2010. APRA is seeking to
extend its current prudential supervision framework to
Conglomerate Groups that have material operations in more
than one APRA regulated industry and/or have one or more
material unregulated entities. The aims of the Level 3 proposals
are to ensure that a Conglomerate Group holds adequate
capital to protect the APRA regulated entities from potential
contagion and other risks within the Group.
Draft capital standards are expected to be released in the early
part of the 2013 calendar year with the intention at this point in
time to implement from 1 January 2014.

Basel II Pillar 3 7
3.2 Risk Weighted Assets
APS 330 Table 3b to 3f – Capital adequacy (risk weighted assets)
31 Dec 12 30 Jun 12 31 Dec 11
Asset Category $M (1)
$M (1)
$M (1)
$M % $M %
Credit Risk
Subject to Advanced IRB Approach
Corporate 51,851 49,331 45,983 2,520 5. 1 3,348 7. 3
SME corporate 30,833 22,319 22,155 8,514 38. 1 164 0. 7
SME retail 4,222 4,071 4,486 151 3. 7 (415) (9. 3)
Sovereign 3,692 3,003 3,201 689 22. 9 (198) (6. 2)
Bank 8,322 7,619 7,925 703 9. 2 (306) (3. 9)
Residential mortgage 63,637 54,545 53,844 9,092 16. 7 701 1. 3
Qualifying revolving retail 6,460 6,703 6,491 (243) (3. 6) 212 3. 3
Other retail 8,983 8,462 8,116 521 6. 2 346 4. 3
Impact of the regulatory scaling factor (2) 10,680 9,363 9,132 1,317 14. 1 231 2. 5
Total RWA subject to Advanced IRB Approach 188,680 165,416 161,333 23,264 14. 1 4,083 2. 5
Specialised lending 48,398 36,141 36,915 12,257 33. 9 (774) (2. 1)
Subject to Standardised approach
Corporate 3,894 10,430 9,950 (6,536) (62. 7) 480 4. 8
SME corporate 317 6,580 6,803 (6,263) (95. 2) (223) (3. 3)
SME retail 4,728 4,836 4,230 (108) (2. 2) 606 14. 3
Sovereign 203 107 308 96 89. 7 (201) (65. 3)
Bank 138 1,243 1,303 (1,105) (88. 9) (60) (4. 6)
Residential mortgage 2,257 25,705 24,660 (23,448) (91. 2) 1,045 4. 2
Other retail 2,212 2,559 2,627 (347) (13. 6) (68) (2. 6)
Other assets 4,124 3,240 5,215 884 27. 3 (1,975) (37. 9)
Total RWA subject to Standardised approach 17,873 54,700 55,096 (36,827) (67. 3) (396) (0. 7)
Securitisation 1,119 2,833 2,695 (1,714) (60. 5) 138 5. 1
Equity exposures 2,397 2,339 2,407 58 2. 5 (68) (2. 8)
Total RWA for credit risk exposures 258,467 261,429 258,446 (2,962) (1. 1) 2,983 1. 2
Traded market risk 4,517 4,842 3,105 (325) (6. 7) 1,737 55. 9
Interest rate risk in the banking book 10,996 9,765 11,525 1,231 12. 6 (1,760) (15. 3)
Operational risk 27,631 26,751 24,629 880 3. 3 2,122 8. 6
Total risk weighted assets 301,611 302,787 297,705 (1,176) (0. 4) 5,082 1. 7
Dec 2012 vs Jun 2012 vs
Jun 2012 Dec 2011
(1) Risk Weighted Assets (RWA) for June 2012 and December 2011 include the consolidation of Bankwest under the Basel II Standardised methodology. APRA granted
approval for the Group to extend its Advanced Internal Ratings Based accreditation to include the Bankwest non-retail loans and residential mortgage portfolio from
31 December 2012.
(2) APRA requires RWA that are derived from the advanced IRB approach to be multiplied by a scaling factor of 1.06 (refer glossary).

8 Commonwealth Bank of Australia
Risk Weighted Assets
Total RWA decreased by $1.2 billion or 0.4% on the prior half to
$301.6 billion. This decrease was driven by a reduction in credit
risk RWA and partially offset by increases in IRRBB and
operational risk RWA.
Credit Risk Exposure and Credit Risk RWA
Credit risk RWA decreased by $3 billion or 1.1% to $258.5
billion. The decrease was primarily due to:
The transition of Bankwest non-retail loans and residential
mortgage portfolio from Standardised to AIRB approach;
and
Changes in risk profile for securitisation exposures; partly
offset by
Growth in bank, specialised lending and residential
mortgage portfolios.
Traded Market Risk RWA
Traded Market Risk RWA decreased $325 million or 6.7% to
$4.5 billion during the half year. The decrease was mainly due to
reduced volatility affecting capital measurements and a change
in the regulatory treatment applied to the Traded Market Risk
RWA component for ASB.
Interest Rate Risk in the Banking Book RWA
IRRBB RWA increased by $1.2 billion or 12.6% to $11 billion
during the half year. The increase in the IRRBB capital
requirement in December 2012 was due to the higher repricing
risk from loans and deposits being partially offset by embedded
gains from lower interest rates and inclusion of Bankwest under
the APS117 regulatory capital requirements.
Operational Risk RWA
Operational Risk RWA increased $0.9 billion or 3.3% to
$27.6 billion during the half year. The increase reflects
refinements made in line with Australian regulatory
requirements and accreditation from APRA to include Bankwest
within the Group‟s Advanced Measurement Approach (AMA)
model, having previously calculated Operational Risk Capital
under the Standardised Approach.
Explanation of change in credit RWA
The composition of the movement in Credit RWA over the prior half, as reflected in APS 330 Table 3b to 3f, is shown below.
Total
movement Volume Data and Change in
Jun 12 to and FX methodology Bankwest credit
Dec 12 changes enhancements accreditation quality
Asset Category $M $M $M $M $M
AIRB corporate including SME and specialised lending 23,442 4,966 111 18,233 132
AIRB bank 703 882 152 54 (385)
AIRB sovereign 689 (21) 212 4 494
AIRB consumer retail 9,370 2,595 - 7,994 (1,219)
Standardised (including other assets) (36,827) (19) - (36,892) 84
Equity and securitisation exposures (1,656) (291) - - (1,365)
Impact of Basel II scaling factor 1,317 218 28 1,167 (96)
Total credit RWA movement (2,962) 8,330 503 (9,440) (2,355)
Credit RWA movement drivers

Basel II Pillar 3 9
4 Credit Risk
4.1 Credit Risk Exposure – Excluding Equities and Securitisation
The table below, and those on page 10, detail credit risk exposures (excluding Equities and Securitisation Exposures) subject to
Advanced IRB and Standardised approaches.
APS 330 Table 4i – Total credit exposures (excluding equities and securitisation) by portfolio type and
modelling approach
Average
On Non- exposure for
balance market Market December Change in exposure for
sheet related related Total 2012 half (2)
December 2012 half (3)
Portfolio Type $M $M $M $M $M $M %
Subject to advanced IRB approach
Corporate 44,726 35,317 5,565 85,608 84,137 2,943 3. 6
SME corporate 39,621 6,272 570 46,463 41,850 9,227 24. 8
SME retail 6,739 1,752 27 8,518 8,450 136 1. 6
Sovereign 45,512 2,498 1,402 49,412 48,011 2,803 6. 0
Bank 27,869 2,964 8,847 39,680 37,503 4,354 12. 3
Residential mortgage 354,944 63,600 - 418,544 386,077 64,934 18. 4
Qualifying revolving retail 9,413 12,655 - 22,068 21,812 513 2. 4
Other retail 6,469 1,706 - 8,175 7,886 578 7. 6
Total advanced IRB approach 535,293 126,764 16,411 678,468 635,726 85,488 14. 4
Specialised lending 43,520 10,028 1,119 54,667 48,123 13,089 31. 5
Subject to standardised approach
Corporate 2,615 1,303 27 3,945 7,152 (6,414) (61. 9)
SME corporate 136 199 - 335 3,388 (6,106) (94. 8)
SME retail 3,904 973 - 4,877 5,006 (258) (5. 0)
Sovereign 839 - - 839 1,616 (1,553) (64. 9)
Bank 324 26 - 350 3,416 (6,131) (94. 6)
Residential mortgage 4,221 642 - 4,863 31,247 (52,767) (91. 6)
Other retail 2,162 93 - 2,255 2,425 (339) (13. 1)
Other assets 10,768 - - 10,768 10,183 1,171 12. 2
Total standardised approach 24,969 3,236 27 28,232 64,433 (72,397) (71. 9)
Total credit exposures (1) 603,782 140,028 17,557 761,367 748,282 26,180 3. 6
Off balance sheet
31 December 2012
(1) Total credit risk exposures (calculated as EAD) do not include equities or securitisation exposures.
(2) The simple average of balances as at 31 December 2012 and 30 June 2012.
(3) The difference between exposures as at 31 December 2012 and 30 June 2012.
Explanation of change in credit risk exposure
Details of credit risk exposure movements over the prior half are as follows:
Total
exposure
change
Asset Category $M Regulatory Exposure Driver
AIRB corporate (including SME) and specialised lending 25,395
AIRB sovereign 2,803
AIRB bank 4,354
AIRB consumer retail 66,025
Total advanced and specialised lending 98,577
Standardised including other assets (72,397)
Total excluding securitisation and equity exposures 26,180
Increase due to growth in specialised lending exposures and
transition of Bankwest portfolios from standardised to AIRB
approach.
Reflects transition of Bankwest portfolio from standardised to
AIRB approach.
Reflects transition of Bankwest portfolio from standardised to
AIRB approach.
Increase due to continued growth in Australian residential
mortgages and transition of Bankwest residential mortgages
from standardised to AIRB approach.
Reduction reflects the transition of Bankwest Standardised
portfolios to AIRB.

10 Commonwealth Bank of Australia
APS 330 Table 4i – Total credit exposures (excluding equities and securitisation) by portfolio type and
modelling approach (continued)
Average
On Non- exposure
balance market Market for June Change in exposure
sheet related related Total 2012 half (2)
for June 2012 half (3)
Portfolio Type $M $M $M $M $M $M %
Subject to advanced IRB approach
Corporate 44,509 32,218 5,938 82,665 79,723 5,885 7. 7
SME corporate 31,366 5,368 502 37,236 36,972 528 1. 4
SME retail 6,702 1,667 13 8,382 8,942 (1,121) (11. 8)
Sovereign 42,170 2,926 1,513 46,609 43,982 5,255 12. 7
Bank 24,832 2,344 8,150 35,326 37,172 (3,692) (9. 5)
Residential mortgage 299,331 54,279 - 353,610 350,854 5,512 1. 6
Qualifying revolving retail 9,256 12,299 - 21,555 21,252 607 2. 9
Other retail 6,066 1,531 - 7,597 7,340 513 7. 2
Total advanced IRB approach 464,232 112,632 16,116 592,980 586,237 13,487 2. 3
Specialised lending 33,656 6,733 1,189 41,578 42,039 (923) (2. 2)
Subject to standardised approach
Corporate 8,494 1,756 109 10,359 10,156 407 4. 1
SME corporate 5,795 610 36 6,441 6,682 (483) (7. 0)
SME retail 3,967 1,168 - 5,135 5,222 (175) (3. 3)
Sovereign 2,391 1 - 2,392 2,573 (362) (13. 1)
Bank 6,419 17 45 6,481 6,504 (47) (0. 7)
Residential mortgage 56,694 909 27 57,630 56,369 2,522 4. 6
Other retail 2,501 90 3 2,594 2,614 (39) (1. 5)
Other assets 9,597 - - 9,597 11,002 (2,810) (22. 6)
Total standardised approach 95,858 4,551 220 100,629 101,122 (987) (1. 0)
Total credit exposures (1) 593,746 123,916 17,525 735,187 729,398 11,577 1. 6
Off balance sheet
30 June 2012
(1) Total credit risk exposures (calculated as EAD) do not include equities or securitisation exposures.
(2) The simple average of balances as at 30 June 2012 and 31 December 2011.
(3) The difference between exposures as at 30 June 2012 and 31 December 2011.
Average
On Non- exposure for
balance market Market December Change in exposure for
sheet related related Total2011 half
(2)December 2011 half
(3)
Portfolio Type $M $M $M $M $M $M %
Subject to advanced IRB approach
Corporate 39,276 32,367 5,137 76,780 72,203 9,154 13. 5
SME corporate 30,693 5,534 481 36,708 36,896 (376) (1. 0)
SME retail 7,393 2,084 26 9,503 9,366 274 3. 0
Sovereign 38,232 1,774 1,348 41,354 41,506 (303) (0. 7)
Bank 25,948 2,292 10,778 39,018 37,442 3,152 8. 8
Residential mortgage 293,726 54,372 - 348,098 344,889 6,419 1. 9
Qualifying revolving retail 9,087 11,861 - 20,948 19,754 2,388 12. 9
Other retail 5,732 1,352 - 7,084 6,868 433 6. 5
Total advanced IRB approach 450,087 111,636 17,770 579,493 568,924 21,141 3. 8
Specialised lending 33,373 8,038 1,090 42,501 42,097 808 1. 9
Subject to standardised approach
Corporate 8,105 1,765 82 9,952 8,898 2,109 26. 9
SME corporate 6,003 884 37 6,924 7,212 (577) (7. 7)
SME retail 3,691 1,619 - 5,310 5,364 (107) (2. 0)
Sovereign 2,751 3 - 2,754 2,350 808 41. 5
Bank 6,412 71 45 6,528 6,346 365 5. 9
Residential mortgage 54,112 975 21 55,108 53,411 3,394 6. 6
Other retail 2,534 97 2 2,633 2,619 29 1. 1
Other assets 12,407 - - 12,407 13,160 (1,505) (10. 8)
Total standardised approach 96,015 5,414 187 101,616 99,360 4,516 4. 7
Total credit exposures (1) 579,475 125,088 19,047 723,610 710,381 26,465 3. 8
Off balance sheet
31 December 2011
(1) Total credit risk exposures (calculated as EAD) do not include equities or securitisation exposures.
(2) The simple average of balances as at 31 December 2011 and 30 June 2011.
(3) The difference between exposures as at 31 December 2011 and 30 June 2011.

Basel II Pillar 3 11
APS 330 Table 4b – Credit risk exposure by portfolio type
As at Half year
31 Dec 12 average (3)
Portfolio Type $M $M
Corporate 89,553 91,289
SME corporate 46,798 45,238
SME retail 13,395 13,456
Sovereign 50,251 49,627
Bank 40,030 40,919
Residential mortgage (1) 423,407 417,324
Qualifying revolving retail 22,068 21,812
Other retail 10,430 10,311
Specialised lending 54,667 48,123
Other assets 10,768 10,183
Total credit exposures (2) 761,367 748,282
(1) Residential mortgages include SME retail secured by residential property.
(2) Total credit risk exposures do not include equities or securitisation exposures.
(3) The simple average of closing balances of each half year.
As at Half year
30 Jun 12 average (3)
Portfolio Type $M $M
Corporate 93,024 89,878
SME corporate 43,677 43,654
SME retail 13,517 14,165
Sovereign 49,001 46,555
Bank 41,807 43,676
Residential mortgage (1) 411,240 407,223
Qualifying revolving retail 21,555 21,252
Other retail 10,191 9,954
Specialised lending 41,578 42,039
Other assets 9,597 11,002
Total credit exposures (2) 735,187 729,398
(1) Residential mortgages include SME retail secured by residential property.
(2) Total credit risk exposures do not include equities or securitisation exposures.
(3) The simple average of closing balances of each half year.
As at Half year
31 Dec 11 average (3)
Portfolio Type $M $M
Corporate 86,732 81,101
SME corporate 43,632 44,108
SME retail 14,813 14,730
Sovereign 44,108 43,856
Bank 45,546 43,788
Residential mortgage (1) 403,206 398,300
Qualifying revolving retail 20,948 19,754
Other retail 9,717 9,487
Specialised lending 42,501 42,097
Other assets 12,407 13,160
Total credit exposures (2) 723,610 710,381
(1) Residential mortgages include SME retail secured by residential property.
(2) Total credit risk exposures do not include equities or securitisation exposures.
(3) The simple average of closing balances of each half year.

12 Commonwealth Bank of Australia
APS 330 Table 4c – Credit risk exposure by portfolio type and geographic distribution
New
Australia Zealand Other Total
Portfolio Type $M $M $M $M
Corporate 66,097 5,718 17,738 89,553
SME corporate 38,624 7,671 503 46,798
SME retail 11,437 1,928 30 13,395
Sovereign 31,681 3,176 15,394 50,251
Bank 20,440 1,195 18,395 40,030
Residential mortgage (1) 387,363 35,441 603 423,407
Qualifying revolving retail 22,068 - - 22,068
Other retail 8,921 1,506 3 10,430
Specialised lending 45,404 4,369 4,894 54,667
Other assets 9,414 554 800 10,768
Total credit exposures (2) 641,449 61,558 58,360 761,367
31 December 2012 (3)
(1) Residential mortgages include SME retail secured by residential property.
(2) Total credit risk exposures do not include equities or securitisation exposures.
(3) Balances are reported based on the risk domicile of the borrowers.
New
Australia Zealand Other Total
Portfolio Type $M $M $M $M
Corporate 69,349 5,966 17,709 93,024
SME corporate 36,383 7,001 293 43,677
SME retail 11,615 1,862 40 13,517
Sovereign 27,968 1,954 19,079 49,001
Bank 23,000 592 18,215 41,807
Residential mortgage (1) 377,341 33,462 437 411,240
Qualifying revolving retail 21,555 - - 21,555
Other retail 8,735 1,455 1 10,191
Specialised lending 35,426 3,669 2,483 41,578
Other assets 8,590 676 331 9,597
Total credit exposures (2) 619,962 56,637 58,588 735,187
30 June 2012 (3)
(1) Residential mortgages include SME retail secured by residential property.
(2) Total credit risk exposures do not include equities or securitisation exposures.
(3) Balances are reported based on the risk domicile of the borrowers.
New
Australia Zealand Other Total
Portfolio Type $M $M $M $M
Corporate 64,773 5,470 16,489 86,732
SME corporate 36,784 6,237 611 43,632
SME retail 12,963 1,806 44 14,813
Sovereign 25,263 2,121 16,724 44,108
Bank 23,609 1,150 20,787 45,546
Residential mortgage (1) 370,554 32,246 406 403,206
Qualifying revolving retail 20,948 - - 20,948
Other retail 8,329 1,387 1 9,717
Specialised lending 37,105 3,789 1,607 42,501
Other assets 9,455 2,603 349 12,407
Total credit exposures (2) 609,783 56,809 57,018 723,610
31 December 2011 (3)
(1) Residential mortgages include SME retail secured by residential property.
(2) Total credit risk exposures do not include equities or securitisation exposures.
(3) Balances are reported based on the risk domicile of the borrowers.

Basel II Pillar 3 13
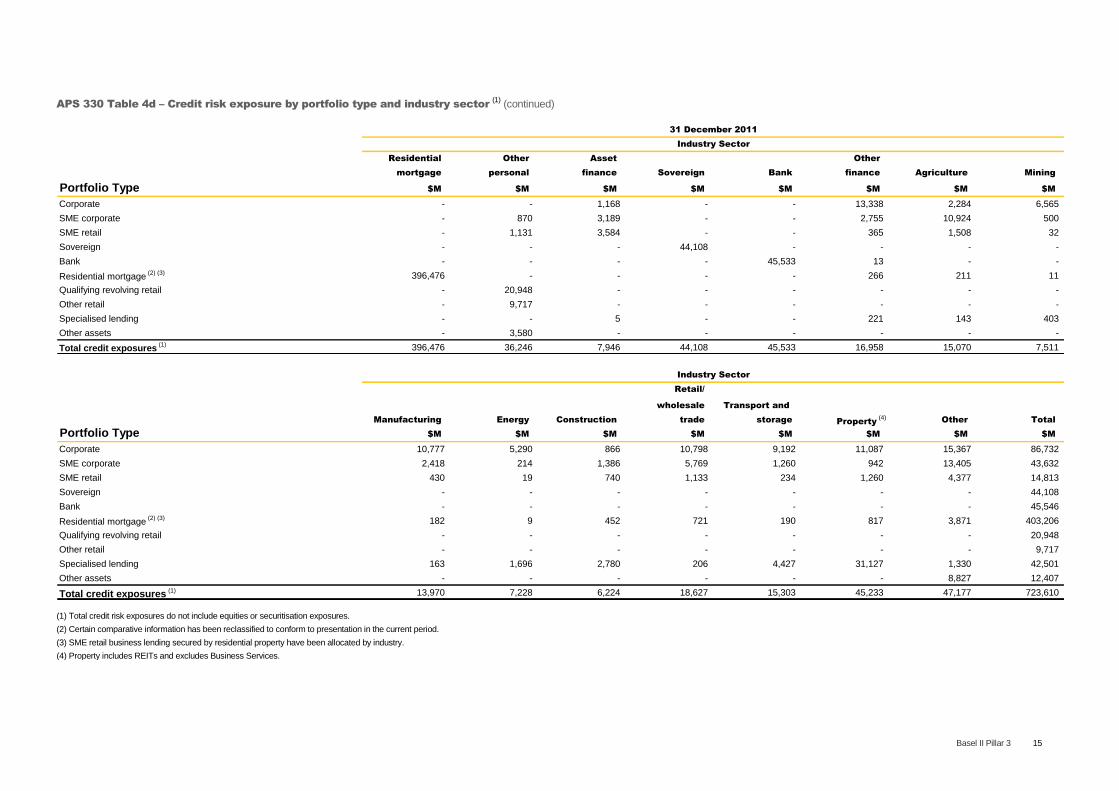
APS 330 Table 4d – Credit risk exposure by portfolio type and industry sector (1)
Residential Other Asset Other
mortgage personal finance Sovereign Bank finance Agriculture Mining
Portfolio Type $M $M $M $M $M $M $M $M
Corporate - - 1,421 - - 11,784 2,261 6,623
SME corporate - 8 3,369 - - 2,700 12,322 369
SME retail - 1,046 3,181 - - 293 1,740 33
Sovereign - - - 50,251 - - - -
Bank - - - - 40,030 - - -
Residential mortgage (2) 416,739 - - - - 235 213 9
Qualifying revolving retail - 22,068 - - - - - -
Other retail - 10,430 - - - - - -
Specialised lending - - 7 - - 486 135 2,277
Other assets - 3,244 - - - - - -
Total credit exposures (1) 416,739 36,796 7,978 50,251 40,030 15,498 16,671 9,311
31 December 2012
Industry Sector
Retail/
wholesale Transport and
Manufacturing Energy Construction trade storage Property (3)
Other Total
Portfolio Type $M $M $M $M $M $M $M $M
Corporate 10,601 5,982 1,920 10,791 11,125 8,534 18,511 89,553
SME corporate 2,953 63 1,806 6,934 1,576 190 14,508 46,798
SME retail 404 21 737 1,097 221 1,317 3,305 13,395
Sovereign - - - - - - - 50,251
Bank - - - - - - - 40,030
Residential mortgage (2) 183 10 443 717 170 866 3,822 423,407
Qualifying revolving retail - - - - - - - 22,068
Other retail - - - - - - - 10,430
Specialised lending 349 1,634 1,802 249 4,301 40,765 2,662 54,667
Other assets - - - - - - 7,524 10,768
Total credit exposures (1) 14,490 7,710 6,708 19,788 17,393 51,672 50,332 761,367
Industry Sector
(1) Total credit risk exposures do not include equities or securitisation exposures.
(2) SME retail business lending secured by residential property have been allocated by industry.
(3) Property includes REITs and excludes Business Services.

14 Commonwealth Bank of Australia
APS 330 Table 4d – Credit risk exposure by portfolio type and industry sector (1) (continued)
Residential Other Asset Other
mortgage personal finance Sovereign Bank finance Agriculture Mining
Portfolio Type $M $M $M $M $M $M $M $M
Corporate - - 1,289 - - 12,839 2,259 6,556
SME corporate - 887 3,362 - - 2,461 11,141 445
SME retail - 1,130 3,254 - - 290 1,531 31
Sovereign - - - 49,001 - - - -
Bank - - - - 41,807 - - -
Residential mortgage (2) (3) 404,532 - - - - 251 215 11
Qualifying revolving retail - 21,555 - - - - - -
Other retail - 10,187 - - - - - -
Specialised lending - - 7 - - 165 128 307
Other assets - 3,465 - - - - - -
Total credit exposures (1) 404,532 37,224 7,912 49,001 41,807 16,006 15,274 7,350
30 June 2012
Industry Sector
Retail/
wholesale Transport and
Manufacturing Energy Construction trade storage Property (4)
Other Total
Portfolio Type $M $M $M $M $M $M $M $M
Corporate 11,071 5,203 1,312 8,708 11,005 14,285 18,497 93,024
SME corporate 2,575 150 1,482 5,644 1,276 735 13,519 43,677
SME retail 406 18 725 1,106 225 1,295 3,506 13,517
Sovereign - - - - - - - 49,001
Bank - - - - - - - 41,807
Residential mortgage (2) (3) 184 9 450 727 185 831 3,845 411,240
Qualifying revolving retail - - - - - - - 21,555
Other retail - - - - - - 4 10,191
Specialised lending 185 2,267 2,256 271 3,625 30,470 1,897 41,578
Other assets - - - - - - 6,132 9,597
Total credit exposures (1) 14,421 7,647 6,225 16,456 16,316 47,616 47,400 735,187
Industry Sector
(1) Total credit risk exposures do not include equities or securitisation exposures.
(2) Certain comparative information has been reclassified to conform to presentation in the current period.
(3) SME retail business lending secured by residential property have been allocated by industry.
(4) Property includes REITs and excludes Business Services.
Basel II Pillar 3 15
APS 330 Table 4d – Credit risk exposure by portfolio type and industry sector (1) (continued)
Residential Other Asset Other
mortgage personal finance Sovereign Bank finance Agriculture Mining
Portfolio Type $M $M $M $M $M $M $M $M
Corporate - - 1,168 - - 13,338 2,284 6,565
SME corporate - 870 3,189 - - 2,755 10,924 500
SME retail - 1,131 3,584 - - 365 1,508 32
Sovereign - - - 44,108 - - - -
Bank - - - - 45,533 13 - -
Residential mortgage (2) (3) 396,476 - - - - 266 211 11
Qualifying revolving retail - 20,948 - - - - - -
Other retail - 9,717 - - - - - -
Specialised lending - - 5 - - 221 143 403
Other assets - 3,580 - - - - - -
Total credit exposures (1) 396,476 36,246 7,946 44,108 45,533 16,958 15,070 7,511
31 December 2011
Industry Sector
Retail/
wholesale Transport and
Manufacturing Energy Construction trade storage Property (4)
Other Total
Portfolio Type $M $M $M $M $M $M $M $M
Corporate 10,777 5,290 866 10,798 9,192 11,087 15,367 86,732
SME corporate 2,418 214 1,386 5,769 1,260 942 13,405 43,632
SME retail 430 19 740 1,133 234 1,260 4,377 14,813
Sovereign - - - - - - - 44,108
Bank - - - - - - - 45,546
Residential mortgage (2) (3) 182 9 452 721 190 817 3,871 403,206
Qualifying revolving retail - - - - - - - 20,948
Other retail - - - - - - - 9,717
Specialised lending 163 1,696 2,780 206 4,427 31,127 1,330 42,501
Other assets - - - - - - 8,827 12,407
Total credit exposures (1) 13,970 7,228 6,224 18,627 15,303 45,233 47,177 723,610
Industry Sector
(1) Total credit risk exposures do not include equities or securitisation exposures.
(2) Certain comparative information has been reclassified to conform to presentation in the current period.
(3) SME retail business lending secured by residential property have been allocated by industry.
(4) Property includes REITs and excludes Business Services.

16 Commonwealth Bank of Australia
APS 330 Table 4e – Credit risk exposure by portfolio type and contractual maturity
No specified
≤ 12mths 1 ≤ 5yrs > 5 years maturity Total
Portfolio Type $M $M $M $M $M
Corporate 10,812 71,954 5,223 1,564 89,553
SME corporate 5,300 32,807 6,565 2,126 46,798
SME retail 1,881 7,258 3,908 348 13,395
Sovereign 9,853 22,294 17,262 842 50,251
Bank 13,526 25,762 385 357 40,030
Residential mortgage (1) 11,398 5,977 351,260 54,772 423,407
Qualifying revolving retail - - - 22,068 22,068
Other retail 119 3,787 3,240 3,284 10,430
Specialised lending 14,283 35,998 3,349 1,037 54,667
Other assets 4,231 - - 6,537 10,768
Total credit exposures (2) 71,403 205,837 391,192 92,935 761,367
31 December 2012
(1) Residential mortgages include SME retail secured by residential property.
(2) Total credit risk exposures do not include equities or securitisation exposures.
No specified
≤ 12mths 1 ≤ 5yrs > 5 years maturity Total
Portfolio Type $M $M $M $M $M
Corporate (3) 9,106 75,672 5,959 2,287 93,024
SME corporate 4,618 31,041 7,075 943 43,677
SME retail 2,036 7,368 3,917 196 13,517
Sovereign 12,383 20,361 15,280 977 49,001
Bank 11,107 29,569 780 351 41,807
Residential mortgage (1) 9,375 9,132 337,172 55,561 411,240
Qualifying revolving retail - - - 21,555 21,555
Other retail 115 3,829 3,081 3,166 10,191
Specialised lending 14,264 24,834 2,480 - 41,578
Other assets 4,472 - - 5,125 9,597
Total credit exposures (2) 67,476 201,806 375,744 90,161 735,187
30 June 2012
(1) Residential mortgages include SME retail secured by residential property.
(2) Total credit risk exposures do not include equities or securitisation exposures.
(3) Certain comparative information has been reclassified to conform to presentation in the current period.
No specified
≤ 12mths 1 ≤ 5yrs > 5 years maturity Total
Portfolio Type $M $M $M $M $M
Corporate 10,258 68,383 4,729 3,362 86,732
SME corporate 3,755 31,722 7,301 854 43,632
SME retail 2,113 8,288 4,251 161 14,813
Sovereign 9,629 19,620 14,013 846 44,108
Bank 11,058 33,107 914 467 45,546
Residential mortgage (1) 8,798 9,259 327,639 57,510 403,206
Qualifying revolving retail - - - 20,948 20,948
Other retail 112 3,768 2,865 2,972 9,717
Specialised lending 14,677 24,904 2,920 - 42,501
Other assets 4,470 - - 7,937 12,407
Total credit exposures (2) 64,870 199,051 364,632 95,057 723,610
31 December 2011
(1) Residential mortgages include SME retail secured by residential property.
(2) Total credit risk exposures do not include equities or securitisation exposures.

Basel II Pillar 3 17
4.2 Past Due and Impaired Exposures, Provisions and Reserves
All provisions for impairment assessed on an individual basis in accordance with the Australian Accounting Standards are classified as
specific provisions in accordance with APS220 “Credit Quality”. Most of the collective provisions raised under the Australian Accounting
Standards are included in the general reserve for credit losses (GRCL), however, since 31 December 2009, certain collective provisions
not eligible for inclusion in the GRCL are classified as specific provisions. This includes, for example, collective provisions on unsecured
retail products 90 days or more past due.
Reconciliation of the Australian Accounting Standards, APS220 based credit provisions and APS 330
Table 4j – General reserve for credit losses
General
reserve for Specific Total
credit losses (2)
provision (2)
provisions
$M $M $M
Collective provision (1) 2,719 139 2,858
Individual provisions (1) - 1,845 1,845
Total provisions 2,719 1,984 4,703
Additional GRCL requirement (3) 282 - 282
Total regulatory provisions 3,001 1,984 4,985
31 December 2012
(1) Provisions as reported in financial accounts according to the Australian Accounting Standards.
(2) Provisions classified according to APS 220 “Credit Quality”.
(3) The Group has recognised an after tax deduction from Tier One Capital of $197 million in order to maintain the required minimum GRCL.
General
reserve for Specific Total
credit losses (2)
provision (2)
provisions
$M $M $M
Collective provision (1) 2,682 155 2,837
Individual provisions (1) - 2,008 2,008
Total provisions 2,682 2,163 4,845
Additional GRCL requirement (3) 299 - 299
Total regulatory provisions 2,981 2,163 5,144
30 June 2012
(1) Provisions as reported in financial accounts according to the Australian Accounting Standards.
(2) Provisions classified according to APS 220 “Credit Quality”.
(3) The Group has recognised an after tax deduction from Tier One Capital of $209 million in order to maintain the required minimum GRCL.
General
reserve for Specific Total
credit losses (2)
provision (2)
provisions
$M $M $M
Collective provision (1) 2,868 116 2,984
Individual provisions (1) - 2,097 2,097
Total provisions 2,868 2,213 5,081
Additional GRCL requirement (3) 261 - 261
Total regulatory provisions 3,129 2,213 5,342
31 December 2011
(1) Provisions as reported in financial accounts according to the Australian Accounting Standards.
(2) Provisions classified according to APS 220 “Credit Quality”.
(3) The Group has recognised an after tax deduction from Tier One Capital of $183 million in order to maintain the required minimum GRCL.
18 Commonwealth Bank of Australia
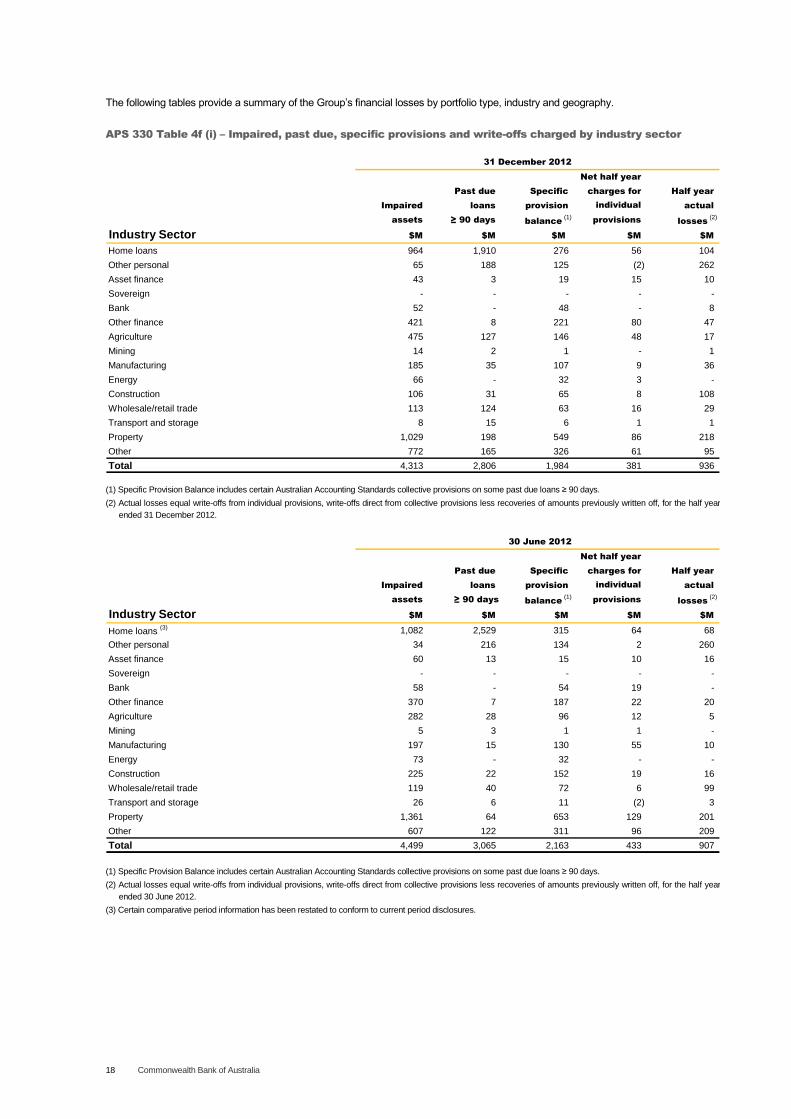
The following tables provide a summary of the Group‟s financial losses by portfolio type, industry and geography.
APS 330 Table 4f (i) – Impaired, past due, specific provisions and write-offs charged by industry sector
31 December 2012
Net half year
Past due Specific charges for Half year
Impaired loans provision individual actual
assets ≥ 90 days balance (1)
provisions losses (2)
Industry Sector $M $M $M $M $M
Home loans 964 1,910 276 56 104
Other personal 65 188 125 (2) 262
Asset finance 43 3 19 15 10
Sovereign - - - - -
Bank 52 - 48 - 8
Other finance 421 8 221 80 47
Agriculture 475 127 146 48 17
Mining 14 2 1 - 1
Manufacturing 185 35 107 9 36
Energy 66 - 32 3 -
Construction 106 31 65 8 108
Wholesale/retail trade 113 124 63 16 29
Transport and storage 8 15 6 1 1
Property 1,029 198 549 86 218
Other 772 165 326 61 95
Total 4,313 2,806 1,984 381 936
(1) Specific Provision Balance includes certain Australian Accounting Standards collective provisions on some past due loans ≥ 90 days.
(2) Actual losses equal write-offs from individual provisions, write-offs direct from collective provisions less recoveries of amounts previously written off, for the half year
ended 31 December 2012.
30 June 2012 > 0 = Error in calculation
Net half year
Past due Specific charges for Half year
Impaired loans provision individual actual
assets ≥ 90 days balance (1)
provisions losses (2)
Industry Sector $M $M $M $M $M
Home loans (3) 1,082 2,529 315 64 68
Other personal 34 216 134 2 260
Asset finance 60 13 15 10 16
Sovereign - - - - -
Bank 58 - 54 19 -
Other finance 370 7 187 22 20
Agriculture 282 28 96 12 5
Mining 5 3 1 1 -
Manufacturing 197 15 130 55 10
Energy 73 - 32 - -
Construction 225 22 152 19 16
Wholesale/retail trade 119 40 72 6 99
Transport and storage 26 6 11 (2) 3
Property 1,361 64 653 129 201
Other 607 122 311 96 209
Total 4,499 3,065 2,163 433 907
(1) Specific Provision Balance includes certain Australian Accounting Standards collective provisions on some past due loans ≥ 90 days.
(2) Actual losses equal write-offs from individual provisions, write-offs direct from collective provisions less recoveries of amounts previously written off, for the half year
ended 30 June 2012.
(3) Certain comparative period information has been restated to conform to current period disclosures.

Basel II Pillar 3 19
APS 330 Table 4f (i) – Impaired, past due, specific provisions and write-offs charged by industry sector
(continued)
31 December 2011 > 0 = Error in calculation
Net half year
Past due Specific charges for Half year
Impaired loans provision individual actual
assets (1)
≥ 90 days (1)
balance (2)
provisions losses (3)
Industry Sector $M $M $M $M $M
Home loans 989 2,496 281 79 39
Other personal 39 219 120 2 261
Asset finance 69 14 26 6 5
Sovereign - - - - -
Bank 55 - 34 1 -
Other finance 368 12 193 28 15
Agriculture 228 31 80 4 32
Mining 15 3 1 - 1
Manufacturing 144 16 89 8 2
Energy 75 - 32 (5) 47
Construction 236 20 134 16 29
Wholesale/retail trade 252 35 154 97 27
Transport and storage 153 8 16 (18) 8
Property 1,424 111 727 124 146
Other 629 126 326 2 130
Total 4,676 3,091 2,213 344 742
(1) Certain comparative information has been reclassified to conform to presentation in the current period.
(2) Specific Provision Balance includes certain Australian Accounting Standards collective provisions on some past due loans ≥ 90 days.
(3) Actual losses equal write-offs from individual provisions, write-offs direct from collective provisions less recoveries of amounts previously written off, for the half year
ended 31 December 2011.

20 Commonwealth Bank of Australia
APS 330 Table 4f (ii) – Impaired, past due, specific provisions and write-offs charged by portfolio
Net half year
Past due Specific charges for Half year
Impaired loans provision individual actual
assets ≥ 90 days balance (1)
provisions losses (2)
Portfolio $M $M $M $M $M
Corporate including SME and specialised lending (3) 3,232 708 1,535 327 562
Sovereign - - - - -
Bank 52 - 48 - 8
Residential mortgage 964 1,910 276 56 104
Qualifying revolving retail 20 89 48 - 133
Other retail 45 99 77 (2) 129
Total 4,313 2,806 1,984 381 936
31 December 2012
(1) Specific Provision Balance includes certain Australian Accounting Standards collective provisions on some past due loans ≥ 90 days.
(2) Actual losses equal write-offs from individual provisions, write-offs direct from collective provisions less recoveries of amounts previously written off, for the half year
ended 31 December 2012.
(3) The movement in past due loans ≥ 90 days for Corporate in December 2012 is primarily due to a change in Bankwest process to align with CBA practice.
Net half year
Past due Specific charges for Half year
Impaired loans provision individual actual
assets ≥ 90 days balance (1)
provisions losses (2)
Portfolio $M $M $M $M $M
Corporate including SME and specialised lending 3,325 320 1,660 348 579
Sovereign - - - - -
Bank 58 - 54 19 -
Residential mortgage (3) 1,082 2,529 315 64 68
Qualifying revolving retail - 103 56 - 122
Other retail 34 113 78 2 138
Total 4,499 3,065 2,163 433 907
30 June 2012
(1) Specific Provision Balance includes certain Australian Accounting Standards collective provisions on some past due loans ≥ 90 days.
(2) Actual losses equal write-offs from individual provisions, write-offs direct from collective provisions less recoveries of amounts previously written off, for the half year
ended 30 June 2012.
(3) Certain comparative period information has been restated to conform to current period disclosures.
Net half year
Past due Specific charges for Half year
Impaired loans provision individual actual
assets (1)
≥ 90 days (1)
balance (2)
provisions losses (2)
Portfolio $M $M $M $M $M
Corporate including SME and specialised lending 3,593 376 1,778 262 442
Sovereign - - - - -
Bank 55 - 34 1 -
Residential mortgage 989 2,496 281 79 39
Qualifying revolving retail - 102 58 - 136
Other retail 39 117 62 2 125
Total 4,676 3,091 2,213 344 742
31 December 2011
(1) Certain comparative information has been reclassified to conform to presentation in the current period.
(2) Specific Provision Balance includes certain Australian Accounting Standards collective provisions on some past due loans ≥ 90 days.
(3) Actual losses equal write-offs from individual provisions, write-offs direct from collective provisions less recoveries of amounts previously written off, for the half year
ended 31 December 2011.

Basel II Pillar 3 21
APS 330 Table 4g (i) – Impaired, past due and specific provisions by geographic region
Past due Specific
Impaired loans provision
assets ≥ 90 days balance
Geographic Region (1)
$M $M $M
Australia 3,840 2,683 1,832
New Zealand 372 114 83
Other 101 9 69
Total 4,313 2,806 1,984
31 December 2012
(1) Balances are disclosed based on the risk domicile of the borrower. The Group‟s financial statements disclose balances based on the domicile of the lending entity.
Past due Specific
Impaired loans provision
assets ≥ 90 days (2)
balance
Geographic Region (1)
$M $M $M
Australia 4,080 2,885 2,000
New Zealand 312 171 90
Other 107 9 73
Total 4,499 3,065 2,163
30 June 2012
(1) Balances are disclosed based on the risk domicile of the borrower. The Group‟s financial statements disclose balances based on the domicile of the lending entity.
(2) Certain comparative information has been reclassified to conform to presentation in the current period.
Past due Specific
Impaired loans provision
assets (2)
≥ 90 days (2)
balance
Geographic Region (1)
$M $M $M
Australia 4,185 2,887 2,105
New Zealand 281 196 65
Other 210 8 43
Total 4,676 3,091 2,213
31 December 2011
(1) Balances are disclosed based on the risk domicile of the borrower. The Group‟s financial statements disclose balances based on the domicile of the lending entity.
(2) Certain comparative information has been reclassified to conform to presentation in the current period.
The Group‟s GRCL (before tax) by geographic region is distributed as follows:
APS 330 Table 4g (ii) – GRCL by geographic region
31 Dec 12 30 Jun 12 31 Dec 11
Geographic Region $M $M $M
Australia 2,771 2,748 2,896
New Zealand 109 108 137
Other 121 125 96
Total GRCL 3,001 2,981 3,129

22 Commonwealth Bank of Australia
APS 330 Table 4h (i) – Movement in collective and other provisions
31 Dec 12 30 Jun 12 31 Dec 11
Movement in Collective Provisions $M $M $M
Opening balance 2,837 2,984 3,043
Net charge against profit and loss 299 111 201
Recoveries 74 127 101
Other (3) (1) (5)
Write-offs (349) (384) (356)
Total collective provisions 2,858 2,837 2,984
Less collective provisions transferred to specific provisions (139) (155) (116)
Additional GRCL requirement (1) 282 299 261
General reserve for credit losses 3,001 2,981 3,129
Half Year Ended
(1) The Group has recognised an after tax deduction from Tier One Capital of $197 million for 31 December 2012 (30 June 2012: $209 million; 31 December 2011:
$183 million) in order to maintain the required minimum GRCL.
APS 330 Table 4h (ii) – Movement in individual provisions
31 Dec 12 30 Jun 12 31 Dec 11
Movement in Individual Provisions $M $M $M
Opening balance for the period 2,008 2,097 2,125
Net new and increased provisioning 521 662 540
Net write back of provisions no longer required (140) (229) (196)
Discount unwind to interest income (51) (59) (63)
Other 168 187 178
Write-offs (661) (650) (487)
Individual provisions 1,845 2,008 2,097
Add collective provisions transferred to specific provisions 139 155 116
Specific provisions 1,984 2,163 2,213
Half Year Ended
4.3 Portfolios Subject to Standardised and Supervisory Risk-Weights in the IRB Approaches
Portfolios that use the Standardised approach include:
Commonwealth Bank of Australia:
Some retail SMEs (overdrawn accounts);
Non-rated Corporate exposures;
Some residential mortgages (purchased portfolios);
Reverse mortgages;
Margin Lending;
Non-recourse purchased receivables; and
Some branches (China, India & Vietnam).
ASB Bank Limited:
Personal Loans.
Bankwest:
Retail SME;
Some residential mortgages (equity lines of credit); and
Unsecured consumer retail (personal loans, credit
cards and personal cheque accounts).
All exposures in the following entities:
CommBank Europe Limited;
PT Bank Commonwealth (Indonesia); and
China County Banks.
APS 330 Table 5b – Exposures subject to standardised and supervisory risk-weights
31 Dec 12 30 Jun 12 31 Dec 11
Standardised Approach Exposures (1) $M $M $M
Risk weight
0% 3,559 6,301 7,508
20% 5,755 10,459 10,885
35% 2,484 39,663 38,078
50% 2,387 12,339 11,813
75% 152 681 666
100% 12,559 29,242 31,448
150% 1,324 1,869 1,158
> 150% - - -
Capital deductions - - -
Total 28,220 100,554 101,556
Exposure After Risk Mitigation (1)
(1) Exposure after credit risk mitigation does not include equity or securitisation exposures.

Basel II Pillar 3 23
APS 330 Table 5b – Exposures subject to standardised and supervisory risk-weights (continued)
Exposure Risk weight RWA
Other Assets (1) $M % $M
Cash 2,730 - -
Cash items in course of collection 1,649 20 330
Margin lending 3,244 20 649
Fixed assets 1,468 100 1,468
Other 1,677 100 1,677
Total 10,768 38 4,124
31 December 2012
(1) Other Assets are included in Standardised Approach Exposures table above.
Exposure Risk weight RWA
Other Assets (1) $M % $M
Cash 2,715 - -
Cash items in course of collection 1,086 20 217
Margin lending 3,466 20 693
Fixed assets 1,523 100 1,523
Other 807 100 807
Total 9,597 34 3,240
30 June 2012
(1) Other Assets are included in Standardised Approach Exposures table above.
Exposure Risk weight RWA
Other Assets (1) $M % $M
Cash 3,650 - -
Cash items in course of collection 848 20 170
Margin lending 3,580 20 716
Fixed assets 1,350 100 1,350
Other 2,979 100 2,979
Total 12,407 42 5,215
31 December 2011
(1) Other Assets are included in Standardised Approach Exposures table above.
31 Dec 12 30 Jun 12 31 Dec 11
Specialised Lending Exposures Subject to Supervisory Slotting (1)
$M $M $M
Risk Weight
0% 1,623 743 745
70% 15,800 14,263 15,559
90% 27,551 20,559 19,720
115% 8,660 5,466 5,864
250% 1,033 547 613
Total exposures 54,667 41,578 42,501
(1) APRA requires certain specialised lending exposures including Income Producing Real Estate, Object and Project Finance to be assigned specific risk weights
according to “slotting” criteria defined by the regulator.
31 Dec 12 30 Jun 12 31 Dec 11
Equity Credit Exposures $M $M $M
Risk Weight
300% 458 445 421
400% 256 251 286
Total credit exposures 714 696 707

24 Commonwealth Bank of Australia
4.4 Portfolios Subject to Internal Ratings Based Approaches
The Group‟s mapping of internal rating scales for risk-rated exposures to external rating agencies is detailed in APS 330 Table 6b.
APS 330 Table 6b – Internal ratings structure for credit risk exposures
Description Internal Rating Probability of Default
Exceptional A0, A1, A2, A3 0.00% - 0.04%
Strong B1, B2, B3, C1, C2, C3 0.04% - 0.45%
Pass D1, D2, D3, E1, E2, E3 0.45% - 4.35%
Weak/doubtful F1, F2, F3, G1, G2, G3 > 4.35%
Default H 100%
Description S&P Rating Moody’s Rating
Exceptional AAA, AA+, AA, AA- Aaa, Aa1, Aa2, Aa3
Strong A+, A, A-, BBB+, BBB, BBB- A1, A2, A3, Baa1, Baa2, Baa3
Pass BB+, BB, BB-, B+, B, B- Ba1, Ba2, Ba3, B1, B2, B3
Weak/doubtful CCC, CC, C Caa, Ca
Default D C
APS 330 Table 6c summarises the PD rating methodology applied by the Group to various segments of the credit portfolio.
APS 330 Table 6c – PD rating methodology by portfolio segment
Portfolio Segment PD Rating Methodology
Bank, sovereign and large corporate exposures Expert judgement assigned risk rating, informed but not driven by
rating agency views and internal rating tools.
Middle market and local business banking exposures Risk rating assigned by PD Rating Tools.
SME retail exposures < $1m SME Behaviour Score assigned PD pools.
Consumer retail exposures PD pools are product specific and assigned based on customer and
facility characteristics. Characteristics used to assign exposures to
pools include application scores, behaviour scores, prepayments,
utilisation, time on books and past default experience.

Basel II Pillar 3 25
Credit Risk Exposure Subject to the Basel II Advanced Approach
APS 330 Table 6d (i) provides a breakdown by asset class and PD Band, of the Group’s credit risk for non-retail exposures that qualify for calculation of RWA under the Basel II AIRB approach.
APS 330 Table 6d (i) – Non-Retail exposures by portfolio type and PD band
0 < 0.03% 0.03% < 0.15% 0.15% < 0.5% 0.5% < 3% 3% < 10% 10% < 100% Default Total
Non Retail (1)$M $M $M $M $M $M $M $M
Total credit risk exposures
Corporate - 25,943 38,219 18,835 788 750 1,073 85,608
SME corporate - 434 4,138 35,232 3,230 1,369 2,060 46,463
SME retail - - 1,073 5,252 1,667 316 210 8,518
Sovereign 46,723 886 594 1,195 13 1 - 49,412
Bank - 37,185 1,777 545 14 - 159 39,680
Total 46,723 64,448 45,801 61,059 5,712 2,436 3,502 229,681
Undrawn commitments (2)
Corporate - 11,764 17,742 5,445 281 50 35 35,317
SME corporate - 62 868 4,930 299 84 29 6,272
SME retail - - 665 772 298 8 9 1,752
Sovereign 834 116 420 1,114 13 1 - 2,498
Bank - 2,278 369 313 4 - - 2,964
Total 834 14,220 20,064 12,574 895 143 73 48,803
Exposure - weighted average EAD ($M)
Corporate - 6. 167 4. 374 0. 815 1. 328 1. 889 3. 214 4. 070
SME corporate - 0. 163 0. 292 0. 184 0. 247 0. 378 0. 713 0. 227
SME retail - - 0. 007 0. 009 0. 033 0. 056 0. 060 0. 016
Sovereign 7. 663 1. 043 1. 181 0. 443 0. 131 1. 162 - 7. 290
Bank - 10. 646 4. 271 0. 127 4. 662 - 22. 746 10. 262
Exposure - weighted average LGD (%)
Corporate - 56. 6 55. 5 48. 4 44. 7 44. 2 48. 7 54. 0
SME corporate - 58. 1 31. 8 29. 6 28. 4 31. 1 36. 0 30. 3
SME retail - - 33. 6 41. 8 29. 6 50. 1 39. 6 38. 6
Sovereign 21. 8 42. 7 44. 4 9. 2 7. 1 5. 0 - 22. 1
Bank - 61. 3 60. 4 61. 0 61. 3 - 61. 3 61. 3
Exposure - weighted average risk weight (%)
Corporate - 29. 2 62. 8 86. 2 143. 5 227. 5 111. 3 60. 6
SME corporate - 20. 3 33. 2 53. 3 77. 6 148. 9 293. 4 66. 4
SME retail - - 17. 7 49. 7 42. 2 101. 7 189. 6 49. 6
Sovereign 6. 4 23. 5 40. 1 21. 1 23. 5 26. 0 - 7. 5
Bank - 18. 9 49. 7 72. 3 245. 8 - - 21. 0
31 December 2012
PD Grade
(1) Total credit risk exposures do not include specialised lending, equity or securitisation exposures.
(2) The credit exposure value of undrawn commitments included in Total Credit Risk Exposures above.

26 Commonwealth Bank of Australia 12/02/2013 4:40 PM
Credit Risk Exposure Subject to the Basel II Advanced Approach
APS 330 Table 6d (i) provides a breakdown by asset class and PD Band, of the Group’s credit risk for non-retail exposures that qualify for calculation of RWA under the Basel II AIRB approach.
APS 330 Table 6d (i) – Non-Retail exposures by portfolio type and PD band (continued)
0 < 0.03% 0.03% < 0.15% 0.15% < 0.5% 0.5% < 3% 3% < 10% 10% < 100% Default Total
Non Retail (1) (2)$M $M $M $M $M $M $M $M
Total credit risk exposure
Corporate - 26,134 36,634 17,741 861 672 623 82,665
SME corporate - 495 3,977 28,322 2,523 1,073 846 37,236
SME retail - - 978 5,235 1,765 224 180 8,382
Sovereign 43,592 1,311 644 1,047 12 3 - 46,609
Bank - 32,884 2,250 153 - - 39 35,326
Total 43,592 60,824 44,483 52,498 5,161 1,972 1,688 210,218
Undrawn commitments (3)
Corporate - 12,470 15,226 4,326 119 46 31 32,218
SME corporate - 131 772 4,173 228 44 20 5,368
SME retail - - 599 755 298 9 6 1,667
Sovereign 1,293 195 402 1,021 12 3 - 2,926
Bank - 1,861 374 109 - - - 2,344
Total 1,293 14,657 17,373 10,384 657 102 57 44,523
Exposure - weighted average EAD ($M)
Corporate - 5. 937 4. 315 0. 802 1. 295 1. 397 2. 857 4. 008
SME corporate - 0. 211 0. 276 0. 153 0. 208 0. 302 0. 487 0. 182
SME retail - - 0. 006 0. 009 0. 033 0. 040 0. 052 0. 016
Sovereign 6. 946 1. 463 1. 118 0. 379 0. 158 2. 634 - 6. 562
Bank - 11. 005 4. 230 0. 037 - - 13. 073 10. 528
Exposure - weighted average LGD (%)
Corporate - 58. 6 55. 3 46. 9 37. 2 43. 5 47. 0 54. 2
SME corporate - 58. 8 33. 7 30. 4 29. 3 33. 4 35. 8 31. 2
SME retail - - 33. 4 41. 8 29. 0 35. 5 32. 4 37. 8
Sovereign 17. 7 46. 1 45. 4 6. 9 5. 4 5. 0 - 18. 7
Bank - 61. 3 58. 3 60. 9 - - 61. 3 61. 1
Exposure - weighted average risk weight (%)
Corporate - 30. 9 62. 8 83. 8 123. 0 214. 9 141. 9 59. 7
SME corporate - 19. 6 34. 6 52. 4 77. 9 159. 2 275. 6 59. 9
SME retail - - 17. 6 49. 8 41. 3 78. 2 216. 3 48. 6
Sovereign 5. 0 26. 6 40. 9 18. 1 16. 9 25. 4 - 6. 4
Bank - 19. 6 45. 8 93. 3 - - - 21. 6
30 June 2012
PD Grade
(1) This comparative period does not include Bankwest.
(2) Total credit risk exposures do not include specialised lending, equity or securitisation exposures.
(3) The credit exposure value of undrawn commitments included in Total Credit Risk Exposures above.

Basel II Pillar 3 27
APS 330 Table 6d (i) – Non-Retail exposures by portfolio type and PD band (continued)
0 < 0.03% 0.03% < 0.15% 0.15% < 0.5% 0.5% < 3% 3% < 10% 10% < 100% Default Total
Non Retail (1) (2) $M $M $M $M $M $M $M $M
Total credit risk exposure
Corporate - 24,262 32,895 17,169 1,034 828 592 76,780
SME corporate - 601 3,856 27,407 2,696 1,330 818 36,708
SME retail - - 1,151 6,154 1,819 193 186 9,503
Sovereign 39,799 928 560 67 - - - 41,354
Bank - 37,043 1,765 154 16 - 40 39,018
Total 39,799 62,834 40,227 50,951 5,565 2,351 1,636 203,363
Undrawn commitments (3)
Corporate - 12,683 14,937 4,546 85 89 27 32,367
SME corporate - 172 869 4,112 303 60 18 5,534
SME retail - - 713 1,014 334 17 6 2,084
Sovereign 1,339 166 253 16 - - - 1,774
Bank - 1,758 437 97 - - - 2,292
Total 1,339 14,779 17,209 9,785 722 166 51 44,051
Exposure - weighted average EAD ($M)
Corporate - 4. 751 4. 240 0. 809 2. 191 1. 604 2. 312 3. 563
SME corporate - 0. 232 0. 275 0. 205 0. 201 0. 308 0. 417 0. 221
SME retail - - 0. 007 0. 011 0. 032 0. 045 0. 052 0. 061
Sovereign 5. 653 1. 160 0. 967 0. 030 - - - 5. 480
Bank - 9. 728 5. 147 1. 329 16. 182 - 6. 584 9. 487
Exposure - weighted average LGD (%)
Corporate - 60. 0 56. 3 45. 1 34. 2 47. 5 48. 0 54. 5
SME corporate - 56. 8 34. 2 30. 3 29. 4 32. 6 36. 0 31. 3
SME retail - - 31. 8 41. 2 28. 2 35. 6 31. 8 37. 3
Sovereign 20. 6 61. 3 61. 3 61. 3 - - - 22. 1
Bank - 61. 2 59. 9 59. 3 61. 3 - 61. 0 61. 1
Exposure - weighted average risk weight (%)
Corporate - 31. 4 61. 8 80. 0 115. 2 245. 2 181. 5 59. 9
SME corporate - 20. 5 34. 7 52. 5 76. 5 156. 4 265. 5 60. 4
SME retail - - 16. 8 49. 1 40. 3 79. 4 206. 1 47. 2
Sovereign 6. 1 38. 3 62. 8 101. 5 - - - 7. 7
Bank - 18. 5 45. 8 91. 8 225. 3 - 189. 8 20. 3
31 December 2011
PD Grade
(1) This comparative period does not include Bankwest.
(2) Total credit risk exposures do not include specialised lending, equity or securitisation exposures.
(3) The credit exposure value of undrawn commitments included in Total Credit Risk Exposures above.

28 Commonwealth Bank of Australia
APS 330 Table 6d (ii) provides a breakdown by asset class and PD band, of the Group’s credit risk for retail exposures that qualify for calculation of RWA under the Basel II IRB approach.
APS 330 Table 6d (ii) – Retail exposures by portfolio type and PD band
0 < 0.1% 0.1% < 0.3% 0.3% < 0.5% 0.5% < 3% 3% < 10% 10% < 100% Default Total
Retail $M $M $M $M $M $M $M $M
Total credit risk exposures
Residential mortgage 86,345 129,422 58,943 123,386 8,491 8,875 3,082 418,544
Qualifying revolving retail 10,596 3,012 - 4,927 2,838 567 128 22,068
Other retail - 373 679 5,403 1,155 499 66 8,175
Total 96,941 132,807 59,622 133,716 12,484 9,941 3,276 448,787
Undrawn commitments (1)
Residential mortgage 39,600 8,669 2,363 12,643 269 48 8 63,600
Qualifying revolving retail 7,966 2,122 - 2,053 434 80 - 12,655
Other retail - 345 560 656 69 76 - 1,706
Total 47,566 11,136 2,923 15,352 772 204 8 77,961
Exposure - weighted average EAD ($M)
Residential mortgage 0. 198 0. 251 0. 246 0. 190 0. 251 0. 226 0. 253 0. 221
Qualifying revolving retail 0. 008 0. 007 - 0. 008 0. 009 0. 007 0. 008 0. 008
Other retail - 0. 002 0. 005 0. 008 0. 005 0. 002 0. 004 0. 007
Exposure - weighted average LGD (%)
Residential mortgage 20. 0 20. 1 20. 2 20. 9 21. 8 20. 3 20. 4 20. 4
Qualifying revolving retail 78. 0 78. 3 - 84. 5 88. 4 87. 9 86. 6 81. 1
Other retail - 94. 2 90. 3 97. 0 97. 8 99. 4 98. 2 96. 6
Exposure - weighted average risk weight (%)
Residential mortgage 2. 2 8. 5 13. 7 22. 8 70. 4 97. 3 0. 1 15. 2
Qualifying revolving retail 3. 1 11. 3 - 32. 9 107. 7 197. 3 - 29. 3
Other retail - 43. 1 59. 0 104. 6 144. 4 220. 3 1. 8 109. 9
31 December 2012
PD Grade
(1) The credit exposure value of undrawn commitments included in Total Credit Risk Exposures above.

Basel II Pillar 3 29
APS 330 Table 6d (ii) – Retail exposures by portfolio type and PD band (continued)
0 < 0.1% 0.1% < 0.3% 0.3% < 0.5% 0.5% < 3% 3% < 10% 10% < 100% Default Total
Retail (1)$M $M $M $M $M $M $M $M
Total credit risk exposures
Residential mortgage 76,957 111,839 35,519 110,312 7,768 7,959 3,256 353,610
Qualifying revolving retail 10,027 2,949 - 4,812 3,017 603 147 21,555
Other retail - 245 651 4,954 1,161 511 75 7,597
Total 86,984 115,033 36,170 120,078 11,946 9,073 3,478 382,762
Undrawn commitments (2)
Residential mortgage 33,592 7,249 1,411 11,618 345 56 8 54,279
Qualifying revolving retail 7,693 2,106 - 1,973 449 78 - 12,299
Other retail - 231 544 619 66 71 - 1,531
Total 41,285 9,586 1,955 14,210 860 205 8 68,109
Exposure - weighted average EAD ($M)
Residential mortgage 0. 194 0. 240 0. 211 0. 185 0. 230 0. 229 0. 241 0. 209
Qualifying revolving retail 0. 008 0. 007 - 0. 008 0. 009 0. 007 0. 007 0. 008
Other retail - 0. 002 0. 005 0. 009 0. 006 0. 002 0. 004 0. 007
Exposure - weighted average LGD (%)
Residential mortgage 20. 0 20. 1 20. 3 20. 7 22. 2 20. 5 20. 5 20. 4
Qualifying revolving retail 77. 4 77. 9 - 84. 6 88. 3 88. 0 86. 3 81. 0
Other retail - 93. 4 90. 3 96. 9 97. 6 99. 4 98. 3 96. 5
Exposure - weighted average risk weight (%)
Residential mortgage 2. 2 8. 4 13. 6 22. 8 74. 3 97. 0 - 15. 4
Qualifying revolving retail 3. 0 11. 2 - 33. 1 108. 9 196. 9 - 31. 1
Other retail - 42. 7 59. 0 104. 5 143. 8 220. 4 0. 5 111. 4
30 June 2012
PD Grade
(1) This comparative period does not include Bankwest.
(2) The credit exposure value of undrawn commitments included in Total Credit Risk Exposures above.

30 Commonwealth Bank of Australia
APS 330 Table 6d (ii) – Retail exposures by portfolio type and PD band (continued)
0 < 0.1% 0.1% < 0.3% 0.3% < 0.5% 0.5% < 3% 3% < 10% 10% < 100% Default Total
Retail (1)$M $M $M $M $M $M $M $M
Total credit risk exposures
Residential mortgage 74,941 108,778 35,861 110,057 7,509 7,696 3,256 348,098
Qualifying revolving retail 9,821 2,810 - 4,670 2,889 612 146 20,948
Other retail - 183 613 4,679 1,147 364 98 7,084
Total 84,762 111,771 36,474 119,406 11,545 8,672 3,500 376,130
Undrawn commitments (2)
Residential mortgage 33,437 7,520 1,250 11,724 389 44 8 54,372
Qualifying revolving retail 7,365 1,990 - 1,978 443 85 - 11,861
Other retail - 172 505 555 55 65 - 1,352
Total 40,802 9,682 1,755 14,257 887 194 8 67,585
Exposure - weighted average EAD ($M)
Residential mortgage 0. 190 0. 240 0. 220 0. 180 0. 230 0. 230 0. 240 0. 210
Qualifying revolving retail 0. 010 0. 010 - 0. 010 0. 010 0. 010 0. 010 0. 010
Other retail - - 0. 010 0. 010 0. 010 - - 0. 010
Exposure - weighted average LGD (%)
Residential mortgage 20. 0 20. 1 20. 2 20. 8 22. 6 20. 3 20. 5 20. 3
Qualifying revolving retail 77. 6 77. 8 - 84. 2 88. 1 87. 7 86. 3 80. 9
Other retail - 92. 4 90. 3 96. 8 98. 1 100. 5 98. 4 96. 6
Exposure - weighted average risk weight (%)
Residential mortgage 2. 1 8. 4 13. 5 23. 0 74. 1 95. 8 - 15. 5
Qualifying revolving retail 3. 0 11. 2 - 32. 9 108. 7 196. 3 - 31. 0
Other retail - 42. 3 59. 0 111. 2 144. 6 224. 2 0. 2 114. 6
31 December 2011
PD Grade
(1) This comparative period does not include Bankwest.
(2) The credit exposure value of undrawn commitments included in Total Credit Risk Exposures above.

Basel II Pillar 3 31
Analysis of Losses
The following tables provide a summary of financial losses by IRB portfolio (APS 330 Table 6e) and a comparison of losses against the
Group‟s regulatory EL estimates (APS 330 Table 6f(ii)).
APS 330 Table 6e – Analysis of losses by portfolio type
Gross write-offs Recoveries Actual losses
Portfolio Type $M $M $M
Corporate 111 (3) 108
SME Corporate 132 (2) 130
SME retail (including SME retail secured by residential mortgages) 23 (3) 20
Specialised lending 301 - 301
Total corporate including SME and specialised lending 567 (8) 559
Sovereign - - -
Bank 8 - 8
Residential mortgage (excluding SME retail secured by residential mortgages) 106 (2) 104
Qualifying revolving retail 160 (27) 133
Other retail 128 (26) 102
Total advanced IRB and specialised lending portfolios 969 (63) 906
31 December 2012
Half year losses in reporting period
Gross write-offs Recoveries Actual losses
Portfolio Type $M $M $M
Corporate 138 (20) 118
SME Corporate 158 (14) 144
SME retail (including SME retail secured by residential mortgages) 57 (16) 41
Specialised lending 262 (3) 259
Total corporate including SME and specialised lending 615 (53) 562
Sovereign - - -
Bank - - -
Residential mortgage (excluding SME retail secured by residential mortgages) 104 (5) 99
Qualifying revolving retail 322 (64) 258
Other retail 282 (54) 228
Total advanced IRB and specialised lending portfolios 1,323 (176) 1,147
30 June 2012
Full year losses in reporting period
Gross write-offs Recoveries Actual losses
Portfolio Type $M $M $M
Total corporate including SME and specialised lending 286 (22) 264
Sovereign - - -
Bank - - -
Residential mortgage (excluding SME retail secured by residential mortgages) 41 (4) 37
Qualifying revolving retail 161 (25) 136
Other retail 137 (19) 118
Total advanced IRB and specialised lending portfolios 625 (70) 555
31 December 2011
Half year losses in reporting period

32 Commonwealth Bank of Australia
APS 330 Table 6f (i)– Historical loss analysis by portfolio type
Regulatory
one year
Half year expected loss
actual loss estimate
$M $M
Corporate 108 900
SME corporate 130 788
SME retail (including SME retail secured by residential mortgages) 20 144
Specialised lending 301 1,420
Total corporate including SME and specialised lending 559 3,252
Sovereign - 4
Bank 8 175
Residential mortgage (excluding SME retail secured by residential mortgages) 104 1,331
Qualifying revolving retail 133 399
Other retail 102 336
Total advanced IRB and specialised lending portfolios 906 5,497
31 December 2012
Regulatory
one year
Full year expected loss
actual loss estimate
$M $M
Corporate 118 507
SME corporate 144 395
SME retail (including SME retail secured by residential mortgages) 41 137
Specialised lending 259 790
Total corporate including SME and specialised lending 562 1,829
Sovereign - 4
Bank - 52
Residential mortgage (excluding SME retail secured by residential mortgages) 99 1,303
Qualifying revolving retail 258 430
Other retail 228 343
Total advanced IRB and specialised lending portfolios 1,147 3,961
30 June 2012 (1)
(1) This comparative period does not include Bankwest.
Regulatory
one year
Half year expected loss
actual loss estimate
$M $M
Total corporate including SME and specialised lending 264 1,888
Sovereign - 3
Bank - 33
Residential mortgage 37 1,310
Qualifying revolving retail 136 425
Other retail 118 346
Total advanced IRB and specialised lending portfolios 555 4,005
31 December 2011 (1)
(1) This comparative period does not include Bankwest.
Actual outcomes may differ from modelled regulatory estimates
for a number of reasons.
Actual losses are historical and are based on the quality of the
assets in prior periods, write-offs (whether full or partial) and
recent economic conditions.
Regulatory EL for AIRB portfolios (calculated as the product of
PD, LGD and EAD) is based on the quality of exposures at a
point in time using long-run PDs and downturn LGDs as
required by APRA. Actual losses would be below the regulatory
EL estimate in most years.
Regulatory EL for AIRB portfolios is reported for both defaulted
and non-defaulted exposures. For non-defaulted exposures,
regulatory EL is a function of long-run PD and downturn LGD.
For defaulted exposures, Regulatory EL is based on the best
estimate of loss which, for the non-retail portfolios, is the
individually assessed provision.
Regulatory EL measures economic loss and includes costs
(e.g. internal workout costs) not included in actual losses.
There was no significant change in Regulatory EL during the
half year.

Basel II Pillar 3 33
Accuracy of Risk Estimates
Probability of Default
APS 330 Table 6f (ii) compares estimates of long-run PD to actual default rates averaged over 4.5 financial years to 31 December
2012, where results for the half year to December 2012 have been annualised without adjustment for seasonality.
APS 330 Table 6f (ii) – Accuracy of risk estimates – PD
Average Average
estimated PD actual PD
Portfolio Type % %
Corporate 1. 35 0. 90
SME corporate 2. 27 1. 83
SME retail (including SME retail secured by residential mortgages) 1. 84 0. 92
Specialised lending (1) n/a 1. 51
Sovereign 0. 54 -
Bank (2) 0. 23 0. 34
Residential mortgage (excluding SME retail secured by residential mortgages) 0. 94 0. 85
Qualifying revolving retail 2. 08 2. 26
Other retail 4. 65 4. 41
As at 31 December 2012
(1) Average estimated PD not relevant for specialised lending under the Supervisory Slotting approach.
(2) Realised PDs for Banks based on a low volume of defaults observed.
Loss Given Default and Exposure at Default
LGDs for non-retail portfolios are based on accounts that defaulted in 2009 and 2010 financial years and LGDs for retail portfolios are
based on accounts that defaulted in 2009 to 2011 financial years. Defaults occurring in the most recent year(s) have been excluded
from the analysis, to allow sufficient time for workout of impaired assets, booking of losses and more meaningful disclosures.
APS 330 Table 6f(iii) shows the EAD ratio which compares estimates of EAD prior to default to realised EAD for obligors that defaulted.
APS 330 Table 6f (iii) – Accuracy of risk estimates – LGD and EAD
Average estimated Average Ratio of estimated
downturn LGD (3)
actual LGD (3)
to actual EAD (3)
Portfolio Type % %
Corporate 61.3 45.2 1.1
SME corporate 36.6 23.0 1.1
SME retail (including SME retail secured by residential mortgages) 41.9 26.8 1.3
Specialised lending n/a 36.1 1.2
Sovereign n/a n/a n/a
Bank (1) 65.0 102.0 1.8
Residential mortgage (excluding SME retail secured by residential
mortgages) (2) 20.9 6.5 1.0
Qualifying revolving retail 85.9 64.5 1.1
Other retail 94.4 77.4 1.0
As at 31 December 2012
(1) Realised LGDs for Banks based on a low volume of defaults observed.
(2) Estimated downturn LGD based on minimum regulatory floor requirements imposed by APRA and RBNZ.
(3) LGD and EAD estimates and actuals have not changed from those reported at 30 June 2012. Refer to Group Pillar 3 report for 30 June 2012 for more information on
methodology of coverage.

34 Commonwealth Bank of Australia
4.5 Credit Risk Mitigation
APS 330 Table 7b and 7c – Credit risk mitigation
Exposures
Eligible Exposures covered by
Total financial covered by credit
exposure (1)
collateral guarantees derivatives Coverage
$M $M $M $M %
Advanced approach
Corporate 85,608 - 903 - 1. 1
SME corporate 46,463 - - 5 -
SME retail 8,518 - - - -
Sovereign 49,412 - - - -
Bank 39,680 - 455 263 1. 8
Residential mortgage 418,544 - - - -
Qualifying revolving retail 22,068 - - - -
Other retail 8,175 - - - -
Total advanced approach 678,468 - 1,358 268 0. 2
Specialised lending 54,667 - - - -
Standardised approach
Corporate 3,945 2 - - -
SME corporate 335 1 - - 0. 2
SME retail 4,877 11 - - 0. 2
Sovereign 839 - - - -
Bank 350 - - - -
Residential mortgage 4,863 2 - - -
Other retail 2,255 - - - -
Other assets 10,768 - - - -
Total standardised approach 28,232 16 - - 0. 1
Total exposures 761,367 16 1,358 268 0. 2
31 December 2012
(1) Credit derivatives that are treated as part of synthetic securitisation structures are excluded from credit risk mitigation disclosures and included within those relating to
securitisation.

Basel II Pillar 3 35
APS 330 Table 7b and 7c – Credit risk mitigation (continued)
Exposures
Eligible Exposures covered by
Total financial covered by credit
exposure (1)
collateral guarantees derivatives Coverage
$M $M $M $M %
Advanced approach
Corporate 82,665 - 601 - 0. 7
SME corporate 37,236 - - 7 -
SME retail 8,382 - - - -
Sovereign 46,609 - - - -
Bank 35,326 - 264 430 2. 0
Residential mortgage 353,610 - - - -
Qualifying revolving retail 21,555 - - - -
Other retail 7,597 - - - -
Total advanced approach 592,980 - 865 437 0. 2
Specialised lending 41,578 - - - -
Standardised approach
Corporate 10,359 61 - - 0. 6
SME corporate 6,441 46 - - 0. 7
SME retail 5,135 16 - - 0. 3
Sovereign 2,392 3 - - 0. 1
Bank 6,481 - - - -
Residential mortgage 57,630 56 - - 0. 1
Other retail 2,594 1 - - -
Other assets 9,597 - - - -
Total standardised approach 100,629 183 - - 0. 2
Total exposures 735,187 183 865 437 0. 2
30 June 2012
(1) Credit derivatives that are treated as part of synthetic securitisation structures are excluded from credit risk mitigation disclosures and included within those relating to
securitisation.
Exposures
Eligible Exposures covered by
Total financial covered by credit
exposure (1)
collateral guarantees derivatives Coverage
$M $M $M $M %
Advanced approach
Corporate 76,780 - 619 - 0. 8
SME corporate 36,708 - - - -
SME retail 9,503 - - - -
Sovereign 41,354 - - - -
Bank 39,018 - 332 442 2. 0
Residential mortgage 348,098 - - - -
Qualifying revolving retail 20,948 - - - -
Other retail 7,084 - - - -
Total advanced approach 579,493 - 951 442 0. 2
Specialised lending 42,501 - - - -
Standardised approach
Corporate 9,952 106 - - 1. 1
SME corporate 6,924 44 - - 0. 6
SME retail 5,310 16 - - 0. 3
Sovereign 2,754 3 - - 0. 1
Bank 6,528 - 37 - 0. 6
Residential mortgage 55,108 63 - - 0. 1
Other retail 2,633 2 - - 0. 1
Other assets 12,407 - - - -
Total standardised approach 101,616 234 37 - 0. 3
Total exposures 723,610 234 988 442 0. 2
31 December 2011
(1) Credit derivatives that are treated as part of synthetic securitisation structures are excluded from credit risk mitigation disclosures and included within those relating to
securitisation.

36 Commonwealth Bank of Australia
4.6 Securitisation
APS 330 Table 9g (i) – Banking book exposures securitised - traditional securitisation
Bank Third party Other
originated originated Facilities (Manager
assets (1)
assets (2)
provided (3)
Services)
Underlying Asset $M $M $M $M
Residential mortgage 4,935 - 269 -
Credit cards and other personal loans - - - -
Auto and equipment finance - 77 79 -
Commercial loans - - - -
Other - - - -
Total 4,935 77 348 -
31 December 2012
Bank Third party Other
originated originated Facilities (Manager
assets (1)
assets (2)
provided (3)
Services)
Underlying Asset $M $M $M $M
Residential mortgage 5,932 588 469 -
Credit cards and other personal loans - - - -
Auto and equipment finance - 79 78 -
Commercial loans - - - -
Other - - - -
Total 5,932 667 547 -
30 June 2012
Bank Third party Other
originated originated Facilities (Manager
assets (1)
assets (2)
provided (3)
Services)
Underlying Asset $M $M $M $M
Residential mortgage 6,681 448 463 -
Credit cards and other personal loans - - - -
Auto and equipment finance - 81 76 -
Commercial loans - - - -
Other - - - -
Total 6,681 529 539 -
31 December 2011
(1) Bank originated assets comprise Medallion and Swan Trusts but exclude those assets held for contingent liquidity purposes.
(2) Third party originated assets comprise assets managed and sponsored by the Bank through Asset Backed Commercial Paper Program.
(3) Facilities provided include liquidity facilities and derivatives provided to Medallion Trusts and facilities related to third party originated assets.
APS 330 Table 9g (ii) – Banking book exposures securitised – synthetic securitisation
APS 120 provides specific regulatory treatment for synthetic securitisations where credit risk is transferred to a third party, however,
legal ownership of the underlying assets remains with the originator.
The Group has not undertaken any synthetic securitisation in the banking book.
APS 330 Table 9g (iii) – Total banking book exposures securitised
APS 330 Table 9g (i) discloses the total banking book exposures securitised by the Group.

Basel II Pillar 3 37
APS 330 Table 9h - Past due and impaired banking book exposures by asset type
Outstanding Losses
exposure Impaired Past due recognised
Underlying Asset $M $M $M $M
Residential mortgage 4,935 10 29 -
Credit cards and other personal loans - - - -
Auto and equipment finance 77 1 1 -
Commercial loans - - - -
Other - - - -
Total 5,012 11 30 -
31 December 2012
Group originated assets securitised
Outstanding Losses
exposure Impaired Past due recognised
Underlying Asset $M $M $M $M
Residential mortgage 6,520 9 39 -
Credit cards and other personal loans - - - -
Auto and equipment finance 79 - - -
Commercial loans - - - -
Other - - - -
Total 6,599 9 39 -
30 June 2012
Group originated assets securitised
Outstanding Losses
exposure Impaired Past due recognised
Underlying Asset $M $M $M $M
Residential mortgage 7,129 15 47 -
Credit cards and other personal loans - - - -
Auto and equipment finance 81 - - -
Commercial loans - - - -
Other - - - -
Total 7,210 15 47 -
31 December 2011
Group originated assets securitised
APS 330 Table 9i – Banking book exposures intended to be securitised
The Group does not have any outstanding banking book exposures that are intended to be securitised at 31 December 2012.

38 Commonwealth Bank of Australia
APS 330 Table 9j (i) - Banking book activity for the reporting period
The Group securitised $1,025 million of new exposures in the banking book during the half year ended 31 December 2012.
Total Recognised
exposures gain or loss
securitised on sale
Underlying Asset Type $M $M
Residential mortgage 1,025 -
Credit cards and other personal loans - -
Auto and equipment finance - -
Commercial loans - -
Other - -
Total 1,025 -
Half year ended 31 December 2012
Total Recognised
exposures gain or loss
securitised on sale
Underlying Asset Type $M $M
Residential mortgage (1) 34,299 -
Credit cards and other personal loans - -
Auto and equipment finance - -
Commercial loans - -
Other - -
Total 34,299 -
Full year ended 30 June 2012
Total Recognised
exposures gain or loss
securitised on sale
Underlying Asset Type $M $M
Residential mortgage 3,159 -
Credit cards and other personal loans - -
Auto and equipment finance - -
Commercial loans - -
Other - -
Total 3,159 -
Half year ended 31 December 2011
(1) New banking book activity during the year to 30 June 2012 includes $31 billion of residential mortgages to upsize securities held for contingent liquidity purposes.

Basel II Pillar 3 39
APS330 Table 9k - Banking Book securitisation exposures retained or purchased
Total
On balance sheet Off balance sheet exposures
Securitisation facility type $M $M $M
Liquidity support facilities - 108 108
Warehouse facilities 2,621 1,307 3,928
Derivative facilities 174 - 174
Holdings of securities 4,490 - 4,490
Other - - -
Total securitisation exposures in the banking book 7,285 1,415 8,700
31 December 2012
Total
On balance sheet Off balance sheet exposures
Securitisation facility type $M $M $M
Liquidity support facilities 20 321 341
Warehouse facilities 3,202 1,494 4,696
Derivative facilities 151 6 157
Holdings of securities 4,558 - 4,558
Other - 16 16
Total securitisation exposures in the banking book 7,931 1,837 9,768
30 June 2012
Total
On balance sheet Off balance sheet exposures
Securitisation facility type $M $M $M
Liquidity support facilities 24 325 349
Warehouse facilities 3,824 1,195 5,019
Derivative facilities 157 14 171
Holdings of securities 4,081 - 4,081
Other - 4 4
Total securitisation exposures in the banking book 8,086 1,538 9,624
31 December 2011

40 Commonwealth Bank of Australia
APS 330 Table 9l (i) - Banking book exposures by risk weighting
Total securitisation exposures in the banking book decreased by $1,336 million or 13.8% during the half year ended 31 December 2012.
The corresponding RWA decreased by $1,697 million or 61.5%. This was mainly due to warehouse exposure runoff and changes in risk
profile for securitisation exposures.
Total Total
Securitisation Resecuritisation Securitisation Resecuritisation exposures RWA
Risk Weight Band (1)
$M $M $M $M $M $M
≤ 25% 8,059 5 824 1 8,064 825
> 25% ≤ 35% 33 - 11 - 33 11
> 35% ≤ 50% - - - - - -
> 50% ≤ 75% 250 - 138 - 250 138
> 75% ≤ 100% - - - - - -
> 100% ≤ 650% 21 - 90 - 21 90
> 650% < 1250% - - - - - -
Total 8,363 5 1,063 1 8,368 1,064
31 December 2012
Exposures Risk Weighted Assets
Total Total
Securitisation Resecuritisation Securitisation Resecuritisation exposures RWA
Risk Weight Band (1)
$M $M $M $M $M $M
≤ 25% 8,753 207 790 41 8,960 831
> 25% ≤ 35% 63 - 22 - 63 22
> 35% ≤ 50% - - - - - -
> 50% ≤ 75% 250 - 138 - 250 138
> 75% ≤ 100% 31 - 31 - 31 31
> 100% ≤ 650% 400 - 1,739 - 400 1,739
> 650% < 1250% - - - - - -
Total 9,497 207 2,720 41 9,704 2,761
30 June 2012
Exposures Risk Weighted Assets
Total Total
Securitisation Resecuritisation Securitisation Resecuritisation exposures RWA
Risk Weight Band (2)
$M $M $M $M $M $M
≤ 25% 8,285 242 779 45 8,527 824
> 25% ≤ 35% 366 - 128 - 366 128
> 35% ≤ 50% - - - - - -
> 50% ≤ 75% 51 15 39 11 66 50
> 75% ≤ 100% 34 - 33 - 34 33
> 100% ≤ 650% 586 - 1,535 - 586 1,535
> 650% < 1250% - - - - - -
Total 9,322 257 2,514 56 9,579 2,570
31 December 2011
Exposures Risk Weighted Assets
(1) EAD and RWA have been calculated according to the revised APS 120 Standard effective 1 January 2012.
(2) EAD and RWA have been calculated according to the old APS 120 Standard as at 31 December 2011. Both EAD and RWA have been separately disclosed between
Securitisation and Resecuritisation for comparative purposes only.

Basel II Pillar 3 41
APS 330 Table 9l (ii) - Banking book exposures deducted entirely from capital
Total securitisation exposures deducted from Tier 1 and Tier 2 Capital increased $268 million during the half year ended 31 December
2012 due to changes in risk profile for securitisation exposures.
Deductions Deductions
from Tier One from Tier Two
Capital Capital Total
Underlying Asset Type $M $M $M
Residential mortgage 156 156 312
Credit cards and other personal loans - - -
Auto and equipment finance 8 8 16
Commercial loans 2 2 4
Other - - -
Total 166 166 332
31 December 2012
Deductions Deductions
from Tier One from Tier Two
Capital Capital Total
Underlying Asset Type $M $M $M
Residential mortgage 26 26 52
Credit cards and other personal loans - - -
Auto and equipment finance - - -
Commercial loans 6 6 12
Other - - -
Total 32 32 64
30 June 2012
Deductions Deductions
from Tier One from Tier Two
Capital Capital Total
Underlying Asset Type $M $M $M
Residential mortgage 7 7 14
Credit cards and other personal loans - - -
Auto and equipment finance - - -
Commercial loans 16 16 32
Other - - -
Total 23 23 46
31 December 2011

42 Commonwealth Bank of Australia
APS 330 Table 9m – Banking book exposures subject to early amortisation
The Group has not undertaken any securitisation subject to early amortisation treatment.
APS 330 Table 9n – Banking book resecuritisation exposures
As at 31 December 2012, banking book resecuritisation exposures without credit risk mitigation total $31 million (30 June 2012: $249
million; 31 December 2011: $257 million).
The Group has not undertaken any resecuritisation exposures subject to credit risk mitigation.
The Group has not undertaken any third party guarantors providing guarantees for securitised assets.
APS 330 Table 9o (i) - Trading book exposures securitised - traditional securitisations
Bank Third party Other
originated originated Facilities (Manager
assets (1)
assets (2)
provided (3)
Services)
Underlying Asset $M $M $M $M
Residential mortgage - - 578 -
Credit cards and other personal loans - - - -
Auto and equipment finance - - - -
Commercial loans - - - -
Other - - - -
Total - - 578 -
31 December 2012
Bank Third party Other
originated originated Facilities (Manager
assets (1)
assets (2)
provided (3)
Services)
Underlying Asset $M $M $M $M
Residential mortgage - - 668 -
Credit cards and other personal loans - - - -
Auto and equipment finance - - - -
Commercial loans - - - -
Other - - - -
Total - - 668 -
30 June 2012
Bank Third party Other
originated originated Facilities (Manager
assets (1)
assets (2)
provided (3)
Services)
Underlying Asset $M $M $M $M
Residential mortgage - - 757 -
Credit cards and other personal loans - - - -
Auto and equipment finance - - - -
Commercial loans - - - -
Other - - - -
Total - - 757 -
31 December 2011
(1) Bank originated assets comprise Medallion and Swan Trusts but exclude those assets held for contingent liquidity purposes.
(2) Third party originated assets comprise assets managed and sponsored by the Bank through Assets Backed Commercial Paper Program.
(3) Facilities provided include liquidity facilities and derivatives provided to Medallion Trusts and facilities related to third party originated assets.
APS 330 Table 9o (ii) – Trading book exposures securitised – synthetic securitisation
The Group has not undertaken any synthetic securitisation in the trading book.
APS 330 Table 9o (iii) – Total trading book exposures securitised
APS 330 Table 9o (i) discloses the total trading book exposures securitised by the Group.
APS 330 Table 9p – Trading book exposures intended to be securitised
The Group does not have any outstanding trading book exposures that are intended to be securitised at 31 December 2012.
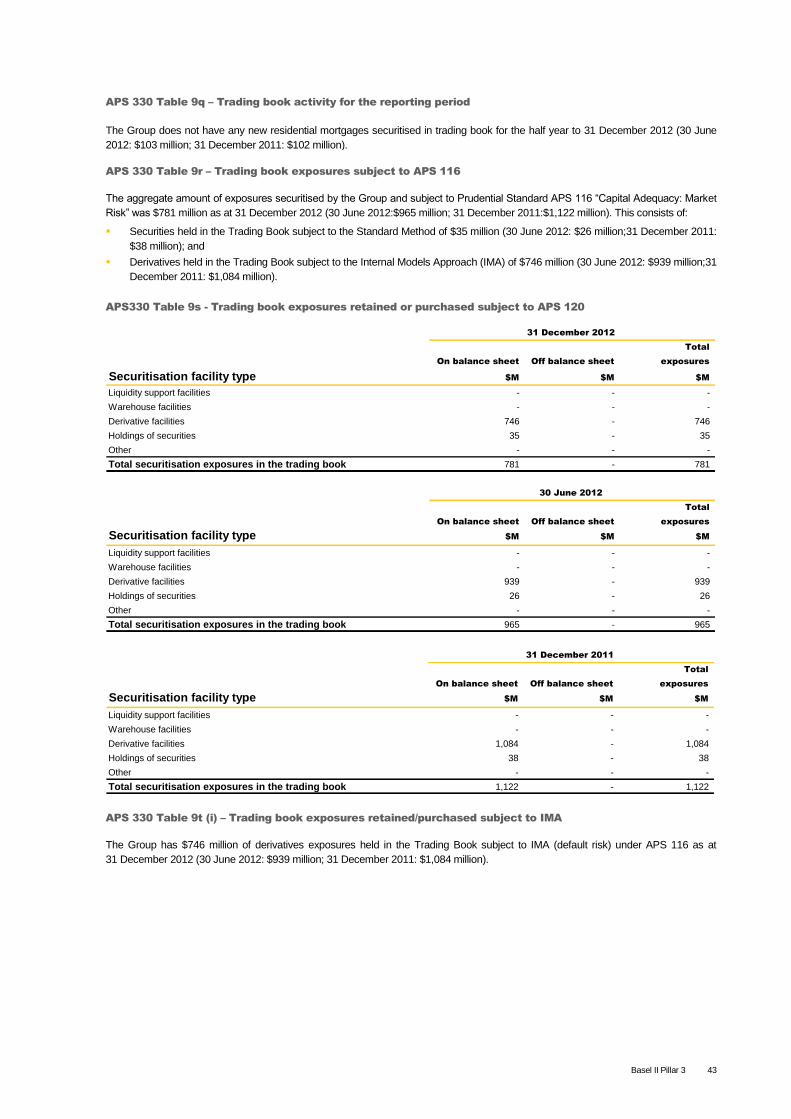
Basel II Pillar 3 43
APS 330 Table 9q – Trading book activity for the reporting period
The Group does not have any new residential mortgages securitised in trading book for the half year to 31 December 2012 (30 June
2012: $103 million; 31 December 2011: $102 million).
APS 330 Table 9r – Trading book exposures subject to APS 116
The aggregate amount of exposures securitised by the Group and subject to Prudential Standard APS 116 “Capital Adequacy: Market
Risk” was $781 million as at 31 December 2012 (30 June 2012:$965 million; 31 December 2011:$1,122 million). This consists of:
Securities held in the Trading Book subject to the Standard Method of $35 million (30 June 2012: $26 million;31 December 2011:
$38 million); and
Derivatives held in the Trading Book subject to the Internal Models Approach (IMA) of $746 million (30 June 2012: $939 million;31
December 2011: $1,084 million).
APS330 Table 9s - Trading book exposures retained or purchased subject to APS 120
Total
On balance sheet Off balance sheet exposures
Securitisation facility type $M $M $M
Liquidity support facilities - - -
Warehouse facilities - - -
Derivative facilities 746 - 746
Holdings of securities 35 - 35
Other - - -
Total securitisation exposures in the trading book 781 - 781
31 December 2012
Total
On balance sheet Off balance sheet exposures
Securitisation facility type $M $M $M
Liquidity support facilities - - -
Warehouse facilities - - -
Derivative facilities 939 - 939
Holdings of securities 26 - 26
Other - - -
Total securitisation exposures in the trading book 965 - 965
30 June 2012
Total
On balance sheet Off balance sheet exposures
Securitisation facility type $M $M $M
Liquidity support facilities - - -
Warehouse facilities - - -
Derivative facilities 1,084 - 1,084
Holdings of securities 38 - 38
Other - - -
Total securitisation exposures in the trading book 1,122 - 1,122
31 December 2011
APS 330 Table 9t (i) – Trading book exposures retained/purchased subject to IMA
The Group has $746 million of derivatives exposures held in the Trading Book subject to IMA (default risk) under APS 116 as at
31 December 2012 (30 June 2012: $939 million; 31 December 2011: $1,084 million).

44 Commonwealth Bank of Australia
APS330 Table 9t (ii) - Trading Book exposures subject to APS 120 by risk weighting
Total securitisation exposures in the trading book decreased by $173 million during the half year ended 31 December 2012 reflecting
runoff of derivatives exposures.
Total
IAA Approach RBA Approach SFA Approach exposures
Risk Weight Band $M $M $M $M
≤ 25% 4 31 746 781
> 25% ≤ 35% - - - -
> 35% ≤ 50% - - - -
> 50% ≤ 75% - - - -
> 75% ≤ 100% - - - -
> 100% ≤ 650% - - - -
> 650% < 1250% - - - -
Total 4 31 746 781
31 December 2012
Total
IAA Approach RBA Approach SFA Approach exposures
Risk Weight Band $M $M $M $M
≤ 25% 5 14 933 952
> 25% ≤ 35% - - - -
> 35% ≤ 50% - - - -
> 50% ≤ 75% - - - -
> 75% ≤ 100% - - - -
> 100% ≤ 650% 1 - - 1
> 650% < 1250% - - - -
Total 6 14 933 953
30 June 2012
Total
IAA Approach RBA Approach SFA Approach exposures
Risk Weight Band $M $M $M $M
≤ 25% 7 1,106 3 1,116
> 25% ≤ 35% - - - -
> 35% ≤ 50% - - - -
> 50% ≤ 75% - - 1 1
> 75% ≤ 100% - - - -
> 100% ≤ 650% - - 5 5
> 650% < 1250% - - - -
Total 7 1,106 9 1,122
31 December 2011
APS 330 Table 9u (i) – Capital requirements (RWA) of securitisation exposures retained/purchased subject to
IMA
The Group has $237 million of derivatives exposures held in the Trading Book subject to IMA (default risk) under APS 116 as at 31
December 2012 (30 June 2012: $261 million;31 December 2011: $398 million).
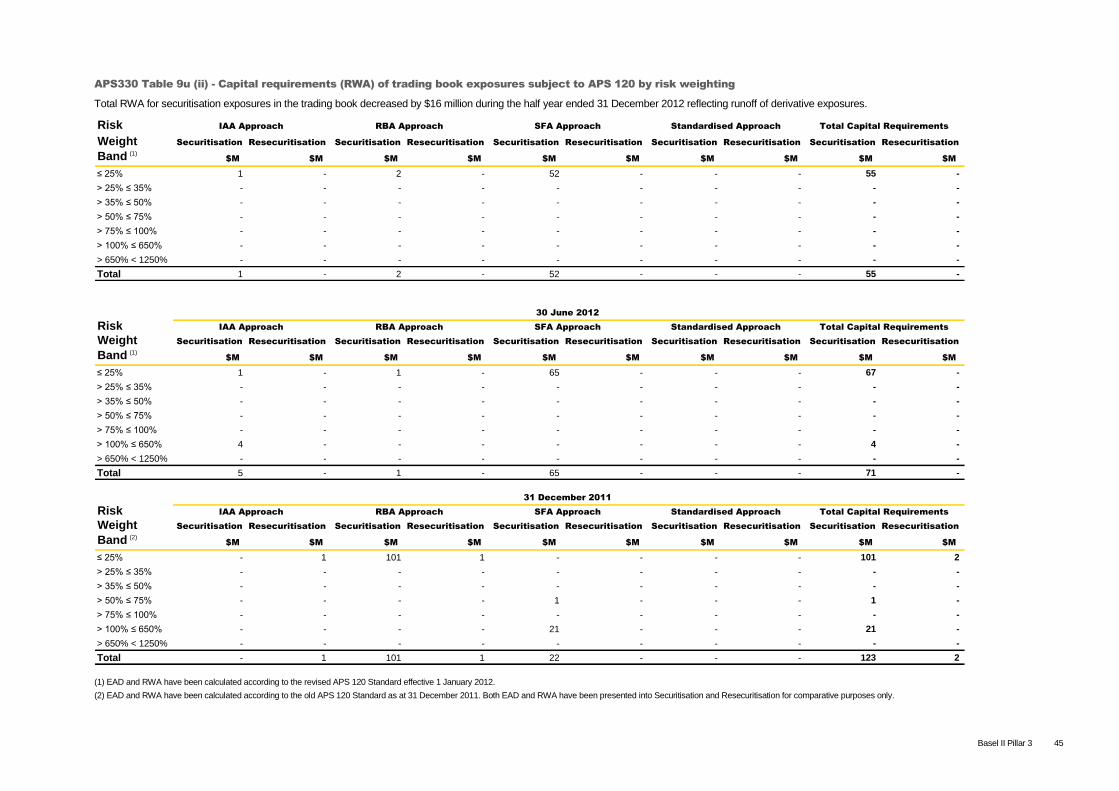
Basel II Pillar 3 45
APS330 Table 9u (ii) - Capital requirements (RWA) of trading book exposures subject to APS 120 by risk weighting
Total RWA for securitisation exposures in the trading book decreased by $16 million during the half year ended 31 December 2012 reflecting runoff of derivative exposures.
Risk
Weight Securitisation Resecuritisation Securitisation Resecuritisation Securitisation Resecuritisation Securitisation Resecuritisation Securitisation Resecuritisation
Band (1)
$M $M $M $M $M $M $M $M $M $M
≤ 25% 1 - 2 - 52 - - - 55 -
> 25% ≤ 35% - - - - - - - - - -
> 35% ≤ 50% - - - - - - - - - -
> 50% ≤ 75% - - - - - - - - - -
> 75% ≤ 100% - - - - - - - - - -
> 100% ≤ 650% - - - - - - - - - -
> 650% < 1250% - - - - - - - - - -
Total 1 - 2 - 52 - - - 55 -
IAA Approach RBA Approach SFA Approach Standardised Approach Total Capital Requirements
Risk
Weight Securitisation Resecuritisation Securitisation Resecuritisation Securitisation Resecuritisation Securitisation Resecuritisation Securitisation Resecuritisation
Band (1)
$M $M $M $M $M $M $M $M $M $M
≤ 25% 1 - 1 - 65 - - - 67 -
> 25% ≤ 35% - - - - - - - - - -
> 35% ≤ 50% - - - - - - - - - -
> 50% ≤ 75% - - - - - - - - - -
> 75% ≤ 100% - - - - - - - - - -
> 100% ≤ 650% 4 - - - - - - - 4 -
> 650% < 1250% - - - - - - - - - -
Total 5 - 1 - 65 - - - 71 -
30 June 2012
IAA Approach RBA Approach SFA Approach Standardised Approach Total Capital Requirements
Risk
Weight Securitisation Resecuritisation Securitisation Resecuritisation Securitisation Resecuritisation Securitisation Resecuritisation Securitisation Resecuritisation
Band (2)
$M $M $M $M $M $M $M $M $M $M
≤ 25% - 1 101 1 - - - - 101 2
> 25% ≤ 35% - - - - - - - - - -
> 35% ≤ 50% - - - - - - - - - -
> 50% ≤ 75% - - - - 1 - - - 1 -
> 75% ≤ 100% - - - - - - - - - -
> 100% ≤ 650% - - - - 21 - - - 21 -
> 650% < 1250% - - - - - - - - - -
Total - 1 101 1 22 - - - 123 2
31 December 2011
IAA Approach RBA Approach SFA Approach Standardised Approach Total Capital Requirements
(1) EAD and RWA have been calculated according to the revised APS 120 Standard effective 1 January 2012.
(2) EAD and RWA have been calculated according to the old APS 120 Standard as at 31 December 2011. Both EAD and RWA have been presented into Securitisation and Resecuritisation for comparative purposes only.

46 Commonwealth Bank of Australia
APS 330 Table 9u (iii) – Trading book exposures entirely deducted from capital
The Group has $0.2 million of trading book exposures that are deducted entirely from Tier 1 capital as at 31 December 2012 (30 June
2012: $6 million; 31 December 2011: $0.2 million).
The Group does not have any trading book exposures that are credit enhancements deducted from total capital or any other exposures
deducted from total capital.
APS 330 Table 9v – Trading book exposures subject to early amortisation
The Group has not undertaken any securitisation subject to early amortisation treatment.
APS 330 Table 9w – Trading book resecuritisation exposures
The Group does not have any trading book resecuritisation exposures without credit risk mitigation as at 31 December 2012 (30 June
2012: $11 million; 31 December 2011: $13 million).
The Group does not have any resecuritisation exposures subject to credit risk mitigation.
The Group does not have any third party guarantors providing guarantees for securitised assets.
APS 330 Table 18a – Total securitisation activity for the reporting period
The Group disclosed the summary of the current period‟s securitisation activity including the total amount of exposures securitised and
recognised gain or loss on sale by exposure type in APS 330 Table 9j (banking book) and APS 330 Table 9q (trading book).
The total exposures (residential mortgages and other) securitised in the half year to 31 December 2012 was $1,025 million
(31 December 2011: $3,262 million). Total exposures (residential mortgages and other) securitised in the full year to 30 June 2012 was
$34,402 million.
APS330 Table 18b - Summary of total securitisation exposures retained or purchased
Total
On balance sheet Off balance sheet exposures
Securitisation facility type $M $M $M
Liquidity support facilities - 108 108
Warehouse facilities 2,621 1,307 3,928
Derivative facilities 920 - 920
Holdings of securities 4,525 - 4,525
Other - - -
Total securitisation exposures 8,066 1,415 9,481
As at 31 December 2012
Total
On balance sheet Off balance sheet exposures
Securitisation facility type $M $M $M
Liquidity support facilities 20 321 341
Warehouse facilities 3,202 1,494 4,696
Derivative facilities 1,090 6 1,096
Holdings of securities 4,584 - 4,584
Other - 16 16
Total securitisation exposures 8,896 1,837 10,733
As at 30 June 2012
Total
On balance sheet Off balance sheet exposures
Securitisation facility type $M $M $M
Liquidity support facilities 24 325 349
Warehouse facilities 3,824 1,195 5,019
Derivative facilities 1,242 14 1,256
Holdings of securities 4,118 - 4,118
Other - 4 4
Total securitisation exposures 9,208 1,538 10,746
As at 31 December 2011

Basel II Pillar 3 47
5. Equity Risk
APS 330 Table 13b to 13f – Equity investment exposures
Balance Fair
sheet value value (2)
Equity Investments $M $M
Value of listed (publicly traded) equities 905 901
Value of unlisted (privately held) equities 1,396 1,396
Total (1) 2,301 2,297
31 December 2012
(1) Equity holdings comprise $1,834 million Investments in Associates, $12 million Assets Held for Sale and $455 million Available for Sale Securities.
(2) Fair value represents the quoted price of listed securities. The difference between balance sheet value and fair value is due to the Group‟s listed securities being
equity accounted as required under the accounting standards.
Balance Fair
sheet value value (2)
Equity Investments $M $M
Value of listed (publicly traded) equities 889 890
Value of unlisted (privately held) equities 1,319 1,319
Total (1) 2,208 2,209
30 June 2012
(1) Equity holdings comprise $1,761 million Investments in Associates, $12 million Assets Held for Sale and $435 million Available for Sale Securities.
(2) Fair value represents the quoted price of listed securities. The difference between balance sheet value and fair value is due to the Group‟s listed securities being
equity accounted as required under the accounting standards.
Balance Fair
sheet value value (2)
Equity Investments $M $M
Value of listed (publicly traded) equities 927 865
Value of unlisted (privately held) equities 1,283 1,283
Total (1) 2,210 2,148
31 December 2011
(1) Equity holdings comprise $1,720 million Investments in Associates, $29 million Assets Held for Sale and $461 million Available for Sale Securities.
(2) Fair value represents the quoted price of listed securities. The difference between balance sheet value and fair value is due to the Group‟s listed securities being
equity accounted as required under the accounting standards.
31 Dec 12 30 Jun 12 31 Dec 11
Gain/Losses on Equity Investments $M $M $M
Cumulative realised gains in reporting period 23 49 40
Total unrealised (gains) losses 116 29 2
Total unrealised gains included in Tier One/Tier Two Capital 27 9 12
Half year ended
31 Dec 12 30 Jun 12 31 Dec 11
Risk Weighted Assets $M $M $M
Equity investments subject to a 300% risk weight 1,373 1,335 1,263
Equity investments subject to a 400% risk weight 1,024 1,004 1,144
Total RWA 2,397 2,339 2,407
31 Dec 12 30 Jun 12 31 Dec 11
Equity Credit Exposure $M $M $M
Equity investments subject to a 300% risk weight 458 445 421
Equity investments subject to a 400% risk weight 256 251 286
Total equity credit exposure 714 696 707
The Group has no equity investments that are subject to any supervisory transition or grandfathering provisions regarding capital
requirements.

48 Commonwealth Bank of Australia
6 Market Risk
6.1 Traded Market Risk
The breakdown of Traded Market Risk RWA by modelling method is summarised below:
31 Dec 12 30 Jun 12 31 Dec 11
Traded Market Risk RWA by Modelling Approach $M $M $M
Internal Model Approach 2,431 2,565 1,068
Standard Method 2,086 2,277 2,037
Total Traded Market Risk RWA 4,517 4,842 3,105
APS 330 Table 10b – Traded Market Risk under the Standard Method
31 Dec 12 30 Jun 12 31 Dec 11
Exposure Type $M $M $M
Interest rate risk 133.2 160. 9 156. 1
Equity risk 24.4 14. 0 2. 7
Foreign exchange risk 8.9 2. 7 3. 0
Commodity risk 0.4 4. 6 1. 2
Total 166.9 182. 2 163. 0
Risk Weighted Asset equivalent (1) 2,086 2,277 2,037
(1) Risk Weighted Asset equivalent is the capital requirements multiplied by 12.5 in accordance with APRA Prudential Standard APS 110.
APS 330 Table 11d – Value at Risk for trading portfolios under the internal model approach
As at
Mean Maximum Minimum balance
value value value date
Average VaR (1)
$M $M $M $M
Over the 6 months to 31 December 2012 25 35 20 28
Over the 6 months to 30 June 2012 31 37 26 28
Over the 6 months to 31 December 2011 30 50 23 25
Aggregate VaR at Risk Over the Reporting Period
Summary Table of the Number of Back-Testing Outliers
(2)
Over the 6 months to 31 December 2012 1
Over the 6 months to 30 June 2012 -
Over the 6 months to 31 December 2011 -
(1) 10 day, 99% confidence interval over the reporting period.
(2) 1 day, 99% confidence interval over the reporting period.
Internal Model Approach – VaR Outliers
There was one VaR outlier during the 6 months to 31 December 2012 due to volatile interest rates.
Hypothetical VaR
loss 99%
Date $M $M
24 October 2012 (7) (6)
Over the Reporting Period 1 July 2012 to 31 December 2012
Hypothetical VaR
loss 99%
Date $M $M
- - -
Over the Reporting Period 1 January 2012 to 30 June 2012
Hypothetical VaR
loss 99%
Date $M $M
- - -
Over the Reporting Period 1 July 2011 to 31 December 2011

Basel II Pillar 3 49
6.2 Non-Traded Market Risk
APS 330 Table 14b – Interest Rate Risk in the Banking Book
31 Dec 12 30 Jun 12 31 Dec 11
Stress Testing: Interest Rate Shock Applied $M $M $M
AUD
200 basis point parallel increase (720) (506) (358)
200 basis point parallel decrease 799 566 428
NZD
200 basis point parallel increase (147) (118) (117)
200 basis point parallel decrease 158 127 126
Other
200 basis point parallel increase (14) (14) (11)
200 basis point parallel decrease 14 14 11
Change in Economic Value
31 Dec 12 30 Jun 12 31 Dec 11
Regulatory RWA $M $M $M
Interest rate risk in the banking book (1) 10,996 9,765 11,525
(1) Risk weighted asset equivalent is the capital requirements multiplied by 12.5 in accordance with APRA Prudential Standard APS 110.
7 Operational Risk
APS 330 Table 3e – Capital requirements for operational risk (risk weighted assets)
31 Dec 12 30 Jun 12 31 Dec 11
$M $M $M
Advanced Measurement Approach 27,513 22,506 20,471
Standardised Approach 118 4,245 4,158
Total operational risk RWA (1) 27,631 26,751 24,629
(1) Refer to page 8 for commentary.
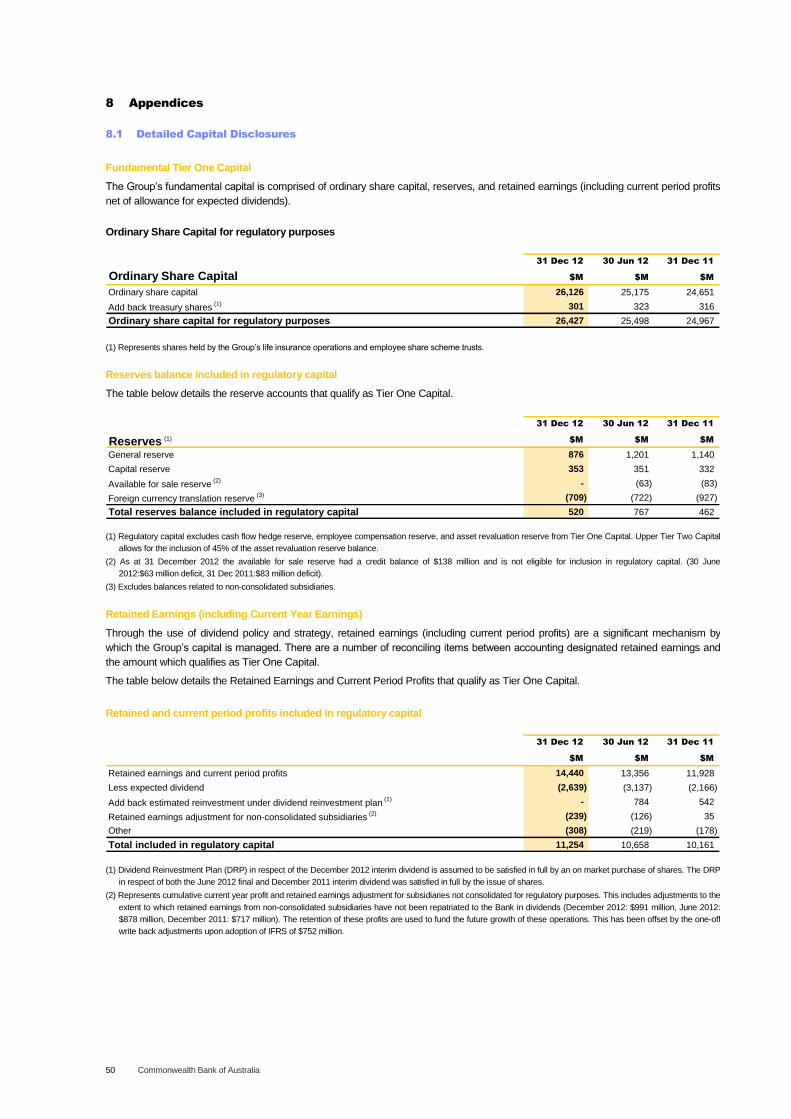
50 Commonwealth Bank of Australia
8 Appendices
8.1 Detailed Capital Disclosures
Fundamental Tier One Capital
The Group‟s fundamental capital is comprised of ordinary share capital, reserves, and retained earnings (including current period profits
net of allowance for expected dividends).
Ordinary Share Capital for regulatory purposes
31 Dec 12 30 Jun 12 31 Dec 11
Ordinary Share Capital $M $M $M
Ordinary share capital 26,126 25,175 24,651
Add back treasury shares (1) 301 323 316
Ordinary share capital for regulatory purposes 26,427 25,498 24,967
(1) Represents shares held by the Group‟s life insurance operations and employee share scheme trusts.
Reserves balance included in regulatory capital
The table below details the reserve accounts that qualify as Tier One Capital.
31 Dec 12 30 Jun 12 31 Dec 11
Reserves (1) $M $M $M
General reserve 876 1,201 1,140
Capital reserve 353 351 332
Available for sale reserve (2) - (63) (83)
Foreign currency translation reserve (3) (709) (722) (927)
Total reserves balance included in regulatory capital 520 767 462
(1) Regulatory capital excludes cash flow hedge reserve, employee compensation reserve, and asset revaluation reserve from Tier One Capital. Upper Tier Two Capital
allows for the inclusion of 45% of the asset revaluation reserve balance.
(2) As at 31 December 2012 the available for sale reserve had a credit balance of $138 million and is not eligible for inclusion in regulatory capital. (30 June
2012:$63 million deficit, 31 Dec 2011:$83 million deficit).
(3) Excludes balances related to non-consolidated subsidiaries.
Retained Earnings (including Current Year Earnings)
Through the use of dividend policy and strategy, retained earnings (including current period profits) are a significant mechanism by
which the Group‟s capital is managed. There are a number of reconciling items between accounting designated retained earnings and
the amount which qualifies as Tier One Capital.
The table below details the Retained Earnings and Current Period Profits that qualify as Tier One Capital.
Retained and current period profits included in regulatory capital
31 Dec 12 30 Jun 12 31 Dec 11
$M $M $M
Retained earnings and current period profits 14,440 13,356 11,928
Less expected dividend (2,639) (3,137) (2,166)
Add back estimated reinvestment under dividend reinvestment plan (1) - 784 542
Retained earnings adjustment for non-consolidated subsidiaries (2) (239) (126) 35
Other (308) (219) (178)
Total included in regulatory capital 11,254 10,658 10,161
(1) Dividend Reinvestment Plan (DRP) in respect of the December 2012 interim dividend is assumed to be satisfied in full by an on market purchase of shares. The DRP
in respect of both the June 2012 final and December 2011 interim dividend was satisfied in full by the issue of shares.
(2) Represents cumulative current year profit and retained earnings adjustment for subsidiaries not consolidated for regulatory purposes. This includes adjustments to the
extent to which retained earnings from non-consolidated subsidiaries have not been repatriated to the Bank in dividends (December 2012: $991 million, June 2012:
$878 million, December 2011: $717 million). The retention of these profits are used to fund the future growth of these operations. This has been offset by the one-off
write back adjustments upon adoption of IFRS of $752 million.
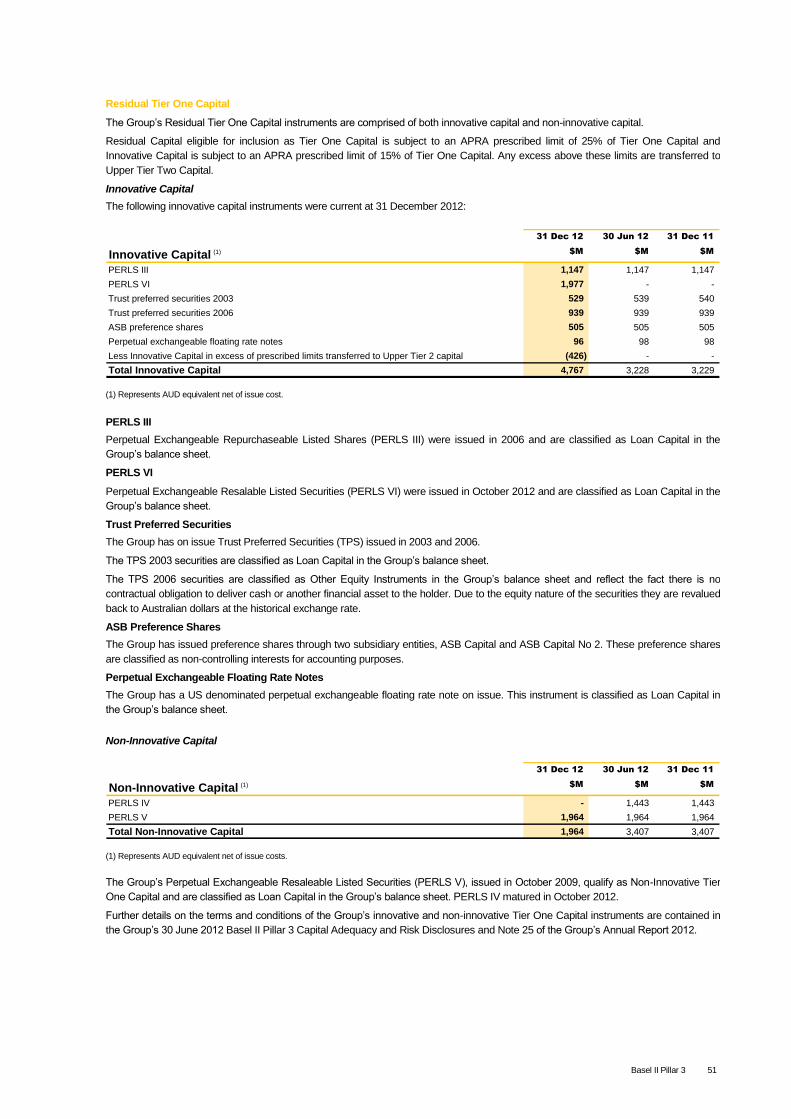
Basel II Pillar 3 51
Residual Tier One Capital
The Group‟s Residual Tier One Capital instruments are comprised of both innovative capital and non-innovative capital.
Residual Capital eligible for inclusion as Tier One Capital is subject to an APRA prescribed limit of 25% of Tier One Capital and
Innovative Capital is subject to an APRA prescribed limit of 15% of Tier One Capital. Any excess above these limits are transferred to
Upper Tier Two Capital.
Innovative Capital
The following innovative capital instruments were current at 31 December 2012:
31 Dec 12 30 Jun 12 31 Dec 11
Innovative Capital (1) $M $M $M
PERLS III 1,147 1,147 1,147
PERLS VI 1,977 - -
Trust preferred securities 2003 529 539 540
Trust preferred securities 2006 939 939 939
ASB preference shares 505 505 505
Perpetual exchangeable floating rate notes 96 98 98
Less Innovative Capital in excess of prescribed limits transferred to Upper Tier 2 capital (426) - -
Total Innovative Capital 4,767 3,228 3,229
(1) Represents AUD equivalent net of issue cost.
PERLS III
Perpetual Exchangeable Repurchaseable Listed Shares (PERLS III) were issued in 2006 and are classified as Loan Capital in the
Group‟s balance sheet.
PERLS VI
Perpetual Exchangeable Resalable Listed Securities (PERLS VI) were issued in October 2012 and are classified as Loan Capital in the
Group‟s balance sheet.
Trust Preferred Securities
The Group has on issue Trust Preferred Securities (TPS) issued in 2003 and 2006.
The TPS 2003 securities are classified as Loan Capital in the Group‟s balance sheet.
The TPS 2006 securities are classified as Other Equity Instruments in the Group‟s balance sheet and reflect the fact there is no
contractual obligation to deliver cash or another financial asset to the holder. Due to the equity nature of the securities they are revalued
back to Australian dollars at the historical exchange rate.
ASB Preference Shares
The Group has issued preference shares through two subsidiary entities, ASB Capital and ASB Capital No 2. These preference shares
are classified as non-controlling interests for accounting purposes.
Perpetual Exchangeable Floating Rate Notes
The Group has a US denominated perpetual exchangeable floating rate note on issue. This instrument is classified as Loan Capital in
the Group‟s balance sheet.
Non-Innovative Capital
31 Dec 12 30 Jun 12 31 Dec 11
Non-Innovative Capital (1) $M $M $M
PERLS IV - 1,443 1,443
PERLS V 1,964 1,964 1,964
Total Non-Innovative Capital 1,964 3,407 3,407
(1) Represents AUD equivalent net of issue costs.
The Group‟s Perpetual Exchangeable Resaleable Listed Securities (PERLS V), issued in October 2009, qualify as Non-Innovative Tier
One Capital and are classified as Loan Capital in the Group‟s balance sheet. PERLS IV matured in October 2012.
Further details on the terms and conditions of the Group‟s innovative and non-innovative Tier One Capital instruments are contained in
the Group‟s 30 June 2012 Basel II Pillar 3 Capital Adequacy and Risk Disclosures and Note 25 of the Group‟s Annual Report 2012.

52 Commonwealth Bank of Australia
Tier One Capital Deductions
31 Dec 12 30 Jun 12 31 Dec 11
Tier One Capital Deductions - 100% $M $M $M
Goodwill and other intangibles (excluding software) (8,535) (8,581) (8,546)
Capitalised expenses (224) (263) (240)
Capitalised computer software costs (1,831) (1,700) (1,480)
General reserve for credit losses (197) (209) (183)
Deferred tax (393) (548) (383)
Total Tier One Capital deductions - 100% (11,180) (11,301) (10,832)
31 Dec 12 30 Jun 12 31 Dec 11
Tier One Capital Deductions - 50% $M $M $M
Equity investments in other companies and trusts (614) (612) (638)
Equity investments in non-consolidated subsidiaries (net of intangibles) (632) (629) (594)
Expected impairment loss (before tax) in excess of eligible credit provisions (net of deferred tax) (512) (630) (646)
Other deductions (241) (113) (66)
Total Tier One Capital deductions - 50% (1,999) (1,984) (1,944)
Tier Two Capital
31 Dec 12 30 Jun 12 31 Dec 11
Upper Tier Two Capital $M $M $M
Innovative Capital in excess of prescribed limits transferred to Upper Tier 2 capital (1) 426 - -
Prudential general reserve for credit losses (net of tax) (2) 124 595 631
Asset revaluation reserve (3) 87 88 86
Upper Tier Two note and bond issues 324 358 368
Other 204 176 151
Total Upper Tier Two Capital 1,165 1,217 1,236
(1) Innovative capital in excess of APRA‟s prescribed limit of 15% transferred from Tier One Capital
(2) Prudential general reserve for credit losses represents the after tax collective provisions and general reserve for credit losses of Banking entities in the Group
(including Bankwest) which operate under the Basel II Standardised methodology.
(3) APRA allows only 45% of the asset revaluation reserve to be included in Tier Two Capital.
Lower Tier Two Capital
The Group has a number of subordinated debt issues across multiple currencies on issue at any one point in time. In order to qualify as
Lower Tier Two Capital the instrument must:
Be unsecured and paid up;
Have a minimum term of 5 years; and
Recognise the amount available for inclusion in Lower Tier Two as being amortised at a rate of 20% (straight line) over the last 5
years to maturity.

Basel II Pillar 3 53
8.2 List of APRA APS 330 Tables
The following schedule lists the quantitative tables in this document as referenced in APRA Prudential Standard APS 330 “Capital
Adequacy: Public Disclosure of Prudential Information” Attachments A and B.
APS 330 Table Title Page No.
1d Capital deficiencies in non-consolidated subsidiaries 3
2b to 2d Group regulatory capital position 5
3b to 3f Capital adequacy (risk weighted assets) 7
3g Capital ratios 5
4b Credit risk exposure by portfolio type 11
4c Credit risk exposure by portfolio type and geographic distribution 12
4d Credit risk exposure by portfolio type and industry sector 13
4e Credit risk exposure by portfolio type and contractual maturity 16
4f (i) Impaired, past due, specific provisions and write-offs charged by industry sector 18
4f (ii) Impaired, past due, specific provisions and write-offs charged by portfolio 20
4g (i) Impaired, past due and specific provisions by geographic region 21
4g (ii) GRCL by geographic region 21
4h (i) Movement in collective and other provisions 22
4h (ii) Movement in individual provisions 22
4i Total credit exposures (excluding equities and securitisation) by portfolio type and modelling
approach
9
4j General Reserve for credit losses 17
5b Exposures subject to standardised and supervisory risk-weights 22
6b Internal ratings structure for credit risk exposures 24
6c PD rating methodology by portfolio segment 24
6d (i) Non-retail risk exposure by portfolio type and PD band 25
6d (ii) Retail exposures by portfolio type and PD band 28
6e Analysis of losses by portfolio type 31
6f (i) Historical loss analysis by portfolio type 32
6f (ii) Accuracy of risk estimates – PD 33
6f (iii) Accuracy of risk estimates – LGD and EAD 33
7b and 7c Credit risk mitigation 34
9g (i) Banking book exposures securitised – traditional securitisations 36
9g (ii) Banking book exposures securitised – synthetic securitisations 36
9g (iii) Total banking book exposures securitised 36
9h Past due and impaired banking book exposures by asset type 37
9i Banking book exposures intended to be securitised 37
9j (i) Banking book activity for the reporting period 38
9k Banking book exposures retained or purchased 39
9l (i) Banking book exposure by risk weighting 40
9l (ii) Banking book exposure deducted entirely from capital 41
9m Banking book exposures subject to early amortisation 42
9n Banking book resecuritisation exposures 42
9o (i) Trading book exposures securitised – traditional securitisations 42
9o (ii) Trading book exposures securitised – synthetic securitisation 42
9o (iii) Total trading book exposures securitised 42
9p Trading book exposures intended to be securitised 42
9q Trading book activity for the reporting period 43

54 Commonwealth Bank of Australia
9r Trading book exposures subject to APS 116 43
9s Trading book exposures retained or purchased subject to APS 120 43
9t (i) Capital requirements (RWA) of securitisation exposures retained/purchased subject to IMA 43
9t (ii) Trading book exposures subject to APS 120 by risk weighting 44
9u (i) Capital requirements (RWA) of trading book exposures retained/purchased subject to IMA 44
9u (ii) Capital requirements (RWA) of trading book exposures subject to APS 120 by risk weighting 45
9u (iii) Trading book exposures entirely deducted from capital 46
9v Trading book exposures subject to early amortisation 46
9w Trading book resecuritisation exposures 46
10b Traded Market Risk under the standard method 48
11d Value at Risk for trading portfolios under the internal model approach 48
13b to 13f Equity investment exposures 47
14b Interest Rate Risk in the Banking Book 49
18a Total securitisation activity for the reporting period 46
18b Summary of total securitisation exposures retained or purchased 46

Basel II Pillar 3 55
8.3 List of Supplemental Tables and Diagrams
Title/Description Page No.
Table – Summary Group capital adequacy ratios (level 2) 2
Diagram – APS 330 reporting structure 3
Table – Summary Group capital adequacy and RWA 4
Table – Regulatory capital frameworks comparison 4
Table – Explanation of change in credit RWA 8
Table – Explanation of change in credit exposure 9
Table – Reconciliation of Australian Accounting Standards and APS 220 based credit provisions 17
Table – Traded Market Risk RWA by modelling approach 48
Table – Ordinary share capital for regulatory purposes 50
Table – Reserves balance included in regulatory capital 50
Table – Retained & current period profits included in regulatory capital 50
Table – Innovative capital 51
Table – Non-innovative capital 51
Table – Tier One Capital Deductions - 100% and 50% 52
Table – Upper Tier Two Capital 52

56 Commonwealth Bank of Australia
8.4 Glossary
Term Definition
Australian Accounting Standards The Australian Accounting Standards as issued by the Australian Accounting Standards Board.
ADI Authorised Deposit-taking Institution – includes banks, building societies and credit unions which are
authorised by APRA to take deposits from customers.
AIRB Advanced Internal Ratings Based approach – used to measure credit risk in accordance with the
Group‟s Basel II accreditation approval that allows the Group to use internal estimates of PD, LGD and
EAD for the purposes of calculating regulatory capital.
AMA Advanced Measurement Approach – used to measure operational risk in accordance with the Group‟s
Basel II accreditation approval that allows the Group to use internal estimates and operational model
for the purposes of calculating regulatory capital.
APRA Australian Prudential Regulation Authority – the regulator of banks, insurance companies and
superannuation funds, credit unions, building societies and friendly societies in Australia.
APS APRA‟s ADI Prudential Standards. For more information, refer to the APRA web site.
ASB ASB Bank Limited – a subsidiary of the Commonwealth Bank of Australia that is directly regulated by
the Reserve Bank of New Zealand.
Bank APS asset class – includes claims on central banks, international banking agencies, regional
development banks, ADI and overseas banks.
Basel II Refers to the Basel Committee on Banking Supervision‟s Revised Framework for International
Convergence of Capital Measurement and Capital Standards issued in June 2006 and as
subsequently amended.
CBA Commonwealth Bank of Australia – the head entity of the Group.
CET1 Common Equity Tier 1 Capital is the highest quality of capital available to the Group and reflects the
permanent and unrestricted commitment of funds that are freely available to absorb losses. It
comprises fundamental capital (share capital, retained earnings and reserves) less prescribed
deductions.
Collective Provision All loans and receivables that do not have an individually assessed provision are assessed collectively
for impairment. The collective provision is maintained to reduce the carrying value of the portfolio of
loans to their estimated recoverable amounts. These provisions are as reported in the Group‟s
Financial Statements in accordance with the Australian Accounting Standards (AASB 139 “Financial
Instruments: Recognition and Measurement”).
Corporate APS asset class – includes commercial credit risk where annual revenues exceed $50 million, SME
Corporate and SME Retail.
EAD Exposure at Default – the extent to which a bank may be exposed to an obligor in the event of default.
ECAI External Credit Assessment Institution.
ELE Extended Licenced Entity – APRA may deem a subsidiary of an ADI to be part of the ADI itself for the
purposes of measuring the ADIs exposures to related entities.
General Reserve for Credit Losses APS 220 requires the Group to establish a reserve that covers credit losses prudently estimated, but
not certain to arise, over the full life of all individual facilities making up the business of the ADI. Most of
the Group‟s collective provisions are included in the General Reserve for Credit Losses. An excess of
required General Reserve for Credit Losses over the Group‟s collective provisions is recognised as a
deduction from Tier One Capital on an after tax basis.
Individual Provisions Provisions made against individual facilities in the credit-rated managed segment where there is
objective evidence of impairment and full recovery of principal and interest is considered doubtful.
These provisions are established based primarily on estimates of realisable value of collateral taken.
These provisions are as reported in the Group‟s Financial Statements in accordance with the Australian
Accounting Standards (AASB 139 “Financial Instruments: Recognition and Measurement”). Also
known as individually assessed provisions or IAP.

Basel II Pillar 3 57
8.4 Glossary (continued)
Term Definition
Level 1 Represents the ADI and each subsidiary of the ADI that has been approved as an extended licence
entity by APRA.
Level 2 The level at which the Group reports its capital adequacy to APRA being the consolidated banking
group comprising the ADI and all of its subsidiary entities other than non-consolidated subsidiaries.
This is the basis on which this report has been produced.
Level 3 The conglomerate group including the Group‟s insurance and wealth management business.
LGD Loss Given Default – the fraction of exposure at default (EAD) that is not expected to be recovered
following default.
Other Assets APS asset class – includes Cash, Investments in Related Entities, Fixed Assets and Margin Lending.
Other Retail APS asset class – includes all retail credit exposures not otherwise classed as a residential mortgage,
SME retail or a qualifying revolving retail asset.
PD Probability of Default – the likelihood that a debtor fails to meet an obligation or contractual
commitment.
Qualifying Revolving Retail APS asset class – represents revolving exposures to individuals less than $0.1m, unsecured and
unconditionally cancellable by the Group. Only Australian retail credit cards qualify for this AIRB asset
class.
Residential Mortgage APS asset class – includes retail and small and medium enterprise exposures up to $1 million that are
secured by residential mortgage property.
RBA Reserve Bank of Australia.
RBNZ Reserve Bank of New Zealand.
RWA Risk Weighted Assets – the value of the Group‟s on and off-balance sheet assets are adjusted
according to risk weights calculated according to various APRA prudential standards. For more
information, refer to the APRA web site.
Scaling Factor In order to broadly maintain the aggregate level of capital in the global financial system post
implementation of Basel II, the Basel Committee on Banking Supervision applies a scaling factor to the
risk-weighted asset amounts for credit risk under the IRB approach. The current scaling factor is 1.06.
Securitisation APS asset class – includes Group-originated securitised exposures and the provision of facilities to
customers in relation to securitisation activities.
SME Corporate APS asset class – includes small and medium enterprise (SME) commercial credit risk where annual
revenues are less than $50 million and exposures are greater than $1 million.
SME Retail APS asset class – includes small and medium enterprise (SME) exposures up to $1 million that are not
secured by residential mortgage property.
Sovereign APS asset class – includes claims on the Reserve Bank of Australia and on Australian and foreign
governments.
Specialised Lending APS asset classes subject to the supervisory slotting approach and which include Income Producing
Real Estate (IPRE) and Project Finance assets.
Specific Provisions APS 220 requires ADIs to report as specific provisions all provisions for impairment assessed by an
ADI on an individual basis in accordance with the Australian Accounting Standards and that portion of
provisions assessed on a collective basis which are deemed ineligible to be included in the General
Reserve for Credit Losses (which are primarily collective provisions on some defaulted assets).
Tier One Capital Tier One Capital comprises:
Fundamental Capital (share capital, retained earnings and reserves);
Residual Capital (innovative and non innovative); and
Prescribed Regulatory deductions.
Tier Two Capital
Tier Two Capital represents those capital items that fall short of the necessary conditions to qualify as
Tier One Capital. There are two main classes, upper and lower Tier Two.