Embed Size (px)
Citation preview

Common Trends and Common Cycles among Interest Rates of the G7-Countries
NANNETTE LINDENBERG FRANK WESTERMANN
CESIFO WORKING PAPER NO. 2532 CATEGORY 6: MONETARY POLICY AND INTERNATIONAL FINANCE
JANUARY 2009
An electronic version of the paper may be downloaded • from the SSRN website: www.SSRN.com • from the RePEc website: www.RePEc.org
• from the CESifo website: Twww.CESifo-group.org/wp T

CESifo Working Paper No. 2532
Common Trends and Common Cycles among Interest Rates of the G7-Countries
Abstract In this paper we re-investigate the comovements of interest rates in the G7-countries. We propose a structured modus operandi to analyze the time series characteristics of interest rates and to test for common features. We conduct cointegration, serial correlation common feature and codependence tests with nominal and real interest rates using quarterly data from 1975 to 2007. Overall we only find little evidence of comovements. Common trends are occasionally observed, but the majority of interest rates are not cointegrated. Although some evidence for codependence of higher order is found among European countries, common cycles appear to exist only in rare cases and cannot be generalized for all interest rates.
JEL Code: C22, E43, G12.
Keywords: interest rates, comovement, cointegration, serial correlation common feature, codependence.
Nannette Lindenberg Institute for Empirical Economic Research
University of Osnabrück Rolandstrasse 8
49069 Osnabrück Germany
Frank Westermann University of Osnabrück
Rolandstrasse 8 49069 Osnabrück
Germany [email protected]
January 20, 2009 We would like to thank Yin-Wong Cheung as well as seminar participants at the University of Osnabrück for helpful discussions and comments.

Common Trends and Common Cycles among Interest Rates of the G7-Countries 1
1 Introduction
A recent empirical literature on interest rates analyzes whether they are integrated in the short-run and
in the long-run, using different concepts and types of interest rates.1 Methods to test for comovement
include the tests for cointegration, serial correlation common feature and codependence.2 Results from these
studies, however, are sometimes difficult to reconcile, as the various tests are appropriate for different types
of stochastic properties of the data series. In particular, they depend on the stationarity or non-stationarity,
as well as on the lag structure of the time series under investigation.
We contribute to the existing literature by implementing a structured framework to analyze possible
comovements in interest rates. First, we analyze the time series characteristics of interest rates. We start by
identifying the AR(p)-structure and testing for stationarity, taking into account the small sample properties
of the data set.3 Then, in the set of non-stationary interest rates, we test for common trends, using the
Johansen (1988, 1991) cointegration procedure.4 Finally, among the set of stationary interest rates, we
test for common cycles, using the serial correlation common feature and the codependence tests, that were
initially suggested by Engle and Kozicki (1993) and Vahid and Engle (1997). For the latter test we employ
two different methods: the Two-Stage-Least-Square (TSLS) estimation, and the optimal GMM estimation
proposed by Cubadda (1999).
We apply our analysis to money market rates, government bond yields and Euro-Market rates, both
nominal and real, using a long sample of quarterly data from 1975 to 2007. The idea behind choosing these
series is to include interest rates of different issuers (public, private), different maturities, and rates with and
without country risk. Our main conclusion is that, independent of the interest rate measure that is chosen,
there is only very limited evidence on either long-run or short-run comovements in the G7-countries.
In the set of non-stationary interest rates we find some evidence of cointegration, but the majority of
interest rates are not cointegrated. Among stationary interest rates, we find even less evidence of comove-
ments. As a first pass, we observe that the lag structure of the AR-representations varies substantially
across countries, which indicates that it is unlikely to find a common cyclical pattern among interest rates.
More formally, we reject the strict form of a common serial correlation feature for all interest rates, and
find evidence of codependence - a common cyclical pattern after an initial time interval - only in rare cases.
Taking various efforts to find more positive evidence of short-run comovements, such as changing the sample
period, lag structures, and estimation procedures, does not change this main conclusion. Some evidence of
1Such as Poghosyan and de Haan (2007); Romero-Avila (2007); Zhou (2003); Bremnes, Gjerde and Soettem (2001); Kugler andNeusser (1993).
2Another possible method is to directly test for uncovered or covered interest rate parity. See for example Chinn and Meredith(2004) who test UIP for the G7-countries using short and long horizon data and find evidence for UIP in the latter case.
3We find that interest rates are in most cases I(1) (as in Romero-Avila (2007); Rapach and Weber (2004); Bremnes et al. (2001);King, Plosser, Stock et al. (1991); Rose (1988)). Although some series are also I(0) (as in Choi and Chul Ahn (1999); Wu andZhang (1996); Kugler and Neusser (1993)). This finding is consistent with studies that conclude that there is no unambiguousevidence for either stationarity or non-stationarity for all interest rates (as in Cheung, Tam and Yiu (2008); Koustas andLamarche (2007); Karanasos, Sekioua and Zeng (2006)).
4Again, we control for finite sample properties, using the scaling factors of Cheung and Lai (1993).

N. Lindenberg and F. Westermann 2
higher order codependence is found, however, among European countries, France, Italy and the UK.
With regard to the long-run comovements among interest rates that were previously reported in the
literature, we confirm the finding that cointegration is found only in the minority of the cases (Romero-
Avila (2007); Zhou (2003); Bremnes et al. (2001)) and in special circumstances (Poghosyan and de Haan
(2007)). Concerning comovements in the short-run, our results suggest that more positive evidence reported
in Kugler and Neusser (1993) cannot be generalized for all interest rates, time periods, and reasonable
alternative estimation procedures.5
The paper is organized as follows: The next section presents the data description and preliminary analysis,
namely unit root tests and the definition of the autoregressive process of the interest rates. Section three
discusses comovements in interest rates. After a brief presentation of the applied methodology, we then
present results of the cointegration, serial correlation common feature and codependence tests for nominal
and real interest rates. In order to augment the possibility of finding at least common if not synchronized
cycles we use two different methodologies for the latter common feature. The last section contains some
concluding remarks.
2 Data and Descriptive Statistics
2.1 Description of the data
Our analysis is conducted with nominal and ex post real interest rates for the G7-countries: Canada, France,
Germany, Italy, Japan, the United Kingdom and the United States. We use money market rates and 10-year
government bond yields. In addition, we run the same investigation with Euro-Market rates of the seven
countries. Our sample period covers quarterly data of the post Bretton-Woods-era, i.e. from 1975:1 to
2007:1.
For the analysis of real interest rates, ex post rates are constructed with the logged first differences of
the respective consumer price index.
Data on money market rates, government bond yields and consumer prices are extracted from the In-
ternational Financial Statistics Database of the International Monetary Fund. In order to complement un-
available data on French interest rates, missing data are taken from the statistics of the Banque de France.
The Euro-Market rates are provided by Global Insight (see table A.1 in the appendix for a detailed data
description).
Graphs of the nominal interest rates are displayed in figure 1 in the appendix.
5Kugler and Neusser (1993) use a codependence test that is based on a MA-representation of real Euro-currency rates from1980 to 1991. Confining our analysis to the same sample period and interest rate, we indeed also find some more evidence ofstationarity and common lag structures. Interest rates are mostly AR(1) processes in this time period. Although the null ofa common feature cannot be rejected in 5 out of 6 cases, the coefficient in the cofeature relationship is insignificant in all butone case (real Euro-Market rates of France and Italy). For all other interest rates, as well as for longer sample periods, wecannot confirm this partial evidence for common features.

Common Trends and Common Cycles among Interest Rates of the G7-Countries 3
2.2 Preliminary Analysis
We start our empirical analysis by defining the lag structure of each time series and by performing unit root
tests.
Process We first estimate different AR representations of the process of each variable using the following
regression equation:
xt = µ+p∑
i=1
βixt−i + εt,
with xt = the interest rate at time t, p = lag parameter and εt = an error term. We then select a parsimonious
lag structure6 by identifying the minimum lag length that is needed to remove all autocorrelation from the
residuals, i.e. all Q-statistics are insignificant.
In addition, we perform the same analysis with the first differences of the interest rates ∆xt. The lag
structures of the nominal and real interest rates and their first differences are shown in table 1.
The lag structures of the nominal interest rates typically vary from AR(1) to AR(6).7 Similarly, the
real interest rates have lag structures from AR(1) to AR(8). The majority of the nominal interest rates are
found to have an AR(2) representation, whereas the lag structure of the real interest rates is more uniformly
distributed between the different possibilities in the range mentioned above.
The diversity of lag structures across countries and interest rates is interesting in the context of the
main aim of the paper, that is to identify common trends and common cycles among interest rates. While
section three will formally investigate whether the autoregressive components of interest rate time series
(”cycles”) are common across countries, the diversity of lag structures in interest rates already tells us, that
an important precondition for finding common cycles (or common serial correlation patterns) is not met in
many countries. Not being able to establish a common lag structure in many cases, makes it very unlikely
to find strong evidence in favor of a common serial correlation feature in the following exercises.
Stationarity As a second preliminary exercise, we test for possible unit roots, using the Augmented-
Dickey-Fuller (ADF) test:8
∆xt = µ+ βt+ γxt−1 +p∑
j=1
φj∆xt−j + εt,
where ∆ is the first difference operator and t a time trend.9
6In order to generate the best condition for finding serial correlation common features or codependence we choose the mostparsimonious model. However, using the AIC or SIC criterion to choose the lag length does not change the results qualitatively.
7There is an exceptionally high lag length of 12 for the money market rate in Germany.8In a first round we allow for an intercept and a time trend, and if the time trend is insignificant, we conduct the ADF-test ina second round only with an intercept.
9The lag parameter p is determined by the Akaike information criterion (AIC). Using the Schwarz criterion (SIC) gives insome cases different results. However, the qualitative interpretation of the analysis is robust to the selected lag length. Thesubsequent tests for comovements will be applied to all interest rates that are I(0) (respectively I(1)) indicated by either one ofthe two criteria. A comparison of the results of the ADF-test with either AIC or SIC is available in the unpublished appendix.

N. Lindenberg and F. Westermann 4
Table 1: AR(p) representations of the process of nominal and real interest rates
Country level 1st diff level 1st diff
Canada 6 6 8 8France 2 1 3 2Germany 12 2 1 1Italy 2 1 3 3Japan 4 2 1 4UK 1 4 5 8USA 6 5 7 2
Canada 4 3 2 4France 2 1 5 4Germany 4 3 1 1Italy 2 1 5 4Japan 2 1 5 3UK 1 3 8 5USA 4 3 2 1
Canada 1 3 1 3France 2 2 2 4Germany 2 1 1 1Italy 5 4 5 4Japan 4 3 2 1UK 6 4 5 2USA 4 2 3 2
1975:1 - 2007:1(1979:1 - 2007:1 for Euro-Market Rates)
Money Market Rates
Government Bond Yields
Euro-Market Rates
Nominal Real
AR(...) AR(...)
Note: AR representations of the process of the nominal and real interest rates (money market rates, government bond yields
and Euro-Market rates) for the sample 1975:1 to 2007:1 (respectively from 1979:1 onwards for the Euro-Market rates) are
reported. The specification with the smallest number of AR terms is selected, under the constraint that the residual is free of
autocorrelation (i.e. the Q-statistics are insignificant).
The t-statistic of the ADF-test is compared with the finite sample critical values from Cheung and Lai
(1995).10
We apply the ADF-test to the levels and to their first differences. Results of the ADF-test are shown in
table 2. For all nominal interest rates the null hypothesis of a unit root cannot be rejected in levels, but in
first differences it can. Thus, the nominal interest rates are I(1) series.11
For the real interest rates the picture is quite different. The money market rates of Canada and the USA
as well as the government bond yields of Germany, Italy and the USA are stationary. This amounts to about
25% of all time series under investigation. For the remaining interest rates we cannot reject the null of non
10The main conclusions remain the same whether we use the critical values of MacKinnon (1996) or the finite sample criticalvalues of Cheung and Lai (1995).
11About a third of the series are trendstationary. For the purpose of our paper, we treat these interest rates as non-stationaryand do not further distinguish between deterministic and stochastic trends.

Common Trends and Common Cycles among Interest Rates of the G7-Countries 5
Table 2: Results of ADF-test for nominal and real interest rates
Country Level 1st diff. Level 1st diff.
Canada -3.463 -5.186 ** -3.330 ** -6.351 **France -2.995 -6.611 ** -2.185 -6.718 **Germany -2.647 -4.799 ** -2.54 -5.742 **Italy -1.945 -7.871 ** -2.089 -7.832 **Japan -4.002 -5.188 ** -4.729 -7.759 **UK -1.985 -4.695 ** -2.487 -4.118 **USA -3.613 -4.765 ** -3.063 ** -5.925 **
Canada -2.366 -4.736 ** -2.602 -8.382 **France -2.25 -5.863 ** -1.533 -5.808 **Germany -3.323 -7.848 ** -2.942 ** -5.257 **Italy -2.633 -7.248 ** -3.808 ** -9.845 **Japan -3.298 -5.058 ** -6.462 -7.098 **UK -3.905 -9.736 ** -2.176 -5.060 **USA -2.959 -5.742 ** -3.221 ** -8.770 **
Canada -3.667 -10.66 ** -4.347 -5.205 **France -3.806 -4.159 ** -3.966 -4.363 **Germany -3.029 -3.500 ** -3.754 -9.691 **Italy -3.523 -3.432 ** -5.405 -4.942 **Japan -2.626 -8.531 ** -1.657 -8.797 **UK -3.832 -3.599 ** -2.6 -6.525 **USA -3.394 -3.765 ** -2.35 -2.734
Government Bond Yields
Euro-Market Rates
1975:1 - 2007:1(respectively 1979:1 - 2007:1 for Euro-Market Rates)
Nominal Interest Rates Real Interest Rates
Money Market Rates
Note: The ADF-test statistics, calculated for the levels and first differences of nominal and real interest rates (money market
rates, government bond yields and Euro-Market rates) for the sample 1975:1 to 2007:1 (respectively from 1979:1 onwards for
the Euro-Market rates), are reported. The lag length was selected by the AIC criterion. Critical values of Cheung and Lai
(1995) were applied. ** indicate rejection of the existence of both, stochastic and deterministic trends with a significance of
5%.
stationarity.
Again, the mixed pattern found on stationarity suggests that strong evidence on either common trends
or common cycles is unlikely to be found in this data set.
3 Comovements in Interest Rates
In recent years a number of new tests to detect comovements in time series have been developed (see Urga
(2007) for a discussion). The concept of common feature has been first suggested by Engle and Kozicki
(1993) and encompasses common stochastic trends (the I(1)-feature), common serial correlation (common
AR(p)-feature), as well as other times series characteristics, including seasonality and ARCH and GARCH
effects.
A necessary element in the analysis is that the ”feature” (I(1), AR(p), and so on) needs to exist in both
time series under investigation. The large diversity of AR(p) processes and I(1)/I(0) processes in interest

N. Lindenberg and F. Westermann 6
rate data documented above yields only a limited number of country pairs where the common features of
interest - common trends and common cycles - can be tested.
We divide the following analysis into two parts: with the interest rates that are found to have a unit root
we conduct cointegration tests and with the stationary interest rates we pursue serial correlation common
feature and, if applicable, codependence tests.
3.1 Common Stochastic Trends
To test for cointegration we adopt the Johansen (1988, 1991) maximum likelihood approach, allowing for an
intercept in the cointegrating equations. We assume that the time series that we analyze for cointegration
follow a vector autoregressive process of order p:
Xt = µ+p−1∑i=1
ΓiXt−i + εt
where Xt is a n×1 vector of different interest rates (with n = number of interest rates included in the VAR),
µ is an intercept vector and εt is a vector of error terms.
In order to generate the test statistic of the Johansen test, namely the trace or the maximum eigenvalue
statistic12, we require the canonical correlations between the least squares residuals of the two subsequent
regressions:
∆Xt = µ1 +p−1∑i=1
Γi∆Xt−i + ε1t
and Xt−p = µ2 +p−1∑i=1
Γi∆Xt−i + ε2t,
i.e. between the matrices ε1t and ε2t. For the lag parameter p we choose the largest lag structure of the
process of the first differenced terms of the relevant interest rates (see table 1).
The maximum eigenvalue statistic tests the null hypothesis of r cointegrating vectors against the alter-
native hypothesis that there are r + 1 cointegrating vectors:
Maximum Eigenvalue Statistic = −T ln(1− λr+1).
The number of cointegration relations r is restricted to 0 ≤ r ≤ n with n being the number of variables.
12In the subsequent discussion of the results of the cointegration tests only the maximum eigenvalue statistic will be used. Thetrace statistic tests the null hypothesis that there are r or fewer cointegrating vectors:
Trace Statistic = −Tn∑
k=r+1
ln(1− λk),
where λk are the squared canonical correlations calculated in the former step of the analysis. The trace statistic gives slightlydifferent interpretations in some cases. However, a pattern that one of the two statistics is more favorable to cointegrationcannot be detected. Comparison tables with both test statistics (trace and maximum eigenvalue) are available upon request.

Common Trends and Common Cycles among Interest Rates of the G7-Countries 7
n− r assigns the number of independent stochastic trends pushing the long-run dynamics.
The test statistic is compared with the critical values of Osterwald-Lenum (1992) for the 5% and 1% levels
that are corrected with the scaling factor of Cheung and Lai (1993) to control for a possible finite-sample
bias.
We perform tests with all available pairs of interest rates. This yields up to(72
)= 21 possible cointegration
relations (as we have seven different countries) among each type of interest rates.
Nominal Interest Rates We start our analysis with the nominal money market rates, nominal govern-
ment bond yields and nominal Euro-Market rates.
Among the nominal interest rates we do not find any stationary time series, so that we can conduct the
cointegration analysis with all of the nominal interest rates. The results of theses tests are shown in table 3.
The evidence shows that less than the half of the pairs of nominal interest rates are cointegrated: The
null hypothesis of no cointegration is rejected at the 1% level for the money market rate of Italy with the
French, and the US money market rates, as well as for the British-French, the British-German and the
British-Japanese pairs. Furthermore, the money market rates of France and Japan; France and the USA;
and Japan and Italy reject the null hypothesis of no cointegration at the 5% level of significance.
Much less cointegration relation is revealed between the government bond yields of the different countries.
Only for the Canadian-German, the Franco-American and the Italian-German pairs of bonds the null of no
cointegration can be rejected at the 5% level of significance. Overall, bivariate cointegration is found for
38.1% (14.3%) of the nominal money market rates (government bond yields).
Running the Johansen test with the nominal Euro-Market rates yields only one cointegrated pair of
interest rates: The Euro-Market rates of France and the USA reject the null of no cointegration at the 1%
level of significance.
Real Interest Rates One possible distortion to comovements among interest rates are differing inflation
rates. Therefore, we conduct the same analysis also for real interest rates.13 However, we find that the
results are overall very similar.
We reject the null of no cointegration at the 1% level of significance and find cointegration between the
real money market rates of Germany and Italy; Germany and Japan; Japan and the UK; and Japan and the
USA.14 Furthermore, the Franco-German, and the Franco-Italian pairs of real money market rates reject the
null hypothesis of no cointegration at the 5% level.
Among the real government bond yields we detect five more pairs that are cointegrated (rejection at
the 1% level of significance): the Canadian-Japanese, the Canadian-UK, the Franco-German, the Franco-
13For the cointegration test of the real interest rates we exclude those interest rates that are found to be unambiguouslystationary, namely the money market rate of Canada, and the government bond yields of Italy and the USA. Note that thedecision for or against non-stationarity sometimes varies depending on the selected lag length.
14The results of the Johansen test for real interest rates are shown in the unpublished web appendix.

N. Lindenberg and F. Westermann 8
Table 3: Results of Johansen Test for nominal interest rates
Canada France Germany Italy Japan UK USACanada --
--France r=0 19.832 --
r=1 1.4049 --Germany r=0 9.8543 8.7667 --
r=1 4.1231 2.2426 --Italy r=0 25.463 22.454 *** 10.005 --
r=1 1.4137 3.3558 2.0208 --Japan r=0 19.969 18.694 ** 11.203 17.683 ** --
r=1 3.859 5.3931 8.7638 4.3105 --UK r=0 10.109 21.812 *** 25.216 *** 14.371 22.308 *** --
r=1 4.6703 1.9755 4.9939 1.1873 3.0814 --USA r=0 10.896 19.653 ** 12.277 25.103 *** 12.571 12.929 --
r=1 2.1592 2.042 5.742 1.2217 5.2862 6.6093 --
Canada France Germany Italy Japan UK USACanada --
--France r=0 15.996 --
r=1 1.6877 --Germany r=0 18.992 ** 13.911 --
r=1 0.9724 1.5174 --Italy r=0 11.394 9.5678 18.864 ** --
r=1 1.3328 1.7641 1.4064 --Japan r=0 11.139 7.8719 12.059 13.865 --
r=1 2.1828 3.6399 2.7951 4.6457 --UK r=0 14.551 9.6901 11.555 13.04 13.347 --
r=1 3.5876 6.0517 3.7901 5.1034 5.7657 --USA r=0 6.8735 20.177 ** 15.563 12.135 11.367 13.643 --
r=1 1.0324 2.0187 2.3973 1.6545 2.8818 4.4668 --
Canada France Germany Italy Japan UK USACanada --
--France r=0 9.9951 --
r=1 4.1521 --Germany r=0 6.7625 7.8962 --
r=1 4.1075 3.6335 --Italy r=0 17.012 28.34 8.278 --
r=1 3.5435 1.7724 2.5586 --Japan r=0 21.57 41.06 22.288 26.266 --
r=1 3.0846 2.8414 3.0897 19.647 --UK r=0 14.089 20.115 16.252 14.032 31.166 --
r=1 8.551 3.3103 4.923 4.4982 8.2539 --USA r=0 6.9337 25.112 *** 7.3094 15.145 9.5507 3.5474 --
r=1 5.7634 3.4048 4.106 6.8402 3.8312 2.9644 --
Johansen Test (Maximum Eigenvalue Statistic) of Money Market Rates
1975:1 - 2007:1(respectively 1979:1 - 2007:1 for Euro-Market Rates)
Johansen Test (Maximum Eigenvalue Statistic) of Government Bond Yields
Johansen Test (Maximum Eigenvalue Statistic) of Euro-Market Rates
Note: Results of testing for bivariate cointegration among the nominal interest rates (money market rates, government bond
yields and Euro-Market rates) for the sample 1975:1 to 2007:1 (respectively from 1979:1 onwards for the Euro-Market rates) are
shown. The table contains the Maximum Eigenvalue statistics for r=0 and r=1 for each pair of variables. The critical values of
Osterwald-Lenum (1992) were scaled with the scaling factor of Cheung and Lai (1993) to adjust for finite samples. ** and ***
indicate the rejection of the null hypothesis with a significance of 5% and 1%.
Japanese and the German-Japanese couple. The Canadian-German pair of real government bond yields still
rejects the null hypothesis of no cointegration at the 5% level.
Summing up, with 6 out of 21 possible pairs being cointegrated (thus 28.6%) the change from nominal to
real interest rates does not enhance the evidence for cointegration among money market rates and government

Common Trends and Common Cycles among Interest Rates of the G7-Countries 9
bond yields in a significant way. Among the real Euro-Market rates there is no evidence for cointegration.
3.2 Common Cycles
Serial Correlation Common Feature As a generalization of the cointegration test, Engle and Kozicki
(1993) have developed the test for common features. If a feature (such as the I(1)-property, AR(p)-structure,
seasonality, etc.) is common to two times series, there should exist a linear combination that does not have
this feature.
In this section, we focus on the common serial correlation feature (SCCF). While the previous section
focused on lon-run comovement, the analysis of a common autoregressive structure of time series is often
interpreted as cyclical comovement (Cheung and Westermann (2002)). It is important to point out, that
not both tests can be meaningfully applied to the same time series, as one requires stationarity, and the
other non-stationarity. In this section we therefore only continue with interest rates that were identified as
I(0)-series in table 2.15
Furthermore, a ”common feature” among time series can only exist, when the feature (i.e. the AR(p)-
structure) is identical in both time series. As reported in table 1, this is rarely the case, however, and, as
pointed out in section 2.2, this substantially limits the degree of common cycles that we anticipate to find
in the data.
For those pairs of interest rates that are stationary and follow the same stochastic process we estimate
the equation
xt = c+ βyt + εt (1)
with two-stage-least-squares, including as instruments all lagged variables of x and y, i.e. xt−k and yt−k for
k = 1, ..., p. (1, β) is the normalized common feature vector.
In a second step, we test whether the estimated residual εt of the former estimation is still driven by the
same stochastic process as xt and yt. Therefore, we estimate the following equation by OLS:
εt = c+p∑
k=1
δkxt−k +p∑
k=1
γkyt−k + ut. (2)
Next, we test the null hypothesis that all lagged variables of xt and yt do not explain jointly the en-
dogenous variable εt, i.e. δk = γk = 0 for k = 1, ..., p. If the lagged variables do not explain the movement
of the estimated residual, the common AR(p)-pattern of the interest rates xt and yt is removed. The null
hypothesis is tested with the F-statistic:
15It is also possible to conduct the serial correlation common feature test in the 1st differences of the non-stationary interestrates. However, as it is difficult to attribute an economic interpretation to the change in interest rates, we focus on the levelsof interest rates in this paper only.

N. Lindenberg and F. Westermann 10
Fk−1,T−k =R2
1−R2
T − k
k − 1,
where T denotes the number of observations and k refers to the number of restrictions, i.e. the number of
exogenous variables including the constant. R2 is the R-squared of regression 2. The null hypothesis of a
common feature will be rejected, if the value of the calculated F-statistic is larger than the tabulated critical
value of the F-distribution.16
For the nominal interest rates we cannot perform the analysis of testing for serial correlation common
features as we do not have a single pair of stationary interest rates.17 Thus, none of the potentially 63 pairs
of nominal interest rates shares a serial correlation common feature.
Among the real interest rates there exist several pairs of interest rates that meet the requirements of
being stationary and following the same AR process.18 The results of the serial correlation common feature
test are displayed in table 4 (panel A).
In our sample, 10 of the 21 real interest rates fulfill the condition of being stationary. Among these 10
time series we identify 2 pairs of interest rates of the same type that follow the same autoregressive process:
the real government bond yields of Canada and the USA (AR(2)); and of France and Italy (AR(5)). For
both pairs of real interest rates we reject the null hypothesis of a common feature at the 1% significance
level. Thus, none of the 63 pairs of real interest rates share a common serial correlation feature.
As a robustness test, we also conduct the analysis in a shorter sample, ending in 1998:4. The aim
is to control for possible influences of the change in the institutional environment that resulted from the
introduction of the ECB.
In comparison to the initial sample, we find three more pairs to test for serial correlation common feature:
real government bond yields of France, Italy and the UK (all AR(5)-processes) form the first three couples
and the real Euro-Market rates from Canada and France (AR(1)), and from Italy and the UK (AR(2)) are
the remaining two couples (see panel B of table 4). In four of the five cases the F-statistics are significant,
indicating that a common serial correlation does not exist. In the case of the real Euro-Market rates of Italy
and the UK, the F-statistic is insignificant. However, the cofeature vector is insignificant. Thus, a serial
correlation common feature does not exist in the shortened sample either.
Codependence: TSLS Estimation In table 4 we also report the results on codependence among interest
rates of higher order. This weaker form of cyclical, but non-synchronized comovement was first described by
Gourieroux and Peaucelle (1989) and Vahid and Engle (1997): Some time series may have a different initial
16Thus, in contrast to the cointegration test, where a rejection of H0 stands for the existence of a common trend, in the caseof the serial correlation common feature test we must not reject the null hypothesis in order to detect a common feature.
17See table 2.18See table 1, table 2 and comparing the table of ADF-tests with AIC and SIC in the web appendix.

Common Trends and Common Cycles among Interest Rates of the G7-Countries 11
Table 4: Results of serial correlation common feature and codependence tests for real interest rates
PANEL A
Country AR(...) Coefficient CF = 0 1 2 3 4
Canada 2 0.7616 129.3 *** 5.251 ***USA 2
France 5 0.6351 30.09 *** 3.466 *** 2.312 ** 3.136 ** 4.974 ***Italy 5
PANEL B
Country AR(...) Coefficient CF = 0 1 2 3 4
Real Euro-Market RatesCanada 1 0.5611 8.409 ***France 1
Italy 2 0.3097 0.921 1.713UK 2
France 5 0.6192 22.53 *** 2.787 *** 1.619 2.204 3.167 **Italy 5
France 5 0.5511 35.65 *** 5.217 *** 2.781 ** 2.134 4.261 **UK 5
Italy 5 0.8429 24.83 *** 7.443 *** 3.372 *** 3.099 ** 6.132 ***UK 5
Real Government Bond Yields
Real Government Bond Yields
Codependence of order
1975:1 - 2007:1 Codependence of order
1975:1 - 1998:4(respectively 1979:1 - 1998:4 for Euro-Market Rates)
Note: Results of the common feature and codependence test of real government bond yields for the sample 1975:1 - 2007:1
(panel A) are reported. In the lower part of the table we report the results of the common feature and codependence test of
real government bond yields for the sample 1975:1 - 1998:4 (panel B) and of real Euro-Market rates for the sample 1979:1 -
1998:4 (panel B). Only few pairs of real interest rates are stationary and have the same autoregressive representation (indicated
in the second column). The third column contains the coefficient of the common feature vector. The following columns report
the F-statistics for the common feature test (= codependence of order 0) and the codependence tests. *, ** and *** indicate
the rejection of the null hypothesis with a significance of 10%, 5% and 1%.
response to a shock, but a common response after some lags.19
We test for codependence estimating the same equations as for the SCCF: 1. TSLS (equation 1) and 2.
OLS of the residual (equation 2).
Then, we compute a Wald-Test, testing whether all but the first lagged terms of both interest rates do
not explain jointly the estimated residual εt. The null hypotheses are: H0 for codependence of order 1:
δk = γk = 0 for k = 2, ..., p; H0 for codependence of order 2: δk = γk = 0 for k = 3, ..., p and so forth. Again,
H0 will be rejected, if the value of the calculated F-statistic is larger than the tabulated critical value.
We test for codependence of order one for the real government bond yields of Canada and the USA and
for codependence up to order four for the real government bond yields of France and Italy (see table 4 (panel
A) for the results). All test statistics are highly significant, thus a codependence relationship does not exist
19Thus, codependence of order 0 is actually a serial correlation common feature.

N. Lindenberg and F. Westermann 12
among the country pairs.
As before, we pursue the codependence tests for the shortened sample (see table 4 (panel B)). In this
specification, very weak evidence is found in favor of codependence. The result lends support to the view
that the real government bond yields of France and Italy are codependant of order two and order three
and that the real government bond yields of France and the UK show third order codependence. However,
codependence of order four is not found in both cases, which suggests that there is little correlation left after
the third lag in either time series.
To sum up, reliable evidence for a comovement in the transitory components of the interest rates cannot
be found. As the evidence for serial correlation common feature is really poor among all types of interest
rates, we finally ignore for a moment the condition that the time series have to follow the same process of
autocorrelation and conduct the test for serial correlation common feature with all interest rates of the same
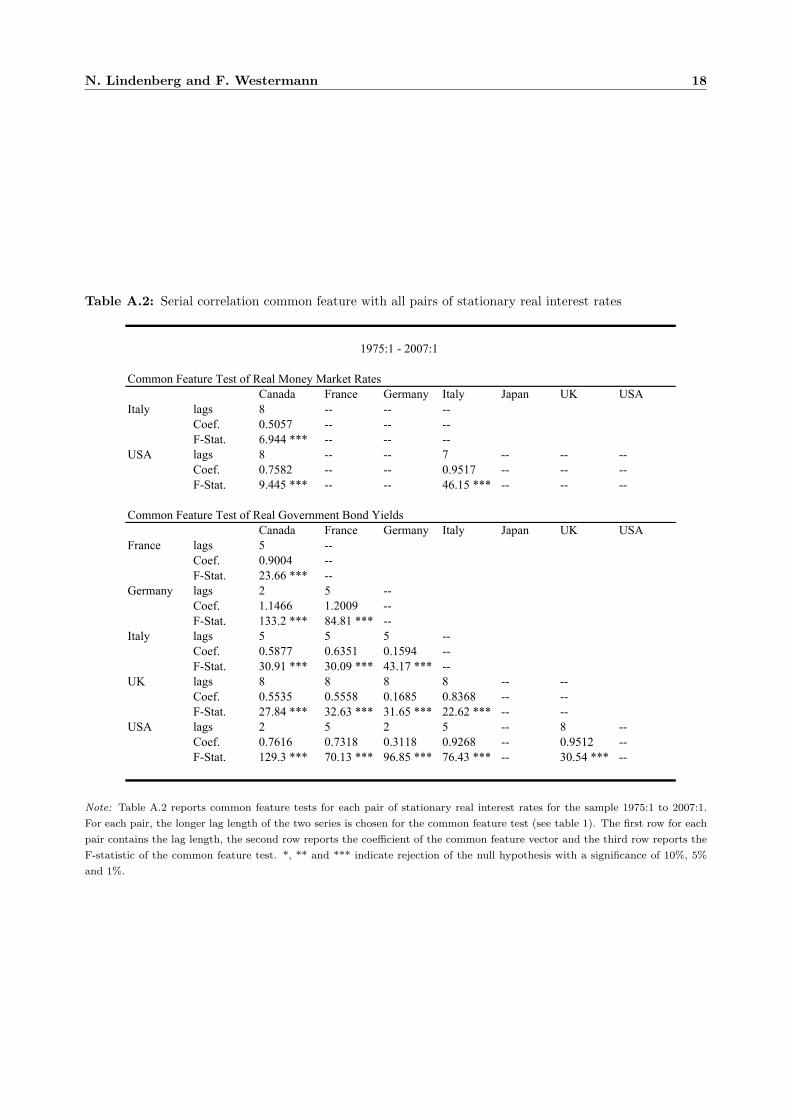
type that are I(0). The results are displayed in table A.2 in the appendix. This relaxation leaves us with
three pairs of real money market rates and 15 pairs of real government bond yields to test for comovements
in the short-run. For each test the respectively longer lag length is selected. All test statistics are highly
significant (at the 1% level), meaning that no serial common feature exists among them. This result indicates
that the poor evidence for serial correlation common feature is not due to a wrong lag length selection.
Codependence: GMM Estimation We finally consider a GMM estimation of the codependence rela-
tionship. Vahid and Engle (1997) and Cubadda (1999) both report that due to its relative efficiency, an
optimal general method of moments (GMM) estimation is more appropriate for a codependence test than
a TSLS estimation.20 Thus, in a last attempt to detect evidence for cyclical comovement, we conduct the
optimal GMM test proposed by Cubadda (1999). Results of the GMM estimation of codependence relations
are shown in table 5.
As in the previous section, we first test the two pairs of real government bond yields of Canada and the
USA; and France and Italy, where common lag structures are given in the full sample (table 5 (panel A)).
In the former case the χ2-statistic is highly significant. In the latter case we find only weak evidence for
codependence of order four, as the null hypothesis of codependence can only be rejected at the 10%-level.
In the shorter sample the evidence for some codependence strengthens a bit: For the real government
bond yields of France and Italy we find the same weak evidence for codependence of order four; and for the
real government bond yields of France and the UK; and Italy and the UK we find codependence of order
three (the null hypothesis of codependence cannot be rejected at conventional levels) (see table 5 (panel B)).
Concerning the real Euro-Market rates we can still not find evidence for codependence. In the case of the
20Schleicher (2007) proposes another alternative to the TSLS procedure claiming that likelihood ratio (LR) tests based on fullinformation maximum likelihood (FIML) estimates have even higher power than the optimal GMM estimates when testingfor codependence of order one. However, this applies above all if error correction terms are included, which is not given inour investigation.

Common Trends and Common Cycles among Interest Rates of the G7-Countries 13
Table 5: Results of optimal GMM estimation of codependence relations for real interest rates
PANEL A
Country AR(...) 0 1 2 3 4
Real Government Bond YieldsCanada 2 Vector - 0.7101 *** - 0.7024 ***USA 2 χ²-test 118.3175 *** 59.8897 ***
France 5 Vector - 0.6587 *** - 0.6666 *** - 0.6888 *** - 0.7386 *** - 0.7982 ***Italy 5 χ²-test 115.5616 *** 54.7611 *** 28.3730 *** 13.6564 *** 6.2664 *
PANEL B
Country AR(...) 0 1 2 3 4
Real Euro-Market RatesCanada 1 Vector - 0.1888 **France 1 χ²-test 66.0714 ***
Italy 2 Vector - 0.2746 ** - 0.2875UK 2 χ²-test 41.3502 *** 21.0472 ***
Real Government Bond YieldsFrance 5 Vector - 0.5598 *** - 0.5731 *** - 0.5971 *** - 0.6594 *** - 0.7212 ***Italy 5 χ²-test 85.1935 *** 40.2984 *** 21.1621 *** 11.4594 *** 7.4646 *
France 5 Vector - 0.4206 *** - 0.4641 *** - 0.5692 *** - 0.7779 *** - 0.9242 ***UK 5 χ²-test 86.3631 *** 41.3578 *** 19.0679 *** 5.6549 1.5596
Italy 5 Vector - 0.7591 *** - 0.8348 *** - 0.9261 *** - 0.9634 *** - 0.8064 ***UK 5 χ²-test 79.9158 *** 30.3733 *** 8.2637 ** 0.4974 1.7558
Codependence of order
1975:1 - 2007:1 Codependence of order
1975:1 - 1998:4(respectively 1979:1 - 1998:4 for Euro-Market Rates)
Note: Results of the optimal GMM estimation of codependence relations of real government bond yields for the sample 1975:1
- 2007:1 (panel A) and 1975:1 - 1998:4 (panel B) as well as of real Euro-Market rates for the sample 1979:1 - 1998:4 (panel B)
are reported. *, ** and *** indicate statistical significance at the 10%, 5% and 1% level.
Italian-UK pair, the codependence vector of order one is insignificant, but the coefficient in the co-feature
relationship is insignificant.
Overall, convincing evidence for cyclical comovement cannot be found. Some codependence of higher
order can be detected in a few special cases. The strongest evidence of codependence exist among the EU
countries, Italy, France and the UK.
4 Conclusions
The contribution of this paper is to analyze comovements in interest rates in a structured framework. For
this purpose we performed the analysis with different interest rates in a post Bretton-Woods sample: we
started with nominal interest rates (money market rates, government bond yields and Euro-Market rates)
and continued with real interest rates.
Already the preliminary analysis of defining the lag structure and the stationarity of the interest rates

N. Lindenberg and F. Westermann 14
gives rise to the suspicion that little evidence of comovement can be detected in our data set. We generally
find only weak evidence for cointegration. Neither the abstraction of the country risk by looking at Euro-
Market rates, nor the distinction between nominal and real rates is vital for finding comovements in the long
run. The same conclusion also applies to cyclical comovement: using two different methodologies, the TSLS
estimation proposed by Engle and Kozicki (1993) and a GMM estimation suggested by Cubadda (1999), we
were not able to establish convincing evidence of either common synchronized cycles (SCCF) or common
non-synchronized cycles (codependence). Very limited evidence of higher order codependence only exists
among a few European countries.
The lesson to be drawn from our analysis is thus that we cannot assume common stochastic characteristics
of interest rates, and we also cannot generalize the limited evidence of comovements, that is found in this
paper, for all interest rates.
Further research could analyze whether the currency risk could explain the weak evidence for comovements
among interest rates.21 We tried to approach this aspect by performing the analysis for the three Eurozone-
Countries: France, Germany and Italy, for the time after the introduction of the euro as common currency.22
Although, we did not find common cycles in this attempt either, this finding might be due to the limited
number of observations.
Another promising field for future research could be to extend the test in the literature on the causality
among interest rates. A deeper knowledge of the trend and cycle comovements may be useful for this purpose.
Furthermore, an analysis of different tax regimes might help to explain the weak evidence of comovement.23
Finally, it would be interesting to contrast the finding of the G7-countries to either emerging market
rates, or the interest rates of large economies, with small neighboring countries, that pursue similar central
bank policies.
References
Bremnes, H., Gjerde, O. and Soettem, F. (2001),“Linkages among Interest Rates in the United States,
Germany and Norway”. The Scandinavian Journal of Economics, 103(1), 127–145.
Cheung, Y.-W. and Lai, K. S. (1993),“Finite-Sample Sizes of Johansen’s Likelihood Ration Tests for
Cointegration”. Oxford Bulletin of Economics and Statistics, 55(3), 313–328.
Cheung, Y.-W. and Lai, K. S. (1995),“Lag Order and Critical Values of the Augmented Dickey-Fuller
Test”. Journal of Business & Economic Statistics, 13(3), 277–280.
21The interaction between interest rates and the exchange rate was the topic of many research papers in the last years. However,evidence is quite mixed. For a discussion about the relationship between interest rates and exchange rates see Hnatkovska,Lahiri and Vegh (2008).
22We use the same interest rates as before, namely money market rates and government bond yields in a reduced sample from1999:1 - 2007:1. Results are available in the unpublished web appendix.
23The importance of tax regimes is reflected in the literature on structural breaks and regime-shifts in the analysis of the unitroot properties of interest rates (as in Lai (2004)).

Common Trends and Common Cycles among Interest Rates of the G7-Countries 15
Cheung, Y.-W., Tam, D. C. and Yiu, M. S. (2008),“Does the Chinese interest rate follow the US
interest rate?” International Journal of Finance & Economics, 13(1), 53–67.
Cheung, Y.-W. and Westermann, F. (2002),“Output Dynamics of the G7 Countries–Stochastic Trends
and Cyclical Movements”. Applied Economics, 34(18), 2239–47.
Chinn, M. D. and Meredith, G. (2004),“Monetary Policy and Long-Horizon Uncovered Interest Parity”.
IMF Staff Papers, 51(3), 409–430.
Choi, I. and Chul Ahn, B. (1999),“Testing the null of stationarity for multiple time series”. Journal of
Econometrics, 88(1), 41–77.
Cubadda, G. (1999),“Common Cycles in Seasonal Non-stationary Time Series”. Journal of Applied Econo-
metrics, 14(3), 273–291.
Engle, R. F. and Kozicki, S. (1993),“Testing for Common Features”. Journal of Business & Economic
Statistics, 11(4), 369–380.
Gourieroux, C. and Peaucelle, I. (1989),“Detecting a long run relationship (with an application to the
p.p.p. hypothesis)”. CEPREMAP Working Papers (Couverture Orange) 8902, CEPREMAP.
Hnatkovska, V., Lahiri, A. and Vegh, C. A. (2008),“Interest Rates and the Exchange Rate: A Non-
Monotonic Tale”. NBER Working Papers 13925, National Bureau of Economic Research, Inc.
Johansen, S. (1988),“Statistical analysis of cointegration vectors”. Journal of Economic Dynamics and
Control, 12(2-3), 231–254.
Johansen, S. (1991),“Estimation and Hypothesis Testing of Cointegration Vectors in Gaussian Vector
Autoregressive Models”. Econometrica, 59(6), 1551–1580.
Karanasos, M., Sekioua, S. and Zeng, N. (2006),“On the order of integration of monthly US ex-ante
and ex-post real interest rates: New evidence from over a century of data”. Economics Letters, 90(2),
163–169.
King, R. G., Plosser, C. I., Stock, J. H. et al. (1991),“Stochastic Trends and Economic Fluctuations”.
American Economic Review, 81(4), 819–840.
Koustas, Z. and Lamarche, J.-F. (2007),“Evidence of nonlinear mean reversion in the real interest rate”.
Applied Economics, 99999(1), 1–12.
Kugler, P. and Neusser, K. (1993),“International Real Interest Rate Equalization: A Multivariate Time-
Series Approach”. Journal of Applied Econometrics, 8(2), 163–174.
Lai, K. S. (2004),“On structural shifts and stationarity of the ex ante real interest rate”. International
Review of Economics & Finance, 13(2), 217–228.
MacKinnon, J. G. (1996),“Numerical Distribution Functions for Unit Root and Cointegration Tests”.
Journal of Applied Econometrics, 11(6), 601–618.

N. Lindenberg and F. Westermann 16
Osterwald-Lenum, M. (1992),“A Note with Quantiles of the Asymptotic Distribution of the Maximum
Likelihood Cointegration Rank Test Statistics”. Oxford Bulletin of Economics and Statistics, 54(3), 461–
472.
Poghosyan, T. and de Haan, J. (2007),“Interest Rate Linkages in EMU Countries: A Rolling Threshold
Vector Error-Correction Approach”. CESifo Working Paper Series 2060, CESifo GmbH.
Rapach, D. E. and Weber, C. E. (2004),“Are real interest rates really nonstationary? New evidence
from tests with good size and power”. Journal of Macroeconomics, 26(3), 409–430.
Romero-Avila, D. (2007),“Unit Roots and Persistence in the Nominal Interest Rate: A Confirmatory
Analysis Applied to the OECD”. Canadian Journal of Economics, 40(3), 980–1007.
Rose, A. K. (1988),“Is the Real Interest Rate Stable?” Journal of Finance, 43(5), 1095–1112.
Schleicher, C. (2007),“Codependence in cointegrated autoregressive models”. Journal of Applied Econo-
metrics, 22(1), 137–159.
Urga, G. (2007),“Common Features in Economics and Finance: An Overview of Recent Developments”.
Journal of Business & Economic Statistics, 25, 2–11.
Vahid, F. and Engle, R. F. (1997),“Codependent cycles”. Journal of Econometrics, 80(2), 199–221.
Wu, Y. and Zhang, H. (1996),“Mean Reversion in Interest Rates: New Evidence from a Panel of OECD
Countries”. Journal of Money, Credit, and Banking, 28(4), 604–621.
Zhou, S. (2003),“Interest Rate Linkages within the European Monetary System: New Evidence Incorporat-
ing Long-Run Trends”. Journal of International Money and Finance, 22(4), 571–590.

Common Trends and Common Cycles among Interest Rates of the G7-Countries 17
Appendix
Table A.1: Data sources
Country Start End Source Code
Canada 1975q1 2007q1 IFS 15660B..ZFFrance 1952q1 2007q1 Banque de France mt.m.e00250.b.m.t.b.xGermany 1957q1 2007q1 IFS 13460B..ZFItaly 1971q1 2007q1 IFS 13660B..ZFJapan 1957q1 2007q1 IFS 15860B..ZFUK 1972q1 2007q1 IFS 11260B..ZFUSA 1957q1 2007q1 IFS 11160B..ZF
Canada 1957q1 2007q1 IFS 15661...ZFFrance 1957q1 2007q1 IFS 13261...ZFGermany 1957q1 2007q1 IFS 13461...ZFItaly 1957q1 2007q1 IFS 13661...ZFJapan 1966q4 2007q1 IFS 15861...ZFUK 1957q1 2007q1 IFS 11261...ZFUSA 1957q1 2007q1 IFS 11161...ZF
Canada 1975q1 2007q1 IFS 15664...ZFFrance 1957q1 2007q1 IFS 13264...ZFGermany 1957q1 2007q1 IFS 13464.D.ZF + 13464...ZFItaly 1957q1 2007q1 IFS 13664...ZFJapan 1957q1 2007q1 IFS 15864...ZFUK 1957q1 2007q1 IFS 11264...ZFUSA 1957q1 2007q1 IFS 11164...ZF
Canada 1979m1 2008m2 Statistics Canada (STATCAN/CANSIMS)
D156RIBEUB1.D
France 1978m1 2008m2 Daily Press D132RIBEUB1.DGermany 1978m1 2008m2 Daily Press D134RIBEUB1.DItaly 1979m1 2008m2 Daily Press D136RIBEUB1.DJapan 1979m1 2008m2 Bank of Japan D158RIBEUB1.DUK 1978m1 2008m2 Financial Times D112RIBEUB1.DUSA 1978m1 2008m2 Financial Times D111RIBEUB1.D
Euro-Market Rates
Money Market Rates
Government Bond Yields
Consumer Price Indexes
Note: From 1992:1 the Real Interest Rates were calculated with the Inflation of reunified Germany. We thank Global Insight
for kindly providing the Euro-Market rates.
N. Lindenberg and F. Westermann 18
Table A.2: Serial correlation common feature with all pairs of stationary real interest rates
Canada France Germany Italy Japan UK USAItaly lags 8 -- -- --
Coef. 0.5057 -- -- --F-Stat. 6.944 *** -- -- --
USA lags 8 -- -- 7 -- -- --Coef. 0.7582 -- -- 0.9517 -- -- --F-Stat. 9.445 *** -- -- 46.15 *** -- -- --
Canada France Germany Italy Japan UK USAFrance lags 5 --
Coef. 0.9004 --F-Stat. 23.66 *** --
Germany lags 2 5 --Coef. 1.1466 1.2009 --F-Stat. 133.2 *** 84.81 *** --
Italy lags 5 5 5 --Coef. 0.5877 0.6351 0.1594 --F-Stat. 30.91 *** 30.09 *** 43.17 *** --
UK lags 8 8 8 8 -- --Coef. 0.5535 0.5558 0.1685 0.8368 -- --F-Stat. 27.84 *** 32.63 *** 31.65 *** 22.62 *** -- --
USA lags 2 5 2 5 -- 8 --Coef. 0.7616 0.7318 0.3118 0.9268 -- 0.9512 --F-Stat. 129.3 *** 70.13 *** 96.85 *** 76.43 *** -- 30.54 *** --
1975:1 - 2007:1
Common Feature Test of Real Money Market Rates
Common Feature Test of Real Government Bond Yields
Note: Table A.2 reports common feature tests for each pair of stationary real interest rates for the sample 1975:1 to 2007:1.
For each pair, the longer lag length of the two series is chosen for the common feature test (see table 1). The first row for each
pair contains the lag length, the second row reports the coefficient of the common feature vector and the third row reports the
F-statistic of the common feature test. *, ** and *** indicate rejection of the null hypothesis with a significance of 10%, 5%
and 1%.

Common Trends and Common Cycles among Interest Rates of the G7-Countries 19
Figure 1: Nominal interest rates
0
4
8
12
16
20
24
1975 1980 1985 1990 1995 2000 2005
FranceGermanyItalyUK
Government Bond Yields
0
4
8
12
16
20
1975 1980 1985 1990 1995 2000 2005
CanadaJapanUSA
Government Bond Yields
0
4
8
12
16
20
24
1975 1980 1985 1990 1995 2000 2005
FranceGermanyItalyUK
Money Market Rates
0
4
8
12
16
20
24
1975 1980 1985 1990 1995 2000 2005
CanadaJapanUSA
Money Market Rates
0
5
10
15
20
25
30
35
40
1980 1985 1990 1995 2000 2005
FranceGermanyItalyUK
Euro-Market Rates
0
4
8
12
16
20
24
1980 1985 1990 1995 2000 2005
CanadaJapanUSA
Euro-Market Rates
Note: Nominal Interest Rates are displayed.

CESifo Working Paper Series for full list see Twww.cesifo-group.org/wp T (address: Poschingerstr. 5, 81679 Munich, Germany, [email protected])
___________________________________________________________________________ 2469 Anna Montén and Marcel Thum, Ageing Municipalities, Gerontocracy and Fiscal
Competition, November 2008 2470 Volker Meier and Matthias Wrede, Reducing the Excess Burden of Subsidizing the
Stork: Joint Taxation, Individual Taxation, and Family Splitting, November 2008 2471 Gunther Schnabl and Christina Ziegler, Exchange Rate Regime and Wage
Determination in Central and Eastern Europe, November 2008 2472 Kjell Erik Lommerud and Odd Rune Straume, Employment Protection versus
Flexicurity: On Technology Adoption in Unionised Firms, November 2008 2473 Lukas Menkhoff, High-Frequency Analysis of Foreign Exchange Interventions: What
do we learn?, November 2008 2474 Steven Poelhekke and Frederick van der Ploeg, Growth, Foreign Direct Investment and
Urban Concentrations: Unbundling Spatial Lags, November 2008 2475 Helge Berger and Volker Nitsch, Gotcha! A Profile of Smuggling in International
Trade, November 2008 2476 Robert Dur and Joeri Sol, Social Interaction, Co-Worker Altruism, and Incentives,
November 2008 2477 Gaёtan Nicodème, Corporate Income Tax and Economic Distortions, November 2008 2478 Martin Jacob, Rainer Niemann and Martin Weiss, The Rich Demystified – A Reply to
Bach, Corneo, and Steiner (2008), November 2008 2479 Scott Alan Carson, Demographic, Residential, and Socioeconomic Effects on the
Distribution of 19th Century African-American Stature, November 2008 2480 Burkhard Heer and Andreas Irmen, Population, Pensions, and Endogenous Economic
Growth, November 2008 2481 Thomas Aronsson and Erkki Koskela, Optimal Redistributive Taxation and Provision of
Public Input Goods in an Economy with Outsourcing and Unemployment, December 2008
2482 Stanley L. Winer, George Tridimas and Walter Hettich, Social Welfare and Coercion in
Public Finance, December 2008 2483 Bruno S. Frey and Benno Torgler, Politicians: Be Killed or Survive, December 2008
2484 Thiess Buettner, Nadine Riedel and Marco Runkel, Strategic Consolidation under
Formula Apportionment, December 2008 2485 Irani Arraiz, David M. Drukker, Harry H. Kelejian and Ingmar R. Prucha, A Spatial
Cliff-Ord-type Model with Heteroskedastic Innovations: Small and Large Sample Results, December 2008
2486 Oliver Falck, Michael Fritsch and Stephan Heblich, The Apple doesn’t Fall far from the
Tree: Location of Start-Ups Relative to Incumbents, December 2008 2487 Cary Deck and Harris Schlesinger, Exploring Higher-Order Risk Effects, December
2008 2488 Michael Kaganovich and Volker Meier, Social Security Systems, Human Capital, and
Growth in a Small Open Economy, December 2008 2489 Mikael Elinder, Henrik Jordahl and Panu Poutvaara, Selfish and Prospective: Theory
and Evidence of Pocketbook Voting, December 2008 2490 Maarten Bosker and Harry Garretsen, Economic Geography and Economic
Development in Sub-Saharan Africa, December 2008 2491 Urs Fischbacher and Simon Gächter, Social Preferences, Beliefs, and the Dynamics of
Free Riding in Public Good Experiments, December 2008 2492 Michael Hoel, Bush Meets Hotelling: Effects of Improved Renewable Energy
Technology on Greenhouse Gas Emissions, December 2008 2493 Christian Bruns and Oliver Himmler, It’s the Media, Stupid – How Media Activity
Shapes Public Spending, December 2008 2494 Andreas Knabe and Ronnie Schöb, Minimum Wages and their Alternatives: A Critical
Assessment, December 2008 2495 Sascha O. Becker, Peter H. Egger, Maximilian von Ehrlich and Robert Fenge, Going
NUTS: The Effect of EU Structural Funds on Regional Performance, December 2008 2496 Robert Dur, Gift Exchange in the Workplace: Money or Attention?, December 2008 2497 Scott Alan Carson, Nineteenth Century Black and White US Statures: The Primary
Sources of Vitamin D and their Relationship with Height, December 2008 2498 Thomas Crossley and Mario Jametti, Pension Benefit Insurance and Pension Plan
Portfolio Choice, December 2008 2499 Sebastian Hauptmeier, Ferdinand Mittermaier and Johannes Rincke, Fiscal Competition
over Taxes and Public Inputs: Theory and Evidence, December 2008 2500 Dirk Niepelt, Debt Maturity without Commitment, December 2008

2501 Andrew Clark, Andreas Knabe and Steffen Rätzel, Boon or Bane? Others’
Unemployment, Well-being and Job Insecurity, December 2008 2502 Lukas Menkhoff, Rafael R. Rebitzky and Michael Schröder, Heterogeneity in Exchange
Rate Expectations: Evidence on the Chartist-Fundamentalist Approach, December 2008 2503 Salvador Barrios, Harry Huizinga, Luc Laeven and Gaёtan Nicodème, International
Taxation and Multinational Firm Location Decisions, December 2008 2504 Andreas Irmen, Cross-Country Income Differences and Technology Diffusion in a
Competitive World, December 2008 2505 Wenan Fei, Claude Fluet and Harris Schlesinger, Uncertain Bequest Needs and Long-
Term Insurance Contracts, December 2008 2506 Wido Geis, Silke Uebelmesser and Martin Werding, How do Migrants Choose their
Destination Country? An Analysis of Institutional Determinants, December 2008 2507 Hiroyuki Kasahara and Katsumi Shimotsu, Sequential Estimation of Structural Models
with a Fixed Point Constraint, December 2008 2508 Barbara Hofmann, Work Incentives? Ex Post Effects of Unemployment Insurance
Sanctions – Evidence from West Germany, December 2008 2509 Louis Hotte and Stanley L. Winer, The Demands for Environmental Regulation and for
Trade in the Presence of Private Mitigation, December 2008 2510 Konstantinos Angelopoulos, Jim Malley and Apostolis Philippopoulos, Welfare
Implications of Public Education Spending Rules, December 2008 2511 Robert Orlowski and Regina T. Riphahn, The East German Wage Structure after
Transition, December 2008 2512 Michel Beine, Frédéric Docquier and Maurice Schiff, International Migration, Transfers
of Norms and Home Country Fertility, December 2008 2513 Dirk Schindler and Benjamin Weigert, Educational and Wage Risk: Social Insurance vs.
Quality of Education, December 2008 2514 Bernd Hayo and Stefan Voigt, The Relevance of Judicial Procedure for Economic
Growth, December 2008 2515 Bruno S. Frey and Susanne Neckermann, Awards in Economics – Towards a New Field
of Inquiry, January 2009 2516 Gregory Gilpin and Michael Kaganovich, The Quantity and Quality of Teachers: A
Dynamic Trade-off, January 2009

2517 Sascha O. Becker, Peter H. Egger and Valeria Merlo, How Low Business Tax Rates
Attract Multinational Headquarters: Municipality-Level Evidence from Germany, January 2009
2518 Geir H. Bjønnes, Steinar Holden, Dagfinn Rime and Haakon O.Aa. Solheim, ‚Large’ vs.
‚Small’ Players: A Closer Look at the Dynamics of Speculative Attacks, January 2009 2519 Jesus Crespo Cuaresma, Gernot Doppelhofer and Martin Feldkircher, The Determinants
of Economic Growth in European Regions, January 2009 2520 Salvador Valdés-Prieto, The 2008 Chilean Reform to First-Pillar Pensions, January
2009 2521 Geir B. Asheim and Tapan Mitra, Sustainability and Discounted Utilitarianism in
Models of Economic Growth, January 2009 2522 Etienne Farvaque and Gaёl Lagadec, Electoral Control when Policies are for Sale,
January 2009 2523 Nicholas Barr and Peter Diamond, Reforming Pensions, January 2009 2524 Eric A. Hanushek and Ludger Woessmann, Do Better Schools Lead to More Growth?
Cognitive Skills, Economic Outcomes, and Causation, January 2009 2525 Richard Arnott and Eren Inci, The Stability of Downtown Parking and Traffic
Congestion, January 2009 2526 John Whalley, Jun Yu and Shunming Zhang, Trade Retaliation in a Monetary-Trade
Model, January 2009 2527 Mathias Hoffmann and Thomas Nitschka, Securitization of Mortgage Debt, Asset Prices
and International Risk Sharing, January 2009 2528 Steven Brakman and Harry Garretsen, Trade and Geography: Paul Krugman and the
2008 Nobel Prize in Economics, January 2009 2529 Bas Jacobs, Dirk Schindler and Hongyan Yang, Optimal Taxation of Risky Human
Capital, January 2009 2530 Annette Alstadsæter and Erik Fjærli, Neutral Taxation of Shareholder Income?
Corporate Responses to an Announced Dividend Tax, January 2009 2531 Bruno S. Frey and Susanne Neckermann, Academics Appreciate Awards – A New
Aspect of Incentives in Research, January 2009 2532 Nannette Lindenberg and Frank Westermann, Common Trends and Common Cycles
among Interest Rates of the G7-Countries, January 2009