Embed Size (px)
Citation preview

1
TARTU UNIVERSITY
FACULTY OF BIOLOGY AND GEOGRAPHY, INSTITUTE OF MOLECULAR
AND CELL BIOLOGY, DEPARTMENT OF EVOLUTIONARY BIOLOGY
Mait Metspalu
COMMON MATERNAL LEGACY OF INDIAN CASTE AND
TRIBAL POPULATIONS
M.Sc. Thesis
Supervisors: Dr. Toomas Kivisild,
Prof. Richard Villems
Tartu 2001

2
Contents
Abbreviations ____________________________________________________3 Definition of basic terms used in the thesis _____________________________3
Part I: Literature overview _____________________________________________4
Some general issues to phylogenetic analysis ____________________________5 Phylogenetic tree-building methods ___________________________________5 Human mtDNA mutation rate calibration_______________________________6 Population demography and mismatch distributions ______________________7
The Properties of mitochondrial (mt)DNA______________________________7 Fast mutation rate of mtDNA ________________________________________8 Maternal inheritance and lack of recombination in mtDNA ________________9 Hetero- and homoplasmy __________________________________________10 Trees of individuals_______________________________________________11
India ____________________________________________________________12 Some general issues ______________________________________________12 Archaeological data ______________________________________________13 Linguistic data___________________________________________________16 Data obtained from studies using “classical” markers.____________________18 MtDNA variation in Indian populations_______________________________19
Part II: Experimental study____________________________________________26
Objectives________________________________________________________27
Materials and Methods_____________________________________________29 The Samples ____________________________________________________29 Treatment of bloodstains___________________________________________31 PCR conditions __________________________________________________32 Primers ________________________________________________________32 Sequencing _____________________________________________________33 Post reaction clean-up: ____________________________________________34 Data analysis ____________________________________________________34
Results __________________________________________________________35
Disscussion_______________________________________________________41
Conclusions ______________________________________________________45
Acknowledgements ________________________________________________46
Kokkuvõte _______________________________________________________47
References _______________________________________________________49
Supplementary Material ___________________________________________56 Original paper I__________________________________________________67 Original paper II _________________________________________________68 Original paper III ________________________________________________69

3
Abbreviations AMH anatomically modern human bp base pair BP before present COII cytochrome oxydase subunit II (95%) CR 95% credible region (Berger 1985) CRS Cambridge Reference Sequence (Anderson et al. 1981) D-loop displacement loop (=control region) of mtDNA Hg haplogroup HVS-I the first hypervariable segment of the control region of the
mitochondrial genome HVS-II the second hypervariable segment of the control region of the
mitochondrial genome MA million years ago MJ Median joining network ML maximum likelihood MP maximum parsimony NJ neighbour joining Ne effective population size mtDNA mitochondrial DNA np nucleotide position RFLP Restriction Fragment Length Polymorphism RM Reduced median network tRNALys lysyl transfer RNA UGC universal genetic code
Definition of basic terms used in the thesis haplotype a sequence type that comprises all identical sequences haplogroup a group of haplotypes that share a common ancestor defined by
an array of synapomorphic substitutions lineage any array of characters/mutations shared by more than one
haplotype star-like tree a set of sequences is said to have a pattern of star-like
phylogeny if most (ideally all of them) coalesce to one and the same haplotype (that has not necessarily been observed in the sample)
expansion time coalescence coalescence coalescence time calculated to the founder that displays star-
like phylogeny greedy network Reduced median and median joining network (Bandelt et al.
2000)

4
Part I: Literature overview

5
Some general issues to phylogenetic analysis
The following chapter will focus on three issues concerning phylogenetic studies in
general and that based on human mtDNA work in particular.
Phylogenetic tree-building methods
Central to phylogenetic analysis of a given dataset is the construction of a
phylogenetic tree. Tree-building algorithms can generally be divided into two groups.
Firstly those, relying on distance, like neighbour joining (NJ) trees and secondly
those, relying on character state differences, e.g. maximum parsimony (MP) and
maximum likelihood (ML) analyses. The NJ tree (Saitou and Nei 1987) is produced
by the search for the closest neighbours in the distance matrix inferred from pairwise
comparison of all sequences. MP analysis (Fitch 1977; Swofford 1993) employs only
informative substitutions and searches for tree(s) that require the smallest amount of
them. Likelihood values, by which the best tree is chosen in ML analysis (Felsenstein
1988), are derived from a probabilistic model that is specified for character state
changes. Such models, therefore, can take into account substitution rate from one
character state to another. The rates can be taken as uniform for all substitution types
(Jukes and Cantor’s 1-parameter model), or different values can be given for
transitions and transversions (Kimura’s 2-parameter model). Different substitution
types and GC content can further refine rates. Unlike MP method, ML analysis makes
use of all sites available in the sequences.
During recent years in studies based on intraspecific data network methods have
become favourable over standard tree building algorithms. Incompatible character
states caused by multiple hits are a common problem for all phylogenetic analyses.
Multiple hits may result in “saturation”, which means that one site may have gone
through many substitutions and yet be at the same state. The higher the number of
pairwise incompatible (homoplasious) sites the higher is the number of trees with
equal length that can be drawn from the data set. One particular tree from such a
forest of MP trees alone, thus, can be misleading as far as character conflicts are
resolved arbitrarily. Here is where the phylogenetic networks come in. The idea
behind (reduced) median networks (Bandelt 1994; Bandelt et al. 1995) is to compile

6
(almost) all MP trees into a single network. It is achieved by algorithms, relying either
on sequential split decomposition of each informative character in the sequence
matrix or on sequential introduction of inner branches between components of tightly
connected nodes (Bandelt et al. 1999).
Human mtDNA mutation rate calibration
Calibration of the molecular clock is another crucial moment in any DNA sequence
data based phylogenetic study. Several approaches have been taken to obtain reliable
relation between sequence diversity and timescale. All of them are based on
assumptions that can be quantitatively checked, like (i) constant rate in different
lineages, (ii) neutrality of the mutations being used.
Human mtDNA mutation rate has been calculated using three approaches. Firstly, if
the colonisation time of a given geographically isolated region is well known, by
means of archaeology for instance, one can calibrate the molecular clock by analysing
genetic variation specific to the populations inhabiting the region. By examining the
extent of diversity within human mtDNA lineage clusters specific to New Guinea,
Australia and the Americas, the mean rate of mtDNA divergence (twice the
substitution rate) has been calculated to be between 2-4% for the whole mtDNA
molecule (Cann et al. 1987; Torroni et al. 1994c; Wilson et al. 1985) and for
transitions in a HVS-I segment (16,090-16365) about 36% (Forster et al. 1996) per
million years.
The second approach has been the outgroup or inter-species calibration method. Here
the split between related species, time of which is estimated from paleontological
evidence, is related to the sequence diversity between the given species. On the basis
of fossil record the divergence time for African apes is estimated to be about 13
million years (MA). From this estimate it has been deduced that the
human/chimpanzee split occurred 4,9 MA ago (Horai 1996). Going further, the
genetical distance between humans and chimpanzees was used to calibrate the rate of
the standard stretch of 360 bps in HVS-I (Ward et al. 1991), yielding the divergence
rate of 33% per MA. For the whole control region, with a total of 751 nps, 23% per
MA of divergence has been estimated (Stoneking et al. 1992).

7
Thirdly, pedigree studies can be used to measure the extent of genetic differentiation
within a set of samples with known genealogy. Initially these studies ended up with
unrealistically fast rates, like 260% divergence per MA (Howell et al. 1996; Parsons
et al. 1997). By now pedigree studies have yielded results close to those discussed
above (Bendall et al. 1996; Jazin et al. 1998; Soodyall et al. 1997).
Population demography and mismatch distributions
Mismatch distribution (Harpending et al. 1993) is a frequency distribution of
distances between all possible pairs of sequences in a dataset. If a population is going
through demographic expansion it probably looses little of its genetic variation.
Moreover, new mutations have higher possibility to get fixed. In contrast, when
population size over a time period is constant or decreasing, less variation is preserved
and new mutations fix with lower probability, as many lineages are lost. Given the
random nature of mutation cumulation, the frequency distribution of pairwise
distances should be unimodal and fit the Poisson process in the former case but multi-
modal or “bumpy” in the latter case. Simplistic correlating of mismatch distributions
and population demographic history can be, however misleading as actual population
demographic histories are usually mixes of different components: expansions,
bottlenecks and stabile phases, fusions and splits.
The Properties of mitochondrial (mt)DNA
Most eukaryotic cells have mitochondria, which are cellular organelles of
endosymbiotic origin (Margulis 1975; Grace 1990; Behnke 1977) tracings their roots
in a putative (proto)- α-proteobacter more than a billion years ago. Mitochondria are
responsible for energy supply to the cell and thus are often referred to as “work-
houses” of the cell. Through the process of oxydative phosphorylation they produce
adenosine triphosphate (ATP), which is the main energy transfer molecule of the cell.
During eons of evolution most of mitochondrial genes have moved to nucleus. Thus,
mitochondria have been left with a relatively small genome, with a total length of
only 16 569 bp in humans, for example.
It is important to stress that mitochondrial genomes of different phyla often exhibit
fundamentally different traits. Those of plants, for instance, are in several important
8
aspects quite different from those typical for higher Metazoa. As discussed below by
the example of human mtDNA, mitochondrial genomes of vertebrates are generally
small, do not recombine and have relatively high mutation rate. Mitochondrial
genomes of plants are larger, with slow mutation rate and do recombine. Moreover,
plant mitochondrial genomes are transcribed using the universal genetic code (UGC),
while information in vertebrate mitochondrial genomes is decoded using alternative
codes (not much, but still different from the UGC). Therefore, it is important to
emphasize that from here on we restrict ourselves to discussion of strictly human
mtDNA characteristics.
Human mtDNA does not have introns and has only a limited space for noncoding
intergenic regions. The only exceptions are the noncoding displacement loop (D-loop)
region with the range of 1122 bp (nps 16 024-00576) and the V region between the
genes for cytochrome oxydase subunit II (COII) and tRNALys (Anderson et al. 1981).
The coding regions consist of 2 rRNA, 22 tRNA and 13 peptide genes. Mitochondrial
genome differs slightly in codon usage from that used in nuclear genes (reviewed by
(Jukes and Osawa 1990).
Several properties of mtDNA make it a valuable tool for phylogenetic studies.
Fast mutation rate of mtDNA
One of the main advantages of mtDNA for reconstructing human phylogenies is its
fast mutation rate (Wilson et al. 1985). MtDNA diverges at the rate of 2-4% per
million years (Torroni et al. 1994c; Cann et al. 1987), which is on the average 10 to
100 fold faster than the rate in the nuclear genome.
Mutations in DNA accumulate over time. Thus, the faster the mutation rate the shorter
the time period needed for enough mutations to accumulate to resolve a phylogeny.
Evolutionary rate of mtDNA is suitable for tracing the evolution of anatomically
modern humans during the past 150,000 years (Stoneking 1994). Yet, a problem
concerning phylogeny reconstruction is also raised by faster mutation rates - multiple
hits on the same sites. This results in possibility of drawing millions of most
parsimonious phylogenetic trees from a data set of approximately 100 sequences
(Cann et al. 1987; Templeton 1992; Vigilant et al. 1991).

9
As already mentioned, the mutation rate of mtDNA is far from being uniform for the
whole genome. Moreover, regarding the control region alone, it has been noted that
besides 20-30 fold transitional bias the rate variation between sites is also
significantly high (Excoffier and Yang 1999; Hasegawa et al. 1993; Ohno et al. 1991;
Wakeley 1993). Transitions at sites like 16093, 16129, 16209, 16311 and 16362 from
HVS-I and 00146, 00150, 00152 and 00195 from HVS-II occur in many different
lineages and these sites can be considered as mutational hotspots (Hasegawa et al.
1993; Wakeley 1993; Gurven 2000; Stoneking 2000). The variation of mutation rate
is higher in HVS II, where one finds a few sites where substitutions occur very often
(observed frequently in different lineages), while most of HVS-II shows rather little
sequence variation (Aris-Brosou and Excoffier 1996). Rate variation can be taken into
account in phylogenetic homoplasy solving by giving different weights to sites
according to known rate variation (Helgason et al. 2000; Richards et al. 1998).
Maternal inheritance and lack of recombination in mtDNA
Human mtDNA is inherited maternally (Giles et al. 1980) and therefore does not
follow the rules of Mendelian inheritance as autosomal chromosomes do. A
phylogeny of human mtDNA is indeed a phylogeny of human maternal lineages.
The mechanism of paternal mtDNA elimination is not fully understood. Firstly, one
has to realise that the number of mitochondria in an oocyte is many hundred times
higher than that of a sperm (Michaels et al. 1982). That alone would make paternal
inheritance of mtDNA very limited. It has been shown that, in intra-species crosses of
mice paternal mtDNA is selectively eliminated (Kaneda et al. 1995). One of the
signals for the destruction of paternal mtDNA is argued to be the ubiquination of the
mid-piece of sperm (Hopkin 1999). Nevertheless leakage of paternal mtDNA in inter-
species crosses of mice has been detected (Gyllensten et al. 1991). Moreover,
Awadalla and colleagues argued that, as linkage disequilibrium in human and
chimpanzee mitochondrial DNA declines as a function of the distance between sites
on the molecule, recombination must occur (Awadalla et al. 1999). As response to
these speculations it was concluded that, likely errors in the sequence data used by
Awadalla, incorrectly calculated tests for significance and the possibility that
straightforward phylogenetic explanations can explain the observed correlations make
the arguments raised by (Awadalla et al. 1999) weaker than would be needed to prove
10
recombination in human mitochondria (Kivisild and Villems 2000; Jorde and
Bamshad 2000; Kumar et al. 2000). Recombination of mtDNA is common among
plants, protists and fungi, but has not been detected among higher Metazoan (Cann et
al. 1984; Lunt and Hyman 1997; Merriwether et al. 1991; Olivo et al. 1983).
Maternal inheritance and lack of recombination lower the effective population size
(Ne) of mitochondrial genome compared to that of any autosomal nuclear locus.
Smaller Ne increases the sensitivity of mtDNA diversity to fluctuations of population
size (random genetic drift) but, meanwhile, enables to detect bottlenecks that are not
necessarily apparent in following frequencies of nuclear markers with a three- (X
chromosome) or four-fold higher Ne. And there is another important consequence
deriving from a four-fold larger effective population size for autosomal genes: in
average, they coalesce in time depth, four times deeper than that for mitochondrial
genome. Taking, very approximately, the coalescence age for the mtDNA equal to
200,000 years, it gives nearly a million years for nuclear genes. It means that certain
questions, like sharing/not sharing gene lineages with Neanderthals would not be
sensible to be asked at the level of nuclear genes, since a likely divergence of AMH
and Neanderthals has occurred more recently than the coalescent of an average
nuclear gene.
Hetero- and homoplasmy
Somatic cells contain 103 – 104 mitochondria, genomes of which could be identical
(homoplasmy) or alternatively two or more subpopulations of mitochondria with
slightly polymorphic genomes may exist (heteroplasmy). Heteroplasmy could be
observed in terms of one mitochondrion, one cell or up to the total population of
mitochondria of an entire organism (reviewed by (Lightowlers et al. 1997).
At least for non-coding regions, in nonmitotic tissues, heteroplasmy is the usual state
of mitochondria (Jazin et al. 1996), as mutations are accumulating during organism
ageing. In fact, due to the lack of recombination and clonal inheritance, mildly
deleterious mutations in mtDNA can fixate by chance, effect known as Muller’s
ratchet (Muller 1964, Lynch 1996). This causes decrease in the fraction of
functionally active mitochondria (Piko et al. 1988).

11
In the context of disease, heteroplasmy is well studied (reviewed by e.g. (Wallace
1999). Less is known on the subject of segregation and fixation of heteroplasmic
mtDNA. Segregation could result in complete swhich to the new mtDNA variant
within a single generation, as seen in Holstein cows (Hauswirth and Laipis 1982;
Koehler et al. 1991), or alternatively heteroplasmy could be inherited to the next
generation. For example, the phenomenon of heteroplasmy was used to detect the
remains of the Romanov family (Gill et al. 1994).
The extent of the bottleneck in the mtDNA population during early stages of the
oogenesis is of key importance. The segregation occurs in the expanding oogonial
(primordial germ cells) cell population (Jenuth et al. 1996). Calculated numbers of
segregation units range from 3-20 (Bendall et al. 1996) to ~200 (Jenuth et al. 1996).
In case of intraorganellar heteroplasmy, the segregation is less rapid (Meirelles and
Smith 1997).
Trees of individuals
The properties of mtDNA mentioned above, with the given restrictions, allow one to
reconstruct genealogies of individuals through maternal descent. These options for
‘trees of individuals’ make mitochondria profoundly different from markers whose
variation is expressed in allele frequencies only and/or evolve too slowly for revealing
genealogies through their mutational pattern - a shortcoming what can be
compensated only by much larger sample sizes, not to add that recombination in
nuclear genes may easily distort any attempts to reconstruct a reliable within-a-
species gene tree.

12
India
Some general issues
India is a vast and highly heterogeneous region. The current population size exceeds 1
billion and is growing faster than that in China. The major division is linguistic: the
most numerous are Indo-European speakers, followed by Dravidian speakers in the
south and a smaller number of speakers of Austro-Asiatic (Austric) and Sino-Tibetan
languages (see further “Linguistical data”) dispersed mainly in the eastern parts of
India.
Many studies on “racial classifications”, especially from the first half of 20th century,
have been put forward with regard to the origin of the present-day ethnic groups in
India. Though, largely contradictory, all agree on the existence of several ethnic
groups with distinct morphological features. A rather simple classification by
(Malhotra 1978) is provided below (taken from (Papiha 1996)). It has to be stressed
that, by now genetic studies have refuted the basis of racial subdivision of human
species (“human race”).
• Negrito bearing some physical similarity to Australian Aborigens and
Melanesians
• Negroid tribes vaguely resembling Africans and Negritos
• Australoid or Proto-Australoid
• Europoid or Caucasoid
• Mongoloid
The population of India is also socially structured into a large number of religious
groups. Majority of Indians are Hinduists (82%) and the largest minority religion is
Muslim (12%). Other minority religions include Christianity, Buddhism and Jainism,
along with Sikh and Parsi religions.
Within each linguistic and religious group sociocultural and biological characteristics
delineate numerous endogenous ethnic groups. These ethnic groups fall into broad
categories of castes and tribes. Outline of the social structure of Indian populations is

13
given in Figure 1. This scheme is further complicated by territorial affiliation of
various tribes and caste groups.
Figure 1. Social organization of Indian population groups (Papiha 1996).
An important part of populations in India are the tribals (~7%), officially called
Scheduled Tribes, who are spread over many regions all over India (though not
uniformly) accounting some 7% of the total population (Fig 2). Tribals may represent
relic populations or intrusive populations, whose origin is in some cases known to
some extent (Singh 1997).
Archaeological data
Archaeological and paleoanthropological records for India are scanty and limited in
details. Thus, it is not clear yet when did modern humans first inhabit the
subcontinent. As it is the case for the rest of Eurasia, earlier hominid species inhabited
India before the immigration of modern humans. Tool-using Homo erectus
populations have been in India for over 0.5 MA. The earliest skeletal evidence comes
from an undistorted cranial vault, referred to as Narmada Man (Sonakia 1984), which
has been dated to between 0.2 and 0.7 MA. It has been proposed, that the Narmada
Man is indeed an archaic Homo sapiens rather than a Homo erectus (Kennedy et al.
1991). Recently, a Middle Pleistocene hominid clavicle was

14
Figure 2. The provinces of India with approximate local densities of tribals (people
who are outside the cast system) (Cavalli-Sforza et al. 1994).
discovered from the same deposit that previously yielded the Narmada Man
(Sankhyan 1997).
The time period around 30,000-50,000 BP, when the first signs of modern humans
can be traced in Eurasia (Smith et al. 1999) has revealed both Middle (up to around
20,000 BP) and Upper Palaeolithic (starting from ca 30,000 BP) tool assemblages in
India (Joshi 1996). (Fig 3 (Gadgil 1997 and references therein)) It has been suggested
that these sites fall in two groups, the northern sites showing affinities with the
Mousterian tool industries of Europe, while the southern sites show cultural
antecedents in upper Palaeolithic (Gadgil 1997).

15
So far the earliest fragmental skeletal evidence (at ca 34,000 C14 BP) of anatomically
modern humans comes from Sri Lanka (Kennedy et al. 1987; Deraniyagala 1998).
Note that this island was at that time connected with the continent.
Next important events on the Indian archaeological scene are the beginnings of
cultivation and pottery use (Gadgil 1997 and references therein) (Fig.4). Cultivation
of plants may have reached India simultaneously, around 6000 BP, from two different
directions: the mid-east and southeast Asia. The steady advance beyond this stage
seems to have been primarily driven by the crop-animal complex derived from the
mid-east, reaching the tip of southern India some 4000 years later, around 2000 BP.
Data on the diffusion of pottery traditions, which arose in response to the need to store
and cook grain, is also not conclusive but indicates similarly two origins, to the
northwest and northeast of India while the western influence seems to predominate
over much of the country. Black and Red Ware reflects western, while the Corded
ware eastern influence (Gadgil 1997 and references therein).
Figure 3. Major Middle Palaeolithic
archaeological sites in India (Gadgil
1997)
Figure 4. Contours of earliest dates
of definite evidence of cultivation of
crops in India (Gadgil 1997).

16
Linguistic data
Nearly all languages spoken in India can be assigned to one of four major language
families – Austro-Asiatic (Austric), Dravidian, Indo-European and Sino-Tibetan.
There are though, a few, which, cannot be assigned to any family. Nahali, a tribal
language of Central India and Burushaski, spoken by a small group of people, the
Hunzas numbering around 40,000, of Pakistan and Afghanistan are two such.
An excellent information base on the languages and indeed on many other cultural
traits of the vast number of different ethnic communities in India is provided by the
People of India project of the Anthropological Survey of India (published in 48
volumes). This project recognises the entire Indian population in 4635 ethnic
communities and puts together detailed information on each of them through
interviews of over 25,000 individual informants spread over all districts of India,
along with compiling information from a variety of published sources (Joshi 1993).
Table 2 shows the worldwide distribution of the four language families present in
India.
Table 2
Worldwide distribution of the four language families present in India.
Austro-Asiatic (Austric) Southeast Asia, eastern and central India
Dravidian South and central India, Pakistan, Iran
Indo-European Europe, West Asia, North, western and
eastern India
Sino-Tibetan China, Southeast Asia, India bordering
Himalayas
The geographical range of distribution of Austro-Asiatic, Indo-European and Sino-
Tibetan speakers is extensive; India harbours only a minority of the languages within
these families. The geographic range of distribution of Dravidian languages is
however restricted largely to India; there are only two outlying populations - Brahui
in Baluchistan and Elamic in Iran. Moreover, not all researchers do support the

17
association between Elamic and Dravidian languages. Therefore one might speculate
that, Dravidian languages might have developed within India (Gadgil 1997).
Most of Austro-Asiatic speakers (>98%) live in southeast Asia. All Austro-Asiatic
speaking communities in India live as hunters-gatherers and/or practice low input
shifting cultivation.
Sino-Tibetan speakers of India also include many tribal groups, though they also
include communities like Maites of Manipur valley practicing advanced agriculture.
Their concentration is highest along the Himalayas; only one community of West
Bengal has reached mainland India. Many of them report having moved into India
from Myanmar or China within last few generations.
Most of the Indian mainland populations are Dravidian and Indo-European speakers.
Both include communities at all economic levels from tribals to the most advanced
cultivator, pastoral, trader or priestly groups. Many of the technologically less
advanced amongst these communities such as Dravidians speaking Kanis of Kerala or
Indo-European speaking Bhils of Rajasthan may have acquired these languages in
more recent times through the influence of the economically more advanced
mainstream societies. It is however notable that while there are several Dravidian
speaking forest dwelling tribal communities such as Gonds or Oraons in a matrix of
technologically more advanced Indo-European speaking communities, there are no
enclaves of forest dwelling tribal Indo-European speakers surrounded by more
advanced Dravidian speaking communities. The tribal Indo-European speakers of
south India are all nomadic communities such as Banjaras or Pardhis (Indian Gypsies)
with known history of migration from Rajasthan to south India in recent centuries.
Some researchers argue that, this is strongly suggestive of the Dravidians being older
inhabitants of the Indian subcontinent, and that they have been pushed southwards,
surrounded by or converted to Indo-European languages by later arriving Indo-
European speakers (Gadgil 1997 and references therein).
18
Data obtained from studies using “classical” markers.
The essence of “classical“ (“pre-DNA”) genetics lies in the geographical mapping of
allele frequencies. Despite the huge amount of gathered data, the “classical era” raised
many basic problems, leaving them largely unsolved.
28 better-studied Indian populations are included in the monumental study of Cavalli-
Sforza and colleagues (Cavalli-Sforza et al. 1994), where the authors compile and
analyse vast amount of the “classical” genetic data. These cover Dravidian and Indo-
European speakers as well as few reasonably well analysed smaller groups (incl.
Tribals). Based on their findings they propose, that there are at least four major
components of the genetic structure of India.
• The first component (Australoid or Veddoid) is an older substrate of
Paleolothic origin, which could be represented today by a few Tribals.
• The second component represents a putative major migration from western
Iran that began in the early Neolithic times and consisted of the spread of
early farmers of the eastern horn of the Fertile Crescent. Indeed, several
varieties of wheat and other cereals reached India at this time. It is argued,
that this immigration wave brought the Dravidian language speakers. This
hypothesis is also supported by linguistically based suggestions of a recent
common root for Elamite and Dravidic languages (Diamond 1997;
Renfrew 1989).
• The third component is, according to them, composed of the most
important later arrival - the Indo-European speakers - the Aryans, who are
claimed to have entered India about 3500 BP from their original location
north of the Caspian see, via Turkmenia and northern Iran, Afghanistan
and Pakistan.
• The forth component is the most diverse one and is probably a result of
many migrations and infiltrations from the east and northeast. This
component is said to be represented today by some Austro-Asiatic and
Sino-Tibetan speakers.

19
As expected this classification is far from being the only one. Some argue that people
of India cannot be classified into a fixed set of ethnic categories (Majumder 1990).
In genetic distance trees based on classical genetic markers Indians cluster more
closely with western Eurasian populations than with either other Asians or Africans
(Cavalli-Sforza et al. 1994).
Another significant summary of the numerous genetic studies on the populations of
India is provided by Surinder S. Papiha (Papiha 1996). He concludes, that tribal
populations are in general well differentiated from the nontribal castes or
communities. Genetic differentiation among nontribal communities and occupational
castes is slight, but the subpopulations of each nontribal group of different provinces
demonstrate considerable genetic diversity.
MtDNA variation in Indian populations
As we start discussing mtDNA variation in India, a brief look into the basic topology
of the worldwide human mtDNA tree is worthwhile (Fig. 5, Fig. 1 in Supplementary
material). All mtDNA lineages outside Africa are derivatives of an African mtDNA
super-cluster L3, supporting the hypothesis of a recent African origins of anatomically
modern humans and the replacement of any pre-existing hominid species in Eurasia.
This fundamental conclusion is now well supported also by Y-chromosomal (e.g. (Ke
et al. 2001) and autosomal DNA (e.g. (Tishkoff et al. 1996) evidence.
As well as geographically, India seems to be a genetic midpoint between eastern and
western Eurasia, sharing mtDNA haplogroups with both regions. Haplogroup M,
defined by a combined presence of a DdeI site at 10394 and AluI site at 10397
(Ballinger et al. 1992), is the most frequent mtDNA cluster found among Indian
(Passarino et al. 1996a; Passarino et al. 1996b; Bamshad et al. 1997; Kivisild et al.
1999a; Kivisild et al. 1999b; Kivisild et al. 2000; Bamshad et al. 2001) and East Asian
(Ballinger et al. 1992; Chen et al. 1995; Horai et al. 1996) populations, but is nearly
absent in west Eurasian populations (Richards et al. 1998; Kivisild et al. 1999b;
Kivisild et al. 2000; Richards et al. 2000). M frequency in Central Asia is close to that
in India and in eastern Asia (deduced by (Kivisild et al. 1999b) from (Comas et al.
1998)

20
Figure 5. General backbone of the global mtDNA tree. Colours of spheres indicate
population groups as follows: blue – Africans; yellow – east Asians and native
Americans; red – Indians and green – western Eurasians. The diameter of the sphere
depicts the relative frequency of the haplogroup. Note that all non-African lineages
arise from one African mtDNA cluster. Adapted from (Kivisild et al. 1999a).
and (Kolman et al. 1996). Indian haplogroup M sub-structure differs profoundly from
that observed in East Asian populations, where haplogroups D, E, G, C, Z constitute
the bulk of M lineages, while a number of Indian-specific M lineage clusters can be
defined (Quintana-Murci et al. 1999; Kivisild et al. 1999b; Bamshad et al. 2001).
Indian M is further characterised by relative abundance of lineages arising from the
central M node (M*). General structure of haplogroup M in India and eastern Asiais
given on Figure 6. The coalescence times of East Asian and Indian haplogroup M
lineages have been estimated to be around 56,000 – 73,000 BP and 65,000 BP;
41,000-55,000 BP; 47,000 BP (Wallace 1995; Chen et al. 1995) and

21
Figure 6. A HVSI sequence variation based tree of haplogroup M structure in some
key populations. The tree is pruned to the basic clusters indicating differential
subhaplogroup distribution. Colours specify populations and sphere sizes correspond
to subhaplogroup frequencies. Figure is based on our and a large number of published
data.
(Mountain et al. 1995; Passarino et al. 1996a; Kivisild et al. 1999b), respectively. This
suggests that Indian and East Asian lineages started to expand separately but
simultaneously and since then, there has been only very limited gene flow between
India and eastern Asia. Major Indian-specific M subclusters have a starlike topology
and their expansion phases range between 17,000-32,000 years, suggesting another
demographic expansion in South Asia triggered, perhaps, either by climatic change
and/or by the spread of a new Palaeolithic industry (Kivisild et al. 1999b). The lack of
any signs for extensive re-migrations of eastern Asians to India is further stressed by
the scarcity of mtDNA lineages belonging to haplogroups A, B and F in India, which
are frequent in neighbouring eastern Asian populations (Fig. 7) (Kivisild 2000).
Around 85% of Turk and Central Asian M lineages can be assigned to known eastern
Asian-specific subhaplogroups of M (Bamshad et al. 2001) that are virtually absent in

22
Figure 7. Partial mtDNA tree drawn from the central node R (see Fig. 5). Note the
differential spread of U subclusters among Indians and west Eurasians. Colours
specify populations and sphere sizes correspond to subhaplogroup frequency. Figure
is based on our and a large number of published data.
India. This suggests that no large-scale migrations from Central Asia to India has
occurred.
Phylogeographically, the distribution of haplogroup U is a mirror image of that for
haplogroup M: U is not present in eastern Asia, but is frequent in European
populations and among Indians (Kivisild et al. 1999a), being the second most frequent
haplogroup in both areas. This reverse analogy goes further: Indian U lineages differ
substantially from those observed in Europe (Fig. 7). Most of the Indian haplogroup U
lineages coalesce to a founder haplotype (U2i), which dates back to around 53,000
years (Kivisild et al. 1999a). This estimate falls to the same period when the
European-specific U5 lineages started to diverge, around 52,000 years ago (Richards
et al. 1998).

23
All major West Eurasian-specific mtDNA haplogroups (H, T, J and U) as well as the
two major eastern Asian-specific haplogroups B and F derive from a common internal
node R (R*) (Macaulay et al. 1999). Apart from U, the other defined haplogroups
derived from this node are largely unaccounted for in India Instead, a large variety of
“non-canonical” Indian-specific derivatives of the R node are present, with the
coalescence age at about 55,000 BP (Kivisild et al. 1999b). Such lineages may be
present also east of India, but sadly Myanmar, Thai, Laos etc. are still poorly studied.
MtDNA data collected thus far does not support the “traditionally” held theory
(Poliakov 1974; Thapar and Rahman 1996; Renfrew 1989) of a recent (around 4000
BP) large-scale Indo-Aryan invasion into India. Some initial mtDNA studies
(Barnabas et al. 1996; Passarino et al. 1996a) favoured this view mainly due to limited
amount and depth of data. With more information available, it was shown that only
less than 10% of Indian mtDNA lineages could be ascribed to relatively recent
admixture with western Eurasians (Kivisild et al. 1999a). Moreover, the arrival of
these lineages was estimated to have occurred about 9000 years BP. This date,
however, is an average over a number of different West Eurasian donations to the
Indian gene pool. Yet, it is more consistent with the time when domesticated cereals
could have reached India from the Fertile Crescent than with later, the Bronze Age
migrations (Kivisild et al. 1999a).
One of the most important divisions in India is linguistic: Hindi and Dravidian. The
primary clustering of mtDNA lineages though, is not language-specific (Fig. 8)
(Kivisild et al. 1999a; Bamshad et al. 2001). A study, where 644 samples,
encompassing 23 ethnic populations from different regions of India, were typed for
haplogroups M, U, A and D, revealed that, 90% of the mtDNA diversity is between
individuals within populations; there is no significant structuring of haplotype
diversity by socio-religious affiliation, geographical location or linguistic affiliation
(Roychoudhury et al. 2000). Bamshad and colleagues in contrary have shown that
differences in social rank between castes correspond to mitochondrial DNA distances
between castes but not genetic distances estimated from Y-chromosome data
(Bamshad et al. 1998). The genetic origins of Indian caste populations were further
analysed recently in a much more detailed study (Bamshad et al. 2001).
Contemporary caste populations of differing rank (i.e., upper, middle and lower) were

24
Figure 8. HVS I sequence variation based network of haplogroup M lineages between
Hindi and Dravidic speakers in India. Asian specific lineages are indicated by yellow
background (Bamshad et al. 2001).
compared to worldwide populations by analysis of: (i) mtDNA HVS-I sequence and
14 restriction-site polymorphisms (RFLP), (ii) 5 Y-chromosome short-tandem repeats
(STRs) and 20 biallelic polymorphisms and (iii) autosomal markers (1 LINE-1 and 39
Alu inserts). Altogether, over 600 Indian samples were included into genetic distance
analyses. All data types supported the same general yet not statistically significant
pattern: relatively smaller genetic distances from European populations and larger
genetic distances from Asian populations as one moves from lower to middle to upper
caste populations (Bamshad et al. 2001).

25
It is often speculated that the tribal populations (especially the Austro-Asiatic
speakers in the east and Dravidian-speaking tribes in the south) of India might be the
relics of the first wave of the anatomically modern human immigration to India
(Papiha 1996; Cavalli-Sforza et al. 1994). So far, mtDNA studies have revealed no
grounds for such speculations. The lineages present in tribals fit well into the
framework of the variation seen in non-tribal groups (Kivisild et al. 1999a) (Kivisild
et al. manuscript in preparation). It has to be noted, though, that no detailed mtDNA
study on Austro-Asiatic speaking tribals has been published yet.
Although quite a number of extensive studies on mtDNA variation among Indian
populations have been conducted and many general observations are standing on a
solid ground, given the number of distinct populations in India together with the
complexity of the emerging picture, further research is clearly needed.
26
Part II: Experimental study

27
Objectives In the centre of the DNA era of human demographic history studies lies the African
exodus and the colonisation of the rest of the world. Indeed, while one may already by
now to submerge into fine details of the colonisation of, e.g. Polynesia by humans – a
rather recent event - we know but little about the very beginning of the process – from
the time, when likely the very diversity of the present-day human mtDNA outside of
Africa started to take shape. Considering both archaeological facts and less precise
observations, a very early colonisation of New Guinea and Australia by AMH is
highly likely, and, therefore, there is not much to wonder that Indians may in many
ways serve as a key for understanding these processes, which have occurred at least
50,000 BP or even significantly earlier: how else people could reach the Far East,
unless passing India? It is at least a good guess. Hence, population genetics studies of
the contemporary Indians can be considered useful - necessary to perform anyway - in
the attempts to reconstruct the process of the out of Africa spread of modern humans.
And although information on Indian maternal and paternal lineages has become to
accumulate in increasing pace, taking into account the huge number of endogamous
populations in India and the complexity of the emerging picture, detailed DNA
variation studies of hitherto uncharacterised populations are clearly worthwhile to
carry out. In particular those, targeted to tribal groups: as one may recall from the
literature review chapter of this study, there are authors who believe that among them,
ancient gene lineages may have preserved the best.
Five Indian populations (Lodha, Bhoksa, Tharu, Kanet and Kurmi) are surveyed here
for mtDNA variation. The populations are chosen in order to compare mtDNA
variation between geographical regions as well as on social axis. The dispute over
indigenous inhabitants of South Asia has largely been an open question while tribals
and Austro-Asiatic speakers in particular have most often collected the fame. Here we
test this conjecture by comparing mtDNA lineages of Austro-Asiatic Lodha to those
of other tribals and caste groups. Gene flow from adjacent geographical areas will be
followed and defining new lineage groups will hopefully refine classification of
Indian-specific mtDNA lineages.
28
A Note
The present study is centred on the five specific populations indicated above.
However, it is not limited to them: much of the general analysis is based on our
already published data or obtained during this study additional results, covering
much larger variety of Indian populations and serving here as a “background”, in
fact essential for basic conclusions to be drawn. Because most (though not all) of
these results are by now published as articles, where the author of this thesis is a co-
author, we found it unjustified to include details of these investigations into the main
text of the present study, not to add that the published papers reflect the contribution
of different investigators and laboratories. Neither are many specific problems
addressed in these articles relevant here. Therefore, reprints of the published papers
are added simply as a supplementary material.

29
Materials and Methods
The Samples
The samples used in this study were collected from four scheduled tribes (Lodha
n=56, Bhoksa n=23, Tharu n=36 and Kanet n=34) and one social community (Kurmi
n=55) from West Bengal and Northern regions of India. (Fig. 9). Some of the
samples, namely Bhoksa, Tharu, Kanet were sent to us as purified DNA and some
(Lodha, Kurmi) as bloodstains.
S. Mastana and S.S. Papiha kindly provided all the samples.
Figure 9. Geographic location of the studied Indian populations.
The Kanet are a tribal population in the Kinnaur district of Himachal Pradesh and
make up most of the districts population. In (Singh 1997) all the inhabitants of the
Kinnaur district are referred to as scheduled tribe Kinnaura, Kinnara or Kinnaurese.
The two major social groups of the Kinnaura are the Khosia and the Beru. The Khosia

30
are Rajput and are also known as Kanet, Khash or Khasa. They own land and are
agriculturists.
The Kinnaura speak the Kinnauri dialect, which belongs to the Himalayan group of
Tibeto-Burman family of languages. They use different local dialects of the Indo-
Aryan language Himachili for inter-group communication. The Kinnaura religion is
an admixture of Buddhism and Hinduism. The traditional occupations of the Kinnaura
are agriculture, trade and sheep rearing, which they continue till today. ~70% of the
workers are cultivators. The total population of the Kinnaura is ~48000 (1981 census).
(Singh 1997) pp. 533-534
The Lodha are a tribal population living mostly in western part of Midnapore district
of West Bengal were they are also known as Kheria and Kharia. To a lesser extent
they are also present in the Mayurbhanj and Baleswar districts of Orissa. The total
population of the Lodha is ~59000 (1981 census). Their mother tongue, lodha, is akin
to Savara, an Austro-Asiatic language. They are fluent in Bengali, which they use to
communicate with other communities (the Lodhas in Orissa also speak Oriya).
Traditionally the Lodhas have provided themselves by forest dwelling, hunting and
gathering (grass-rope making in Orissa). Of the 40% of workers among the Lodhas
40% are engaged in forestry, fishing, hunting, etc., and another 40% are agricultural
labourers. In Orissa the per cent of agriculturists is higher. Vast majority of the
Lodhas are Hinduists. ~17% claim to be Christians.
(Singh 1997) pp. 694-697
The Bhoksa are a Himalayan community (scheduled tribe) that inhabits the terai*
areas of Bijnor district of Uttar Pradesh and Dehradun, Nainital and Pauri Garhwal
districts of Uttaranchal. In Dehradun district they are also referred to as Mehre or
Mehra. They speak Hindi and write in Devanagari script. The total population of the
Bhoksa is ~32000 (1981 census).
The traditional and primary occupations of the Bhoksa are agriculture and animal
husbandry. Over 99% of the Bhoksa are Hinduists.
(Singh 1997) pp. 146-149
* a belt of marshy land at the foot of the Himalayas mountains: moderate climate,
dense to thin forests and medium rainfall, also tarai

31
The Tharu are a well-studied community (scheduled tribe) of Uttar Pradesh who live
close to the border of Nepal, and are widely dispersed in the Districts of Baharaich,
Gonda, Gorakhpur, Kheri (Lakhimpur) and Nainital district of Uttaranchal. Their total
population in India is ~96000 (1981 census). ~99% of the Tharus are rural. Most of
the Tharus live in southern Nepal (terai areas) where they number about 720,000. The
Tharu trace their origin to Rajput forefathers, who fled from the great battle described
in the epic Mahabharata. (For popular article on the Tharus see also: National
Geographic Magazine, September 2000). They inhabit the terai areas. Their mother
tongue Tharu belongs to the central group of the Indo-Aryan family of languages.
They use Hindi for inter-group communication and write in Devanagari script.
The Tharu are a landholding community with individual proprietorship of land. They
did hunt and gather food in the past, but presently they depend on settled cultivation.
Although nearly 100% of the Tharus are Hinduists, they use alcoholic beverages and
eat beef. Despite their patrilineal social system, women have property rights greatly
exceeding those recognized in Hindu society.
(Singh 1997) pp. 1137-1140
Apart from West Bengal The Kurmi are also concentrated in Bihar and UP where
they represented respectively 3.6 and 3.5% of the population in 1931. The Kurmi
generally work as cultivators and are looked at as middle caste peasants but they
claim to be Kshatriyas.
Treatment of bloodstains
Several discs of 3 mm diameter were cut from the bloodstains on Guthrie cards. The
discs were then vortexed in 1 ml of deionised water for 30 minutes (modification from
(Makowski et al. 1995). Following the aspiration of the water, the discs were
incubated in 100µl methanol for 15 minutes, after what the methanol was removed.
Next, 100µl 5mM NaOH/NaCl mix and 20µl EDTA (end concentration 0,2 mM) was
added. Mineral oil was added to protect the sample from evaporation while heating at
100ºC for 10 minutes. Then the samples were placed on ice. Method was developed in
our department by Jüri Parik.
All the samples were kept at -20ºC.
32
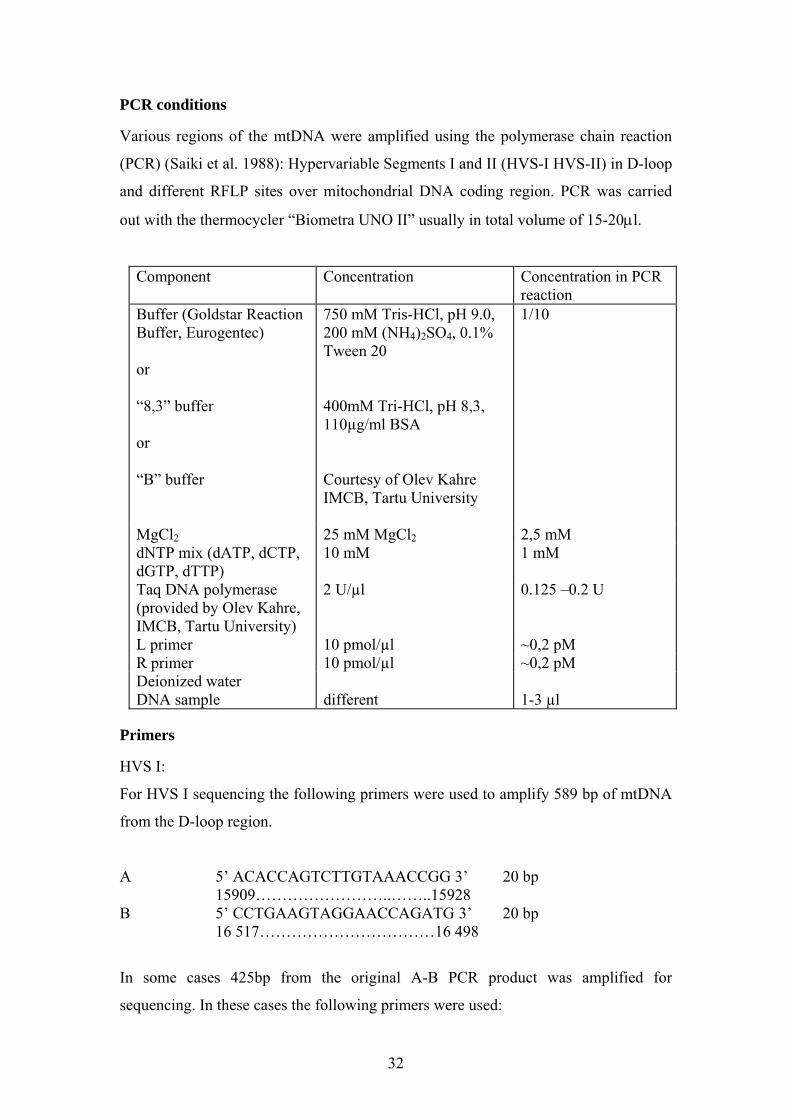
PCR conditions
Various regions of the mtDNA were amplified using the polymerase chain reaction
(PCR) (Saiki et al. 1988): Hypervariable Segments I and II (HVS-I HVS-II) in D-loop
and different RFLP sites over mitochondrial DNA coding region. PCR was carried
out with the thermocycler “Biometra UNO II” usually in total volume of 15-20µl.
Component Concentration Concentration in PCR reaction
Buffer (Goldstar Reaction Buffer, Eurogentec) or “8,3” buffer or “B” buffer
750 mM Tris-HCl, pH 9.0, 200 mM (NH4)2SO4, 0.1% Tween 20 400mM Tri-HCl, pH 8,3, 110µg/ml BSA Courtesy of Olev Kahre IMCB, Tartu University
1/10
MgCl2 25 mM MgCl2 2,5 mM dNTP mix (dATP, dCTP, dGTP, dTTP)
10 mM 1 mM
Taq DNA polymerase (provided by Olev Kahre, IMCB, Tartu University)
2 U/µl 0.125 –0.2 U
L primer 10 pmol/µl ~0,2 pM R primer 10 pmol/µl ~0,2 pM Deionized water DNA sample different 1-3 µl
Primers
HVS I:
For HVS I sequencing the following primers were used to amplify 589 bp of mtDNA
from the D-loop region.
A 5’ ACACCAGTCTTGTAAACCGG 3’ 20 bp 15909……………………..……..15928 B 5’ CCTGAAGTAGGAACCAGATG 3’ 20 bp 16 517……………………………16 498
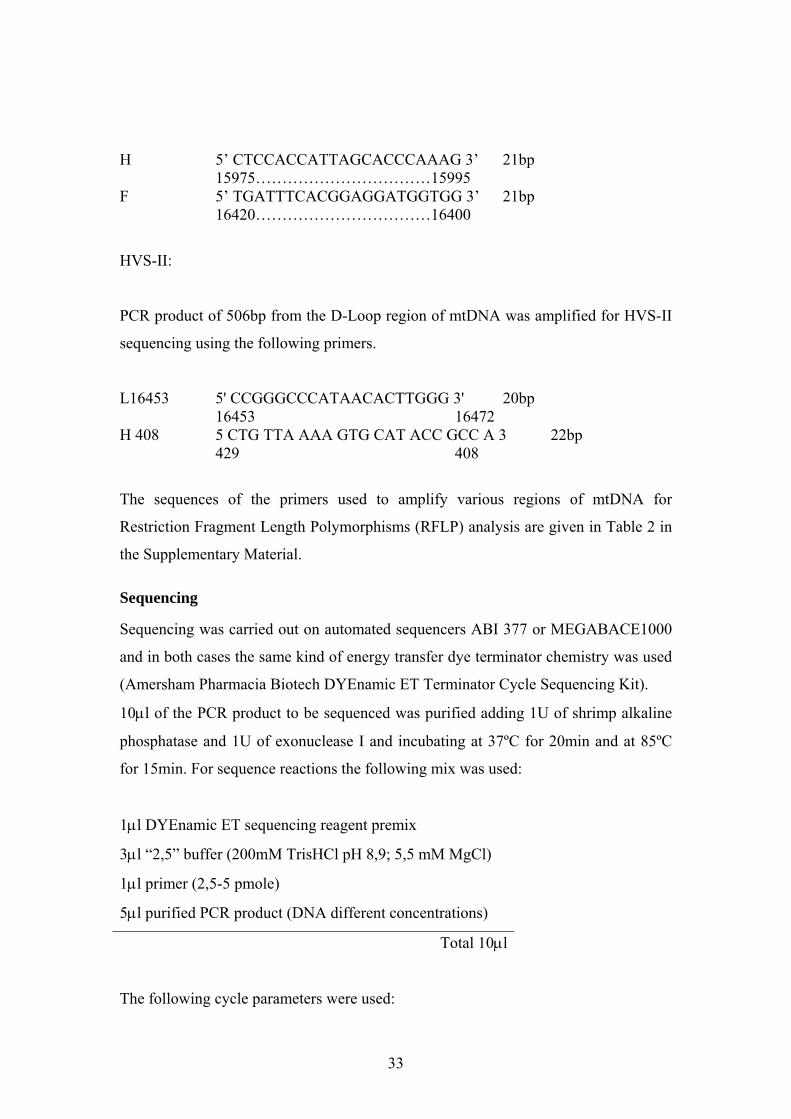
In some cases 425bp from the original A-B PCR product was amplified for
sequencing. In these cases the following primers were used:
33
H 5’ CTCCACCATTAGCACCCAAAG 3’ 21bp 15975……………………………15995 F 5’ TGATTTCACGGAGGATGGTGG 3’ 21bp 16420……………………………16400
HVS-II:
PCR product of 506bp from the D-Loop region of mtDNA was amplified for HVS-II
sequencing using the following primers.
L16453 5' CCGGGCCCATAACACTTGGG 3' 20bp 16453 16472
H 408 5 CTG TTA AAA GTG CAT ACC GCC A 3 22bp 429 408
The sequences of the primers used to amplify various regions of mtDNA for
Restriction Fragment Length Polymorphisms (RFLP) analysis are given in Table 2 in
the Supplementary Material.
Sequencing
Sequencing was carried out on automated sequencers ABI 377 or MEGABACE1000
and in both cases the same kind of energy transfer dye terminator chemistry was used
(Amersham Pharmacia Biotech DYEnamic ET Terminator Cycle Sequencing Kit).
10µl of the PCR product to be sequenced was purified adding 1U of shrimp alkaline
phosphatase and 1U of exonuclease I and incubating at 37ºC for 20min and at 85ºC
for 15min. For sequence reactions the following mix was used:
1µl DYEnamic ET sequencing reagent premix
3µl “2,5” buffer (200mM TrisHCl pH 8,9; 5,5 mM MgCl)
1µl primer (2,5-5 pmole)
5µl purified PCR product (DNA different concentrations)
Total 10µl
The following cycle parameters were used:
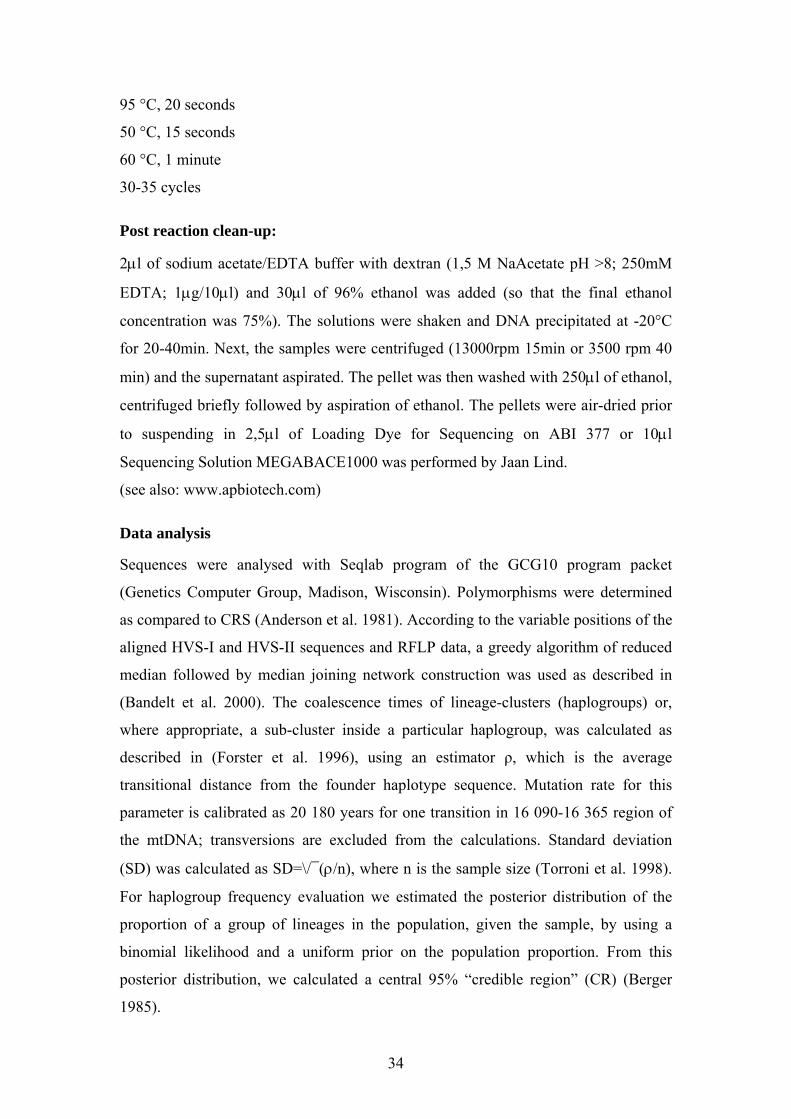
34
95 °C, 20 seconds
50 °C, 15 seconds
60 °C, 1 minute
30-35 cycles
Post reaction clean-up:
2µl of sodium acetate/EDTA buffer with dextran (1,5 M NaAcetate pH >8; 250mM
EDTA; 1µg/10µl) and 30µl of 96% ethanol was added (so that the final ethanol
concentration was 75%). The solutions were shaken and DNA precipitated at -20°C
for 20-40min. Next, the samples were centrifuged (13000rpm 15min or 3500 rpm 40
min) and the supernatant aspirated. The pellet was then washed with 250µl of ethanol,
centrifuged briefly followed by aspiration of ethanol. The pellets were air-dried prior
to suspending in 2,5µl of Loading Dye for Sequencing on ABI 377 or 10µl
Sequencing Solution MEGABACE1000 was performed by Jaan Lind.
(see also: www.apbiotech.com)
Data analysis
Sequences were analysed with Seqlab program of the GCG10 program packet
(Genetics Computer Group, Madison, Wisconsin). Polymorphisms were determined
as compared to CRS (Anderson et al. 1981). According to the variable positions of the
aligned HVS-I and HVS-II sequences and RFLP data, a greedy algorithm of reduced
median followed by median joining network construction was used as described in
(Bandelt et al. 2000). The coalescence times of lineage-clusters (haplogroups) or,
where appropriate, a sub-cluster inside a particular haplogroup, was calculated as
described in (Forster et al. 1996), using an estimator ρ, which is the average
transitional distance from the founder haplotype sequence. Mutation rate for this
parameter is calibrated as 20 180 years for one transition in 16 090-16 365 region of
the mtDNA; transversions are excluded from the calculations. Standard deviation
(SD) was calculated as SD=\/¯(ρ/n), where n is the sample size (Torroni et al. 1998).
For haplogroup frequency evaluation we estimated the posterior distribution of the
proportion of a group of lineages in the population, given the sample, by using a
binomial likelihood and a uniform prior on the population proportion. From this
posterior distribution, we calculated a central 95% “credible region” (CR) (Berger
1985).

35
Results
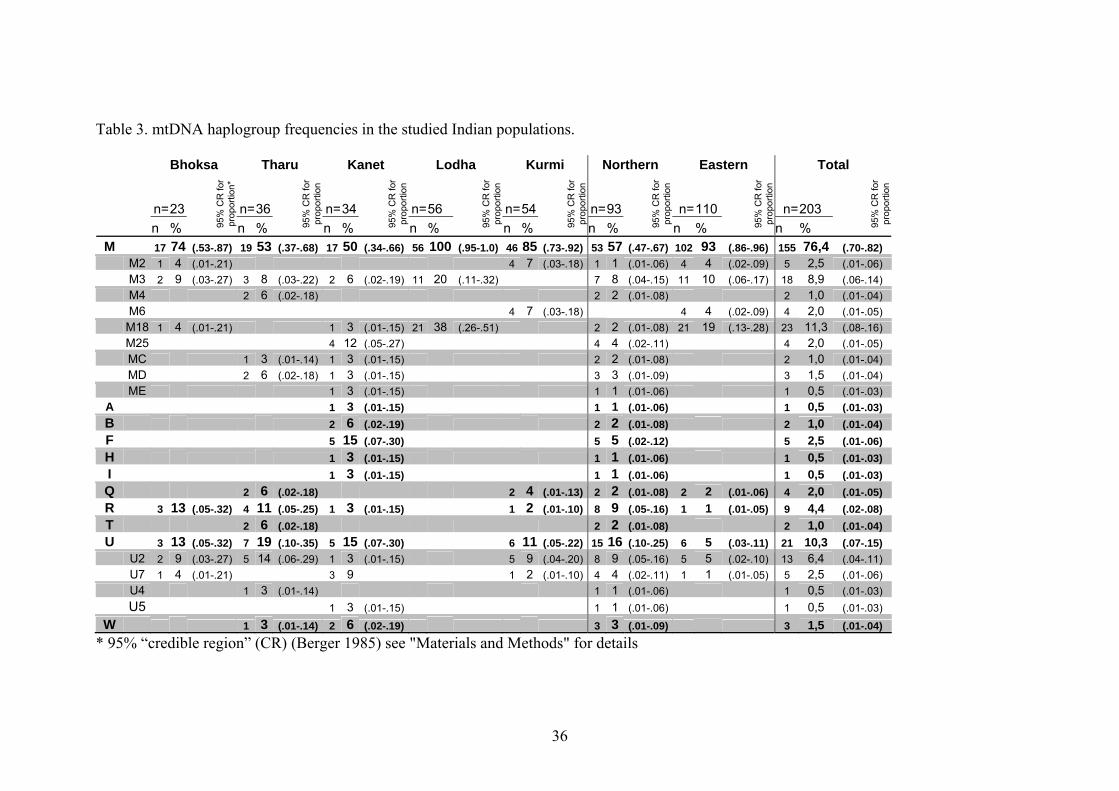
Table 3 presents the frequencies of the mtDNA haplogroups found in the studied five
populations (see also supplementary material for full data table). For better
characterisation of spatial differences in mtDNA lineages distribution in India, the
populations were grouped by their geographical origin: Kanet from Himachal
Pradesh, Tharu and Bhoksa from northern districts of Uttar Pradesh and Uttaranchal
as a northern group; Lodha and Kurmi from West Bengal as an eastern group. As
already established in several studies (Passarino et al. 1996a; Passarino et al. 1996b;
Bamshad et al. 1997; Kivisild et al. 1999a; Bamshad et al. 2001), the dominant
mtDNA lineage cluster in Indian populations is the Asian-specific M defined by gains
of DdeI and AluI restriction sites at np 10394 and 10397, respectively. An average
frequency of haplogroup Hg M in the studied populations was 76%, while the eastern
group showed considerably higher Hg M frequency than the northern one, 93% and
57%, respectively. All the Lodhas included in this study fall into Hg M. It should be
noted, however, that in another study where 32 Lodha mtDNAs were typed for Hgs M
and U, the corresponding frequencies were 82% and 18% (Roychoudhury et al. 2000).
In concordance with previous reports, the subclusters of Hg M found in our study
were largely Indian-specific (Quintana-Murci et al. 1999; Kivisild et al. 1999b;
Bamshad et al. 2001). Eastern Asian M derivates C, D and E, accounted for only 3%
each in the Kanet population. Among the Tharus the frequencies for Hgs C and D
were 3% and 6%, respectively. It is worthwhile noting that the populations from West
Bengal lacked eastern Asian Hg M varieties completely. This is also true for the upper
cast people from West Bengal (our unpublished data).
The other specific for East Asian populations haplogroups were detected only in the
Kanet sample and among them only haplogroup F (more precisely F1b; Fig.10; see
also Fig. 1 in Supplementary Material) occurred at a considerable frequency - 15%.
Hgs A and B frequencies among the Kanet were 3% and 6%, respectively.
36
Table 3. mtDNA haplogroup frequencies in the studied Indian populations.
* 95% “credible region” (CR) (Berger 1985) see "Materials and Methods" for details
Bhoksa Tharu Kanet Lodha Kurmi Northern Eastern Total
n=23 n=36 n=34 n=56 n=54 n=93 n=110 n=203 n % 95
% C
R fo
r pr
opor
tion*
n % 95
% C
R fo
r pr
opor
tion
n % 95%
CR
for
prop
ortio
n
n % 95%
CR
for
prop
ortio
n
n % 95%
CR
for
prop
ortio
n
n % 95%
CR
for
prop
ortio
n
n % 95%
CR
for
prop
ortio
n
n % 95%
CR
for
prop
ortio
n
M 17 74 (.53-.87) 19 53 (.37-.68) 17 50 (.34-.66) 56 100 (.95-1.0) 46 85 (.73-.92) 53 57 (.47-.67) 102 93 (.86-.96) 155 76,4 (.70-.82) M2 1 4 (.01-.21) 4 7 (.03-.18) 1 1 (.01-.06) 4 4 (.02-.09) 5 2,5 (.01-.06) M3 2 9 (.03-.27) 3 8 (.03-.22) 2 6 (.02-.19) 11 20 (.11-.32) 7 8 (.04-.15) 11 10 (.06-.17) 18 8,9 (.06-.14) M4 2 6 (.02-.18) 2 2 (.01-.08) 2 1,0 (.01-.04) M6 4 7 (.03-.18) 4 4 (.02-.09) 4 2,0 (.01-.05) M18 1 4 (.01-.21) 1 3 (.01-.15) 21 38 (.26-.51) 2 2 (.01-.08) 21 19 (.13-.28) 23 11,3 (.08-.16) M25 4 12 (.05-.27) 4 4 (.02-.11) 4 2,0 (.01-.05) MC 1 3 (.01-.14) 1 3 (.01-.15) 2 2 (.01-.08) 2 1,0 (.01-.04) MD 2 6 (.02-.18) 1 3 (.01-.15) 3 3 (.01-.09) 3 1,5 (.01-.04) ME 1 3 (.01-.15) 1 1 (.01-.06) 1 0,5 (.01-.03) A 1 3 (.01-.15) 1 1 (.01-.06) 1 0,5 (.01-.03) B 2 6 (.02-.19) 2 2 (.01-.08) 2 1,0 (.01-.04) F 5 15 (.07-.30) 5 5 (.02-.12) 5 2,5 (.01-.06) H 1 3 (.01-.15) 1 1 (.01-.06) 1 0,5 (.01-.03) I 1 3 (.01-.15) 1 1 (.01-.06) 1 0,5 (.01-.03) Q 2 6 (.02-.18) 2 4 (.01-.13) 2 2 (.01-.08) 2 2 (.01-.06) 4 2,0 (.01-.05) R 3 13 (.05-.32) 4 11 (.05-.25) 1 3 (.01-.15) 1 2 (.01-.10) 8 9 (.05-.16) 1 1 (.01-.05) 9 4,4 (.02-.08) T 2 6 (.02-.18) 2 2 (.01-.08) 2 1,0 (.01-.04) U 3 13 (.05-.32) 7 19 (.10-.35) 5 15 (.07-.30) 6 11 (.05-.22) 15 16 (.10-.25) 6 5 (.03-.11) 21 10,3 (.07-.15) U2 2 9 (.03-.27) 5 14 (.06-.29) 1 3 (.01-.15) 5 9 (.04-.20) 8 9 (.05-.16) 5 5 (.02-.10) 13 6,4 (.04-.11) U7 1 4 (.01-.21) 3 9 1 2 (.01-.10) 4 4 (.02-.11) 1 1 (.01-.05) 5 2,5 (.01-.06) U4 1 3 (.01-.14) 1 1 (.01-.06) 1 0,5 (.01-.03) U5 1 3 (.01-.15) 1 1 (.01-.06) 1 0,5 (.01-.03)
W 1 3 (.01-.14) 2 6 (.02-.19) 3 3 (.01-.09) 3 1,5 (.01-.04)
37
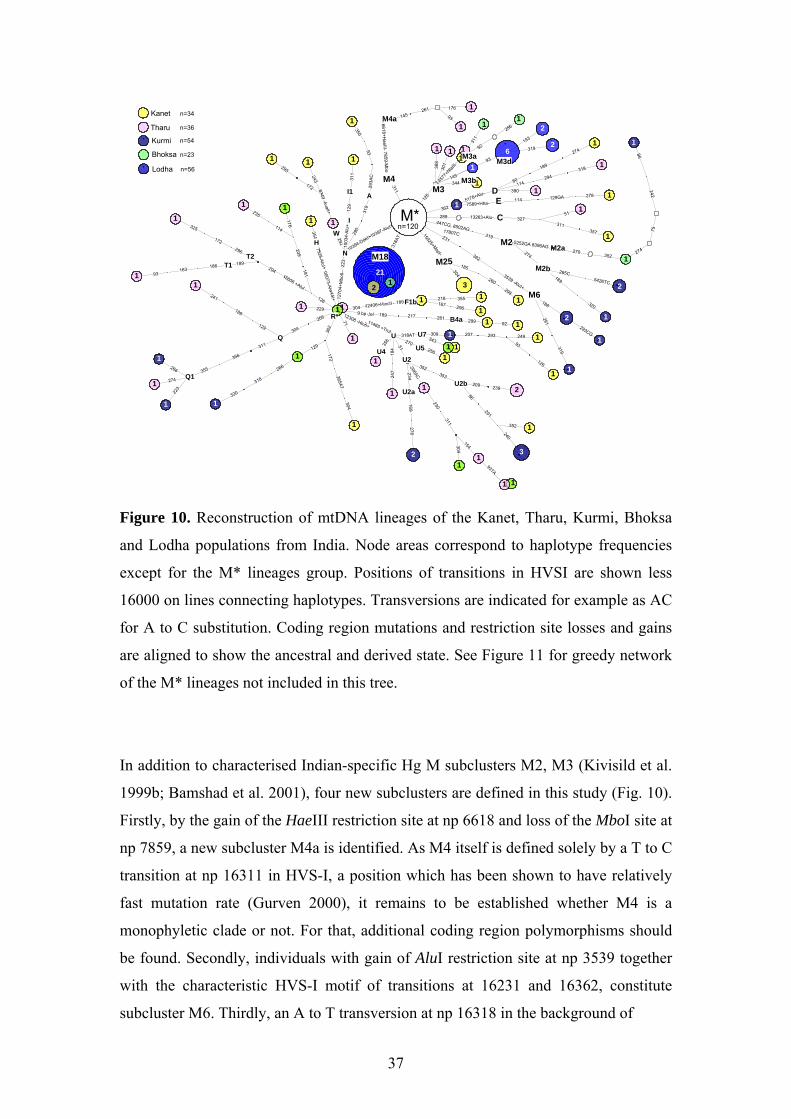
Figure 10. Reconstruction of mtDNA lineages of the Kanet, Tharu, Kurmi, Bhoksa
and Lodha populations from India. Node areas correspond to haplotype frequencies
except for the M* lineages group. Positions of transitions in HVSI are shown less
16000 on lines connecting haplotypes. Transversions are indicated for example as AC
for A to C substitution. Coding region mutations and restriction site losses and gains
are aligned to show the ancestral and derived state. See Figure 11 for greedy network
of the M* lineages not included in this tree.
In addition to characterised Indian-specific Hg M subclusters M2, M3 (Kivisild et al.
1999b; Bamshad et al. 2001), four new subclusters are defined in this study (Fig. 10).
Firstly, by the gain of the HaeIII restriction site at np 6618 and loss of the MboI site at
np 7859, a new subcluster M4a is identified. As M4 itself is defined solely by a T to C
transition at np 16311 in HVS-I, a position which has been shown to have relatively
fast mutation rate (Gurven 2000), it remains to be established whether M4 is a
monophyletic clade or not. For that, additional coding region polymorphisms should
be found. Secondly, individuals with gain of AluI restriction site at np 3539 together
with the characteristic HVS-I motif of transitions at 16231 and 16362, constitute
subcluster M6. Thirdly, an A to T transversion at np 16318 in the background of
12308 -HinfI+
10397-AluI+
15925+MspI-
362
289447CG, 8502AG1780TC
231
126
31131
8AT
M*
10394-DdeI+
325
1
296
172
294189
126
18115606 +AluI -
266
304
356
355
31122
3
292
290
129
362
172
51
318AT
184
356
11465 +TruI-
270
86
291
239209
353
352
234169
240
3
U2aU2b
278
2
309343
2071U U7
320
318
1
266266
223
274
1
1
176
1
209
114
1
311
304154
230
1
261 299217189
92 19 bp del
B4a
18912406+HincII- 167 296 1304
2181 355 1F1b
354
1
293A
C
93
319
355
1
129
311
1
I1
304
1
265AT
93
126
249293
1
111
352 1
2561
172
295
2438249 -AvaII+
1 1
189
129
241
1
1
2291
71
1
1
931186
163
247
1 2206AC
1
93TA
1
11
1
7028-AluI+
1
U5
Q1
T1T2
H
235
1
N
Q
U2U4
W
00073-Alw44I+ 12
704+
Mbo
II-10
034-
Alu+
1R*
I
304
185
3
M25
260
298
1
5178+Alu-
7589+Hha-1
114294
390
80
3181
D 1
189
2741
278 1129GA114E13263+Alu-
511
327311
3571
C
3195252GA 8396AG
274 352270
189
265C
274
75
242
M2a
M2b
M2
86
1
320
1
1
5426TC 2
362
188
291
3539 -AluI+
293CG
2
1
319
M6
1
145
92
311
4577
+NlaI
II-
1
286
319193
936
1
344 1M3b
M3d
2
2
368
1
1
301
145
1
M3
1
1M3a
A
26193
176
145
1
1M4a6618+H
aeIII- 7859-Mbo+
M4
211
2
M18
n=120
Kanet
Bhoksa
Tharu
Kurmi
Lodha
n=23
n=36
n=56
n=34
n=54
1

38
Figure 11. Greedy network (Bandelt et al. 2000) (MJ + RM see Materials and
Methods) of the M* lineages of the Kanet, Tharu, Kurmi, Bhoksa and Lodha
populations from India. For other details see Legend to Fig. 10.
haplogroup M, is assigned to define M18 and, fourthly, M25 is distinguished by a loss
of MspI restriction site at np 15925. These new subhaplogroups cover 21% of Hg M
lineages in the populations examined in this study.
Of the Hg M subclusters, M3 is the most widespread in the populations under study –
the Kurmi being the only ones lacking this haplogroup (see Table 3). M4a and M6
discriminate the northern and eastern populations, as M4a is present only in the
former and M6 only in the latter. This segregation is not maintained when additional
data of many different Indian populations is included – both M4 and M6 have
representatives from many populations of different social rank, geographical origin
and linguistic background (our unpublished data).
111CA302292
304263
179del
93
362
129
311
172189
294
95, 249, 359316,
234
185, 260, 298178, 316AT, 325
193, 278, 362TG
241
12
3
11
11
274, 362
1
264, 265AC
48, 218
11
3251
291
1
1
1
1
169
1
189
2451
184 300
5
234, 2 66
367A
C
147,243,278
114,
362
GT
166, 275
92
92TA, 291
1
2
2
12
93, 243
17
1
6 1
274, 319
1
1
42, 3
6 2
1
1
1
145
1
1
2
124,
179,
249
1
2
1
1
1
10
11
1
Kanet
Bhoksa
Tharu
Kurmi
Lodha
n=23
n=36
n=56
n=34
n=54

39
A number of Hg M lineages could not be ascribed to any of the defined Hg M sub-
haplogroups. The greedy network (Bandelt et al. 2000) based on HVS-I sequence
variation of these lineages (M*) (Fig. 11) reveals an extensive diversity, in particular
in the northern populations. The Lodhas show the least amount of variation and fall
into only a few (8) haplotypes. In general, this analysis does not reveal any strictly
population- or region-specific lineage groups. There is only one lineage with
considerable length (substitutions at nps 16147, 16189, 16243, 16278, 16362) what is
present only among one population, the Kurmis. Given the seemingly starlike
topology of the tree (Fig.11), it was possible to calculate the coalescence time for
these lineages which yielded 62,000 ± 6500 years BP. Coalescence estimate of 40,000
± 2000 years BP. for M* lineages was calculated from a much large dataset including
360 individuals (Mountain et al. 1995; Bamshad et al. 1996; Kivisild et al. 1999a)
(our unpublished data). The large contrast in these estimates is most likely caused by
demographic histories of the Kurmis and Lodhas. Probably because of a bottleneck
event and/or by a founder effect, most of them harbour only few haplotypes. This, in
turn, disrupts the starlike topology of the tree. Indeed, when Lodhas and Kurmis are
excluded from the expansion time calculation, the result becomes close to that
observed with the large dataset, being 43,000 ± 7300.
Lineages grouped as R in Table 3 do not form a haplogroup in a strict sense. R is
considered as a phylogenetic node, descending from another internal node N through
transitions at nps 12705 and 16223 (See Figure 1 in Supplementary material). In turn,
R itself is also is a branching point, connecting a number of distinct haplogroups: B
and F, specific for eastern Asian populations and H, V, J, T and U, typical for western
Eurasians (Figure 1 in Supplementary material). A group of Indian mtDNA lineages,
another derivate of this node, is defined here as an Indian-specific haplogroup Q. This
haplogroup is characterised by HVS-I sequence motif of substitutions at np16266 and
16304. The distinction of this Indian-specific cluster from East Asian-specific Hg F is
based on the difference at np 249.
As expected, the western Eurasian-specific haplogroups H, T and I accounted for only
minor proportions of the gene pool of the populations studied here, reaching the

40
average of 0,5%, 1% and 0,5%, respectively. Furthermore, the eastern group and the
Bhoksa from the northern group lacked these haplogroups altogether.
A vast majority of the Hg U lineages in the studied populations belong to two Indian-
specific varieties - U2i and U7 (Kivisild et al. 1999a). The frequency of Hg U
lineages is higher among the northern populations - 16%, while that of the eastern
group is only 5% (8% if data of (Roychoudhury et al. 2000) is included). This is
because the Lodhas included into this study lack Hg U. European-specific U4 and U5
are both represented by only one individual from the Tharu and Kanet, respectively.
HVS-II was sequenced in the Lodha and Kurmi samples (see supplementary
material). As HVS-II data is not yet available for all other studied Indian populations,
full analysis of this data is not presented here. However, it should be noted that the
observed HVS-II sequence variation in the Lodha and Kurmi supports the constructed
clades in the networks (Fig. 10, Fig11). In some instances it provided additional
resolution power to break apart “crowded” haplotypes. For instance, 17 Kurmi
individuals with HVS-I motif of substitutions at np 16048, 16129 and 16218 were
distributed into four haplotypes based on a transition at np 204, a transversion at np
209 and an insertion at nps 57.

41
Disscussion
Based on genetic studies of classical markers (summarised in (Papiha 1996), linguistic
data and archaeology, peopling of India is usually discussed bearing in mind just two
putative large-scale immigration waves of anatomically modern humans to the sub-
continent. Firstly, the demic diffusion of Dravidic speakers coinciding with the arrival
of several varieties of wheat and other cereals some 8000 – 9000 years ago from the
Fertile Crescent (Diamond 1997; Renfrew 1989). Secondly, a more widely discussed
scenario is in a presumed invasion of nomadic Indo-Aryan tribes around 4000 BP
either from the west or from the Central Asian steppes in the north. Literature about
the latter is huge and still growing, often mixed with clearly political rhetoric.
However, both theories leave completely open the question about the “indigenous”,
pre-Neolithic inhabitants of India. In some papers the present-day tribal populations
(especially the Austro-Asiatic speakers) of India are considered to be descendants of
these original inhabitants of South Asia (Papiha 1996; Cavalli-Sforza et al. 1994;
Gadgil 1997).
To this date no Austro-Asiatic speaking Indian tribal population has been studied in
detail for mtDNA variation. The Lodha, Munda and Santal tribals have been typed for
the frequencies of haplogroups M, U, A and D (Roychoudhury et al. 2000). These
results showed that in haplogroup frequencies Austro-Asiatic tribals are composed as
the rest of Indians - of Hgs M and U.
Here we analysed mtDNA sequence variation in one of the Austro-Asiatic speaking
tribals – the Lodhas – in detail. It became evident that the Lodhas have gone through
demographic bottleneck and/or represent a population with strongly manifested
narrow founder effect and, in result, exhibit only a limited extent of variation in their
maternal lineages. Nevertheless, the Hg M lineages present among the Lodhas fit well
into the framework of Indian varieties of this super-cluster of human mtDNA.
Moreover, all the Hg M and U lineages found in the studied four tribal populations,
with the exception of one Kurmi lineage, have representatives in a wide range of
different Indian populations, described earlier by us and others (Mountain et al. 1995;
Kivisild et al. 1999a; Kivisild et al. 2000) (our unpublished data). The mtDNA data,
therefore, suggest a common origin for Indian tribal and caste groups. This may seem

42
to be in conflict with earlier interpretations by i) Das and colleagues for example, who
demonstrated by frequency distributions of classical genetic markers that Indo-
European and Austro-Asiatic speaking tribals showed little genetic affinity (Das et al.
1996) and to ii) overall conclusion of S. S. Papiha in the review of classical genetic
studies of Indian populations, that tribal populations are in general well differentiated
from the nontribal castes or communities (Papiha 1996). However, these differences
are likely due to different approaches used: allele frequency based statistics and
genealogical approach.
Our mtDNA-based analyses do not support the idea that tribals or Austro-Asiatic
speakers in particular, are genetically different from the cast groups of India in
principle. Rather, the differences (even significant) can be attributed to genetic drift
(including bottlenecks, founder effects etc.), changing frequencies but not lineage
clusters (clades), which the tribal populations share with the rest of Indian populations
– and, as a rule, do not share with other Eurasian or African populations.
Nevertheless, we admit that additional data on other Austro-Asiatic speakers of India
and beyond is needed to draw more detailed picture of their genetic affinities within
India and with contiguous areas.
The observed mtDNA variation among Tharus contrasts with some and is consistent
with other earlier mtDNA studies on this population. From the results by Passarino
and colleagues (Passarino et al. 1993), we could deduce that, as in our study, Hg M
comprised majority of mtDNA lineages of their Tharu sample. However, two
restriction fragment length polymorphism (RFLP) studies concluded that the Tharus
are clearly different from modern Hindus and are, instead, closely related to East
Asians (Semino et al. 1991; Brega et al. 1986). In our study, only 9% of mtDNA
variation in the Tharu sample (presence of Hgs C and D 3% and 6%, respectively)
could be ascribed to an eastern Asian admixture. In part, this controversy can be
ascribed to a lower phylogenetic resolution in the RFLP studies and the fact that the
Tharu sampled in the mentioned studies originated in Nepal while our samples came
from India, though close to the border of Nepal.
When comparing the northern and eastern populations under study we found that
some detectable gene flow of eastern Asian mtDNA lineages has indeed enriched the

43
gene pool of the former. At it’s most it is manifested among the Kanet, where specific
to East Asia Hgs B and F reach 6% and 15%, respectively. On the other hand, this
admixture could be expected, as historical trade relations with the Tibetans are well
known and the presence of the mentioned Hgs there has been shown already some
time ago (Torroni et al. 1994b). Moreover, by typing immunoglobulin allotypes,
Papiha and colleagues described extensive Tibetan admixture among the Kanet. This
intermixture decreased in Kanet regional populations as the distance from the Tibetan
border increased (Papiha et al. 1996b), suggesting a typical isolation-by-distance
mechanism in action. Yet the admixture with East Asian mtDNA lineages is not
uniform to all studied populations from the northern group (see Table 3). This is in
concordance with earlier studies on classical genetic markers showing that genetic
admixture with the Tibetans varies considerably among the Indian populations along
the Tibetan border (Papiha et al. 1996a).
In contrast to that, studied by us eastern Indian tribal populations did not show any
admixture with East Asians whatsoever. For the Lodha and Kurmi, their particular
demographic histories could be indicative: both populations show only a little
variation and, therefore, they might have lost the East Asian lineages. Yet, most likely
they never had East Asian lineages at substantial frequencies as, given the number of
lineages left among these populations (30 haplotypes out of 111 samples examined),
the probability that they have lost all East Asian haplotypes by means of drift is
negligible. The argument of lineage loss is also not applicable to explain the lack of
East Asian maternal lineages among the upper cast sample of West Bengal (our
unpublished data), who show no sign of severe bottleneck in their demographic
history. High population density over a long time period, making the region less prone
to the effect of immigration could, among other interpretations, serve as an
explanation.
The mtDNA lineages arising from the central node of Hg M that have so far not been
assigned to any subcluster of Hg M, form the M* lineages. As the Lodhas and Kurmis
did not show starlike topology on the greedy network of M* (Fig. 11), they had to be
excluded from the coalescence time calculation. Based on the remaining data of
Tharus, Bhoksas and Kanets the expansion time for the Indian M* was estimated as
43,000 ± 7300 BP. To further narrow the error margins, a dataset of 362 M* lineages

44
covering different areas and socio-cultural backgrounds of India, was included and in
result, expansion time of 40000 ± 2000 years BP was found. Analyses yielding
somewhat or significantly earlier Indian Hg M coalescence estimates, ranging from
~47,000 – ~65,000 BP (Kivisild et al. 1999b) and (Mountain et al. 1995) respectively,
included sequence information of all Indian M subclusters in the former, and
additionally even some African sequences in the latter case, therefore blurring the
expansion time estimate of the central M node in India.
The proposed here expansion time for M* lineages of in India (~40,000 BP) is in
good concordance with the archaeological data, dating the oldest known anatomically
modern human (AMH) skeletal remains in South Asia to 34,000 C14 BP (Kennedy et
al. 1987; Deraniyagala 1998). It is also consistent with the dating of the oldest AMH
remains in East Asia to ~30,000BP, which have become favourable over the earlier
uranium-series date of 67,000 BP (Etler 1996; Foley and Lahr 1997; Foley 1998). The
proposed coalescence estimate of ~60,000 BP for Indian M variety M2 (Kivisild et al.
1999b), is, on the other hand, consistent with expansion time estimations for the two
macro-lineage groups of the native Australians (our unpublished observation) and
archaeological evidence showing the presence of AMH in Australia at about 60,000
BP (Roberts et al. 1990; Thorne et al. 1999).
Coalescence age estimation for the proposed new Hg M subgroups was not carried
out, as for the lack of starlike topology or sometimes due to too few representatives.
Nevertheless, it can be suggested that Hg M18 is probably of a very recent origin as
even in case of the large dataset (n=362) only two lineages with one and two
mutational steps have arisen from the nodal haplotype.

45
Conclusions
I. Five Indian populations (Lodha n=56, Bhoksa n=23, Tharu n=36, Kanet n=34,
Kurmi n=55) were surveyed here for mtDNA variation. HVS-I was sequenced
in all samples and characteristic mutations in coding region of the mt-genome
were analysed by RFLP analysis.
II. As general for India, mtDNA haplogroups (Hg) M and U were found to be
dominant in the five studied populations of northern and eastern India.
III. Virtually all lineages, belonging to Hg M and Hg U what we found among these
populations, have representatives in a wide range of different Indian
populations. It strongly suggests a common, Indian-specific origin of the
maternal gene pool of the Indian tribal and caste groups.
IV. Indian tribal populations and Austro-Asiatic speakers in particular, are often
considered to be the otherwise lost genetic relicts of the indigenous
(Palaeolithic) inhabitants of India. Our results on mtDNA variation among tribal
populations and Austro-Asiatic Lodhas in particular give no grounds for such
speculations.
V. We characterise here four new Indian M subclusters, covering 21% of Hg M
lineages in studied populations.
VI. Comparing the maternal lineages of studied here northern and eastern
populations, we found that the gene pool of the northern group has been
enriched with East Asian mtDNA lineages, most likely via gene flow from Tibet
or Central Asia, while eastern populations showed no admixture with East
Asians.
VII. We calculated the coalescence age for the M* lineages (Hg M lineages not
ascribed to any Hg M subclusters so far) as ~40,000 BP, being in good
concordance with the archaeological data on the peopling of South Asia by
anatomically modern humans.

46
Acknowledgements
It has been a privilege to have Professor Richard Villems and Dr. Toomas Kivisild as
supervisors. I thank them both for the professional guidance in this interesting field of
science. I would like to express my deepest gratitude to Professor Surinder S. Papiha
and Dr. Sarabjit Mastana for kindly providing all the samples, and introducing our
laboratory to the genetic studies of India. Also, this work would have been impossible
without the technical assistance by Ille Hilpus and Jaan Lind. Jüri Parik –genius of
methods- has helped me through on numerous occasions. I wish to thank all the
colleagues and fellow students for the friendly atmosphere and ongoing fruitful
discussions. Last but not least, I thank my family, my parents and brothers and
especially my wife, Pille, who has bravely put up with me through thick and thin.

47
Kokkuvõte
Tänapäevaste India populatsioonide geeniliinide uurimine on huvipakkuv mitmel
põhjusel. Esiteks on see teema vahetult seotud anatoomiliselt moodsa inimese (AMI)
väljarändega Aafrikast - ülejäänud maailma koloniseerimisega. Arheoloogid on
arvamusel, et Austraaliasse ja Uus Guineasse jõudis AMI juba vähemasti 50,000
tagasi. Kuivõrd teekonda Aafrikast Austraaliasse on pea võimatu kujutada ette ilma
Indiat vähemasti osaliselt läbimata, aitab India populatsioonigeneetiline uurimine
kaasa selle AMI demograafilise ajaloo keskse problemaatika paremale mõistmisele.
Ka kitsamalt India rahvastiku kujunemine on oluline – elab ju seal pea viiendik
inimkonnast. Keeleteadlased ja arheoloogid on välja pakkunud mitmeid põnevad
stsenaariume, mis hõlmavad ulatuslikke sisserändeid ja erinevate rahvaste
(kultuuride) segunemist.
Kuigi viimasel ajal on India inimpopulatsioonide ema- ja isaliinide uurimine
hoogustunud, on tohutut endogaamsete populatsioonide arvu ning tekkiva pildi
keerukust silmas pidades selge, et ollakse alles selle tee alguses. Eriti oluline oleks
India hõimurahvaste (tribals) ja nende seas just iseäranis austroaasia keeli kõnelevate
populatsioonide uurimine, sest sageli peetakse just neid vahetuiks India põlisasukate
geneetilisteks järeltulijateks.
Antud töös uuriti mitokondriaalse DNA varieeruvust viies India populatsioonis –
tharude, bhoksade, lodhade, kurmide ja kaneede juures, kusjuures valik võimaldas
võrdlust geograafiliste piirkondade vahel ja piki sotsiaalset vertikaali. Et kontrollida
hüpoteesi, mille kohaselt austroaasia keeli kõnelevad hõimurahvad kannavad endis
India iidseimate asukate geneetilist pärandit, analüüsisime ühe sellise hõimu –
lodhade – mitokondriaalse DNA varieeruvust võrdlevalt teiste hõimude ja
endogaamsete kastidega. Samuti soovisime jälgida võimalikke geenivooge
naaberaladelt ning üritasime täpsustada India-spetsiifiliste emaliinide klassifikatsiooni
uute liinirühmade (haplogruppide) defineerimisega.

48
Tulemused on toodud alljärgnevalt:
I. Kirjeldamaks mitokondriaalse DNA varieeruvust viies India populatsioonis
(lodha n=56, bhoksa n=23, tharu n=36, kanet n=34, kurmi n=55)
sekvineerisime kõigil proovidel mitokondriaalse genoomi kontrollregiooni
esimese hüpervarieeruva segmendi (HVS-I) ning analüüsisime informatiivseid
mutatsioone kodeerivas alas RFLP meetodil.
II. Sarnaselt seniuuritud India populatsioonidele osutusid uuritud viies
populatsioonis kõige kõrgemate esinemissagedustega mtDNA
haplogruppideks (Hg) M ja U.
III. Valdav enamus leitud Hg M ja U liinidest on kaetud esindajatega paljudest
erinevatest seni uuritud India populatsioonidest. See tulemus viitab India
hõimurahvaste ja kastide emaliinide ühisele päritolule.
IV. India hõimurahvaid ning nende seas eelkõige austroaasia keelte kõnelejaid, on
tihti peetud ainsateks India (paleoliitiliste) põlisasukate geneetiliste pärandi
kandjateks. Meie tulemused mtDNA varieerumise kirjeldamisel
hõimurahvastel, sealhulgas lodhadel, ei anna niisuguseks oletuseks alust.
V. Defineeriti neli uut India-spetsiifilist Hg M alamklastrit, mis moodustasid 21%
Hg M liinidest uuritud populatsioonides.
VI. Uuritud põhja- ja idapoolsete populatsioonide võrdlemisel selgus, et esimese
grupi geenifond on rikastunud Ida-Aasiale spetsiifiliste emaliinidega
tõenäoliselt tänu geenivoole Tiibetist või Kesk-Aasiast. Samas ei leidnud me
just India idapoolseist populatsioonidest mtDNA liine, mis võiksid pärineda
Ida-Aasiast.
VII. Meie poolt arvutatud M* liinide (Hg M liinid mis ei ole seni määratletud mõne
Hg M alamklastrina) koalestsentsi aeg, ~ 40,000 aastat tagasi, on heas
kooskõlas arheoloogiliste andmetega Lõuna-Aasia asustamisest AMI poolt.

49
References
Anderson S, Bankier AT, Barrell BG, de Bruijn MH, Coulson AR, Drouin J, Eperon IC, et al (1981) Sequence and organization of the human mitochondrial genome. Nature 290:457-65
Aris-Brosou S, Excoffier L (1996) The impact of population expansion and mutation rate heterogeneity on DNA sequence polymorphism. Mol Biol Evol 13:494-504
Awadalla P, Eyre-Walker A, Smith JM (1999) Linkage disequilibrium and recombination in hominid mitochondrial DNA. Science 286:2524-5
Ballinger SW, Schurr TG, Torroni A, Gan YY, Hodge JA, Hassan K, Chen KH, et al (1992) Southeast Asian mitochondrial DNA analysis reveals genetic continuity of ancient mongoloid migrations. Genetics 130:139-52
Bamshad M, Fraley AE, Crawford MH, Cann RL, Busi BR, Naidu JM, Jorde LB (1996) mtDNA variation in caste populations of Andhra Pradesh, India. Hum Biol 68:1-28
Bamshad M, Kivisild T, Watkins WS, Dixon ME, Ricker CE, Rao BB, Naidu JM, et al (2001) Genetic evidence on the origins if Indian caste populations. Genome Research
Bamshad M, Rao BB, Naidu JM, Prasad BVR, Watkins S, Jorde LB (1997) Response to Spurdle et al. Human Biology 69:432-435
Bamshad MJ, Watkins WS, Dixon ME, Jorde LB, Rao BB, Naidu JM, Prasad BV, et al (1998) Female gene flow stratifies Hindu castes. Nature 395:651-2
Bandelt H-J (1994) Phylogenetic networks. Verh. Naturwiss. Ver. Hamburg 34:51-71 Bandelt H-J, Forster P, Röhl A (1999) Median-joining networks for inferring
intraspecific phylogenies. Mol Biol Evol 16:37-48 Bandelt H-J, Forster P, Sykes BC, Richards MB (1995) Mitochondrial portraits of
human populations using median networks. Genetics 141:743-53 Bandelt H-J, Macaulay V, Richards M (2000) Median networks: speedy construction
and greedy reduction, one simulation, and two case studies from human mtDNA [In Process Citation]. Mol Phylogenet Evol 16:8-28
Barnabas S, Apte RV, Suresh CG (1996) Ancestry and interrelationships of the Indians and their relationship with other world populations: a study based on mitochondrial DNA polymorphisms. Ann Hum Genet 60:409-22
Behnke HD (1977) [The origin of plastids and mitochondria. The endosymbiotic hypothesis]. MMW Munch Med Wochenschr 119:317-8.
Bendall KE, Macaulay VA, Baker JR, Sykes BC (1996) Heteroplasmic point mutations in the human mtDNA control region. Am J Hum Genet 59:1276-87
Berger JO (1985) Statistical decision theory and Bayesian analysis. Springer-Verlag, New York
Brega A, Gardella R, Semino O, Morpurgo G, Astaldi Ricotti GB, Wallace DC, Santachiara Benerecetti AS (1986) Genetic studies on the Tharu population of Nepal: restriction endonuclease polymorphisms of mitochondrial DNA. Am J Hum Genet 39:502-12
Cann RL, Brown WM, Wilson AC (1984) Polymorphic sites and the mechanism of evolution in human mitochondrial DNA. Genetics 106:479-99
Cann RL, Stoneking M, Wilson AC (1987) Mitochondrial DNA and human evolution. Nature 325:31-6
Cavalli-Sforza LL, Menozzi P, Piazza A (1994) The History and geography of human genes. Princeton University Press, Princeton
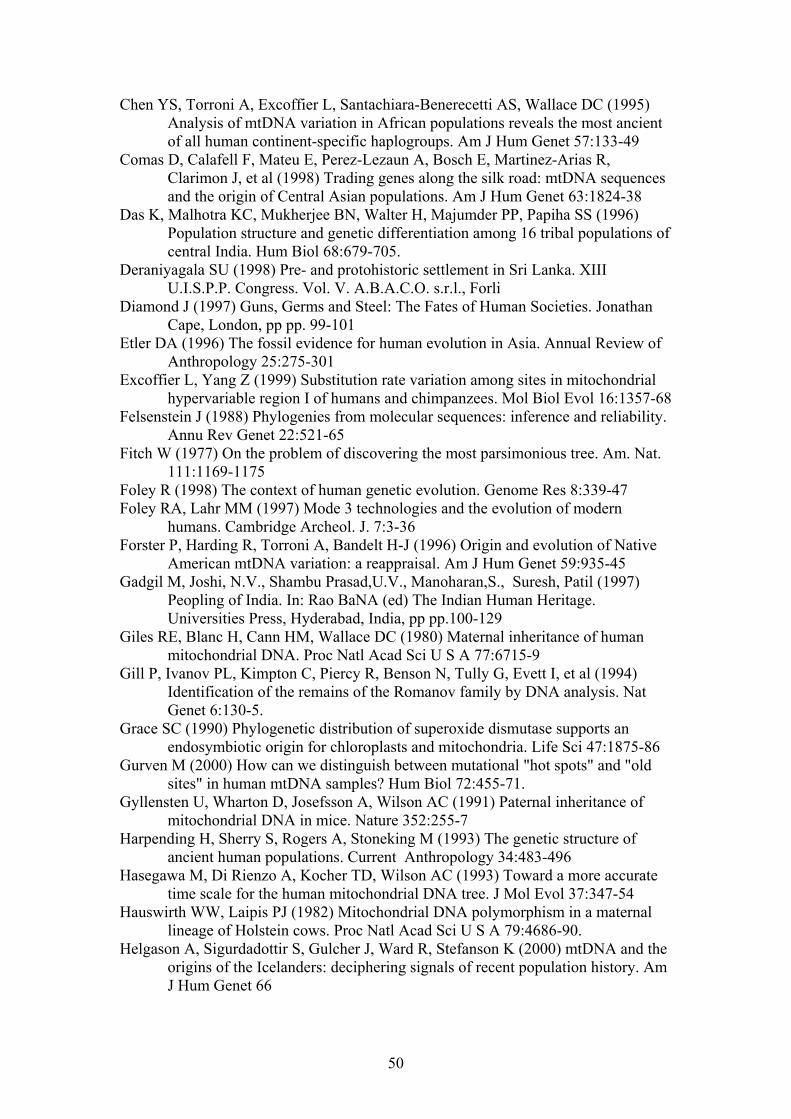
50
Chen YS, Torroni A, Excoffier L, Santachiara-Benerecetti AS, Wallace DC (1995) Analysis of mtDNA variation in African populations reveals the most ancient of all human continent-specific haplogroups. Am J Hum Genet 57:133-49
Comas D, Calafell F, Mateu E, Perez-Lezaun A, Bosch E, Martinez-Arias R, Clarimon J, et al (1998) Trading genes along the silk road: mtDNA sequences and the origin of Central Asian populations. Am J Hum Genet 63:1824-38
Das K, Malhotra KC, Mukherjee BN, Walter H, Majumder PP, Papiha SS (1996) Population structure and genetic differentiation among 16 tribal populations of central India. Hum Biol 68:679-705.
Deraniyagala SU (1998) Pre- and protohistoric settlement in Sri Lanka. XIII U.I.S.P.P. Congress. Vol. V. A.B.A.C.O. s.r.l., Forli
Diamond J (1997) Guns, Germs and Steel: The Fates of Human Societies. Jonathan Cape, London, pp pp. 99-101
Etler DA (1996) The fossil evidence for human evolution in Asia. Annual Review of Anthropology 25:275-301
Excoffier L, Yang Z (1999) Substitution rate variation among sites in mitochondrial hypervariable region I of humans and chimpanzees. Mol Biol Evol 16:1357-68
Felsenstein J (1988) Phylogenies from molecular sequences: inference and reliability. Annu Rev Genet 22:521-65
Fitch W (1977) On the problem of discovering the most parsimonious tree. Am. Nat. 111:1169-1175
Foley R (1998) The context of human genetic evolution. Genome Res 8:339-47 Foley RA, Lahr MM (1997) Mode 3 technologies and the evolution of modern
humans. Cambridge Archeol. J. 7:3-36 Forster P, Harding R, Torroni A, Bandelt H-J (1996) Origin and evolution of Native
American mtDNA variation: a reappraisal. Am J Hum Genet 59:935-45 Gadgil M, Joshi, N.V., Shambu Prasad,U.V., Manoharan,S., Suresh, Patil (1997)
Peopling of India. In: Rao BaNA (ed) The Indian Human Heritage. Universities Press, Hyderabad, India, pp pp.100-129
Giles RE, Blanc H, Cann HM, Wallace DC (1980) Maternal inheritance of human mitochondrial DNA. Proc Natl Acad Sci U S A 77:6715-9
Gill P, Ivanov PL, Kimpton C, Piercy R, Benson N, Tully G, Evett I, et al (1994) Identification of the remains of the Romanov family by DNA analysis. Nat Genet 6:130-5.
Grace SC (1990) Phylogenetic distribution of superoxide dismutase supports an endosymbiotic origin for chloroplasts and mitochondria. Life Sci 47:1875-86
Gurven M (2000) How can we distinguish between mutational "hot spots" and "old sites" in human mtDNA samples? Hum Biol 72:455-71.
Gyllensten U, Wharton D, Josefsson A, Wilson AC (1991) Paternal inheritance of mitochondrial DNA in mice. Nature 352:255-7
Harpending H, Sherry S, Rogers A, Stoneking M (1993) The genetic structure of ancient human populations. Current Anthropology 34:483-496
Hasegawa M, Di Rienzo A, Kocher TD, Wilson AC (1993) Toward a more accurate time scale for the human mitochondrial DNA tree. J Mol Evol 37:347-54
Hauswirth WW, Laipis PJ (1982) Mitochondrial DNA polymorphism in a maternal lineage of Holstein cows. Proc Natl Acad Sci U S A 79:4686-90.
Helgason A, Sigurdadottir S, Gulcher J, Ward R, Stefanson K (2000) mtDNA and the origins of the Icelanders: deciphering signals of recent population history. Am J Hum Genet 66
51
Hofmann S, Jaksch M, Bezold R, Mertens S, Aholt S, Paprotta A, Gerbitz KD (1997) Population genetics and disease susceptibility: characterization of central European haplogroups by mtDNA gene mutations, correlation with D loop variants and association with disease. Hum Mol Genet 6:1835-46
Hopkin K (1999) Death to sperm mitochondria. Sci Am 280:21 Horai S (1996) [Origin of modern humans revealed by complete sequences of
hominoid mitochondrial DNAs]. Tanpakushitsu Kakusan Koso 41:727-32 Horai S, Murayama K, Hayasaka K, Matsubayashi S, Hattori Y, Fucharoen G,
Harihara S, et al (1996) mtDNA polymorphism in East Asian Populations, with special reference to the peopling of Japan. Am J Hum Genet 59:579-90
Howell N, Kubacka I, Mackey DA (1996) How rapidly does the human mitochondrial genome evolve? Am J Hum Genet 59:501-9
Jazin E, Soodyall H, Jalonen P, Lindholm E, Stoneking M, Gyllensten U (1998) Mitochondrial mutation rate revisited: hot spots and polymorphism. Nat Genet 18:109-10
Jazin EE, Cavelier L, Eriksson I, Oreland L, Gyllensten U (1996) Human brain contains high levels of heteroplasmy in the noncoding regions of mitochondrial DNA. Proc Natl Acad Sci U S A 93:12382-7.
Jenuth JP, Peterson AC, Fu K, Shoubridge EA (1996) Random genetic drift in the female germline explains the rapid segregation of mammalian mitochondrial DNA. Nat Genet 14:146-51.
Jorde LB, Bamshad M (2000) Questioning evidence for recombination in human mitochondrial DNA. Science 288:1931.
Joshi NV, Gadgil, M., Patil, S. (1993) Exploring cultural diversity of the people of India. Current Science 64:10-17
Joshi RV (1996) SOUTH ASIA in the period of Homo sapiens neanderthalensis and contemporaries (Middle Palaeolithic) History of Humanity. Vol. I. UNESCO, pp 162-164
Jukes TH, Osawa S (1990) The genetic code in mitochondria and chloroplasts. Experientia 46:1117-26.
Kaneda H, Hayashi J, Takahama S, Taya C, Lindahl KF, Yonekawa H (1995) Elimination of paternal mitochondrial DNA in intraspecific crosses during early mouse embryogenesis. Proc Natl Acad Sci U S A 92:4542-6
Ke Y, Su B, Song X, Lu D, Chen L, Li H, Qi C, et al (2001) African origin of modern humans in East Asia: a tale of 12,000 Y chromosomes. Science 292:1151-3.
Kennedy KA, Deraniyagala SU, Roertgen WJ, Chiment J, Disotell T (1987) Upper pleistocene fossil hominids from Sri Lanka. Am J Phys Anthropol 72:441-61.
Kennedy KA, Sonakia A, Chiment J, Verma KK (1991) Is the Narmada hominid an Indian Homo erectus? Am J Phys Anthropol 86:475-96.
Kivisild T (2000) PhD Thesis: The Origins of Souhern and Western Eurasian Populations: an mtDNA Study. Departement of Evolutionary Biology, Institute of Cell and Molecular Biology. Tartu University, Tartu, pp 117
Kivisild T, Bamshad MJ, Kaldma K, Metspalu M, Metspalu E, Reidla M, Laos S, et al (1999a) Deep common ancestry of Indian and western-Eurasian mitochondrial DNA lineages. Curr Biol 9:1331-1334
Kivisild T, Kaldma K, Metspalu M, Parik J, Papiha SS, Villems R (1999b) The Place of the Indian Mitochondrial DNA Variants in the Global Network of Maternal Lineages and the Peopling of the Old World. In: Deka R, Papiha SS (eds) Genomic Diversity. Kluwer/Academic/Plenum Publishers, pp 135-152
52
Kivisild T, Papiha SS, Rootsi S, Parik J, Kaldma K, Reidla M, Laos S, et al (2000) An Indian Ancestry: a key for understanding human diversity in Europe and beyond. In: Renfrew C, Boyle K (eds) Archaeogenetics: DNA and the population prehistory of Europe. McDonald Institute for Archaeological Research University of Cambridge, Cambridge, pp 267-279
Kivisild T, Villems R (2000) Questioning evidence for recombination in human mitochondrial DNA. Science 288:1931
Koehler CM, Lindberg GL, Brown DR, Beitz DC, Freeman AE, Mayfield JE, Myers AM (1991) Replacement of bovine mitochondrial DNA by a sequence variant within one generation. Genetics 129:247-55.
Kolman C, Sambuughin N, Bermingham E (1996) Mitochondrial DNA analysis of Mongolian populations and implications for the origin of New World founders. Genetics 142:1321-34
Kumar S, Hedrick P, Dowling T, Stoneking M (2000) Questioning evidence for recombination in human mitochondrial DNA. Science 288:1931.
Lightowlers RN, Chinnery PF, Turnbull DM, Howell N (1997) Mammalian mitochondrial genetics: heredity, heteroplasmy and disease. Trends Genet 13:450-5.
Lunt DH, Hyman BC (1997) Animal mitochondrial DNA recombination. Nature 387:247.
Lynch M (1996) Mutation accumulation in transfer RNAs: molecular evidence for Muller's ratchet in mitochondrial genomes. Mol Biol Evol 13:209-20
Macaulay VA, Richards MB, Hickey E, Vega E, Cruciani F, Guida V, Scozzari R, et al (1999) The emerging tree of west Eurasian mtDNAs: a synthesis of control-region sequences and RFLPs. Am J Hum Genet 64:232-49
Majumder P (1990) Anthropometric variation in India: A statistical Appraisal. Current Anthropology 31:94-103
Makowski GS, Aslanzadeh J, Hopfer SM (1995) In situ PCR amplification of Guthrie card DNA to detect cystic fibrosis mutations. Clin Chem 41:477-9.
Malhotra KC (1978) Morphological composition of the people of India. Journal of Human Evolution :45-53
Margulis L (1975) Symbiotic theory of the origin of eukaryotic organelles; criteria for proof. Symp Soc Exp Biol 29:21-38
Meirelles FV, Smith LC (1997) Mitochondrial genotype segregation in a mouse heteroplasmic lineage produced by embryonic karyoplast transplantation. Genetics 145:445-51.
Merriwether DA, Clark AG, Ballinger SW, Schurr TG, Soodyall H, Jenkins T, Sherry ST, et al (1991) The structure of human mitochondrial DNA variation. J Mol Evol 33:543-55
Michaels GS, Hauswirth WW, Laipis PJ (1982) Mitochondrial DNA copy number in bovine oocytes and somatic cells. Dev Biol 94:246-51
Mountain JL, Hebert JM, Bhattacharyya S, Underhill PA, Ottolenghi C, Gadgil M, Cavalli-Sforza LL (1995) Demographic history of India and mtDNA-sequence diversity. Am J Hum Genet 56:979-92
Muller HJ (1964) The relation of recombination to mutational advance. Mutat Res 1:2-9
Ohno K, Tanaka M, Suzuki H, Ohbayashi T, Ikebe S, Ino H, Kumar S, et al (1991) Identification of a possible control element, Mt5, in the major noncoding region of mitochondrial DNA by intraspecific nucleotide conservation. Biochem Int 24:263-72

53
Olivo PD, Van de Walle MJ, Laipis PJ, Hauswirth WW (1983) Nucleotide sequence evidence for rapid genotypic shifts in the bovine mitochondrial DNA D-loop. Nature 306:400-2
Papiha SS (1996) Genetic variation in India. Hum Biol 68:607-28 Papiha SS, Chahal SM, Mastana SS (1996a) Variability of genetic markers in
Himachal Pradesh, India: variation among the subpopulations. Hum Biol 68:629-54
Papiha SS, Schanfield MS, Chakraborty R (1996b) Immunoglobulin allotypes and estimation of genetic admixture among populations of Kinnaur District, Himachal Pradesh, India. Hum Biol 68:777-94.
Parsons TJ, Muniec DS, Sullivan K, Woodyatt N, Alliston-Greiner R, Wilson MR, Berry DL, et al (1997) A high observed substitution rate in the human mitochondrial DNA control region. Nat Genet 15:363-8
Passarino G, Semino O, Bernini LF, Santachiara-Benerecetti AS (1996a) Pre-Caucasoid and Caucasoid genetic features of the Indian population, revealed by mtDNA polymorphisms. Am J Hum Genet 59:927-34
Passarino G, Semino O, Modiano G, Bernini LF, Santachiara Benerecetti AS (1996b) mtDNA provides the first known marker distinguishing proto-Indians from the other Caucasoids; it probably predates the diversification between Indians and Orientals. Ann Hum Biol 23:121-6
Passarino G, Semino O, Modiano G, Santachiara-Benerecetti AS (1993) COII/tRNA(Lys) intergenic 9-bp deletion and other mtDNA markers clearly reveal that the Tharus (southern Nepal) have Oriental affinities. Am J Hum Genet 53:609-18
Piko L, Hougham AJ, Bulpitt KJ (1988) Studies of sequence heterogeneity of mitochondrial DNA from rat and mouse tissues: evidence for an increased frequency of deletions/additions with aging. Mech Ageing Dev 43:279-93.
Poliakov L (1974) The Aryan Myth. Basic Books, New York, pp 190 Quintana-Murci L, Semino O, Bandelt H-J, Passarino G, McElreavey K, Santachiara-
Benerecetti AS (1999) Genetic evidence of an early exit of Homo sapiens sapiens from Africa through eastern Africa. Nat Genet 23:437-41
Renfrew C (1989) The origins of Indo-European languages. Sci. Am. 261:82:90 Richards M, Macaulay V, Hickey E, Vega E, Sykes B, Guida V, Rengo C, et al
(2000) Tracing european founder lineages in the near eastern mtDNA pool. Am J Hum Genet 67:1251-76
Richards MB, Macaulay VA, Bandelt H-J, Sykes BC (1998) Phylogeography of mitochondrial DNA in western Europe. Ann Hum Genet 62:241-60
Roberts RG, Jones R, Smith MA (1990) Thermoluminescence dating of a 50,000-year-old human occupation site in northern Australia. Nature 345:153-156
Roychoudhury S, Roy S, Dey B, Chakraborty M, Roy M, Roy B, Ramesh A, et al (2000) Fundamental genomic unity of ethnic India is revealed by analysis of mitochondrial DNA. Current Science 79:1182-1192
Saiki RK, Gelfand DH, Stoffel S, Scharf SJ, Higuchi R, Horn GT, Mullis KB, et al (1988) Primer-directed enzymatic amplification of DNA with a thermostable DNA polymerase. Science 239:487-91.
Saitou N, Nei M (1987) The neighbor-joining method: a new method for reconstructing phylogenetic trees. Mol Biol Evol 4:406-25
Sankhyan AR (1997) Fossil clavicle of a middle Pleistocene hominid from the Central Narmada Valley, India. J Hum Evol 32:3-16.
54
Semino O, Torroni A, Scozzari R, Brega A, Santachiara Benerecetti AS (1991) Mitochondrial DNA polymorphisms among Hindus: a comparison with the Tharus of Nepal. Ann Hum Genet 55:123-36
Singh KS (1997) The Scheduled Tribes. In: Singh KS (ed) People of India. Vol. III. Oxford University Press, Oxford, pp 1266
Smith DG, Malhi RS, Eshleman J, Lorenz JG, Kaestle FA (1999) Distribution of mtDNA haplogroup X among Native North Americans. Am J Phys Anthropol 110:271-84
Sonakia A (1984) The scull-cap of Early Man and Associated Mammalin Fauna from Narmada Valley Alluvium, hoshangabad Area, Madhya Pradesh (India). Records of the Geological Survey of India :159-172
Soodyall H, Jenkins T, Mukherjee A, du Toit E, Roberts DF, Stoneking M (1997) The founding mitochondrial DNA lineages of Tristan da Cunha Islanders. Am J Phys Anthropol 104:157-66
Stoneking M (1994) Mitochondrial DNA and human evolution. J Bioenerg Biomembr 26:251-9
Stoneking M (2000) Hypervariable sites in the mtDNA control region are mutational hotspots. Am J Hum Genet 67:1029-32.
Stoneking M, Sherry ST, Redd AJ, Vigilant L (1992) New approaches to dating suggest a recent age for the human mtDNA ancestor. Phil. Trans. Royal Soc. 337:167-175
Swofford DL (1993) PAUP: Phylogenetic Analysis Using Parsimony. Illinois Natural History Survey, Champaign
Templeton AR (1992) Human origins and analysis of mitochondrial DNA sequences. Science 255:737
Thapar BK, Rahman A (1996) The post-Indus cultures. In: Dani AH, J.-P. M (eds) History of Humanity. Vol. II. Clays Ltd., St. Ives plc., UK, pp pp. 266-279
Thorne A, Grun R, Mortimer G, Spooner NA, Simpson JJ, McCulloch M, Taylor L, et al (1999) Australia's oldest human remains: age of the Lake Mungo 3 skeleton. J Hum Evol 36:591-612
Tishkoff SA, Dietzsch E, Speed W, Pakstis AJ, Kidd JR, Cheung K, Bonne-Tamir B, et al (1996) Global patterns of linkage disequilibrium at the CD4 locus and modern human origins. Science 271:1380-7
Torroni A, Bandelt HJ, D'Urbano L, Lahermo P, Moral P, Sellitto D, Rengo C, et al (1998) mtDNA analysis reveals a major late Paleolithic population expansion from southwestern to northeastern Europe. Am J Hum Genet 62:1137-52
Torroni A, Huoponen K, Francalacci P, Petrozzi M, Morelli L, Scozzari R, Obinu D, et al (1996) Classification of European mtDNAs from an analysis of three European populations. Genetics 144:1835-50
Torroni A, Lott MT, Cabell MF, Chen YS, Lavergne L, Wallace DC (1994a) mtDNA and the origin of Caucasians: identification of ancient Caucasian- specific haplogroups, one of which is prone to a recurrent somatic duplication in the D-loop region. Am J Hum Genet 55:760-76
Torroni A, Miller JA, Moore LG, Zamudio S, Zhuang J, Droma T, Wallace DC (1994b) Mitochondrial DNA analysis in Tibet: implications for the origin of the Tibetan population and its adaptation to high altitude. Am J Phys Anthropol 93:189-99
Torroni A, Neel JV, Barrantes R, Schurr TG, Wallace DC (1994c) Mitochondrial DNA "clock" for the Amerinds and its implications for timing their entry into North America. Proc Natl Acad Sci U S A 91:1158-62

55
Wakeley J (1993) Substitution rate variation among sites in hypervariable region 1 of human mitochondrial DNA. J Mol Evol 37:613-23
Wallace D (1995) Mitochondrial DNA variation in human evolution, degenerative disease, and aging. Am J Hum Genet 57:201-23
Wallace DC (1999) Mitochondrial diseases in man and mouse. Science 283:1482-8. Ward RH, Frazier B, Dew-Jager K, Paabo S (1991) Extensive mitochondrial diversity
within a single Amerindian tribe. Proc Natl Acad Sci U S A 88:8270-8274 Vigilant L, Stoneking M, Harpending H, Hawkes K, Wilson AC (1991) African
populations and the evolution of human mitochondrial DNA. Science 253:1503-7
Wilson A, Cann R, Carr S, George M, Gyllensten U, Helm-Bychowski K, Higuchi R, et al (1985) Mitochondrial DNA and two perspectives on evolutionary genetics. Biological Journal of the Linnean Society 26:375-400

56
Supplementary Material

57
Table 1. Data table for mtDNA variation in the studied five Indian populations.
lw44
I H
inf I
Alu
I
Nla
III
Hae
III
Alu
I H
aeIII
A
luI
Alu
I H
haI
Mbo
I A
vaII
Hae
III
Alu
I A
luI
Dde
I Tr
uI
Hin
fI H
incI
I A
luI
Alu
I D
deI
Msp
I
Hg HVS1 HVS2 (510-300)
73
447
3539
45
77
4830
51
76
6618
70
25
7055
75
98
7859
82
49
8994
10
032
1039
7 10
394
1146
5 12
308
1240
6 13
262
1560
6 15
754
1592
5 9b
p de
l
Bhoksa 4 M 223 + - - + + + - + - Bhoksa 14 M 111CA-223 + - + + + + - + - Bhoksa 1 M 124-179-189-223-249-294 + - + + + + - + - Bhoksa 20 M 129-189-223-325 + - + + - + - + - Bhoksa 226 M 129-223-264-265AC + Bhoksa 5 M 129-223-311 + - - + + + - + - Bhoksa 22 M 140-189-223-293-311 + - + + + + - + - Bhoksa 228 M 178-223-316AT-325 + Bhoksa 2 M 223-241 + - + + + + - + - Bhoksa 229 M 223-311-367AC + Bhoksa 6 M 93-223 + - + + + + - + - Bhoksa 8 M 95-223-249-359 + - + + + + - + Bhoksa 21 M 95-223-249-359 + - + + + + - + Bhoksa 3 M18223-318AT + - + + + + - + - Bhoksa 12 M2 223-270-319-352 + - + + + + - + Bhoksa 17 M3 126-223-311 + - + + + + - + - Bhoksa 99 M3 92-126-223-286 + - + + + + - + - Bhoksa 29 R 126-176-181-209 + + + - - - Bhoksa 10 R 129-362 + + + - - - Bhoksa 15 R CRS + + + - - - Bhoksa 230 U2a 51-206AC-230-304-311 - Bhoksa 23 U2a 51-93TA-154-206AC-230-311 + + + - - + Bhoksa 225 U7 318AT-343 - -
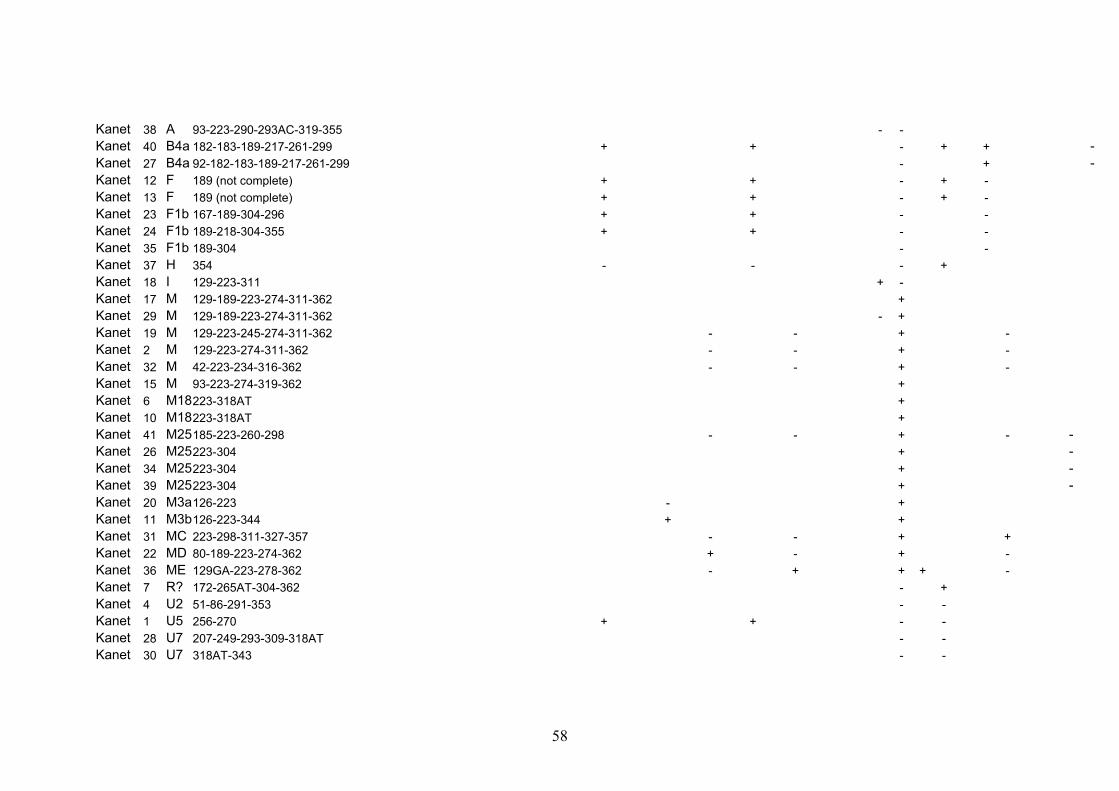
58
Kanet 38 A 93-223-290-293AC-319-355 - - Kanet 40 B4a 182-183-189-217-261-299 + + - + + - Kanet 27 B4a 92-182-183-189-217-261-299 - + - Kanet 12 F 189 (not complete) + + - + - Kanet 13 F 189 (not complete) + + - + - Kanet 23 F1b 167-189-304-296 + + - - Kanet 24 F1b 189-218-304-355 + + - - Kanet 35 F1b 189-304 - - Kanet 37 H 354 - - - + Kanet 18 I 129-223-311 + - Kanet 17 M 129-189-223-274-311-362 + Kanet 29 M 129-189-223-274-311-362 - + Kanet 19 M 129-223-245-274-311-362 - - + - Kanet 2 M 129-223-274-311-362 - - + - Kanet 32 M 42-223-234-316-362 - - + - Kanet 15 M 93-223-274-319-362 + Kanet 6 M18223-318AT + Kanet 10 M18223-318AT + Kanet 41 M25185-223-260-298 - - + - - Kanet 26 M25223-304 + - Kanet 34 M25223-304 + - Kanet 39 M25223-304 + - Kanet 20 M3a126-223 - + Kanet 11 M3b126-223-344 + + Kanet 31 MC 223-298-311-327-357 - - + + Kanet 22 MD 80-189-223-274-362 + - + - Kanet 36 ME 129GA-223-278-362 - + + + - Kanet 7 R? 172-265AT-304-362 - + Kanet 4 U2 51-86-291-353 - - Kanet 1 U5 256-270 + + - - Kanet 28 U7 207-249-293-309-318AT - - Kanet 30 U7 318AT-343 - -
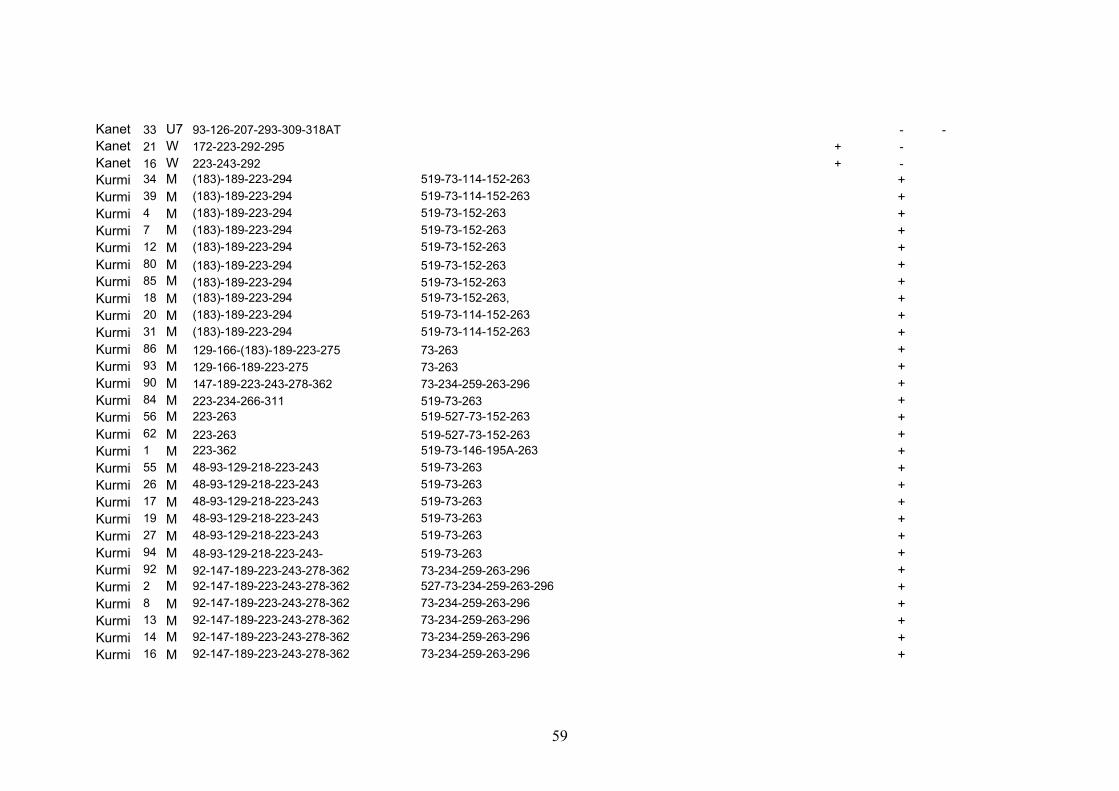
59
Kanet 33 U7 93-126-207-293-309-318AT - - Kanet 21 W 172-223-292-295 + - Kanet 16 W 223-243-292 + - Kurmi 34 M (183)-189-223-294 519-73-114-152-263 + Kurmi 39 M (183)-189-223-294 519-73-114-152-263 + Kurmi 4 M (183)-189-223-294 519-73-152-263 + Kurmi 7 M (183)-189-223-294 519-73-152-263 + Kurmi 12 M (183)-189-223-294 519-73-152-263 + Kurmi 80 M (183)-189-223-294 519-73-152-263 + Kurmi 85 M (183)-189-223-294 519-73-152-263 + Kurmi 18 M (183)-189-223-294 519-73-152-263, + Kurmi 20 M (183)-189-223-294 519-73-114-152-263 + Kurmi 31 M (183)-189-223-294 519-73-114-152-263 + Kurmi 86 M 129-166-(183)-189-223-275 73-263 + Kurmi 93 M 129-166-189-223-275 73-263 + Kurmi 90 M 147-189-223-243-278-362 73-234-259-263-296 + Kurmi 84 M 223-234-266-311 519-73-263 + Kurmi 56 M 223-263 519-527-73-152-263 + Kurmi 62 M 223-263 519-527-73-152-263 + Kurmi 1 M 223-362 519-73-146-195A-263 + Kurmi 55 M 48-93-129-218-223-243 519-73-263 + Kurmi 26 M 48-93-129-218-223-243 519-73-263 + Kurmi 17 M 48-93-129-218-223-243 519-73-263 + Kurmi 19 M 48-93-129-218-223-243 519-73-263 + Kurmi 27 M 48-93-129-218-223-243 519-73-263 + Kurmi 94 M 48-93-129-218-223-243- 519-73-263 + Kurmi 92 M 92-147-189-223-243-278-362 73-234-259-263-296 + Kurmi 2 M 92-147-189-223-243-278-362 527-73-234-259-263-296 + Kurmi 8 M 92-147-189-223-243-278-362 73-234-259-263-296 + Kurmi 13 M 92-147-189-223-243-278-362 73-234-259-263-296 + Kurmi 14 M 92-147-189-223-243-278-362 73-234-259-263-296 + Kurmi 16 M 92-147-189-223-243-278-362 73-234-259-263-296 +

60
Kurmi 59 M 92-147-189-223-243-278-362 73-234-259-263-296 + Kurmi 61 M 92-147-189-223-243-278-362 73-234-259-263-296 + Kurmi 72 M 92-147-189-223-243-278-362 73-234-259-263-296 + Kurmi 76 M 92-147-189-223-243-278-362 73-234-259-263-296 + Kurmi 57 M 92-147-189-223-243-278-362 73-234-259-263-296 + Kurmi 35 M 92-147-189-223-243-278-362 519-73-234-259-263-296 + Kurmi 24 M 92TA-147-189-223-243-278-291-362 73-234-259-263-296 + Kurmi 10 M 93-129-223-291 519-73-146-263 + Kurmi 83 M 93-129-223-291 519-73-146-263 + Kurmi 15 M2a75-86-(183)-223-242-270-274-319-352 519-73-263 + + Kurmi 75 M2b169insC-189-223-274-319-320 519-73-146-182-195-263 + + Kurmi 22 M2b223-265C-274-319 519-73-146-207-263 + + Kurmi 87 M2b223-265C-274-319 519-73-146-263 + + Kurmi 66 M6 188-223-231-293-362 519-73-146-152-263 - + Kurmi 88 M6 188-223-231-362 519-73-146-152-263 - + Kurmi 91 M6 188-223-231-362 519-73-146-152-263 - + Kurmi 40 M6 189-223-231-291-319-362 519-73-44iC-228-263 - + Kurmi 78 Q1 223-266-304-311-355-356 519-524-73-152-263 - - Kurmi 70 Q1 304-311-355-356 519-524-73-152-263 - - Kurmi 6 R 129-266-318-320-362 519-73-228-263 - - Kurmi 36 U2 51-169-234-278 519-73-152-263 - + Kurmi 33 U2 51-169-234-278 519-73-152-263 - + Kurmi 29 U2 51-86-240-291-352-353 73-146-150-195-234-263 - + Kurmi 71 U2 51-86-240-291-352-353 73-146-150-195-234-263 - + Kurmi 74 U2 51-86-240-291-352-353 73-146-150-195-234-263 - + Kurmi 5 U7 223-309-318T 519-73-151-152-263 - + Lodha 10 M 183-189-223-294-332N 519-73-152-263 + Lodha 19 M 184-189-223-300 519-53-73-143-146-152-263 + Lodha 38 M 184-189-223-300 519-53-73-143-146-152-263 Lodha 59 M 184-189-223-300 519-53-73-143-146-152-263 Lodha 34 M 184-189-223-300 519-53-73-143-146-152-263 Lodha 60 M 184-189-223-300 519-53-73-143-146-152-263
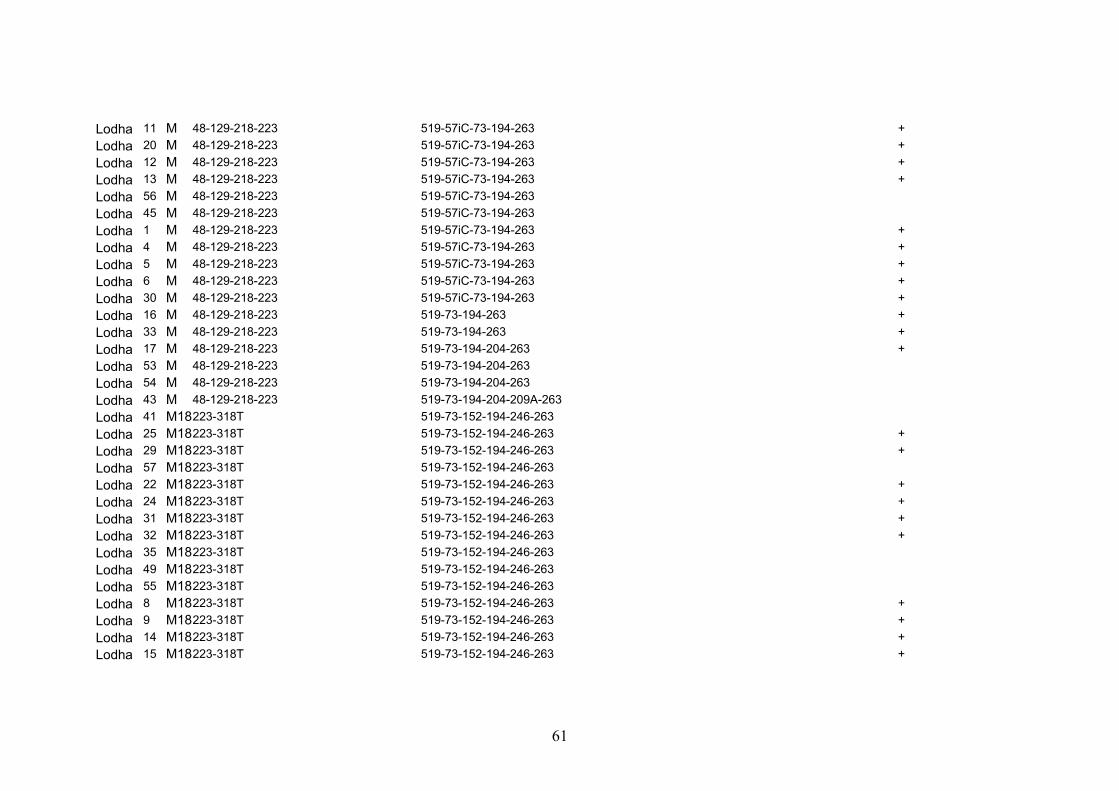
61
Lodha 11 M 48-129-218-223 519-57iC-73-194-263 + Lodha 20 M 48-129-218-223 519-57iC-73-194-263 + Lodha 12 M 48-129-218-223 519-57iC-73-194-263 + Lodha 13 M 48-129-218-223 519-57iC-73-194-263 + Lodha 56 M 48-129-218-223 519-57iC-73-194-263 Lodha 45 M 48-129-218-223 519-57iC-73-194-263 Lodha 1 M 48-129-218-223 519-57iC-73-194-263 + Lodha 4 M 48-129-218-223 519-57iC-73-194-263 + Lodha 5 M 48-129-218-223 519-57iC-73-194-263 + Lodha 6 M 48-129-218-223 519-57iC-73-194-263 + Lodha 30 M 48-129-218-223 519-57iC-73-194-263 + Lodha 16 M 48-129-218-223 519-73-194-263 + Lodha 33 M 48-129-218-223 519-73-194-263 + Lodha 17 M 48-129-218-223 519-73-194-204-263 + Lodha 53 M 48-129-218-223 519-73-194-204-263 Lodha 54 M 48-129-218-223 519-73-194-204-263 Lodha 43 M 48-129-218-223 519-73-194-204-209A-263 Lodha 41 M18223-318T 519-73-152-194-246-263 Lodha 25 M18223-318T 519-73-152-194-246-263 + Lodha 29 M18223-318T 519-73-152-194-246-263 + Lodha 57 M18223-318T 519-73-152-194-246-263 Lodha 22 M18223-318T 519-73-152-194-246-263 + Lodha 24 M18223-318T 519-73-152-194-246-263 + Lodha 31 M18223-318T 519-73-152-194-246-263 + Lodha 32 M18223-318T 519-73-152-194-246-263 + Lodha 35 M18223-318T 519-73-152-194-246-263 Lodha 49 M18223-318T 519-73-152-194-246-263 Lodha 55 M18223-318T 519-73-152-194-246-263 Lodha 8 M18223-318T 519-73-152-194-246-263 + Lodha 9 M18223-318T 519-73-152-194-246-263 + Lodha 14 M18223-318T 519-73-152-194-246-263 + Lodha 15 M18223-318T 519-73-152-194-246-263 +

62
Lodha 37 M18223-318T 519-73-152-194-246-263 Lodha 44 M18223-318T 519-73-152-194-246-263 Lodha 47 M18223-318T 519-73-152-194-246-263 Lodha 48 M18223-318T 519-73-152-194-246-263 Lodha 18 M18223-318T 519-73-152-194-246-263 + Lodha 40 M18223-318T 519-73-152-194-246-263 Lodha 7 M18223-318T 519-73-152-194-246-263 + Lodha 2 M3b126-145-223 51-73-195-263 + + Lodha 23 M3b93-126-145-193-223 73-195-263 + + Lodha 26 M3b93-126-145-193-223 73-195-263 + Lodha 36 M3b93-126-145-223 73-195-263 Lodha 50 M3b93-126-145-223 73-195-263 + Lodha 27 M3b93-126-145-223 73-195-263 + Lodha 28 M3b93-126-145-223 73-195-263 + + Lodha 42 M3b93-126-145-223 73-195-263 Lodha 51 M3b93-126-145-223 73-195-263 Lodha 46 M3b93-126-145-223-319 73-195-263 + Lodha 21 M3b93-126-145-223-319 73-195-263 + Tharu 7 M 223 + Tharu 4 M 114-223-294-362TG + Tharu 2 M 129-223 + Tharu 33 M 129-223-291 + Tharu 1 M 145-223-234-316 - + - Tharu 20 M 169-172-223 + Tharu 34 M 172-223-362 Tharu 3 M 193-223-278-362TG + Tharu 16 M 223-179DEL + Tharu 946M 223-302 + - + + + + - + - Tharu 950M 93-129-223 + - + + + + - + - Tharu 949M3 126-223-368 + - + + + + - + - Tharu 9 M3a126-223 - + Tharu 5 M3b126-223-301 + +

63
Tharu 19 M4a145-176-223-261-311 + - - Tharu 37 M4a93-145-223-261-311 + + Tharu 92 MC 51-223-298-327 + - + + + + - + + Tharu 94 MD 114-223-294-318-362 + - - + + + - + Tharu 95 MD 223-362-390 + - - + + + - + - Tharu 948Q1 129-189-241-266-304 + + + - - Tharu 29 Q1 266-274-304-311-355-356 + + - + Tharu 28 R 229 + + - + Tharu 6 R 114-126-181-209-235 - Tharu 936R 71 + + + - - - Tharu 915R CRS + + + - - - Tharu 38 T 126-172-294-296-325 - + Tharu 925T 93-126-163-186-189-294 + + + - - - Tharu 17 U 184-247 + + - - + Tharu 11 U2 51-209-239-352-353 + + - + Tharu 951U2 51-209-239-352-353 + + + - - + Tharu 13 U2a 51-154-206AC-230-311 + + - - Tharu 26 U2a 51-206AC + + - - Tharu 30 U2a 51-93TA-154-206AC-230-311 + + - - Tharu 947U4 356 + + + - - + Tharu 25 W 223-292 - - - Tharu 18 223-311 - +
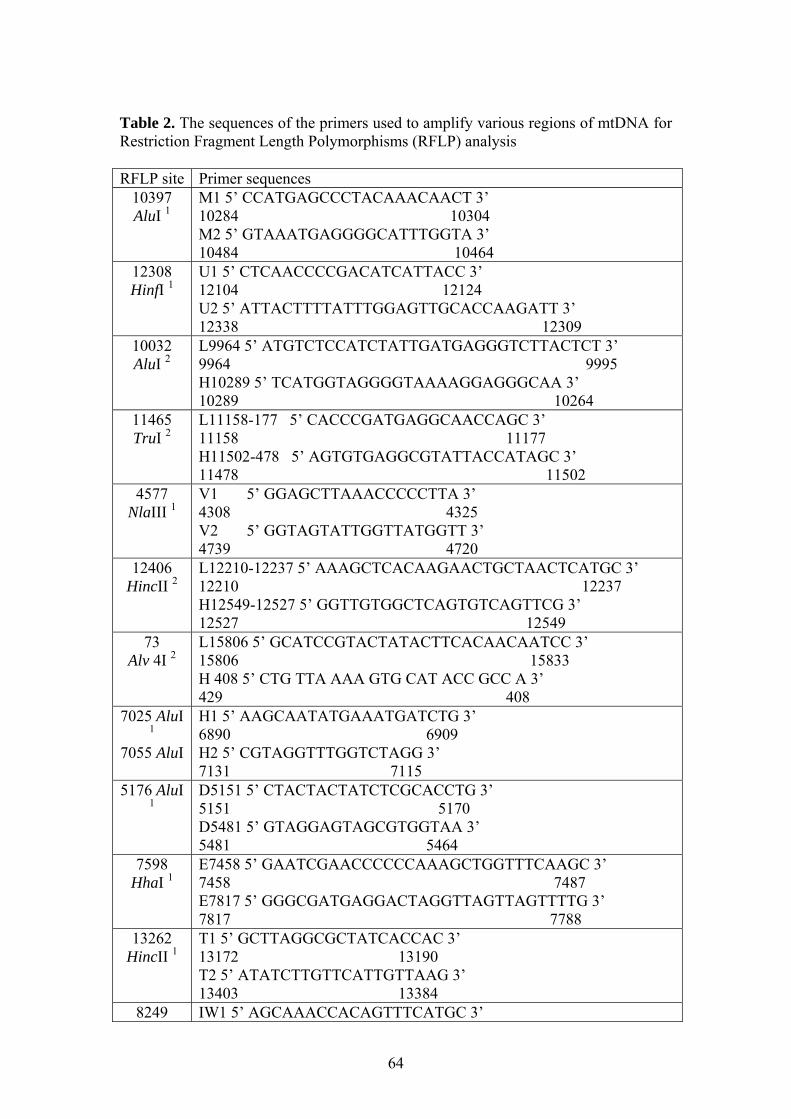
64
Table 2. The sequences of the primers used to amplify various regions of mtDNA for Restriction Fragment Length Polymorphisms (RFLP) analysis RFLP site Primer sequences
10397 AluI 1
M1 5’ CCATGAGCCCTACAAACAACT 3’ 10284 10304 M2 5’ GTAAATGAGGGGCATTTGGTA 3’ 10484 10464
12308 HinfI 1
U1 5’ CTCAACCCCGACATCATTACC 3’ 12104 12124 U2 5’ ATTACTTTTATTTGGAGTTGCACCAAGATT 3’ 12338 12309
10032 AluI 2
L9964 5’ ATGTCTCCATCTATTGATGAGGGTCTTACTCT 3’ 9964 9995 H10289 5’ TCATGGTAGGGGTAAAAGGAGGGCAA 3’ 10289 10264
11465 TruI 2
L11158-177 5’ CACCCGATGAGGCAACCAGC 3’ 11158 11177 H11502-478 5’ AGTGTGAGGCGTATTACCATAGC 3’ 11478 11502
4577 NlaIII 1
V1 5’ GGAGCTTAAACCCCCTTA 3’ 4308 4325 V2 5’ GGTAGTATTGGTTATGGTT 3’ 4739 4720
12406 HincII 2
L12210-12237 5’ AAAGCTCACAAGAACTGCTAACTCATGC 3’ 12210 12237 H12549-12527 5’ GGTTGTGGCTCAGTGTCAGTTCG 3’ 12527 12549
73 Alv 4I 2
L15806 5’ GCATCCGTACTATACTTCACAACAATCC 3’ 15806 15833 H 408 5’ CTG TTA AAA GTG CAT ACC GCC A 3’ 429 408
7025 AluI 1
7055 AluI
H1 5’ AAGCAATATGAAATGATCTG 3’ 6890 6909 H2 5’ CGTAGGTTTGGTCTAGG 3’ 7131 7115
5176 AluI 1
D5151 5’ CTACTACTATCTCGCACCTG 3’ 5151 5170 D5481 5’ GTAGGAGTAGCGTGGTAA 3’ 5481 5464
7598 HhaI 1
E7458 5’ GAATCGAACCCCCCAAAGCTGGTTTCAAGC 3’ 7458 7487 E7817 5’ GGGCGATGAGGACTAGGTTAGTTAGTTTTG 3’ 7817 7788
13262 HincII 1
T1 5’ GCTTAGGCGCTATCACCAC 3’ 13172 13190 T2 5’ ATATCTTGTTCATTGTTAAG 3’ 13403 13384
8249 IW1 5’ AGCAAACCACAGTTTCATGC 3’

65
AvaII 1 8188 8207 IW2 5’ TTTCACTGTAAAGAGGTGTTGG 3’ 8366 8345
3539 AluI 1
L1 5’ CTAGGCTATATACAACTACGC 3’ 3388 3408 L2 5’ GGCTACTGCTCGCAGTG 3’ 3717 3701
447 HinfI F 330 5’ CACTTAAACACATCTCTGCC 3’ 330 349 R-470mm451G M2 5’ TGGGAGTGGGAGGGGAAAAGAAT 3’ 470 451
4830 HaeIII 1
G4711 5’ CCGGACAATGAACCATAACCAATACTACCA 3’ 4711 4740 G4969 5’ CAACTGCCTGCTATGATGGA 3’ 4969 4950
15606 AluI 1
T3 5’ CCTTACTACACAATCAAAG 3’ 15409 15428 T4 5’ GGCGAAATATTATGCTTTGT 3’ 15701 15682
13704 BstOI 1
J1 5’ CCTCCCTGACAAGCGCCTATAGC 3’ 13583 13605 J2 5’ CTAGGGCTGTTAGAAGTCCT 3’ 13843 13824
12704 MboII 2
L12495-12525 5’ ATTCATGTGCCTAGACCAAGAAGTTATTATC 3’ 12495 12525 H12788-12763 5’ GATATAATTCCTACGCCCTCTCAGCC 3’ 12763 2788
1 (Torroni et al. 1994a) (Torroni et al. 1996) 2 (Hofmann et al. 1997)

66
Figure 1. A more detailed general backbone of the global mtDNA tree. Positions of mutations and restriction site losses and gains are indicated and aligned to show the ancestral and derived state.
10034; 15924; 16129; 16391; 00199; 00204; 00250
(+AluI)
16311
I*
10238 12501
+ HphI - - NlaIII +
1039
8- D
deI +
15043
8252+ AvaII -
1626
5; 16
201
14470; 16278 16189 00153 00195 00225
+ AccI -
16176CG; 16145
16147CG
16172 16248
16355
Ő*
8252 8994 16292 00189 00195 00204
- AvaII + + HaeIII -
10400 489 14783 15043
- AluI + + VspI - 16298
16362
16189 16249 16311
16319
4580 16126- NlaIII +
16129
16231
16311
9824
- Sch
I +
L3m
3594
- Hpa
I +
10084 16362+ TaqI -
1627
816390
+ HinfI -
1080
6
161
87
1618
9 1
6311
- Hin
fI +
16294
L2*
16270 16264 16126
1614816129
L1*
Ü
X249del
16304
16298
R9
W
Ä
15606 13366 14905+ AluI - + BamHI - - NlaIII+
13708 1
0398 12612 16069 0
0295
- BstOI + -
DdeI + + MslI -
4216
11251
+ NlaIII -
+ TspRI -
12629 16163 16186 16189
- AvaII +
1423
3 1
6296
T*
7476
16
145
162
61
- Alu
I +
16193
J
7028(AluI)
16311
5004DdeI
3010(Bsh1236I)
143816265
16482(DdeI)
456
6776
H
4580(NlaIII)
V
16189
1621710398(DdeI)B
12406(HincII)
1004HincIIF
12705(MboII)
1719(DdeI)
5417(TasI) 663
(HaeIII)
8701
N
12308HinfI
11719(SmaI)
16266
16126R
L1b
4310 4
583 5711 1
6172 16188CG 16278 16320
+ AluI - + AluI -
L1a
root
8252+ AvaII -
9bpDEL 16169 16193 1695
8616 16124
+ MboI -
2349 16051 16264
+ MboI -
1476
9 1
6209
1629
2 16
311
+ Tr
u1I -
L3*
L3b
16181
4216(NlaIII)
16217pre-HV2
16189
9052HaeII
F1
F2
13262 16327
- AluI +
C
4833- HaeII + G
7598 16227 16278
+ HhaI -
E
5178
CA+ A
luI -
D*
16185 16224 16260 Z
M1
M4
M3
16189 16274 16320
16270 16352
M2
M5M6
M2b
M2a
16129C
U2e
16219
U6
I1
1629
5
16147A
Ő2Ő1
L3eL3dL3g
L3f
16278 16243
L1cL2*
12946 15882 12300 6296 16166
+ DdeI - + A
vaII - -HaeIII +
L1e
2758 16230
+ RsaI -
*
16360 16294
L1d
16298
pre-V
4917 15928 16294+ BfaI - - MspI +
T1
T2
1629716209 M7
M8
J1
J2
R.
16223
+-
-9bp
-
R9a16355
16362
-7828(HhaI)
+11467(Tru1I)
+
12372
-
3197
9477
1811U 9698
16318T
16356
16249
16051
9055(HaeII)
16146
1622411025
10550(NlaIII)
11914(TaiI) 9093
K16234U8pre-K1
14793 7768
U5
13617
16270
5360(TasI)
15073(DdeI)
U7
11332(AluI)
U416234 16209
16206C
U2c
16189
16111
U1
F1aF1b-1617210084?(VspI)-
U7a
U7b
+ -
-
10398
(DdeI)+
U2b
U2a
16239
16311
1189
11299
14167
147983480
K2
K1
K4
15924
K3
11377
13104
(MboI)
14070
(TaqI)
+ +U1a
4990AluI -
U1b16327
16342
16172
14766(MseI)73 -+
16362
16220C
16311
16067
HV
-+
pre-HV1
4646(RsaI)+
8818
+
59996047
1462015693
U4a
U3?
16343?
72
15904(MseI)+
-
HV2
HV3
HV1
-
2706(NlaIII)+
?
8012RsaI- 5134
(AluI)+6262
MspI-
N1-
8448(SspI)
H1H3
-13759(AciI)-
H1a
+16293
73
16189
H2-
H2a
H2b
16162
4336(NlaIII)
H4+
16354 H5 4769(AluI)+
H6 4793(HaeIII)+
R.(Q)16304
H716362 +
16209
+
16257A
N9a
7933(DdeI)
-8391HaeIII
Y
TJ
N9+
146150
10398(DdeI) +
16126
1622316231
16266
16362
16187A
235 +
16261
12372
123585231
(Cac8I)
-
1626116136B4
B5
B4a
+16140
B4b
9540(BfaI)
10398(DdeI)-
10873(MnlI)
15301
+
-
17364248
48248794
1629016319
A4
A5
Y116189
16192U5a
16256
U5a1 16192
5656(NheI)U5b
14182
U5b2
16192
16144
U5b1+12618 16189
U5b1a
U5b1b
10927
+
L3
-
U
16304
H4a 4452
7309
9066 ?
??
H8
H5a 951
N
67
Original paper I Kivisild, T., Bamshad, M., Kaldma, K., Metspalu, M., Metspalu, E., Reidla, M., Laos, S., Parik, J., Watkins, W.S., Dixon, M.E., Papiha, S.S., Mastana, S.S., Mir, M.R., Ferak, V., Villems, R. (1999). Deep common ancestry of Indian and western Eurasian mtDNA lineages. Current Biology 9: 1331-1334.
68
Original paper II Kivisild, T., Kaldma, K., Metspalu, M., Parik, J., Papiha, S.S., Villems, R. (1999). The Place of the Indian mtDNA Variants in the Global Network of Maternal Lineages and the Peopling of the Old World. in Genomic Diversity. (Kluwer Academic/Plenum Publishers). 135-152.

69
Original paper III Kivisild, T., S. S. Papiha, S. Rootsi, J. Parik, K. Kaldma, M. Reidla, S. Laos, M. Metspalu, G. Pielberg, M. Adojaan, E. Metspalu, S. S. Mastana, Y. Wang, M. Gölge, H. Demirtas, E. Schnekenberg, G. F. Stefano, T. Geberhiwot, M. Claustres, and R. Villems. (2000). An Indian Ancestry: a key for understanding human diversity in Europe and beyond, pp. 267-279. In C. Renfrew and K. Boyle (eds.), Archaeogenetics: DNA and the population prehistory of Europe. McDonald Institute for Archaeological Research University of Cambridge, Cambridge