Embed Size (px)
Citation preview

COMMON CORE INTERIM BENCHMARK
TECHNICAL MANUAL

Page | 1
Discovery Education Assessment
Common Core Interim Benchmark Technical Manual
Table of Contents
I. Introduction: Discovery Education Assessment . . . . . 2
II. Assessment Standards and Content Validity . . . . . . 3
A. Common Core Standards . . . . . . . 3
B. Test Development and Review . . . . . . . 4
C. Web Alignment . . . . . . . . 8
III. Test Administration Online . . . . . . . . 9
IV. Test and Item Scores and Test Reports . . . . . . 10
A. Test and Item Scores . . . . . . . . 10
B. Interim Assessment Reports . . . . . . . 11
C. Interim Assessment Reports Examples . . . . . . 12
V. Reliability, Proficiency Levels, Validity and Growth . . . . . 21
A. Test Reliability . . . . . . . . . 21
B. Proficiency Levels . . . . . . . . 22
C. Validity . . . . . . . . . 23
D. Vertical Scale Averages and Growth . . . . . . 26
Appendices . . . . . . . . . . . 29
A. Test and Question Statistics, Reliability and Scale Scores . . . . . 29
B. Web Alignment Study . . . . . . . . . 42

Page | 2
I. Introduction: Discovery Education Assessment
Discovery Education has focused on the use of formative assessments to improve K-12 student learning
and performance. Bridging the gap between university research and classroom practice, Discovery
Education Assessment offers effective and user-friendly assessment products that provide classroom
teachers and students with the feedback needed to strategically adapt their teaching and learning activities
throughout the school year.
Discovery Education Assessment has pioneered a unique approach to formative assessments using a
scientifically research-based continuous improvement model that maps diagnostic assessments to each
state’s high stakes summative tests. Discovery Education Assessment’s Predictive Test-Specific Interim
Assessments are aligned to the content assessed by each summative assessment allowing teachers to track
student progress toward the standards and objectives used for accountability purposes.
Furthermore, Discovery Education Assessment subscribes to the Standards for Educational and
Psychological Testing articulated by the consortium of the American Educational Research Association,
the American Psychological Association, and the National Council on Measurement in Education.
This technical manual presents information about the Common Core Interim Assessments used during
2010-2011.
Discovery Education Assessment across the United States
In 2010-2011 over 1.2 million K-12 students in the United States took at least one interim benchmark
assessment created by Discovery Education Assessment. These students were found in twenty different
states across the country. As more states transition to the Common Core State Standards, more students
are being assessed with DEA’s Common Core Interim Benchmark Assessments.

Page | 3
II. Assessment Standards and Content Validity
Content validity evidence shows that test content is appropriate for the particular constructs that are
being measured. Content validity is measured by agreement among subject matter experts about test
material and alignment to state standards, by highly reliable training procedures for item writers, by
thorough reviews of test material for accuracy and lack of bias, and by examination of depth of
knowledge of test questions.
To ensure content validity of all tests, Discovery Education Assessment carefully aligns the content of its
assessments to a given state’s content standards and the content sampled by the respective high stakes
test. Discovery Education Assessment hereby employs one of the leading alignment research
methodologies, the Webb Alignment Tool (WAT), which has continually supported the alignment of
our tests to state specific content standards both in breadth (i.e., amount of standards and objectives
sampled) and depth (i.e., cognitive complexity of standards and objectives). All Discovery Education
Assessment tests are thus state specific and feature matching reporting categories of a given state’s
large-scale assessment used for accountability purposes.
Common Core Standards
The Common Core State Standards Initiative is a state-led effort to establish a shared set of educational
standards in English language arts and mathematics for grades K-12. The standards are adopted
voluntarily by state, and are designed to prepare students to be ready to enter college or join the
workforce upon graduation. These standards will not be tested until the 2014-2015 school year.
Since the implementation of the Common Core standards, Discovery Education Assessment is working
with the adopted states to help transition to these new standards from their old state standards. Below are
the Common Core State Standards that can be found on the interim benchmark assessments in Reading
and Mathematics, grades 3-8, and Algebra 1 & 2 in High School.
Common Core English Language Arts Reporting Categories
Reading: Literature English Language Arts Standards : Writing
Reading: Informational Text English Language Arts Standards: Language
Reading: Foundational Skills English Language Arts Standards: Listening &
Speaking
Common Core Algebra 1 & 2 Reporting Categories
Number & Quantity Functions
Algebra Statistics & Probability

Page | 4
Common Core Mathematics Reporting Categories
Operations & Algebraic Thinking Ratios & Proportional Relationships
Number & Operations in Base Ten The Number System
Number & Operations—Fractions Expressions & Equations
Measurement & Data Geometry
Statistics & Probability
Test Development and Review
Alignment
For the last nine years, Discovery Education has led in assuring educators that its items are aligned
specifically to each state’s curriculum or district pacing guide. Every change in a state’s curriculum was
carefully identified and items changed to meet the current year’s statewide assessment.
Alignment is done by trained test developers who have subject matter expertise, teaching experience in
the grade/subject, and the assessment expertise to produce appropriate items. Each individual has
certification in the grade/subject and has at least three years teaching experience in the area. The
alignment is managed within our software and mapped one item at a time. This is not a software
alignment but rather a teacher who compares each item to the state standard to determine if it is
aligned.
We begin by matching our tests to the Common Core State Standards that are assessed. We agree that for
teachers to have confidence in the results, they must be assured that an assessment is aligned to their
standards. The test has to exhibit content validity, which is demonstrated when test items represent the
subject area, such as math or reading. In other words, a math assessment must have items that match or
align to the Common Core Standards and benchmarks defined by a state’s curriculum and high stakes’
test. Difficulty levels are based on actual prior student performance and provide teachers with a crucial
comparison of how a current class or individual student compares to what is generally expected of student
performance on these items.
Discovery Education Assessment pioneered a unique approach to benchmark assessments using a
scientifically research-based continuous improvement model that maps diagnostic assessments to each
state’s high stakes test. Discovery Education’s Predictive Test-Specific Benchmark tests are aligned to
the content assessed by each state test allowing teachers to track student progress toward the standards
and objectives used for accountability purposes. This same predictive approach is being applied to state
tests as they transition to Common Core assessments.

Page | 5
Items
Discovery Education employs only certified, experienced teachers with content majors and master’s
degrees to align, create, and develop items; the content review, copy editing, and quality control
departments are also staffed by competent, qualified teachers with graduate degrees. Discovery Education
intentionally employs teachers with familiarity in varied subjects, age groups, and ability levels, which
gives the item development teams an impressive range of expertise. They work with psychometric staff to
review and systematically match items to Common Core standards. All items have appropriate
psychometric properties from field testing that permit accurate, valid, and reliable predictive tests. Our
commitment to rely on competent, seasoned educators throughout the entire development process assures
that items and tests are accurate, appropriate, and accessible.
Discovery Education content team begins the test development process with the state standards, test
blueprints and test specifications. We begin by matching our items to the Common Core standards that
are assessed.
No software tool can sufficiently match items to state standards. Curriculum experts must do this job one
item at a time. Discovery Education Assessment’s software facilitates the curriculum expert’s job of
aligning each item to a Common Core standard. This task is re-aligned every year, using prior year
student performance statistics to assure continuous alignment, reliability, and validity. All Common Core
standards are loaded into the Discovery Education Assessment tool, which allows our curriculum experts
to build state-specific tests. Item notes and field test data are available at the time of item selection for
each grade and subject test.
Bias Statistics
All Discovery Education assessments incorporate a systematic, official statistical bias analysis, using
Rasch analysis on gender, ethnicity, and differing abilities. Discovery Education Assessment is
committed to assuring students, teachers, and administrators that we are sensitive to and cognizant of the
need for assessments to be bias-free. While it is important to know that a test measures what it is
purported to measure, it is just as important to know what a test does not measure. Discovery Education
assessments are designed and reviewed to guard against culture or gender bias and to address issues of
disability.
Types of Items
Discovery Education assessments feature multiple choice questions that measure the maximum range of
cognitive skills in the content areas. Using multiple choice questions reduces the cost, test taking time,
and provides immediate results with diagnostic and predictive capabilities. However, we generally
include constructive response open response and performance tasks with the assessments that could be

Page | 6
manually scored and used by teachers in the classrooms for formative purposes. In addition, Discovery
Education services provide access to performance tasks and tools for locally created items.
Refreshing Item Pool
Discovery Education Assessment routinely works with schools to field test new benchmark items to
replenish our pool of available items. This approach assures that we continuously have field tested items
available. This improvement process also assists our test coordinators to receive specific feedback on
every item, thereby further increasing the reliability of each item included.
Quality Control
Quality control is a crucial aspect of Discovery Education Assessment’s approach to item construction.
The quality control process ensures that every component of a Discovery product is consistent and
accurate within and across printed or online versions of tests. The quality control department
determines that the online and printed versions of tests match exactly, that reports are accessible and
complete, and that scores on Discovery Education tests are correlated to the proficiency or mastery
specifications provided by the state. A key role of the quality control department involves testing the
functionality of the online interface and examining reports for accuracy.
Copy Editing & Proofreading
A vital part of the development team is the finalization team, responsible for ensuring the typographical
accuracy of all assessments. The copy editing personnel proofread the assessments after they are released
from the content review team. The editors correct any typographical or mechanical errors that appear in
the test, and they also look for errors in the layout and placement of graphics, instructions, page numbers,
or margins. Copy editors also perform a final examination of formatting to ensure that each test is
formatted to match the state’s high stakes tests’ formatting. When the assessment is proofread and
necessary changes are made, the test is converted into PDF format, then proofread again. If any errors still
exist, they are corrected before a copy of the final test is posted for printing. The proof from the printer is
then edited one final time. These multiple instances of thorough proofreading enable Discovery Education
to produce tests that are not only exemplary in content but also accurate in grammar and mechanics.
Overview of Benchmark Item Review Steps
Items are reviewed multiple times by experienced teachers, a psychometrician, a grammar
expert, and Director of Testing for spelling errors, errors in usage, and awkward phrasing.
All items are reviewed by at least 2 reviewers to have a single correct answer and appropriate
distracters.
All items are reviewed for grade appropriateness in content and readability, using Flesch-
Kincaid scale.

Page | 7
Items have field test and actual administration data to support reliability of grade level in terms
of difficulty and content validity.
Item Depth of Knowledge (DOK) is reviewed and displayed for educators on reports.
Where items are expected to include vocabulary “above grade level,” items are reviewed to
assure that context clues are on grade level.
In math items, required computations are reviewed to be appropriate for grade level and
appropriate to the time-constraints of the formative environment.
Items that require critical thinking skills are measured in terms of steps required and the
difficulty levels to provide an appropriate mix across the skill area.
Many items require graphics to support the thinking skill measurement. These items are
reviewed to assure that the graphics print and appear on the web with clarity, appropriate level
of detail, and appropriate grade level to measure the skill.
Graphic items are kept simple enough to assure web display within 2-3 seconds but complex
enough to measure the skill or accomplishment being tested.
Item answers are varied to distribute them randomly across answer options A, B, C, and D so
that no discernable pattern is possible for correct answers.
Web Alignment
Discovery Education contracted with an independent research team, Test Prep, led by Dr.
Michael K. Smith in April 2012 to conduct a Web alignment study of the Discovery
Education interim benchmark assessments with the Common Core State Standards. This
process is repeated after any revisions are made to the interim benchmark assessments.
The WAT (Web Alignment Tool) version 2 was used to measure categorical concurrence,
depth-of-knowledge consistency, range-of-knowledge correspondence and balance of
representation. A summary of the results are below. Results of this study are being used to
make appropriate revisions to the 2012-2013 interim benchmarks. A plan of action has
already been set in place to increase depth-of-knowledge consistency in the reading
assessments and the categorical concurrence in the mathematics assessments. For more
details on this alignment study, please see Appendix B for the document Web Alignment
Study of Discovery Education Assessment Benchmarks with Common Core Standards.

Page | 8
Mathematics Tests Alignment Summary
YES WEAK NO TOTAL
# % # % # % #
Categorical
Concurrence 59 63% 34 37% 93
Depth-of-Knowledge
Consistency
93 100% 0 0% 0 0% 93
Range of Knowledge
90 97% 3 3% 0 0% 93
Balance of
Representation 91 98% 2 2% 0 0% 93
Reading Tests Alignment Summary
YES WEAK NO TOTAL
# % # % # % #
Categorical
Concurrence 58 82% 13 18% 71
Depth-of-Knowledge
Consistency 57 80% 8 11% 6 8% 71
Range of Knowledge
62 87% 9 13% 0 0% 71
Balance of
Representation 70 99% 1 1% 0 0% 71

Page | 9
III. Test Administration Online
To administer interim benchmark tests online an administrator must first import students to the
Discovery Education website (www.discoveryeducation.com). Once students are imported and
populated into grade pool and teacher classes, testing can begin at any time after the
recommended window opens. For steps on importing students, populating classes, and
administering interim benchmarks online, please refer to the Assessment User Guide. This
document is located at: http://assessment.discoveryeducation.com/start and on the help site at
discoveryeducation.com.

Page | 10
IV. Test and Item Scores and Test Reports
Test and Item Scores
Discovery Education Assessment reports the following item and test scores on its Interim Assessments.
Student Level Scores:
Test Percent Correct: The percent correct on an interim benchmark
Test Number Correct: The number correct on an interim benchmark
Reporting Category Percent Correct: The percent correct on a particular reporting category
Reporting Category Number Correct: The number correct on a particular reporting category
Vertical Scale Score: A scale score on a 1000 to 2000 scale
State Percentile: The percent of students that score lower than a particular scale
score. The state percentile is based on all students in a particular
state that completed an interim assessment
National Percentile: The percent of students that score lower than a particular scale
score. The national percentile is based on a stratified random
national sampling of students who completed an interim
assessment
Proficiency Prediction: A prediction of the level of student performance
Class, Grade, School, and District Level Scores:
Item Percent Correct: The percent of students in a class, grade, school or district that
answer an item correctly
Item Percent Incorrect: The percent of students in a class, grade, school, or district that
answer an item incorrectly
Test Mean Number Correct: The arithmetic mean (average) of the number correct on an
interim assessment for a class, grade, school, or district
Test Mean Percent Correct: The arithmetic mean (average) of the percent correct on an
interim assessment for a class, grade, school, or district
Vertical Scale Mean: The arithmetic mean (average) of the vertical scale score on an
interim assessment for a class, grade, school, or district
Proficiency Level Number: The number of students in each proficiency level on an interim
assessment for a class, grade, school, or district

Page | 11
Proficiency Percent: The percent of students in each proficiency level on an interim
assessment for a class, grade, school, or district
Median State Percentile: The middle value of all state percentiles for a school or district
Interim Assessment Reports
Discovery Education produces multiple standard report formats to coincide with each interim assessment,
as well as dynamic district reports. Interactive reports are linked to recommended digital remediation
selected from Discovery Education’s award-winning streaming. Discovery Education recognizes the
tremendous value in prompt, easy to read reports that allow all stakeholders, including students, parents,
teachers, administrators and district staff, to instantly determine how learning is progressing. While the
software and standard reports are not customizable, all reports allow easy export of data to CSV or
EXCEL file formats for flexible reporting or import into other reporting tools.
Discovery Education Assessment reports the following:
For Teachers:
Proficiency predictions by subject point to which students are at risk.
Predictions of proficiency levels within each Common Core standard define specifically
what to focus on in remediation.
Performance Indicator results viewed with the test items to define detailed gaps in student
thinking processes.
Growth of student performance across time and comparable across grade, school, and
district.
Additionally, digital instructional resources, targeted by Performance Predictor, which
teachers can assign.
For Administrators:
Summarized grade, school, and district learning status for each subject and standard by
proficiency level.
Growth of student performance across time and comparable across grade, school, and
district.
Identification of all student results by Common Core standards to examine possibilities
for professional development and need for new texts and resources.
Guided priority for instruction of demographic subgroups and examination of results of
special programs.
For community leaders, summarized status of each school for comparison purposes, with
information during the year similar to state assessment reports.
For Students and Parents:
Predictions of student proficiency by subject
Growth of individual performance across time and compared to school and district
performance

Page | 12
Detail of skills and subskills mastered or in need of remediation
Individual student responses by item
Access to engaging digital content aligned to targeted skills and objectives
Interim Assessment Example Reports
This section provides annotated examples of each of the following Interim Assessment Reports:
Class and Grade Skill Summary Report
Student Skill Report
Student Sub-Skill Report A and B
Item Summary Report
Answers Report
Individual Student Report
Drill Down Report
Comparison Report
School Comparison Report
Scale Comparison Report
Subgroup/Disaggregated Reports
Comparative Growth Reports
School Reports
Class and Grade Skill Summary Report
The Class Summary Report identifies performance by skill for entire class or grade. Using the red,
yellow, and green stop light approach (Common Core also has blue), proficiency is shown for each
standard within reading,
math, and science. In this
example, the bar chart
displays the percent of
students Level 1 (red),
Level 2 (yellow), Level 3
(green), and Level 4
(blue) by each of the
reporting categories for
Reading. The actual
percentages for each
proficiency level for each
reporting category are
given in the table below
the bar chart.
Page | 13
Student Skill Report
The student skill report uses the same color-coded approach to plot individual student performance and
proficiency by skill. In this example, the level of performance on each skill for each student is presented.
Furthermore, in the two far left columns, the student overall proficiency level is presented together with
the number correct on the interim assessment.
Student Sub-skill Reports
This report displays performance on every Common Core sub-skill measured. Pale green means it is
correct, and the letter gives the student’s incorrect answer. This feature helps the teacher identify why the
student selected the wrong answer. Little teacher time is required to go through the whole set of reports.

Page | 14
Item Summary Report
The item summary report
presents information on every
question in an interim
assessment. The summary is
tallied over a class or grade.
For each question, the
following information is
provided: the correct answer;
the number and percent correct;
the number and percent
incorrect; the Common Core
reporting category (skill) and
reporting subcategory (sub-
skill); and the level of difficulty
of the question (easy, medium,
or hard). This report is also
available interactively. This
interactive feature allows a user
to sort by any of the information above and to search for resources tied to the skill or sub-skill questioned
such as streaming videos and quizzes.
Answer Report
The answer report provides each student’s specific response (ABCD) to each question on an interim
assessment. In the top row, the correct answers on the assessment are provided. Then, each student’s
individual choices (ABCD) on each question are listed. Summary information is provided on the right-
hand side: number correct, percent correct, state percentile rank, and vertical scale score. The student’s
overall subject proficiency is indicated by the highlighted color.
Page | 15
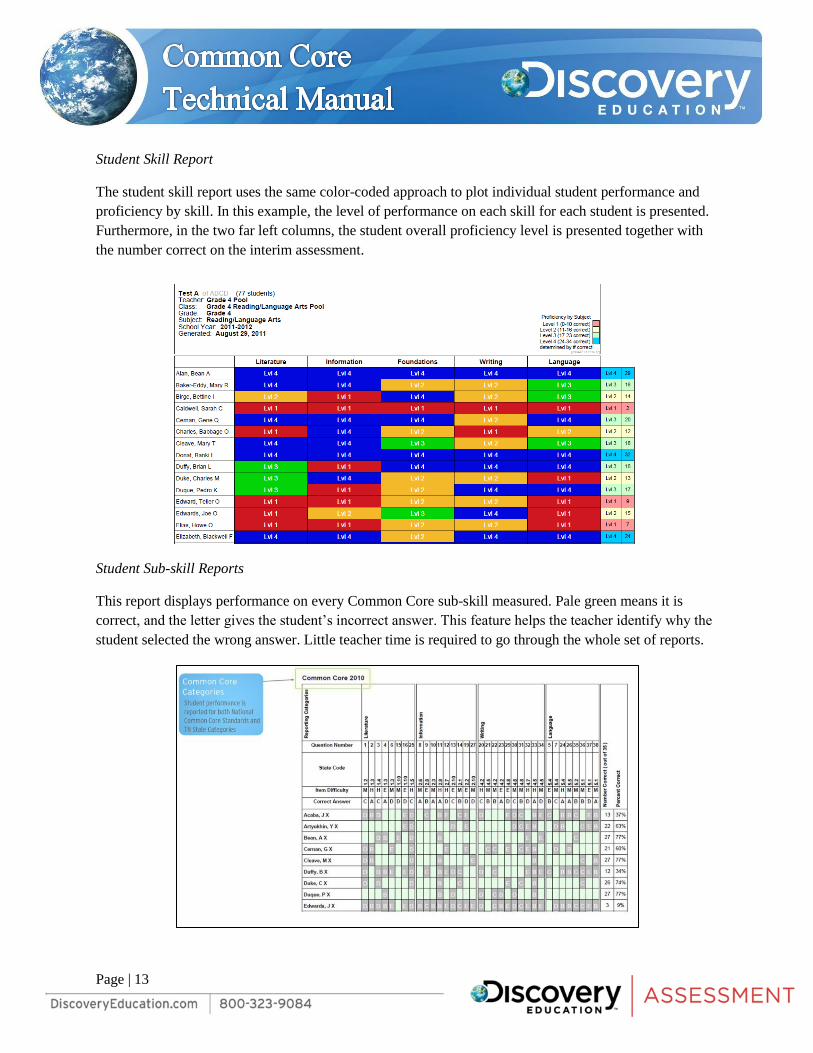
Individual Student Report
The individual student report summarizes scores on all interim assessments for an individual student. The
Overall Subject Summary (box to the right) displays the Number Correct, Total Questions in Test,
Percent Correct, Scale Score, and State Percentile for Test A, Test B, and Test C for this student. This
student has started at Level 2 (yellow) on Test A and has stayed consistently at that level on Test B and C.
A national percentile, based on Test B, is also included. The Growth chart on the left graphs the student’s
scores on the three assessments along with the school and district averages. Furthermore, the solid gray
line represents an End-of-Year Target score; to reach Level 3 at the end of the school year, a student
would need a scale score at or above this value. The Performance by Standard Summary table displays the
Proficiency level of this student by each of the five Mathematics standards. Finally, the student’s answers
to all questions are provided in the last table.

Page | 16
Drill-Down Report
District Administrators can compare schools. Both District and School Administrators can use a series of
drill down reports by grade, teacher, or student, and sort by proficiency prediction. They can also get
Microsoft Excel extractions of data, view comparisons across NCLB sub-group populations, and track
progress of all classes and schools.

Page | 17
Comparison Report
This report compares students across multiple testing periods and monitors student progress during the
year where they have recently concentrated instruction and where students have not retained learning
from earlier instruction.

Page | 18
Comparative Growth Report
This report helps teachers compare students with each other at the district or school level. This report will
be available when at least two benchmark tests have been completed. There are three sections to this
report.
Test 1 and Test 2 Regression
Each student is represented by a sphere. A
larger sphere indicates multiple students
with the same score on both tests. In the
teacher version, you can mouse over the
sphere to display the student name.
The horizontal axis is the first test and the
vertical access is the second test. The
vertical scores shown on each axis is defined
by the range of each proficiency level on
that particular test. As a comparison, the
grid boxes with color show all of the
students who scored within the same
proficiency level on both tests.
The heavy line across the chart shows the
regression line based on the students who
took these particular tests for either the
school or the district. A regression line
makes predictions of scores based on the
scores on a prior test. The dotted lines
represent the error bands of the regression
line. This is the lower and upper bound
values of the standard error of estimate. For
example, look at the chart above. If a
student scores a 1631 on test 1, we expect them to score somewhere approximately between 1611 and
1693 on test 2. A student scoring a 1499 on test 1, we only expect to score approximately between
1479 and 1561 on the second test.
You can individually view the school line in red or the district line in blue on this section of the report.
You also have the option of viewing them together at the same time; just select how you would like to
view in the “Select Report Criteria” section. If students are outside of the dotted lines, they have scored
higher or lower than the expected range on the second test based on how they scored on the first test.
The students’ names shown as small red spheres scored below their expected vertical score range on the
second test. The ones shown as small green spheres scored above their expected vertical score range on
the second test. All of the gray spheres represent students with a vertical score in their expected range.
If both lines are shown, students will be compared to the district line.

Page | 19
Test 1 to Test 2 Distribution of Change
This bar chart allows you to see
the distribution of scores from the
regression line. The higher above
or below the 0 line, the farther
away that score is from the
regression line. This is calculated
by the actual score on test 2 minus
the expected score on test 2.
This chart also displays the
standard error of the estimate
(SEE). The standard error of
estimate is a measure of the
average distance from the regression line, or the accuracy of the predictions. Notice that those scores
falling above or below the SEE lines are the ones displayed as red or green. These are the scores
identified as above or below average.
Ranked Order of Change
All of the students’ names are listed and organized
in three groups: Below Average Students, Above
Average Students and Average Students. This
section displays the scores on the first and second
test, color coded to display which proficiency level
their vertical score is associated with. Students
appear in ranked order according to their residual
scores, that is, the difference between their actual
test 2 scores and their expected test 2 scores.

Page | 20
District Reports
School Comparison Report
This report summarizes district
performance by proficiency
level on a specific interim
assessment together with
performance on the reporting
categories (skills) that comprise
that assessment. This report is
broken down by school to show
comparisons across the district.
This graph presents an example
of a Grade 3 Reading interim
assessment.
Scale Comparison Report
The scale comparison report is a table that displays the average scale scores for each of the tests and the
average change for the whole district and each individual school. It is broken down by grades and
subjects.
Detail Export
The detail export is a .csv or .xls report with student level data. This report has all the different data
points for each test the student has taken including overall subject and skill proficiency levels, number &
percent correct, state & national percentiles and vertical scores.

Page | 21
V. Reliability, Proficiency Predictions, Validity and Growth
Test Reliability
Test reliability provides evidence that test questions are consistently measuring a given construct, such
as mathematics ability or reading comprehension. Furthermore, high test reliability indicates that the
measurement error for a test is low. Reliabilities are calculated using Cronbach’s alpha.
The following tables present test reliabilities and sample sizes for Discovery Education Assessments for
four time periods—Fall (Test A), Winter (Test B), early Spring (Test C) and late Spring (Test D)—in the
subject areas of Reading and Mathematics for 2011-2012.
The median Reading reliabilities were .86, for Test A, B and C and .89 for Test D with median sample
sizes of 13,554, 11,414, 12,972 and 3,504. The median Mathematics reliabilities for the three time periods
were .79 for Test A and B, .81 for Test C and .85 for Test D. Median math sample sizes for 2011-2012
were 12,997, 11,261, 12,917 and 3,434.
DEA Common Core 2011-2012 Reading Reliability Coefficients
Test A Test B Test C Test D
N Reliability N Reliability N Reliability N Reliability
Grade 3 13,163 0.86 10,941 0.86 13,085 0.86 4,236 0.89
Grade 4 13,282 0.83 11,404 0.84 12,748 0.86 3,637 0.88
Grade 5 13,804 0.87 11,424 0.86 12,859 0.85 3,338 0.86
Grade 6 13,698 0.87 11,628 0.86 13,783 0.85 3,780 0.89
Grade 7 13,851 0.83 12,274 0.85 13,570 0.88 3,370 0.91
Grade 8 13,410 0.86 11,380 0.88 12,270 0.87 2,442 0.91
Median 13,554 0.86 11,414 0.86 12,972 0.86 3,504 0.89
DEA Common Core 2011-2012 Math Reliability Coefficients
Test A Test B Test C Test D
N Reliability N Reliability N Reliability N Reliability
Grade 3 13,068 0.82 10,923 0.82 13,054 0.84 4,022 0.86
Grade 4 12,934 0.78 11,261 0.79 12,553 0.81 3,503 0.86
Grade 5 13,527 0.82 11,136 0.82 12,779 0.81 3,277 0.84
Grade 6 13,704 0.76 11,394 0.75 14,089 0.79 3,809 0.83
Grade 7 13,060 0.80 11,753 0.78 13,532 0.81 3,365 0.83
Grade 8 12,374 0.82 11,302 0.80 12,129 0.84 2,421 0.86
Algebra 1 4,388 0.68 NA NA NA NA NA NA
Algebra 2 8,093 0.64 2,683 0.65 NA NA NA NA
Median 12,997 0.79 11,261 0.79 12,917 0.81 3,434 0.85

Page | 22
0%
5%
10%
15%
20%
25%
30%
Level 1 Level 2 Level 3 Level 4
% o
f St
ud
en
ts
Discovery Education Assessment: 20/30/30/20 Model
Proficiency Predictions
Discovery Education Assessment provides each student with a prediction of proficiency status on each of
their benchmark assessments. These interim benchmarks are designed to measure skills tested by the
future PARCC and SBAC summative assessments but in a more time-limited format. The results of these
benchmarks are intended to provide teachers, administrators, and students with reliable and valid
predictors of student performance. Discovery Education Assessment uses the Continue-to-Learn model
for providing proficiency predictions. The Continue-to-Learn model differs from an Absolute model in
that it does not give a prediction based on if the student took the state test at the same time. Instead, this
gives a prediction based on that student continuing to learn throughout the rest of the year up to the time
of their state test. With this model, there are fairly stable distributions of proficiency levels throughout
the year. The Continue-to-Learn model helps teachers identify at the beginning of the year those students
who need the most instruction and in what area that instruction is needed. With an Absolute model, a
large percentage of students would score as Not Proficient in the beginning of the year because many of
the skills have not yet been taught.
Discovery assessments feature four performance levels. There are no state proficiency levels to predict so
we must rely on Discovery created criterion referenced cut scores. A large representative sample of scores
on the Common Core assessments will be separated into four performance groups or levels. Twenty
percent of scores are identified for Level 1, thirty percent for Level 2, thirty percent for Level 3, and
twenty percent for Level 4.
Blue (Level 4) indicates a performance
level achieved by the top twenty percent of
students on the Common Core assessment.
Students at this level may be ready to learn more
advanced standards or to broaden their
knowledge of the grade level standards.
Green (Level 3) indicates a good
performance level, at or slightly above grade
level.
Yellow (Level 2) is tied to a performance
level at or slightly below grade level.
Red (Level 1) suggests a poor
performance level. The lowest fifth of all test
scores are at this level. The student with “Red”
scores may need significant support to achieve
the grade level standards specified by the
Kentucky Department of Education. Some
schools will consider these students for additional
assessments and Tier 2 or Tier 3 instructional
strategies under an RTI model.

Page | 23
Validity
Proficiency Prediction Score
The Proficiency Prediction Score is used to determine the accuracy of predicted proficiency status. Under
the NCLB legislation, it is important that states and school districts help students progress from a “Not
Proficient” status to one of “Proficient”. The Proficiency Prediction Score is based on the percentage of
correct proficiency classifications (Not Proficient/Proficient). If a state uses two or more classifications
for “Proficient” (such as “Proficient” and “Advanced”), the percentage of students in these two or more
categories would be added together. Also, if a state uses two or more categories for “Not Proficient” (such
as “Below Basic” and “Basic”), the percentage of students in these two or more categories would be
added together. To see how to use this score, let’s assume a school district had the following data based
on its annual state test and a Discovery Education Assessment Spring benchmark assessment. Let’s use
data from a Grade 4 Mathematics Test as an example:
Predicted Percent Proficient or higher = 70%
Actual Percent Proficient or higher on the State Test = 80%
The error rate for these predictions is as follows:
Error Rate = /Actual Percent Proficient - Predicted Percent Proficient/
Error Rate = 80% - 70% = 10%
In this example, Discovery Education Assessment under predicted the percent of students proficient by
10%. The absolute value (the symbols / / ) of the error rate is used to account for cases where Discovery
Education Assessment over predicts the percent of students proficient and the calculation is negative (e.g.,
Actual - Predicted = 70% - 80% = -10%; absolute value is 10%).
The Proficiency Prediction Score is calculated as follows:
Proficiency Prediction Score = 100% - Error Rate
In this example, the score is as follows:
Proficiency Prediction Score = 100% - 10% = 90%
A higher Proficiency Prediction Score indicates a larger number or percentage of correct proficiency
predictions. In this example, Discovery Education Assessment had a score of 90%. Discovery Education
Assessment uses information from these scores to improve its benchmark assessments every year.
Discovery Education Assessment Proficiency Predictions vs. NM SBA Proficiency Levels
In the 2010-2011 school year, districts in New Mexico used the Discovery Education Common Core
interim benchmark assessments to predict performance on the NM Standards Based Assessments (SBA).
The following tables display the DEA percent Proficient on the Common Core interim benchmark
assessments, percent Proficient on the New Mexico SBA, the difference between the two and the

Page | 24
proficiency prediction score. The median reading proficiency prediction score was 98.1 while the median
math proficiency prediction score was 95.8.
Validity: New Mexico Reading Proficiency Prediction Scores from
2010-2011
DEA CC NM SBA Difference Prediction Score
Grade 3 56.5 57.3 0.8 99.2
Grade 4 51.8 51.4 0.4 99.6
Grade 5 58.0 59.0 1.0 99.0
Grade 6 54.9 39.6 15.3 84.7
Grade 7 40.6 49.6 9.0 91.0
Grade 8 57.5 60.4 2.9 97.1
Median 2.0 98.1
Validity: New Mexico Math Proficiency Prediction Scores from
2010-2011
DEA CC NM SBA Difference Prediction Score
Grade 3 52.8 58.2 5.4 94.6
Grade 4 49.1 45.3 3.8 96.2
Grade 5 44.4 45.3 0.9 99.1
Grade 6 54.6 34.6 20.0 80.0
Grade 7 38.3 33.6 4.7 95.3
Grade 8 39.4 39.3 0.1 99.9
Median 4.3 95.8

Page | 25
0.0
10.0
20.0
30.0
40.0
50.0
60.0
70.0
Grade 3 Grade 4 Grade 5 Grade 6 Grade 7 Grade 8
New Mexico Reading % Proficient:
DEA Common Core & SBA
DEA CC
NM SBA
0
10
20
30
40
50
60
70
Grade 3 Grade 4 Grade 5 Grade 6 Grade 7 Grade 8
New Mexico Math % Proficient:
DEA Common Core & SBA
DEA CC
NM SBA

Page | 26
Vertical Scale Averages and Growth
Growth models depend on a highly rigorous and valid vertical scale to measure student performance
over time. Discovery Education Assessment vertical scales are constructed using Rasch measurement
models with state-of-the-art psychometric techniques.
The accurate measurement of student achievement over time is becoming increasingly important to
parents, teachers, and school administrators. Student “growth” within a grade and across grades has
also been sanctioned by the U. S. Department of Education as a reliable way to measure student
proficiency in Reading and Mathematics and to satisfy the requirements of Adequate Yearly Progress
(AYP) under the No Child Left Behind Act. Accurate measurement and recording of individual student
achievement can also help with issues of student mobility: as students move within a district or state,
records of individual student achievement can help new schools administer to the needs of this mobile
population.
The assessment of student achievement over time is even more important with the use of benchmarks
tests. Discovery Education Assessment Benchmark tests provide a snapshot of student progress toward
state standards at up to four points during the school year. These benchmark tests are scientifically linked,
so that the reporting of student proficiency levels is both reliable and valid.
Discovery Education Assessment has added a scientifically based vertical scaled growth score to its
family of benchmark tests in 2007-08. These growth scores are based on the Rasch measurement model, a
state-of-the-art psychometric technique for scaling ability (e.g., Wright & Stone, 1979; Wright & Masters,
1982; Linacre 1999; Smith & Smith, 2004; Wilson, 2005). To accomplish vertical scaling, common items
are embedded across assessments to enable the psychometric linking of tests at different points in time.
For example, a Grade 3 mathematics benchmark test administered mid-year might contain below grade
level and above grade level items. Performance on these off grade level items provides an accurate
measurement of how much growth occurs across grades. Furthermore, benchmark tests within a grade are
also linked with common items, once again to assess change at different points in time within a grade.
Discovery Education Assessment is using established psychometric procedures to build calibrated item
banks and linked tests (i.e., Ingebo, 1997; Kolen & Brennan, 2004).
Isn’t student growth similar across grades? Don’t students change as much from Grade 3 to Grade 4 as
they do from Grade 7 to Grade 8? Previous research on the use of vertical scales has demonstrated that
student growth is not linear; that is, growth in student achievement is different from grade to grade (see
Young 2006). For instance, the figure on the next page shows preliminary Discovery Education
Assessment vertically scaled growth results. This graph shows growth from Grades Kindergarten to 10 in
Mathematics as measured by Discovery Education Assessment’s Spring benchmark tests. Typically,
students have larger gains in mathematics achievement in elementary grades with growth somewhat
slowing in middle and high school, as published by other major testing companies.

Page | 27
Discovery Within Year Growth for 4th Grade Math
1400
1420
1440
1460
1480
1500
1520
Test P Test A Test B Test C
Avera
ge S
cale
Sco
re
Math
Student growth can now be accurately measured at four points in time in each grade level. Discovery
Education Assessment benchmark tests are administered up to four times yearly: Early Fall, Late Fall,
Winter, and Spring. For each time period, we report scale scores and accompanying statistics. Most
testing companies only allow the
measurement of student growth at two
points in time: Fall and Spring. Discovery
Education Assessment benchmark tests
provide normative information to assess
student growth multiple times each year.
The figure to the right illustrates this
growth for Grade 4 Mathematics using our
benchmark assessments.
National Math Scale Score Averages
1200
1300
1400
1500
1600
1700
Kinde
rgar
ten
Gra
de 1
Gra
de 2
Gra
de 3
Gra
de 4
Gra
de 5
Gra
de 6
Gra
de 7
Gra
de 8
Gra
de 9
Gra
de 1
0
Avg
Stu
den
t S
cale
Sco
re

Page | 28
Common Core 2011-2012 Average Vertical Scale Scores
Common Core 2011-2012 Average Vertical Scores
Reading Math
Test A Test B Test C Test A Test B Test C
Grade 3 1403 1458 1469 1367 1423 1475
Grade 4 1461 1508 1545 1461 1486 1519
grade 5 1518 1536 1562 1517 1554 1583
Grade 6 1540 1597 1584 1552 1563 1586
grade 7 1570 1612 1621 1586 1608 1626
Grade 8 1603 1627 1637 1598 1652 1658
1350
1400
1450
1500
1550
1600
1650
1700
Tes
t A
Tes
t B
Tes
t C
Tes
t A
Tes
t B
Tes
t C
Tes
t A
Tes
t B
Tes
t C
Tes
t A
Tes
t B
Tes
t C
Tes
t A
Tes
t B
Tes
t C
Tes
t A
Tes
t B
Tes
t C
Grade 3 Grade 4 Grade 5 Grade 6 Grade 7 Grade 8
Common Core 2011-2012 Average Vertical Scores
Reading
Math

Page | 29
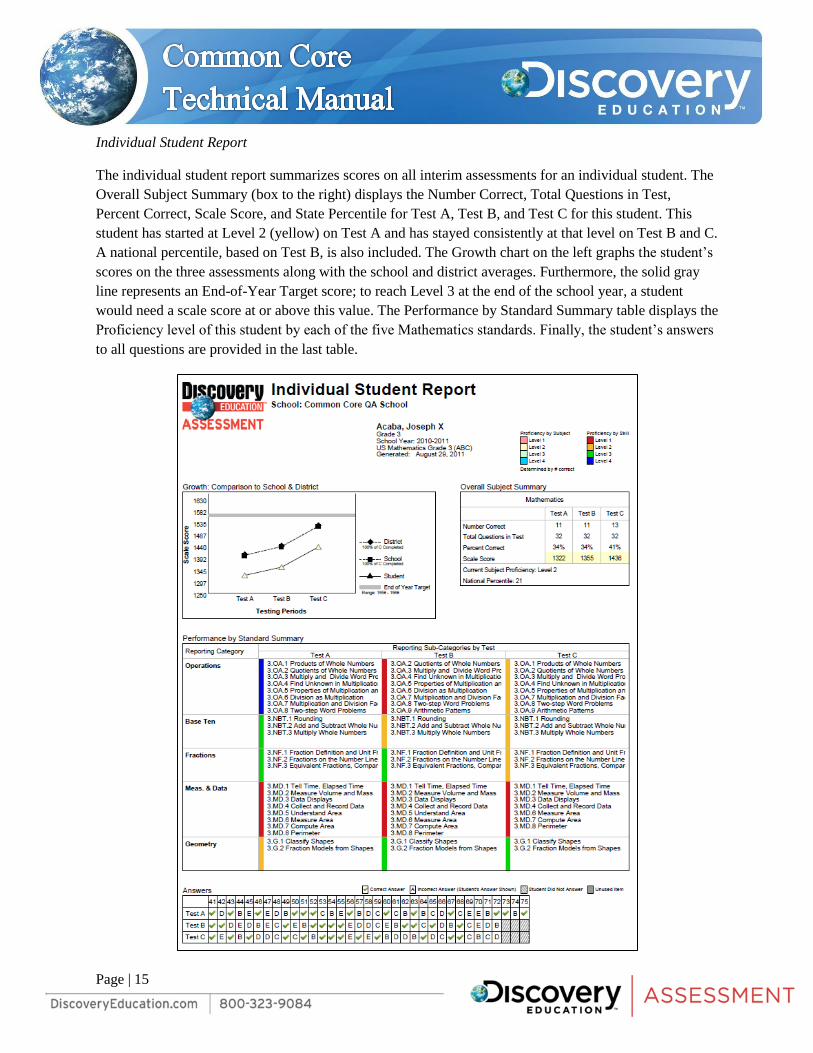
Appendix A: Test and Question Statistics, Reliability, and Scale Scores
The following section reports test and question statistics, reliability, and percentiles for the benchmark
tests, for grades 3-8, Reading and Mathematics. These benchmark tests were administered during the fall
of 2011-2012. Benchmark tests are revised each year based on test and question statistics.
Number of Students: Number of students used for calculation of test statistics.
Number of Items: Number of items in each benchmark test (including common items used
for scaling purposes).
Mean: Test mean in terms of number correct.
Standard Deviation: Test standard deviation.
Reliability: Cronbach’s alpha.
SEM: Standard Error of Measurement (SEM) for the test.
Scale Score:
Discovery Education Assessment Scale Score for each number correct
(Scale scores are vertically scaled using Rasch measurement. Scale scores
from grades K-12 range from 1000 to 2000).
Level The DEA proficiency level (Level 1 – Level 4) assigned to the student
based on the number of items correct on the assessment.
Question P-values: The proportion correct for each item.
Biserial: Item discrimination using biserial correlation.
Rasch Item Difficulty: Rasch item difficulty parameter calculated using WINSTEPS.
DIF Gender: Rasch item difficulty difference (Male vs. Female).
DIF Ethnicity: Rasch item difficulty difference (White vs. Black).
DIF Size
Negligible: 0 logits to .42 logits (absolute value).
Moderate: .43 logits to .63 logits (absolute value).
Large: .64 logits and up (absolute value).
(see p.1070 “An Adjustment for Sample Size in DIF Analysis”, Rasch Measurement Transactions, 20:3,
Winter 2006)
Technical Data
Common Core Fall 2011-2012 Reading Grade 3
Test Statistics
Number of Students 13,163
Number of Items 34
Average Number Correct 19.48
Std. Deviation 6.74
Avg. Scale Score 1401
Reliability 0.86
Std. Error of Measurement 2.52
Question Statistics
Scale Scores & Percentiles
Item No. P-Value Biserial
Rasch Item
Difficulty DIF
Gender DIF
Ethnicity
No. Correct
Scale Score Level
1 0.49 0.36 0.43 0.02 0.16
0 1000 Level 1
2 0.46 0.31 0.59 0.04 0.21
1 1086 Level 1
3 0.78 0.48 -1.12 0.13 0.23
2 1142 Level 1
4 0.78 0.46 -1.13 0.07 0.19
3 1177 Level 1
5 0.8 0.43 -1.30 0.18 0.03
4 1203 Level 1
6 0.71 0.52 -0.72 0.14 0.13
5 1223 Level 1
7 0.48 0.43 0.49 0.04 0.43
6 1241 Level 1
8 0.76 0.51 -0.98 0.19 0.25
7 1257 Level 1
9 0.65 0.35 -0.39 0.11 0.07
8 1271 Level 1
10 0.5 0.39 0.40 0.06 0.35
9 1285 Level 1
11 0.77 0.5 -1.05 0.08 0.21
10 1297 Level 1
12 0.74 0.5 -0.89 0.16 0.19
11 1309 Level 1
13 0.61 0.47 -0.18 0.20 0.08
12 1320 Level 1
14 0.48 0.46 0.48 0.05 0.06
13 1331 Level 2
15 0.65 0.49 -0.36 0.07 0.25
14 1341 Level 2
16 0.54 0.41 0.18 0.22 0.05
15 1352 Level 2
17 0.68 0.53 -0.53 0.04 0.02
16 1362 Level 2
18 0.53 0.46 0.23 0.03 0.05
17 1372 Level 2
19 0.49 0.39 0.46 0.17 0.00
18 1382 Level 2
20 0.55 0.44 0.15 0.05 0.14
19 1392 Level 2
21 0.36 0.2 1.11 0.15 0.66
20 1402 Level 3
22 0.41 0.25 0.87 0.02 0.32
21 1412 Level 3
23 0.35 0.3 1.18 0.07 0.19
22 1423 Level 3
24 0.56 0.47 0.10 0.03 0.03
23 1434 Level 3
25 0.86 0.36 -1.76 0.04 0.08
24 1445 Level 3
26 0.47 0.42 0.54 0.01 0.06
25 1458 Level 3
27 0.5 0.44 0.38 0.13 0.05
26 1470 Level 4
28 0.63 0.47 -0.27 0.11 0.14
27 1484 Level 4
29 0.33 0.25 1.25 0.30 0.21
28 1500 Level 4
30 0.61 0.51 -0.16 0.16 0.06
29 1517 Level 4
31 0.63 0.5 -0.24 0.01 0.15
30 1537 Level 4
32 0.64 0.48 -0.32 0.16 0.11
31 1562 Level 4
33 0.39 0.39 0.95 0.08 0.19
32 1596 Level 4
34 0.27 0.17 1.63 0.11 0.70
33 1652 Level 4
34 1744 Level 4

Technical Data
Common Core Fall 2011-2012
Math Grade 3
Test Statistics
Number of Students 13,068
Number of Items 32
Average Number Correct 15.28
Std. Deviation 5.94
Avg. Scale Score 1364
Reliability 0.82
Std. Error of Measurement 2.52
Question Statistics
Scale Scores & Percentiles
Item No. P-Value Biserial
Rasch Item
Difficulty DIF
Gender DIF
Ethnicity
No. Correct
Scale Score Level
1 0.73 0.4 -1.29 0.02 0.13
0 1000 Level 1
2 0.51 0.4 -0.18 0.33 0.17
1 1092 Level 1
3 0.52 0.38 -0.24 0.00 0.05
2 1148 Level 1
4 0.23 0.17 1.35 0.11 0.31
3 1182 Level 1
5 0.52 0.36 -0.23 0.08 0.13
4 1208 Level 1
6 0.3 0.38 0.90 0.27 0.18
5 1229 Level 1
7 0.68 0.3 -0.99 0.17 0.23
6 1247 Level 1
8 0.69 0.41 -1.07 0.12 0.03
7 1263 Level 1
9 0.58 0.34 -0.51 0.16 0.08
8 1277 Level 1
10 0.51 0.42 -0.15 0.03 0.01
9 1291 Level 1
11 0.73 0.29 -1.30 0.07 0.04
10 1303 Level 2
12 0.64 0.51 -0.79 0.15 0.52
11 1316 Level 2
13 0.55 0.45 -0.38 0.16 0.09
12 1327 Level 2
14 0.48 0.39 -0.03 0.23 0.15
13 1338 Level 2
15 0.25 0.38 1.20 0.13 0.03
14 1349 Level 2
16 0.56 0.49 -0.42 0.03 0.39
15 1360 Level 3
17 0.53 0.34 -0.28 0.12 0.02
16 1371 Level 3
18 0.38 0.44 0.46 0.10 0.27
17 1382 Level 3
19 0.35 0.43 0.63 0.31 0.22
18 1393 Level 3
20 0.28 0.37 1.02 0.29 0.24
19 1404 Level 3
21 0.27 0.37 1.04 0.05 0.07
20 1415 Level 4
22 0.42 0.34 0.27 0.35 0.20
21 1427 Level 4
23 0.67 0.42 -0.97 0.18 0.17
22 1439 Level 4
24 0.46 0.42 0.08 0.16 0.00
23 1451 Level 4
25 0.3 0.42 0.87 0.13 0.10
24 1465 Level 4
26 0.29 0.46 0.96 0.12 0.16
25 1479 Level 4
27 0.6 0.47 -0.60 0.03 0.16
26 1495 Level 4
28 0.37 0.28 0.50 0.09 0.22
27 1513 Level 4
29 0.33 0.5 0.70 0.02 0.26
28 1534 Level 4
30 0.5 0.29 -0.11 0.25 0.26
29 1559 Level 4
31 0.69 0.37 -1.04 0.09 0.14
30 1593 Level 4
32 0.35 0.31 0.62 0.11 0.31
31 1649 Level 4
32 1742 Level 4

Technical Data
Common Core Fall 2011-2012
Reading Grade 4
Test Statistics
Number of Students 13,282
Number of Items 34
Average Number Correct 17.55
Std. Deviation 6.31
Avg. Scale Score 1460
Reliability 0.83
Std. Error of Measurement 2.60
Question Statistics
Scale Scores & Percentiles
Item No. P-Value Biserial
Rasch Item
Difficulty DIF
Gender DIF
Ethnicity
No. Correct
Scale Score Level
1 0.62 0.50 -0.53 0.16 0.33
0 1080 Level 1
2 0.80 0.47 -1.55 0.15 0.17
1 1173 Level 1
3 0.49 0.36 0.11 0.17 0.13
2 1228 Level 1
4 0.67 0.40 -0.77 0.21 0.11
3 1262 Level 1
5 0.65 0.44 -0.66 0.20 0.01
4 1287 Level 1
6 0.36 0.37 0.75 0.11 0.13
5 1308 Level 1
7 0.60 0.28 -0.40 0.17 0.22
6 1325 Level 1
8 0.44 0.33 0.37 0.16 0.01
7 1341 Level 1
9 0.60 0.45 -0.42 0.06 0.17
8 1355 Level 1
10 0.44 0.46 0.35 0.09 0.11
9 1368 Level 1
11 0.68 0.49 -0.80 0.06 0.12
10 1380 Level 1
12 0.52 0.43 -0.01 0.30 0.05
11 1391 Level 2
13 0.58 0.41 -0.30 0.03 0.11
12 1402 Level 2
14 0.57 0.40 -0.25 0.05 0.11
13 1413 Level 2
15 0.19 0.17 1.79 0.33 0.48
14 1423 Level 2
16 0.34 0.30 0.87 0.06 0.04
15 1433 Level 2
17 0.32 0.32 0.98 0.08 0.11
16 1443 Level 2
18 0.51 0.41 0.04 0.06 0.02
17 1453 Level 3
19 0.42 0.40 0.44 0.06 0.15
18 1463 Level 3
20 0.62 0.43 -0.48 0.21 0.04
19 1473 Level 3
21 0.63 0.43 -0.55 0.31 0.29
20 1484 Level 3
22 0.35 0.42 0.80 0.30 0.14
21 1494 Level 3
23 0.73 0.46 -1.07 0.26 0.05
22 1505 Level 3
24 0.66 0.45 -0.68 0.02 0.21
23 1516 Level 3
25 0.57 0.42 -0.27 0.09 0.13
24 1527 Level 4
26 0.40 0.42 0.54 0.11 0.03
25 1540 Level 4
27 0.54 0.43 -0.12 0.25 0.17
26 1553 Level 4
28 0.51 0.35 0.05 0.01 0.04
27 1567 Level 4
29 0.49 0.46 0.14 0.16 0.28
28 1582 Level 4
30 0.40 0.22 0.55 0.07 0.43
29 1600 Level 4
31 0.56 0.35 -0.20 0.02 0.03
30 1621 Level 4
32 0.32 0.14 0.99 0.05 0.22
31 1646 Level 4
33 0.67 0.47 -0.74 0.13 0.08
32 1680 Level 4
34 0.30 0.18 1.06 0.22 0.13
33 1736 Level 4
34 1829 Level 4

Technical Data
Common Core Fall 2011-2012
Math Grade 4
Test Statistics
Number of Students 12,934
Number of Items 34
Average Number Correct 17.99
Std. Deviation 5.52
Avg. Scale Score 1459
Reliability 0.78
Std. Error of Measurement 2.59
Question Statistics
Scale Scores & Percentiles
Item No. P-Value Biserial
Rasch Item
Difficulty DIF
Gender DIF
Ethnicity
No. Correct
Scale Score Level
1 0.71 0.35 -0.9 0.18 0.24
0 1061 Level 1
2 0.64 0.42 -0.5 0.1 0.24
1 1155 Level 1
3 0.71 0.45 -0.89 0.12 0.28
2 1212 Level 1
4 0.53 0.46 0.02 0.06 0.14
3 1247 Level 1
5 0.24 0.12 1.45 0.03 0.5
4 1273 Level 1
6 0.69 0.27 -0.76 0.07 0.33
5 1294 Level 1
7 0.43 0.43 0.46 0.15 0.18
6 1313 Level 1
8 0.82 0.31 -1.61 0.03 0.06
7 1329 Level 1
9 0.73 0.48 -1.01 0.24 0.53
8 1343 Level 1
10 0.56 0.36 -0.11 0.18 0.33
9 1357 Level 1
11 0.46 0.21 0.33 0.07 0.14
10 1370 Level 1
12 0.73 0.35 -0.97 0.01 0.11
11 1382 Level 1
13 0.55 0.33 -0.09 0.15 0.23
12 1393 Level 1
14 0.64 0.43 -0.51 0.23 0.36
13 1405 Level 2
15 0.35 0.27 0.88 0.17 0.38
14 1416 Level 2
16 0.51 0.29 0.08 0.09 0.45
15 1426 Level 2
17 0.51 0.43 0.09 0.18 0.15
16 1437 Level 2
18 0.60 0.45 -0.3 0.03 0.02
17 1447 Level 2
19 0.55 0.48 -0.09 0.24 0.39
18 1458 Level 3
20 0.61 0.42 -0.35 0.24 0.73
19 1469 Level 3
21 0.87 0.38 -2.03 0.45 0.13
20 1479 Level 3
22 0.45 0.30 0.36 0.01 0.03
21 1490 Level 3
23 0.53 0.30 0.02 0.06 0.44
22 1502 Level 3
24 0.35 0.28 0.87 0.16 0.22
23 1513 Level 4
25 0.62 0.40 -0.4 0.19 0.28
24 1526 Level 4
26 0.78 0.46 -1.32 0.15 0.43
25 1538 Level 4
27 0.61 0.51 -0.39 0.2 0
26 1552 Level 4
28 0.52 0.37 0.03 0.24 0.37
27 1567 Level 4
29 0.13 0.20 2.31 0.07 0.61
28 1583 Level 4
30 0.40 0.32 0.61 0.22 0.31
29 1602 Level 4
31 0.24 0.14 1.46 0.02 0.51
30 1623 Level 4
32 0.23 0.13 1.55 0.29 0.5
31 1649 Level 4
33 0.35 0.35 0.88 0.1 0.16
32 1685 Level 4
34 0.35 0.18 0.85 0.05 0.55
33 1741 Level 4
34 1835 Level 4

Technical Data
Common Core Fall 2011-2012
Reading Grade 5
Test Statistics
Number of Students 13,804
Number of Items 34
Average Number Correct 20.66
Std. Deviation 6.90
Avg. Scale Score 1518
Reliability 0.87
Std. Error of Measurement 2.49
Question Statistics
Scale Scores & Percentiles
Item No. P-Value Biserial
Rasch Item
Difficulty DIF
Gender DIF
Ethnicity
No. Correct
Scale Score Level
1 0.89 0.36 -1.91 0.03 0.14
0 1097 Level 1
2 0.80 0.37 -1.16 0.05 0.16
1 1190 Level 1
3 0.69 0.36 -0.44 0.03 0.19
2 1246 Level 1
4 0.65 0.37 -0.17 0.15 0.27
3 1280 Level 1
5 0.64 0.39 -0.16 0.03 0.29
4 1306 Level 1
6 0.74 0.50 -0.73 0.14 0.22
5 1327 Level 1
7 0.71 0.47 -0.51 0.00 0.04
6 1344 Level 1
8 0.61 0.51 0.00 0.14 0.14
7 1360 Level 1
9 0.55 0.38 0.32 0.17 0.08
8 1374 Level 1
10 0.40 0.42 1.09 0.07 0.15
9 1387 Level 1
11 0.64 0.36 -0.15 0.29 0.08
10 1399 Level 1
12 0.45 0.38 0.86 0.34 0.06
11 1411 Level 1
13 0.64 0.45 -0.14 0.00 0.07
12 1422 Level 1
14 0.60 0.42 0.05 0.07 0.07
13 1433 Level 1
15 0.59 0.42 0.11 0.12 0.10
14 1443 Level 2
16 0.71 0.52 -0.52 0.23 0.00
15 1453 Level 2
17 0.50 0.39 0.59 0.28 0.22
16 1463 Level 2
18 0.77 0.49 -0.91 0.17 0.04
17 1473 Level 2
19 0.51 0.48 0.55 0.14 0.22
18 1483 Level 2
20 0.34 0.36 1.44 0.35 0.04
19 1493 Level 2
21 0.65 0.48 -0.20 0.03 0.11
20 1504 Level 2
22 0.70 0.53 -0.49 0.03 0.01
21 1514 Level 2
23 0.80 0.49 -1.09 0.31 0.05
22 1525 Level 3
24 0.36 0.41 1.31 0.07 0.02
23 1536 Level 3
25 0.64 0.39 -0.12 0.05 0.24
24 1547 Level 3
26 0.70 0.56 -0.44 0.24 0.32
25 1559 Level 3
27 0.51 0.48 0.52 0.00 0.19
26 1572 Level 3
28 0.52 0.37 0.47 0.31 0.34
27 1586 Level 4
29 0.67 0.48 -0.28 0.32 0.09
28 1602 Level 4
30 0.73 0.43 -0.64 0.05 0.03
29 1619 Level 4
31 0.69 0.50 -0.40 0.24 0.02
30 1640 Level 4
32 0.35 0.37 1.35 0.17 0.04
31 1665 Level 4
33 0.27 0.19 1.83 0.07 0.23
32 1699 Level 4
34 0.62 0.48 -0.04 0.54 0.01
33 1755 Level 4
34 1848 Level 4

Technical Data
Common Core Fall 2011-2012
Math Grade 5
Test Statistics
Number of Students 13,527
Number of Items 34
Average Number Correct 16.17
Std. Deviation 6.11
Avg. Scale Score 1516
Reliability 0.82
Std. Error of Measurement 2.59
Question Statistics
Scale Scores & Percentiles
Item No. P-Value Biserial
Rasch Item
Difficulty DIF
Gender DIF
Ethnicity
No. Correct
Scale Score Level
1 0.57 0.27 -0.46 0.18 0.09
0 1147 Level 1
2 0.60 0.40 -0.61 0.28 0.06
1 1240 Level 1
3 0.62 0.38 -0.72 0.22 0.05
2 1296 Level 1
4 0.35 0.37 0.59 0.21 0.07
3 1331 Level 1
5 0.37 0.34 0.51 0.08 0.04
4 1356 Level 1
6 0.59 0.32 -0.56 0.06 0.16
5 1377 Level 1
7 0.63 0.41 -0.76 0.06 0.08
6 1395 Level 1
8 0.42 0.42 0.23 0.16 0.15
7 1411 Level 1
9 0.66 0.40 -0.93 0.04 0.24
8 1425 Level 1
10 0.29 0.53 0.91 0.2 0.13
9 1438 Level 1
11 0.21 0.34 1.46 0.3 0.04
10 1450 Level 1
12 0.63 0.38 -0.76 0.33 0.02
11 1462 Level 2
13 0.33 0.33 0.7 0.13 0.1
12 1473 Level 2
14 0.48 0.40 -0.05 0.14 0.39
13 1484 Level 2
15 0.26 0.36 1.1 0.22 0.08
14 1494 Level 2
16 0.60 0.40 -0.62 0.11 0.06
15 1504 Level 2
17 0.43 0.37 0.18 0.05 0.2
16 1514 Level 3
18 0.26 0.22 1.12 0.15 0.45
17 1524 Level 3
19 0.51 0.43 -0.17 0.1 0.14
18 1534 Level 3
20 0.35 0.54 0.57 0.17 0.08
19 1545 Level 3
21 0.45 0.36 0.12 0.21 0.06
20 1555 Level 3
22 0.40 0.39 0.33 0.19 0.14
21 1565 Level 3
23 0.65 0.36 -0.85 0.17 0.18
22 1576 Level 4
24 0.50 0.40 -0.14 0.06 0.16
23 1587 Level 4
25 0.23 0.12 1.32 0.04 0.64
24 1599 Level 4
26 0.41 0.40 0.32 0.26 0.04
25 1611 Level 4
27 0.62 0.39 -0.71 0.18 0.21
26 1624 Level 4
28 0.37 0.39 0.51 0.01 0.26
27 1638 Level 4
29 0.35 0.29 0.59 0.13 0.2
28 1653 Level 4
30 0.76 0.42 -1.49 0.15 0.06
29 1671 Level 4
31 0.70 0.37 -1.13 0.16 0.22
30 1692 Level 4
32 0.68 0.41 -1.01 0.08 0.14
31 1717 Level 4
33 0.43 0.31 0.2 0.13 0.39
32 1751 Level 4
34 0.43 0.40 0.19 0.17 0.05
33 1807 Level 4
34 1900 Level 4

Technical Data
Common Core Fall 2011-2012
Reading Grade 6
Test Statistics
Number of Students 13,698
Number of Items 34
Average Number Correct 21.62
Std. Deviation 6.90
Avg. Scale Score 1541
Reliability 0.87
Std. Error of Measurement 2.49
Question Statistics
Scale Scores & Percentiles
Item No. P-Value Biserial
Rasch Item
Difficulty DIF
Gender DIF
Ethnicity
No. Correct
Scale Score Level
1 0.78 0.40 -0.84 0.54 0.36
0 1114 Level 1
2 0.56 0.37 0.45 0.09 0.27
1 1207 Level 1
3 0.83 0.43 -1.24 0.15 0.04
2 1262 Level 1
4 0.71 0.25 -0.38 0.11 0.45
3 1296 Level 1
5 0.85 0.33 -1.42 0.11 0.11
4 1322 Level 1
6 0.71 0.42 -0.39 0.08 0.25
5 1342 Level 1
7 0.84 0.42 -1.29 0.20 0.03
6 1359 Level 1
8 0.59 0.42 0.31 0.21 0.09
7 1375 Level 1
9 0.55 0.41 0.52 0.01 0.17
8 1388 Level 1
10 0.62 0.42 0.12 0.39 0.12
9 1401 Level 1
11 0.74 0.50 -0.56 0.02 0.00
10 1413 Level 1
12 0.74 0.41 -0.55 0.19 0.12
11 1424 Level 1
13 0.61 0.48 0.21 0.20 0.21
12 1435 Level 1
14 0.52 0.42 0.63 0.20 0.28
13 1446 Level 1
15 0.57 0.45 0.42 0.12 0.12
14 1456 Level 2
16 0.26 0.15 2.08 0.09 0.45
15 1466 Level 2
17 0.62 0.51 0.16 0.23 0.03
16 1476 Level 2
18 0.58 0.50 0.35 0.19 0.22
17 1485 Level 2
19 0.68 0.58 -0.20 0.17 0.18
18 1495 Level 2
20 0.69 0.49 -0.27 0.15 0.06
19 1505 Level 2
21 0.64 0.48 0.04 0.08 0.07
20 1515 Level 2
22 0.47 0.45 0.92 0.16 0.01
21 1525 Level 2
23 0.77 0.47 -0.76 0.37 0.02
22 1536 Level 3
24 0.54 0.41 0.53 0.15 0.08
23 1546 Level 3
25 0.61 0.44 0.17 0.06 0.07
24 1558 Level 3
26 0.75 0.55 -0.63 0.07 0.44
25 1570 Level 3
27 0.44 0.35 1.04 0.15 0.30
26 1583 Level 3
28 0.72 0.43 -0.46 0.01 0.05
27 1596 Level 3
29 0.78 0.56 -0.84 0.10 0.10
28 1612 Level 4
30 0.52 0.50 0.66 0.36 0.09
29 1629 Level 4
31 0.39 0.37 1.33 0.00 0.21
30 1650 Level 4
32 0.66 0.49 -0.07 0.05 0.09
31 1675 Level 4
33 0.63 0.35 0.07 0.11 0.21
32 1709 Level 4
34 0.66 0.45 -0.10 0.09 0.12
33 1765 Level 4
34 1858 Level 4

Technical Data
Common Core Fall 2011-2012
Math Grade 6
Test Statistics
Number of Students 13,704
Number of Items 34
Average Number Correct 15.72
Std. Deviation 5.31
Avg. Scale Score 1552
Reliability 0.76
Std. Error of Measurement 2.60
Question Statistics
Scale Scores & Percentiles
Item No. P-Value Biserial
Rasch Item
Difficulty DIF
Gender DIF
Ethnicity
No. Correct
Scale Score Level
1 0.25 0.10 1.02 0.09 0.33
0 1186 Level 1
2 0.53 0.33 -0.34 0.08 0.18
1 1279 Level 1
3 0.72 0.27 -1.26 0.28 0.13
2 1335 Level 1
4 0.36 0.34 0.44 0.08 0.32
3 1369 Level 1
5 0.51 0.37 -0.27 0.16 0.19
4 1395 Level 1
6 0.49 0.44 -0.15 0.14 0.04
5 1416 Level 1
7 0.27 0.19 0.91 0.15 0.3
6 1433 Level 1
8 0.53 0.19 -0.35 0.23 0.44
7 1449 Level 1
9 0.20 0.29 1.38 0 0.13
8 1464 Level 1
10 0.66 0.40 -0.98 0.17 0.08
9 1477 Level 1
11 0.73 0.43 -1.33 0.09 0
10 1490 Level 1
12 0.54 0.43 -0.39 0.12 0.06
11 1501 Level 2
13 0.39 0.25 0.29 0.05 0.27
12 1513 Level 2
14 0.79 0.39 -1.71 0.21 0.16
13 1524 Level 2
15 0.72 0.28 -1.26 0.03 0.23
14 1535 Level 2
16 0.58 0.39 -0.55 0.03 0.03
15 1545 Level 2
17 0.47 0.49 -0.08 0.2 0.39
16 1556 Level 3
18 0.36 0.13 0.46 0.03 0.32
17 1566 Level 3
19 0.54 0.35 -0.39 0 0.22
18 1577 Level 3
20 0.43 0.33 0.13 0.01 0.37
19 1588 Level 3
21 0.40 0.43 0.24 0.04 0.22
20 1598 Level 4
22 0.49 0.43 -0.17 0.22 0.06
21 1609 Level 4
23 0.33 0.20 0.61 0.04 0.13
22 1621 Level 4
24 0.55 0.40 -0.43 0.27 0.19
23 1632 Level 4
25 0.43 0.23 0.11 0.06 0.33
24 1645 Level 4
26 0.35 0.36 0.51 0.09 0.03
25 1658 Level 4
27 0.19 0.32 1.44 0.35 0.23
26 1672 Level 4
28 0.61 0.49 -0.73 0.12 0.38
27 1687 Level 4
29 0.21 0.24 1.27 0.01 0.09
28 1704 Level 4
30 0.69 0.49 -1.12 0.02 0.14
29 1723 Level 4
31 0.11 0.24 2.19 0.05 0.58
30 1745 Level 4
32 0.36 0.31 0.47 0.03 0.04
31 1772 Level 4
33 0.23 0.23 1.14 0 0.14
32 1808 Level 4
34 0.69 0.44 -1.1 0.31 0.5
33 1866 Level 4
34 1961 Level 4

Technical Data
Common Core Fall 2011-2012
Reading Grade 7
Test Statistics
Number of Students 13,851
Number of Items 34
Average Number Correct 19.20
Std. Deviation 6.19
Avg. Scale Score 1570
Reliability 0.83
Std. Error of Measurement 2.55
Question Statistics
Scale Scores & Percentiles
Item No. P-Value Biserial
Rasch Item
Difficulty DIF
Gender DIF
Ethnicity
No. Correct
Scale Score Level
1 0.90 0.34 -2.20 0.42 0.04
0 1163 Level 1
2 0.71 0.42 -0.70 0.15 0.30
1 1256 Level 1
3 0.85 0.38 -1.67 0.07 0.16
2 1313 Level 1
4 0.53 0.36 0.21 0.10 0.09
3 1348 Level 1
5 0.70 0.44 -0.66 0.04 0.79
4 1374 Level 1
6 0.62 0.22 -0.22 0.19 0.26
5 1395 Level 1
7 0.56 0.56 0.06 0.13 0.51
6 1413 Level 1
8 0.31 0.36 1.30 0.12 0.04
7 1429 Level 1
9 0.65 0.39 -0.38 0.06 0.16
8 1444 Level 1
10 0.59 0.35 -0.10 0.19 0.18
9 1457 Level 1
11 0.76 0.42 -1.03 0.32 0.02
10 1470 Level 1
12 0.64 0.39 -0.32 0.03 0.14
11 1482 Level 1
13 0.58 0.53 -0.05 0.13 0.23
12 1493 Level 1
14 0.53 0.27 0.20 0.12 0.16
13 1504 Level 2
15 0.76 0.46 -1.01 0.08 0.21
14 1514 Level 2
16 0.43 0.43 0.68 0.24 0.18
15 1525 Level 2
17 0.79 0.39 -1.20 0.35 0.13
16 1535 Level 2
18 0.37 0.24 1.00 0.06 0.05
17 1545 Level 2
19 0.36 0.26 1.06 0.12 0.28
18 1555 Level 2
20 0.69 0.51 -0.60 0.07 0.01
19 1565 Level 3
21 0.43 0.30 0.69 0.16 0.12
20 1575 Level 3
22 0.56 0.51 0.04 0.00 0.08
21 1586 Level 3
23 0.64 0.37 -0.35 0.12 0.00
22 1596 Level 3
24 0.48 0.45 0.46 0.13 0.35
23 1607 Level 3
25 0.64 0.43 -0.31 0.03 0.18
24 1619 Level 3
26 0.37 0.33 0.97 0.33 0.13
25 1631 Level 4
27 0.50 0.46 0.36 0.05 0.00
26 1643 Level 4
28 0.36 0.25 1.04 0.02 0.09
27 1657 Level 4
29 0.54 0.46 0.14 0.13 0.08
28 1673 Level 4
30 0.58 0.35 -0.01 0.19 0.29
29 1690 Level 4
31 0.47 0.28 0.51 0.23 0.10
30 1710 Level 4
32 0.49 0.39 0.41 0.03 0.04
31 1735 Level 4
33 0.38 0.34 0.95 0.18 0.17
32 1769 Level 4
34 0.42 0.39 0.73 0.23 0.34
33 1824 Level 4
34 1917 Level 4

Technical Data
Common Core Fall 2011-2012
Math Grade 7
Test Statistics
Number of Students 13,060
Number of Items 34
Average Number Correct 15.92
Std. Deviation 5.88
Avg. Scale Score 1585
Reliability 0.8
Std. Error of Measurement 2.63
Question Statistics
Scale Scores & Percentiles
Item No. P-Value Biserial
Rasch Item
Difficulty DIF
Gender DIF
Ethnicity
No. Correct
Scale Score Level
1 0.41 0.34 0.29 0.33 0.18
0 1225 Level 1
2 0.38 0.43 0.4 0.34 0.41
1 1318 Level 1
3 0.30 0.26 0.81 0.25 0.06
2 1373 Level 1
4 0.14 0.22 1.9 0.14 0.15
3 1407 Level 1
5 0.80 0.41 -1.77 0.08 0.16
4 1432 Level 1
6 0.75 0.38 -1.46 0.21 0.3
5 1453 Level 1
7 0.62 0.40 -0.76 0.03 0.01
6 1470 Level 1
8 0.32 0.38 0.71 0.16 0.18
7 1485 Level 1
9 0.21 0.34 1.38 0.08 0.05
8 1499 Level 1
10 0.48 0.49 -0.07 0.35 0.28
9 1512 Level 1
11 0.38 0.28 0.41 0.23 0.18
10 1524 Level 2
12 0.47 0.37 -0.02 0.05 0.01
11 1535 Level 2
13 0.34 0.21 0.61 0.04 0.19
12 1546 Level 2
14 0.67 0.38 -0.98 0.14 0
13 1557 Level 2
15 0.40 0.28 0.29 0 0.04
14 1567 Level 2
16 0.41 0.31 0.24 0.5 0.08
15 1577 Level 2
17 0.41 0.43 0.24 0.31 0.58
16 1587 Level 3
18 0.31 0.18 0.76 0.03 0.35
17 1597 Level 3
19 0.35 0.26 0.54 0.17 0.28
18 1606 Level 3
20 0.49 0.20 -0.09 0.12 0.34
19 1616 Level 3
21 0.55 0.52 -0.37 0.08 0.38
20 1626 Level 3
22 0.41 0.31 0.25 0.33 0.18
21 1637 Level 4
23 0.46 0.42 0.01 0.23 0
22 1647 Level 4
24 0.48 0.40 -0.05 0.18 0.03
23 1658 Level 4
25 0.55 0.39 -0.4 0.23 0.31
24 1669 Level 4
26 0.52 0.48 -0.25 0.08 0.07
25 1681 Level 4
27 0.22 0.13 1.33 0.07 0.59
26 1694 Level 4
28 0.58 0.48 -0.56 0.03 0.1
27 1708 Level 4
29 0.70 0.40 -1.12 0.17 0.01
28 1723 Level 4
30 0.62 0.46 -0.75 0.02 0.08
29 1741 Level 4
31 0.57 0.46 -0.48 0.07 0.04
30 1761 Level 4
32 0.47 0.39 -0.04 0.1 0.24
31 1786 Level 4
33 0.76 0.45 -1.5 0.17 0
32 1820 Level 4
34 0.36 0.38 0.51 0.11 0.11
33 1876 Level 4
34 1968 Level 4
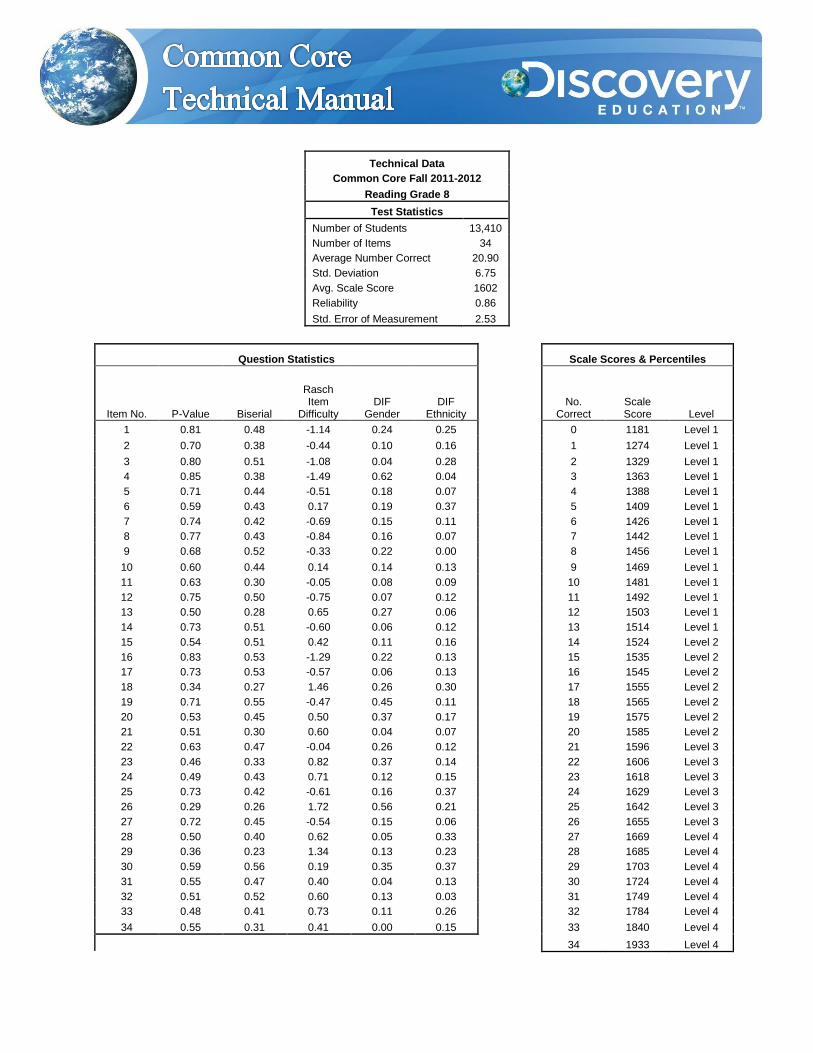
Technical Data
Common Core Fall 2011-2012
Reading Grade 8
Test Statistics
Number of Students 13,410
Number of Items 34
Average Number Correct 20.90
Std. Deviation 6.75
Avg. Scale Score 1602
Reliability 0.86
Std. Error of Measurement 2.53
Question Statistics
Scale Scores & Percentiles
Item No. P-Value Biserial
Rasch Item
Difficulty DIF
Gender DIF
Ethnicity
No. Correct
Scale Score Level
1 0.81 0.48 -1.14 0.24 0.25
0 1181 Level 1
2 0.70 0.38 -0.44 0.10 0.16
1 1274 Level 1
3 0.80 0.51 -1.08 0.04 0.28
2 1329 Level 1
4 0.85 0.38 -1.49 0.62 0.04
3 1363 Level 1
5 0.71 0.44 -0.51 0.18 0.07
4 1388 Level 1
6 0.59 0.43 0.17 0.19 0.37
5 1409 Level 1
7 0.74 0.42 -0.69 0.15 0.11
6 1426 Level 1
8 0.77 0.43 -0.84 0.16 0.07
7 1442 Level 1
9 0.68 0.52 -0.33 0.22 0.00
8 1456 Level 1
10 0.60 0.44 0.14 0.14 0.13
9 1469 Level 1
11 0.63 0.30 -0.05 0.08 0.09
10 1481 Level 1
12 0.75 0.50 -0.75 0.07 0.12
11 1492 Level 1
13 0.50 0.28 0.65 0.27 0.06
12 1503 Level 1
14 0.73 0.51 -0.60 0.06 0.12
13 1514 Level 1
15 0.54 0.51 0.42 0.11 0.16
14 1524 Level 2
16 0.83 0.53 -1.29 0.22 0.13
15 1535 Level 2
17 0.73 0.53 -0.57 0.06 0.13
16 1545 Level 2
18 0.34 0.27 1.46 0.26 0.30
17 1555 Level 2
19 0.71 0.55 -0.47 0.45 0.11
18 1565 Level 2
20 0.53 0.45 0.50 0.37 0.17
19 1575 Level 2
21 0.51 0.30 0.60 0.04 0.07
20 1585 Level 2
22 0.63 0.47 -0.04 0.26 0.12
21 1596 Level 3
23 0.46 0.33 0.82 0.37 0.14
22 1606 Level 3
24 0.49 0.43 0.71 0.12 0.15
23 1618 Level 3
25 0.73 0.42 -0.61 0.16 0.37
24 1629 Level 3
26 0.29 0.26 1.72 0.56 0.21
25 1642 Level 3
27 0.72 0.45 -0.54 0.15 0.06
26 1655 Level 3
28 0.50 0.40 0.62 0.05 0.33
27 1669 Level 4
29 0.36 0.23 1.34 0.13 0.23
28 1685 Level 4
30 0.59 0.56 0.19 0.35 0.37
29 1703 Level 4
31 0.55 0.47 0.40 0.04 0.13
30 1724 Level 4
32 0.51 0.52 0.60 0.13 0.03
31 1749 Level 4
33 0.48 0.41 0.73 0.11 0.26
32 1784 Level 4
34 0.55 0.31 0.41 0.00 0.15
33 1840 Level 4
34 1933 Level 4

Technical Data
Common Core Fall 2011-2012
Math Grade 8
Test Statistics
Number of Students 12,374
Number of Items 34
Average Number Correct 15.54
Std. Deviation 6.10
Avg. Scale Score 1598
Reliability 0.82
Std. Error of Measurement 2.59
Question Statistics
Scale Scores & Percentiles
Item No. P-Value Biserial
Rasch Item
Difficulty DIF
Gender DIF
Ethnicity
No. Correct
Scale Score Level
1 0.41 0.40 0.2 0.11 0.04
0 1228 Level 1
2 0.54 0.42 -0.39 0.04 0.23
1 1322 Level 1
3 0.47 0.34 -0.07 0.32 0.06
2 1380 Level 1
4 0.22 0.28 1.3 0.09 0.51
3 1415 Level 1
5 0.36 0.38 0.45 0.17 0.16
4 1442 Level 1
6 0.29 0.34 0.83 0.19 0.14
5 1464 Level 1
7 0.29 0.39 0.82 0.3 0.23
6 1482 Level 1
8 0.70 0.31 -1.21 0.31 0.1
7 1498 Level 1
9 0.47 0.55 -0.08 0.17 0.42
8 1513 Level 1
10 0.78 0.44 -1.7 0.45 0.27
9 1526 Level 1
11 0.55 0.47 -0.45 0.08 0.17
10 1539 Level 2
12 0.48 0.44 -0.1 0.16 0.26
11 1551 Level 2
13 0.48 0.45 -0.1 0.35 0.13
12 1562 Level 2
14 0.40 0.28 0.26 0.09 0.67
13 1573 Level 2
15 0.40 0.31 0.24 0.04 0.27
14 1583 Level 2
16 0.43 0.33 0.12 0.25 0.19
15 1594 Level 3
17 0.37 0.30 0.4 0.26 0.08
16 1604 Level 3
18 0.70 0.41 -1.2 0.22 0.28
17 1614 Level 3
19 0.41 0.39 0.23 0.12 0.17
18 1623 Level 3
20 0.43 0.36 0.11 0.15 0.17
19 1633 Level 3
21 0.30 0.33 0.78 0.09 0.1
20 1643 Level 3
22 0.81 0.43 -1.89 0.17 0.05
21 1654 Level 4
23 0.32 0.17 0.68 0.16 0.32
22 1664 Level 4
24 0.37 0.39 0.4 0.21 0
23 1675 Level 4
25 0.18 0.24 1.56 0.18 0.07
24 1686 Level 4
26 0.51 0.39 -0.25 0.02 0
25 1698 Level 4
27 0.57 0.51 -0.56 0.27 0.42
26 1711 Level 4
28 0.33 0.20 0.62 0.14 0.33
27 1725 Level 4
29 0.60 0.43 -0.67 0.11 0.15
28 1740 Level 4
30 0.45 0.33 0 0.15 0.3
29 1757 Level 4
31 0.61 0.44 -0.75 0.21 0.03
30 1777 Level 4
32 0.44 0.51 0.06 0.06 0.37
31 1802 Level 4
33 0.37 0.22 0.42 0 0.2
32 1836 Level 4
34 0.46 0.42 -0.04 0.16 0.09
33 1891 Level 4
34 1984 Level 4

Appendix B: Web Alignment

Web Alignment Study of Discovery Education Assessment Benchmarks with
Common Core Standards
Purpose
The purpose of this study is to report the results of a Web Alignment Study of Discovery
Education Assessment (DEA) benchmarks in reading and mathematics, grades 3 to 12, with
Common Core Standards. Discovery Education Assessment has created three benchmark
assessments (for use in fall, winter, and spring) for reading grades 3 to 10 and mathematics
grades 3 to 11. These benchmarks were created based on Common Core Standards in reading
and mathematics. The Web Alignment Tool (WAT) version 2 was used to record and analyze the
results of this study. The nature of an alignment is to measure “the degree to which expectations
and assessments are in agreement and serve in conjunction with one another to guide the system
toward students learning what they are expected to know and do.”
There are two aspects of this study. First, Common Core Standards are entered into the
WAT. In Phase I, subject matter experts rate the depth of knowledge (DOK) of each objective in
each of the standards. Then, in Phase II, subject matter experts rate each question in each
assessment for the objective and standard it matches and the depth of knowledge. Phase II results
are reported for each of the following categories:
Categorical Concurrence --- This criterion measures the extent to which the same or
consistent categories of content appear in the standards and the assessments. The criterion
is met for a given standard if there are more than five assessment items targeting that
standard.
Depth-of-Knowledge Consistency --- This criterion measures the degree to which the
knowledge elicited from students on the assessment is as complex within the context area
as what students are expected to know and do as stated in the standards. The criterion is
met if more than half of targeted objectives are hit by items of the appropriate
complexity.
Range-of-Knowledge Correspondence --- This criterion determines whether the span of
knowledge expected of students on the basis of a standard corresponds to the span of
knowledge that students need in order to correctly answer the corresponding assessment
items/activities. The criterion is met for a given standard if more than half of the
objectives that fall under that standard are targeted by assessment items.
Balance of Representation --- This criterion measures whether objectives that fall under
a specific standard are given relatively equal emphasis on the assessment.

Source of Challenge --- This criterion is met if the primary difficulty of the assessment
items is significantly related to students’ knowledge and skill in the content area as
represented in the standards.
Phase I: Entry of Standards and Depth of Knowledge Consensus
The Common Core Standards for Reading and Mathematics were entered into WAT. The
WAT identifies three level of entry for a standard:
Standard is the most general. It may be a broad statement of student activities, such as
“Students read for understanding,” or it may simply be a content classification like
“Geometry.” The data are reported out at this level.
Goal is the middle level of specificity. Each standard is composed of goals that may
involve smaller topic areas or more precise student activities.
Objective is the most specific level. Each goal is composed of objectives, which specify
particular kinds of activities or skills (e.g., “Read and identify types of poetry and the use
of inversion, rhyme, and rhythm,” or “Convert units within a measurement system.”).
When reviewers are coding items, they will match assessment items with one or more
objectives, if possible.
For English language arts Grade 3, the following presents two examples of these three levels,
one for RL 3.1 and the other for RI 3.7:
Standard: Reading: Literature
Goal: Key Ideas and Detail
Objective: Ask and answer questions to demonstrate understanding of a text,
referring explicitly to the text as the basis for the answers.
Standard: Reading: Informational Text
Goal: Integration of Knowledge and Ideas
Objective: Use information gained from illustrations (e.g., maps, photographs) and
the words in a text to demonstrate understanding of the text (e.g., where,
when, why, and how key events occur).
For mathematics Grade 3, the following presents two examples of these three levels, one for
3.NBT.1 and the other for 3.MD.5:
Standard: Number and Operations in Base Ten

Goal: Use place value understanding and properties of operations to perform
multi-digit arithmetic.
Objective: Use place value understanding to round whole numbers to the nearest 10
or 100.
Standard: Measurement and Data
Goal: Geometric measurement: understand concepts of area and relate area to
multiplication and to addition.
Objective: Recognize area as an attribute of plane figures and understand concepts of
area measurement.
The SMARTER Assessment Consortium commissioned a study by WESTED to
determine, among other factors, the depth of knowledge of each Common Core objectives. The
results of this DOK analysis were published in March 2011: SMARTER Balanced Assessment
Consortium Common Core State Standards Analysis: Eligible Content for the Summative
Assessment: Final Report. For each objective in reading and mathematics, a DOK value or range
of values was assigned.
For purposes of this study, these ranges were used as the initial consensus judgment on a
DOK level. If the range had two values, such as 1-2 or 2-3, the higher DOK value was selected.
If the DOK had a range of 1-3, the middle value of 2 was selected. No value of 4 was selected in
this initial judgment. All DEA assessment items were written in a multiple-choice format or
short answer constructed response. These types of items are often unable to measure a depth of
knowledge of 4. These initial consensus values were then presented to an additional subject
matter expert separately for reading and mathematics. These two experts concurred with the
chosen values or offered their own revisions. A final group consensus was undertaken to
reconcile differences. Final DOK values for each objective were entered into WAT.
Phase II: Reviewer Judgment of Objective and DOK Level
This study measured the alignment of the following DEA benchmarks. DEA offered
three benchmarks in three time periods: fall, winter, and spring. All benchmarks from fall and
winter 2012 were aligned along with a sampling of benchmarks from spring 2012. The following
tables summarize the benchmarks aligned in reading and mathematics. In total, sixteen reading
tests and nineteen mathematics tests were used in this alignment study.

Grade 3 Reading fall 2012 winter 2012
Grade 4 Reading fall 2012 winter 2012
Grade 5 Reading fall 2012 winter 2012 spring 2012
Grade 6 Reading fall 2012 winter 2012
Grade 7 Reading fall 2012 winter 2012 spring 2012
Grade 8 Reading fall 2012 winter 2012
Grade 9 Reading fall 2012
Grade 10 Reading fall 2012
Grade 3 Math fall 2012 winter 2012
Grade 4 Math fall 2012 winter 2012
Grade 5 Math fall 2012 winter 2012 spring 2012
Grade 6 Math fall 2012 winter 2012
Grade 7 Math fall 2012 winter 2012
Grade 8 Math fall 2012 winter 2012 spring 2012
Algebra I fall 2012 winter 2012
Geometry fall 2012
Algebra II fall 2012 winter 2012
Three trained subject matter experts reviewed each benchmark test. These reviewers were
first trained on depth of knowledge using materials provided in the Web Alignment Tool (WAT):
Training Manual Versions 1.1 July 2005. Then reviewers were trained on Common Core
Standards and Objectives for reading and mathematics.
Each reviewer completed three tasks with each assessment item: (1) judging the primary
objective to which that item corresponds; (2) judging the depth of knowledge of that item; and
(3) judging whether there is a source-of-challenge with an assessment item.
Results
A total of 93 standards across 19 mathematics tests and 71 standards across 16 reading
tests were judged using WAT2. The four major categories of alignment and the degree of
alignment are as follows:
Categorical Concurrence --- A judgment of “YES” indicates that six or more items
target a standard; a judgment of “WEAK” indicates that five items target a standard; and
a judgment of “NO” indicates that fewer than five items target a standard.
Depth-of-Knowledge Consistency --- A judgment of “YES” indicates that 50% or more
of the items were rated “at” or “above” the depth-of-knowledge level of the
corresponding objectives; “WEAK” indicates that 40% to 50% of the items were rated as
“at” or “above” the depth-of-knowledge level of the corresponding objectives; and “NO”

indicates that less than 40% of the items were rated as “at” or “above” the depth-of-
knowledge level of the corresponding objectives
Range-of-Knowledge Correspondence --- “Yes” indicates that 50% or more of the
objectives had at least one coded objective. “Weak” indicates that 40% to 50% of the
objectives had at least one coded objective. “No” indicates that 40% or less of the
objectives had at least one coded objective.
Balance of Representation --- “Yes” indicates that the Balance Index was .7 or above
(items evenly distributed among objectives). “Weak” indicates that the Balance Index
was .6 to .7 (a high percentage of items coded as corresponding to two or three
objectives). “No” indicates that the Balance Index was .6 or less (a high percentage of
items coded as corresponding to one objective.)
The following table summarizes the Web alignment results for the mathematics tests. For
Categorical Concurrence, 63% of the 65 standards received a “YES”. For Depth-of-Knowledge
Consistency, 100% of the standards received a “YES”. For Range of Knowledge, 97% of the
standards received a “YES” and 98% received a “YES” for Balance of Representation. Thus, the
mathematics tests are highly aligned to Common Core Standards. Some standards did not have at
least six questions for that standard. This trend probably reflects the nature of some DEA
benchmark tests. All benchmarks comprise 30 to 40 questions and are designed to be completed
in a class period. Furthermore, some standards have numerous objectives. To ensure that each
benchmark is sampling these objectives, more questions are written to some standards than
others. Mathematics Tests Alignment Summary
YES WEAK NO TOTAL
# % # % # % #
Categorical Concurrence
59 63% 34 37% 93 Depth-of-Knowledge Consistency
93 100% 0 0% 0 0% 93 Range of Knowledge
90 97% 3 3% 0 0% 93 Balance of Representation 91 98% 2 2% 0 0% 93
The following table summarizes the Web alignment results for the reading tests. For
Categorical Concurrence, 82% of the 71 standards received a “YES”. For depth-of-knowledge
Consistency, 80% of the standards received a “YES” and 11% a “WEAK”. For Range of
Knowledge, 87% of the standards received a “YES” and 13% received a “WEAK”. For Balance
of Representation, 99% of the standards received a “YES”. Thus, the reading tests are highly
aligned to Common Core Standards. Some standards did not have at least six questions for that

standard. This trend probably reflects the nature of some DEA benchmark tests. All benchmarks
comprise 30 to 40 questions and are designed to be completed in a class period. Furthermore,
some standards have numerous objectives. To ensure that each benchmark is sampling these
objectives, more questions are written to some standards than others. Furthermore, the depth-of-
knowledge of some standards was rated during consensus at a three level. Some questions to
some objectives were rated slightly below this level.
Reading Tests Alignment Summary
YES WEAK NO TOTAL
# % # % # % #
Categorical Concurrence
58 82%
13 18% 71 Depth-of-Knowledge Consistency
57 80% 8 11% 6 8% 71 Range of Knowledge
62 87% 9 13% 0 0% 71 Balance of Representation 70 99% 1 1% 0 0% 71
The actual Web alignment results for all four categories for all 35 tests are presented in
the tables on the next pages.

Grade 3 Mathematics Fall 2012
Categorical Concurrence
Depth-of-Knowledge Consistency
Range of Knowledge
Balance of Representation
Operations & Algebra YES YES YES YES
Number/Operations Base Ten
NO YES YES YES
Number/Operations Fractions
NO YES YES YES
Measurement & Data YES YES YES YES
Geometry NO YES YES YES
Grade 4 Mathematics Fall 2012
Categorical Concurrence
Depth-of-Knowledge Consistency
Range of Knowledge
Balance of Representation
Operations & Algebra YES YES YES YES
Number/Operations Base Ten
YES YES YES YES
Number/Operations Fractions
YES YES YES YES
Measurement & Data YES YES YES YES
Geometry NO YES YES YES
Grade 5 Mathematics Fall 2012
Categorical Concurrence
Depth-of-Knowledge Consistency
Range of Knowledge
Balance of Representation
Operations & Algebra NO YES YES YES
Number/Operations Base Ten
YES YES YES YES
Number/Operations Fractions
YES YES YES YES
Measurement & Data YES YES YES YES
Geometry YES YES YES YES

Grade 6 Mathematics Fall 2012
Categorical Concurrence
Depth-of-Knowledge Consistency
Range of Knowledge
Balance of Representation
Ratios and Proportions NO YES YES YES
Number System YES YES YES YES
Expressions & Equations YES YES YES YES
Geometry YES YES YES YES
Statistics and Probability
NO YES YES YES
Grade 7 Mathematics Fall 2012
Categorical Concurrence
Depth-of-Knowledge Consistency
Range of Knowledge
Balance of Representation
Ratios and Proportions YES YES YES YES
Number System NO YES YES YES
Expressions & Equations YES YES YES YES
Geometry YES YES YES YES
Statistics and Probability
YES YES YES YES
Grade 8 Mathematics Fall 2012
Categorical Concurrence
Depth-of-Knowledge Consistency
Range of Knowledge
Balance of Representation
Number System NO YES YES YES
Expressions & Equations YES YES YES YES
Functions YES YES YES WEAK
Geometry YES YES YES YES
Statistics and Probability
NO YES YES YES

Algebra I Fall 2012
Categorical Concurrence
Depth-of-Knowledge Consistency
Range of Knowledge
Balance of Representation
Number and Quantity NO YES YES YES
Algebra YES YES YES YES
Functions YES YES YES YES
Statistics and Probability
NO YES YES YES
Algebra II Fall 2012
Categorical Concurrence
Depth-of-Knowledge Consistency
Range of Knowledge
Balance of Representation
Number and Quantity NO YES YES YES
Algebra YES YES YES YES
Functions YES YES YES YES
Statistics and Probability
YES YES YES YES
Geometry Fall 2012
Categorical Concurrence
Depth-of-Knowledge Consistency
Range of Knowledge
Balance of Representation
Congruence YES YES YES YES
Similarity, Right Triangles
YES YES WEAK YES
Circles NO YES YES YES
Expressing Geometric NO YES YES YES
Geometric Measurement
NO YES YES YES
Modeling with Geometry
NO YES YES YES
Statistics NO YES WEAK YES

Grade 3 Mathematics Winter 2012
Categorical Concurrence
Depth-of-Knowledge Consistency
Range of Knowledge
Balance of Representation
Operations & Algebra YES YES YES YES
Number/Operations Base Ten
NO YES YES YES
Number/Operations Fractions
NO YES YES YES
Measurement & Data YES YES YES YES
Geometry NO YES YES YES
Grade 4 Mathematics Winter 2012
Categorical Concurrence
Depth-of-Knowledge Consistency
Range of Knowledge
Balance of Representation
Operations & Algebra YES YES YES WEAK
Number/Operations Base Ten
YES YES YES YES
Number/Operations Fractions
YES YES YES YES
Measurement & Data YES YES YES YES
Geometry NO YES YES YES
Grade 5 Mathematics Winter 2012
Categorical Concurrence
Depth-of-Knowledge Consistency
Range of Knowledge
Balance of Representation
Operations & Algebra NO YES YES YES
Number/Operations Base Ten
YES YES YES YES
Number/Operations Fractions
YES YES YES YES
Measurement & Data YES YES YES YES
Geometry YES YES YES YES

Grade 6 Mathematics Winter 2012
Categorical Concurrence
Depth-of-Knowledge Consistency
Range of Knowledge
Balance of Representation
Ratios and Proportions NO YES YES YES
Number System YES YES YES YES
Expressions & Equations YES YES YES YES
Geometry YES YES YES YES
Statistics and Probability
NO YES YES YES
Grade 7 Mathematics Winter 2012
Categorical Concurrence
Depth-of-Knowledge Consistency
Range of Knowledge
Balance of Representation
Ratios and Proportions YES YES YES YES
Number System NO YES YES YES
Expressions & Equations YES YES YES YES
Geometry YES YES YES YES
Statistics and Probability
YES YES YES YES
Grade 8 Mathematics Winter 2012
Categorical Concurrence
Depth-of-Knowledge Consistency
Range of Knowledge
Balance of Representation
Number System NO YES YES YES
Expressions & Equations YES YES YES YES
Functions YES YES YES YES
Geometry YES YES YES YES
Statistics and Probability
NO YES YES YES

Algebra 1 Winter 2012
Categorical Concurrence
Depth-of-Knowledge Consistency
Range of Knowledge
Balance of Representation
Number and Quantity NO YES YES YES
Algebra YES YES YES YES
Functions YES YES YES YES
Statistics and Probability
NO YES WEAK YES
Algebra 2 Winter 2012
Categorical Concurrence
Depth-of-Knowledge Consistency
Range of Knowledge
Balance of Representation
Number and Quantity NO YES YES YES
Algebra YES YES YES YES
Functions YES YES YES YES
Statistics and Probability
YES YES YES YES
Grade 5 Mathematics Spring 2012
Categorical Concurrence
Depth-of-Knowledge Consistency
Range of Knowledge
Balance of Representation
Operations & Algebra NO YES YES YES
Number/Operations Base Ten
YES YES YES YES
Number/Operations Fractions
YES YES YES YES
Measurement & Data YES YES YES YES
Geometry YES YES YES YES

Grade 8 Mathematics Spring 2012
Categorical Concurrence
Depth-of-Knowledge Consistency
Range of Knowledge
Balance of Representation
Number System NO YES YES YES
Expressions & Equations YES YES YES YES
Functions YES YES YES YES
Geometry YES YES YES YES
Statistics and Probability
NO YES YES YES
Grade 3 Reading Fall 2012
Categorical Concurrence
Depth-of-Knowledge Consistency
Range of Knowledge
Balance of Representation
Reading: Literature YES YES YES YES
Reading: Informational YES NO YES YES
Reading Foundation NO YES YES YES
Writing YES YES YES YES
Language YES YES YES YES
Grade 4 Reading Fall 2012
Categorical Concurrence
Depth-of-Knowledge Consistency
Range of Knowledge
Balance of Representation
Reading: Literature YES YES YES YES
Reading: Informational YES WEAK WEAK YES
Reading Foundation NO YES YES YES
Writing YES WEAK WEAK YES
Language YES YES YES YES

Grade 5 Reading Fall 2012
Categorical Concurrence
Depth-of-Knowledge Consistency
Range of Knowledge
Balance of Representation
Reading: Literature YES WEAK YES YES
Reading: Informational YES YES WEAK YES
Reading Foundation NO YES YES YES
Writing YES WEAK YES YES
Language YES YES YES YES
Grade 6 Reading Fall 2012
Categorical Concurrence
Depth-of-Knowledge Consistency
Range of Knowledge
Balance of Representation
Reading: Literature YES NO YES YES
Reading: Informational YES NO WEAK YES
Writing YES YES YES YES
Language YES YES YES YES
Grade 7 Reading Fall 2012
Categorical Concurrence
Depth-of-Knowledge Consistency
Range of Knowledge
Balance of Representation
Reading: Literature YES WEAK YES YES
Reading: Informational YES NO YES WEAK
Writing YES WEAK YES YES
Language NO YES YES YES
Grade 8 Reading Fall 2012
Categorical Concurrence
Depth-of-Knowledge Consistency
Range of Knowledge
Balance of Representation
Reading: Literature YES NO YES YES
Reading: Informational YES NO YES YES
Writing YES YES YES YES
Language NO YES YES YES

Grade 9 Reading Fall 2012
Categorical Concurrence
Depth-of-Knowledge Consistency
Range of Knowledge
Balance of Representation
Reading: Literature YES WEAK YES YES
Reading: Informational YES YES YES YES
Writing YES YES WEAK YES
Language NO YES YES YES
Grade 10 Reading Fall 2012
Categorical Concurrence
Depth-of-Knowledge Consistency
Range of Knowledge
Balance of Representation
Reading: Literature YES YES YES YES
Reading: Informational YES WEAK YES YES
Writing YES YES WEAK YES
Language YES YES YES YES
Grade 3 Reading Winter 2012
Categorical Concurrence
Depth-of-Knowledge Consistency
Range of Knowledge
Balance of Representation
Reading: Literature YES YES YES YES
Reading: Informational YES YES YES YES
Reading Foundation NO YES YES YES
Writing YES YES YES YES
Language YES YES YES YES
Grade 4 Reading Winter 2012
Categorical Concurrence
Depth-of-Knowledge Consistency
Range of Knowledge
Balance of Representation
Reading: Literature YES YES YES YES
Reading: Informational YES YES YES YES
Reading Foundation NO YES YES YES
Writing YES YES YES YES
Language YES YES YES YES

Grade 5 Reading Winter 2012
Categorical Concurrence
Depth-of-Knowledge Consistency
Range of Knowledge
Balance of Representation
Reading: Literature YES YES YES YES
Reading: Informational YES YES YES YES
Reading Foundation NO YES YES YES
Writing YES YES WEAK YES
Language YES YES YES YES
Grade 6 Reading Winter 2012
Categorical Concurrence
Depth-of-Knowledge Consistency
Range of Knowledge
Balance of Representation
Reading: Literature YES YES YES YES
Reading: Informational YES YES YES YES
Writing YES YES YES YES
Language YES YES WEAK YES
Grade 7 Reading Winter 2012
Categorical Concurrence
Depth-of-Knowledge Consistency
Range of Knowledge
Balance of Representation
Reading: Literature YES YES YES YES
Reading: Informational YES YES YES YES
Writing YES YES WEAK YES
Language NO YES YES YES
Grade 8 Reading Winter 2012
Categorical Concurrence
Depth-of-Knowledge Consistency
Range of Knowledge
Balance of Representation
Reading: Literature YES YES YES YES
Reading: Informational YES YES YES YES
Writing YES YES YES YES
Language NO YES YES YES

Grade 5 Reading Spring 2012
Categorical Concurrence
Depth-of-Knowledge Consistency
Range of Knowledge
Balance of Representation
Reading: Literature YES YES YES YES
Reading: Informational YES YES YES YES
Reading Foundation NO YES YES YES
Writing YES YES YES YES
Language YES YES YES YES
Grade 7 Reading Spring 2012
Categorical Concurrence
Depth-of-Knowledge Consistency
Range of Knowledge
Balance of Representation
Reading: Literature YES YES YES YES
Reading: Informational YES YES YES YES
Writing YES YES YES YES
Language NO YES YES YES