Embed Size (px)
Citation preview

OECD-FAO Agricultural Outlook 2017-2026
© OECD/FAO 2017
101
Chapter 3
Commodity snapshots
This chapter describes the market situation and highlights of the latest set ofquantitative medium-term projections for world and national agricultural markets,for the ten-year period 2017-26. It provides information on prices, production,consumption, trade and main uncertainties for cereals, oilseeds, sugar, meat, dairyproducts, fish, biofuels and cotton. The quantitative projections are developed withthe aid of the partial equilibrium Aglink-Cosimo model of world agriculture. Theprinted version of this chapter only includes the projection highlights for eachcommodity whereas further details and an extensive statistical annex are availableonline.

3. COMMODITY SNAPSHOTS
OECD-FAO AGRICULTURAL OUTLOOK 2017-2026 © OECD/FAO 2017102
CEREALS
Market situationGlobal supplies of major cereals continued to exceed overall demand, leading to a
significant build-up of inventories and much lower prices on international markets as
compared to the previous decade. In 2016, world cereals production reached a new high,
exceeding the previous peak of 2014. Wheat and maize outputs increased the most, driven by
record high crops in several countries, especially among the world’s leading exporters. Given
the continued large surplus of cereals, downward pressure on world prices is unlikely to be
relieved over the coming months.
Projection highlightsPrices will likely remain under pressure in the short term due to low prices during the base
period (2014-16), sluggish economic growth conditions, large stocks, low oil prices, and a strong
US dollar. Over the course of the medium term, however, cereal prices are projected to increase
in nominal terms, but not by enough to keep pace with inflation, which indicates a slight
decline in real terms. The decline in real terms is more pronounced for rice since human
consumption is its only relevant use category while prices of the remaining cereals are also
supported by feed and other uses. Prices of all cereals, even in nominal terms, are projected to
be lower on average than in the previous decade, although well above the levels of before 2007.
Global cereal production is projected to expand by 12% between the base period and 2026,
mainly driven by yield growth. Compared with the base period, production of wheat in 2026 is
projected to be 11% higher (78 Mt), with most of the increase in India (15 Mt), followed by
the European Union (10 Mt), the Russian Federation (7 Mt), Pakistan (6 Mt), and the People’s
Republic of China (hereafter “China”) (5.5 Mt). Rice production is set to increase by 13% (66 Mt),
with most of the increase (58 Mt) concentrated in Asian countries, led by India (20 Mt),
Indonesia (7 Mt), Bangladesh, Thailand (6 Mt each), Viet Nam (4 Mt), and China (3.5 Mt). Maize
production is projected to rise by 14% (138 Mt), led by United States (29 Mt), the Brazil (22 Mt),
China (14 Mt), Argentina (11 Mt), the European Union (9 Mt) and India (6 Mt). Production of
other coarse grains is projected to increase by 10% (30 Mt), with the biggest increases in
Ethiopia (4 Mt), India (3.5 Mt), Argentina (2 Mt), the Russian federation (1.9 Mt), and Nigeria
(1.8 Mt).
Global cereal use is projected to grow by 13% or 338 Mt, to reach 2 863 Mt by 2026. Wheat
consumption is expected to increase by 11% compared to the base period, and will continue to
be largely used for human consumption (67% of total use throughout the projection period).
The use of wheat for feed is projected to increase, primarily in China, Pakistan andViet Nam in
relative terms, while the use of wheat for the production of biofuels will account for only 1.2%
of global use in 2026. Maize use for animal feed is projected to increase to 121 Mt, increasing its
overall share over total use from 56% during the base period to 60% in 2026, largely on account
of fast expanding livestock sectors in developing countries. Maize for human consumption is
projected to grow by 19% (24 Mt), mainly in developing countries also, especially those in Africa
where white maize is a main staple in several countries. The use of other coarse grains is also
set to grow by 12% (34 Mt), driven by feed demand (17 Mt) followed closely by food demand
(16 Mt). The expansion of food use is mainly in Africa (13 Mt), while the European Union and
the Russian Federation have the highest expansion for feed. Direct human consumption

3. COMMODITY SNAPSHOTS
OECD-FAO AGRICULTURAL OUTLOOK 2017-2026 © OECD/FAO 2017 103
remains the main end-use of rice, a major staple in large parts of Asia, Africa, Latin America,
and the Caribbean. Total consumption is predicted to rise from 494 Mt in the base period to
560 Mt by 2026, principally due to population growth. Given the expected demographic
changes, Asian countries are expected to account for close to 80% of the projected increase in
global rice consumption.
World trade in cereals by 2026 is projected to increase to 448 Mt, up 14% from the base
period. At this projected level, global trade would expand at a slightly faster rate than
production (1.5% p.a. vs. 1.2% p.a.), increasing the share of global production that is traded to
15.6%. For wheat, this share is expected to reach 23% by 2026, compared with 13% for maize
and 15% for other coarse grains. The Russian Federation has started to play a major role on
international markets for wheat and maize in the past few years. It was the fifth largest
exporter of wheat on average over the past decade and is projected to become the second
largest exporter over the projection period, contributing 15% to global trade. Developed
countries are expected to continue to be the main exporters of wheat and coarse grains to
developing countries, while rice is mostly traded between developing countries. The global
players on international rice markets are expected to remain the same, although Cambodia
and Myanmar are projected to increase their shares of the international market over the next
decade.
Continued lower cereal prices, as compared to the previous decade, will impact planting
decisions and hence supply responses. Prices relative to other crops, such as oilseeds, are
therefore an important factor as lower prices might lead to a more vigorous reallocation
towards other crops. On the demand side, developments in the fastest growing economies will
have profound implications for trade. Changes in demand in China and the timing with which
they release their maize stocks are the main uncertainties during the projection period.
The expanded cereals chapter is available athttp://dx.doi.org/10.1787/agr_outlook-2017-7-en
Figure 3.1. World cereal prices
Note: Wheat: US wheat No.2 Hard Red Winter (fob), maize: US Gulf maize, No.2 Yellow (fob), other coarse grains: Barley (feed Rouen), rice:Thailand, 100% B, 2nd grade.Source: OECD/FAO (2017), “OECD-FAO Agricultural Outlook”, OECD Agriculture statistics (database), http://dx.doi.org/10.1787/agr-data-en.
1 2 http://dx.doi.org/10.1787/888933522016
0
100
200
300
400
500
600
700
800
1996
2001
2006
2011
2016
2021
2026
1996
2001
2006
2011
2016
2021
2026
1996
2001
2006
2011
2016
2021
2026
1996
2001
2006
2011
2016
2021
2026
Wheat Maize Other coarse grains Rice
USD/t
Nominal price Real price

3. COMMODITY SNAPSHOTS
OECD-FAO AGRICULTURAL OUTLOOK 2017-2026 © OECD/FAO 2017104
OILSEEDS AND OILSEED PRODUCTS
Market situationGlobal soybean production increased strongly in 2016, with the United States and
Brazil registering record crops. The aggregate world production of other oilseeds (rapeseed,
sunflower seed and groundnuts) increased for the first time in three years. Increased
sunflower production, mainly in the Russian Federation and Ukraine, helped offset the
decreased production of rapeseed in the European Union. This has brought some relief to
a relatively tight market situation.
Vegetable oil production declined in the 2015 marketing year for two reasons. First,
palm oil yields decreased in Southeast Asia (Chapter 2) due to El Niño, and secondly, the
market share of soybeans, which contain less oil than other oilseeds, increased, resulting
in a stagnation of oilseed oil production. This led to a sharp decline in world stocks and
although vegetable oil production recovered in 2016, this will not be sufficient to relieve the
relatively tight market in view of the demand growth for vegetable oils to produce biodiesel
in 2016, especially in Indonesia and the United States. Per capita food use of vegetable oils
also continued to grow both in developed and developing countries.
The growing demand for protein meals, especially in China, has been the main driver
behind the expansion of global oilseed production. This has increased the share of protein
meals in the returns from the crushing of oilseeds, in particular for soybeans due to their
higher protein content.
Projection highlightsIn nominal terms all oilseeds and oilseed product prices are projected to increase
slightly over the outlook period. Due to saturated per capita food demand, stagnation in
the biodiesel sector and ongoing livestock intensification in many emerging economies,
vegetable oil prices will decline further than protein meal prices in real terms over the
outlook period. Prices for soybeans and other oilseeds are also projected to decline in real
terms. Nevertheless, volatility should be expected due to market uncertainties.
During the outlook period, global soybean production is expected to continue to
expand, but at 1.9% p.a., which is well below the growth rate of 4.9% p.a. of the last decade.
This slowdown is due mainly to a decrease in additional area planted. Brazil soybean
production is expected to grow at 2.6% p.a., the fastest of the major producers as more
additional land is available, compared to Argentina (2.1% p.a.) and the United States (1.0%
p.a.). Consequently, Brazil is projected to overtake the United States as the largest soybean
producer. Production of other oilseeds increases by 1.0% p.a. over the next decade,
considerably below the 3.4% p.a. growth rate of the previous one. Crushing of soybeans and
other oilseeds into meal (cake) and oil are the dominate usage and will increase faster than
other uses, in particular direct food consumption of soybeans, groundnuts and sunflower
seeds as well as direct feeding of soybeans. Overall, 90% of world soybean production and
86% of world production of other oilseeds are projected to be crushed in 2026.
Vegetable oil includes oil obtained from the crushing of soybeans and other oilseeds
(about 55% of world vegetable oil production), palm oil (35%), as well as palm kernel,
coconut and cottonseed oils. Growth in demand for vegetable oil is expected to be slower

3. COMMODITY SNAPSHOTS
OECD-FAO AGRICULTURAL OUTLOOK 2017-2026 © OECD/FAO 2017 105
in the coming decade due to reduced growth in per capita food use in developing countries
(1.1% p.a. compared to 3.1% in the previous decade) and to the stable demand for vegetable
oils that are used to produce biodiesel. Despite a slowdown in the expansion of the mature
oil palm area, there will be significant production growth in Indonesia (2.0% p.a. vs. 7.0%
p.a. in the previous decade) and Malaysia (1.5% p.a. vs. 1.2% p.a.).
Protein meal production and consumption is dominated by soybean meal. Compared
to the past decade, consumption growth of protein meal (1.7% p.a. vs. 4.1% p.a.) will be
limited by slower growth in global livestock production and by the fact that the protein
meal share in Chinese feed rations has reached a plateau. Chinese consumption of protein
meal is projected to grow by 2.3% p.a. compared to 7.9% p.a. in the previous decade, a rate
which still exceeds the growth rate of animal production.
Vegetable oil has one of the highest trade shares (42%) of production of all agricultural
commodities. This share is expected to remain stable throughout the outlook period, with
global vegetable oil exports reaching 91 Mt by 2026. Vegetable oil exports will continue to be
dominated by Indonesia and Malaysia (Figure 3.2), which are strongly export-orientated:
about two-thirds of Indonesian and more than 80% of Malaysian vegetable oil production is
exported. While the share will remain unchanged in the latter over the outlook period, in
Indonesia it is expected to decrease as more vegetable oil will be used as feedstock for
biofuels. Indonesian exports will grow at 1.5% p.a. compared to 6.1% p.a. in the last decade.
Soybean, other oilseeds and protein meal exports are dominated by the Americas. The
phasing-out of export taxes in Argentina opens new opportunities for its soybean and
sunflower production and their products, although there could be some reallocation of
land in favour of competing grain crops that benefit from immediate export liberalisation.
Growth in world trade of soybeans is expected to slow down considerably in the next
decade, a development directly linked to the projected slower growth in soybean crushing
in China.
Figure 3.2. Exports of oilseeds and oilseed products by region
Source: OECD/FAO (2017), “OECD-FAO Agricultural Outlook”, OECD Agriculture statistics (database), http://dx.doi.org/10.1787/agr-data-en.1 2 http://dx.doi.org/10.1787/888933522035
0
20
40
60
80
100
120
140
160
180
200
2014-16 2026 2014-16 2026 2014-16 2026 2014-16 2026Soybean Other oilseeds Protein meals Vegetable oils
Mt
United States Canada Brazil Argentina Malaysia Indonesia Rest of the World

3. COMMODITY SNAPSHOTS
OECD-FAO AGRICULTURAL OUTLOOK 2017-2026 © OECD/FAO 2017106
The expected expansion of soybean and palm oil production will depend on the
availability of additional new land, which could be constrained by new legislation seeking
to protect the environment. This concerns notably oil palm plantations. Biofuel policies in
the United States, the European Union and Indonesia are also major sources of uncertainty
because they account for a considerable share of the vegetable oil demand in these
countries. In addition, the issues and uncertainties common to most commodities (e.g. the
macroeconomic environment, crude oil prices, and weather conditions) have considerable
influence on the oilseed complex.
The expanded oilseeds and oilseed products chapter is available athttp://dx.doi.org/10.1787/agr_outlook-2017-8-en

3. COMMODITY SNAPSHOTS
OECD-FAO AGRICULTURAL OUTLOOK 2017-2026 © OECD/FAO 2017 107
SUGAR
Market situationAfter five consecutive seasons of a global production surplus in the international sugar
market, the 2015 marketing year marked the start of a production deficit period.
Preliminary data suggest that a production deficit will also prevail in the 2016/17 season, as
the anticipated production increases are considered insufficient to cover world sugar
demand. This global supply shortage can be partially attributed to production setbacks in
some key exporting countries, namely Brazil and Thailand, but also to shortfalls in India,
the world’s second largest sugar producer. It is not expected, however, that the global sugar
stock-to-use ratio will return to the low levels observed in 2009 and 2010, despite stock
releases on the domestic market undertaken by China.
In contrast to other basic agricultural commodities, current international sugar prices
are relatively high. They started to rise sharply in mid-2015 due to tighter market
conditions, ending four seasons of relatively weak world prices. High fructose corn syrup,
the main competitive alternative representing 10% of the market for sweeteners, also
experienced a price increase in 2016 with a realignment of supply-to-demand in
the United States, the main exporting country. These elevated international sugar
quotations augur well for production prospects in the coming years.
Projection highlightsThe start of this outlook period is marked by relatively high sugar market prices,
which conditions the market balance for the coming years. Assuming normal weather
conditions and low input prices, increased crushing is expected throughout the projection
period, thus increasing sugar availability. Sugar prices are expected to come down for some
years before increasing slightly in nominal terms, but to decline further in real terms.
Slowing population growth and changes in consumer attitudes will most likely moderate
future sugar demand growth. The market will continue to be influenced by production
shocks, macroeconomic factors, and domestic policies which shape the performance of
the sugar sub-sector. Efforts to liberalise this market have taken place in key producing
regions, including the European Union (abolition of sugar quota by 2017) and India, and
Thailand is expected to reform its sugar programme in reaction to a complaint lodged by
Brazil at the WTO.
Sugar crop production is projected to expand in many parts of the world, driven by
remunerative returns in comparison to other crops. Sugarcane, cultivated largely in
developing countries (Africa, Asia and South America), will continue to be the main crop
used to produce sugar. The share of sugar from sugar beet is expected to decline slightly
from 14% during the base period to 12.9% in 2026. Brazil is the world’s largest sugar
producer and exporter, and its sector is expected to recover from the severe financial
problems of the last several years. As a sign of recovery, investments for the renewal of
sugarcane plantations have strengthened and are anticipated to expand. In addition, on
the basis of lower international oil prices, sugar is set to be relatively more profitable in
comparison to ethanol at the start of the outlook period but a higher growth is expected in
ethanol production throughout the outlook period.

3. COMMODITY SNAPSHOTS
OECD-FAO AGRICULTURAL OUTLOOK 2017-2026 © OECD/FAO 2017108
In Asia, robust growth in sugar demand will continue to support expansion of the
sugar sector over the outlook period. Efforts to deregulate the sector are not likely to lead
to a complete removal of domestic support policies and associated border measures, but
will have an impact on the market. Expansion is also foreseen in Africa as the number of
operational factories increases (notably in Ethiopia). Globally, the production of sugar crops
and sugar should increase by respectively 17% and 24% over the next ten years, and the
growth in the share of sugarcane production devoted to producing ethanol should be
slightly reduced from about +0.6% p.a. during the last decade to 0.4% this decade.
Per capita global demand growth for sweeteners is not foreseen to change much over
the outlook period compared to the last decade (0.7% p.a. versus 0.6%). Slower population
growth will put a brake on demand growth, as will changing attitudes towards sweetened
products, which are increasingly linked to obesity and other associated health issues.
Some companies have recently taken measures to reduce sugar content in their products.
Although no growth is foreseen in sugar consumption in developed countries over the next
decade, the reverse is true for developing countries due to population growth and
increasing urbanisation, where a higher share of the consumers’ budgets is allocated to
beverages and food. Globally, the consumption of sweeteners is foreseen to increase by
20.3% over the next ten years.
Sugar will continue to be highly traded, with about 33% of total production expected to
be exported over the outlook period. Exports are projected to remain concentrated, with
48% originating from Brazil where sugar cane production is shared between supply of sugar
of which 72% are exported and ethanol for domestic use. Sugar exports are likely to expand
in countries that have modernised or reformed their sugar sectors (notably Australia,
European Union and Thailand). Imports will remain diversified, mostly driven by demand
from Africa and Asia.
Figure 3.3. World nominal and real sugar prices
Note: Raw sugar world price, Intercontinental Exchange contract No.11 nearby futures price; Refined sugar price, Euronext Liffe, FuturesContract No. 407, London. Real sugar prices are nominal world prices deflated by the US GDP deflator (2010=1).Source: OECD/FAO (2017), “OECD-FAO Agricultural Outlook”, OECD Agriculture statistics (database), http://dx.doi.org/10.1787/agr-outl-data-en.
1 2 http://dx.doi.org/10.1787/888933522054
0
100
200
300
400
500
600
700
800
1996
2001
2006
2011
2016
2021
2026
1996
2001
2006
2011
2016
2021
2026
Nominal price Real price
USD/t
Raw sugar White sugar

3. COMMODITY SNAPSHOTS
OECD-FAO AGRICULTURAL OUTLOOK 2017-2026 © OECD/FAO 2017 109
Following four seasons of steady decline, international sugar prices are at a relatively
high level since 2015, although about 28% below the previous peak recorded in 2010.
Nominal prices are projected to decline over the next few years and then remain at a
relatively high plateau when compared to the long-term average, prior to the 2009 price
hike. Prices are projected to reach USD 367/t in 2026, with a premium for white sugar
estimated at USD 86/t. In real terms, sugar quotations are expected to decline consistently
and average lower than the previous ten years.
The outlook for sugar production is dependent on a number of factors, such as
weather events, macroeconomic conditions and national policies. Any changes to these
factors will condition the results of the projections and alter the outcome of the sugar
balance and prices. For example, any changes to the value of the Brazilian currency (real)
against the United States dollar, or changes in the assumed level of world crude oil prices
will alter the producer sugar margin and affect the sugar trade. The projections could also
be affected by market movements of other competing crops, the feed sector, biofuels, or
price fluctuations of other caloric sweeteners.
The expanded sugar chapter is available athttp://dx.doi.org/10.1787/agr_outlook-2017-9-en

3. COMMODITY SNAPSHOTS
OECD-FAO AGRICULTURAL OUTLOOK 2017-2026 © OECD/FAO 2017110
MEAT
Market situationOverall world meat production increased by only 1% to 317 million tonnes in 2016,
with growth in the Americas and Europe offset by a down-turn in output in China in
particular, but also in Australia. This was the second lowest annual increase in the last
decade. Among the various sectors, poultry and bovine meat production expanded, while
a decline was evident in pigmeat and sheepmeat production.
Measured by the FAO Meat Price Index, prices began 2016 at low levels, equivalent to
those last seen at the end of 2009, and despite some recovery during the course of the year,
annual average prices compare to levels attained in 2010, well below recent peaks. Prices
rose for all categories of meat, in particular ovine, pig and poultry meat, with bovine meat
recording more modest growth. Limited supplies of pigmeat in the European Union and of
sheepmeat from Oceania lent support to prices for these products, while firm international
demand, in particular from Asia, underpinned poultry meat prices. Meanwhile, recovery in
bovine meat production in the United States reduced import requirements, contributing to
a smaller lower increase in international prices for this product than for other categories of
meat.
Global meat trade recovered in 2016, rising by 5% to 30 Mt. This represents a return to
trend levels following the decline in 2015. Trade increased for pigmeat by 9%, poultry meat
by 5%, and bovine meat by 3%, while sheepmeat decreased by 3%. At the country level,
China in particular increased its imports of meat, along with Chile, Korea, Mexico,
the European Union, the Philippines, South Africa, and the United Arab Emirates. By
contrast, growth in domestic production reduced imports by the United States and
Canada. Australia, the Russian Federation and Angola also imported less. The expansion in
world meat exports was led by Brazil and the European Union, followed by
the United States, with sales also rising for Argentina, Canada, Mexico, New Zealand,
Paraguay and Thailand. Meanwhile, exports by Australia, China, India, South Africa and
Turkey fell.
Projection highlightsThe outlook for the meat market remains relatively favourable for producers. Feed
grain prices have declined and assuming stable weather are set to remain low for the
projection period. This lends stability to a sector that had been operating in an
environment of particularly high and volatile feed costs over extended periods through the
past decade. This is particularly relevant for regions such as the Americas, Australia and
Europe, where feed grains are being used more intensively in the production of meat.
Global meat production is projected to be 13% higher in 2026 relative to the base period
(2014-16). This compares with an increase of almost 20% in the previous decade.
Developing countries are projected to account for the vast majority of the total increase,
with a more intensive use of feed in the production process. Poultry meat is the primary
driver of the growth in total meat production in response to expanding global demand for
this more affordable animal protein compared to red meats. Low production costs and
lower product prices have contributed to making poultry the meat of choice both for
producers and consumers in developing countries. In the bovine meat sector, cow herds

3. COMMODITY SNAPSHOTS
OECD-FAO AGRICULTURAL OUTLOOK 2017-2026 © OECD/FAO 2017 111
are being rebuilt in several major producing regions, but the decline in cattle slaughter in
these regions is projected to be offset by higher carcass weights. Production is further
increased by rising slaughter numbers in countries that are further along in the rebuilding
cycle. This resulted in slightly higher beef production starting in 2016. Production growth is
expected to accelerate from 2017 onwards, as slaughter volumes continue to increase.
Pigmeat production will also increase after 2017, driven by slow herd expansion in China.
The increase in herd size is, however, slowed by increased environmental regulations and
animal welfare concerns affecting the pork sector. Production is also expected to increase
in the sheepmeat sector with an expected global growth of 2.0% p.a., a higher rate than last
decade. Production increases will be led by China, with expansion also in Algeria, Australia,
Bangladesh, Islamic Republic of Iran, Nigeria, Pakistan and Sudan.
Globally, the traded share of meat output is expected to remain fairly constant, at
around 10%, over the projection period, with most of the increase in volume coming from
poultry meat. Import demand growth will be weak during the first years of the outlook
period, mainly due to lower imports from China and the Russian Federation. Import
demand will strengthen in the second half of the projection period, due to import growth
in the developing world. The most significant growth in import demand originates from
the Philippines and Viet Nam as well as Sub-Saharan Africa, which captures a large share
of additional imports for all meat types. Although developed countries are still expected to
account for slightly more than half of global meat exports by 2026, their share decreases
steadily relative to the base period. On the other hand, the share of the two largest meat
exporting countries, Brazil and the United States, in global meat exports is expected to
increase to around 44%, contributing to almost 70% of the expected increase in global meat
exports over the projection period.
At the start of the outlook, nominal meat prices are expected to be at levels similar or
lower to those registered in 2016. Meat prices are projected to trend only marginally
upwards as the market expands and exerts downward pressure on prices. Despite normal
cycles for meats with longer production cycles, e.g. beef and sheepmeat, nominal prices for
all meats are projected to be higher in 2026 relative to current levels. By 2026, the price for
beef is projected to increase to USD 3984/t carcass weight equivalent (c.w.e.) and to
increase to USD 3938/t c.w.e. for sheepmeat, while world pigmeat and poultry prices are
expected to rise to around USD 1500/t c.w.e. and USD 1 709/t product weight (p.w.) respectively.
Poultry meat demand is expected to increase more rapidly than the demand for pigmeat. In
real terms, prices are expected to trend downwards for all meat types (Figure 3.4), although
meat-to-feed price margins will generally remain within historical trends.
Global meat consumption per capita is expected to stagnate at 34.6 kg retail weight
equivalent (r.w.e.) by 2026, an increase of less than half a kg r.w.e. compared to the base
period. Nonetheless given high population growth rates in much of the developing world,
total consumption is still expected to increase by nearly 1.5% per annum. Additional per
capita consumption will consist mainly of poultry while pigmeat will decline globally on a
per capita basis. In absolute terms, total consumption growth in developed countries over
the projection period is expected to be approximately a fifth of that in developing regions,
where rapid population growth and urbanisation remain the core drivers. These drivers are
particularly important in Sub-Saharan Africa, where the rate of total consumption growth
over the outlook period is faster than any other region. The composition growth is also
different, with beef accounting for most of the total growth. Import demand is also
expected to continue increasing in South East Asia.

3. COMMODITY SNAPSHOTS
OECD-FAO AGRICULTURAL OUTLOOK 2017-2026 © OECD/FAO 2017112
Globally, animal disease outbreaks and trade policies remain among the main factors
driving the evolution and dynamics in world meat markets. The implementation of various
trade agreements, such as the ratified China-Australia Free Trade Agreement (ChAFTA), or
the signed Canada-Ukraine Free Trade Agreement (CUFTA) and the Comprehensive
Economic and Trade Agreement (CETA) over the outlook period could increase and
diversify meat trade. Domestic policies will also impact the meat sector such as the review
in 2018 of the US Farm Bill. Further factors that could impact the meat outlook include
consumer preferences and attitudes towards meat consumption. Consumers are showing
a preference for free-range meat and antibiotic-free meat products, but the extent to which
they are willing and able to pay a premium for them remains unclear.
The expanded meat chapter is available athttp://dx.doi.org/10.1787/agr_outlook-2017-10-en
Figure 3.4. World meat prices
Note: US Choice steers, 1 100-1 300 lb dressed weight, Nebraska. New Zealand lamb schedule price dressed weight, all grade average. USBarrows and gilts, No. 1-3, 230-250 lb dressed weight, Iowa/South Minnesota. Brazil: Export unit value for chicken (f.o.b.) product weight.Source: OECD/FAO (2017), “OECD-FAO Agricultural Outlook”, OECD Agriculture statistics (database), http://dx.doi.org/10.1787/agr-outl-data-en.
1 2 http://dx.doi.org/10.1787/888933522073
1 000
2 000
3 000
4 000
5 000
6 000
0
500
1000
1500
2000
2500
3000
1996
2001
2006
2011
2016
2021
2026
1996
2001
2006
2011
2016
2021
2026
1996
2001
2006
2011
2016
2021
2026
1996
2001
2006
2011
2016
2021
2026
Pork Poultry Beef (right axis) Sheep (right axis)
USD/tUSD/t
Nominal price Real price

3. COMMODITY SNAPSHOTS
OECD-FAO AGRICULTURAL OUTLOOK 2017-2026 © OECD/FAO 2017 113
DAIRY AND DAIRY PRODUCTS
Market situationInternational dairy prices started to increase in the last half of 2016, with butter and
whole milk powder (WMP) accounting for most of this increase. This reversed a decline in
dairy prices that started in 2014 following a decrease in Chinese demand,
the Russian Federation’s ban on imports from several countries, and an increase in
production from some key exporters. From January to December 2016, butter and WMP
prices increased by around 40% and 56% respectively.
Butter prices have recovered significantly and future increases will be limited
compared to other dairy products. The prices of other milk-based products, such as cheese
and skim milk powder (SMP), have increased more slowly but are expected to continue to
increase through 2017. The increase in dairy prices in 2016 was due to a slump in milk
production in Australia, New Zealand and Argentina and the European Union (only in the
second half of 2016), as well as a strong demand for some dairy products, particularly
cheese and butter.
In Oceania, milk production has been limited for several reasons, including low dairy
prices in 2015-16, adverse weather conditions related to El Niño, poor pasture conditions,
and higher prices of cull dairy cows which resulted in a contraction of the dairy herd by
1.6% in 2016. This has encouraged a renewal of dairy herds with younger, more productive
cows, although the monthly culling rate is slowing down as international dairy prices
improve. Considering the production cycle of dairy herds, this suggests a slow recovery in
inventories but an increase in yields. Although China, the largest importer of milk
products, has decreased its imports, mainly WMP, from the highs of 2013-14, Oceania’s
dairy exports are slowly recovering, through higher exports to countries such as Algeria,
Indonesia, Mexico, the Russian Federation, Yemen, Bangladesh, and Egypt. New Zealand
has reduced its production of WMP, but increased its production of cheese in response to
world demand.
Several factors (in particular the import ban imposed by the Russian Federation,
production increases in New Zealand, Australia and the United States, the elimination of
the quota restrictions; decreases in WMP and SMP exports to China) created a challenging
environment for the EU dairy sector in 2015. This changed in mid-2016. On the supply side,
351 029 tonnes of skim milk powder (SMP) were removed from the market via public
purchases through the EU intervention policy. The stock is projected to be released over the
next two years. Both domestic and international cheese and butter consumption
increased, and some key producers reduced their production. The European Union,
however, increased its production, and its exports of cheese and butter grew by 9.5% and
23% respectively, while exports of SMP and WMP decreased by 18% and 5% respectively.
Projection highlightsThere is renewed consumer enthusiasm in developed countries for butter and dairy
fat over substitutes based on vegetable oil. This trend can be attributed to such factors as
more positive health assessments on dairy fat, a change in consumer perceptions towards
taste and towards less processed food, with the result that these products are increasingly
used in bakery products and recipes. As incomes and population increase, and diets

3. COMMODITY SNAPSHOTS
OECD-FAO AGRICULTURAL OUTLOOK 2017-2026 © OECD/FAO 2017114
become more globalised, more dairy products are expected to be consumed in developing
countries. In developed countries, per-capita consumption is projected to grow from
20.2 kg in 2014-16 to 21.4 kg in 2026 in milk solids, compared with an increase from 10.9 kg
to 13.2 kg in developing countries. There are, however, significant regional disparities
amongst developing countries, where fresh dairy products will remain by far the most
consumed; this contrasts with developed countries, where consumer preferences tend
towards processed products (Figure 3.5).
Although in some countries world milk production has been limited in recent years, it
is projected to increase by 178 Mt (22%) in 2026, compared to the 2014-16 base period. The
share of production from developed countries decreases over time, from 49% in 2016 to 44%
in 2026. The majority of the increase in milk production (77%) is anticipated to come from
developing countries, in particular Pakistan and India, which are expected to account for
29% of total milk production by 2026, compared to 24% in the base year. The expansion of
milk production in developing countries at a rate of 2.7% p.a., is expected to be largely
consumed domestically as fresh dairy products. At the world level, production of WMP is
increasing at 1.9% p.a.; production of butter and SMP is expected to grow faster at 2% p.a.
and 2.5% p.a. respectively, while cheese production should grow at 1.4% p.a.
Starting from a relatively low base in 2016, demand growth will support increases in
dairy prices over the medium term. By 2026, cheese prices, currently lower than butter
prices, will surpass the latter and be 38% higher than in the base period. The prices of milk
powders increase slowly in the short term, due to the slow recovery of powder demand
from China. Even though they are not expected to return to the highs of 2013-14, prices of
SMP and WMP will increase by 76% and 60% respectively, between the base period
and 2026, implying modest increases in real terms.
Figure 3.5. Per capita consumption of processed and fresh dairy productsMilk solids
Note: Milk solids are calculated by adding the amount of fat and non-fat solids for each product; Processed products include buttercheese, skim milk powder and whole milk powderSource: OECD/FAO (2017), “OECD-FAO Agricultural Outlook”, OECD Agriculture statistics (database), http://dx.doi.org/10.1787/agr-data-en.
1 2 http://dx.doi.org/10.1787/888933522092
0
5
10
15
20
25
30
35
40
45
2014-16 2026 2014-16 2026 2014-16 2026 2014-16 2026 2014-16 2026 2014-16 2026 2014-16 2026European Union United States Brazil India Pakistan China Sub-Saharan Africa
kg
Processed Products Fresh dairy products

3. COMMODITY SNAPSHOTS
OECD-FAO AGRICULTURAL OUTLOOK 2017-2026 © OECD/FAO 2017 115
The projected depreciation over the medium term of the Argentinian and Brazilian
currencies with respect to the United States dollar will encourage growth in exports from
these countries as they become more competitive. On the import side, the currencies of
most large importers – namely Philippines, Egypt, Islamic Republic of Iran, and Indonesia –
are expected to depreciate, which will reduce their import demands. In the case of Japan,
import demand is constrained by an ageing population, while in Canada the response is
limited by the country’s domestic dairy policies. Between the base period and 2026, the
export share of dairy commodities increases for European Union from 24% to 28%. India –
as the world’s largest milk producing country – has a large expanding domestic market,
and is not projected to become an important player on the export market.
The expanded dairy and dairy products chapter is available athttp://dx.doi.org/10.1787/agr_outlook-2017-11-en

3. COMMODITY SNAPSHOTS
OECD-FAO AGRICULTURAL OUTLOOK 2017-2026 © OECD/FAO 2017116
FISH AND SEAFOOD
Market situationThe global fishery and aquaculture sector continued to expand in 2016, albeit at a
modest rate. This reflects a number of factors, including diseases in aquaculture
production, El Niño, regulatory constraints, and the ongoing inability of capture production
to continue growing under current exploitation conditions. Aquaculture was responsible
for the overall growth in production as capture fisheries experienced lower catches of
selected major species including anchoveta (mainly used to produce fishmeal and fish oil).
Although several exporting countries faced supply constraints, the value of
international fish trade increased in 2016, recouping part of the losses registered in 2015.
This growth in value terms was mainly due to improved prices for a number of highly
traded seafood commodities, in particular salmon. According to the FAO Fish Price Index,
international fish prices were 7% higher on average in the second half of 2016 compared to
the same period in the previous year. Despite higher prices, consumer demand for fish was
sustained, with an overall slight increase in per capita fish intake. Due to a revision of
historical capture fisheries data new statistics indicate that since 2013 aquaculture has
become the main global source of fish for human consumption, rather than 2014 as
previously believed.
Projection highlightsAverage nominal traded fish prices are projected to continue increasing at a rate of
0.8% p.a. over the outlook period and are expected to grow by a total of 7.3% by 2026 when
compared to the 2014-16 base period. Average nominal prices for both aquaculture and
capture species are expected to remain relatively flat or decrease slightly up to 2020 but
then begin growing up to 2026. Nominal prices for fishmeal and fish oil continue trending
upwards over the outlook period with respective growth rates of 3.4% p.a. and 2.0% p.a.
Total fish production at the global level is anticipated to grow by just over 1% p.a. over
the outlook period, a substantial reduction when compared to the 2.4% p.a. growth rate
witnessed over the previous decade. In absolute terms total production is expected to reach
193.9 Mt by 2026, growing by a total of 15.2% (25.6 Mt) from the base period, partly affected
by the assumed El Niño event in 2026. This slowdown is driven by the combined effect of
growth rates falling in both capture fisheries and aquaculture. The annual rate of growth in
world capture production is anticipated to be negative over the projected time period, at -
0.1% p.a., compared with a positive 0.3% p.a. rate of growth observed over the previous
decade (2007-16).
The observed slowdown in aquaculture growth is expected to continue, falling from
5.3% p.a. over the period 2007-16 to 2.3% p.a. for 2017-26. Aquaculture production is
expected to surpass total capture fisheries production (including that utilised for non-food
uses) in 2021, a year when capture production is assumed to be lower as a consequence of
El Niño, and then continue to increase in absolute terms until the end of the outlook period.
Global aquaculture production is anticipated to exceed the 100 Mt mark for the first time
in 2025 and to reach 102 Mt in 2026. Continuing profitability as a consequence of relatively
low feed prices is behind the ongoing growth of aquaculture, and profitability in the sector
is expected to remain high in the short term, especially for species that require small

3. COMMODITY SNAPSHOTS
OECD-FAO AGRICULTURAL OUTLOOK 2017-2026 © OECD/FAO 2017 117
amounts of fishmeal and fish oil. Production of selected freshwater species, including
catfish/pangas, tilapia, and carp are expected to grow fastest over the next decade, all by
more than 35%, while salmon/trout and shrimp will grow by around 27% and 28%,
respectively, and molluscs by around 24%.
The share of capture fisheries production that is reduced into fishmeal and fish oil will
continue to fall over the next decade, with 3.4% less fish being crushed in 2026 than the
base period. Efficiency increases, that are enabling greater quantities of oil and fishmeal to
be recovered from fish waste, mean that the reduced share going to crushing is not
expected to affect total world fishmeal and fish oil production, which will be relatively
stable (except in El Niño years). Production of fishmeal and fish oil from fish residue will
continue to increase, both at rates of 1.6% and 1.5% p.a., respectively, over 2017-26.
Between the base period and 2026 the proportion of total fish oil obtained from waste fish
will grow from 35.7% to 40.1%; for fishmeal this proportion increases from 26.9% to 29.2%
over the same period. With growing demand from aquaculture and a stable supply, the
price of fishmeal will continue to increase relative to oilseed meals.
Fish consumed as food is expected to increase at the global level from 148.8 Mt in the
base period to 177.4 Mt by 2026 but, mirroring changes in production, the rate of increase
is slowing and expected to be 1.4% p.a. over the period 2017-26, down from 2.9% p.a.
in 2007-16. Growth in per capita consumption is also anticipated to slow, from 1.7% p.a.
in 2007-16 to 0.4% p.a. over the projection and to reach 21.6 kg in 2026. At the world level,
proportionally more of the fish being produced will be consumed as food by 2026 (91.5%)
than in the base period (88.4%). At the regional level, per capita consumption is expected to
continue an increasing trend in the Americas and in Europe, whilst rates of growth will
decline in Asia (from 2.5% p.a. over 2007-16 to 0.7% p.a. in 2017-26) and become negative in
Africa (-0.3% p.a. over 2017-26). This prospective decline for Africa raises an alarm in terms
of food security.
Figure 3.6. Regional contributions to world fish and seafood production
Source: OECD/FAO (2017), “OECD-FAO Agricultural Outlook”, OECD Agriculture statistics (database), http://dx.doi.org/10.1787/agr-data-en.1 2 http://dx.doi.org/10.1787/888933522111
0
10
20
30
40
50
60
70
1996
2016
2026
1996
2016
2026
1996
2016
2026
1996
2016
2026
1996
2016
2026
1996
2016
2026
Africa Asia and Pacific excl.China
China Europe Latin America North America
Capture Aquaculture%

3. COMMODITY SNAPSHOTS
OECD-FAO AGRICULTURAL OUTLOOK 2017-2026 © OECD/FAO 2017118
About 35% of total fish production (30% excluding intra-EU trade) is expected to be
exported in different product forms for human consumption, fishmeal and fish oil. After
falling in 2015-16 world trade of fish for human consumption will once again increase, at a
rate of 1.5% p.a. over the outlook period and by a total of 12.9% by 2026 (5.0 Mt lw), but this
rate of increase is flatter than that observed in the previous decade. Being the major
producers, Asian countries are expected to continue to be the main exporters of fish for
human consumption, with their share in world exports to increase from 50% in 2014-16 to
53% in 2026. During the same period, developed countries will reduce their share in world
imports from 53% to 52%.
Many factors influence the evolution and dynamics of world fish markets and, as a
consequence, a range of uncertainties exist when projecting into the future. For production
this includes: environmental degradation and habitat destruction, overfishing, illegal,
unreported and unregulated fishing (IUU), climate change, transboundary issues with
respect to natural resource utilisation, poor governance, invasion of non-native species,
diseases and escapes, accessibility and availability of sites and water resources, as well as
to technology and finance. From the perspective of market access, issues include those
related to food safety and traceability, the need to demonstrate that products are not
derived from illegal and proscribed fishing operations, and uncertainties around the
international trade environment in the short to medium term.
The expanded fish and seafood chapter is available athttp://dx.doi.org/10.1787/agr_outlook-2017-12-en

3. COMMODITY SNAPSHOTS
OECD-FAO AGRICULTURAL OUTLOOK 2017-2026 © OECD/FAO 2017 119
BIOFUELS
Market situationInternational prices of biodiesel and ethanol stabilised in 2016. Demand for biofuels
was sustained by bioenergy obligatory blending and by the surge in demand for
transportation fuels due to continued weak energy prices. Unfavourable price ratios of
biofuels to conventional fuels resulted in a limited demand for non-mandated use of
biofuels, with the notable exception of Brazil where recent policy reforms in several states
favour hydrous ethanol which can be used directly by their flex-fuel vehicle fleet. Despite
low crude oil prices, policy decisions were favourable to biofuels in 2016 with
developments such as mandate increases and differential taxation systems or subsidies
enacted in several countries.
In the United States, the Environmental Protection Agency’s (EPA) final rulemaking
for 2017 increased the maximum potential access for corn ethanol under the program to
the statutory limit of 15 billion gallons and specified an “advanced” mandate that is higher
than it would have been if it fully reflected the reduction of the cellulosic mandate. This
translates into a strong demand for ethanol and biodiesel, despite the blend wall1
constraint. The European Commission provided a nuanced message in a July 2016
communication on the limited role that food-based biofuels would play in decarbonising
the transport sector post-2020. A revision to the European legislation – the RED2
legislation2– was proposed in February 2017 but is not considered in these projections. It
sets a limit of 3.8% for the portion of renewable energy in the transport sector coming from
food and feed crops below the current 7% cap.
Projection highlightsInternational crude oil prices are expected to double in nominal terms over the
baseline period. This should lower demand for gasoline and diesel fuels, especially in
developed countries. Biofuel prices, similar to biofuel feedstock prices, should trend
upward but at a slower pace than energy prices. The evolution of ethanol and biodiesel
markets over the baseline period is expected to continue to be driven by policies. Biofuel
policies are subject to uncertainty and projections; they are based in this Outlook on a specific
set of assumptions concerning the continuation of the same policies over the next ten years.
For the United States, all mandates are assumed to remain at their announced levels
for 2017 except the cellulosic mandate, which should continue to increase moderately. The
ethanol blend wall is set to increase to 11.3% by 2026. This Outlook thus assumes a limited
development of mid-blends of ethanol. In addition, biodiesel use is assumed to increase in
the early years of the outlook period, above the biodiesel mandate, to meet part of the
advanced mandate (Figure 3.7). The Canadian Federal program called ecoENERGY for
biofuels that started in 2008 with incentives of CAD 0.10 per litre for ethanol and CAD 0.26
per litre for biodiesel is gradually phased out with payments reduced to CAD 0.03 and
CAD 0.04 respectively for ethanol and biodiesel.
1. The term blend wall refers to short-term technical constraints that act as an impediment toincreased ethanol use.
2. http://eur-lex.europa.eu/legal-content/EN/TXT/?uri=CELEX:52016PC0767R%2801%29

3. COMMODITY SNAPSHOTS
OECD-FAO AGRICULTURAL OUTLOOK 2017-2026 © OECD/FAO 2017120
The use of biofuels in the European Union is assumed to be governed by the 2009
Renewable Energy (RED) and Fuel Quality Directives and the 2015 ILUC Directive, as well as
by national legislations. The proportion of total transportation energy accounted for
biofuels, including double counting for waste- and residue-based biofuels, is expected to
reach 6.4% by 2020 and to remain stable thereafter. The remainder of the 10% RED target
should be met from other renewable energy sources.
It is assumed that the Brazilian taxation system will remain favourable to hydrous
ethanol rather than gasohol, which corresponds to the mandatory mix of 27% ethanol with
gasoline. Brazilian ethanol demand is expected to expand by 6 blnL over the outlook
period. The Brazilian biodiesel mandate should reach 10% by 2019, leading to an increase
in production of more than 40% over the next ten years. In Argentina, it is assumed that the
12% blending mandate for biodiesel and ethanol will be fulfilled by 2020. Argentinean
biodiesel production should be also driven by US import demand to meet the latter’s
advanced mandate.
Thailand is expected to be a significant player on biofuel markets, with most of its
biofuel use met by domestic production. The Thai government plan to increase use of
biofuels entails a differential taxation and subsidy system that is favourable to higher
blends of ethanol in gasoline. The Indian government should continue to support the
production of ethanol from molasses. It is assumed, however, that the observed blending
share of ethanol in gasoline remains lower than the 5% mandate. The Indonesian
government has a 20% biodiesel blending mandate, but this Outlook assumes that this
mandate will not be fulfilled. The development of biodiesel production in Indonesia is
related to the potential attribution of subsidies to biodiesel producers. Chinese use of
ethanol should expand by about 1 blnL with mandates in place in some cities. Chinese
ethanol is expected to be produced domestically from maize – thus helping to lower
domestic stocks – and from cassava.
Figure 3.7. Evolution of ethanol blending in gasoline fuels and of biodiesel blending in dieselfuels
Note: Shares are expressed in volume.Source: OECD/FAO (2017), “OECD-FAO Agricultural Outlook”, OECD Agriculture statistics (database), http://dx.doi.org/10.1787/agr-data-en.
1 2 http://dx.doi.org/10.1787/888933522130
0
10
20
30
40
50
60
0
5
10
15
20
25
30
2006
2011
2016
2021
2026
2006
2011
2016
2021
2026
2006
2011
2016
2021
2026
2006
2011
2016
2021
2026
2006
2011
2016
2021
2026
2006
2011
2016
2021
2026
United States European Union Brazil (Ethanol right axis) Argentina Thailand (Ethanol rightaxis)
Indonesia
Ethanol Biodiesel% %

3. COMMODITY SNAPSHOTS
OECD-FAO AGRICULTURAL OUTLOOK 2017-2026 © OECD/FAO 2017 121
Given these expected developments, global ethanol production should expand from
120 blnL in 2016 to 137 blnL by 2026, while global biodiesel production should increase
from 37 blnL in 2016 to 40.5 blnL by 2026. By 2026, 55% of global ethanol production should
be based on maize and 35% on sugar crops. In 2026, about 30% of global biodiesel
production should be based on waste vegetable oils. Advanced biofuels based on residues
are not expected to take off over the projection period due to lack of investment in research
and development.
Biofuel trade will remain limited. Potential ethanol exporters are the United States
where the blend wall limits further increases in domestic demand and Brazil where
ethanol could fulfil part of the US advanced ethanol mandate. Brazilian ethanol exports are
not expected to expand as US ethanol is likely to remain cheaper over the outlook period.
Argentina is expected to be a major biodiesel exporter with most exports directed towards
the United States. The future of European biodiesel anti-dumping duties is an important
uncertainty in the evolution of biodiesel trade.
The expanded biofuels chapter is available athttp://dx.doi.org/10.1787/agr_outlook-2017-13-en

3. COMMODITY SNAPSHOTS
OECD-FAO AGRICULTURAL OUTLOOK 2017-2026 © OECD/FAO 2017122
COTTON
Market situationThere was a light recovery in the world cotton market during the 2016 marketing
year following a strong drop in production in 2015, from 26.2 Mt in 2014 to 21.2 Mt. Global
cotton production recovered by about 7% in 2016 due to improved yields. In addition, on-
going stock releases sustained world consumption, although total world stocks remain at
a very high level (18 Mt, 7.5% less than 2015, but still the equivalent of about eight
months of world consumption). Production increased in almost all major cotton
producing countries, with the exception of China. Pakistan, the United States, Brazil and
India increased production by 17%, 24%, 7% and 1%, respectively due to improved yields
that over-compensated a contraction in the area planted.
Global cotton demand stagnated at around 23.9 Mt during the 2016 marketing year.
Mill consumption estimates in India remained stable at 5.3 Mt, but in China, decreased by
2.0% to 7.2 Mt. Mill consumption increased in Viet Nam by 12% and in Bangladesh by 11%.
The increase in Pakistan was 1%. Global cotton trade recovered slightly, increasing by
3.8% in 2016 to 7.7 Mt. Increases in imports by Bangladesh, Pakistan and Viet Nam were
insufficient to offset the decline in many countries’ import demand since 2015. China’s
new cotton support policy, which narrowed the price gap between domestic and
imported cotton, is behind this sluggish consumption; its domestic cotton price was
below the imported price for a limited time in 2016. Moreover, US exports continued to
increase, to 2.7 Mt or 27%, over the previous year, and Australia’s exports increased by
17% as production recovered.
Projection highlightsAlthough the world cotton price remains under pressure due to high stock levels and
fierce competition from synthetic fibres, cotton prices are expected to be relatively stable
in nominal terms. This makes cotton less competitive because prices for polyester are
significantly lower than international and domestic cotton prices and likely to decrease
further. During 2017-26, relative stability is expected as government support policies
continue to stabilise markets in major cotton-producing countries. However, world
cotton prices are expected to be lower in real terms than the average during the base
period (2014-16).
World production is expected to grow at a slower pace than consumption during the
first few years of the outlook period, reflecting anticipated lower price levels and
projected releases of global stocks accumulated between 2010 and 2014. More cotton may
be auctioned if sales are strong and market prices increase. Last year, around 2.6 Mt were
sold through to the end of September 2016. The stock-to-use ratio is expected to fall to
39% in 2026 from 83% in the base period. The global land use devoted to cotton is
projected to decrease slightly below the average in the base period. Global cotton yields
will grow slowly as production gradually shifts from relatively high yielding countries,
notably China, to relatively low-yielding ones in South Asia.
World cotton use is expected to grow at 0.9% p.a. as a result of slower economic and
population growth in comparison with 2000s, reaching 26.0 Mt in 2026. Consumption in
China is expected to fall by 15% from the base period to 6.2 Mt following the downward

3. COMMODITY SNAPSHOTS
OECD-FAO AGRICULTURAL OUTLOOK 2017-2026 © OECD/FAO 2017 123
trend since 2010, while India will become the world’s most important country for cotton
mill consumption with 6.7 Mt in 2026. Higher cotton mill consumption by 2026 is also
foreseen for Viet Nam, Bangladesh, Indonesia and Turkey, with consumption increasing
by 45%, 47%, 10% and 8% respectively.
It is expected that global cotton trade will grow more slowly compared to previous
years, especially 2011-13 when growth was driven by surging Chinese imports. Trade
in 2026 is expected, however, to exceed the average of the 2000s. To obtain value-added
from mills, there has been a shift in the past several years from trading raw cotton to
cotton yarn and man-made fibres, and which is expected to continue. Global raw cotton
trade will nevertheless reach 8.5 Mt by 2026, 12% higher than the average of the 2014-16
base period, despite cotton being less competitive as prices for polyester are expected to
be significantly lower. The United States retains its position as the world’s largest
exporter, accounting for 33% of world trade, a percentage that will remain stable. Brazil is
ranked second with exports expected to reach 1.1 Mt, from 0.9 Mt. Cotton producing
countries in Sub-Saharan Africa, as a whole, are expected to increase their exports to
1.5 Mt by 2026. After a strong decrease of cotton imports by China 2012 and 2016 it is
expected that import increase over the outlook period to about 1.3 Mt in 2026. Its
dominant role in the world cotton market will be significantly challenged as other
importing countries emerge and India is assumed to be the largest cotton importer
in 2026. It is projected that imports in Bangladesh and Viet Nam will increase to 1.5 Mt,
each.
While increases in farm labour costs and competition for resources with other
agricultural crops place significant constraints on growth, higher productivity driven by
technological progress, including greater adoption of bio-tech cotton, creates significant
potential for cotton production to expand in the next decade. Although the medium-term
prospects are for sustained growth, there may be potential short-term uncertainties in
the current outlook period which may result in short-term volatility in demand, supply
and prices. A sudden slow-down in the global economy, a sharp drop in global textiles
Figure 3.8. Cotton consumption by region
Source: OECD/FAO (2017), “OECD-FAO Agricultural Outlook”, OECD Agriculture statistics (database), http://dx.doi.org/10.1787/agr-data-en.1 2 http://dx.doi.org/10.1787/888933522149
0
2
4
6
8
10
12
2006 2007 2008 2009 2010 2011 2012 2013 2014 2015 2016 2017 2018 2019 2020 2021 2022 2023 2024 2025 2026
Mt
China India Pakistan Rest of the World

3. COMMODITY SNAPSHOTS
OECD-FAO AGRICULTURAL OUTLOOK 2017-2026 © OECD/FAO 2017124
and clothing trade, competitive prices and quality from synthetic fibres, and changes in
government policies are important factors that can affect the cotton market. The
unprecedented high level of stocks is currently a key driver of the world cotton price.
The expanded cotton chapter is available athttp://dx.doi.org/10.1787/agr_outlook-2017-14-en

OECD-FAO Agricultural Outlook 2017-2026
© OECD/FAO 2017
125
ANNEX
Commodity snapshot tables

ANNEX: COMMODITY SNAPSHOT TABLES
OECD-FAO AGRICULTURAL OUTLOOK 2017-2026 © OECD/FAO 2017126
Table 3.A1.1. World cereal projections
Marketing year
Average2014-16est 2017 2018 2019 2020 2021 2022 2023 2024 2025 2026
WHEATWorld
Production Mt 742.1 744.2 755.5 763.3 771.4 780.0 788.1 796.3 804.4 812.4 820.8Area Mha 222.7 222.8 223.5 224.0 224.4 224.9 225.3 225.6 226.0 226.4 226.7Yield t/ha 3.33 3.34 3.38 3.41 3.44 3.47 3.50 3.53 3.56 3.59 3.62
Consumption Mt 722.4 754.2 753.2 760.6 767.9 775.9 783.2 791.1 798.9 806.9 815.3Feed use Mt 138.5 148.5 146.4 148.0 149.8 152.0 153.9 155.9 157.8 159.9 162.3Food use Mt 491.5 507.1 512.8 517.7 522.4 527.3 532.3 537.1 542.1 547.0 551.9Biofuel use Mt 13.1 13.2 13.6 13.7 13.6 13.3 13.6 13.4 13.4 13.5 13.3Other use Mt 79.2 85.5 80.4 81.3 82.2 83.2 83.5 84.7 85.6 86.5 87.8
Exports Mt 165.8 168.8 173.9 176.5 178.5 180.4 182.7 184.8 186.9 189.1 191.1Closing stocks Mt 226.3 226.1 226.0 226.3 227.3 229.0 231.6 234.4 237.4 240.4 243.5
Price1 USD/t 207.3 200.5 202.5 208.2 215.9 225.3 232.7 238.5 243.6 246.2 248.9
Developed countriesProduction Mt 397.5 396.7 403.7 407.0 410.8 414.6 418.0 421.2 424.4 427.6 430.9Consumption Mt 275.2 279.9 277.9 279.5 281.0 282.9 284.4 286.1 287.7 289.4 291.1Net trade Mt 115.4 121.4 126.8 129.0 130.6 132.0 133.6 135.0 136.5 138.1 139.5Closing stocks Mt 78.4 81.1 80.1 78.7 77.8 77.5 77.5 77.5 77.7 77.9 78.3
Developing countriesProduction Mt 344.6 347.4 351.8 356.3 360.6 365.4 370.2 375.1 380.1 384.8 389.9Consumption Mt 447.2 474.3 475.3 481.1 486.9 492.9 498.8 504.9 511.3 517.6 524.2Net trade Mt -112.9 -119.0 -124.3 -126.6 -128.2 -129.5 -131.2 -132.6 -134.1 -135.6 -137.0Closing stocks Mt 147.9 145.0 145.8 147.6 149.5 151.5 154.1 156.8 159.7 162.6 165.3
OECD2
Production Mt 298.0 294.0 298.2 300.8 303.4 306.1 308.4 310.7 312.8 315.0 317.1Consumption Mt 224.5 230.0 227.4 228.6 229.7 231.1 232.1 233.3 234.4 235.6 236.7Net trade Mt 68.5 69.2 71.8 73.7 74.6 75.4 76.5 77.4 78.4 79.4 80.1Closing stocks Mt 58.7 58.6 57.5 56.0 55.2 54.8 54.6 54.6 54.6 54.5 54.7
MAIZEWorld
Production Mt 1 024.7 1 042.4 1 050.8 1 066.2 1 078.9 1 096.0 1 109.7 1 123.0 1 136.0 1 149.4 1 163.7Area Mha 177.9 178.0 178.0 178.7 179.0 179.9 180.4 180.8 181.0 181.4 181.8Yield t/ha 5.76 5.85 5.90 5.96 6.03 6.09 6.15 6.21 6.28 6.34 6.40
Consumption Mt 1 015.1 1 041.3 1 058.3 1 072.2 1 083.2 1 096.0 1 106.6 1 119.6 1 132.1 1 147.0 1 161.2Feed use Mt 574.1 600.9 609.3 621.7 629.9 642.1 650.8 662.2 672.8 683.8 695.4Food use Mt 131.5 135.7 137.9 140.0 142.1 144.4 146.8 149.2 151.5 153.9 156.3Biofuel use Mt 167.5 176.6 181.0 181.4 183.4 182.8 182.7 182.3 181.9 181.5 180.8Other use Mt 99.0 84.0 85.4 83.6 81.5 79.8 78.7 77.8 77.3 78.6 78.9
Exports Mt 135.3 137.9 138.4 139.3 140.6 143.0 145.6 148.1 150.2 152.4 154.5Closing stocks Mt 228.8 222.1 213.3 206.1 200.6 199.4 201.3 203.5 206.2 207.5 208.8
Price3 USD/t 164.4 156.5 161.1 164.9 173.5 179.4 183.8 185.5 190.2 193.6 196.7
Developed countriesProduction Mt 504.7 513.1 515.0 521.7 526.6 533.4 538.4 543.6 548.4 553.3 558.6Consumption Mt 447.5 465.6 472.4 478.4 482.3 486.7 488.8 493.1 496.8 500.8 505.1Net trade Mt 46.9 47.9 46.4 46.9 47.1 47.4 48.2 49.8 51.2 52.2 53.2Closing stocks Mt 80.3 86.3 82.5 78.8 76.0 75.3 76.6 77.3 77.8 78.1 78.3
Developing countriesProduction Mt 520.0 529.4 535.8 544.5 552.3 562.7 571.3 579.5 587.6 596.1 605.1Consumption Mt 567.6 575.7 586.0 593.8 600.9 609.3 617.8 626.6 635.4 646.2 656.0Net trade Mt -45.4 -46.7 -45.2 -45.7 -45.9 -46.2 -47.0 -48.6 -50.0 -51.0 -52.0Closing stocks Mt 148.5 135.8 130.8 127.3 124.6 124.1 124.7 126.2 128.4 129.4 130.5
OECD2
Production Mt 474.8 478.5 479.6 485.7 489.9 496.2 500.7 505.3 509.6 513.9 518.7Consumption Mt 466.3 485.8 492.6 498.5 502.3 506.8 509.0 513.2 516.9 521.0 525.3Net trade Mt -1.9 -5.8 -7.8 -8.5 -9.6 -9.8 -9.6 -8.4 -7.7 -7.2 -6.8Closing stocks Mt 78.3 84.6 79.4 75.1 72.3 71.6 72.9 73.4 73.8 74.0 74.2

ANNEX: COMMODITY SNAPSHOT TABLES
OECD-FAO AGRICULTURAL OUTLOOK 2017-2026 © OECD/FAO 2017 127
Table 3.A1.1. World cereal projections (cont.)
Note: Marketing year: See Glossary of Terms for definitions.Average 2014-16est: Data for 2016 are estimated.
1. No.2 hard red winter wheat, ordinary protein, United States FOB Gulf Ports (June/May).2. Excludes Iceland but includes all EU28 member countries.3. No.2 yellow corn, United States FOB Gulf Ports (September/August).4. Feed barley, Europe, FOB Rouen.5. Milled 100%, grade b, nominal price quote, FOB Bangkok (January/December).Source: OECD/FAO (2017), “OECD-FAO Agricultural Outlook”, OECD Agriculture statistics (database). doi: dx.doi.org/10.1787/agr-outl-data-en
Marketing year
Average2014-16est 2017 2018 2019 2020 2021 2022 2023 2024 2025 2026
OTHER COARSE GRAINSWorld
Production Mt 301.4 302.1 305.4 308.5 311.8 315.2 318.6 321.9 325.1 328.5 331.8Area Mha 156.2 153.9 154.0 154.2 154.3 154.4 154.6 154.8 154.9 155.1 155.3Yield t/ha 1.93 1.96 1.98 2.00 2.02 2.04 2.06 2.08 2.10 2.12 2.14
Consumption Mt 292.5 298.1 300.3 304.1 307.2 310.4 313.2 316.5 319.7 323.1 326.5Feed use Mt 165.1 166.5 166.7 169.1 172.2 174.3 175.7 177.6 179.2 180.7 182.0Food use Mt 75.5 77.9 79.6 81.0 82.4 83.8 85.3 86.8 88.4 89.9 91.5Biofuel use Mt 7.8 9.8 10.1 10.1 10.2 10.2 10.1 9.9 9.9 9.9 9.9Other use Mt 44.2 43.9 43.9 43.9 42.4 42.1 42.2 42.1 42.1 42.6 43.0
Exports Mt 49.2 43.4 43.9 44.9 45.9 46.7 47.7 48.7 49.5 50.3 51.2Closing stocks Mt 58.1 61.4 61.5 60.8 60.4 60.1 60.5 60.9 61.3 61.5 61.8
Price4 USD/t 179.4 154.6 155.6 162.3 170.2 181.1 186.8 187.8 191.9 195.3 198.3
Developed countriesProduction Mt 188.9 185.4 186.8 188.1 189.3 190.4 191.5 192.5 193.5 194.5 195.5Consumption Mt 150.1 156.1 156.1 156.9 157.2 157.5 157.5 157.7 157.9 158.4 158.6Net trade Mt 36.2 30.4 30.7 31.6 32.4 33.1 34.0 34.8 35.5 36.1 36.9Closing stocks Mt 37.1 41.2 41.2 40.8 40.4 40.3 40.4 40.4 40.5 40.5 40.4
Developing countriesProduction Mt 112.5 116.7 118.6 120.4 122.6 124.8 127.1 129.4 131.6 134.0 136.4Consumption Mt 142.4 142.0 144.2 147.2 150.0 152.8 155.7 158.7 161.7 164.8 167.8Net trade Mt -30.1 -25.3 -25.6 -26.5 -27.4 -28.0 -28.9 -29.8 -30.4 -31.1 -31.9Closing stocks Mt 21.0 20.2 20.2 20.0 19.9 19.9 20.1 20.5 20.8 21.1 21.5
OECD2
Production Mt 155.0 150.2 151.4 152.4 153.3 154.3 155.3 156.2 157.1 158.0 159.0Consumption Mt 129.3 133.2 132.7 133.3 133.4 133.6 133.5 133.9 134.3 134.9 135.4Net trade Mt 24.9 18.8 19.0 19.6 20.3 20.7 21.4 22.1 22.6 23.0 23.6Closing stocks Mt 30.9 31.7 31.4 30.9 30.6 30.5 30.8 31.0 31.2 31.4 31.4
RICEWorld
Production Mt 494.9 506.5 512.5 518.2 524.2 530.0 536.1 542.1 548.3 554.6 560.9Area Mha 162.3 163.8 163.8 163.9 164.0 164.0 164.0 164.1 164.1 164.2 164.2Yield t/ha 3.05 3.09 3.13 3.16 3.20 3.23 3.27 3.30 3.34 3.38 3.42
Consumption Mt 494.7 507.6 513.5 518.1 524.3 530.1 535.8 541.8 547.8 553.9 560.1Feed use Mt 20.6 21.9 22.6 23.0 23.3 23.7 23.9 24.2 24.5 24.8 25.2Food use Mt 399.9 409.6 414.4 418.9 423.8 428.2 432.6 437.0 441.4 445.8 450.3
Exports Mt 44.0 42.7 43.7 44.7 45.6 46.6 47.4 48.3 49.3 50.2 51.2Closing stocks Mt 171.7 169.4 167.9 167.5 166.9 166.4 166.2 166.1 166.2 166.5 166.8
Price5 USD/t 375.1 389.0 393.5 398.4 400.3 405.0 407.6 409.5 411.1 412.9 415.5
Developed countriesProduction Mt 18.1 17.3 18.2 18.2 18.3 18.4 18.4 18.5 18.5 18.6 18.6Consumption Mt 19.1 19.3 19.3 19.3 19.3 19.3 19.3 19.3 19.3 19.3 19.3Net trade Mt -1.1 -1.4 -0.9 -1.0 -1.0 -1.0 -1.0 -1.0 -1.0 -0.9 -0.9Closing stocks Mt 5.1 4.4 4.2 4.1 4.1 4.1 4.2 4.3 4.5 4.7 4.9
Developing countriesProduction Mt 476.8 489.2 494.3 499.9 505.9 511.6 517.6 523.7 529.8 536.0 542.3Consumption Mt 475.6 488.3 494.3 498.8 505.0 510.8 516.5 522.5 528.4 534.6 540.8Net trade Mt 1.5 1.8 1.4 1.4 1.5 1.4 1.4 1.4 1.4 1.4 1.3Closing stocks Mt 166.5 165.0 163.7 163.4 162.9 162.3 162.0 161.7 161.7 161.8 161.9
OECD2
Production Mt 21.8 20.8 21.7 21.6 21.7 21.7 21.7 21.7 21.7 21.7 21.7Consumption Mt 22.9 23.3 23.2 23.1 23.0 23.0 22.9 22.9 22.8 22.8 22.7Net trade Mt -1.4 -1.6 -1.2 -1.3 -1.3 -1.3 -1.3 -1.3 -1.3 -1.3 -1.3Closing stocks Mt 6.6 5.8 5.4 5.2 5.1 5.1 5.2 5.3 5.4 5.6 5.8

ANNEX: COMMODITY SNAPSHOT TABLES
OECD-FAO AGRICULTURAL OUTLOOK 2017-2026 © OECD/FAO 2017128
Table 3.A1.2. World oilseed projections
Marketing year
Average2014-16est 2017 2018 2019 2020 2021 2022 2023 2024 2025 2026
SOYBEANWorld
Production Mt 325.6 338.6 344.6 350.7 358.2 364.7 372.9 378.7 386.7 393.1 401.3Consumption Mt 322.2 341.9 347.0 352.0 358.6 365.3 372.5 379.0 386.2 393.3 401.1
Crush Mt 288.1 306.3 310.8 315.5 321.6 327.9 334.6 340.6 347.5 354.1 361.4Closing stocks Mt 36.3 33.5 31.1 29.8 29.4 28.8 29.1 28.8 29.3 29.0 29.2
Price1 USD/t 402.2 389.7 398.2 408.6 412.0 430.6 434.0 439.6 439.5 442.2 446.1
Developed countriesProduction Mt 127.3 128.0 128.9 129.7 131.6 133.3 135.2 136.4 138.2 139.6 141.1Consumption Mt 86.7 88.2 89.0 89.2 90.4 91.5 92.8 93.5 94.7 95.6 97.1
Crush Mt 77.7 79.6 80.3 80.6 81.7 82.8 84.0 84.8 86.0 86.9 88.2Closing stocks Mt 11.3 13.2 11.4 10.6 10.3 10.3 10.6 10.7 11.2 11.2 11.7
Developing countriesProduction Mt 198.3 210.7 215.7 220.9 226.6 231.4 237.7 242.3 248.4 253.4 260.2Consumption Mt 235.5 253.7 258.0 262.8 268.2 273.8 279.8 285.5 291.5 297.7 304.0
Crush Mt 210.4 226.7 230.5 234.9 239.9 245.1 250.5 255.8 261.4 267.2 273.2Closing stocks Mt 25.0 20.3 19.7 19.2 19.0 18.5 18.5 18.2 18.1 17.8 17.6
OECD2
Production Mt 119.6 119.4 120.1 120.7 122.3 123.7 125.3 126.3 127.9 129.0 130.2Consumption Mt 87.5 89.1 89.8 89.9 91.1 92.0 93.1 93.8 94.9 95.8 97.2
Crush Mt 78.4 80.3 81.0 81.1 82.2 83.2 84.3 84.9 86.1 86.9 88.2Closing stocks Mt 11.2 12.9 11.1 10.3 10.0 10.0 10.3 10.4 10.9 10.9 11.3
OTHER OILSEEDSWorld
Production Mt 139.9 146.0 147.7 149.4 151.1 152.7 154.3 156.3 158.0 159.3 161.2Consumption Mt 141.1 145.2 147.5 149.6 151.4 152.9 154.4 156.2 158.0 159.5 161.0
Crush Mt 119.5 123.2 125.4 127.4 129.1 130.6 131.9 133.6 135.2 136.6 138.0Closing stocks Mt 8.1 8.2 8.4 8.2 7.9 7.8 7.7 7.8 7.8 7.6 7.8
Price3 USD/t 420.0 431.3 425.0 428.3 441.7 451.4 454.4 459.0 465.8 477.3 483.2
Developed countriesProduction Mt 84.3 88.1 89.1 90.3 91.4 92.5 93.4 94.9 96.0 96.7 98.0Consumption Mt 76.6 79.7 81.1 82.2 82.9 83.6 84.3 85.2 86.0 86.7 87.4
Crush Mt 69.5 72.5 73.8 74.7 75.3 76.0 76.5 77.3 78.0 78.7 79.2Closing stocks Mt 6.2 6.5 6.7 6.5 6.2 6.0 5.9 6.0 6.0 5.8 6.0
Developing countriesProduction Mt 55.6 57.9 58.6 59.1 59.7 60.2 60.9 61.4 62.0 62.6 63.3Consumption Mt 64.6 65.4 66.4 67.4 68.5 69.2 70.1 71.1 72.0 72.8 73.7
Crush Mt 50.0 50.7 51.7 52.7 53.8 54.6 55.4 56.3 57.2 58.0 58.8Closing stocks Mt 1.9 1.7 1.7 1.7 1.7 1.8 1.8 1.8 1.8 1.9 1.9
OECD2
Production Mt 57.9 58.6 59.0 59.5 59.9 60.3 60.5 61.2 61.6 61.5 62.0Consumption Mt 54.4 54.6 55.5 56.0 56.2 56.4 56.5 56.8 57.0 57.1 57.1
Crush Mt 49.3 49.6 50.4 50.8 50.9 51.1 51.2 51.4 51.6 51.7 51.6Closing stocks Mt 5.4 5.6 5.7 5.5 5.3 5.1 5.0 5.0 5.0 4.8 5.0
PROTEIN MEALSWorld
Production Mt 314.5 331.2 335.8 340.3 346.1 352.2 358.6 364.6 371.2 377.5 384.3Consumption Mt 308.8 330.1 335.0 340.5 346.4 352.5 358.7 364.8 371.3 377.5 384.2Closing stocks Mt 16.0 16.4 17.1 16.9 16.6 16.3 16.2 16.0 15.8 15.8 15.9
Price4 USD/t 340.2 296.4 294.9 297.9 302.6 313.1 313.0 318.7 321.0 327.2 335.3
Developed countriesProduction Mt 101.2 104.3 105.2 105.7 106.9 108.1 109.4 110.4 111.7 112.8 114.0Consumption Mt 116.8 122.0 123.0 123.7 124.8 125.7 126.8 127.8 128.9 129.9 130.8Closing stocks Mt 1.8 1.7 1.7 1.7 1.7 1.7 1.7 1.7 1.7 1.7 1.7
Developing countriesProduction Mt 213.3 226.8 230.5 234.6 239.3 244.1 249.2 254.2 259.5 264.8 270.2Consumption Mt 192.0 208.1 212.0 216.8 221.6 226.8 231.9 237.1 242.4 247.7 253.4Closing stocks Mt 14.2 14.7 15.4 15.2 14.9 14.6 14.5 14.3 14.1 14.1 14.2
OECD2
Production Mt 94.0 95.9 96.6 96.7 97.7 98.6 99.6 100.3 101.4 102.2 103.2Consumption Mt 122.2 128.1 129.2 129.9 131.2 132.1 133.2 134.1 135.3 136.3 137.3Closing stocks Mt 1.7 1.6 1.6 1.6 1.6 1.6 1.6 1.6 1.6 1.6 1.6

ANNEX: COMMODITY SNAPSHOT TABLES
OECD-FAO AGRICULTURAL OUTLOOK 2017-2026 © OECD/FAO 2017 129
Table 3.A1.2. World oilseed projections (cont.)
Note: Average 2014-16est: Data for 2016 are estimated.1. Soybean, U.S., CIF Rotterdam.2. Excludes Iceland but includes all EU28 member countries.3. Rapeseed, Europe, CIF Hamburg.4. Weighted average protein meal, European port.5. Weighted average price of oilseed oils and palm oil, European port.Source: OECD/FAO (2017), “OECD-FAO Agricultural Outlook”, OECD Agriculture statistics (database). doi: dx.doi.org/10.1787/agr-outl-data-en
Marketing year
Average2014-16est 2017 2018 2019 2020 2021 2022 2023 2024 2025 2026
VEGETABLE OILSWorld
Production Mt 179.0 189.9 193.2 196.4 199.6 202.8 206.0 209.3 212.9 216.4 219.8of which palm oil Mt 61.8 66.9 68.4 69.9 71.2 72.5 73.7 75.1 76.5 77.9 79.3
Consumption Mt 180.0 189.5 192.6 196.1 199.5 202.6 205.8 209.1 212.7 216.0 219.5Food Mt 141.4 147.8 150.1 153.0 156.2 159.3 162.4 165.5 168.8 171.9 175.2Biofuel Mt 23.9 26.2 26.8 27.1 27.0 26.7 26.6 26.5 26.5 26.4 26.4
Exports Mt 75.3 79.1 80.2 81.6 82.7 84.1 85.5 87.0 88.6 90.0 91.5Closing stocks Mt 22.7 21.7 22.2 22.5 22.5 22.7 22.8 23.1 23.3 23.7 24.0
Price5 USD/t 768.3 827.7 829.2 838.2 849.9 862.2 871.8 884.2 896.6 897.4 902.0
Developed countriesProduction Mt 46.0 47.7 48.2 48.5 49.0 49.5 50.0 50.4 51.0 51.4 51.9Consumption Mt 51.2 52.0 51.9 52.1 52.2 52.5 52.6 52.7 52.8 52.7 52.6Closing stocks Mt 4.4 4.2 4.2 4.1 4.0 4.0 4.0 3.9 3.9 3.9 3.9
Developing countriesProduction Mt 132.9 142.2 145.0 147.8 150.6 153.3 156.0 158.9 162.0 164.9 167.9Consumption Mt 128.7 137.5 140.7 144.0 147.3 150.2 153.3 156.4 159.8 163.3 166.9Closing stocks Mt 18.3 17.5 18.0 18.4 18.6 18.7 18.9 19.1 19.4 19.7 20.0
OECD2
Production Mt 37.9 38.3 38.7 38.8 39.0 39.3 39.6 39.8 40.1 40.4 40.6Consumption Mt 50.8 51.7 51.8 52.0 52.2 52.5 52.7 52.9 53.1 53.1 53.1Closing stocks Mt 3.8 3.5 3.5 3.4 3.3 3.3 3.3 3.3 3.2 3.2 3.2

ANNEX: COMMODITY SNAPSHOT TABLES
OECD-FAO AGRICULTURAL OUTLOOK 2017-2026 © OECD/FAO 2017130
Table 3.A1.3. World sugar projections
Note: Marketing year: See Glossary of Terms for definitions.Average 2014-16est: Data for 2016 are estimated.tq : tel quel.HFCS: High fructose corn syrup.
1. Raw sugar world price, ICE contract No11 nearby, October/September.2. Refined sugar price, White Sugar Futures Contract No. 407, Euronext market, Liffe, London, Europe, October/September.3. United States wholesale list price HFCS-55, October/September.4. Excludes Iceland but includes all EU28 member countries.Source: OECD/FAO (2017), “OECD-FAO Agricultural Outlook”, OECD Agriculture statistics (database). doi: dx.doi.org/10.1787/agr-outl-data-en
Marketing year
Average2014-16est 2017 2018 2019 2020 2021 2022 2023 2024 2025 2026
WORLDSUGARBEET
Production Mt 261.9 276.3 276.2 270.8 269.5 268.8 268.9 268.7 269.1 270.4 271.4Area Mha 4.5 4.6 4.6 4.5 4.4 4.4 4.4 4.3 4.3 4.3 4.3Yield t/ha 58.72 59.99 60.12 60.84 61.11 61.41 61.69 61.95 62.24 62.59 62.91
Biofuel use Mt 13.2 11.4 10.3 10.0 9.9 10.0 9.4 9.4 9.4 9.4 9.3SUGARCANE
Production Mt 1 844.0 1 918.8 1 947.2 1 977.9 1 998.0 2 018.0 2 044.3 2 078.0 2 116.6 2 157.6 2 197.9Area Mha 27.0 27.7 27.9 28.2 28.4 28.5 28.7 29.0 29.4 29.8 30.3Yield t/ha 68.39 69.34 69.69 70.11 70.45 70.78 71.17 71.54 71.91 72.28 72.65
Biofuel use Mt 343.5 362.6 371.3 381.4 391.9 399.0 407.4 412.7 418.9 426.0 432.9SUGAR
Production Mt tq 168.6 179.2 184.1 187.2 190.0 192.4 195.3 198.8 202.2 205.9 209.5Consumption Mt tq 168.3 174.3 176.7 179.8 183.0 186.5 189.7 192.9 196.3 199.7 203.3Closing stocks Mt tq 72.8 67.1 69.8 72.5 74.8 76.1 77.0 78.1 79.3 80.7 82.3
Price, raw sugar1 USD/t 361.6 403.2 383.9 369.2 350.8 354.5 359.2 357.4 365.7 367.3 367.1
Price, white sugar2 USD/t 429.9 487.7 471.4 453.4 437.6 439.3 442.9 443.6 452.2 454.1 452.6
Price, HFCS3 USD/t 651.5 609.5 538.3 524.3 511.3 516.5 523.8 523.0 535.1 542.9 543.6
DEVELOPED COUNTRIESSUGARBEET
Production Mt 217.4 218.8 217.3 211.2 209.4 208.2 207.9 207.1 206.5 207.0 206.9SUGARCANE
Production Mt 81.1 83.4 85.0 86.6 87.3 87.1 87.2 87.3 87.6 88.2 88.4SUGAR
Production Mt tq 40.3 43.9 44.3 43.6 43.5 43.4 43.6 43.7 43.8 44.1 44.3Consumption Mt tq 47.6 47.8 47.8 47.7 47.8 48.0 48.2 48.4 48.6 48.8 49.1Closing stocks Mt tq 14.8 14.6 15.5 16.0 16.5 16.8 16.9 17.0 17.0 17.1 17.2
HFCSProduction Mt 9.4 9.7 9.8 10.0 10.3 10.4 10.5 10.5 10.6 10.6 10.7Consumption Mt 8.3 8.6 8.6 8.8 9.0 9.2 9.2 9.2 9.2 9.3 9.3
DEVELOPING COUNTRIESSUGARBEET
Production Mt 44.5 57.5 59.0 59.6 60.1 60.6 61.0 61.7 62.5 63.4 64.5SUGARCANE
Production Mt 1 763.0 1 835.4 1 862.2 1 891.3 1 910.7 1 930.8 1 957.1 1 990.6 2 029.0 2 069.4 2 109.6SUGAR
Production Mt tq 128.3 135.3 139.9 143.6 146.5 149.0 151.7 155.1 158.3 161.8 165.2Consumption Mt tq 120.6 126.6 128.9 132.1 135.1 138.4 141.5 144.5 147.7 150.9 154.2Closing stocks Mt tq 58.0 52.5 54.3 56.5 58.3 59.3 60.1 61.1 62.2 63.6 65.1
HFCSProduction Mt 3.5 3.7 3.7 3.8 3.8 3.9 3.9 4.0 4.0 4.1 4.2Consumption Mt 4.5 4.7 4.8 4.8 4.9 5.0 5.0 5.1 5.2 5.3 5.3
OECD4
SUGARBEETProduction Mt 170.1 183.6 182.7 176.8 175.1 173.9 173.3 172.0 171.2 171.6 171.5
SUGARCANEProduction Mt 120.3 123.1 125.1 127.2 128.3 128.3 129.3 130.3 131.3 132.4 133.3
SUGARProduction Mt tq 39.5 43.4 43.9 43.2 43.2 43.1 43.2 43.3 43.5 43.7 43.9Consumption Mt tq 44.9 45.3 45.3 45.1 45.3 45.4 45.5 45.8 46.0 46.3 46.5Closing stocks Mt tq 13.1 12.7 13.5 13.8 14.2 14.3 14.4 14.5 14.7 14.8 14.9
HFCSProduction Mt 10.6 10.9 11.0 11.3 11.5 11.7 11.7 11.8 11.8 11.9 11.9Consumption Mt 10.3 10.6 10.7 11.0 11.2 11.4 11.4 11.5 11.5 11.6 11.6

ANNEX: COMMODITY SNAPSHOT TABLES
OECD-FAO AGRICULTURAL OUTLOOK 2017-2026 © OECD/FAO 2017 131
Table 3.A1.4. World meat projections
Note: Calendar Year: Year ending 30 September for New Zealand.Average 2014-16est: Data for 2016 are estimated.
1. Per capita consumption expressed in retail weight. Carcass weight to retail weight conversion factors of 0.7 for beef and veal, 0.78 forpigmeat and 0.88 for both sheep meat and poultry meat.
2. Excludes Iceland but includes all EU28 member countries.Source: OECD/FAO (2017), “OECD-FAO Agricultural Outlook”, OECD Agriculture statistics (database). doi: dx.doi.org/10.1787/agr-outl-data-en
Calendar year
Average2014-16est 2017 2018 2019 2020 2021 2022 2023 2024 2025 2026
WORLDBEEF AND VEAL
Production kt cwe 68 471 69 942 70 652 71 187 71 854 72 621 73 400 74 146 74 766 75 496 76 341Consumption kt cwe 67 538 69 723 70 371 70 898 71 557 72 312 73 090 73 843 74 464 75 196 76 041
PIGMEATProduction kt cwe 116 907 117 975 118 639 120 090 121 441 122 515 123 299 124 531 125 683 126 685 127 526Consumption kt cwe 116 912 117 931 118 653 120 092 121 437 122 513 123 298 124 525 125 677 126 679 127 521
POULTRY MEATProduction kt rtc 113 875 118 080 119 205 120 885 122 461 124 036 125 608 127 196 128 737 130 256 131 609Consumption kt rtc 113 228 118 081 119 208 120 887 122 463 124 036 125 605 127 192 128 734 130 254 131 607
SHEEP MEATProduction kt cwe 14 318 14 711 15 045 15 343 15 760 16 103 16 405 16 719 16 978 17 237 17 515Consumption kt cwe 14 288 14 712 15 052 15 354 15 770 16 114 16 410 16 715 16 976 17 238 17 515
TOTAL MEAT
Per capita consumption1 kg rwt 34.1 34.3 34.2 34.3 34.4 34.4 34.4 34.5 34.5 34.6 34.6
DEVELOPED COUNTRIESBEEF AND VEAL
Production kt cwe 29 428 30 024 30 240 30 223 30 259 30 337 30 458 30 636 30 739 30 880 31 045Consumption kt cwe 28 347 29 025 29 137 29 181 29 276 29 331 29 458 29 650 29 781 29 930 30 096
PIGMEATProduction kt cwe 43 006 44 562 44 036 44 182 44 538 44 760 44 746 45 036 45 347 45 540 45 596Consumption kt cwe 39 989 41 151 40 854 41 058 41 455 41 634 41 553 41 776 42 041 42 170 42 140
POULTRY MEATProduction kt rtc 47 328 49 261 49 364 49 939 50 466 50 932 51 361 51 810 52 173 52 520 52 756Consumption kt rtc 44 873 46 983 47 004 47 438 47 828 48 127 48 440 48 735 48 997 49 215 49 343
SHEEP MEATProduction kt cwe 3 393 3 348 3 385 3 429 3 462 3 496 3 534 3 572 3 600 3 628 3 662Consumption kt cwe 2 699 2 732 2 771 2 795 2 816 2 840 2 857 2 875 2 893 2 912 2 934
TOTAL MEAT
Per capita consumption1 kg rwt 66.4 68.3 68.0 68.2 68.5 68.7 68.7 68.9 69.2 69.3 69.3
DEVELOPING COUNTRIESBEEF AND VEAL
Production kt cwe 39 043 39 917 40 411 40 964 41 595 42 284 42 943 43 510 44 027 44 616 45 297Consumption kt cwe 39 191 40 698 41 234 41 718 42 281 42 981 43 632 44 192 44 683 45 266 45 945
PIGMEATProduction kt cwe 73 901 73 412 74 603 75 908 76 903 77 755 78 554 79 496 80 336 81 145 81 930Consumption kt cwe 76 923 76 780 77 799 79 034 79 982 80 879 81 745 82 750 83 635 84 509 85 381
POULTRY MEATProduction kt rtc 66 546 68 819 69 842 70 945 71 995 73 104 74 247 75 386 76 564 77 737 78 852Consumption kt rtc 68 355 71 098 72 205 73 449 74 635 75 909 77 166 78 457 79 737 81 039 82 265
SHEEP MEATProduction kt cwe 10 926 11 362 11 660 11 915 12 298 12 607 12 871 13 147 13 378 13 610 13 853Consumption kt cwe 11 590 11 979 12 281 12 559 12 954 13 275 13 553 13 841 14 083 14 326 14 581
TOTAL MEAT
Per capita consumption1 kg rwt 26.5 26.5 26.5 26.6 26.7 26.8 26.9 27.0 27.0 27.1 27.2
OECD2
BEEF AND VEALProduction kt cwe 27 605 28 317 28 570 28 597 28 636 28 704 28 811 28 968 29 052 29 192 29 350Consumption kt cwe 26 448 27 261 27 425 27 518 27 598 27 623 27 717 27 876 27 970 28 091 28 240
PIGMEATProduction kt cwe 41 120 42 546 41 987 42 091 42 459 42 719 42 717 43 004 43 327 43 548 43 620Consumption kt cwe 38 548 39 663 39 384 39 573 39 993 40 205 40 149 40 387 40 663 40 818 40 802
POULTRY MEATProduction kt rtc 45 585 47 402 47 497 48 078 48 612 49 096 49 537 49 994 50 391 50 764 51 018Consumption kt rtc 42 865 45 034 45 079 45 521 45 939 46 280 46 612 46 935 47 249 47 514 47 695
SHEEP MEATProduction kt cwe 2 736 2 693 2 729 2 767 2 797 2 825 2 856 2 889 2 911 2 934 2 964Consumption kt cwe 2 062 2 096 2 133 2 151 2 168 2 186 2 198 2 210 2 223 2 238 2 256
TOTAL MEAT
Per capita consumption1 kg rwt 67.1 69.0 68.6 68.8 69.1 69.1 69.1 69.3 69.4 69.5 69.5

ANNEX: COMMODITY SNAPSHOT TABLES
OECD-FAO AGRICULTURAL OUTLOOK 2017-2026 © OECD/FAO 2017132
Table 3.A1.5. World dairy projections: Butter and cheese
Note: Calendar year: Year ending 30 June for Australia and 31 May for New Zealand in OECD aggregate.Average 2014-16est: Data for 2016 are estimated.
1. FOB export price, butter, 82% butterfat, Oceania.2. Excludes Iceland but includes all EU28 member countries.3. FOB export price, cheddar cheese, 39% moisture, Oceania.Source: OECD/FAO (2017), “OECD-FAO Agricultural Outlook”, OECD Agriculture statistics (database). doi: dx.doi.org/10.1787/agr-outl-data-en
Calendar year
Average2014-16est 2017 2018 2019 2020 2021 2022 2023 2024 2025 2026
BUTTERWorld
Production kt pw 10 905 11 379 11 644 11 902 12 161 12 412 12 662 12 888 13 108 13 348 13 593Consumption kt pw 10 831 11 379 11 609 11 869 12 131 12 380 12 631 12 857 13 077 13 317 13 561Stock changes kt pw 13 -3 3 1 -3 0 -1 -2 -1 -2 -1
Price1 USD/t 3 396 3 925 3 736 3 788 3 852 3 935 3 982 4 063 4 130 4 214 4 248
Developed countriesProduction kt pw 4 725 4 877 4 966 5 068 5 155 5 221 5 296 5 350 5 403 5 464 5 526Consumption kt pw 4 131 4 316 4 356 4 434 4 501 4 547 4 597 4 631 4 659 4 702 4 745
Developing countriesProduction kt pw 6 180 6 503 6 678 6 835 7 006 7 191 7 367 7 538 7 705 7 884 8 067Consumption kt pw 6 700 7 064 7 252 7 435 7 630 7 833 8 033 8 227 8 419 8 615 8 815
OECD2
Production kt pw 4 528 4 691 4 780 4 881 4 968 5 034 5 107 5 159 5 210 5 270 5 330Consumption kt pw 3 930 4 156 4 193 4 268 4 332 4 378 4 425 4 456 4 480 4 522 4 564Stock changes kt pw 13 -3 3 1 -3 0 -1 -2 -1 -2 -1
CHEESEWorld
Production kt pw 22 471 23 139 23 526 23 888 24 240 24 520 24 856 25 197 25 520 25 849 26 193Consumption kt pw 22 273 23 064 23 401 23 760 24 101 24 381 24 714 25 054 25 376 25 711 26 049Stock changes kt pw 37 -51 0 2 14 14 17 17 18 13 19
Price3 USD/t 3 633 3 644 3 604 3 700 3 775 3 863 3 946 4 038 4 121 4 210 4 276
Developed countriesProduction kt pw 17 843 18 410 18 673 18 930 19 184 19 365 19 602 19 854 20 090 20 338 20 600Consumption kt pw 16 964 17 609 17 805 18 051 18 283 18 451 18 672 18 900 19 109 19 330 19 555
Developing countriesProduction kt pw 4 628 4 729 4 853 4 958 5 057 5 156 5 254 5 343 5 430 5 512 5 594Consumption kt pw 5 309 5 455 5 596 5 709 5 818 5 929 6 041 6 155 6 267 6 380 6 494
OECD2
Production kt pw 17 334 17 896 18 174 18 435 18 691 18 873 19 108 19 354 19 586 19 831 20 092Consumption kt pw 16 593 17 280 17 471 17 714 17 942 18 107 18 324 18 547 18 753 18 970 19 192Stock changes kt pw 37 -51 0 2 14 14 17 17 18 13 19
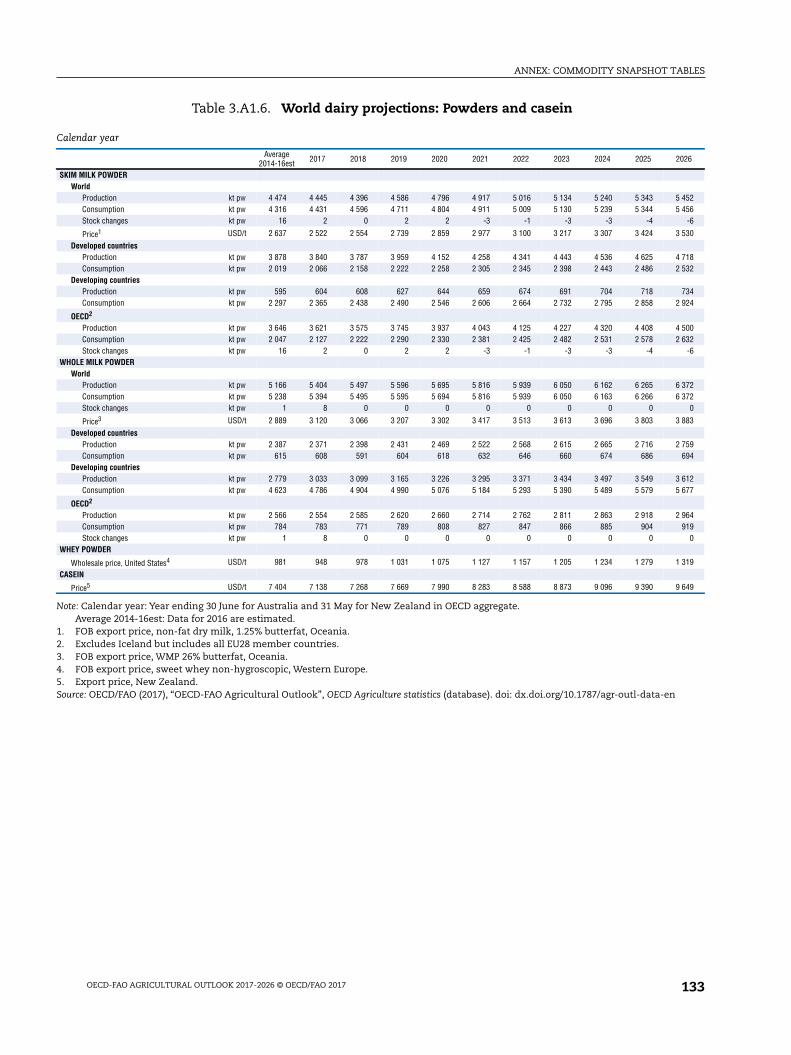
ANNEX: COMMODITY SNAPSHOT TABLES
OECD-FAO AGRICULTURAL OUTLOOK 2017-2026 © OECD/FAO 2017 133
Table 3.A1.6. World dairy projections: Powders and casein
Note: Calendar year: Year ending 30 June for Australia and 31 May for New Zealand in OECD aggregate.Average 2014-16est: Data for 2016 are estimated.
1. FOB export price, non-fat dry milk, 1.25% butterfat, Oceania.2. Excludes Iceland but includes all EU28 member countries.3. FOB export price, WMP 26% butterfat, Oceania.4. FOB export price, sweet whey non-hygroscopic, Western Europe.5. Export price, New Zealand.Source: OECD/FAO (2017), “OECD-FAO Agricultural Outlook”, OECD Agriculture statistics (database). doi: dx.doi.org/10.1787/agr-outl-data-en
Calendar year
Average2014-16est 2017 2018 2019 2020 2021 2022 2023 2024 2025 2026
SKIM MILK POWDERWorld
Production kt pw 4 474 4 445 4 396 4 586 4 796 4 917 5 016 5 134 5 240 5 343 5 452Consumption kt pw 4 316 4 431 4 596 4 711 4 804 4 911 5 009 5 130 5 239 5 344 5 456Stock changes kt pw 16 2 0 2 2 -3 -1 -3 -3 -4 -6
Price1 USD/t 2 637 2 522 2 554 2 739 2 859 2 977 3 100 3 217 3 307 3 424 3 530
Developed countriesProduction kt pw 3 878 3 840 3 787 3 959 4 152 4 258 4 341 4 443 4 536 4 625 4 718Consumption kt pw 2 019 2 066 2 158 2 222 2 258 2 305 2 345 2 398 2 443 2 486 2 532
Developing countriesProduction kt pw 595 604 608 627 644 659 674 691 704 718 734Consumption kt pw 2 297 2 365 2 438 2 490 2 546 2 606 2 664 2 732 2 795 2 858 2 924
OECD2
Production kt pw 3 646 3 621 3 575 3 745 3 937 4 043 4 125 4 227 4 320 4 408 4 500Consumption kt pw 2 047 2 127 2 222 2 290 2 330 2 381 2 425 2 482 2 531 2 578 2 632Stock changes kt pw 16 2 0 2 2 -3 -1 -3 -3 -4 -6
WHOLE MILK POWDERWorld
Production kt pw 5 166 5 404 5 497 5 596 5 695 5 816 5 939 6 050 6 162 6 265 6 372Consumption kt pw 5 238 5 394 5 495 5 595 5 694 5 816 5 939 6 050 6 163 6 266 6 372Stock changes kt pw 1 8 0 0 0 0 0 0 0 0 0
Price3 USD/t 2 889 3 120 3 066 3 207 3 302 3 417 3 513 3 613 3 696 3 803 3 883
Developed countriesProduction kt pw 2 387 2 371 2 398 2 431 2 469 2 522 2 568 2 615 2 665 2 716 2 759Consumption kt pw 615 608 591 604 618 632 646 660 674 686 694
Developing countriesProduction kt pw 2 779 3 033 3 099 3 165 3 226 3 295 3 371 3 434 3 497 3 549 3 612Consumption kt pw 4 623 4 786 4 904 4 990 5 076 5 184 5 293 5 390 5 489 5 579 5 677
OECD2
Production kt pw 2 566 2 554 2 585 2 620 2 660 2 714 2 762 2 811 2 863 2 918 2 964Consumption kt pw 784 783 771 789 808 827 847 866 885 904 919Stock changes kt pw 1 8 0 0 0 0 0 0 0 0 0
WHEY POWDER
Wholesale price, United States4 USD/t 981 948 978 1 031 1 075 1 127 1 157 1 205 1 234 1 279 1 319
CASEIN
Price5 USD/t 7 404 7 138 7 268 7 669 7 990 8 283 8 588 8 873 9 096 9 390 9 649

ANNEX: COMMODITY SNAPSHOT TABLES
OECD-FAO AGRICULTURAL OUTLOOK 2017-2026 © OECD/FAO 2017134
Table 3.A1.7. World fish and seafood projections
Calendar year
Average2014-16est 2017 2018 2019 2020 2021 2022 2023 2024 2025 2026
FISH1
WorldProduction kt 168 293 175 969 178 702 182 271 184 953 185 154 187 894 189 614 191 752 193 936 193 875
of which aquaculture kt 76 369 82 291 85 171 88 805 91 535 93 864 94 695 96 220 98 332 100 426 102 128Consumption kt 168 212 176 761 179 393 182 863 185 444 185 546 188 186 189 805 191 843 193 927 193 866
of which for food kt 148 756 155 821 159 020 162 928 165 910 167 681 169 522 171 436 173 757 176 112 177 367of which for reduction kt 14 187 15 929 15 664 15 517 15 399 13 998 15 050 14 991 14 892 14 817 13 698
Price
Aquaculture2 USD/t 2 095.5 2 109.0 2 119.1 2 119.5 2 100.0 2 139.4 2 172.2 2 204.4 2 230.2 2 286.2 2 312.7
Capture3 USD/t 1 568.3 1 564.7 1 580.6 1 577.3 1 577.8 1 610.6 1 631.0 1 655.1 1 677.2 1 699.3 1 724.8
Product traded4 USD/t 2 837.2 2 850.0 2 867.5 2 826.0 2 800.0 2 852.5 2 896.3 2 939.2 2 973.6 3 008.2 3 043.0
Developed countriesProduction kt 29 154 29 378 29 464 29 614 29 684 29 704 29 682 29 624 29 597 29 616 29 684
of which aquaculture kt 4 546 4 748 4 876 5 059 5 228 5 314 5 318 5 317 5 345 5 391 5 471Consumption kt 37 148 37 372 37 369 37 286 37 341 37 197 37 497 37 260 37 759 37 721 38 231
of which for food kt 31 718 32 200 32 306 32 307 32 442 32 326 32 752 32 577 33 132 33 149 33 651of which for reduction kt 4 494 4 330 4 263 4 218 4 178 4 188 4 099 4 066 4 031 3 999 4 032
Developing countriesProduction kt 139 139 146 592 149 238 152 657 155 268 155 450 158 213 159 990 162 156 164 320 164 190
of which aquaculture kt 71 823 77 544 80 295 83 746 86 307 88 550 89 377 90 903 92 986 95 035 96 657Consumption kt 131 064 139 389 142 024 145 577 148 103 148 349 150 689 152 545 154 084 156 206 155 634
of which for food kt 117 038 123 621 126 714 130 621 133 469 135 355 136 770 138 859 140 625 142 963 143 716of which for reduction kt 9 692 11 598 11 401 11 299 11 221 9 811 10 950 10 925 10 861 10 818 9 667
OECDProduction kt 31 211 31 536 31 696 31 853 31 968 31 699 31 832 31 939 31 981 32 068 31 694
of which aquaculture kt 6 299 6 454 6 611 6 837 7 049 7 174 7 188 7 200 7 256 7 325 7 432Consumption kt 39 372 39 993 40 099 40 029 40 125 39 822 40 267 40 145 40 717 40 728 41 024
of which for food kt 32 736 33 330 33 584 33 640 33 833 33 740 34 214 34 110 34 715 34 756 35 307of which for reduction kt 5 542 5 656 5 561 5 485 5 438 5 275 5 286 5 300 5 288 5 281 5 053
FISHMEAL5
WorldProduction kt 4 385.2 4 942.2 4 921.4 4 932.4 4 944.6 4 635.5 4 933.1 4 948.1 4 957.0 4 973.2 4 721.4
from whole fish kt 3 205.6 3 752.9 3 709.9 3 694.9 3 686.0 3 362.0 3 634.4 3 630.7 3 617.8 3 610.0 3 343.3Consumption kt 4 457.5 4 856.0 4 929.2 4 944.0 4 957.2 4 811.1 4 771.5 4 958.4 4 967.3 4 985.2 4 877.5Variation in stocks kt -72.4 85.8 -8.2 -12.1 -13.0 -176.0 161.2 -10.7 -10.7 -12.4 -156.5
Price6 USD/t 1 592.3 1 280.9 1 200.3 1 252.9 1 291.0 1 558.6 1 372.1 1 412.0 1 442.0 1 487.8 1 834.9
Developed countriesProduction kt 1 414.8 1 423.2 1 427.5 1 439.8 1 448.8 1 469.3 1 460.7 1 463.7 1 467.3 1 472.8 1 493.4
from whole fish kt 1 025.1 1 024.3 1 018.6 1 018.4 1 019.0 1 032.0 1 013.6 1 008.7 1 003.3 998.6 1 010.1Consumption kt 1 618.9 1 677.8 1 675.6 1 619.2 1 581.4 1 444.4 1 437.4 1 463.5 1 429.7 1 402.6 1 299.1Variation in stocks kt 3.6 28.8 2.8 -1.1 -2.0 -47.0 44.2 0.3 0.3 -1.4 -47.5
Developing countriesProduction kt 2 970.4 3 518.9 3 493.9 3 492.6 3 495.9 3 166.2 3 472.3 3 484.4 3 489.7 3 500.4 3 228.0
from whole fish kt 2 180.5 2 728.6 2 691.4 2 676.5 2 667.0 2 330.0 2 620.7 2 622.1 2 614.5 2 611.4 2 333.2Consumption kt 2 838.7 3 178.3 3 253.6 3 324.8 3 375.8 3 366.7 3 334.1 3 495.0 3 537.5 3 582.6 3 578.4Variation in stocks kt -76.0 57.0 -11.0 -11.0 -11.0 -129.0 117.0 -11.0 -11.0 -11.0 -109.0
OECDProduction kt 1 604.4 1 687.2 1 685.6 1 691.5 1 699.4 1 681.2 1 695.6 1 709.7 1 718.8 1 730.6 1 692.0
from whole fish kt 1 210.6 1 282.0 1 270.4 1 263.6 1 263.0 1 237.1 1 241.5 1 247.4 1 247.5 1 248.9 1 201.0Consumption kt 1 810.5 1 864.0 1 862.9 1 815.1 1 780.2 1 635.0 1 633.7 1 669.6 1 638.7 1 615.6 1 501.5Variation in stocks kt -9.0 62.8 1.8 -2.1 -3.0 -68.0 63.2 -0.7 -0.7 -2.4 -53.5

ANNEX: COMMODITY SNAPSHOT TABLES
OECD-FAO AGRICULTURAL OUTLOOK 2017-2026 © OECD/FAO 2017 135
Table 3.A1.7. World fish and seafood projections (cont.)
Note: The term “fish” indicates fish, crustaceans, molluscs and other aquatic animals, but excludes aquatic mammals, crocodiles, caimans,alligators and aquatic plants.Average 2014-16est: Data for 2016 are estimated.
1. Data are in live weight equivalent.2. World unit value of aquaculture fisheries production (live weight basis).3. FAO estimated value of world ex vessel value of capture fisheries production excluding for reduction.4. World unit value of trade (sum of exports and imports).5. Data are in product weight.6. Fishmeal, 64-65% protein, Hamburg, Germany.7. Fish oil, any origin, N.W. Europe.Source: OECD/FAO (2017), “OECD-FAO Agricultural Outlook”, OECD Agriculture statistics (database). doi: dx.doi.org/10.1787/agr-outl-data-en
Calendar year
Average2014-16est 2017 2018 2019 2020 2021 2022 2023 2024 2025 2026
FISH OIL5
WorldProduction kt 881.2 968.1 962.2 962.3 962.8 909.0 959.2 962.3 964.0 966.9 925.6
from whole fish kt 566.8 645.0 634.0 628.5 623.8 565.0 609.9 607.7 603.9 601.1 554.0Consumption kt 905.1 894.4 963.9 964.0 964.4 961.6 912.7 961.8 963.5 966.4 976.1Variation in stocks kt -23.9 73.7 -1.7 -1.6 -1.6 -52.6 46.4 0.5 0.5 0.5 -50.5
Price7 USD/t 1 808.3 1 607.9 1 622.9 1 641.3 1 667.2 1 907.2 1 720.2 1 747.0 1 774.4 1 794.8 2 055.8
Developed countriesProduction kt 394.2 354.3 354.2 356.0 357.1 360.0 359.3 360.6 362.0 363.7 367.8
from whole fish kt 206.1 171.9 169.4 168.3 167.1 167.9 164.8 163.9 163.0 162.1 163.8Consumption kt 534.6 502.0 529.8 526.6 524.8 540.1 482.2 515.2 511.8 510.2 536.9Variation in stocks kt -4.7 28.7 0.3 0.4 0.4 -25.6 21.4 0.5 0.5 0.5 -25.5
Developing countriesProduction kt 487.0 613.9 608.0 606.3 605.7 549.0 599.9 601.7 602.0 603.2 557.8
from whole fish kt 360.7 473.1 464.6 460.2 456.7 397.1 445.0 443.8 440.9 438.9 390.2Consumption kt 370.5 392.4 434.1 437.4 439.6 421.5 430.5 446.7 451.7 456.3 439.2Variation in stocks kt -19.2 45.0 -2.0 -2.0 -2.0 -27.0 25.0 0.0 0.0 0.0 -25.0
OECDProduction kt 513.6 469.2 468.4 469.1 470.5 466.8 470.6 474.4 477.3 480.7 474.7
from whole fish kt 274.4 238.0 234.0 230.8 228.8 221.9 222.4 222.9 222.4 222.1 212.6Consumption kt 682.9 640.8 673.2 670.5 669.2 671.7 621.1 660.9 658.4 657.2 669.7Variation in stocks kt -8.0 43.7 0.3 0.4 0.4 -35.6 31.4 0.5 0.5 0.5 -35.5

ANNEX: COMMODITY SNAPSHOT TABLES
OECD-FAO AGRICULTURAL OUTLOOK 2017-2026 © OECD/FAO 2017136
Table 3.A1.8. World biofuel projections
Note: Average 2014-16est: Data for 2016 are estimated.1. Advanced biofuels corresponding to biofuels produced out of agricultural residues, forest residues and dedicated energy crops.2. Wholesale price, United states, Omaha.3. Excludes Iceland but includes all EU28 member countries.4. Producer price Germany net of biodiesel tariff and energy tax.Source: OECD/FAO (2017), “OECD-FAO Agricultural Outlook”, OECD Agriculture statistics (database). doi: dx.doi.org/10.1787/agr-outl-data-en
Average2014-16est 2017 2018 2019 2020 2021 2022 2023 2024 2025 2026
ETHANOLWorld
Production mln L 117.4 123.7 126.8 128.4 130.7 131.5 132.8 133.7 134.7 135.8 136.7of which maize based mln L 68.2 71.9 73.7 73.9 74.7 74.5 74.5 74.3 74.2 74.0 73.7of which sugar cane based mln L 27.9 29.5 30.2 31.1 31.9 32.5 33.3 33.7 34.3 34.9 35.5
of which advanced1 mln L 0.8 0.8 0.9 0.9 0.9 1.0 1.0 1.1 1.1 1.2 1.2
Consumption mln L 117.2 124.6 127.0 128.8 130.8 131.8 133.0 134.0 134.9 136.0 136.9of which fuel use mln L 96.2 103.1 105.4 107.0 108.9 109.6 110.7 111.4 112.1 113.0 113.6
Exports mln L 8.2 8.9 9.0 8.9 8.9 8.8 8.7 8.5 8.2 8.1 7.9
Price2 USD/hl 51.0 44.5 46.0 47.3 48.4 49.7 50.9 51.9 53.2 54.5 55.3
Developed countriesProduction mln L 68.1 71.7 73.2 73.2 74.0 73.6 73.6 73.3 73.2 73.0 72.7Consumption mln L 67.7 72.7 74.0 74.4 74.9 74.7 74.8 74.5 74.3 74.1 73.8
of which fuel use mln L 62.0 66.7 67.9 68.3 68.8 68.7 68.7 68.4 68.1 68.0 67.6Net trade mln L 0.2 -0.5 -0.8 -0.9 -0.9 -1.0 -1.1 -1.0 -1.0 -1.0 -1.0
Developing countriesProduction mln L 49.4 51.9 53.6 55.2 56.7 57.9 59.3 60.4 61.5 62.8 64.0Consumption mln L 49.5 51.9 53.1 54.4 56.0 57.1 58.3 59.5 60.7 61.9 63.1
of which fuel use mln L 34.2 36.4 37.5 38.7 40.0 41.0 42.0 43.0 44.0 45.0 46.0Net trade mln L -0.2 0.5 0.8 0.8 0.9 0.9 1.1 1.0 1.0 1.0 0.9
OECD3
Production mln L 67.2 70.8 72.3 72.3 73.0 72.6 72.6 72.4 72.2 72.0 71.7Consumption mln L 67.9 72.8 74.1 74.5 75.0 74.8 74.9 74.6 74.4 74.2 73.9
of which fuel use mln L 62.0 66.7 68.0 68.4 68.8 68.7 68.7 68.4 68.1 68.0 67.6Net trade mln L -0.8 -1.5 -1.8 -1.9 -1.9 -2.0 -2.1 -2.1 -2.0 -2.0 -2.0
BIODIESELWorld
Production mln L 33.8 37.3 38.6 39.6 40.3 40.2 40.1 40.2 40.4 40.4 40.5of which vegetable oil based mln L 24.3 27.6 28.4 29.0 29.2 29.0 28.8 28.8 28.8 28.8 28.8of which waste based mln L 8.2 9.0 9.4 9.8 10.2 10.2 10.3 10.4 10.4 10.5 10.5
of which advanced1 mln L 0.3 0.4 0.4 0.4 0.4 0.5 0.5 0.5 0.5 0.6 0.6
Consumption mln L 33.8 37.5 38.8 39.7 40.4 40.3 40.2 40.4 40.5 40.6 40.6Exports mln L 3.5 3.8 4.3 4.2 3.8 3.6 3.3 3.2 3.1 3.1 3.1
Price4 USD/hl 86.9 86.1 88.0 89.4 90.4 90.9 91.3 92.1 92.7 93.2 93.6
Developed countriesProduction mln L 20.4 21.7 22.2 22.4 22.3 22.1 21.9 21.8 21.7 21.2 20.9Consumption mln L 22.4 24.3 25.3 25.4 24.8 24.4 24.0 23.7 23.5 23.0 22.6Net trade mln L -2.2 -2.6 -3.0 -2.9 -2.5 -2.3 -2.0 -1.9 -1.8 -1.8 -1.8
Developing countriesProduction mln L 13.4 15.6 16.4 17.2 18.0 18.1 18.2 18.4 18.7 19.2 19.6Consumption mln L 11.3 13.2 13.5 14.3 15.6 15.9 16.3 16.6 17.0 17.5 18.0Net trade mln L 2.1 2.5 2.9 2.8 2.4 2.2 1.9 1.8 1.7 1.7 1.6
OECD3
Production mln L 21.0 22.4 23.0 23.2 23.0 22.8 22.7 22.6 22.4 21.9 21.6Consumption mln L 22.9 24.9 25.9 26.0 25.5 25.1 24.7 24.4 24.1 23.7 23.3Net trade mln L -2.1 -2.5 -3.0 -2.9 -2.5 -2.3 -2.0 -1.8 -1.8 -1.7 -1.7

ANNEX: COMMODITY SNAPSHOT TABLES
OECD-FAO AGRICULTURAL OUTLOOK 2017-2026 © OECD/FAO 2017 137
Table 3.A1.9. World cotton projections
Note: Marketing year: See Glossary of Terms for definitions.Average 2014-16est: Data for 2016 are estimated.
1. Consumption for cotton means mill consumption and not final consumer demand.2. Cotlook A index, Middling 1 3/32", c.f.r. far Eastern ports (August/July).3. Excludes Iceland but includes all EU28 member countries.Source: OECD/FAO (2017), “OECD-FAO Agricultural Outlook”, OECD Agriculture statistics (database). doi: dx.doi.org/10.1787/agr-outl-data-en
Marketing year
Average2014-16est 2017 2018 2019 2020 2021 2022 2023 2024 2025 2026
WORLDProduction Mt 23.4 22.7 22.6 22.7 23.2 23.7 24.2 24.7 25.2 25.6 26.1
Area Mha 31.7 30.2 29.7 29.5 29.5 29.6 29.7 29.8 29.9 29.9 30.0Yield t/ha 0.74 0.75 0.76 0.77 0.79 0.80 0.81 0.83 0.84 0.86 0.87
Consumption1 Mt 24.0 24.0 24.0 24.1 24.1 24.2 24.6 24.9 25.2 25.6 26.0
Exports Mt 7.6 7.8 7.8 7.9 7.9 8.0 8.0 8.1 8.2 8.4 8.5Closing stocks Mt 19.8 16.5 14.9 13.3 12.1 11.4 10.9 10.4 10.2 10.1 10.0
Price2 USD/t 1 582.8 1 480.7 1 467.2 1 442.1 1 460.5 1 546.7 1 568.2 1 572.3 1 572.5 1 573.3 1 576.0
DEVELOPED COUNTRIESProduction Mt 5.6 6.0 5.9 5.9 6.0 6.0 6.1 6.2 6.3 6.4 6.5Consumption Mt 1.7 1.8 1.8 1.8 1.8 1.8 1.9 1.9 2.0 2.0 2.0Exports Mt 4.1 4.6 4.6 4.6 4.6 4.6 4.6 4.7 4.7 4.7 4.8Imports Mt 0.4 0.4 0.4 0.4 0.4 0.4 0.4 0.4 0.4 0.4 0.4Closing stocks Mt 1.8 2.1 2.0 1.8 1.7 1.7 1.7 1.7 1.7 1.7 1.7
DEVELOPING COUNTRIESProduction Mt 17.7 16.7 16.7 16.8 17.2 17.6 18.1 18.5 18.9 19.3 19.7Consumption Mt 22.3 22.2 22.2 22.3 22.3 22.3 22.7 23.0 23.3 23.6 23.9Exports Mt 3.5 3.2 3.2 3.2 3.3 3.4 3.4 3.5 3.5 3.6 3.7Imports Mt 7.0 7.3 7.3 7.3 7.4 7.4 7.5 7.6 7.7 7.8 7.9Closing stocks Mt 18.0 14.4 12.9 11.5 10.4 9.8 9.2 8.7 8.5 8.3 8.3
OECD3
Production Mt 5.2 5.5 5.4 5.4 5.5 5.6 5.6 5.7 5.8 5.9 5.9Consumption Mt 3.3 3.3 3.3 3.3 3.3 3.3 3.3 3.3 3.4 3.4 3.4Exports Mt 3.3 3.9 4.0 4.0 4.0 4.0 3.9 4.0 4.0 4.1 4.1Imports Mt 1.7 1.7 1.7 1.7 1.7 1.7 1.6 1.6 1.6 1.6 1.6Closing stocks Mt 2.5 2.8 2.6 2.5 2.4 2.3 2.3 2.3 2.4 2.4 2.4