Embed Size (px)
Citation preview

Fairchild Consulting
C O M M I T I N N O VAT E A D VA N C E
RISK MANAGEMENT
BUSINESS CONTINUITY
DISASTER RECOVERYINFORMATION SECURITY
SOFTWARE IMPLEMENTATION& ADMINISTRATIVE SERVICES
Managing and Measuring BC Program Maturity

Objective
• Growing and maturing your business continuity program utilizing an assessment methodology, social media, and recommended practices.
• Learn how and why companies use program / plan assessments and social media to mature their programs.
• Explaining how an organization implements quality controls to mature the program.
• Session Takeaways: Recommended practices, lessons learned, example reports and dashboards, tips, and potential pitfalls.

• Doug Kavanagh – Fairchild [email protected]
• Al Sawchak – Fairchild [email protected]
• Sue Hornstra – GE [email protected]

Fairchild Background
Business Continuity
Disaster Recovery
Information Security
Risk Management
Shared Resiliency Services
Fairchild Consulting is a full-service business resiliency consulting firm. Fairchild applies a unique blend of proven methodology and innovative thought leadership to advance your organization to a new level of preparedness.
Fairchild Consulting currently supports some of the largest organizations in the world in the following areas:
4

Program Management
Platform Servicing
Program Awareness
Program Metrics /
Health
Initiate Planning Process
Conduct a Risk Analysis
Conduct a Business Impact
Analysis
Determine Essential Functions
Design and Build the Plan
Test, Train, and Exercise
Measure, Monitor, &
Market
Business Resiliency Life Cycle
5

Overview of What is Required in Mature Programs
• Program Management– Steering Committee, Advanced Metrics
• Communications– Communications to all audiences– Increased speed and accuracy– Communications Feedback
• Testing• Supply Chain/Vendor Management
– Recognize vendor criticality, up to and including identif99ying alternates– Establish vendor BC standards for their preparedness and internal testing
processes• Pandemic – stronger efforts to address:
– Organization and employee education about Pandemic– Pre-event strategies, plans, and supporting resources– Integration of Pandemic into the BC program– Conducting tests of the pandemic portions of your BC program

Maturity Assessment

Maturity Assessment

Maturity Assessment

Maturity Level CharacteristicsMaturity Level Characteristics of
Capability Example Criteria
5 Optimizing(Optimizing Feedback) Issue
Management a source of competitive advantage.
•Proactive improvement of processes & controls, based on costs;•High use of statistics data to analyze & improve costs, performance, & risks;•Formal & flexible cost / benefit analysis.
4 Managed
(Quantitative) Issues measured/managed quantitatively and aggregated enterprise-wide;
there is a "Chain of Accountability".
•Objective is process control of outputs;•Detailed statistical measurement & Key Performance Indicators;•Cost & cycle times well known;•Early-warning systems & risk analytics;•Strong teams & experienced role models.
3 Defined
(Qualitative/Quantitative) Policies, process, and standards defined and institutionalized; there is a "Chain of
Certification".
•Proactive management & flexibility;•Standardized processes company-wide;•Stable & measurable processes, integrated into organization with tools;•Standards & verification mechanisms.
2 Repeatable(Intuitive) Process repeatable, but
reliance on people continues; controls documentation lacking.
•Management objectives & planning;•Some documented policies & procedures, signs of implementation;•Stability increased;•Organizational knowledge & training.
1 Initial(Ad Hoc / Chaotic) Dependent on
heroics; institutional capability lacking, non existent.
•Unpredictability;•Little or vague documentation;•Highly dependent on individuals;•Individual, technical skills;•Instability, especially during crisis.

Sample Maturity Level Assessment

Adding Social Media to a Mature Resilient Organization

Use of Social Media in a Mature Resiliency Program
• Tweets from building evacuees in Virginia beat the earthquake aftershocks to New York City.
• The city of Calgary effectively used social media tools to communicate during the 2013 flood.
• Twitter was used extensively during the earthquake and tsunami in Japan.
• Google’s Crisis Response team helped develop a “Person Finder” that acted as a message board for communication where cellphone access was limited.

Use of Social Media in a Mature Resiliency Program
• “The convergence of social networks and mobile has thrown the old response playbook out the window,” Michael Beckerman, president and CEO of the Internet Association, told the House Subcommittee on Emergency Preparedness, Response, and Communications in 2013.
• The Federal Emergency Management Agency (FEMA) wrote in its 2013 National Preparedness report that during and immediately following Hurricane Sandy, “users sent more than 20 million Sandy-related Twitter posts, or “tweets,” despite the loss of cell phone service during the peak of the storm.

Use of Social Media in a Mature Resiliency Program
• A new application called Line was developed after the earthquake. It provides free IM and calling through various devices and soon it exceeded Twitter use within a year in that country.
• US Congress - Emergency MGMT 2.0: How Social Media & New Tech are Transforming Preparedness, Response, & Recovery
• Hurricane Sandy - Twitter hashtags were analyzed to track power outages.

Use of Social Media in a Mature Resiliency Program


Use of Social Media in a Mature Resiliency Program
• Tools are available to help manage social media and to monitor multiple social media platforms and respond to public inquiries and concerns.• Hootsuite • Tweetdeck• Nuvi• Social Media Monitoring Wiki• Sirenus (Australia) social media

Use of Social Media in a Mature Resiliency Program

Use of Social Media in a Mature Resiliency Program
Action URL
Geotag your twitter searches: http://www.youtube.com/watch?v=Q3coB42XVtM
Use Hashtags: https://dev.twitter.com/media/hashtags
Create Buttons: https://twitter.com/about/resources/buttons
Creating track-able bit.ly links: https://bitly.com/
Stay in the know: http://socialmediatoday.com/

Use of Social Media in a Mature Resiliency Program
Action URL
Community and Regional Resilience http://www.resilientus.org/
City Resilience http://www.100resilientcities.org/#/-_/

Implementing Assessments

QA Charter
To implement a process to ensure compliance with the FFIEC guidelines, policy & procedures & business continuity best practices
To validate execution quality & to enhance transparency of deliverables across the BUs
Ensure the overall resiliency of the GECC BC and CM programs In scope - 100% Inspection of; BIAs, plans, exercises Validate training and communication
Needs to be communicated to your stakeholders

Assessment Methodology
Key attributesQualitative and quantitativeIndependent Knowledgeable personnelRepeatable process with consistent resultsDrives decisions and changeAligned with policy and procedures

Establishing the assessment
Preparation is the keyBased on program requirementsDetailed questions and instructionsOperationally define terms and expectationsTesting of the process for consistencyRegular review throughout lifecycleMeaningful reporting – detailed and summaryCommunication to the business

Identification of themes
Areas of Review Possible Points Actual points Percentage
Tool usage 54 54 100%
Process Data 32 32 100%
Impacts 90 90 100%
MADs 54 54 100%
Application 72 72 100%
Interdependencies 36 36 100%
Approval 54 54 100%
Scenario 96 96 100%
Recovery 58 58 100%
Resources 2 2 100%
Team 36 36 100%
General Planning 18 18 100%
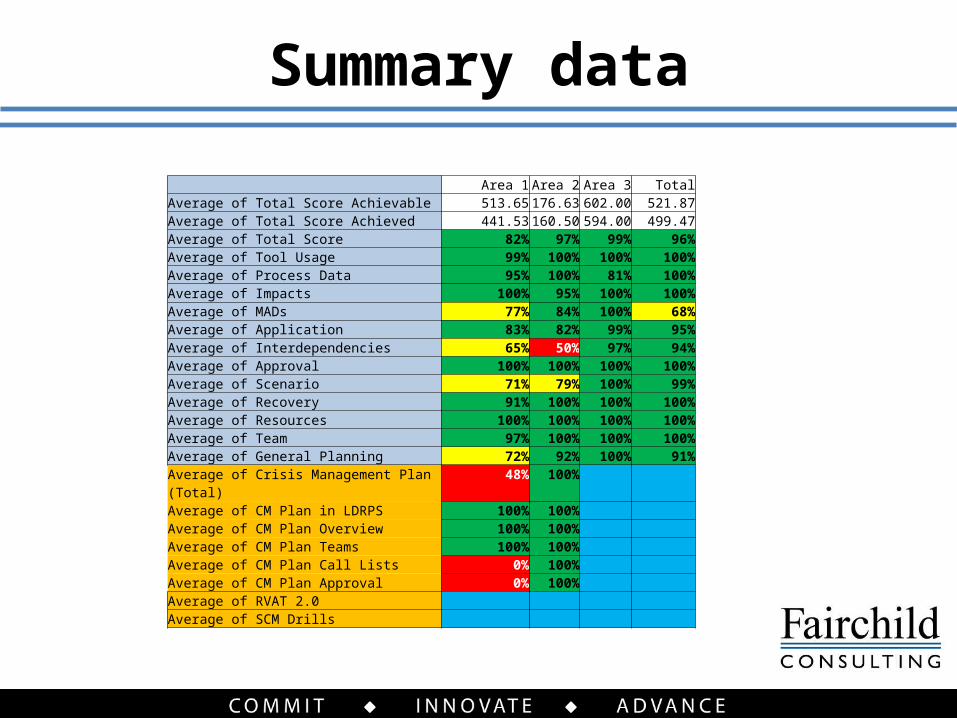
Summary data
Area 1 Area 2 Area 3 TotalAverage of Total Score Achievable 513.65 176.63 602.00 521.87Average of Total Score Achieved 441.53 160.50 594.00 499.47Average of Total Score 82% 97% 99% 96%Average of Tool Usage 99% 100% 100% 100%Average of Process Data 95% 100% 81% 100%Average of Impacts 100% 95% 100% 100%Average of MADs 77% 84% 100% 68%Average of Application 83% 82% 99% 95%Average of Interdependencies 65% 50% 97% 94%Average of Approval 100% 100% 100% 100%Average of Scenario 71% 79% 100% 99%Average of Recovery 91% 100% 100% 100%Average of Resources 100% 100% 100% 100%Average of Team 97% 100% 100% 100%Average of General Planning 72% 92% 100% 91%Average of Crisis Management Plan (Total) 48% 100% Average of CM Plan in LDRPS 100% 100% Average of CM Plan Overview 100% 100% Average of CM Plan Teams 100% 100% Average of CM Plan Call Lists 0% 100% Average of CM Plan Approval 0% 100% Average of RVAT 2.0 Average of SCM Drills

Identification of trends plan level
Error Trend 1: - BIA: MAD Identified Incorrectly Error Trend 2: - BIA: Applications with RTOs shorter
than MADs Error Trend 3: - BIA: Independencies have RTOs
shorter than MADs Error Trend 4: - Plan: Scenario Components Missing Error Trend 5: - Plan: Overview Components Missing
Error Trend 6: - Plan: Call Lists not identified Error Trend 7: - Plan: Teams not identified

Questions????