Embed Size (px)
Citation preview

Commission on Fiscal Stability
and Economic Growth
Commission Meeting
March 1, 2018

Commission on Fiscal Stability and
Economic Development
Commission on Fiscal Stability and
Economic Development
Current Connecticut Situation

Commission on Fiscal Stability and
Economic Development
Connecticut real gross state product still remains 8% below 2007 levels;
lagging neighboring states and national averages
3
Indexed Real GDP by state (millions of chained 2007 dollars)
Source: Bureau of Economic Analysis, Gross State Product
-7.9%

Commission on Fiscal Stability and
Economic Development
4
Despite achieving a bipartisan budget, significant out year deficits remain
To the extent one-time measures in the biennium are reversed as currently
contemplated in FY 2020, the budget deficit will grow to be over $2 billion and
is expected to increase thereafter
Connecticut State Forecasted Budget Balances ($ in millions)1
(1) Source: FY18-19 Biennial Budget, January 2018 Consensus Revenue Estimates, January 2018 OPM Budget
Estimates, OFA Out Year Estimates
Commission on Fiscal Stability and
Economic Development
5
Source: OFA Fiscal Accountability Report FY17 – FY 20. Connecticut CAFR. 2017 Annual Report of the State Comptroller. OFA Fiscal Note to Enacted Biennium Budget. OPM and OFA January 16, 2018 Consensus Revenue Estimates. OPM January 19, 2018 Budget Letter. (1) Fixed cost data from OFA Fiscal Accountability Report dated Nov 15, 2016 and
is not reflective of enacted budget and projections. (2) FY06 General Fund revenues and expenditures based on gross funding of
Medicaid (includes both federal and local portion).
(3) FY17 General Fund fixed expenditures per OFA Fiscal Accountability Report FY17 – FY20. FY17 total General Fund expenditures and revenues per 2017 State Comptroller’s Annual Report.
(4) Includes Medicaid and other services provided by the Department of Social Services, Department of Children and Families, Department of Mental Health and Addiction Services, and Office of Early Childhood.
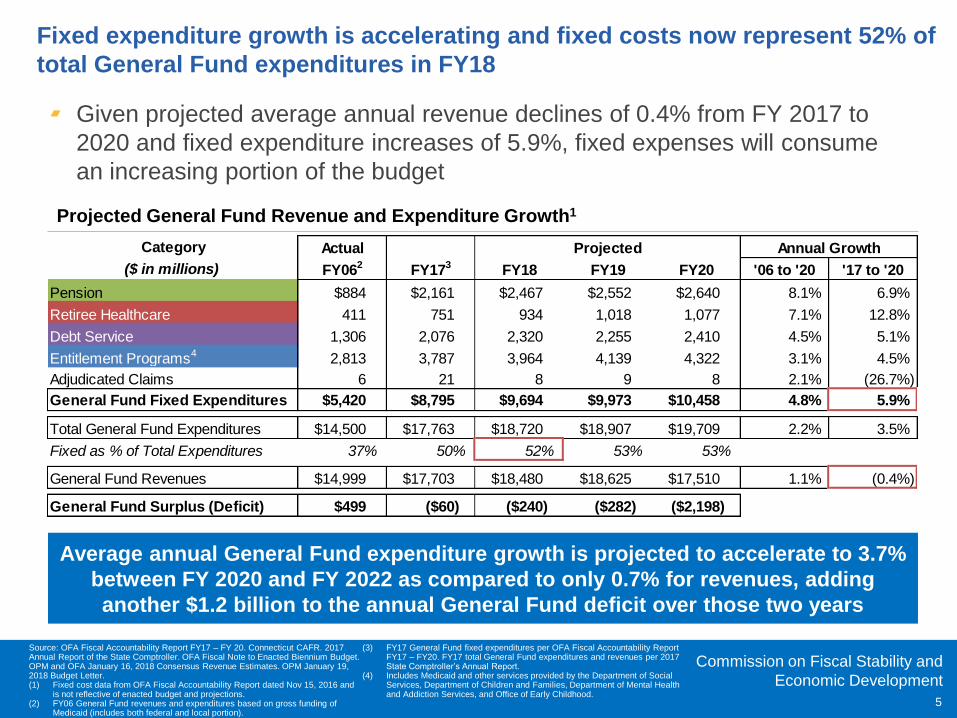
Fixed expenditure growth is accelerating and fixed costs now represent 52% of
total General Fund expenditures in FY18
Given projected average annual revenue declines of 0.4% from FY 2017 to
2020 and fixed expenditure increases of 5.9%, fixed expenses will consume
an increasing portion of the budget
Projected General Fund Revenue and Expenditure Growth1
Average annual General Fund expenditure growth is projected to accelerate to 3.7%
between FY 2020 and FY 2022 as compared to only 0.7% for revenues, adding
another $1.2 billion to the annual General Fund deficit over those two years
Category Actual Projected Annual Growth
($ in millions) FY062 FY173 FY18 FY19 FY20 '06 to '20 '17 to '20
Pension $884 $2,161 $2,467 $2,552 $2,640 8.1% 6.9%
Retiree Healthcare 411 751 934 1,018 1,077 7.1% 12.8%
Debt Service 1,306 2,076 2,320 2,255 2,410 4.5% 5.1%
Entitlement Programs4 2,813 3,787 3,964 4,139 4,322 3.1% 4.5%
Adjudicated Claims 6 21 8 9 8 2.1% (26.7%)
General Fund Fixed Expenditures $5,420 $8,795 $9,694 $9,973 $10,458 4.8% 5.9%
Total General Fund Expenditures $14,500 $17,763 $18,720 $18,907 $19,709 2.2% 3.5%
Fixed as % of Total Expenditures 37% 50% 52% 53% 53%
General Fund Revenues $14,999 $17,703 $18,480 $18,625 $17,510 1.1% (0.4%)
General Fund Surplus (Deficit) $499 ($60) ($240) ($282) ($2,198)

Commission on Fiscal Stability and
Economic Development
Fixed costs are growing to over 50% of the general fund, crowding out
other spending and investment
6
Source: 2014-2016 Annual Reports of the State Comptroller, OFA Fiscal Accountability Report FY17
– FY 20
General Fund Fixed vs. Discretionary Costs (% of General Fund Expenditures)

Commission on Fiscal Stability and
Economic Development
Unfunded Pension
$33.8
GO Debt$17.4
Non-GO Debt$10.6
Unfunded Other Post
Employment Benefits (OPEB)
$21.9
Other$1.9
Total Liabilities2 ($ billions)$85.5B as of 6/16
CT’s legacy liabilities are precariously high and trending higher
Debt service to revenue ratio of 13.3% is highest in the US3
3.0x US mean / 3.2x US median
Moody’s adjusted net pension liability (ANPL) is 20.4% of GDP, 3rd highest in the US3
2.8x US mean / 4.2x US median
Pension contributions and debt service at 26.5% of revenue is highest in the US3
3.0x US mean / 3.6x US median
Net tax supported debt as a % of personal income is 9.7%, 3rd highest in the US3
7
The State’s $86 billion of total liabilities would increase to nearly $100 billion if
the State’s pension systems reduced their investment return assumption to 6%1
(1) Sensitivity analysis of pension liabilities per The Pew Charitable Trusts.
(2) State of Connecticut Comprehensive Annual Financial Report, 2016. Debt includes component units. Unfunded pension and OPEB liabilities represent
unfunded actuarial accrued liabilities (“UAAL”) based on actuarial reports for the State’s pension and OPEB systems.
(3) Moody’s Investor Service. These ratios have been calculated based on Moody’s definitions of debt, pension liabilities, debt service, contributions and own-
source governmental revenues (revenues less federal funding), and in most cases will differ from a state’s own published calculations or the calculations of
other institutions.
State Employees $20.4
Teachers 13.1
Judicial 0.2
Total $33.8

Commission on Fiscal Stability and
Economic Development
Escalating required pension contributions, especially for TRS, exacerbate the
State’s fiscal challenges
8
(1) The Pew Charitable Trusts, State Office Policy Management, May 2017 SEBAC Agreement
Projected Annual Pension Contributions (excl. JRS) ($ in billions)1
Utilizing the current discount rate of 8% for TRS, total annual contributions
reach $4.7B in 2032

Commission on Fiscal Stability and
Economic Development
$2.6 $2.9$3.5
$4.0$4.4
$4.8$5.5
$6.7
$8.4
$2.0 $1.6 $1.9$2.2
$2.6$3.1
$3.5
–
$2.0
$4.0
$6.0
$8.0
$10.0
2017
2018
2019
2020
2021
2022
2023
2024
2025
2026
2027
2028
2029
2030
2031
2032
2033
2034
2035
2036
2037
2038
2039
2040
2041
2042
2043
2044
2045
SERS (Post SEBAC) TRS
However if you adopt a more realistic discount rate of 5.5%, the 2032
contributions would be $8.4 billion
9
(1) Excludes JRS. 2016 CT CAFR, CT SERS, TRS 2016 Actuarial Valuation Report.
(2) JRS projected contributions unavailable. TRS contributions assume a 5.5% investment return per Center for
Retirement Research at Boston College, State Office of Policy and Management. SERS contributions per
May 2017 SEBAC Agreement.
General Fund revenues would need to grow by 8% annually to maintain the
FY 2017 ratio of pension contributions to General Fund revenues1,2
Projected Annual Pension Contributions (excl. JRS) ($ in billions)2

Commission on Fiscal Stability and
Economic Development
Connecticut would need to spend ~35% of state revenues to fund debt and
legacy pension and OPEB liabilities on an accrual basis over 30 years,
assuming an illustrative 6% return on plan assets1
10
Source: The ARC and the Covenants 2.0, J.P. Morgan Asset Management; State/Pension Plan
Comprehensive Annual Financial Reports; Census; Loop Capital Markets. FY 2015.
(1) Accrual basis expenditures include payments of benefits that have accrued even if cash
payment for such benefits is not yet due.
25%
15%
Percent of state revenue collections required to pay the sum of interest on bonds, the state's
share of unfunded pension and retiree healthcare liabilities, and defined contribution plan
payments
Connecticut spent ~21% of state revenues to fund debt, pension and OPEB
liabilities in FY 2015
Connecticut would need to either raise revenues by ~14%, cut direct spending
by 14%, or increase worker contributions by 699% to meet full accrual
payments to retirees

Commission on Fiscal Stability and
Economic Development
Connecticut’s taxes are higher than US averages
1 Represents the highest marginal corporate tax rate
2 Represents the highest marginal personal income tax rate
3 Mean Property Taxes on Owner-Occupied Housing as Percentage of Mean Home Value as of Calendar Year 2011
4 Tax Foundation data
SOURCE: Federation of Tax Administrators (2016); U.S. Census, Hartford Courant

Commission on Fiscal Stability and
Economic Development
Connecticut’s Population Growth Remains Flat
12
Source: US Census, American Community Survey, BLS
Population projections
Indexed to 2006
CAGR ‘16-’26
%
0.5%
0.1%
0.0%
0.0%
106
110
108
112
98
104
102
100
NJ
CT
MA
2006
NY
2026

Commission on Fiscal Stability and
Economic Development
Migrants to CT earn less than those who leave CT
13
1 Number of returns filed approximates the number of households that migrated
2 Adjusted Gross Income as reported to the IRS
SOURCE: Infernal Revenue Service (2015-2016)
$101
$101
CA
NJ
$73 MA
$123
93
NY
FL $56
123
$87
$112
$95
$253
$112
Destination region
% of total households
Average
Income2
Source region
% of total households
Households1 moving to Connecticut
earn $93,000/year…
…while CT residents moving away earn
more – averaging $123,000/year
Average
30%
12%
8%
5%
5%
17%
10%
16%
4%
6%
Average
Average
Income2

Commission on Fiscal Stability and
Economic Development
(2,873)
3,758 4,058
7,044
1,727
(3,971)(2,723)
(8,846)(10,507)
(8,228)
2007 08 09 10 11 12 13 14 15 2016
At the same time, a series of tax increases has correlated with significant
outmigration
14
Key events Income tax bracket added for
high earners; corporate surcharge added for large firms (2009)
Number of brackets, top income tax rate, and corp. surcharge increased (2011)
Top income tax rate increased (2015)
Several high profile corporate departures (e.g. GE) (2016 - 2017)
In 2016, the average adjusted gross
income of those leaving was $123,377...
totaling over $6 billion
Historical Net Migration in Connecticut (# of people)1
Source: Hartford Courant, January 3, 2018.
(1) FY 2018 – FY 2019 Biennium Economic Report of the Governor

Commission on Fiscal Stability and
Economic Development
Connecticut has a Mismatch of Labor Supply and Demand
15
Source: EMSI and BLS data

Commission on Fiscal Stability and
Economic Development
The Bridgeport-Stamford Metro Area had 37.1 million hours of traffic delay
in 2014, up 400% from 1980
16
Millions of Hours of Delay Annually: Bridgeport-Stamford Metro Area
Source: Texas A&M Transportation Institute

Commission on Fiscal Stability and
Economic Development
A “strawman” vision for CT
17
Raise key
competitiveness
factors from bottom
quartile to above median
within 3-5 years and achieve top
quartile competitiveness by 2025
Achieve Sustainable
High Quality of Life
For All Connecticut
Residents
Target CT economic
growth rate of 3%+
(vs. flattish today)
Maintain critical
services while
protecting
vulnerable
populations
Achieve fiscal stability
– Sustainably
balanced budget
– Manageable debt
levels & unfunded
liabilities
Commission will recommend short-term, medium-term and long-term actions that will
enable improved competitiveness and higher growth
A long-term vision is required to propel our state back to greatness...

Commission on Fiscal Stability
and Economic Growth
Commission Meeting
March 1, 2018

Commission on Fiscal Stability and
Economic Development
Commission on Fiscal Stability and
Economic Development
Key Recommendations

Commission on Fiscal Stability and
Economic Development
Key Recommendations…
1. Enact a revenue neutral rebalancing of state taxes (which
becomes revenue positive when coupled with economic
growth) that reduces income taxes in every bracket,
selectively raises taxes on business, raises the sales tax
rate by less than 1%, cuts exemptions and exclusions
from all taxes by 14%, and eliminates the dwindling estate
and gift taxes
2. Raise the gas tax to fund transportation projects and
produce a plan for eventual implementation of electronic
tolls
3. Create a Joint Budget Committee of the legislature with
the power to set limits on revenues and expenses
20

Commission on Fiscal Stability and
Economic Development
Key Recommendations…
4. Have the legislature assume the responsibility to define
state employee fringe benefits by removing them from
collective bargaining for new contracts
5. Amend binding arbitration laws to permit award of
compromise outcomes
6. Develop and implement a plan to cut $1 billion out of
annual operating expenses
7. Reform the Teachers’ Retirement System to lower costs
and to make it sustainable by paying down unfunded
liabilities
21

Commission on Fiscal Stability and
Economic Development
Key Recommendations…
8. Reinvest in transportation and cities, and build a major
new STEM campus in one city in partnership with a major
research university
9. Undertake a series of growth initiatives, led by the
executive branch, with the funding and support from the
legislature to:
► (1) develop and retain the workforce Connecticut needs,
► (2) support the growth of Connecticut’s highest-potential economic
sectors,
► (3) transform the business environment for entrepreneurship and
innovation
10.Diversify municipal revenue streams beyond the
regressive property tax and stimulate regional service
delivery
22

Commission on Fiscal Stability
and Economic Growth
Commission Meeting
March 1, 2018

Commission on Fiscal Stability and
Economic Development
Current Policy
24
Source: Revenues – Comptroller’s Open Budget FY12 – FY17; OPM Consensus Revenue January 2018 |
Expenses – OFA Fiscal Accountability Report FY17 – FY20 & October Out Year Estimates
Key Assumptions: Fixed costs are growing at an average of ~5.5% each year; Total General Fund expenses
growing at 3% in future years past 2022
General Fund Surplus / Deficit Projections – Current Policy

Commission on Fiscal Stability and
Economic Development
Commission Plan
25
General Fund Surplus / Deficit Projections – Commission Plan
Source: Revenues – Comptroller’s Open Budget FY12 – FY17; OPM Consensus Revenue January 2018 |
Expenses – OFA Fiscal Accountability Report FY17 – FY20 & October Out Year Estimates; CT Tax Expenditure
Report February 2018
Key Assumptions: All Tax changes are implemented in 2020 | Payroll Tax – OPM Population data; CT SBA Office
of Advocacy

Commission on Fiscal Stability and
Economic Development
Commission Plan – Growth Assumption
26
General Fund Surplus / Deficit Projections – Commission Plan (Growth Assumption)
Source: Revenues – Comptroller’s Open Budget FY12 – FY17; OPM Consensus Revenue January 2018 | Expenses – OFA
Fiscal Accountability Report FY17 – FY20 & October Out Year Estimates; CT Tax Expenditure Report February 2018
Key Assumptions: All Tax changes are implemented in 2020; | Payroll Tax – OPM Population data; CT SBA Office of
Advocacy; Assume the pro-growth tax initiatives enable roughly 3% increased basis growth each year achieving our goal of a
3% – 3.5% Average GSP in 5-10 years

Commission on Fiscal Stability and
Economic Development
Net Plan Comparison
27
General Fund Surplus / Deficit Projections – Net Plan Comparison
Source: Revenues – Comptroller’s Open Budget FY12 – FY17; OPM Consensus Revenue January 2018 | Expenses – OFA
Fiscal Accountability Report FY17 – FY20 & October Out Year Estimates; CT Tax Expenditure Report February 2018
Key Assumptions: All Tax changes are implemented in 2020; | Payroll Tax – OPM Population data; CT SBA Office of
Advocacy; Assume the pro-growth tax initiatives enable roughly 3% increased basis growth each year achieving our goal of a
3% – 3.5% Average GSP in 5-10 years

Commission on Fiscal Stability
and Economic Growth
Commission Meeting
March 1, 2018


![[Economic Policy Making] Fiscal Policy](https://img.dokumen.tips/doc/110x75/5a4d1bf67f8b9ab0599e8d15/economic-policy-making-fiscal-policy.jpg)


