Embed Size (px)
Citation preview

EN EN
EUROPEAN COMMISSION
Brussels, 23.11.2017
SWD(2017) 397 final
COMMISSION STAFF WORKING DOCUMENT
Energy Union Factsheet Hungary
Accompanying the document
COMMUNICATION FROM THE COMMISSION TO THE EUROPEAN
PARLIAMENT, THE COUNCIL, THE EUROPEAN ECONOMIC AND SOCIAL
COMMITTEE, THE COMMITTEE OF THE REGIONS AND THE EUROPEAN
INVESTMENT BANK
Third Report on the State of the Energy Union
{COM(2017) 688 final} - {SWD(2017) 384 final} - {SWD(2017) 385 final} -
{SWD(2017) 386 final} - {SWD(2017) 387 final} - {SWD(2017) 388 final} -
{SWD(2017) 389 final} - {SWD(2017) 390 final} - {SWD(2017) 391 final} -
{SWD(2017) 392 final} - {SWD(2017) 393 final} - {SWD(2017) 394 final} -
{SWD(2017) 395 final} - {SWD(2017) 396 final} - {SWD(2017) 398 final} -
{SWD(2017) 399 final} - {SWD(2017) 401 final} - {SWD(2017) 402 final} -
{SWD(2017) 404 final} - {SWD(2017) 405 final} - {SWD(2017) 406 final} -
{SWD(2017) 407 final} - {SWD(2017) 408 final} - {SWD(2017) 409 final} -
{SWD(2017) 411 final} - {SWD(2017) 412 final} - {SWD(2017) 413 final} -
{SWD(2017) 414 final}
Energy Union –Hungary
1
Hungary Energy Union factsheet1
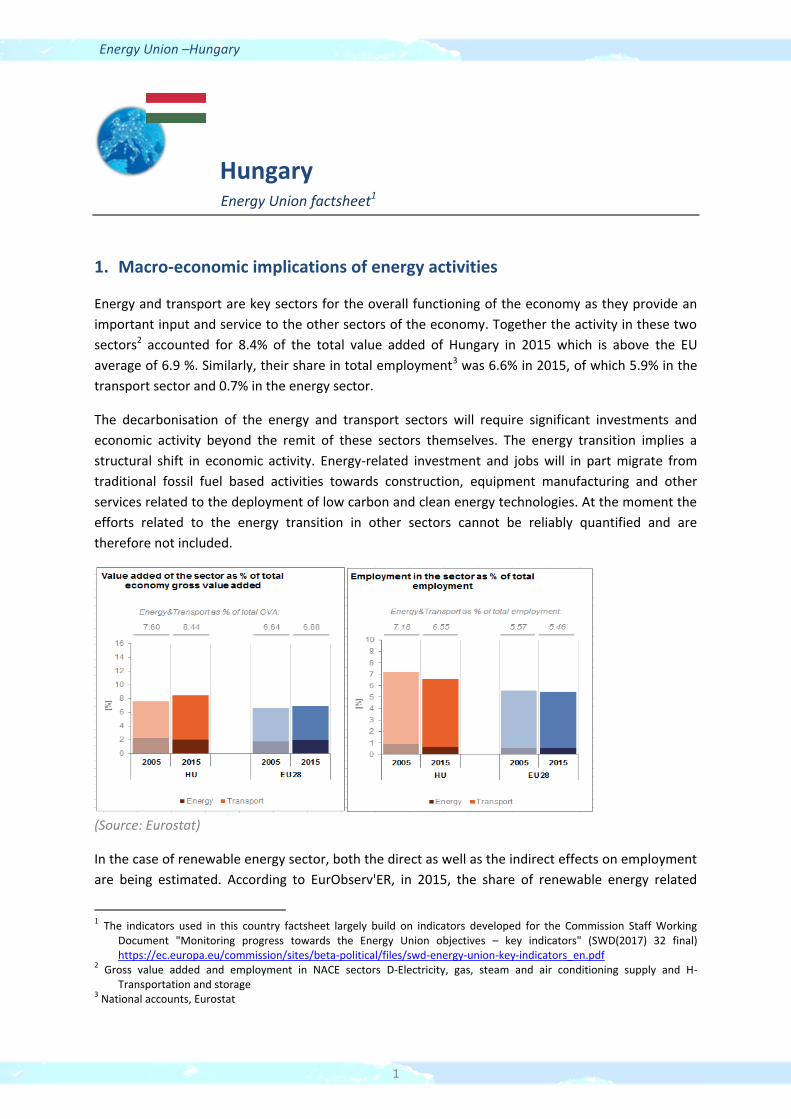
1. Macro-economic implications of energy activities
Energy and transport are key sectors for the overall functioning of the economy as they provide an
important input and service to the other sectors of the economy. Together the activity in these two
sectors2 accounted for 8.4% of the total value added of Hungary in 2015 which is above the EU
average of 6.9 %. Similarly, their share in total employment3 was 6.6% in 2015, of which 5.9% in the
transport sector and 0.7% in the energy sector.
The decarbonisation of the energy and transport sectors will require significant investments and
economic activity beyond the remit of these sectors themselves. The energy transition implies a
structural shift in economic activity. Energy-related investment and jobs will in part migrate from
traditional fossil fuel based activities towards construction, equipment manufacturing and other
services related to the deployment of low carbon and clean energy technologies. At the moment the
efforts related to the energy transition in other sectors cannot be reliably quantified and are
therefore not included.
(Source: Eurostat)
In the case of renewable energy sector, both the direct as well as the indirect effects on employment
are being estimated. According to EurObserv'ER, in 2015, the share of renewable energy related
1 The indicators used in this country factsheet largely build on indicators developed for the Commission Staff Working
Document "Monitoring progress towards the Energy Union objectives – key indicators" (SWD(2017) 32 final) https://ec.europa.eu/commission/sites/beta-political/files/swd-energy-union-key-indicators_en.pdf
2 Gross value added and employment in NACE sectors D-Electricity, gas, steam and air conditioning supply and H-Transportation and storage
3 National accounts, Eurostat

Energy Union –Hungary
2
employment in total employment of the economy in Hungary was at about 0.18%, well below the EU
average of 0.54%. The turnover of the renewable energy industry in the same year was estimated at
around EUR 830 million, the biggest part being attributed to the biomass industry (EUR 410 million)
followed by the biofuels (EUR 200 million), geothermal (EUR 85 million) and photovoltaic (EUR 75
million) industries.
(Source: EC based on Eurobserv'Er and Eurostat)
An indication of the level of efforts and challenges encountered by Hungary in the energy sector is
given by the gross fixed capital formation (GFCF)4. Investments in the electricity and gas sectors,
which are taken as reference sectors, have peaked in 2011 reaching a level of about 1% of GDP and
declined since then. It amounted to about 0.5 % of GDP in 2015.
(Source: Eurostat)
4 Gross fixed capital formation consists of resident producers´ acquisitions, less disposals, of fixed tangible or intangible assets. This covers, in particular, machinery and equipment, vehicles, dwellings and other buildings. It also includes foreign direct investment (FDI). Steam and air conditioning supply are also included in the figures mentioned above as Eurostat reports electricity, gas, steam and air conditioning supply together.

Energy Union –Hungary
3
Hungary is a net importer of fossil fuels and electricity. The trade deficit in energy products has fallen
from above 6% of GDP in 2006 to close to 4% in 2015, influenced by improvements in energy
efficiency and a decrease in the prices of energy commodities. The largest decrease in the trade
balance is accounted for by gas (from 2.9 % of GDP in 2006 to 1.7% in 2015), followed by petroleum
products (from 2.7 % of GDP in 2006 to 1.9% in 2015).
(Source: Eurostat)
2. Energy security, solidarity and trust
2.1. Energy Mix
In comparison to the average energy mix in the EU, the Hungarian energy mix has a lower share of
renewable energy (12.5% vs 13%), a lower share of oil (28.8% vs. 34.4%), similarly to solid fuels (9.8%
vs. 16.2%). In contrast, natural gas has a much higher importance in Hungary than in the EU as a
whole (31.2% vs 22%). To a lesser extent, this applies to nuclear energy as well (17.1% vs 13.6%).
(Source: ESTAT)

Energy Union –Hungary
4
2.2. Import dependency and security of supply
In 2015 about 53% of Hungary's energy consumption came from imports, being comparable with the
EU average (54%). However, given that the country has significant gas storage capacities, the overall
import dependency rate can show large variations from one year to another, as it happened between
2014 and 2015 (59.3% vs. 53.4%).
Consequently, a clear trend could not be established in the overall energy import dependency in
Hungary between 2005 and 2015, whereas the overall import dependency in the EU-28 increased
slightly; from 52.1% to 54%. In the case of hard coal, Hungary's import dependency remained close
to 100% over this period (reaching 99.3% in 2015), while for crude oil5 it increased by 3 percentage
points (from 88% to 91%) at the same time. Increasing share of renewables and share of nuclear
being higher than in the EU-28 energy mix helped in keeping the increase in the overall energy
import dependency rate under control.
In 2015 Hungary's net gas import dependency was almost 70%, with a dominant share of Russia as
import source (95%). In the case of crude oil Russia also had a dominant share (81% in 2015), while
for hard coal the most important trading partner were the United States (48% of all coal imports6). In
the case of nuclear energy, the fuel came exclusively from Russia.
(Source: Eurostat)
The Regulation concerning measures to safeguard security of gas supply requires that, if the single
largest gas infrastructure fails in one Member State, the capacity of the remaining infrastructure is
able to satisfy the total gas demand during a day of exceptionally high gas demand. This condition is
met if the value of the N-1 indicator is equal to or above 100%. Hungary complies with this rule,
principally relying on its significant gas storage capacities and increasing interconnections with
neighbouring countries. Demand side measures (e.g.: voluntary load curtailments for large industrial
gas consumers) also play a role in maintaining continuous gas supply in case of the disruption of a
large infrastructure item.
5 National statistical data show slightly different numbers on the share of imports in crude oil consumption: 91.7% for 2005
and 95.9% for 2015. 6 National statistical data show slightly different numbers on top extra-EU suppliers: United States: 53.8 %, Canada: 10.2 %, Australia: 5.7 %

Energy Union –Hungary
5
(Source: Gas Coordination Group)
3. Internal market
3.1. Interconnections and wholesale market functioning
3.1.1. Electricity
(Source: EC based on ENTSO-E scenario outlook and adequacy forecast 2014)
(Sources: EC services based on Eurostat for the left graph and based on Platts and European power exchanges for the right graph)
Hungary is part of the electricity system of Central Eastern Europe, and its wholesale electricity
market has been coupled with the Czech Republic, Slovakia and Romania since 2014. The Hungarian
electricity system is directly connected to all of the country's neighbours with the exception of
Slovenia, where the interconnector is planned to be built in the forthcoming years under a Project of
Common Interest (PCI). In 2017 the electricity interconnection level7 of Hungary was 58%, having
7 The interconnectivity level is calculated as a ratio between import interconnection and net generation capacities
of the country (i.e. the 2017 value is the ratio between simultaneous import interconnection capacity [GW]
and net generating capacity [GW] in the country at 11 January 2017, 19:00 pm as resulted from ENTSO-E
Winter Outlook 2016/2017)

Energy Union –Hungary
6
increased from 29% in 2014 and being well above the 2020 EU target of 10%. However, the current
national arrangements for congestion management and bidding zone definition in Central Europe do
not necessarily accurately reflect actual congestion, and this is leading to increasing limitations of
cross-border flows of electricity.
The concentration of the power generation market is well below EU average. Between 2013 and
2016 wholesale electricity prices decreased in Hungary by 16.3%, following the general decreasing
trend in the EU. In 2016 the annual average wholesale electricity price in Hungary (35.4 €/MWh) was
close to the EU average. However, it is worth noting that the price level has been higher compared to
most of its neighbouring countries over the last few years, as the 2016 average wholesale price was
29.2 €/MWh in Austria, 31.5 €/MWh in Slovakia, 33.2 €/MWh in Romania and 36.6 €/MWh in
Slovenia. The main reason for this price premium is the structural exposure to electricity imports, as
a significant part of the generation portfolio in Hungary is producing electricity at higher costs than in
the regional peers. As a result, Hungary is importing electricity, mainly through Slovakia8, Ukraine and
Austria. During peak demand periods (e.g.: heat waves in the summertime or cold periods during the
winter) the price of imported electricity can rise significantly, as hydro based electricity generation in
the Balkan region can diminish substantially. Although Hungary's electricity interconnection level
with its neighbours is good in EU comparison, it would still be important to ensure that competitively
priced electricity from Western Europe could reach Hungary in order to decrease the persisting price
premium to the peer markets in Central Europe.
For assuring more competitive imports from Central and Western Europe, electricity
interconnections with neighbouring Slovakia are planned to be reinforced in the future through the
following three PCI projects:
A new AC 400 kV double circuit interconnection with a total capacity of 2 772 MVA between
SK and HU from Gabčíkovo substation (SK) to the Gönyű substation (HU), with one circuit
connected to Veľký Ďur substation (SK). The permitting process started on the 14th of June
2016, foreseen to be completed in 2020.
Connection of the two existing substations R. Sobota (SK) and Sajóivánka (HU) by a new
2x400 kV AC double circuit line – In permitting, foreseen to be implemented in 2020. It has
obtained a Connecting Europe Facility (CEF) grant for studies of 0.7 million EUR.
Hungary signed with Slovakia a construction agreement at Ministerial level for the
implementation of the two aforementioned interconnectors in October 2016.
Erection of new 400 kV AC double circuit line (OHL) with a capacity of 2772 MVA between
Veľké Kapušany (SK) and a substation in the area of Kisvárda (HU) – Under consideration, to
be completed by 2029.
The electricity interconnector with Slovenia (Cirkovce (SI) to Héviz (HU)/Žerjavinec (HR) -400 kV
double circuit line) is planned to be built until 2019.
88 According to data from the national regulator, top electricity import suppliers with the share in total import in
2015 were Slovakia (49%), Ukraine (28%), Austria (13%)

Energy Union –Hungary
7
3.1.2. Gas
By 2015 the market concentration index of wholesale gas supply in Hungary grew significantly above
the EU average, though in 2011 it was below. The main reason for this increasing supply
concentration was the dwindling domestic gas production that amplified the role the dominant
import supplier. Both in Hungary and the EU as a whole natural gas prices in the wholesale market
decreased significantly (respectively by 48% and 46%) between 2013 and 2016, largely owing to
decreasing crude oil prices that resulted in price decrease in the oil-indexed gas supply contracts.
Hungary's price premium decreased compared to Western European hub prices, due to the impact of
the aforementioned oil-indexation and to the increasing competition on the gas internal market in
the EU, pushing external gas suppliers to acknowledge price signals from free market gas hubs
besides oil-indexation in their price setting factors.
Hungary has significant import capacities from Ukraine and Austria. In 2015 the new interconnector
with Slovakia was put in operation, through which Hungary has a further link to Western European
hubs. Nevertheless, up to now the utilisation rate of the Hungarian-Slovakian interconnector
remained low, as imports from Russia became cheaper and further North-South infrastructure (that
would enable e.g.: LNG imports from Poland) is still missing (i.e. Poland-Slovakia and/or Poland-Czech
republic). Hungary has significant interconnection capacities enabling gas exports to Serbia, Romania
and Croatia. However, physical reverse flows on the Croatian and the Romanian side are needed to
enable gas imports from alternative sources9 to Hungary. Efforts are being made by the European
Commission to this effect, including through CEF grants to both projects.
(Source: ACER for the left graph and EC services based on Platts, gas hubs, Eurostat for the right graph)
Main natural gas PCI projects:
New interconnector between the Hungarian and Slovenian transmission systems (currently
Slovenia is the only neighbouring country not having gas interconnection with Hungary) on the
9 e.g. Black Sea, South Eastern Europe infrastructure connections, and the Krk LNG regasification terminal in the future
Energy Union –Hungary
8
route Nagykanizsa Tornyiszentmiklós (HU) - Lendava (SI) – Kidričevo, enabling access to
underground storages in Hungary for Slovenian gas suppliers, enabling access to LNG terminals
in northern Adriatic and other gas sources for Hungarian gas suppliers. Planned completion by
2020 the earliest.
Phased capacity increase on the Bulgaria — Romania — Hungary — Austria bidirectional
transmission corridor (currently known as "ROHUAT or BRUA") to enable an indicative capacity
increase at the Hungarian-Romanian interconnection point and related necessary investments in
the rest of the transmission system in three phases, as a reference for the corridor including
new resources, inter alia from the Black Sea.
3.2. Retail electricity and gas markets
3.2.1. Electricity
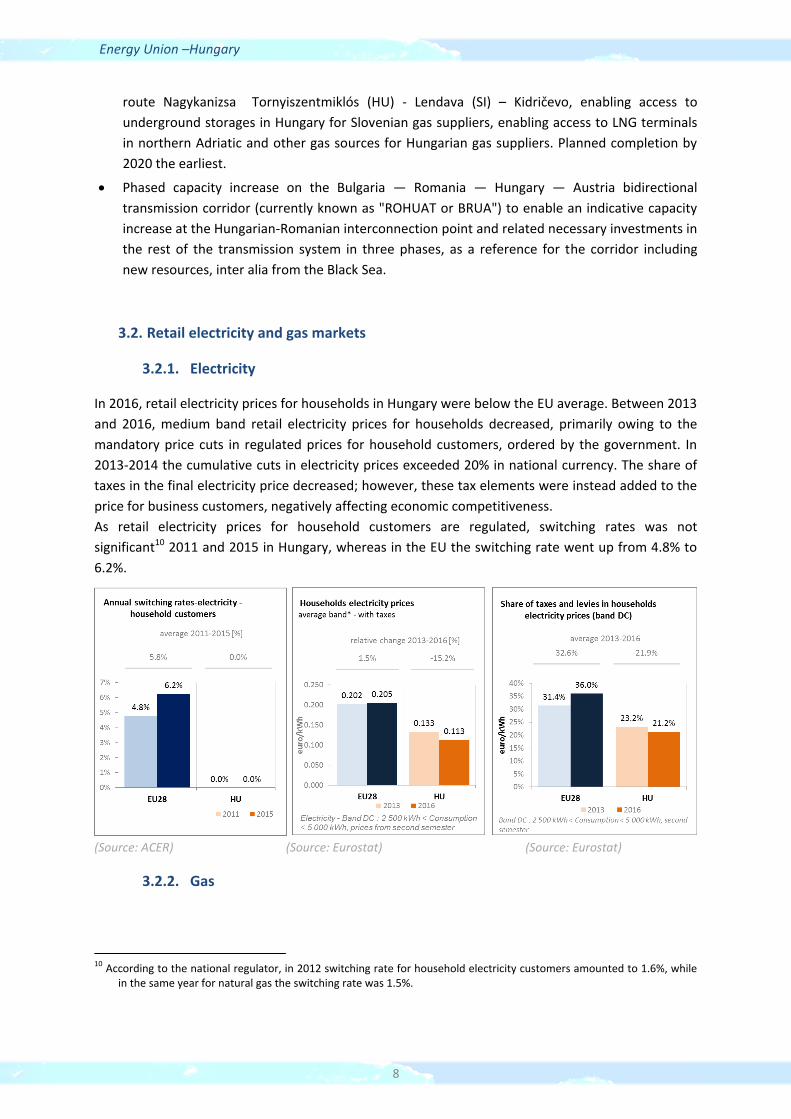
In 2016, retail electricity prices for households in Hungary were below the EU average. Between 2013
and 2016, medium band retail electricity prices for households decreased, primarily owing to the
mandatory price cuts in regulated prices for household customers, ordered by the government. In
2013-2014 the cumulative cuts in electricity prices exceeded 20% in national currency. The share of
taxes in the final electricity price decreased; however, these tax elements were instead added to the
price for business customers, negatively affecting economic competitiveness.
As retail electricity prices for household customers are regulated, switching rates was not
significant10 2011 and 2015 in Hungary, whereas in the EU the switching rate went up from 4.8% to
6.2%.
(Source: ACER) (Source: Eurostat) (Source: Eurostat)
3.2.2. Gas
10 According to the national regulator, in 2012 switching rate for household electricity customers amounted to 1.6%, while
in the same year for natural gas the switching rate was 1.5%.

Energy Union –Hungary
9
The share of natural gas in Hungary is one of the highest in the EU in domestic heating and heat
generation. Therefore, both security of supply and affordability issues relating to gas are of key
political interest in the country. Gas retail prices for household customers were lower compared to
the EU average in 2016 and decreased compared to 2013 as a result of the mandatory price cuts
ordered by the government, which exceeded 20% in national currency. The share of tax content
within the final retail price did not change in this period, and was slightly lower than the EU average.
As retail prices are regulated for all customers that are supplied by universal service providers,
switching rates was not significant between 2011 and 2015 in Hungary. As the universal service
segment was not profitable in the last few years, utilities withdrew from this business and as of 1
October 2016 the state owned Főgáz Ltd. practically became the single provider of natural gas for
households in Hungary.
(Source: ACER) (Source: Eurostat) (Source: Eurostat)
Regulated retail electricity and gas prices, often not reflecting all incurring energy supply costs,
network costs and taxes and levies (below-cost price regulation) have resulted in losses to the service
providers over several years and prompted energy retailers to return their universal supply licences.
The state-owned First National Utility (ENKSZ Zrt.) has been established in order to take over the
universal service segment for households from utilities, and besides natural gas it aims to supply
electricity for all customers in Hungary on the long run. The dominance of a single electricity and gas
utility company results in a lack of consumer choice and competition. Below-cost prices do not
subsidise only the vulnerable households, but also all the wealthier customers. The accumulating
potential financial losses in the balance sheet of the state-owned energy utility may not be
sustainable in the long run and may result in regular recapitalisation needs, implying a risk on the
state budget.
3.2.3. Market performance indicators
According to the periodical survey of the Directorate-General Justice and Consumers of the European
Commission (DG JUST), the Hungarian consumers are more satisfied than the EU average with the
services received on energy retail markets. The market performance indicators on the chart embrace
factors such as satisfaction on the easiness of comparing offers, consumers' trust in retailers on
complying with consumer protection rules, problems experienced (and the degree up to which they
led to complaints) and consumer satisfaction (how consumer expectations are met).

Energy Union –Hungary
10
(Source: DG JUST survey)
3.3. Energy affordability
In Hungary the share of energy in the total expenditure of the poorest households was 16.9% in
2014, being almost twice as high as the EU average and up from 13.9% in 2005, implying that energy
affordability for poorer households is a significant issue in the country. This can be explained by
relatively low purchasing power in the country and relatively high energy consumption in the
residential sector in EU comparison, pointing to low energy efficiency performance. At the same time
the share of households (in the total population at-risk-of poverty) being unable to keep home
adequately warm was only slightly higher in Hungary than the EU average in 2015 and measurably
decreased since 2005.
(Source: Ad-hoc data collection of DG ENER based on HBS with the support of Eurostat and national statistics)

Energy Union –Hungary
11
4. Energy efficiency and moderation of demand
Since 2005 primary energy consumption in Hungary decreased by 8.5% and reached 23.3 Mtoe in
2015. Over the same period, final energy consumption decreased by 5%, to 17.3 Mtoe in 2015. While
primary energy consumption in 2015 was below the indicative 2020 national target (24.1 Mtoe),
further efforts are needed in order to attain the final energy consumption target (14.4 Mtoe) until
2020, bearing in mind that in 2015 both primary and final energy consumption temporarily rose
compared to the previous year, going against the decreasing trend since 2005.
(Source: Eurostat)
Although primary energy intensity in Hungary decreased over the 2005-2015 period, it remained
significantly above EU average (about 90% higher in 2015), which indicates an unexploited
improvement potential. Primary energy intensity in Hungary decreased by 1.6% on annual average
between 2005 and 2015, whereas in the EU on it decreased by 2%, implying that difference in energy
intensity remained constant. A detailed sectorial assessment can illustrate these trends.
In 2015 the residential sector was the biggest energy consumer in Hungary, representing 34% of the total final energy consumption, followed by transport and industry (about 25% both). The residential sector had a higher share in the final consumption than the EU average, whereas in the case of transport the opposite is true.
(Source: Eurostat)

Energy Union –Hungary
12
As for industry, in 2015 the energy intensity was significantly higher than the EU average (153 vs. 92
toe/EUR million) and was up by 19% compared to 2005, while during the same period average EU
final energy intensity in the industry decreased by 18%. In the services sector, though practically
halving since 2005, energy intensity in Hungary in 2015 was almost twice as much as the EU average.
However, final energy intensity in the residential sector (measured as consumption per square
meter, with climate correction) has slightly decreased11 over the last decade; it was above the EU
average in 2015, whereas in 2005 it was close to the EU average.
(Source: Eurostat) (Source: Eurostat) (Source: Odyssee database)
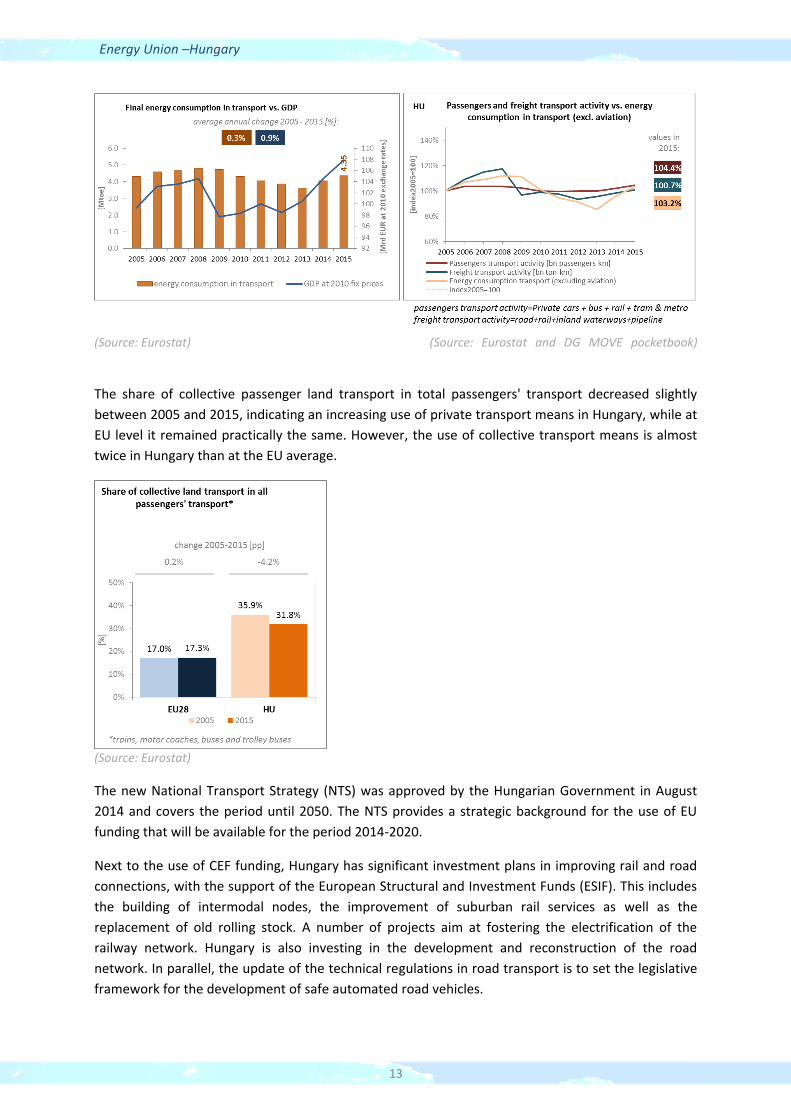
Although showing a favourable trend, there is still room for energy efficiency improvements in the residential sector in Hungary. During the funding period of 2014-2020, approx. EUR 949 million will be granted to energy efficiency programmes for buildings from European Structural Investment Fund (ESIF). Current and planned levels of support for residential building renovation do not seem to be sufficient to achieve the targets of the 2015 long-term building renovation strategy12. While the strategy foresees renovating 700,000 households by 2020, only 25,000 households are planned to be renovated under ESIF, since Hungary plans to reallocate ESIF grants for 50,000 to public buildings. There is significant energy saving potential in modernisation of district heating systems and in broader deployment of combined heat and power generation (CHP). Between 2005 and 2015 the final energy consumption in transport recorded an average annual
increase of 0.3% in Hungary, which was lower than the 0.9% average annual increase of the GDP.
Behind the slight increase in energy consumption in transport divergent trends could be observed in
this period: while passenger transport activity increased by 4.4%, freight transport activity decreased
by 0.7%.
11 According to the Odyssee database energy consumption in the residential sector in 2005 was: 21.06 koe/m2, while in 2015 it decreased to 20.93 koe/m2 12 https://ec.europa.eu/energy/sites/ener/files/documents/2014_article4_hungary_en%20translation.pdf
Energy Union –Hungary
13
(Source: Eurostat) (Source: Eurostat and DG MOVE pocketbook)
The share of collective passenger land transport in total passengers' transport decreased slightly
between 2005 and 2015, indicating an increasing use of private transport means in Hungary, while at
EU level it remained practically the same. However, the use of collective transport means is almost
twice in Hungary than at the EU average.
(Source: Eurostat)
The new National Transport Strategy (NTS) was approved by the Hungarian Government in August
2014 and covers the period until 2050. The NTS provides a strategic background for the use of EU
funding that will be available for the period 2014-2020.
Next to the use of CEF funding, Hungary has significant investment plans in improving rail and road
connections, with the support of the European Structural and Investment Funds (ESIF). This includes
the building of intermodal nodes, the improvement of suburban rail services as well as the
replacement of old rolling stock. A number of projects aim at fostering the electrification of the
railway network. Hungary is also investing in the development and reconstruction of the road
network. In parallel, the update of the technical regulations in road transport is to set the legislative
framework for the development of safe automated road vehicles.

Energy Union –Hungary
14
5. Decarbonisation of economy
5.1. GHG emissions
The implementation of National Climate Change Strategy 2008‐2025 resulted in notable
achievements in reaching GHG reduction targets. Hungary has met its Kyoto and EU obligations rate-
proportionally. Hungary’s total greenhouse gas (GHG) emissions decreased by 34.2% compared to
199013, and were down by 19.6% compared to the level of 2005. This decline in greenhouse gas
emissions is not only correlated with the economic transition after the collapse of heavy industry of
the communist era. Around half of the aggregate decline in GHG emissions is related to the
diminishing role of coal in electricity generation (by replacing it with other sources, including nuclear)
and to the applied climate policy measures, also exerting their impact over the past fifteen years. The
country is right on track in meeting its 2020 emission target under the Effort Sharing Decision: in
2016 emissions in the non-ETS sectors (including transport, buildings and agriculture) were already
24 pps.14 below the 2016 target and are projected to be 29 pps.15 below the 2020 target (which
allows for a 10% increase of non-ETS emissions compared to 2005 emission levels).
(Source: EC and EEA)
In 2016, the GHG intensity of the Hungarian economy was significantly higher than the EU average
(by more than 70%), however, since 1990 it decreased more in Hungary than the average decrease in
the EU. In 2016, the GHG emissions per capita in Hungary were about 30% below the EU average, as
compared to the 25% gap in 1990.
In 2015 in the largest sectors in Hungary in terms of GHG emissions were the energy sector (24% of
the total GHG emissions), followed by transport (20%), industry and product use (19%), residential
and commercial sectors (17.5%) and agriculture, forestry and fishery (13.2%).
13 If LULUCF is included, GHG emissions were down by 40.3% in 2015, compared to 1990. 14 Based on approximated inventory data. 15 Taking into account the effect of the Commission Decision 2017/1471/EU, dated on the 10th of August 2017, which resulted in a recalculated 2020 target (in absolute terms). 2020 emissions projections were taken from Member States 2017 submissions under the MMR regulation (quality checked by EEA).

Energy Union –Hungary
15
(Source: EC and EEA)
Preliminary accounts under the Kyoto Protocol for Hungary show overall removals of -3.0 Mt CO2-eq.
as an annual average in the period 2013-2015. For comparison, the annual average of the EU-28
accounted for removals of -119.0 Mt CO2-eq. It should be noted that in this preliminary simulated
accounting exercise, removals from Forest Management did by far not exceed the accounting cap.
Removals by Afforestation are clearly higher than emissions by Deforestation. Removals by Forest
Management show an evolving importance becoming by far the largest contributor in 2015. Overall,
there is a clearly increasing trend in removals, due to the above-noted increasing removals by Forest
Management. Deforestation shows slight increases in emissions and removals by Afforestation a
varying pattern over the course of the three-year period.
Note: Forest Management credits are capped and presented as yearly averages when the total Forest Management credits of the considered period exceed the simulated cap over the same period. (source: EC and EEA)

Energy Union –Hungary
16
CO2 emissions in transport and alternative fuelled vehicles
In Hungary, the CO2 emissions from road transport were in 2015 about 51 % higher than in 1990,
reflecting the consistent increase of passengers and freight traffic.
In 2016 average CO2 emissions of new cars in Hungary were above the EU average. The decrease
between 2005 and 2016 in Hungary (19.4%) was less than the average decrease in the EU (27.3%),
implying that the structure of new car sales followed less intensively the shift towards vehicles with
lower emission in Hungary than in the EU as a whole.
(source: European Environment Agency)
The share of electric and hybrid-electric cars in total sales on the Hungarian market is at around
0.25% of total cars sales in 2015 (i.e. 70 petrol-electric cars and 121 electric cars). Over the last four
years the number of electric charging points in Hungary has increased steadily, from 63 units in 2013
to 205 units in 2016.
(European Environment Agency) (European Alternative Fuels Observatory)
National Policy Frameworks under Directive 2014/94/EU on alternative fuels infrastructure have to
establish targets, objective and measures for the development of the market of alternative fuels in

Energy Union –Hungary
17
the transport sector and the deployment of the relevant infrastructure. Hungary has submitted its
National Policy Framework16 as requested under article 3 of the Directive 2014/94/EU
A detailed assessment of the Hungarian National Policy Framework in terms of its compliance with
the requirements of Directive 2014/94/EU on alternative fuels infrastructure, its contribution to
achievement of long-term energy and climate objectives of the Union and coherence of its targets
and objectives in terms of cross-border continuity has been published as part of the Communication
on Alternative Fuels Action Plans (COM(2017)652) and the related staff working document
SWD(2017)365.
5.2. Adaptation to climate change
The first National Climate Change Strategy (NCCS I) from 2008 included a chapter on adaptation and
was implemented by a National Climate Change Programme for 2009-2010. A revised strategy (NCCS
II) is planned for adoption in autumn 2017 and will comprise a National Adaptation Strategy. The
current NCCS contains projections and incentives concerning adaptation in the following sectors:
natural environment, health, water management, agriculture, crop and livestock management, forest
management, regional development, human/built environment. NCCS II will add to the list regional
development, urban planning, green infrastructure, critical infrastructure and tourism. Currently
there is no system in place17 for monitoring mainstreaming of adaptation into specific sectorial
policies, or assessing adaptation actions that are being implemented.
5.3. Taxes on energy and transport and fossil fuel subsidies
The overall tax burden on energy and transport in relation to GDP has decreased in Hungary from 2.6% in 2007 to 2.4% in 2014. That is from 0.3 p.p. above the EU average to be on par with the EU average. The tax burden on transport vehicles is in line with EU average, whereas the taxation of transport fuel is above the EU average. The taxation of heat and electricity is in contrast below the EU average and has only changed slightly since 2007. Hungary has no CO2 component in the taxation framework for energy products or vehicles.
16 The so-called Jedlik Ányos Plan
17 On the basis of the EU’s Greenhouse gas Monitoring Mechanism Regulation (MMR) member states are required to provide GHG projections called for 2015, 2020, 2025, 2030, 2035 and, if available, each year in between. Hungarian authorities were able to monitor future GHG emission scenarios and identify those problematic economic sectors using MMR projections that have a potential for permanently increasing GHG emission. This gives a chance for the introduction of new mitigation and adaptation measures.

Energy Union –Hungary
18
(Source: Eurostat)
Hungary stopped direct subsidies to coal production in 2000. Moreover, in line with EU regulation on
state support for uncompetitive coal mines, Vértes Power Plant Zrt. received financial assistance
between 2011 and 2014 in order to cover operating losses, as well as between 2011 and 2018 to
mitigate social and regional problems arising from mine closures18. However, it has to be noted that
fossil fuel subsidies in Hungary also consist of increasing subsidies to gas and petrol.
5.4. Renewable energy
Regarding the share of renewable energy, Hungary is right on track in meeting its overall 2020 target
as set under the Renewable Energy Directive (2009/28/EC). In 2015 the share of renewables in the
country's gross final energy consumption was 14.5%, which was above the official 13% target for
18 For example, it received HUF 42,247 million (approximately €140 million) of public funding for the closure its
uncompetitive Márkushegy coal mine at the end of 2014. The plan includes measures to mitigate the environmental impact of the production of coal (http://ec.europa.eu/competition/state_aid/cases/246728/246728_1415478_129_2.pdf).

Energy Union –Hungary
19
2020, specified in the Renewable Energy Directive (2009/28/EC) and was close to the target of
14.65%, which Hungary voluntarily endeavoured for.
(Source: Eurostat-SHARES)
In the case of the renewable target in the transport sector, Hungary has still to make significant efforts to attain the 2020 target; in 2015 the renewable share indicator stood at 6.2%. Both in the renewable share in transport and electricity generation only minor increases could be observed over the last few years, and biomass had a dominant role in renewable electricity generation, while other sources, such as solar, geothermal or wind generation had lesser importance, which provides for an untapped potential for better exploitation, in order to increase variable renewable penetration in the electricity generation mix. However, current renewable policies in Hungary do not favour wind energy, as licensing of new wind farms face significant regulatory obstacles.
(Source: Eurostat-SHARES)
The newly proposed support system for electricity generation from renewable sources (METÁR)
seems to introduce a fundamental reform following the old feed-in tariff system (KÁT). In METÁR for
renewable generation capacities below 0.5 MW, MAVIR (the Hungarian electricity TSO) will take over
the generated power and the electricity will be sold on the Hungarian Power Exchange (HUPX) while
generators receive a guaranteed feed-in price. For new generation capacities between 0.5 MW and
1.0 MW an administrative premium will be paid above the reference price determined by law. The
length of the support period and the supported yearly quantity are calculated by the Hungarian
Energy and Public Utility Regulatory Authority (HEA). For larger capacities (at least 1.0 MW) and wind
installations competitive bidding procedure will be implemented and for depreciated biomass and
biogas generation capacities a so-called brown premium will be introduced, in order to keep biomass

Energy Union –Hungary
20
firing competitive vis-á-vis fossil fuels. The new METÁR system provides operating aid for renewable
sources and it should fulfil the requirements of EU state aid guidelines.
Due to a consistent deployment of renewables since 2005, it is estimated that Hungary avoided in
2015 about 11.2% of the fossil fuel in gross inland consumption and about 8.9% of GHG emissions at
national level19.
(Source: EEA)
5.5. Contribution of the Energy Union to better air quality
Air quality in Hungary continues to give cause for concern. For the year 2013, the European
Environment Agency estimated that more than 12,890 premature deaths in Hungary were
attributable to fine particulate matter (PM2,5) concentrations and more than 390 to nitrogen dioxide
(NO2) concentrations20.
For both pollutants Hungary reported exceedances of the binding EU air quality standards21. For the year 2015, Hungary reported exceedances of the limit value for PM10 in 4 out of the 10 air quality zones in Hungary, while exceedances of the limit value for PM2.5 were reported in 1 zone, and of the limit value for NO2 in 2 out of the 10 zones; see figure below22.
19 Avoided GHG emissions mentioned here have a theoretical character as these contributions do not necessarily represent
'net GHG savings per se' nor are they based on life-cycle assessment or full carbon accounting. 20 European Environment Agency, 2016, Air Quality in Europe – 2016 Report, table 10.2. The report also includes details as regards the underpinning methodology for calculating premature deaths. 21 Directive 2008/50/EC of the European Parliament and of the Council of 21 May 2008 on ambient air quality and cleaner air for Europe, OJ L 152, 11.6.2008, p.1-44 22 Compliance data as reported by the Member States as part of their official annual air quality report for the calender year 2015 (available on the European Environment Agency's (EEA) Eionet/Central Data Repository), http://cdr.eionet.europa.eu/hu/eu/aqd

Energy Union –Hungary
21
(Source: EEA)
The health-related external costs from air pollution in Hungary have been estimated to be more than
EUR 5 billion/year (income adjusted, 2010), which includes the intrinsic value of living a healthy life
without premature death as well as the direct costs to the economy such as healthcare costs and lost
working days due to sickness caused by air pollution23.
The Energy Union can substantially contribute to addressing these air quality problems through measures reducing emissions of both GHG and air pollutants such as PM and nitrogen oxides (NOx) from major contributing sectors such as (road) transport, energy production, industry and residential heating (e.g. stoves and boilers) as shown in figure below24.
(Source: EEA. This table reflects only sources of primary PM2,5 emissions.)
23 See also the EU Environmental Implementation Review Country Report for Hungary, SWD(2017)46 final of 3.2.2017 24 National emission data as reported by the Member States to the EEA (available on the EEA's Eionet/Central Data Repository), http://cdr.eionet.europa.eu/hu/eu/nec_revised

Energy Union –Hungary
22
6. Research, innovation and competitiveness
6.1. Research and innovation policy
Priorities for energy research and innovation in Hungary include the development of nuclear power,
regional cooperation, renewable energy, energy efficiency, and diversification of energy imports and
fuel storage facilities. Focal research areas in renewable energy include biomass, second-generation
biofuels and geothermal energy (e.g. enhanced geothermal systems). Research on nuclear mainly
targets nuclear fission and waste disposal.
Hungary is not a very active contributor to the ongoing work of the Strategic Energy Technology (SET)
Plan. It only participates in two (out of fourteen) temporary working groups for the implementation
of the integrated SET Plan, the ones dedicated to carbon capture and storage/use and nuclear safety.
Regarding the Horizon 2020 programme, Hungary has received so far 0.4% of the EU contribution
devoted to the 'secure, clean and efficient energy' part of the programme. As of September 2017,
thirty-eight participations from Hungarian organisations have been awarded EUR 7.8 million in
Horizon 2020 energy projects.
The majority of the EU contribution is attributed for participation in Low Carbon Energy projects
(55%) followed by Energy Efficiency and savings measures (40%). Hungarian involvement in the
Smart Cities and Communities projects is amounting to 5% of the total funding received by Hungarian
partners.
6.2. Investments and patents in the Energy Union R&I priorities
In 2016, public (national) investments in the Energy Union R&I priorities reached EUR 27 million,
almost three times the amount reported in 201525. The largest share of these investments (70%) was
attracted by the Smart System priority of the Energy Union, followed by the Efficient Systems and
Renewables priorities (15% and 13% respectively). In 2014, the most recent year for which data from
most Member States are available, public investment per GDP was lower than the EU average.
Private investment in the Energy Union R&I priorities in 2013 was estimated at EUR 31 million (0.2%
of the private R&I investment in Energy Union R&I priorities in the EU). The focus was on Sustainable
transport, which received 55% of these investments, followed by Efficient Systems with a share of
28% and Renewables with 17%.
In 2013, the most recent year for which complete patent26 statistics are available, 9 companies and
research organisations based in Hungary filed 11 patents in low-carbon energy technologies (0.16%
of the EU total). The focus was on Sustainable Transport (51%), followed by Efficient Systems (31%)
and Renewables (18%).
25 Due to a change in the reporting methodology, the MS is revising data up to 2012. It has not been concluded whether
this data will be changed or discarded, thus they have not been included here. Data for 2016 are provisional. 26 In the context of this document, the term 'patent' refers to patent families, rather than applications, as a measure of
innovative activity. Patent families include all documents relevant to a distinct invention (e.g. applications to multiple authorities), thus preventing multiple counting. A fraction of the family is allocated to each applicant and relevant technology.

Energy Union –Hungary
23
In 2014, private R&I investments and patents in Energy Union R&I priorities were lower than the EU
average when normalised by GDP and by population respectively. In the period 2007-2013, both
private R&I investments and the number of patents in Energy Union R&I priorities have increased on
average by 4% and 14% per year, displaying slightly lower rates of increase than the EU indicators
(6% and 15% respectively).
Note: Due to a change in methodology, only data for the period 2013 - 2016 are shown. The international
comparison (right) is shown for 2014 (Hungary had reported EUR 6.7 million). Reporting at EU for 2015 level is
not as complete, and very few countries have reported for 2016.
(Data sources: Public investment as available in the International Energy Agency RD&D Statistics database27 for
codes relevant to Energy Union RIC priorities. Patent data based on the European Patent Office PATSTAT
database28. Private investment as estimated by JRC SETIS. Detailed methodology available from the JRC29.)
27 http://www.iea.org/statistics/RDDonlinedataservice/ 28 https://www.epo.org/searching-for-patents/business/patstat.html#tab1 29 https://setis.ec.europa.eu/related-jrc-activities/jrc-setis-reports/monitoring-ri-low-carbon-energy-technologies

Energy Union –Hungary
24
6.3. Competitiveness
In 2014 real unit energy costs (RUEC)30 in Hungary, expressed as percent of the total value added,
were significantly higher than the EU average (21.2% vs.15.3%), almost three times as high as those
in the US (7.5%), comparable with those in Japan but measurably below those in Japan and China.
Between 2005 and 2014 the relative increase in real unit energy costs was much lower in Hungary
(2.4%) than in the EU on average (11.5%), which points to improvements in energy intensity in the
Hungarian manufacturing industry, largely owing to the increasing importance of less energy
intensive manufacturing branches (e.g.: cars and transport vehicles). However, energy costs
compared to the total production value were still higher in Hungary and the EU in 2014, both in
manufacturing industry and the services sector.
Retail electricity prices paid by industrial customers in Hungary were below the EU and OECD
averages in the second half of 2016. However, in the case of the largest industrial consumers the
average price paid in Hungary was of similar magnitude with the EU average.
Gas prices for industrial consumers were similar to the EU average, both for medium and large
consumers. However, they were significantly higher than the OECD average.
It is worth recalling here that national average retail prices paid by industrial customers, especially in
the case of electricity prices for large customers, might not reflect the actual prices paid in given
industries (e.g.: energy intensive industries), as they do not include the impact of tax and policy levy
exemptions and reductions these industrial players are entitled for.
(Source: ECFIN) (Source: EU and IEA)
Regarding the competitiveness in renewable technology, Hungary is neither specialised in solar PV
nor in wind as measured by the revealed comparative advantage indicator below 131. An exception is
power electronics for solar photovoltaic panels where Hungary enjoys some advantage over its
30
This indicator measures the amount of money spent on energy sources needed to obtain one unit of value added.
31 The RCA index for product "i" is defined as follows: RCAi =
Xj,i
∑ Xj,iiXw,i
∑ Xw,ii
where X is the value of exports, and j is the country and
w is the reference group, the World economy. 2005 refers in the text to the indicator average over the 2000-2009 period, while 2015 represents the average over the 2010-2016 period. The same applies for the RTB indicator - see below.

Energy Union –Hungary
25
competitors. The relative trade balance32 confirms the comparative advantage indicator and shows
that Hungary is a net importer of both wind and solar energy components. Its relative trade deficit is
lower than the EU average for solar energy components, while it is above the EU average for wind
energy components. The latter shows a strong deterioration in the period from 2005 to 2015.
(Source: UN Comtrade)
7. Regional and local cooperation
The EU macro-regional strategy for the Danube Region in which Hungary takes part can be used as a
basis for regional cooperation on energy. Hungary is a co-coordinator of the priority area 'To
encourage more sustainable energy'. In 2017 Hungary is holding the rotating presidency of the EU
Strategy for the Danube Region. European Territorial Cooperation – 'Interreg' – under EU cohesion
policy also provides further opportunities for cross-border, transnational and interregional
cooperation, including in the Energy Union areas.
Hungary participates in the work of the Central East South Europe Gas Connectivity (CESEC) High
Level Group, operational since February 2015, having the aim of implementing a regional priority
natural gas infrastructure roadmap in order to improve interconnections and security of supply. One
important CESEC related project for Hungary is the LNG evacuation pipeline Croatia-Hungary, which
is to enable evacuation of gas from the planned Croatian LNG terminal to regional markets via
Hungary.
The Czech, Slovak and Hungarian day-ahead electricity wholesale markets have been coupled since
September 2012, and Romania also joined in 2014 (4M MC coupling area), establishing an available
transfer capacity (ATC) based implicit capacity allocation mechanism.
32 The RTB indicator for product "i" is defined as follows: RTBi =
Xi−Mi
Xi+Mi where Xi is the value of product's "i" exports and Mi
imports.
Energy Union –Hungary
26
Hungary actively participates in the energy cooperation dimension of the Visegrad 4 Group (V4).
From July 2017 to June 2018, Hungary is holding the rotating Presidency of the Visegrad Group for
the fifth time. V4 aims at regional integration of the energy markets in particular for the gas and
electricity sectors, and with the Allegro project in the nuclear research sector, which is aimed at
demonstrating the operability and technological feasibility of gas cooled fast reactors.
Cities and urban areas have a key role in the energy and climate challenge. The Urban Agenda for the EU, established by the Pact of Amsterdam in May 2016, better involves cities in the design and implementation of policies, including those related to the Energy Union. It is implemented through Partnerships, in which the Commission, Member States, cities and stakeholders work together on a number of important areas, including on Energy Transition, Urban Mobility, Air Quality, Climate Adaptation and Housing.
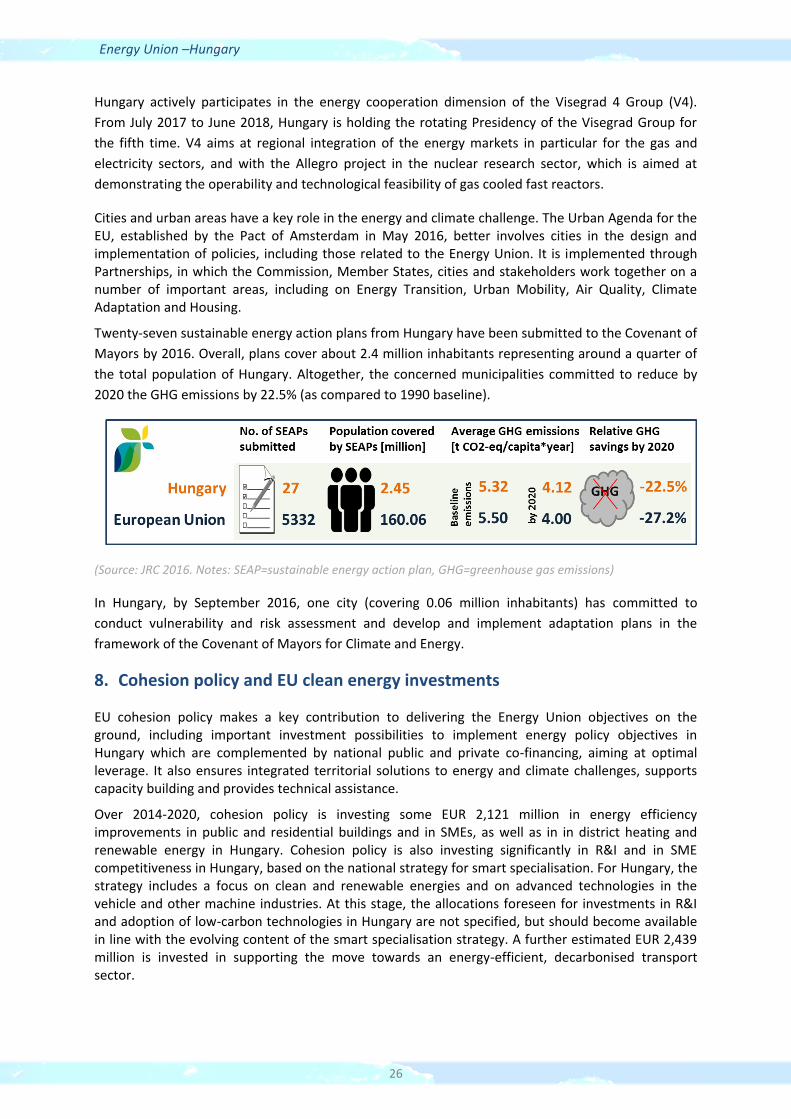
Twenty-seven sustainable energy action plans from Hungary have been submitted to the Covenant of
Mayors by 2016. Overall, plans cover about 2.4 million inhabitants representing around a quarter of
the total population of Hungary. Altogether, the concerned municipalities committed to reduce by
2020 the GHG emissions by 22.5% (as compared to 1990 baseline).
(Source: JRC 2016. Notes: SEAP=sustainable energy action plan, GHG=greenhouse gas emissions)
In Hungary, by September 2016, one city (covering 0.06 million inhabitants) has committed to
conduct vulnerability and risk assessment and develop and implement adaptation plans in the
framework of the Covenant of Mayors for Climate and Energy.
8. Cohesion policy and EU clean energy investments
EU cohesion policy makes a key contribution to delivering the Energy Union objectives on the ground, including important investment possibilities to implement energy policy objectives in Hungary which are complemented by national public and private co-financing, aiming at optimal leverage. It also ensures integrated territorial solutions to energy and climate challenges, supports capacity building and provides technical assistance.
Over 2014-2020, cohesion policy is investing some EUR 2,121 million in energy efficiency improvements in public and residential buildings and in SMEs, as well as in in district heating and renewable energy in Hungary. Cohesion policy is also investing significantly in R&I and in SME competitiveness in Hungary, based on the national strategy for smart specialisation. For Hungary, the strategy includes a focus on clean and renewable energies and on advanced technologies in the vehicle and other machine industries. At this stage, the allocations foreseen for investments in R&I and adoption of low-carbon technologies in Hungary are not specified, but should become available in line with the evolving content of the smart specialisation strategy. A further estimated EUR 2,439 million is invested in supporting the move towards an energy-efficient, decarbonised transport sector.

Energy Union –Hungary
27
(Source: DG REGIO)
These investments are expected to contribute to around 24,000 households with improved energy consumption classification, a decrease of around 103,200,000 kWh per year of primary energy consumption of public buildings, around 1,840 MW of additional capacity of renewable energy production, as well as to around 470 km of reconstructed or upgraded railway lines, 130 km of new or improved tram and metro lines and 50 km of new or improved inland waterways. Overall, the EU cohesion policy investments in Hungary over 2014-2020 are expected to contribute to an estimated annual decrease of GHG emissions of around 2,964,000 tonnes of CO2eq.
For example, until recently Budapest Zoological and Botanical Garden was almost entirely reliant on expensive and sometimes unreliable supplies of Russian gas to meet its heating requirements. But a recently completed project co-financed by the European Regional Development Fund (ERDF) has enabled the Zoo to take advantage of its closeness to a source of geo-thermal water of Széchenyi Bath 1,000 meters under the ground. Total investment for the project was HUF 315 million (approximately EUR 1 million), of which the ERDF contributed HUF 189 million (EUR 630,000).
As another example, the construction of a biogas facility in Békés county represented a total project
cost of HUF 1.3 billion (approximately EUR 4 million), of which cohesion policy funding contributed
with approximately EUR 2 million. The plant's built-in power output is 1,190 kW and its thermal
output is 1,170 kW.
So far only one European Fund for Strategic Investments (EFSI) infrastructure project has been
approved and signed in Hungary. Supported by the EFSI guarantee, the European Investment Bank is
providing a EUR 42 million loan to energy and resource efficiency investments in sugar and starch
plants in Hungary and Austria, including upgrade of a bio-ethanol production unit in Austria and
construction of a new sugar packaging plant in Hungary.
Through its support to sustainable transport systems, the Connecting Europe Facility (CEF) also
contributes to the goals of the Energy Union. Following the Hungarian participation in the CEF –
Transport 2014-2015 Calls, the Hungarian action portfolio comprises twenty-seven signed grant
agreements, allocating EUR 1,071 million of actual CEF Transport Funding to Hungarian beneficiaries
(state-of-play February 2017)33. The transport mode which receives the highest share of funding is
rail (80.2% of actual funding). All Hungarian rail actions aim at eliminating important bottlenecks
33 Note that European Economic Interest Groups and International Organisations are excluded from the analysis.

Energy Union –Hungary
28
along the three core network corridors crossing the country, i.e. the Mediterranean, the Rhine
Danube and the Orient East-Med corridors. They will ensure increased capacity, improved service
quality, safety and security and contribute to the modal shift of passengers and freight from road to
rail.
The overall objective of the Hungarian road actions is to develop an efficient and competitive road
transport network by addressing bottlenecks which are currently limiting traffic along the three core
network corridors crossing Hungary and thereby contributing to the reduction of operating costs and
improving safety and security. Hungary is also active in inland waterways (IWW), with actions aiming
at establishing a good navigation status along the Hungarian section of the Danube mainly by
eliminating important bottlenecks along the Rhine Danube core network corridor and to foster LNG
use in inland navigation sector, contributing to the European alternative fuels implementation
strategy. The IWW actions cover a wide range of activities which will increase safety as well as
reliability of navigation thus contributing to the modal shift of freight from road to inland
waterways.34
34 Source: INEA