Embed Size (px)
Citation preview
JOINT LEGISLATIVE AUDIT AND REVIEW COMMISSION
Commonwealth of VirginiaJune 7, 2021
Report to the Governor and the General Assembly of Virginia
Trade and Transportation Incentives Economic Development Incentives Evaluation Series
COMMISSION DRAFT

JLARC Report 550©2021 Joint Legislative Audit and Review Commission
http://jlarc.virginia.gov
Joint Legislative Audit and Review CommissionDelegate Kenneth R. Plum, ChairSenator Janet D. Howell, Vice Chair
Delegate Terry L. Austin Delegate Betsy B. CarrDelegate M. Kirkland CoxDelegate Eileen Filler-CornDelegate Charniele L. HerringSenator Mamie E. LockeSenator Jeremy S. McPikeSenator Thomas K. Norment, Jr.Delegate Robert D. Orrock, Sr.Delegate Mark D. SicklesSenator Lionell Spruill, Sr.Delegate Luke E. Torian
Staci Henshaw, Auditor of Public Accounts
JLARC staff Hal E. Greer, DirectorKimberly Sarte, Associate Director for Ongoing Oversight and Fiscal AnalysisEllen Miller, Chief Economic Development and Quantitative AnalystInformation graphics: Nathan Skreslet
Economic analysisTerance J. Rephann, Regional EconomistWeldon Cooper Center for Public Service
Contents
Summary i
Recommendations and Policy Options v
Trade and Transportation Incentives 1
1. Rail Transportation Incentives 3
2. Airline and Aircraft Repair Incentives 13
3. Ships and Vessels Exemption 27
4. Port Incentives 33
5. International Trade Assistance Programs 51
Appendixes
A. Study mandate 61
B. Research methods and activities 63
C. Economic benefits and return in revenue for all Virginia incentives 76 reviewed to date
D. Railroad common carrier and rolling stock exemptions by state 79
E. Airline and aircraft repair incentives by state 83
F. Airlines serving Virginia airports 88
G. Aircraft repair employment by state 90
H. Ships and vessels exemptions by state 93
I. Port incentive awards by region and locality 96
J. Port-related incentives by state 98
K. VALET and Trade Show Assistance Program awards by locality 104
L. Agency responses 106
Appendixes – Online only
M. Economic impact modeling
N Results of economic and revenue impact analysis
O. References

Commission draft i
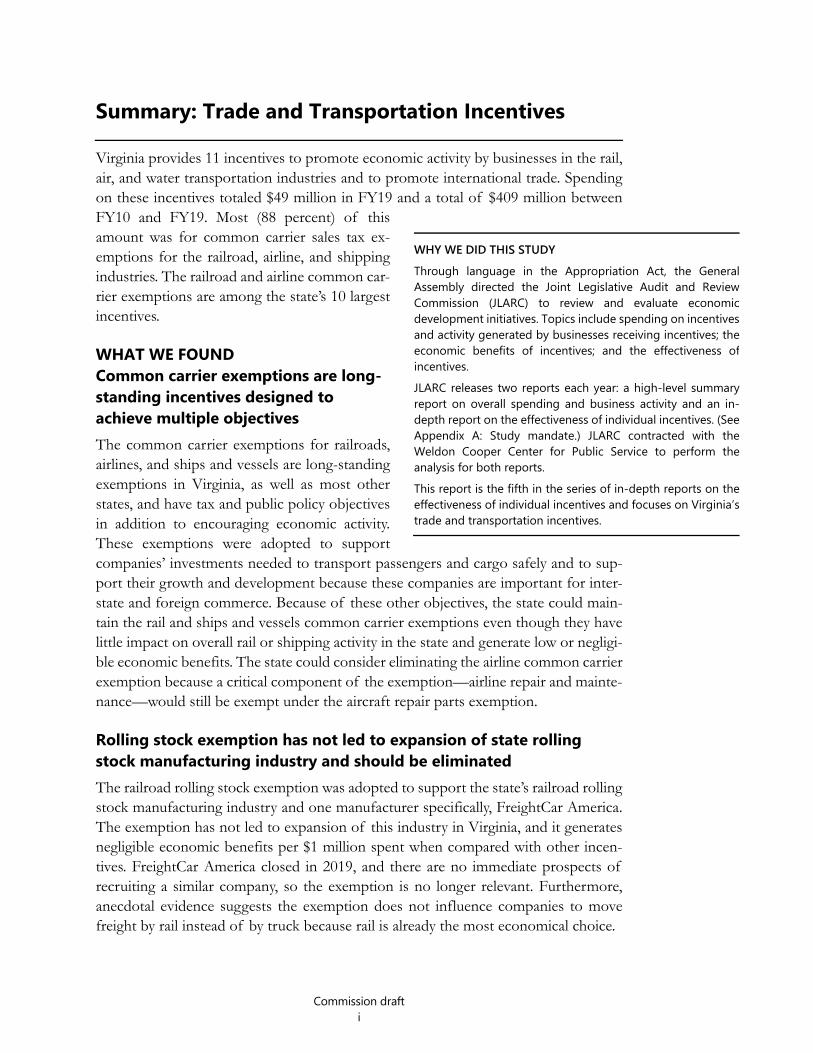
Summary: Trade and Transportation Incentives Virginia provides 11 incentives to promote economic activity by businesses in the rail, air, and water transportation industries and to promote international trade. Spending on these incentives totaled $49 million in FY19 and a total of $409 million between FY10 and FY19. Most (88 percent) of this amount was for common carrier sales tax ex-emptions for the railroad, airline, and shipping industries. The railroad and airline common car-rier exemptions are among the state’s 10 largest incentives.
WHAT WE FOUND Common carrier exemptions are long-standing incentives designed to achieve multiple objectives The common carrier exemptions for railroads, airlines, and ships and vessels are long-standing exemptions in Virginia, as well as most other states, and have tax and public policy objectives in addition to encouraging economic activity. These exemptions were adopted to support companies’ investments needed to transport passengers and cargo safely and to sup-port their growth and development because these companies are important for inter-state and foreign commerce. Because of these other objectives, the state could main-tain the rail and ships and vessels common carrier exemptions even though they have little impact on overall rail or shipping activity in the state and generate low or negligi-ble economic benefits. The state could consider eliminating the airline common carrier exemption because a critical component of the exemption—airline repair and mainte-nance—would still be exempt under the aircraft repair parts exemption.
Rolling stock exemption has not led to expansion of state rolling stock manufacturing industry and should be eliminated The railroad rolling stock exemption was adopted to support the state’s railroad rolling stock manufacturing industry and one manufacturer specifically, FreightCar America. The exemption has not led to expansion of this industry in Virginia, and it generates negligible economic benefits per $1 million spent when compared with other incen-tives. FreightCar America closed in 2019, and there are no immediate prospects of recruiting a similar company, so the exemption is no longer relevant. Furthermore, anecdotal evidence suggests the exemption does not influence companies to move freight by rail instead of by truck because rail is already the most economical choice.
WHY WE DID THIS STUDY Through language in the Appropriation Act, the General Assembly directed the Joint Legislative Audit and ReviewCommission (JLARC) to review and evaluate economicdevelopment initiatives. Topics include spending on incentives and activity generated by businesses receiving incentives; theeconomic benefits of incentives; and the effectiveness of incentives. JLARC releases two reports each year: a high-level summary report on overall spending and business activity and an in-depth report on the effectiveness of individual incentives. (See Appendix A: Study mandate.) JLARC contracted with the Weldon Cooper Center for Public Service to perform theanalysis for both reports. This report is the fifth in the series of in-depth reports on the effectiveness of individual incentives and focuses on Virginia’s trade and transportation incentives.
Summary: Trade and Transportation Incentives
Commission draft ii
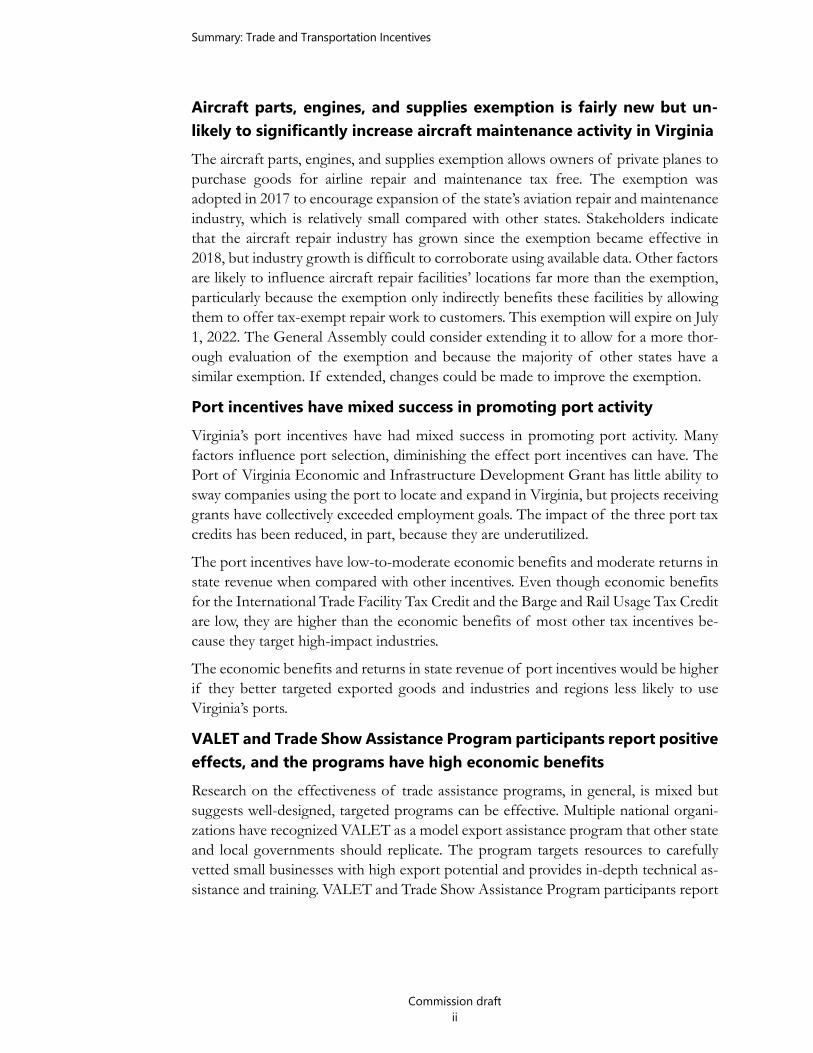
Aircraft parts, engines, and supplies exemption is fairly new but un-likely to significantly increase aircraft maintenance activity in Virginia The aircraft parts, engines, and supplies exemption allows owners of private planes to purchase goods for airline repair and maintenance tax free. The exemption was adopted in 2017 to encourage expansion of the state’s aviation repair and maintenance industry, which is relatively small compared with other states. Stakeholders indicate that the aircraft repair industry has grown since the exemption became effective in 2018, but industry growth is difficult to corroborate using available data. Other factors are likely to influence aircraft repair facilities’ locations far more than the exemption, particularly because the exemption only indirectly benefits these facilities by allowing them to offer tax-exempt repair work to customers. This exemption will expire on July 1, 2022. The General Assembly could consider extending it to allow for a more thor-ough evaluation of the exemption and because the majority of other states have a similar exemption. If extended, changes could be made to improve the exemption.
Port incentives have mixed success in promoting port activity Virginia’s port incentives have had mixed success in promoting port activity. Many factors influence port selection, diminishing the effect port incentives can have. The Port of Virginia Economic and Infrastructure Development Grant has little ability to sway companies using the port to locate and expand in Virginia, but projects receiving grants have collectively exceeded employment goals. The impact of the three port tax credits has been reduced, in part, because they are underutilized.
The port incentives have low-to-moderate economic benefits and moderate returns in state revenue when compared with other incentives. Even though economic benefits for the International Trade Facility Tax Credit and the Barge and Rail Usage Tax Credit are low, they are higher than the economic benefits of most other tax incentives be-cause they target high-impact industries.
The economic benefits and returns in state revenue of port incentives would be higher if they better targeted exported goods and industries and regions less likely to use Virginia’s ports.
VALET and Trade Show Assistance Program participants report positive effects, and the programs have high economic benefits Research on the effectiveness of trade assistance programs, in general, is mixed but suggests well-designed, targeted programs can be effective. Multiple national organi-zations have recognized VALET as a model export assistance program that other state and local governments should replicate. The program targets resources to carefully vetted small businesses with high export potential and provides in-depth technical as-sistance and training. VALET and Trade Show Assistance Program participants report
Summary: Trade and Transportation Incentives
Commission draft iii
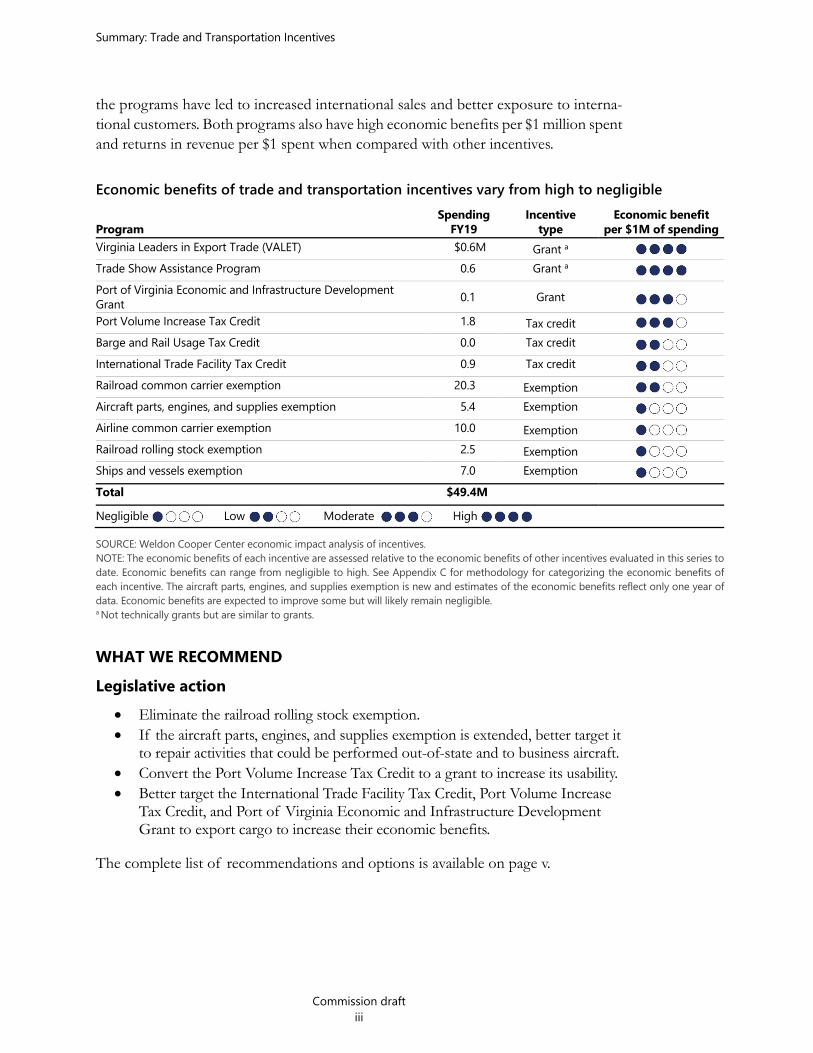
the programs have led to increased international sales and better exposure to interna-tional customers. Both programs also have high economic benefits per $1 million spent and returns in revenue per $1 spent when compared with other incentives.
Economic benefits of trade and transportation incentives vary from high to negligible
Program Spending
FY19 Incentive
type Economic benefit
per $1M of spending Virginia Leaders in Export Trade (VALET) $0.6M Grant a Trade Show Assistance Program 0.6 Grant a Port of Virginia Economic and Infrastructure Development Grant 0.1 Grant Port Volume Increase Tax Credit 1.8 Tax credit Barge and Rail Usage Tax Credit 0.0 Tax credit International Trade Facility Tax Credit 0.9 Tax credit Railroad common carrier exemption 20.3 Exemption Aircraft parts, engines, and supplies exemption 5.4 Exemption Airline common carrier exemption 10.0 Exemption Railroad rolling stock exemption 2.5 Exemption Ships and vessels exemption 7.0 Exemption Total $49.4M Negligible Low Moderate High
SOURCE: Weldon Cooper Center economic impact analysis of incentives. NOTE: The economic benefits of each incentive are assessed relative to the economic benefits of other incentives evaluated in this series to date. Economic benefits can range from negligible to high. See Appendix C for methodology for categorizing the economic benefits of each incentive. The aircraft parts, engines, and supplies exemption is new and estimates of the economic benefits reflect only one year of data. Economic benefits are expected to improve some but will likely remain negligible. a Not technically grants but are similar to grants.
WHAT WE RECOMMEND Legislative action
Eliminate the railroad rolling stock exemption. If the aircraft parts, engines, and supplies exemption is extended, better target it
to repair activities that could be performed out-of-state and to business aircraft. Convert the Port Volume Increase Tax Credit to a grant to increase its usability. Better target the International Trade Facility Tax Credit, Port Volume Increase
Tax Credit, and Port of Virginia Economic and Infrastructure Development Grant to export cargo to increase their economic benefits.
The complete list of recommendations and options is available on page v.

Summary: Trade and Transportation Incentives
Commission draft iv
Commission draft v
Recommendations and Policy Options: Trade and Transportation Incentives
JLARC staff typically make recommendations to address findings during reviews. Staff also sometimes propose policy options rather than recommendations. The three most common reasons staff propose policy options rather than recommendations are: (1) the action proposed is a policy judgment best made by the General Assembly or other elected officials, (2) the evidence indicates that addressing a report finding is not necessarily required, but doing so could be beneficial, or (3) there are multiple ways in which a report finding could be addressed and there is insufficient evidence of a single best way to address the finding.
Recommendations
RECOMMENDATION 1 The General Assembly may wish to consider eliminating the railroad rolling stock ex-emption.
RECOMMENDATION 2 If the General Assembly extends the expiration of the aircraft parts, engines, and sup-plies exemption, it may wish to consider amending § 58.1-609.10 of the Code of Vir-ginia to restrict eligibility of the exemption to certified Federal Aviation Administra-tion repair facilities in the state or maintenance, repair, and overhaul facilities that employ a minimum number of workers.
RECOMMENDATION 3 If the General Assembly extends the expiration of the aircraft parts, engines, and sup-plies exemption, it may wish to consider amending § 58.1-609.10 of the Code of Vir-ginia to restrict eligible aircraft to licensed or nonscheduled airline carriers, or to a minimum take-off weight threshold, to exclude repairs to personal use aircraft from qualifying for the exemption.
RECOMMENDATION 4 The General Assembly may wish to consider amending sections §§ 58.1-439.12:06, 58.1-439.12:10, and 62.1-132.3:2 of the Code of Virginia to better target the Interna-tional Trade Facility Tax Credit, Port Volume Increase Tax Credit, and Port of Virginia Economic and Infrastructure Development Grant, respectively, to export cargo.
Recommendations and Options: Trade and Transportation Incentives
Commission draft vi
RECOMMENDATION 5 Virginia Port Authority (VPA) staff should develop a proposal, in consultation with the Virginia Economic Development Partnership’s (VEDP) Project Review and Credit Committee and other stakeholders, to better align the Port of Virginia Economic In-frastructure and Development Grant with best practices and guidelines used by VEDP’s economic development incentives. VPA staff should report their proposal and necessary statutory changes to the House Finance, House Appropriations, and Senate Finance & Appropriations committees by November 1, 2022.
RECOMMENDATION 6 The General Assembly may wish to consider amending § 58.1-439.12:10 of the Code of Virginia to convert the Virginia Port Volume Increase Tax Credit to a grant to increase its usability and to better target it to companies in geographic regions and industries less likely to use Virginia ports.
RECOMMENDATION 7 The General Assembly may wish to consider amending § 58.1-439.12:06 of the Code of Virginia to increase the value of the International Trade Facility Tax Credit for job creation.
RECOMMENDATION 8 The Virginia Port Authority (VPA) staff, in consultation with the Virginia Economic Development Partnership and other stakeholders as necessary, should develop a pro-posal to combine the Port of Virginia Economic and Infrastructure Development Grant and the International Trade Facility Tax Credit into one robust discretionary grant program. VPA staff should report their proposal to the House Finance, House Appropriations, and Senate Finance & Appropriations committees by November 1, 2022.
Policy options to consider
POLICY OPTION 1 The General Assembly could consider eliminating the airline common carrier exemp-tion.
POLICY OPTION 2 The General Assembly could consider extending the expiration of the aircraft parts, engines, and supplies exemption to July 1, 2025 and making substantive changes to improve the exemption.

Commission draft 1
Trade and Transportation Incentives Economic Development Incentives Evaluation Series
Virginia provides economic development incentives to encourage business growth as part of its economic development strategy. To better understand the effectiveness of these incentives in stimulating business activity, the General Assembly directed the Joint Legislative Audit and Review Commission (JLARC) to conduct, on a continuing basis, an evaluation of the effectiveness and economic benefits of economic develop-ment incentives such as grants, tax preferences, and other assistance. (See Appendix A for the study mandate.) This report is part of a series of annual reports that provide comprehensive information about effectiveness and economic benefits of individual economic development incentives offered by the state. JLARC contracted with the University of Virginia’s Weldon Cooper Center for Public Service to perform the eval-uation.
This report focuses on 11 incentives in the trade and transportation industries (Table). Five incentives are designed primarily to benefit businesses within the rail, air, and water transportation industries or businesses that use these transportation modes. Three of these transportation exemptions are “common carrier exemptions,” which were originally adopted to demonstrate the state’s commitment to the development and growth of commercial enterprises in Virginia because they serve the general public and are important in interstate and foreign commerce. Two other transportation in-centives expand some exempt items under the railroad and airline common carrier exemptions to aircraft and railroad rolling stock owners.
Six incentive programs examined for this report focus on international trade. Four incentives—one grant and three tax credits—are designed to encourage increased use of Virginia ports to export or import cargo. Two programs provide international trade assistance to help businesses develop and expand their international export markets.
State spending on these 11 incentives totaled $409 million over the past decade (FY10 to FY19), or an average of $41 million per year. The common carrier exemptions for railroads and airlines are by far the largest of the incentives evaluated in this report and are among the state’s 10 largest incentives in terms of spending. (See Economic Development Incentives 2020, JLARC 2020).
Spending on these 11 incentives has grown more slowly than other incentives, and their share of total incentive spending decreased from FY10 through FY19. These incentives made up a third of the state’s spending on economic development in FY10 ($53 million out of $159 million). Their share decreased to one-quarter of spending in FY19 ($75 million out of $319 million) because spending on these incentives has grown at a much slower rate (41 percent) compared with spending for all incentives (100 percent) during the time period. The transportation-related sales tax exemptions
For purposes of this re-port, spending on incentives refers to (1) actual expenditures by the state in the form of grant awards and (2) tax expenditures in the form of forgone rev-enue, through tax credits or sales and use tax ex-emptions.

Trade and Transportation Incentives
Commission draft 2
benefit relatively mature, stable, slow-growing industry sectors, which expand and con-tract modestly in response to business activity and other factors. Future growth of these 11 incentives will be limited for similar reasons and because the port-related tax incentives are collectively capped at $5 million per year.
TABLE: Virginia’s 11 trade and transportation industry incentives are covered in this report
Program Spending
FY10–FY19
Purpose International
trade Transportation Railroad common carrier exemption $205.6M Airline common carrier exemption 95.1 Ships and vessels exemption 60.9 Railroad rolling stock exemption 22.6 Port Volume Increase Tax Credit 8.0 Aircraft parts, engines, and supplies exemption 5.4 Virginia Leaders in Export Trade (VALET) 4.0 Port of Virginia Economic and Infrastructure Development Grant 3.6 International Trade Facility Tax Credit 2.3 Trade Show Assistance Program 1.7 Barge and Rail Usage Tax Credit 0.6 All programs $409.1M SOURCE: Weldon Cooper Center review of Code of Virginia and agency documents NOTE: Spending on grants includes amounts for projects that have completed or have reached milestones and received payments, and tax credits includes amounts claimed.
Trade and Transportation Incentives
Commission draft 3
1. Rail Transportation Incentives Virginia offers two sales and use tax exemptions to support the rail transportation industry in the state. The railroad common carrier exemption allows railroads operat-ing in Virginia to purchase goods used to provide their services, such as locomotives, railcars, railway structures, and repair parts, tax free (Table 1-1). The railroad rolling stock exemption extended the exemption of locomotives and railcars (rolling stock) to companies like manufacturers and utilities that transport their goods by rail. Though these companies contract with railroads to transport their goods, they own an esti-mated 50 to 60 percent of rolling stock in Virginia.
The railroad common carrier exemption was adopted in 1978 for several reasons, in-cluding to encourage rail investment. However, the exemption has other tax and public policy objectives beyond encouraging economic activity. The exemption was adopted to ensure that railroads were not unfairly taxed compared with other common carriers. Other common carriers, such as airlines, ships, and motor carriers, had been exempt from the state sales and use tax since 1966, when the sales and use tax was adopted. Railroads were granted the exemption after substantive changes to state tax require-ments for railroads and federal regulations were adopted that prohibited discrimina-tory state taxation of railroads.
Common carrier exemptions in Virginia and other states were adopted when transpor-tation companies were regulated and fare prices were set by regulatory bodies. These exemptions were granted to reduce the costs of providing transportation services in light of the regulated fares, ensuring necessary services would be available. Although the transportation industries have been deregulated and prices are no longer set, these entities still serve a public role because they must exercise the “highest degree of care for the safety of their passengers,” according to the Virginia Supreme Court (Common-wealth v. United Airlines, 1978) and must accept any person or load. Common carrier exemptions also support the growth and development of these transportation indus-tries, which are important to interstate and foreign commerce.
The railroad rolling stock exemption was adopted in 2007 to encourage capital invest-ment in railroad rolling stock, and specifically, according to stakeholders, to support FreightCar America, a freight railcar manufacturer, which had recently located in Ro-anoke. Although FreightCar America was not the direct user of the exemption, the company would benefit because the incentive would make it less expensive for busi-nesses to purchase their rail cars.
A common carrier is a company that transports goods or people accord-ing to defined and pub-lished routes, time schedules, and rate ta-bles. Public airlines, rail-roads, bus lines, taxicab companies, trucking companies, and other freight companies gen-erally operate as com-mon carriers. Their ser-vices are available to the general public, which sets it apart from con-tract carriers, which transport goods or peo-ple for certain clients, or private carriers.
The Railroad Revitaliza-tion and Regulatory Re-form Act of 1976 pro-hibits states from enact-ing taxes that discrimi-nate against the railroad industry in favor of other forms of transportation. States that tax the rail-road industry at higher rates, or do not provide the industry with tax ex-emptions similar to those allowed for other forms of transportation, may face legal chal-lenges.
Trade and Transportation Incentives
Commission draft 4

Trade and Transportation Incentives
Commission draft 5
TABLE 1 -1 Virginia provides two incentives to support rail transportation industries Railroad Common Carrier Exemption (adopted 1978)
Purpose Promote maintenance and expansion of the railroad system in Virginia and provide similar tax treatment as other common carriers.
Eligibility Railroads operating in Virginia as common carriers of property or passengers. Amtrak is technically eligible, but it uses another exemption.
Exemption features
Exempts tangible personal property purchased or leased by a railroad operating as a common carrier for use or consumption in providing the service. Applies to railway and associated structures (such as track, switches, and right-of-ways); locomotives, rolling stock, working equipment; diesel fuel; tangible personal property used in repair and maintenance; and equipment and tangible personal property used directly in railroad operations.
Railroad Rolling Stock Exemption (adopted 2007)
Purpose Encourage capital investment in railroad rolling stock to support a rolling stock manufacturer.
Eligibility Companies that purchase or lease rolling stock in Virginia directly from a rolling stock manufacturer. Railroads are technically eligible, but their purchases of rolling stock are already exempt by their common carrier exemption.
Exemption features
Exempts purchases and leases of locomotives, autocars, and railroad cars (box cars, open cars, tank cars, refrigerator cars, flat cars, etc.).
SOURCE: Weldon Cooper Center review of the Code of Virginia and agency documents. NOTE: Authorized by §§ 58.1-609. 3(3) and 58.1-609. 3(16) of the Code of Virginia.
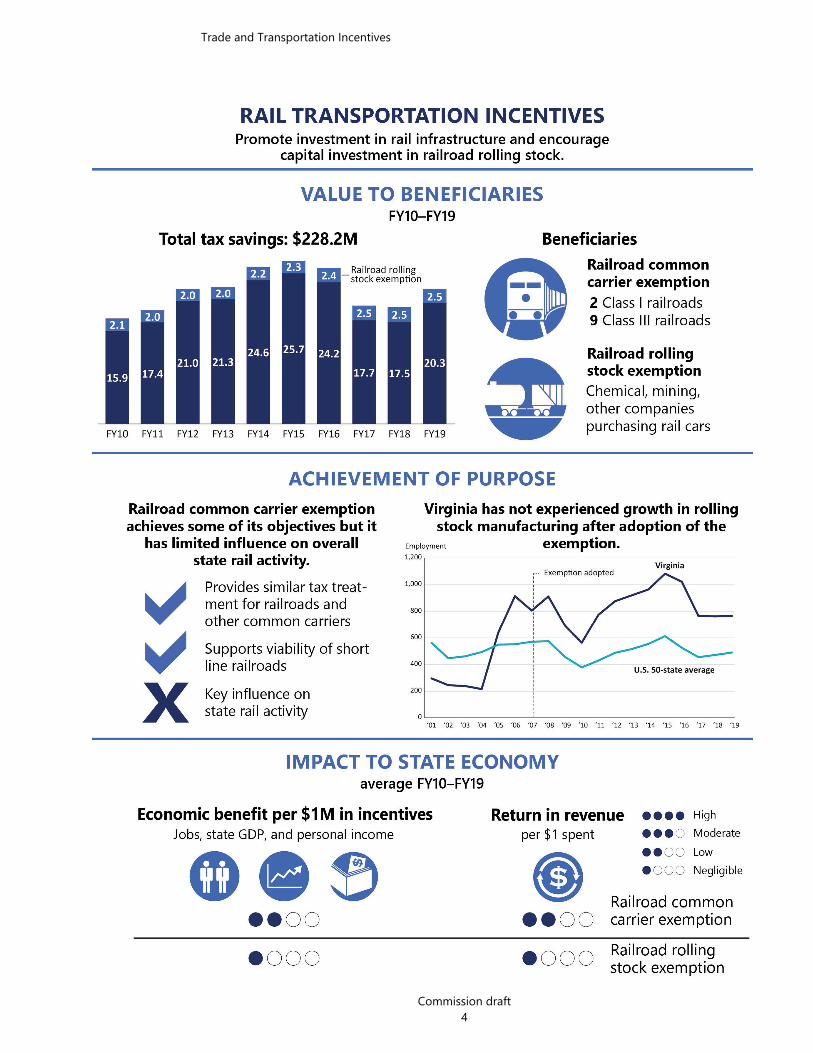
Railroads and companies purchasing rolling stock saved $23 million in taxes per year because of the rail transportation exemptions Tax savings from the railroad common carrier exemption and railroad rolling stock exemption totaled $228 million during the 10-year period from FY10 to FY19. This equates to about $23 million per year, on average.
The railroad common carrier exemption accounted for most of the tax savings to businesses ($206 million total or $21 million per year). The beneficiaries of this ex-emption are Virginia’s two Class I, or mainline, railroads (Norfolk Southern and CSX) and nine Class III, or short line, railroads, which range in size from 10 to over 200 miles of track. Class II, or regional, railroads would also qualify for the exemption but none operate in Virginia. Tax savings from the rolling stock exemption totaled $23 million over the 10-year period, or about $2 million per year, and benefited companies such as chemical manufacturers and mining and utility companies.
Railroad common carrier exemption achieves some of its objectives but has limited influence on overall state rail activity The railroad common carrier exemption achieves several public policy and tax policy objectives. However, other factors appear to have more influence on the rail industry in Virginia than the railroad common carrier exemption.
The Surface Transporta-tion Board designated railroads as Class I, II, or III, according to size. Short line railroads tend to be concentrated in ru-ral areas and serve as a distribution and feeder system for the overall freight network, gener-ally handling the “first mile and last mile.” Virginia’s short line rail-roads include the Buck-ingham Branch Railroad, Chesapeake & Albe-marle Railroad, Chesa-peake Western Railroad, Commonwealth Railway, Norfolk & Portsmouth Co. Belt Line, North Car-olina & Virginia Railroad, Shenandoah Valley Rail-road, Winchester & Western Railroad, and Delmarva Central Rail-road (ceased operation in 2019).
Trade and Transportation Incentives
Commission draft 6
Railroad common carrier exemption helps support railroad industry, established common carrier tax parity, and has societal and tax policy benefits The exemption provides tax relief to the railroad industry given its important role in transporting passengers and cargo safely and in interstate and foreign commerce. The exemption also reduces the cost for railroads to invest in improvements necessary to move passengers and cargo safely. Unlike the trucking industry, railroads build, main-tain, and operate their own private transportation infrastructure, which in Virginia, also is used by publicly supported passenger rail.
The exemption, which was established 12 years after the other common carrier tax exemptions, brought tax parity to all three common carriers, reducing the state’s expo-sure to legal challenges of disparate treatment among the carriers.
Increased rail investment supported by the exemption also has societal benefits. Both freight and passenger rail transportation generally impose lower environmental and social costs compared with most other transportation modes (e.g., truck transporta-tion, air transportation). Rail passenger and freight use can reduce congestion, decrease pollution, increase public safety, and reduce road pavement damage. The private rail network also provides complementary use for passenger rail systems such as Amtrak and Virginia Railway Express at reduced rates. Railroads may help diffuse congestion in the urban crescent because Virginia’s railroads also reach lesser developed, rural regions.
The exemption also aligns with principles of a good tax system by improving tax ad-ministration, enforcement, and efficiency. Because mainline railroads operate nation-ally, it is more difficult to assign purchases, usage, and repair of locomotives and rolling stock equipment to one state. The exemption helps avoid tax pyramiding whereby taxes are applied to the same product during multiple stages of production. These cumulating taxes are often embedded in the final sale of a good or service, resulting in higher consumer costs.
Railroad common carrier exemption important to strengthen short line railroads’ viability and encourage capital investment in railroads Mainline and short line railroad representatives emphasized the rail common carrier exemption is critical to the viability of short line railroads. Short line railroads link local and regional industrial customers and some areas of the Port or Virginia to Virginia’s mainline railways. Many short lines were spun off from Class I railroads to maintain branch lines or light-density lines that were unprofitable. Short line railroads are mar-ginally profitable, spending more of their revenue on capital investment than mainline railroads (approximately 40 percent of revenues compared with an average of 16 per-cent for mainlines). Eliminating the exemption would increase the financial strain on short lines and could cause some of them to be abandoned. Short line railroads con-tinue to take over the operation of unprofitable, abandoned Class I rail lines, and elim-inating the exemption may make this more difficult for them to do.
Trade and Transportation Incentives
Commission draft 7
Mainline railroads indicate the railroad common carrier exemption supports capital investment in costly projects. The exemption made it easier for railroads to invest in freight expansion projects like the National Gateway and Heartland Corridor and safety improvements like Positive Train Control, without deferring other maintenance projects. The exemption also improves the feasibility of future capital investment for projects that would benefit the public, such as track upgrades between Richmond and Washington, the Bristol to Richmond “Dominion Express” rail in the I-81 corridor, better service to Hampton Roads, and links from Richmond to Raleigh through Southside Virginia. Most other states provide a similar exemption, so railroads would be less likely to purchase equipment and conduct repairs in Virginia without the ex-emption.
In addition, the exemption helps the railroads compete with the trucking industry. Rail activity has shifted away from coal toward intermodal cargo, which is more cost sen-sitive than traditional sectors. Railroads have been required to invest more on infra-structure to remain competitive with the trucking industry, and railroads expect this trend to continue.
Industrial production and trade have greater influence on rail activity than the railroad common carrier exemption Rail industry reports indicate that types of industry and trade are among the key fac-tors that influence rail activity and employment in a region. Bulk commodities, such as coal, chemicals, and stone, are more economical to transport by rail, so the presence of industries that produce them can substantially increase the demand for rail trans-portation in a state. Research has not examined tax incentives’ influence on rail activity, but the railroad common carrier exemption likely has limited influence compared with these factors.
Virginia has a lower level of rail-dependent industrial production, such as chemical manufacturers and mining companies, compared with other states. This likely explains why Virginia’s concentration of rail industry employment is slightly below the national average (location quotient of 0.95 in 2019). States with high concentrations of rail employment (location quotients of 3.0 or higher) have a heavy presence of mining activity (Montana, North Dakota, and Wyoming) or export substantial amounts of agricultural products (Nebraska). Even though the Port of Virginia is a substantial contributor to Virginia’s rail activity (34 percent of port cargo was transported by rail in 2019), it does not offset the lower level of rail-dependent industrial production in Virginia.
Virginia’s rail employment has also declined at a faster rate than national rail employ-ment over the past 20 years, likely because Virginia’s coal industry—a heavily rail de-pendent industry—has also experienced sharper declines. (See Infrastructure and Regional Incentives, JLARC 2020.) Virginia’s rail transportation employment declined 22 percent compared with 5.5 percent nationally. According to railroad representatives, coal once
Location quotient indi-cates how concentrated an industry or occupa-tion is in a region com-pared to the national av-erage. A location quotient above 1.0 indicates the industry or occupation in a region is more concen-trated than the national average. A location quo-tient below 1.0 indicates it is less concentrated.
The National Gateway and Heartland Corridor projects improved rail connections between East Coast ports and the Midwest by upgrading bridges and tunnels to allow taller double-stacked container freight trains.
Positive Train Control includes technologies designed to automati-cally stop a train before certain accidents related to human error occur.
Intermodal cargo uses two or more modes, or carriers, to transport goods (freight) from shipper to the receiver. Special standardized containers are used for intermodal transport of cargo on trucks, freight trains, and ships.

Trade and Transportation Incentives
Commission draft 8
represented as much as 50 percent of Virginia’s freight rail business but now represents just 15 percent.
Rolling stock exemption has not led to expansion of state rolling stock manufacturing industry The rolling stock exemption was established in 2007 reportedly to support railcar man-ufacturing operations at FreightCar America in Roanoke. Sales attributable to the ex-emption, however, have not been sufficient to sustain the company’s operations, and the company closed in 2019. The state no longer has a rolling stock manufacturer.
Virginia did not experience growth in the railroad rolling stock industry after the ex-emption was introduced in 2007 (Figure 1-1). Most of the employment growth in the rolling stock industry (which largely reflects parts and components and other rail equipment manufacturers) occurred before 2007, with nearly 700 jobs added between 2004 and 2006. Employment in the industry fell in 2009 and 2010 in tandem with the national recession, increased between 2010 and 2015, but then dropped below its 2006 level by 2019. From 2006 to 2019, Virginia’s rolling stock industry decreased 16 per-cent compared with a nationwide decrease of 11 percent. Industry employment will likely decrease further with the closure of FreightCar America. (Virginia has several rolling stock manufacturing suppliers that are included in industry employment.)
FIGURE 1-1 Rolling stock exemption has not led to expansion of rolling stock manufacturing industry in Virginia
SOURCE: Weldon Cooper Center analysis of Economic Modeling Systems, Inc. (EMSI) employment data for the rail-road rolling stock industry.
The rolling stock exemption likely will not lead to growth of the rolling stock manu-facturing industry in Virginia. While Virginia had a slightly higher concentration in this

Trade and Transportation Incentives
Commission draft 9
industry than the national average, it did not benefit from a cluster of industry manu-facturers, and the concentration is likely lower now with the closure of FreightCar America. Major U.S. freight rail car manufacturers are located in states with the highest industry concentration (Pennsylvania, Arkansas, South Carolina, and Alabama).
The rolling stock exemption benefits manufacturers or other companies, such as power and waste management companies, when they purchase or lease locomotives or railroad cars. (Though Virginia no longer has a rolling stock manufacturer, Virginia would still have taxing jurisdiction when companies have rolling stock delivered to Virginia.) However, the exemption was not created to provide a benefit to these pur-chasers of railroad cars, and the exemption has little influence on their decision to use rail for cargo. Most of these companies ship bulk commodities for which rail is already the most economical modal choice.
Railroad common carrier has low economic benefit, and the economic benefits of the railroad rolling stock exemption are negligible The railroad common carrier exemption and railroad rolling stock exemption are esti-mated to have generated additional economic activity for the state between FY10 and FY19. The majority of the new activity is generated by the railroad common carrier exemption. Estimates show that each year private sector employment increased by 498 jobs, state GDP increased by $65 million, and statewide personal income increased by $47 million because of the exemption. The railroad rolling stock exemption each year is estimated to have increased private sector employment by four jobs and statewide personal income by $0.25 million. The state lost $0.45 million in Virginia GDP each year during the time period because of the exemption (Table 1-2).
When assessed per $1 million spent on incentives, the economic benefits of the rail-road common carrier exemption are low compared with the economic benefits across other incentives, including grants. The return in state revenue for every $1 spent on the exemption is also low. (See Appendix C for more detail on the comparison of economic benefits and the return in revenue generated by Virginia incentives.) How-ever, the economic benefits and return in revenue are higher than the majority of other tax incentives evaluated so far in this series. Of the 21 tax incentives evaluated so far, only seven have higher economic benefits per $1 million spent. Only six of these tax incentives also generate higher returns in state revenue per $1 spent. Economic bene-fits and the return in revenue generated by the railroad common carrier exemption are likely higher than many other tax incentives because some of the capital purchases (such as lumber for railroad ties) and labor for track construction and maintenance are Virginia-based, meaning the multiplier effect is higher.
Economic impact analysis of incentive spending between FY10 and FY19 was conducted using economic model-ing software developed by REMI, Inc. (See Appendix M [online only] for the economic impact analysis used in this study.)

Trade and Transportation Incentives
Commission draft 10
Table 1-2 Railroad common carrier has low economic benefit, and the economic benefits of the railroad rolling stock exemption are negligible (FY10–FY19) Annual average FY10–FY19 Railroad common
carrier exemption Railroad rolling stock
exemption Net impact to Virginia economy Private employment 498 jobs 4 jobs Virginia GDP $65.1 M ($0.4 M) Personal income $46.5 M $0.3 M Impact to Virginia economy per $1 million of incentives Private employment 32 jobs 10 jobs Virginia GDP $4.2 M $0.8 M Personal income $3.1 M $0.9 M Impact to state revenue Total revenue $4.6 M $0.1 M Incentive awards $20.6 M $2.3 M Revenue net of awards ($15.9 M) ($2.2 M) Return in revenue 23¢ for every $1 spent 4¢ for every $1 spent SOURCE: Weldon Cooper Center economic impact analysis of amount of incentive spending between FY10 and FY19. NOTE: Includes direct, indirect, and induced impacts. Gross impact on Virginia’s economy is used to calculate impact per $1 million in incentive awards. This is consistent with how the economic development research literature typically calculates these impacts. (See Appendix N [online only] for detailed results on total impact of the incentives, impact of raising income taxes by the amount of the incentives [opportunity cost], and revenue generated by source.)
The economic benefits per $1 million spent on the railroad rolling stock exemption and the return in state revenue per $1 spent are both negligible compared with other incentives. (See Appendix C for more detail on the comparison of economic benefits generated by Virginia incentives.) Though negligible, the economic benefits and return in state revenue are in line with many other tax incentives evaluated. Both are negligible because most of the capital spending is for equipment produced outside Virginia.
Rail common carrier exemption could be maintained, but the railroad rolling stock exemption should be eliminated The railroad common carrier exemption could be maintained. The exemption achieves several of its objectives, including providing tax parity with other common carriers, thereby reducing legal challenges of discriminatory state taxation against railroads. The exemption also reduces railroads’ costs for maintaining and building their own infra-structure and supports their importance in interstate commerce. While the exemption is not a major factor influencing rail activity in the state, it helps maintain the existence of short line railroads, and railroads indicate tax savings help them make capital in-vestments, which can help reduce congestion and road pavement damage, decrease pollution, and increase public safety. Though the railroad industry is deregulated and no longer has to charge set rates, railroads common carriers still must “accept any
Net impact is the increase in economic activity induced by the incentives after adjusting for the opportunity cost of increasing taxes to pay for the incentives. (See Appendix N [online only] for information on the total economic im-pact and the opportunity cost of increasing taxes.)

Trade and Transportation Incentives
Commission draft 11
proper load along their route.” Furthermore, most states have a railroad common car-rier exemption and mainline railroads, in particular, can easily shift purchases of equip-ment and supplies to other states.
In contrast, the General Assembly should eliminate the railroad rolling stock exemp-tion. With the closure of FreightCar Roanoke and no immediate prospects of recruit-ing a similar company to Virginia, the exemption is no longer relevant in supporting the recruitment, expansion, or retention of a major railroad rolling stock manufacturer. Anecdotal evidence also suggests companies using the exemption are not shifting freight from truck transportation to rail because of the exemption. Eliminating the exemption could provide revenue to spend on programs better designed to encourage companies to use rail transportation (Rail Industrial Access Program or Barge and Rail Usage Tax Credit) or alternatively to provide infrastructure assistance for short line railroads (Rail Preservation Fund).
RECOMMENDATION 1 The General Assembly may wish to consider eliminating the railroad rolling stock ex-emption.
Trade and Transportation Incentives
Commission draft 12

Trade and Transportation Incentives
Commission draft 13
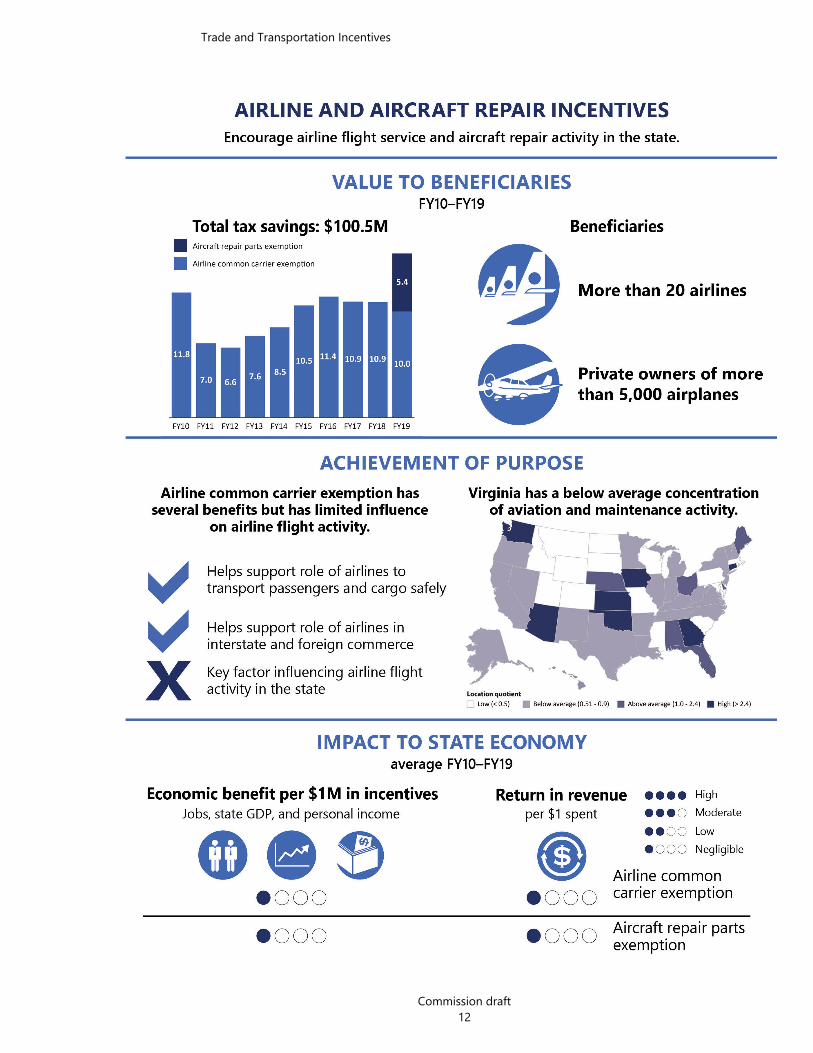
2. Airline and Aircraft Repair Incentives Virginia has two sales tax exemptions to encourage airline flight service and aircraft repair activity in the state. The airline common carrier exemption allows commercial airlines providing regularly scheduled flights to and from Virginia airports to purchase goods required for flight services and goods for airline repair and maintenance tax free. The aircraft parts, engines, and supplies (aircraft repair parts) exemption extends the exemption for purchasing goods for airline repair and maintenance to owners of other aircraft (Table 2-1).
The airline common carrier exemption was created in the 1966 legislation that estab-lished the sales and use tax. The exemption is designed to increase commercial airline activity and support maintenance and repair operations for common carriers, but like other common carrier exemptions, also has objectives other than encouraging eco-nomic activity. Virginia and other states adopted the common carrier exemptions when transportation companies were regulated, and fare prices were set by regulatory bodies. These exemptions were granted to reduce the costs of providing transportation ser-vices in light of the regulated fares, ensuring necessary levels of service would be available. Although the transportation industries have been deregulated and prices are no longer set, these entities still serve a public role because they must exercise “the highest degree of care for the safety of their passengers,” according to the Virginia Supreme Court (Commonwealth v. United Airlines, 1978) and must accept any person or load along their route. Common carrier exemptions were also adopted because of the importance of transportation companies to interstate and foreign commerce.
The aircraft repair parts exemption was adopted to encourage growth of the aircraft maintenance, repair, and overhaul industry. Virginia adopted the exemption in 2017 after the Joint Commission on Technology and Science (JCOTS) recommended the creation of a sales and use tax exemption for aircraft repair because businesses were sending private aircraft out-of-state for maintenance and repair services. Other states have adopted similar aircraft repair exemptions. (See Appendix E for more infor-mation about other state incentives.) According to JCOTS, the exemption would en-courage expansion of the state’s aviation repair and maintenance industry and support the growth of the fledgling unmanned systems industry, which could also benefit from the exemption. The exemption expires July 1, 2022.
A common carrier is a company that transports goods or people accord-ing to defined and pub-lished routes, time schedules, and rate ta-bles. Public airlines, rail-roads, bus lines, taxicab companies, trucking companies, and other freight companies gen-erally operate as com-mon carriers. Common carriers’ services are available to the general public, which set them apart from contract car-riers, which transport goods or people for cer-tain clients, or private carriers.

Trade and Transportation Incentives
Commission draft 14
TABLE 2-1 Virginia provides an exemption for airline common carriers and purchases of aircraft repair parts Airline Common Carrier Exemption (adopted 1966)
Purpose Encourage commercial airline service to and from Virginia airports and support maintenance and repair operations for common carriers. Reduce costs of transporting passengers and cargo safely and recognize airline importance in interstate and foreign commerce.
Eligible beneficiaries
Airlines operating in intrastate, interstate, or foreign commerce as common carriers that provide scheduled air service on a continuing basis to one or more Virginia airports at least once per week.
Exemption features
Exempts purchases of tangible personal property sold or leased to an eligible airline; property must be used directly in its service as a common carrier. Exempted items include parts and supplies used in aircraft repair and maintenance as well as ground support equipment used outside the aircraft in support of flights such as baggage service equipment and anti-hijacking surveillance devices. Amenities such as food and related items offered to passengers during flight and other goods not used to “keep the plane in the air” are not exempt (Commonwealth v. United Airlines, 1978).
Aircraft Parts, Engines, and Supplies Exemption (adopted 2017) a Purpose Encourage growth of aviation maintenance, repair, and overhaul industry and unmanned aviation
systems.
Eligible beneficiaries
Nonscheduled (charter) airline common carriers and private (business and individual) owners of airplanes. Owners of unmanned aviation systems are also exempt. Airline common carriers are technically eligible, but their purchases of parts, engines, and supplies are already exempt under the airline common carriers exemption.
Exemption features
Tax exemption for parts, engines, and supplies used for maintaining, repairing, or reconditioning aircraft or unmanned systems. Does not cover tools, equipment, and any parts that do not become part of the aircraft. Expires July 1, 2022.
SOURCE: Weldon Cooper Center review of the Code of Virginia and agency documents. NOTE: Authorized by §§ 58.1-609. 3(6) and 58.1-609. 10(20) of the Code of Virginia. a Exemption was adopted in 2017 but became effective July 1, 2018.
Virginia provides several other tax incentives to the airline industry, but they were not evaluated for this report because this series focuses on incentives provided through the corporate income, individual income, and retail sales and use tax. Virginia provides an aircraft purchase exemption and “fly away” exemption, both of which exempt air-craft purchases from the aircraft sales and use tax. In 2020, the General Assembly created the Governor’s New Airline Service Incentive Fund, which has yet to make any awards.
Airlines and aircraft owners collectively saved $15 million in taxes in FY19 because of the airline and aircraft repair exemptions Airlines and aircraft owners collectively saved an estimated $15 million in taxes in FY19 because of the airline common carrier and aircraft repair exemptions. The airline com-mon carrier exemption is the larger of the two exemptions (estimated $10 million in

Trade and Transportation Incentives
Commission draft 15
tax savings in FY19). Total tax savings over the 10-year period from the exemption was $95 million, making it Virginia’s third-largest exemption and among Virginia’s 10 largest incentives. (See Economic Development Incentives 2020, JLARC, 2020.)
United Airlines and American Airlines are likely the largest beneficiaries of the airline common carrier exemption because they have the highest volume of passenger traffic at Virginia airports (accounting for 34 percent of departures). United has a hub (a central airport through which airlines route most of their flights) at Dulles Interna-tional Airport, and American Airlines has a hub at Reagan National Airport. Both airlines also have base maintenance facilities at their hubs where substantial aircraft repair can occur because of specialized equipment and enclosed hangars. Because of the exemption, the repair parts and supplies used at those facilities are tax exempt. Other airline carriers that serve Virginia airports benefit from the exemption, but to a lesser extent, because of lower passenger traffic or lack of a base maintenance facility in Virginia. (See Appendix F for information about airlines serving Virginia airports.).
Tax savings from the aircraft repair parts exemption are estimated to be $5.4 million in FY19. Owners of turboprop or turbojet planes, which have high average repair costs, are estimated to receive the greatest tax savings from the exemption. These own-ers are likely companies that provide unscheduled air service and companies with cor-porate jets. Owners of sport or recreation airplanes can also benefit from the exemp-tion and likely represent the largest group of beneficiaries, though repair costs, and thus their tax savings, are much lower. While owners of unmanned aircraft can also benefit from the exemption, not much is known about their utilization.
Airline common carrier exemption has several benefits even though it has limited influence on airline flight activity The airline common carrier exemption achieves some of the objectives for which it was adopted. The exemption provides tax relief to the airline industry given its im-portant roles in transporting passengers and cargo safely and supporting interstate and foreign commerce.
The airline common carrier has limited additional benefits. It does not have the envi-ronmental benefits of the railroad common carrier exemption because air travel is not environmentally friendly. The exemption does, however, improve tax administration, enforcement, and efficiency. Because airlines operate nationally and internationally, it is difficult to assign purchases, usage, and repairs to one state. The exemption elimi-nates airline decisions to shift purchases to other states just because other states ex-empt the sale. In addition, the exemption helps avoid tax pyramiding whereby taxes are applied to the same product during multiple stages of production. These cumulat-ing taxes are often embedded in the final sale of a good or service, resulting in higher costs to consumers.
The airline common carrier exemption was adopted to reduce airline costs and support lower airfares, thereby increasing airline service at Virginia airports. The exemption,
Estimates of tax savings from the airline com-mon carrier and aircraft repair parts exemption differ from prior esti-mates. A more precise method-ology was used to esti-mate the airline com-mon carrier exemption estimate for this report, and as a result, the esti-mate reported here is slightly lower than the estimate in Economic Development Incentives 2020 (JLARC). A more precise method-ology was also used to estimate the aircraft re-pair parts exemption for this report. The estimate reported here is higher than prior estimates. (See Appendix B for more detail on the methodologies used to estimate tax savings re-lated to both exemp-tions and why they differ from prior estimates.)

Trade and Transportation Incentives
Commission draft 16
however, likely has less influence on air travel demand and airline decisions about flight activity than other factors. Research shows air travel demand is sensitive to air fare prices, more so for leisure travelers and tourists traveling short distances than business travelers. Research also suggests that other factors likely have a greater effect on air travel demand. Leisure travel demand (about 50 percent of airline industry revenue) is most affected by disposable incomes and leisure time availability. Business travel de-mand is based on business activity and corporate profitability. Air cargo demand is sensitive to economic activity, demand for high value goods, input prices (in particular oil prices), and the relative prices of other transportation modes.
Several regulatory, economic, and industry factors have influenced airline decisions about flight activity over the past several decades. After deregulation of the airline industry in the 1970s, airlines adopted a hub and spoke system to optimize flight ser-vice and reduce passenger costs. Airports are more likely to be hubs if they serve regions with higher incomes, larger populations, and host business centers or tourist destinations. Although the effect of tax and other incentives on hub locations has not been studied, it seems unlikely that an incentive like the airline common carrier ex-emption would influence airline decisions on hub locations.
Over this time period, several airlines consolidated, leaving four large domestic carri-ers—Delta Airlines, United Airlines, American Airlines, and Southwest Airlines—serving 85 percent of domestic seat miles. These consolidation trends affected smaller and mid-size airports, which experienced reductions in flights or abandonment by some air carriers.
The economy has also played a large role on air service decisions. During the Great Recession of 2007–09, airlines reduced domestic flights, cut unprofitable services, such as regional flights to smaller airports, and further consolidated service in hub locations.
Both exemptions have little effect on aircraft maintenance activity Both the airline common carrier exemption and aircraft repair parts exemption reduce the cost of aircraft maintenance and repair in the state. Stakeholders view exemptions as an important tool in supporting maintenance, repair, and overhaul (MRO) industry location and expansion. While MRO facilities do not use the exemption, they benefit indirectly because they can offer tax-exempt repair work to their customers. Other factors, however, likely have a greater impact on the MRO industry than the exemp-tions.
Stakeholders indicate that Virginia has several strengths in attracting MRO activity, and that the industry has grown since Virginia adopted the aircraft repair parts exemption. Virginia’s strengths include its East Coast location, airport inventory (nine commercial service and 57 general aviation airports) with adjacent land available for development, and favorable business climate. Prior to the exemption, stakeholders indicate that most
The hub and spoke sys-tem consists of a central airport, or hub, and spokes, or flights, out of the hub. Airlines route most of their flights through a central hub, and the spoke flights take passengers to select destinations. Prior to deregulation, airlines used a direct-route, or point-to-point, system and were forced by the federal govern-ment to fly directly be-tween two small mar-kets. Many of these flights were routinely half empty, which re-sulted in airlines losing money.
An MRO facility is any location, workshop, or hangar that conducts aircraft maintenance professionally. MRO fa-cilities and technicians help keep airplanes run-ning safely and reliably through the use of air-craft ground support equipment. Airlines own and operate their own MROs and some are independently operated.
Trade and Transportation Incentives
Commission draft 17
Virginia MRO facilities were small operations providing annual inspections and rou-tine maintenance on small aircraft. Since adoption of the exemption, they report the number and size of MRO facilities have grown in Virginia, and the range of services and size of aircraft serviced has increased. According to the Virginia Aviation Business Association
Three MRO companies in Virginia each have experienced increases in annual contracts valued at greater than $500,000 in annual revenues.
Two flight schools are planning capital expansion and improvements to sup-port new avionic sales and installations and other maintenance activities.
Some MROs have expanded the types of services they offer, and some report doing more maintenance work for out-of-state customers.
Several MROs have hired new staff and plan to hire more because of in-creased work. Facilities are seeking new FAA-certified airframe and power mechanics.
Reports of increased MRO activity are difficult to corroborate using available data. Industry activity may not have increased enough to increase employment, and industry employment is not easily identified and tracked. (See Appendix G for more detail about industry employment by state and data limitations.) Moreover, it is unlikely that the exemptions will have as much influence as other factors that have affected the MRO industry in recent years, such as where MRO activity has concentrated and the in-creased outsourcing of MRO activity.
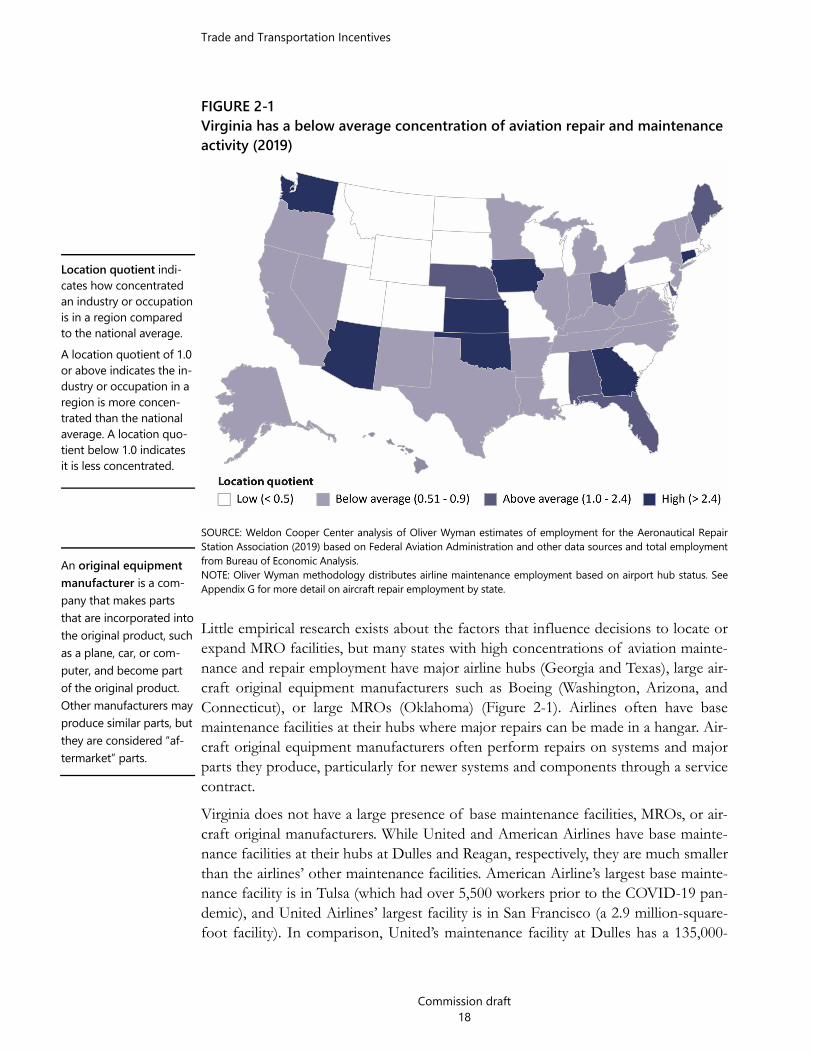
Virginia has a below average concentration of aviation repair and maintenance employment Virginia’s concentration of employment in the MRO industry is below average com-pared with other states (Figure 2-1). Virginia had an estimated 4,566 total employees in the civil aviation repair and maintenance industry in 2019, accounting for only 1.6 percent of total national employment in the industry. Virginia’s below average concen-tration is because of its low level of employment at aircraft repair facilities that are unaffiliated with airlines (location quotient of 0.27). Virginia has higher concentrations of aviation repair and maintenance employment at airline “base maintenance” repair facilities and at aircraft parts manufacturers and distributers, but only slightly higher than the national average. (See Appendix G for more detail on aircraft repair employ-ment by state.)
Trade and Transportation Incentives
Commission draft 18
FIGURE 2-1 Virginia has a below average concentration of aviation repair and maintenance activity (2019)
SOURCE: Weldon Cooper Center analysis of Oliver Wyman estimates of employment for the Aeronautical Repair Station Association (2019) based on Federal Aviation Administration and other data sources and total employment from Bureau of Economic Analysis. NOTE: Oliver Wyman methodology distributes airline maintenance employment based on airport hub status. See Appendix G for more detail on aircraft repair employment by state.
Little empirical research exists about the factors that influence decisions to locate or expand MRO facilities, but many states with high concentrations of aviation mainte-nance and repair employment have major airline hubs (Georgia and Texas), large air-craft original equipment manufacturers such as Boeing (Washington, Arizona, and Connecticut), or large MROs (Oklahoma) (Figure 2-1). Airlines often have base maintenance facilities at their hubs where major repairs can be made in a hangar. Air-craft original equipment manufacturers often perform repairs on systems and major parts they produce, particularly for newer systems and components through a service contract.
Virginia does not have a large presence of base maintenance facilities, MROs, or air-craft original manufacturers. While United and American Airlines have base mainte-nance facilities at their hubs at Dulles and Reagan, respectively, they are much smaller than the airlines’ other maintenance facilities. American Airline’s largest base mainte-nance facility is in Tulsa (which had over 5,500 workers prior to the COVID-19 pan-demic), and United Airlines’ largest facility is in San Francisco (a 2.9 million-square-foot facility). In comparison, United’s maintenance facility at Dulles has a 135,000-
Location quotient indi-cates how concentrated an industry or occupation is in a region compared to the national average. A location quotient of 1.0 or above indicates the in-dustry or occupation in a region is more concen-trated than the national average. A location quo-tient below 1.0 indicates it is less concentrated.
An original equipment manufacturer is a com-pany that makes parts that are incorporated into the original product, such as a plane, car, or com-puter, and become part of the original product. Other manufacturers may produce similar parts, but they are considered “af-termarket” parts.

Trade and Transportation Incentives
Commission draft 19
square-foot hangar and employs approximately 300 technical staff. Virginia MRO fa-cilities are generally small operations employing fewer than 40 aircraft mechanics and technicians (with two exceptions), and Virginia ranked 27th in terms of aircraft man-ufacturing employment compared with other states in 2019.
Airlines increasingly outsource their maintenance and repair work to facilities outside Virginia Airlines are increasingly outsourcing major repairs (engine overhauls, avionic/elec-tronic work, and other specialized work) to large independently owned MRO facilities. In 1990, approximately 34 percent of national airline maintenance was done by outside entities compared with 55 percent to 58 percent during the past 10 years (Figure 2-2). Maintenance and overhauls are also increasingly occurring outside of the U.S., where production costs are lower. Because of increased outsourcing to large “one stop shop” MROs and to international facilities, airline maintenance and repair employment in the U.S. has not expanded despite a large growth in airline passenger traffic during this time period. This trend is likely exacerbated in Virginia because the state lacks large MRO facilities. (All but two of the major airlines serving Virginia outsource more than 50 percent of their MRO needs. See Appendix F for more information about the per-centage of maintenance outsourced by airlines operating in Virginia.)
FIGURE 2-2 Airline outsourcing of maintenance, repair, and overhaul services has grown nationally, but industry employment has not expanded
SOURCE: Source: U.S. Department of Transportation, Form 41 Financial Reports, Schedules P-10 and P-5.2.
Trade and Transportation Incentives
Commission draft 20
Workforce preparation is reported as weakness in attracting additional MRO activity to Virginia Stakeholders indicated that workforce preparation, including workforce certification, is a significant weakness in attracting additional MRO activity to Virginia. The state currently has four airframe and power plant (A&P) mechanic programs (Aviation In-stitute of Maintenance with locations in Norfolk and Manassas, Shenandoah Commu-nity College, and Liberty School of Avionics). However, several Virginia certified MROs report having difficulties filling vacancies for A&P mechanics, suggesting that these programs may not be providing enough certified mechanics to meet demand. The industry is working with state officials and higher education entities to address workforce needs. Additional emphasis is reportedly needed to develop programs within K–12 education for Aerospace Education STEM Training and the community colleges for FAA A&P certifications.
The COVID-19 pandemic has also hurt the aviation industry, and thus the MRO work-force, with only a gradual recovery expected. Overall, the state experienced a 60 per-cent reduction in flights from October 2019 to October 2020, which resulted in less need for maintenance and repair. The long-term impacts of the pandemic on the maintenance repair workforce supply are unclear.
Airline common carrier and aircraft repair parts exemptions have negligible economic benefits and return in revenue The airline common carrier exemption and aircraft repair parts exemption are esti-mated to have generated either minimal additional economic activity, or economic losses, for the state. Estimates show that each year private sector employment in-creased by two jobs and statewide personal income increased by $0.8 million because of the airline common carrier exemption, but Virginia GDP decreased by $2 million. For the aircraft repair parts exemption, estimates show Virginia lost one job, $0.6 mil-lion in Virginia GDP, and $0.1 million in personal income each year because of the exemption (Table 2-2). These losses occur mainly because the aircraft repair parts ex-emption is new. As additional activity accrues over time, the impact to the economy should become positive, at least for some of the measures, but will likely remain min-imal.
Economic impact analysis of incentive spending between FY10 and FY19 was conducted using economic model-ing software developed by REMI, Inc. (See Appendix M [online only] for the economic impact analysis used in this study.)

Trade and Transportation Incentives
Commission draft 21
Table 2-2 Airline common carrier and aircraft repair parts exemptions have negligible economic benefits and return in revenue Annual average Airline common
carrier exemption Aircraft repair parts
exemption Net impact to Virginia economy Private employment 2 jobs (1 job) Virginia GDP ($2.0 M) ($0.6 M) Personal income $0.8 M ($0.1 M) Impact to Virginia economy per $1 million of incentives Private employment 8 jobs 4 jobs Virginia GDP $0.5 M ($0.4 M) Personal income $0.9 M $0.4 M Impact to state revenue Total revenue $0.4 M $0.01 M Incentive awards $9.5 M $0.54 M Revenue net of awards ($9.1 M) ($0.53 M) Return in revenue 4¢ for every $1 spent 2¢ for every $1 spent SOURCE: Weldon Cooper Center economic impact analysis of amount of incentive spending between FY10 and FY19 for the airline common carrier exemption and in FY19 for the aircraft repair parts exemption. NOTE: Includes direct, indirect, and induced impacts. Gross impact on Virginia’s economy is used to calculate impact per $1 million in incentive awards. This is consistent with how the economic development research literature typically calculates these impacts. (See Appendix N [online only] for detailed results on total impact of the incentives, impact of raising income taxes by the amount of the incentives [opportunity cost], and revenue generated by source.)
The economic benefits of the exemptions are negligible compared with the economic benefits of other incentives when assessed per $1 million spent. While sales tax ex-emptions and tax credits often have negligible or low economic benefits per $1 million spent, these exemptions generate lower benefits than many other tax incentives evalu-ated to date. (See Appendix C for more detail on the comparison of economic benefits generated by Virginia incentives.) The aircraft repair parts exemption is estimated to generate the lowest economic benefits of all incentives evaluated, generating only four jobs and $0.4 million in statewide personal income per $1 million spent. This exemp-tion is also the only incentive evaluated to date that has generated economic losses when benefits are assessed per $1 million spent, most likely because the incentive is new. The economic loss in Virginia GDP ($0.4 million loss) should improve over time as benefits accrue. Still, economic benefits are expected to remain negligible, similar to the economic benefits of the airline common carrier exemption.
Both exemptions also have a negligible return in state revenue for every $1 spent on the exemptions compared with the return in revenue for other Virginia incentives. The return in revenue each year for the airline common carrier exemption is 4¢ per $1 spent between FY10 and FY19, on average, and the return in revenue for the aircraft repair parts exemption is 2¢ per $1 spent. (See Appendix C for more detail on the comparison of the return in revenue generated by Virginia incentives.)
Net impact is the increase in economic activity induced by the incentives after adjusting for the opportunity cost of increasing taxes to pay for the incentives. (See Appendix N [online only] for information on the total economic im-pact and the opportunity cost of increasing taxes.)
Trade and Transportation Incentives
Commission draft 22
Economic benefits and returns in state revenue for the airline common carrier exemp-tion and aircraft repair parts exemption are low relative to other incentives for several reasons. Like many other exemptions, they do not require beneficiaries to create jobs or make a capital investment to be eligible. Tax-exempt parts are likely produced out-of-state, which reduce the multiplier effect of the purchases through the state econ-omy. Even though the economic benefits and return in state revenue for the aircraft repair parts exemption should improve over time, they will likely remain negligible for these reasons.
State could consider eliminating airline common carrier exemption The General Assembly could consider eliminating the airline common carrier exemp-tion, even though this exemption, like the railroad and ships and vessels exemptions, achieves some of its objectives such as supporting its important roles in transporting passengers and cargo safely and interstate and foreign commerce. The primary reason the exemption could be eliminated is because airline repair and maintenance—which stakeholders indicate is a critical component of the exemption—would still be exempt under the aircraft repair parts exemption.
Virginia would still be consistent with many other states if it eliminated the airline common carrier exemption. Nearly every state exempts airline repairs through either an airline common carrier tax exemption or a more general aircraft parts exemption. Twenty states offer only the aircraft parts exemption and do not exempt other pur-chases by commercial airlines. Virginia is one of only 13 states that has separate ex-emptions for both airline common carriers and aircraft parts.
However, eliminating the exemption would likely be viewed unfavorably by the airline industry for several reasons. The industry has been significantly impacted financially by the COVID-19 pandemic, and eliminating the exemption would mean airlines would be required to pay sales taxes on some items previously exempt, such as baggage handling equipment and airport security screening systems. No longer exempting these items would also be viewed as a significant departure from long-standing tax policy dating back to the creation of the sales tax. The airline common carrier exemption does not have an expiration date, whereas the aircraft repair parts exemption has an expiration date of July 1, 2022 unless extended.
POLICY OPTION 1 The General Assembly could consider eliminating the airline common carrier exemp-tion.
Policy options for con-sideration. Staff typically propose policy options rather than make recom-mendations when (i) the action is a policy judg-ment best made by elected officials—espe-cially the General Assem-bly, (ii) evidence suggests action could potentially be beneficial, or (iii) a re-port finding could be ad-dressed in multiple ways.

Trade and Transportation Incentives
Commission draft 23
If the aircraft repair parts exemption is extended, it should be made more effective and re-evaluated in a few years The General Assembly could extend the expiration date (July 1, 2022) of the aircraft repair parts exemption because the exemption is new and a full evaluation of the im-pact of the exemption could not be performed for this report. Stakeholders report the exemption has increased aircraft repair activity in the state, but this could not be veri-fied with available data. VEDP staff indicate that maintaining the exemption would allow Virginia to remain on par with the majority of other states which have aircraft repair exemptions, particularly those with a larger presence of MRO facilities. The General Assembly could extend the expiration date to July 1, 2025 to be consistent with expiration dates of other tax incentives and allow for a more thorough evaluation of the exemption in the future.
If the General Assembly extends the expiration date for the aircraft repair parts ex-emption, it should consider making substantive changes to improve the exemption. Even if these improvements are adopted, the aircraft repair parts exemption will likely not by itself have a substantive impact on aircraft maintenance activity in the state because MRO facilities are not the direct beneficiary. However, the exemption can be a useful tool to support other state economic development programs that are more likely to stimulate MRO attraction and expansion in the state. These programs include ex-isting grants and tax credits that can directly benefit MROs seeking to locate or expand in Virginia, such as the Commonwealth’s Opportunity Fund, Virginia Investment Part-nership grant, Virginia Jobs Investment Program, enterprise zone grants, and the Ma-jor Business Facility Tax Credit.
POLICY OPTION 2 The General Assembly could consider extending the expiration of the aircraft parts, engines, and supplies exemption to July 1, 2025 and making substantive changes to improve the exemption.
Better target aircraft repair parts exemption to repair activities that could be performed out-of-state If the expiration date of the aircraft repair parts exemption is extended, the General Assembly could better target the exemption to repairs that could be performed out of state. Currently the exemption can be used for all repairs, including “line maintenance” checks and minor repairs that are provided at every stop. This change would target the exemption to repair and maintenance activities that could likely be performed out of state and reduce the cost of the exemption.
Some states have restricted eligibility of their aircraft parts exemptions to target repair facilities that are certified to perform a variety of repairs or are large enough to handle substantial repairs. States typically accomplish this in two ways: (1) creating a sales tax exemptions for parts, engines, and supplies used to repair aircraft by repair facilities

Trade and Transportation Incentives
Commission draft 24
(commonly referred to as repair stations) certified by the Federal Aviation Administra-tion (FAA) or (2) restricting the exemptions to certain MRO facilities, such as facilities of a designated size or that create a certain level of jobs and capital investment. Indi-ana, Washington, and Wyoming restrict their exemptions to repairs provided by FAA-certified repair stations, which include both airline and independent repair facilities. Oklahoma’s aircraft sales, parts, and other tangible personal property exemption can be used only by MROs with at least 2,000 employees. (Oklahoma also has two of the largest MRO facilities in the U.S.) Virginia would need to set a much lower threshold. The average size of MROs in Virginia is 22 employees, compared with the national average of 57 employees.
RECOMMENDATION 2 If the General Assembly extends the expiration of the aircraft parts, engines, and sup-plies exemption, it may wish to consider amending § 58.1-609.10 of the Code of Vir-ginia to restrict eligibility of the exemption to certified Federal Aviation Administra-tion repair facilities in the state or maintenance, repair, and overhaul facilities that em-ploy a minimum number of workers.
Restrict aircraft repair parts exemption to business aircraft to better target businesses If the expiration date of the aircraft repair parts exemption is extended, the General Assembly could consider restricting the aircraft repair parts exemption to business aircraft. Owners can claim the exemption for repairs on leisure and recreation aircraft, making it more like a consumer exemption rather than a business exemption. Virginia, however, typically provides consumer exemptions only for goods such as food (partial exemption) and medicine deemed as necessities and does not provide exemptions for luxury goods. Leisure and recreation aircraft owners and operators also are likely to use local maintenance and repair services, which means they would continue to use these in-state facilities even without the exemption.
To target aircraft repair parts exemptions at businesses, some states restrict eligibility to certain aircraft uses or aircraft specifications. Six states (Arizona, Kentucky, Iowa, Texas, Vermont, and West Virginia) restrict usage to licensed or nonscheduled carriers, which are more likely to be used for business purposes. Five states (Arkansas, Florida, New Jersey, Ohio, and Tennessee) specify minimum take-off weight thresholds rang-ing from 2,000 pounds (Florida and North Carolina) to 12,500 pounds (Arkansas), which likely prevents most sport aircraft from using the exemptions.
Trade and Transportation Incentives
Commission draft 25
RECOMMENDATION 3 If the General Assembly extends the expiration of the aircraft parts, engines, and sup-plies exemption, it may wish to consider amending § 58.1-609.10 of the Code of Vir-ginia to restrict eligible aircraft to licensed or nonscheduled airline carriers, or to a minimum take-off weight threshold, to exclude repairs to personal use aircraft from qualifying for the exemption.
Exemption should be re-evaluated in a few years If the expiration date of the aircraft repair parts exemption is extended, a more thor-ough evaluation of the exemption could be performed in several years. Data on the number of FAA-certified repair facilities in Virginia and their employment levels could be collected over several years to determine whether the number of FAA repair facil-ities, or their size, has increased, and if overall FAA repair facility employment has increased. Data on the type, variety, and rating of services that Virginia-based FAA-certified repair facilities provide could also be collected over several years to determine if repair facilities have expanded the repairs they can provide.
While not all repair facili-ties are FAA certified, the FAA reports detail infor-mation on its certified re-pair stations. This is the most comprehensive source of information on repair facilities.
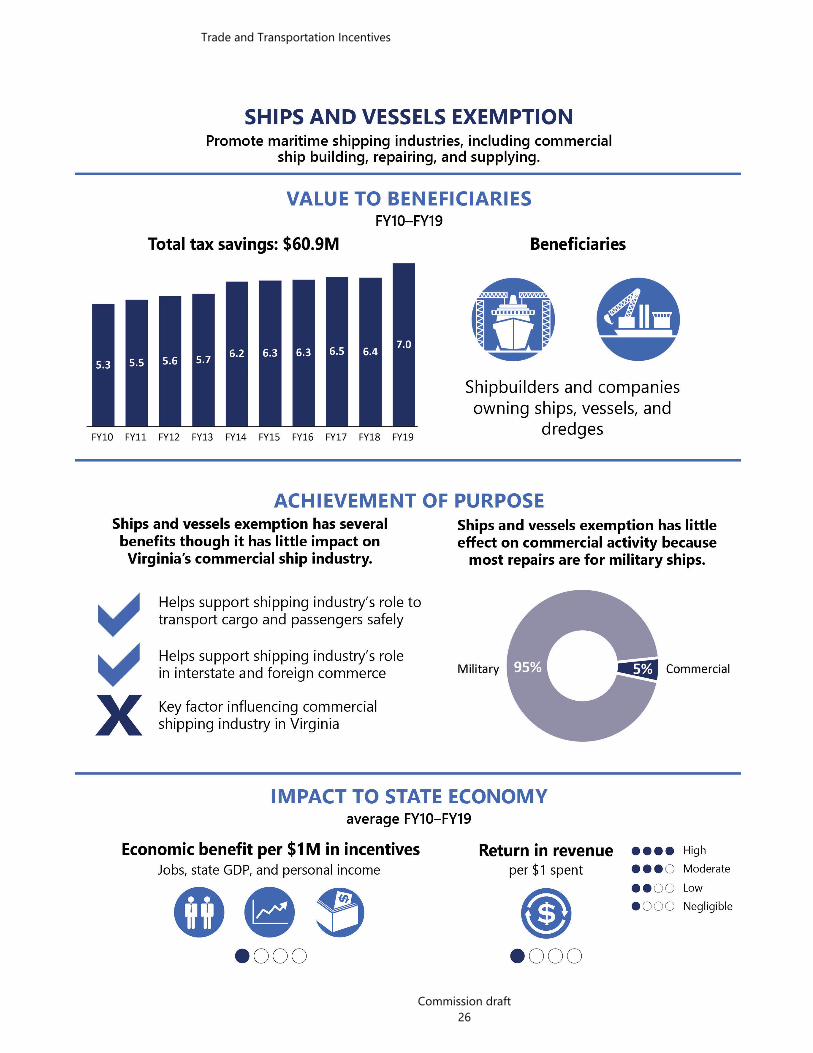
Trade and Transportation Incentives
Commission draft 26
O
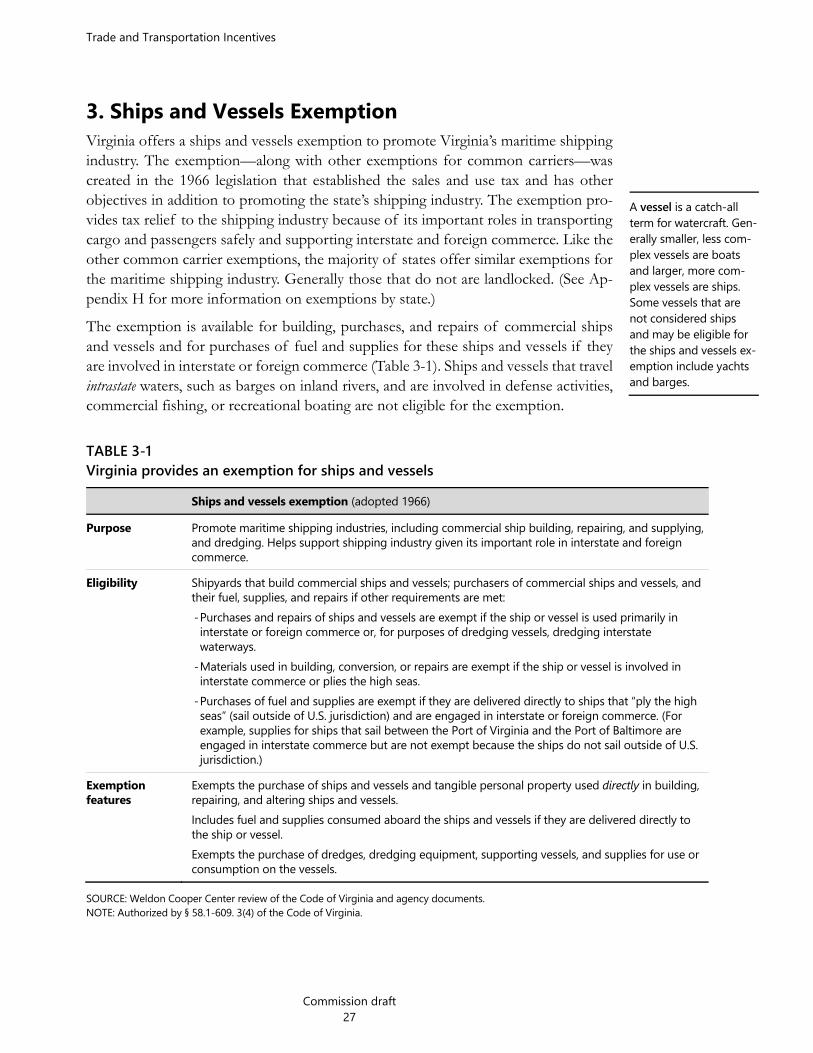
Trade and Transportation Incentives
Commission draft 27
3. Ships and Vessels Exemption Virginia offers a ships and vessels exemption to promote Virginia’s maritime shipping industry. The exemption—along with other exemptions for common carriers—was created in the 1966 legislation that established the sales and use tax and has other objectives in addition to promoting the state’s shipping industry. The exemption pro-vides tax relief to the shipping industry because of its important roles in transporting cargo and passengers safely and supporting interstate and foreign commerce. Like the other common carrier exemptions, the majority of states offer similar exemptions for the maritime shipping industry. Generally those that do not are landlocked. (See Ap-pendix H for more information on exemptions by state.)
The exemption is available for building, purchases, and repairs of commercial ships and vessels and for purchases of fuel and supplies for these ships and vessels if they are involved in interstate or foreign commerce (Table 3-1). Ships and vessels that travel intrastate waters, such as barges on inland rivers, and are involved in defense activities, commercial fishing, or recreational boating are not eligible for the exemption.
TABLE 3-1 Virginia provides an exemption for ships and vessels Ships and vessels exemption (adopted 1966)
Purpose Promote maritime shipping industries, including commercial ship building, repairing, and supplying, and dredging. Helps support shipping industry given its important role in interstate and foreign commerce.
Eligibility Shipyards that build commercial ships and vessels; purchasers of commercial ships and vessels, and their fuel, supplies, and repairs if other requirements are met: - Purchases and repairs of ships and vessels are exempt if the ship or vessel is used primarily in interstate or foreign commerce or, for purposes of dredging vessels, dredging interstate waterways.
- Materials used in building, conversion, or repairs are exempt if the ship or vessel is involved in interstate commerce or plies the high seas.
- Purchases of fuel and supplies are exempt if they are delivered directly to ships that “ply the high seas” (sail outside of U.S. jurisdiction) and are engaged in interstate or foreign commerce. (For example, supplies for ships that sail between the Port of Virginia and the Port of Baltimore are engaged in interstate commerce but are not exempt because the ships do not sail outside of U.S. jurisdiction.)
Exemption features
Exempts the purchase of ships and vessels and tangible personal property used directly in building, repairing, and altering ships and vessels. Includes fuel and supplies consumed aboard the ships and vessels if they are delivered directly to the ship or vessel. Exempts the purchase of dredges, dredging equipment, supporting vessels, and supplies for use or consumption on the vessels.
SOURCE: Weldon Cooper Center review of the Code of Virginia and agency documents. NOTE: Authorized by § 58.1-609. 3(4) of the Code of Virginia.
A vessel is a catch-all term for watercraft. Gen-erally smaller, less com-plex vessels are boats and larger, more com-plex vessels are ships. Some vessels that are not considered ships and may be eligible for the ships and vessels ex-emption include yachts and barges.

Trade and Transportation Incentives
Commission draft 28
Companies saved $6.1 million per year from ships and vessels exemption between FY10 and FY19 Companies saved an estimated $61 million between FY10 and FY19 because of the ships and vessels exemption, or about $6.1 million per year. Even though Virginia has a substantial shipbuilding and repair and cargo shipping industry, use of the exemption is relatively small for several reasons. Shipbuilders likely use the broader manufacturing exemption for most of the parts and other intermediate goods necessary to build ships and other vessels. Shipyards that provide repair work rely heavily on military ship con-tracts, and purchases for these repairs are likely exempt through the government ex-emption. Virginia is also not a major resupply port for food or fuel used on ships.
Ships and vessels exemption has several benefits though it has little impact on Virginia’s commercial ship industry Similar to Virginia’s other common carrier exemptions, the ships and vessels exemp-tion achieves some of its objectives but is not a key factor in influencing commercial ship activity in the state.
Ships and vessels exemption helps support shipbuilding and shipping industries and has tax policy benefits The exemption supports investments by the shipping industry given its importance for transporting cargo and passengers safely and to interstate and foreign commerce. The exemption also aligns with principles of a good tax system. Even though few foreign shipping companies likely use Virginia shipyards and shipping supply compa-nies, the exemption adheres to the general tax principle of not taxing foreign income. The exemption also increases tax efficiency because intermediate inputs are not taxed.
Exemption viewed as important by the industry to maintain future competitiveness The ships and vessels exemption is important to maintain Virginia’s future competi-tiveness in the commercial ship repair and supply industries because other East Coast states offer similar exemptions, according to industry stakeholders. Virginia’s current shipbuilding and repair activity is mostly for the Navy, and the exemption may become more important to support the ship repair industry in the state if the Navy incorpo-rates a larger fleet of smaller ships, which it has considered for some time. Though implementation of the plan would take years to fully implement, these smaller ships could be built or repaired at smaller shipyards and could result in Hampton Roads losing some of its share in the military shipbuilding and repair market. Virginia is also developing a competitive position in offshore wind construction, which is supported by the commercial maritime industry.
Trade and Transportation Incentives
Commission draft 29
Ships and vessels exemption has little impact on Virginia’s commercial ship industry, because most shipbuilding and repair activity is for the Navy Virginia has the largest shipbuilding and repair industry in the U.S., representing 29 percent of national employment in the industry in 2019. Newport News Shipbuilding, headquartered in the City of Newport News, is the largest shipbuilder in the U.S. and Virginia’s largest industrial employer. Several other private shipyards are located in Hampton Roads, and they mainly provide maintenance, repair, and overhaul work.
Most of Virginia’s shipbuilding and repair activity is for the military, however, and only a small portion (5 percent in 2012) is commercial and eligible for the exemption. One reason this occurs is because of the outsized role of military contracts at Virginia shipyards. Newport News Shipbuilding is the sole provider of Navy aircraft carriers and one of two providers of Navy submarines. Hampton Roads is also home to the largest naval base—Naval Station Norfolk—and approximately 97 percent of the re-pair work by Virginia’s shipyards is for military ship repair.
The “Jones Act” requires domestic commercial ships to be built and repaired at U.S. facilities, but other East Coast and Gulf Coast states have captured more of the do-mestic commercial market than Virginia. Foreign companies are unlikely to choose U.S. shipyards generally, including Virginia’s, to build or repair ships and vessels be-cause of higher labor and material costs and longer repair times than at foreign ship-yards. However, Virginia shipyards may handle unscheduled “emergency” work.
Best estimates indicate Virginia’s commercial ship maintenance and repair activity has decreased despite the exemption Virginia’s commercial ship maintenance and repair activity has deteriorated over the past 20 years despite the ships and vessels exemption. Best estimates indicate that Vir-ginia’s commercial ship maintenance and repair employment has decreased by 22 per-cent between 2001 and 2019, while national employment increased slightly (Figure 3-1).
The decline in commercial ship building and repair employment may at least partly result from Virginia’s large military maintenance and repair industry drawing resources from less lucrative commercial repair and maintenance markets. Virginia also has com-petition from shipyards in other states, such as Texas, Louisiana, Florida and Alabama, which have larger commercial ship repair industries.
The federal Jones Act requires that ships or vessels transporting goods between U.S. ports must be domesti-cally owned, operated, built, and repaired. It was adopted as part of the Merchant Marine Act of 1920.
Virginia and national commercial ship maintenance, repair, and overhaul employ-ment was estimated. Commercial ship repair employment repre-sented 3 percent of total ship repair employment in Virginia and 24 per-cent of total national ship repair, according to the 2012 Economic Cen-sus. These percentages were applied to total ship repair employment for Virginia and the na-tion between 2001 and 2019. These estimates assume Virginia’s share and the nation’s share remain constant over time.

Trade and Transportation Incentives
Commission draft 30
FIGURE 3-1 Virginia commercial ship maintenance, repair, and overhaul is estimated to have declined over the past 20 years
SOURCE: Weldon Cooper Center imputation using EMSI data using constant industry share assumptions. NOTE: Commercial maintenance, repair, and overhaul activity is assumed to represent 3% of Virginia shipbuilding and repair employment and 84% of other support activities for water transportation employment. It is assumed to represent 24% and 84% respectively of national employment in those sectors.
Ships and vessels exemption has negligible economic benefit and negligible return in state revenue The ships and vessels exemption does not generate additional activity for the Virginia economy, adjusting for the opportunity cost of increasing taxes to pay for the credits. This occurs because any additional economic activity, such as jobs, induced by the exemption is eroded by the reduction in economic activity that occurs because of the tax increase to pay for the exemption. Virginia’s economy lost an estimated 10 jobs, $2 million in Virginia GDP, and $0.8 million in personal income because of the exemp-tion (Table 3-2). Only three other incentives (the state’s two coal tax credits and the aircraft repair parts exemption) evaluated so far have generated economic losses for all three measures of economic activity.
Economic impact analysis of incentive spending between FY10 and FY19 was conducted using economic model-ing software developed by REMI, Inc. (See Appendix M [online only] for the economic impact analysis used in this study.)
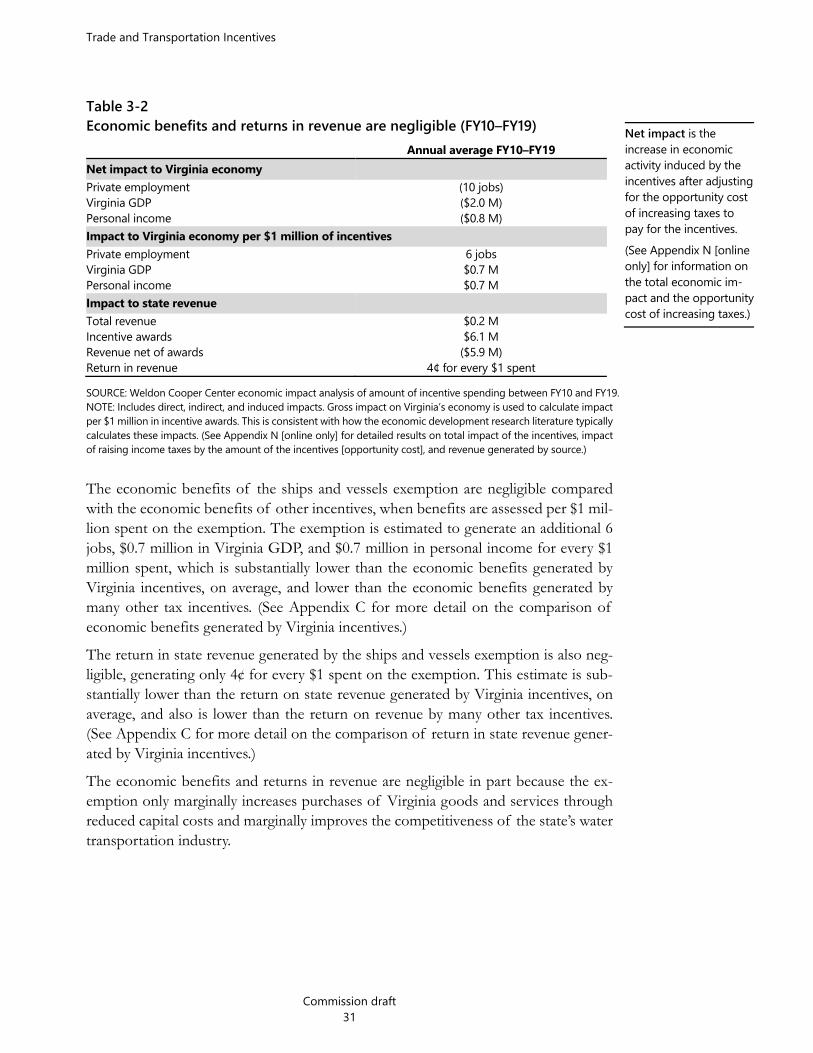
Trade and Transportation Incentives
Commission draft 31
Table 3-2 Economic benefits and returns in revenue are negligible (FY10–FY19) Annual average FY10–FY19 Net impact to Virginia economy Private employment (10 jobs) Virginia GDP ($2.0 M) Personal income ($0.8 M) Impact to Virginia economy per $1 million of incentives Private employment 6 jobs Virginia GDP $0.7 M Personal income $0.7 M Impact to state revenue Total revenue $0.2 M Incentive awards $6.1 M Revenue net of awards ($5.9 M) Return in revenue 4¢ for every $1 spent SOURCE: Weldon Cooper Center economic impact analysis of amount of incentive spending between FY10 and FY19. NOTE: Includes direct, indirect, and induced impacts. Gross impact on Virginia’s economy is used to calculate impact per $1 million in incentive awards. This is consistent with how the economic development research literature typically calculates these impacts. (See Appendix N [online only] for detailed results on total impact of the incentives, impact of raising income taxes by the amount of the incentives [opportunity cost], and revenue generated by source.)
The economic benefits of the ships and vessels exemption are negligible compared with the economic benefits of other incentives, when benefits are assessed per $1 mil-lion spent on the exemption. The exemption is estimated to generate an additional 6 jobs, $0.7 million in Virginia GDP, and $0.7 million in personal income for every $1 million spent, which is substantially lower than the economic benefits generated by Virginia incentives, on average, and lower than the economic benefits generated by many other tax incentives. (See Appendix C for more detail on the comparison of economic benefits generated by Virginia incentives.)
The return in state revenue generated by the ships and vessels exemption is also neg-ligible, generating only 4¢ for every $1 spent on the exemption. This estimate is sub-stantially lower than the return on state revenue generated by Virginia incentives, on average, and also is lower than the return on revenue by many other tax incentives. (See Appendix C for more detail on the comparison of return in state revenue gener-ated by Virginia incentives.)
The economic benefits and returns in revenue are negligible in part because the ex-emption only marginally increases purchases of Virginia goods and services through reduced capital costs and marginally improves the competitiveness of the state’s water transportation industry.
Net impact is the increase in economic activity induced by the incentives after adjusting for the opportunity cost of increasing taxes to pay for the incentives. (See Appendix N [online only] for information on the total economic im-pact and the opportunity cost of increasing taxes.)

Trade and Transportation Incentives
Commission draft 32
Consideration could be given to maintaining the ships and vessels exemption The ships and vessels exemption could be maintained because it achieves several of its objectives. The exemption was adopted, along with other common carrier exemp-tions, when the sales tax was created in recognition of the importance of Virginia’s shipbuilding and port industries, its public service as a common carrier, and the im-portance of the shipping industry in interstate and foreign commerce. It also adheres to sound tax policy principles by neither taxing intermediate goods nor foreign income and preventing the shifting of purchases to other states that have the exemption.
Additionally, the exemption could help Virginia maintain its competitiveness if there is greater opportunity in the future to further develop its commercial shipbuilding and repair industry. Like the other common carrier exemptions, most states that are not landlocked have a similar exemption for ships and vessels.
However, given its negligible economic benefit, it may become reasonable in the future to consider eliminating the exemption if the Navy’s shift to smaller ships does not occur, Virginia’s commercial shipbuilding and repair industry continues to decline, and Virginia continues to not be a major resupply state for the shipping industry.
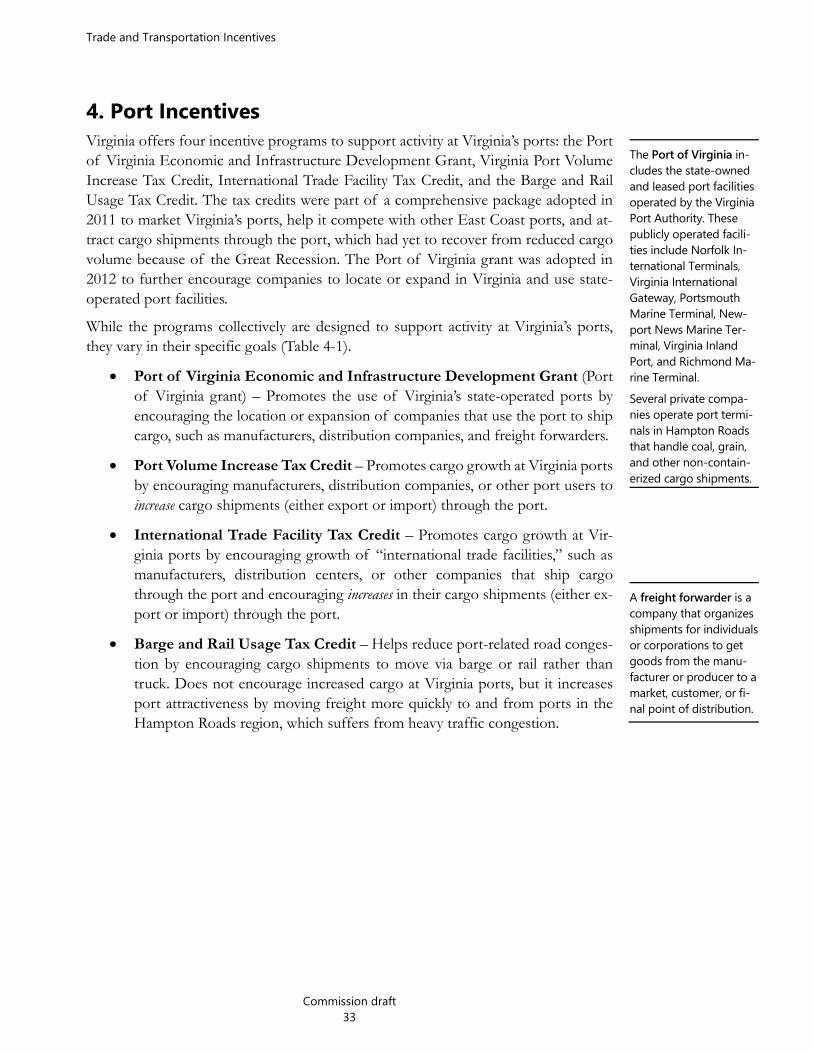
Trade and Transportation Incentives
Commission draft 33
4. Port Incentives Virginia offers four incentive programs to support activity at Virginia’s ports: the Port of Virginia Economic and Infrastructure Development Grant, Virginia Port Volume Increase Tax Credit, International Trade Facility Tax Credit, and the Barge and Rail Usage Tax Credit. The tax credits were part of a comprehensive package adopted in 2011 to market Virginia’s ports, help it compete with other East Coast ports, and at-tract cargo shipments through the port, which had yet to recover from reduced cargo volume because of the Great Recession. The Port of Virginia grant was adopted in 2012 to further encourage companies to locate or expand in Virginia and use state-operated port facilities.
While the programs collectively are designed to support activity at Virginia’s ports, they vary in their specific goals (Table 4-1).
Port of Virginia Economic and Infrastructure Development Grant (Port of Virginia grant) – Promotes the use of Virginia’s state-operated ports by encouraging the location or expansion of companies that use the port to ship cargo, such as manufacturers, distribution companies, and freight forwarders.
Port Volume Increase Tax Credit – Promotes cargo growth at Virginia ports by encouraging manufacturers, distribution companies, or other port users to increase cargo shipments (either export or import) through the port.
International Trade Facility Tax Credit – Promotes cargo growth at Vir-ginia ports by encouraging growth of “international trade facilities,” such as manufacturers, distribution centers, or other companies that ship cargo through the port and encouraging increases in their cargo shipments (either ex-port or import) through the port.
Barge and Rail Usage Tax Credit – Helps reduce port-related road conges-tion by encouraging cargo shipments to move via barge or rail rather than truck. Does not encourage increased cargo at Virginia ports, but it increases port attractiveness by moving freight more quickly to and from ports in the Hampton Roads region, which suffers from heavy traffic congestion.
The Port of Virginia in-cludes the state-owned and leased port facilities operated by the Virginia Port Authority. These publicly operated facili-ties include Norfolk In-ternational Terminals, Virginia International Gateway, Portsmouth Marine Terminal, New-port News Marine Ter-minal, Virginia Inland Port, and Richmond Ma-rine Terminal. Several private compa-nies operate port termi-nals in Hampton Roads that handle coal, grain, and other non-contain-erized cargo shipments.
A freight forwarder is a company that organizes shipments for individuals or corporations to get goods from the manu-facturer or producer to a market, customer, or fi-nal point of distribution.

Trade and Transportation Incentives
Commission draft 34
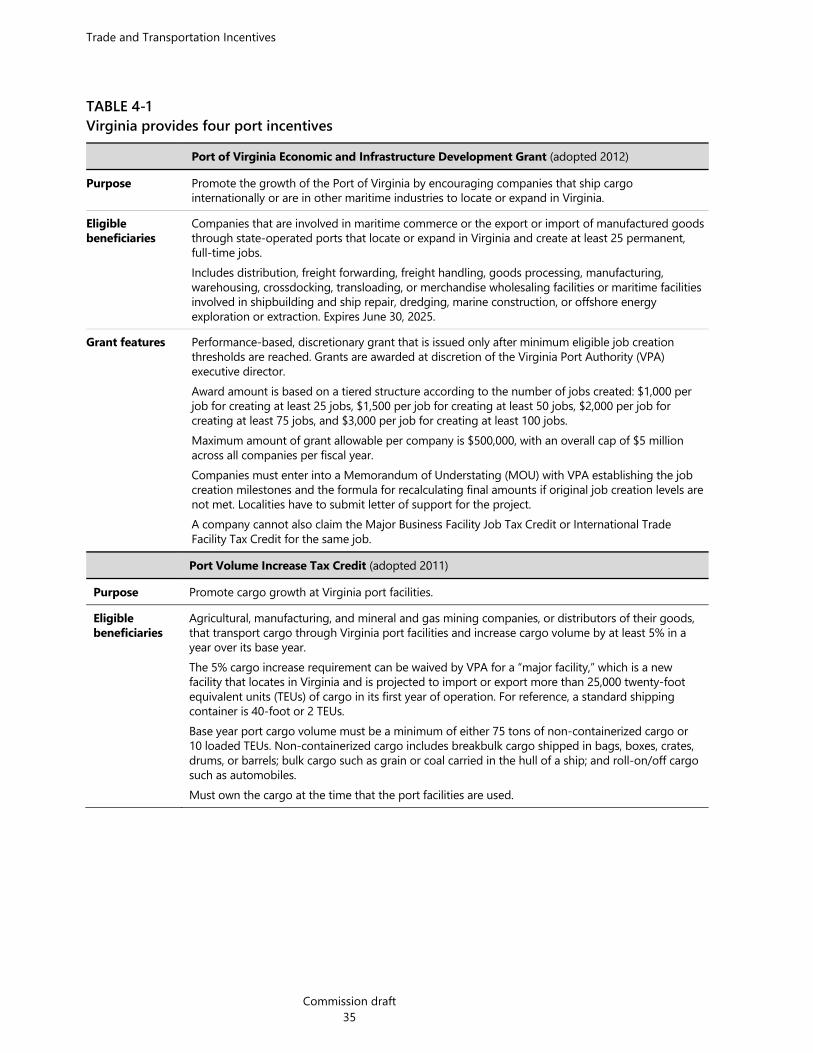
Trade and Transportation Incentives
Commission draft 35
TABLE 4-1 Virginia provides four port incentives Port of Virginia Economic and Infrastructure Development Grant (adopted 2012)
Purpose Promote the growth of the Port of Virginia by encouraging companies that ship cargo internationally or are in other maritime industries to locate or expand in Virginia.
Eligible beneficiaries
Companies that are involved in maritime commerce or the export or import of manufactured goods through state-operated ports that locate or expand in Virginia and create at least 25 permanent, full-time jobs. Includes distribution, freight forwarding, freight handling, goods processing, manufacturing, warehousing, crossdocking, transloading, or merchandise wholesaling facilities or maritime facilities involved in shipbuilding and ship repair, dredging, marine construction, or offshore energy exploration or extraction. Expires June 30, 2025.
Grant features Performance-based, discretionary grant that is issued only after minimum eligible job creation thresholds are reached. Grants are awarded at discretion of the Virginia Port Authority (VPA) executive director. Award amount is based on a tiered structure according to the number of jobs created: $1,000 per job for creating at least 25 jobs, $1,500 per job for creating at least 50 jobs, $2,000 per job for creating at least 75 jobs, and $3,000 per job for creating at least 100 jobs. Maximum amount of grant allowable per company is $500,000, with an overall cap of $5 million across all companies per fiscal year. Companies must enter into a Memorandum of Understating (MOU) with VPA establishing the job creation milestones and the formula for recalculating final amounts if original job creation levels are not met. Localities have to submit letter of support for the project. A company cannot also claim the Major Business Facility Job Tax Credit or International Trade Facility Tax Credit for the same job.
Port Volume Increase Tax Credit (adopted 2011)
Purpose Promote cargo growth at Virginia port facilities.
Eligible beneficiaries
Agricultural, manufacturing, and mineral and gas mining companies, or distributors of their goods, that transport cargo through Virginia port facilities and increase cargo volume by at least 5% in a year over its base year. The 5% cargo increase requirement can be waived by VPA for a “major facility,” which is a new facility that locates in Virginia and is projected to import or export more than 25,000 twenty-foot equivalent units (TEUs) of cargo in its first year of operation. For reference, a standard shipping container is 40-foot or 2 TEUs. Base year port cargo volume must be a minimum of either 75 tons of non-containerized cargo or 10 loaded TEUs. Non-containerized cargo includes breakbulk cargo shipped in bags, boxes, crates, drums, or barrels; bulk cargo such as grain or coal carried in the hull of a ship; and roll-on/off cargo such as automobiles. Must own the cargo at the time that the port facilities are used.

Trade and Transportation Incentives
Commission draft 36
Tax credit features
Tax credit amount is $50 per TEU, one unit of roll on/roll off cargo, or 16 tons of non-containerized cargo. Annual award amounts are capped at $250,000 per taxpayer per year and $3.2 million for all taxpayers per year. If the cap is not reached for all taxpayers, the residual amount can be distributed to applicants on a pro rata basis. Non-refundable, transferable (since 2019) credit with a 5-year carryover. Can be claimed against corporate and individual income tax. Expires January 1, 2025.
International Trade Facility Tax Credit (adopted 2011)
Purpose Promotes cargo growth at Virginia ports by encouraging growth of international trade facilities through job creation or capital investment.
Eligible beneficiaries
Company that is a 'shipper' of goods, like a manufacturer or distribution company. Company must be engaged in port-related activities.
Tax credit features
Tax credit for international trade facilities that show at least 5% increase in Virginia port shipments. Employee credit is equal to $3,500 per new job created. Capital investment credit is equal to 2% of new capital investment. Credit is capped at $1.25 million per year for all taxpayers. Can be claimed against individual and corporate income tax. Non-refundable and non-transferable tax credit with a 10-year carryover. Cannot claim the Major Business Facility Job Tax Credit or Port of Virginia grant for the same activity. Expires January 1, 2025.
Barge and Rail Usage Tax Credit (adopted 2011)
Purpose Encourage use of rail and barge transportation and decrease Virginia road congestion.
Eligible beneficiaries
Virginia international trade facilities (cargo shippers) that utilize barge and rail rather than truck transportation. Facility must have ownership interest in the cargo and sole discretion and authority to choose the method used to move cargo originating or terminating in Virginia.
Tax credit features
Credit is $25 per TEU, 16 tons of noncontainerized cargo, or one unit of roll-on/roll-off cargo in excess of the number of containers shipped by barge or rail by the taxpayer during the preceding taxable year. Can be claimed against corporate or individual income taxes, bank franchise tax, insurance premium tax, and public service corporation tax. Credit is capped at $500,000 per year for all taxpayers but has a 5-year carryover. Expires January 1, 2025.
SOURCE: Weldon Cooper Center review of the Code of Virginia and agency documents. NOTE: Authorized by §§ 58.1-439.12:06, 58.1-439.12:09, and 58.1-439.12:10.
Manufacturers and other companies shipping goods through the port received $2 million in port incentives per year Manufacturers and other companies that import or export cargo through Virginia’s ports received $14.4 million in port-related incentives between FY13 and FY19, or about $2 million per year. The majority of the incentive spending was for the Port Volume Increase Tax Credit followed by Port of Virginia grant awards (Figure 4-1).

Trade and Transportation Incentives
Commission draft 37
FIGURE 4-1 Majority of spending on port incentives was through the port volume tax credit (FY13–FY19)
SOURCE: Weldon Cooper Center analysis of data provided by the Virginia Port Authority and Department of Taxation.
Manufacturers have been the primary beneficiaries (72 percent) of the port incentives followed by companies in the transportation and warehousing sector (12 percent), but users vary by program. Nearly all (97 percent) of the International Trade Facility Tax Credits were awarded to manufacturers. The majority (66 percent) of Port Volume Increase Tax Credits awarded were to manufacturers; about one-fifth went to whole-salers and transportation and warehousing companies. Awards are also more concen-trated in Hampton Roads than other incentives, with more than one-third (36 percent) of grant and credit amounts benefiting businesses in the Hampton Roads region com-pared with 11 percent of awards across all incentive grants. (See Economic Development Incentives, JLARC 2020). (See Appendix I for awards distribution map by locality.)
Port incentives have mixed success in promoting port activity Virginia and many states served by seaports have introduced economic incentives to attract cargo from existing businesses in the region or expand the footprint of port-using businesses. (See Appendix J for more detail on port incentives by state.) The Port Volume Increase Tax Credit and International Trade Facility Tax Credit, in par-ticular, are designed to increase cargo volume and could have a substantial impact on it (support up to 84,280 TEUs per year, which is 1.8 percent of current capacity) if fully utilized, assuming that cargo volume is responsive to tax credits.
Research indicates, however, that many factors influence port selection, diminishing the effect port incentives can have in influencing cargo volume. Geographical factors influence port choice and competitiveness. The Port of Virginia benefits from a loca-tion that is relatively distant from rival ports and close to the open ocean and has a naturally deep harbor to accommodate larger ships and vessels. Port infrastructure and management decisions also influence port choice and competitiveness. VPA and the state have made significant improvements to the Port of Virginia in recent years, such
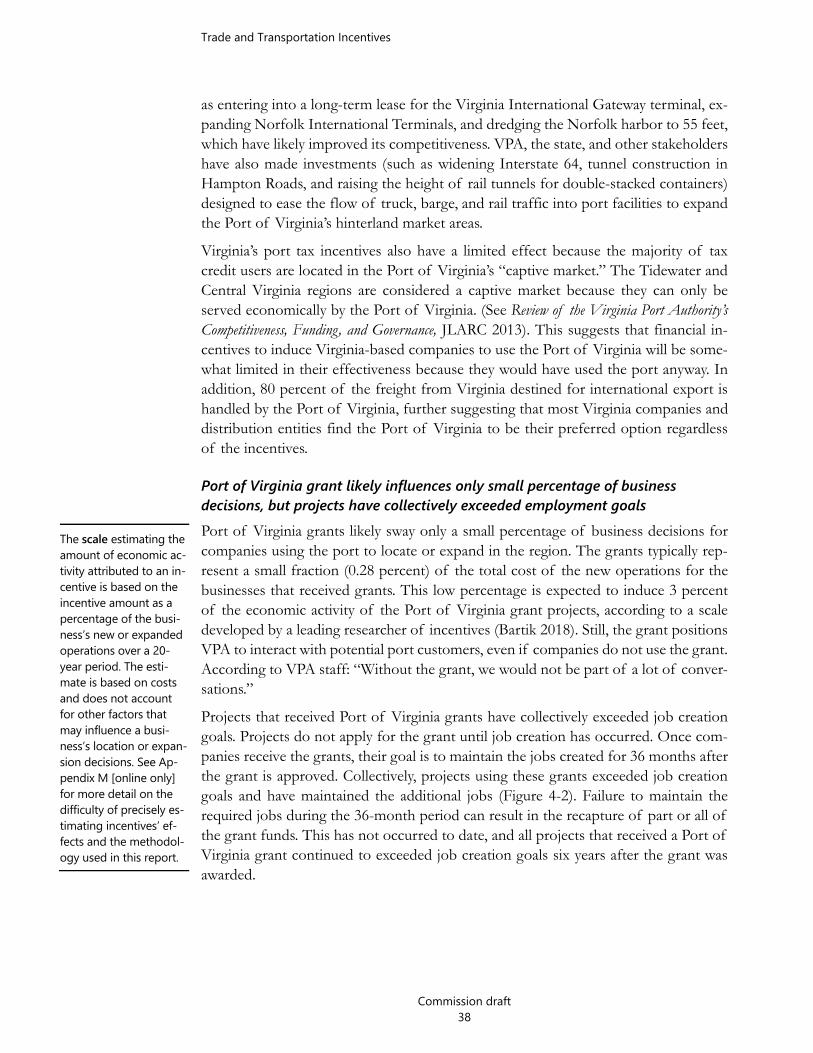
Trade and Transportation Incentives
Commission draft 38
as entering into a long-term lease for the Virginia International Gateway terminal, ex-panding Norfolk International Terminals, and dredging the Norfolk harbor to 55 feet, which have likely improved its competitiveness. VPA, the state, and other stakeholders have also made investments (such as widening Interstate 64, tunnel construction in Hampton Roads, and raising the height of rail tunnels for double-stacked containers) designed to ease the flow of truck, barge, and rail traffic into port facilities to expand the Port of Virginia’s hinterland market areas.
Virginia’s port tax incentives also have a limited effect because the majority of tax credit users are located in the Port of Virginia’s “captive market.” The Tidewater and Central Virginia regions are considered a captive market because they can only be served economically by the Port of Virginia. (See Review of the Virginia Port Authority’s Competitiveness, Funding, and Governance, JLARC 2013). This suggests that financial in-centives to induce Virginia-based companies to use the Port of Virginia will be some-what limited in their effectiveness because they would have used the port anyway. In addition, 80 percent of the freight from Virginia destined for international export is handled by the Port of Virginia, further suggesting that most Virginia companies and distribution entities find the Port of Virginia to be their preferred option regardless of the incentives.
Port of Virginia grant likely influences only small percentage of business decisions, but projects have collectively exceeded employment goals Port of Virginia grants likely sway only a small percentage of business decisions for companies using the port to locate or expand in the region. The grants typically rep-resent a small fraction (0.28 percent) of the total cost of the new operations for the businesses that received grants. This low percentage is expected to induce 3 percent of the economic activity of the Port of Virginia grant projects, according to a scale developed by a leading researcher of incentives (Bartik 2018). Still, the grant positions VPA to interact with potential port customers, even if companies do not use the grant. According to VPA staff: “Without the grant, we would not be part of a lot of conver-sations.”
Projects that received Port of Virginia grants have collectively exceeded job creation goals. Projects do not apply for the grant until job creation has occurred. Once com-panies receive the grants, their goal is to maintain the jobs created for 36 months after the grant is approved. Collectively, projects using these grants exceeded job creation goals and have maintained the additional jobs (Figure 4-2). Failure to maintain the required jobs during the 36-month period can result in the recapture of part or all of the grant funds. This has not occurred to date, and all projects that received a Port of Virginia grant continued to exceeded job creation goals six years after the grant was awarded.
The scale estimating the amount of economic ac-tivity attributed to an in-centive is based on the incentive amount as a percentage of the busi-ness’s new or expanded operations over a 20-year period. The esti-mate is based on costs and does not account for other factors that may influence a busi-ness’s location or expan-sion decisions. See Ap-pendix M [online only] for more detail on the difficulty of precisely es-timating incentives’ ef-fects and the methodol-ogy used in this report.

Trade and Transportation Incentives
Commission draft 39
FIGURE 4-2 Port of Virginia grant projects collectively exceeded their job creation goals (FY14–FY19)
SOURCE: Weldon Cooper Center analysis of information reported by VPA and VEC employment data.
Barge and Rail Usage Tax Credit has incentivized use of barge service to Richmond Marine Terminal and has social and environmental benefits The primary purpose of the Barge and Rail Usage Tax Credit is to encourage firms to switch freight from truck to barge or rail service, and it appears to have influenced increased barge activity. According to stakeholder interviews, the tax credit has been a valuable tool for incentivizing growth in barge service between the ports in Hampton Roads and the Richmond Marine Terminal, which is now near its estimated capacity (50,000–60,000 twenty-foot equivalent units, or TEUs, annually). The extent to which this increase can be attributed to the tax credit is unknown, but the tax credit amount ($25 per TEU) is significant enough to incentivize shippers to switch (9 percent of the estimated $292 handling cost for full containers and 74 percent of handling costs of $34 for empty loads). VPA staff believe that once a company switches to barge or rail, they are unlikely to revert back to truck transport even after they no longer receive the credit.
The Barge and Rail Usage Tax Credit’s benefits substantially outweigh its costs, ac-cording to an analysis of social, environmental, and economic benefits using a benefit- cost model developed by a national consulting firm for estimating the public benefits of the state’s Rail Enhancement Fund projects. For example, diverting 10,000 TEUs from truck to rail is estimated to result in $103,000 in pavement maintenance cost savings, $392,000 in accident reduction benefits, $124,000 in congestion savings, and
A TEU or twenty-foot equivalent unit is how shipping containers are measured. The standard shipping container is 40 feet or two TEUs.
The additional social cost benefit analysis of the Barge and Rail Usage Tax Credit is broader than the standard eco-nomic impact analysis that measures the effect on jobs and output. This analysis measures social welfare effects.
Trade and Transportation Incentives
Commission draft 40
$84,000 from air pollutant reduction, or $703,000 in total benefits. This estimate of total benefits is nearly 2.5 times larger than the annual cost of the credits ($250,000). The model does not account for the diversion from truck to barge, but the benefits are expected to be similar. (See Appendix B for more information about the model and the social cost benefit analysis.)
Port tax credits have been underutilized, which has reduced their impact on port volume and barge or rail shipments While the Barge and Rail Use Tax Credit’s benefits appear to outweigh its costs, the incentive along with the other port tax credits (International Trade Facility Tax Credit and the Port Volume Increase Tax Credit) have generally been underutilized. This un-derutilization limits their ability to increase port cargo and encourage rail and barge transport.
Underutilization occurs for several reasons. First, credit amounts requested are less than the total amount of tax credits that could have been awarded. Further, not all requests for the credit are approved and awarded. Since FY11, $44.5 million in tax credits could have been awarded, but only 52 percent of the amount was awarded, and the percentage awarded varies by port tax credit (Figure 4-3). VPA (Port Volume In-crease Tax Credit) and TAX (International Trade Facility Tax Credit and Barge and Rail Usage Tax Credit), which have approved the majority of credit amounts requested, report that several applications for the tax credits were not approved because they did not meet the cargo volume growth requirements. Only about 25 percent of the total amount that could have been awarded has ultimately been claimed on tax returns.
Several factors, other than cargo volume being insufficient, may also contribute to the port tax credits’ underutilization. Local economic development staff responding to a survey rated the port tax credits as generally useful, but their average rating was low relative to other incentives (ranking 25th, 26th, and 31st among 33 total incentives). This could be because of a misconception that the incentives are relevant only for companies close to the Port of Virginia. Tax credits are also generally less usable than grants because a company must have tax liability to use tax credits. The Port Volume Tax Credit can be used more easily now that it is transferable.
Upon adoption of the port tax credits, the credit caps were $250,000 for the Inter-national Trade Facility Tax Credit, $1.5 million for the Barge and Rail Usage Tax Credit, and $3.2 million for the Port Volume Increase Tax Credit. Legislation in 2014 in-creased the International Trade Facility Tax Credit cap to $1.25 million be-cause the credit had ex-ceeded its cap in prior years and decreased the Barge and Rail Usage Tax Credit cap to $500,000 because of low utilization. The cap for the Port Volume In-crease Tax Credit re-mained at $3.2 million.
A transferable tax credit can be sold to another taxpayer, sometimes through a broker and usually at a discounted price, if the taxpayer that earned the credit does not have tax liability to use it. This allows the taxpayer originally allo-cated the credit to still benefit.

Trade and Transportation Incentives
Commission draft 41
FIGURE 4-3 Amount of port credits awarded has generally been well below total amounts that could have been awarded
SOURCE: Weldon Cooper Center analysis of Department of Taxation and Virginia Port Authority data. NOTE: Tax credits were approved beginning in tax year 2011 but none were claimed on tax returns until FY13.
Port incentives have low-to-moderate economic benefits and moderate returns in state revenue The four port incentives are estimated to generate additional economic activity. Col-lectively, it is estimated that each year private employment increased by 90 jobs, Vir-ginia GDP increased by $12 million, and personal income increased by $8 million be-cause of the port incentives (Table 4-2). The Port Volume Increase Tax Credit gener-ates most of the additional economic activity followed by the Port of Virginia grant, which is where the majority of spending has occurred. These estimates assume that not all activity generated by the businesses receiving port incentives can be attributed to the incentives.
Economic impact analysis of incentive spending between FY10 and FY19 was conducted using economic model-ing software developed by REMI, Inc. (See Appendix M [online only] for the economic impact analysis used in this study.)

Trade and Transportation Incentives
Commission draft 42
Table 4-2 Port incentives have low-to-moderate economic benefits, but returns in revenue are moderate (FY13–FY19) Annual average FY13–FY19
Port of Virginia grant
Port Volume Increase
Tax Credit
International Trade Facility
Tax Credit
Barge and Rail Usage Tax
Credit All port
incentives Net impact to Virginia economy Private employment 20 jobs 63 jobs 5 jobs 2 jobs 90 jobs Virginia GDP $3.4 M $7.9 M $0.9 M $0.3 M $12.4 M Personal income $1.8 M $5.5 M $0.5 M $0.4 M $8.1 M Impact to Virginia of incentives economy per $1 million Private employment 65 jobs 86 jobs 29 jobs 41 jobs 70 jobs Virginia GDP $10.6 M $10.9 M $5.0 M $6.0 M $9.7 M Personal income $5.8 M $7.6 M $2.8 M $6.9 M $6.4 M Impact to state revenue Total revenue $0.2 M $0.3 M $0.1 M $0.02 M $0.6 M Incentive awards $0.4 M $0.8 M $0.2 M $0.06 M $1.4 M Revenue net of awards ($0.2 M) ($0.5 M) ($0.1 M) ($0.04 M) ($0.8 M) Return in revenue 46¢ for every
$1 spent 40¢ for every
$1 spent 47¢ for every
$1 spent 31¢ for every
$1 spent 42¢ for every
$1 spent SOURCE: Weldon Cooper Center economic impact analysis of amount of incentive spending between FY13 and FY19. NOTE: Includes direct, indirect, and induced impacts. Gross impact on Virginia’s economy is used to calculate impact per $1 million in incentive awards. This is consistent with how the economic development research literature typically calculates these impacts. (See Appendix N [online only] for detailed results on total impact of the incentives, impact of raising income taxes by the amount of the incentives [opportunity cost], and revenue generated by source.) Impacts for the Barge and Rail Usage Tax Credit include traffic diversion benefits. Assumes that 14.8 percent of the activity generated by companies claiming the International Trade Facility Tax Credit for capital investment, 1.5 percent of the activity generated by companies claiming the International Trade Facility Tax Credit for job creation, 2.7 percent of the activity generated by companies using the Port of Virginia Economic and Infrastructure Development Grant, and 20 percent of the increase in cargo generated by companies using the Port Volume Increase Tax Credit are attributable to the incentives. See Appendix M [online only] for how these estimates were gen-erated.
Port Volume Increase Tax Credit and Port of Virginia grant have moderate economic benefits The economic benefits of the Port Volume Increase Tax Credit and Port of Virginia grant are moderate when assessed per $1 million spent on the incentives and compared with the economic benefits of other incentives. (See Appendix C for more detail on the comparison of economic benefits generated by Virginia incentives.) The Port Vol-ume Increase Tax Credit is estimated to generate an additional 86 jobs, $11 million in Virginia GDP, and $8 million in personal income for every $1 million spent on the credit. After the Data Center Exemption, it generates the highest benefits of all tax incentives evaluated so far in this series (Table 4-2). The Port of Virginia grant gener-ates less additional jobs and income (65 jobs and $6 million in personal income) than the tax credit, but the additional Virginia GDP generated by both programs is similar. Economic benefits generated by the Port Volume Increase Tax Credit may generally be higher than the Port of Virginia grant because a higher percentage of tax credit projects meet at least one indicator of high economic impact. (See Appendix B for more information on industry targeting.)
Net impact is the increase in economic activity induced by the incentives after adjusting for the opportunity cost of increasing taxes to pay for the incentives. (See Appendix N [online only] for information on the total economic im-pact and the opportunity cost of increasing taxes.)
Trade and Transportation Incentives
Commission draft 43
International Trade Facility Tax Credit and Barge and Rail Usage Tax Credit have low economic benefits The economic benefits of the International Trade Facility Tax Credit and Barge and Rail Usage Tax Credit are low when assessed per $1 million spent on the incentives and compared with other incentives’ economic benefits. Even though the economic benefits are low, they are higher than the economic benefits generated by most other tax incentives.
The International Trade Facility Tax Credit has the lowest economic benefits of the four port incentives even though the credit is well targeted to businesses that generate high economic benefits. Benefits are likely lower because the credit is mostly used for investment purposes rather than job creation (90 percent of the credits were awarded based on capital investment rather than job creation). Consequently, the credit has more of a one-time “burst of activity” impact rather than the longer-term sustained boost provided by job creation. In addition, the credit reimburses at a substantially higher rate ($7,394 per job) when the reimbursement is converted to a job equivalent. (See Appendix B for more detail about how this conversion is calculated.) This amount is higher than the average Virginia economic development incentive grant of $6,393 per job and almost double the $3,757 per job offered by standard discretionary grant programs (excluding customized grants). (See Economic Development Incentives 2020, JLARC 2020).
Port incentives have moderate returns in state revenue The port incentives have a moderate return in state revenue for every $1 spent on the incentives compared across other incentives. (See Appendix C for more detail on the comparisons with other incentives.) All of the port incentives are estimated to generate higher returns in state revenue than other tax incentives evaluated so far, with the ex-ception of the Data Center Exemption. While the Port Volume Increase Tax Credit is estimated to generate the highest economic benefits per $1 million spent of the four incentives, the International Trade Facility Tax Credit and Port of Virginia grant gen-erate the highest returns in state revenue. At 47¢ per $1 spent, the International Trade Facility Tax Credit generates a higher return in state revenue than several grant pro-grams.
Port incentives have higher economic benefits and returns in revenue than many incentives because they are used by high impact industries The economic benefits when assessed per $1 million spent and the returns in revenue per $1 spent for the port incentives are higher than the economic benefits and returns in revenue generated by many other incentives. The port tax credits, in particular, have higher economic benefits and returns in revenue than most other tax incentives and even several grant programs. One reason is because the incentives are used mostly by manufacturers, which tend to export their goods outside of the region and have high

Trade and Transportation Incentives
Commission draft 44
employment multipliers. For example, 67 percent of all projects receiving a port in-centive, on average, were in export-base industries compared with only 40 percent across all grants. (See Appendix B for more information.) Port incentives awards and credits also appear to generally align better with industry clusters targeted by the Vir-ginia Economic Development Partnership (VEDP), such as manufacturing, logistics, and research-intensive industries than economic development grant programs at large.
Several changes to improve the effectiveness and use of the port incentives should be considered VPA and industry stakeholders report that the port incentives are working as intended and provide multiple tools to market the Port of Virginia. However, the programs are relatively small and have limited influence on companies’ decisions to use the port. The Port of Virginia grant is viewed as a valuable economic development tool because it allows both VPA and VEDP to establish long-term relationships with companies using the port. VEDP staff indicate that the grant (along with the International Trade Facility Tax Credit) also encourages companies to expand in Virginia in addition to increasing use of Virginia ports. The grant is also useful to local economic developers and is favored by companies because the cash grant can be used immediately upon receipt. The Barge and Rail Usage Tax Credit generates positive social, environmental, and economic benefits by diverting cargo from truck to barge or rail. Because the port incentives have mostly been used by manufacturers that generally have high economic impacts, they generate higher economic benefits and returns in state revenue than many other tax incentives and some grant programs. However, several changes to the port incentives could improve their effectiveness and increase their use.
Port incentives should better target export cargo The Port of Virginia grant, Port Volume Increase Tax Credit, and International Trade Facility Tax Credit should better target companies that export cargo, which would im-prove their economic benefits to the state. These incentives currently make no distinc-tion between export and import cargo. For example, approximately 58 percent of the Port Volume Increase Tax Credit was used for imported cargo between FY10 and FY19, although it varied each year. The percentage of Port of Virginia grant and In-ternational Trade Facility Tax Credit awards for imported cargo is unknown, but more than one-fourth of Port of Virginia grant awards were to projects in retail trade or transportation and warehousing industries and likely represent imported cargo.
Companies that export goods typically have higher economic benefits than companies importing goods, particularly if the imported goods (final and intermediate goods such as parts and equipment) displace other goods produced in the regional economy. How-ever, better targeting exporters would not necessarily increase cargo volume overall—which is the primary purpose of these incentives—and could potentially decrease cargo volume by discouraging importing companies, particularly those outside of Vir-ginia’s captive market, from using the port.

Trade and Transportation Incentives
Commission draft 45
The incentives could better target export cargo and exporting companies by adopting different eligibility requirements or reimbursement levels for export and import cargo (tax credits) or exporting or importing companies (Port of Virginia grant). For exam-ple, Mississippi offers two port volume tax credits, one for export cargo and the other for imported cargo. Mississippi’s import credit has stricter eligibility requirements and requires the company to have corporate headquarters in the state with a minimum of five employees and a minimum capital investment of $2 million. A smaller incentive per job or per TEU, for example, could be awarded for projects in industries such as wholesale or retail trade and distribution.
RECOMMENDATION 4 The General Assembly may wish to consider amending sections §§ 58.1-439.12:06, 58.1-439.12:10, and 62.1-132.3:2 of the Code of Virginia to better target the Interna-tional Trade Facility Tax Credit, Port Volume Increase Tax Credit, and Port of Virginia Economic and Infrastructure Development Grant, respectively, to export cargo.
Port of Virginia grant program guidelines should better align with VEDP grant programs to improve economic benefits Program guidelines for the Port of Virginia grant should better align with those used by VEDP’s incentive grant programs to increase the grant’s economic benefits. Even though the Port of Virginia grant has moderate economic benefits and a moderate return in revenue, benefits are lower than the estimated benefits generated by all of Virginia’s economic development grants, on average.
Currently, the Port of Virginia grant statute and guidelines do not align with economic development incentive best practices. The program statute and guidelines allow re-gional wholesale trade activities, which are not export-based, to qualify, do not restrict funding to competitive projects, and have no minimum wage levels for job creation. Reimbursement levels (which increase with the number of jobs created) also make no differentiation for job “quality,” treating job creation by manufacturers and other ex-port-base industries, which tend to pay higher wages, the same as warehousing and distribution companies, which tend to pay lower wages. The Port of Virginia grant has minimum job creation requirements, which is a best practice, but does not have a min-imum capital investment or port volume increase requirement.
In contrast, statutes and program guidelines for VEDP’s grant programs require pro-jects to be in export-base businesses, be competitive, pay above the locality’s average wages, and meet minimum job creation and capital investment requirements. VEDP considers each project’s return on investment and other criteria in determining grant amounts.
VPA staff, in conjunction with VEDP, the Virginia Maritime Association, local and regional economic development staff, and other stakeholders as necessary, should as-sess changes that could be made to eligibility requirements and other guidelines for the Port of Virginia grant so that they, where appropriate, better align with economic
Grants, on average, are estimated to generate an additional 132 jobs, $23 million in Virginia GDP, and $13 million in personal income per $1 million spent and have a return in revenue of 84¢ per $1 spent. (See Eco-nomic Development In-centives 2020, JLARC 2020.)
Trade and Transportation Incentives
Commission draft 46
development incentive best practices, such as those used by VEDP programs. VPA should report its proposal, along with any necessary statutory changes, to the General Assembly.
RECOMMENDATION 5 Virginia Port Authority (VPA) staff should develop a proposal, in consultation with the Virginia Economic Development Partnership’s (VEDP) Project Review and Credit Committee and other stakeholders, to better align the Port of Virginia Economic In-frastructure and Development Grant with best practices and guidelines used by VEDP’s economic development incentives. VPA staff should report their proposal and necessary statutory changes to the House Finance, House Appropriations, and Senate Finance & Appropriations committees by November 1, 2022.
Port Volume Increase Tax Credit should be converted to a grant to increase usability and to better target industries and locations less likely to use port The Port Volume Increase Tax Credit should be converted to a grant to better target companies in geographic regions or industries, especially those shipping non-contain-erized cargo, that are less likely to use the Port of Virginia without an incentive. A significant portion of credits are provided to businesses in the Hampton Roads region, which is considered the Port of Virginia’s “captive market.” Tax credits can be targeted to some extent, but taxpayers are awarded credits “by right” as long as they meet eli-gibility requirements, whereas grants give program administrators more discretion for approval. VPA, in consultation with VEDP, the Virginia Maritime Association, and regional or local economic developers, could perform a geographical and industrial competitiveness analysis to identify the geographic regions and industries to target and develop guidelines.
Converting the Port Volume Increase Tax Credit to a grant would also make it more usable. Grants are typically more usable than tax credits because they are not reliant on tax liability. Tax credit approvals have generally been substantially lower than their caps, and previous analysis indicated that only 59 percent of the tax credit was typically used within its five-year carryover period.
Making the credit transferable in 2019 likely made it more usable, but it will likely make the program more costly and have other shortcomings. By making it transferable, the credit will likely approach 100 percent of approved amounts, which it did in FY19, because eligible businesses can transfer (or sell) the credit to other taxpayers if they do not have enough tax liability to use the credit themselves. However, businesses typically sell transferable tax credits at a discount, so they will not receive the full value of the credit. In addition, an out-of-state business that qualifies for the credit but has little or no Virginia tax liability now has an incentive to claim the credit because it can sell the credit to another company with a Virginia income tax liability. Changing the tax credit to a grant would likely increase its costs, but because a grant is more discretionary and

Trade and Transportation Incentives
Commission draft 47
can be better targeted, it may have a more positive impact on the return in state reve-nue.
RECOMMENDATION 6 The General Assembly may wish to consider amending § 58.1-439.12:10 of the Code of Virginia to convert the Virginia Port Volume Increase Tax Credit to a grant to increase its usability and to better target it to companies in geographic regions and industries less likely to use Virginia ports.
International Trade Facility Tax Credit reimbursement should better incentivize job creation The reimbursement for the International Trade Facility Tax Credit should be changed to better incentivize job creation, which would improve its economic benefits. This tax credit can reimburse companies for capital investment, but, as noted earlier, the reim-bursement for capital investment is higher than for job creation. The capital invest-ment reimbursement also grows over time as the cost of property and equipment in-creases whereas the job creation amount remains constant at $3,500 per job. Compa-nies mostly use the credit for capital investment rather than job creation, reducing the economic benefits generated by the credit. The reimbursement rate per job could pe-riodically be adjusted for inflation and labor productivity, thereby, making it a more attractive incentive for job creation.
RECOMMENDATION 7 The General Assembly may wish to consider amending § 58.1-439.12:06 of the Code of Virginia to increase the value of the International Trade Facility Tax Credit for job creation.
Combine the Port of Virginia grant and the International Trade Facility Tax Credit into one robust discretionary grant program The Port of Virginia grant and the International Trade Facility Tax Credit could be combined into one robust discretionary grant program. Both programs have similar purposes—to encourage the location or expansion of companies that use Virginia’s ports to ship cargo. Both programs also target similar companies, though the Port of Virginia grant is broader. VPA staff indicated that the Port of Virginia grant is the more useful of the two programs. Converting the International Facility Tax Credit into a grant may make it more usable—only 65 percent of the credit has been utilized to date. It would also likely increase the economic benefits of the incentive because grants can be better targeted. The improvements to the Port of Virginia grant and the Inter-national Trade Facility Tax Credit discussed above should be included when combining the incentives.
VPA staff, in conjunction with VEDP and other stakeholders as necessary, should develop a proposal for combining the Port of Virginia grant and the International

Trade and Transportation Incentives
Commission draft 48
Trade Facility Tax Credit into one robust discretionary grant program. In developing the proposal, consideration should be given to preserving some of the differences between the two programs. For example, the Port of Virginia grant is available to eli-gible companies using state-operated facilities, but the International Trade Facility Tax Credit is available to eligible companies using Virginia’s privately owned and operated ports as well. The Port of Virginia grant has minimum job creation requirements, but the International Trade Facility Tax Credit has minimum cargo volume increase re-quirements. The new grant could be structured similarly to the Virginia Jobs Invest-ment Program, which has subcomponent programs with different eligibility require-ments. Consideration could also be given to preserving the maximum annual awards for both programs ($1.25 million for the International Trade Facility Tax Credit and $5 million for the Port of Virginia Grant), at least initially.
RECOMMENDATION 8 The Virginia Port Authority (VPA) staff, in consultation with the Virginia Economic Development Partnership and other stakeholders as necessary, should develop a pro-posal to combine the Port of Virginia Economic and Infrastructure Development Grant and the International Trade Facility Tax Credit into one robust discretionary grant program. VPA staff should report their proposal to the House Finance, House Appropriations, and Senate Finance & Appropriations committees by November 1, 2022.
VPA should report more performance information about the incentives VPA should collect and report more information about the performance of the port incentives, which would help inform future potential changes to them by the legisla-ture. For example, uniformly collecting cargo increase data for the incentives will also allow VPA to report estimates of how much port volume each year was supported by the incentives. Information collected for this report would also improve future evalu-ation of the economic impact of the incentives. The General Assembly could direct VPA to provide an annual or biennial report on the performance of the incentives. Alternatively, VPA could report this information in its annual report or on its webpage for economic development.
VPA already collects some useful information on the incentives. For the Port of Vir-ginia grant, VPA collects and verifies job creation and minimum port volume goal at-tainment for each project. VPA also tracks and verifies information on additional port activity that results from the Port Volume Increase Tax Credit. VPA would need to coordinate with the Department of Taxation on obtaining additional information for the International Trade Facility Tax Credit and the Barge and Rail Usage Tax Credit and ensuring information reported does not potentially reveal confidential taxpayer information. Additional information that should be collected and included in the port incentive report includes:

Trade and Transportation Incentives
Commission draft 49
port cargo increases, including whether import or export, and capital invest-ment made by each project (Port of Virginia grant),
amount of export and import cargo and regional location of credit user (Port Volume Increase Tax Credit),
job creation or capital investment and export or import cargo increases (Inter-national Trade Facility Tax Credit), and
TEUs (or equivalent) diverted, whether they were diverted to rail or barge, and destination, such as one of Virginia’s inland ports (Barge and Rail Usage Tax Credit).
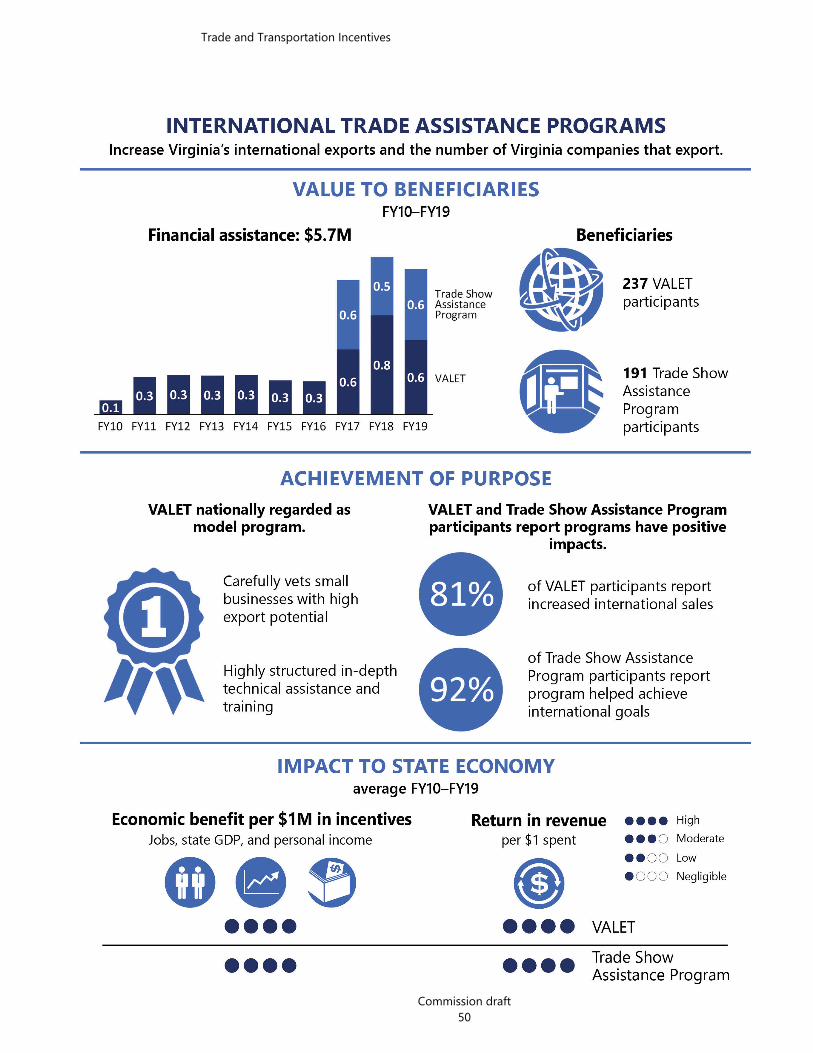
Trade and Transportation Incentives
Commission draft 50

Trade and Transportation Incentives
Commission draft 51
5. International Trade Assistance Programs The Virginia Economic Development Partnership (VEDP) offers several programs designed to increase Virginia’s international exports and the number of Virginia com-panies that export. These include the Virginia Leaders in Export Trade (VALET) pro-gram and the Virginia Trade Show Assistance Program (Table 5-1).
VALET, established by VEDP in 2002, is a two-year export accelerator program that assists established companies with finding and developing export markets for their products and services. The program is selective, and VEDP staff identify and nomi-nate companies to apply for admission. To be eligible, companies must meet employ-ment and sales requirements, already export, and agree to commit $20,000 of their own resources to export development. These requirements ensure participants are al-ready established in the domestic market and have the resources and stability to de-velop and implement an export plan. VALET reimburses participating companies up to $30,000 over the two-year period for approved export-related expenses such as mar-ket research, website and advertising development, and translation services. Compa-nies also receive technical assistance from VEDP staff or private sector partners in several areas, such as developing export plans. The program also has strict require-ments that companies must meet to remain in the program.
VEDP established the Trade Show Assistance Program in 2016, which provides up to $10,000 in financial assistance to companies participating in international trade shows. This helps to reduce costs, which typically run about $50,000–$70,000 per show. Eli-gible expenses include developing booth marketing materials and show registration fees. Companies must have at least five full-time staff to be eligible and must submit an application to VEDP for acceptance into the program.
State economic development agencies target programs designed to enhance interna-tional trade for several reasons. A significant portion of future commodity demand growth is projected to occur outside U.S. borders and in emerging markets, particularly the Asia-Pacific region. Research suggests exporting firms are generally more success-ful economically than non-exporting firms: they pay higher wages, exhibit faster eco-nomic growth, and have higher productivity than non-exporting firms. It is less clear, however, whether exporting leads to higher performance, or if highly productive firms are more likely to become exporters. Virginia would particularly benefit from enhanc-ing international trade because Virginia’s export levels are significantly smaller than most Southeastern states and have lagged U.S. export growth, particularly since the Great Recession (2007–2009). This pattern is largely reflective of Virginia’s services-oriented economy, high reliance on federal government spending, and its relatively small number of large commodity exporting firms or manufacturing industries.
VEDP offers several in-ternational trade pro-grams in addition to VALET and the Trade Show Assistance Pro-gram. These programs include the State Trade Export Promotion, Going Global Defense Initiative, and Virginia Interna-tional Trade Alliance. These other programs are not evaluated in this report because they are primarily federally funded or are not di-rectly targeted to busi-nesses.

Trade and Transportation Incentives
Commission draft 52
TABLE 5-1 Virginia provides international trade assistance through VALET and the Trade Show Assistance Program Virginia Leaders in Export Trade (VALET) (established in 2002)
Purpose Help companies expand their markets and encourage the export of products and services to international markets.
Eligibility Company must employ at least 20 people, have at least $3 million in annual sales, be at least 3 years old, commit at least $20,000 to export development, and have undertaken international market research. Recruitment and vetting occurs prior to application; VEDP trade managers identify and nominate candidates that are most likely to benefit from the program based on prior experience with the firm.
Program features
Two-year acceleration program with 25 companies per year, divided into 2 cohorts. One cohort starts in January and the other in July. There are 50 companies in the program at all times at various stages. Provides financial reimbursement, technical assistance, and training to assist eligible businesses develop international export markets. Reimburses up to $30,000 per company for approved export-related expenses and is competitive.
Trade Show Assistance Program (established in 2016)
Purpose Help companies expand their markets and encourage the export of products and services to international markets.
Eligibility Not targeted to specific industry sectors, but companies must have at least 5 full-time employees and be able to cover the cost of the trade show. First-come, first served but must apply and be approved; has waiting list.
Program features
Reimburses company trade show attendees for up to $10,000 of the cost of trade exhibits. Trade shows can be held either overseas or in the U.S. but must have a substantial international audience by meeting at least one of the following conditions: (a) at least 16% of show attendees or exhibitors must be international or (b) at least 60 countries must be represented at the show.
SOURCE: Weldon Cooper Center review of the Code of Virginia and agency documents. NOTE: Authorized by §§ 2.2-2238(7) and the Appropriation Act.
Companies received $1.2 million from VALET and the Trade Show Assistance Program in FY19 Companies received $1.2 million in international export assistance from VALET and the Trade Show Assistance Program in FY19. Over the past decade, they received a total of $5.7 million in assistance from the two programs. Most of the assistance ($4 million) has been provided by VALET because the Trade Show Assistance Program is new. Since FY16, spending by VALET and the Trade Show Assistance Program has been similar (averaging $0.7 million and $0.6 million per year respectively), though the Trade Show Assistance Program served nearly three times the number of companies each year, on average.
The majority of awards for both programs are directed to businesses in the manufac-turing industry or the professional, scientific, and technical services industry (Figure

Trade and Transportation Incentives
Commission draft 53
5-1). A high concentration of VALET awards (34 percent) are to businesses in profes-sional, scientific, and technical services, because many participating companies are sell-ing novel, high-tech products and services. In comparison, only 4 percent of awards across all grant programs were directed to companies in this industry sector. (See Eco-nomic Development Incentives 2020, JLARC 2020.)
FIGURE 5-1 International export program awards are directed to manufacturing and professional, scientific, and technical services industries (FY10–FY19)
SOURCE: Weldon Cooper Center Analysis of VEDP records. NOTE: A total of $4.6 million was awarded by the VALET program, but only $4 million was paid to companies in reimbursements because some participants did not complete the program.
VALET and the Trade Show Assistance Program tend to target smaller businesses than typical Virginia grant programs. Approximately 60 percent of the businesses in both programs had fewer than 50 employees when they entered the program com-pared with 42 percent of businesses having fewer than 50 employees for all grant pro-grams. (See Economic Development Incentives 2020, JLARC 2020.) The majority of partic-ipants in both programs, particularly VALET, are “middle market” companies with 20 to 499 employees. Research suggests that these are the best sized firms to target for trade assistance. Larger firms do not need government-sponsored trade assistance, and smaller firms are less likely to be able to sustain an international trade program.
Award amounts from both programs are widely distributed across Virginia’s counties and cities compared with other Virginia incentive programs, which tend to be more focused on Northern Virginia and the Tobacco Region. (See Appendix K for maps of awards by program.) To ensure geographical balance, VEDP’s regional trade managers are allotted a quota of businesses to recruit from each region to participate in both programs.
VALET and the Trade Show Assistance Pro-gram are not commonly identified as grants, but they are similar to grants because they provide fi-nancial assistance to businesses (or to a third party for their benefit).

Trade and Transportation Incentives
Commission draft 54
VALET and Trade Show Assistance Program participants report positive effects Research on the effectiveness of international trade assistance programs, in general, is mixed. However, participants of Virginia’s VALET and Trade Show Assistance Pro-gram indicate the programs have helped them increase international sales and expand their international market presence. These positive results may occur, in part, because the programs are targeted to businesses that would benefit the most from export as-sistance, and VALET, in particular, is highly structured. Program participants are also routinely surveyed to obtain feedback, and VEDP has refined the program based on survey responses.
Virginia’s programs—and any state trade assistance program—are likely to have only small impacts on state international trade activity. Trade is affected most by macroe-conomic and federal policy factors. Also, large firms are responsible for the bulk of exports in a state, but most trade assistance programs target smaller businesses.
Research suggests well-designed, targeted programs can be effective Evidence of the effectiveness of trade assistance programs is mixed. Early studies using state and national data often found significant impacts on export activity. For example, one state-level study found that $1 in export promotion is associated with a $432 increase in exports. However, many of these studies had significant methodolog-ical limitations. Studies using firm-based data are generally less conclusive. Many stud-ies show export promotion services can improve some export activity, such as achieve-ment of firm exporting goals, but research is less conclusive about export assistance’s effect on substantive economic measures, such as expanding to new markets and in-creasing export sales.
Research also indicates that international trade shows are positively associated with improved firm exports but is mixed on which aspects of trade show participation are most important. Research indicates that firms that are better prepared for trade shows, spend more on trade shows, and provide better visitor interaction experiences have better outcomes. Some evidence indicates that government-assisted trade show partic-ipants tend to be less prepared than other exhibitors and thus experience poorer out-comes.
Though evidence of program success is mixed, there is some indication that trade programs can be effective if they are properly designed and targeted to firms most likely to benefit, such as small businesses with sufficient size and managerial resources. For example, small businesses are particularly likely to be hampered by limited knowledge of international market opportunities, encounter difficulty obtaining ex-port financing, and experience problems in navigating complex domestic and foreign regulations. One study found that businesses that employ at least 20 workers, offer a differentiated (e.g., new, unique, innovative) product or service, and are willing to com-mit resources toward exporting, are best able to benefit from export services.

Trade and Transportation Incentives
Commission draft 55
VALET is regarded as a model program nationally VALET has been recognized by multiple national organizations (e.g., Brookings Insti-tution; National Council for Public-Private Partnerships) as a model export assistance program other state and local governments should replicate. VALET is credited with optimally targeting resources to carefully vetted small businesses with high export po-tential, which ensures firms are well placed to benefit from the experience.
VALET is also considered a model program because of its content and format. Unlike many programs in other states, VALET is highly structured and provides in-depth technical assistance and training. In addition to the $30,000 to help defray the cost of developing and implementing export plans, the program provides
assistance with export strategic planning and implementation, including iden-tifying markets and opportunities and overcoming communications and legal hurdles in international markets;
training in market research; organizational and corporate structure; logistics, export compliance, and shipping issues; and sales generation and payment;
access to a network of 25 professional experts with expertise in international trade that provide pro bono technical assistance for exporting (e.g., transla-tion, legal, accounting, marketing); and
educational and networking events, including panel discussions, networking sessions, and webinars.
To graduate, VALET program participants must remain actively engaged and create a “Plan of Action,” which describes the company’s strategic goals and export sales tar-gets. Participants must commit to regular program attendance, write an international business plan using a VALET template before receiving reimbursement, and agree to complete an exit interview upon completion of the program. Failure to follow through on program requirements can result in program termination, which has occurred with only about 5 percent of entrants during the FY10–FY18 timeframe. (The FY19 co-horts have not graduated yet.)
While many states offer trade development services, they appear to be less compre-hensive than VALET. Training is typically offered through online materials, webinars, seminars and workshops, and third-party providers, according to a review of state program websites and materials. No state has a wrap-around technical assistance/ac-celerator program like VALET with a similar combination of training, hands-on expe-rience, technical assistance, and financial assistance.
VALET and Trade Show Assistance Program participants report programs have positive impacts VALET has had positive impacts on program participants, according to surveys and exit interviews with program participants. The median company participating in VALET between FY10 and FY19 experienced a 60 percent increase in international sales from program entry to graduation, with an overall increase in sales of 47 percent
Through exit interviews and surveys, VEDP regu-larly assesses client satis-faction with its interna-tional trade programs and their effects on firm performance. For VALET, program staff conduct exit interviews with graduates that ask questions about interna-tional sales and employ-ment that can be com-pared to program entry data from firm applica-tions. International sales figures are used to assess the "before and after" ef-fects of the program. For VALET, VEDP has used consultants to per-form more in-depth sur-veys, one in 2006 and one in 2012. VEDP also conducts an annual survey of firms that receive its interna-tional export services each year, including VALET and the Trade Show Assistance Pro-gram. The survey asks cli-ents about program/ser-vice satisfaction, growth in international sales, pro-jected future growth in such sales, and the im-portance of VEDP assis-tance in generating the additional sales.

Trade and Transportation Incentives
Commission draft 56
across all program graduates. The most recent in-depth survey of VALET participants showed that most participants reported expanding into new international markets (94 percent of respondents), increasing their international sales (81 percent), and imple-menting new international marketing strategies (83 percent). The majority of partici-pants also indicated VALET had a “significant or moderate impact” on their perfor-mance in these areas.
Participants in the Virginia Trade Show Assistance Program also reported positive im-pacts when responding to an annual survey conducted by VEDP. Many program par-ticipants received multiple trade-related services from VEDP, but a review of the 13 survey responses by participants served only through the Trade Show Assistance Pro-gram indicated that program funding played a role in encouraging companies to attend a trade show, add trade shows to their calendar, or enhance the quality of their exhibits. Several respondents indicated their company had not yet realized sales as a result of show attendance but had gained better exposure to international customers, increased interest in their products, generated leads, negotiated contracts, or received prototype orders. Ninety-two percent (11 of 12 responding) indicated that the program helped the company work toward achieving its strategic international goals. VEDP staff indi-cated that outcomes for the Trade Show Assistance Program are more difficult to measure through the annual survey because long lead times are often needed to de-velop sales from trade show exhibits.
Although the exit interviews and annual surveys provide some evidence of positive outcomes for VALET and Trade Show Assistance Program participants, it is difficult to make strong inferences about the effects of the programs. VALET participants are carefully selected by VEDP regional trade managers because of their export success potential, which creates selection bias. VALET and Trade Show Assistance Program participants also received other international trade services or economic development incentives. For VALET, the average participant received at least 7.6 other trade-related services from VEDP, and 10 percent received other state economic development in-centives between FY10 and FY19. For the Trade Show Assistance Program, the aver-age participant received at least 4.7 other trade-related services from VEDP and 30 percent of participants had participated in VALET.
VALET and Trade Show Assistance Program generate high economic benefits and high returns in state revenue The international trade assistance programs are estimated to have generated additional economic activity for the state (Table 5-2). The VALET program generated nearly twice the economic activity per year as the Trade Show Assistance Program, generating an additional 86 jobs, $14 million in Virginia GDP, and $8 million in personal income. The VALET program impacts are slightly higher, in part because it has been around longer, so it provides a longer period in which program completers can generate eco-nomic activity driven by international sales growth. These estimates assume that only a portion of the additional activity is attributed to the programs.
Economic impact analysis of incentive spending between FY10 and FY19 was conducted using economic model-ing software developed by REMI, Inc. (See Appendix M [online only] for the economic impact analysis used in this study.)
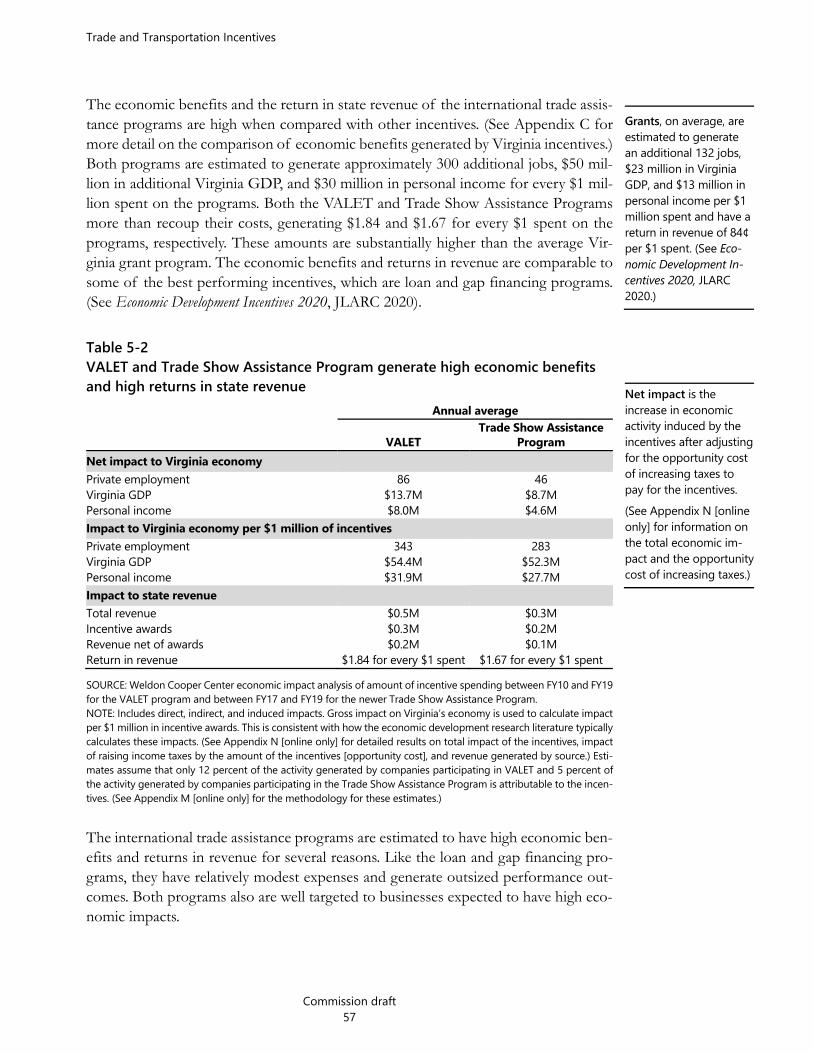
Trade and Transportation Incentives
Commission draft 57
The economic benefits and the return in state revenue of the international trade assis-tance programs are high when compared with other incentives. (See Appendix C for more detail on the comparison of economic benefits generated by Virginia incentives.) Both programs are estimated to generate approximately 300 additional jobs, $50 mil-lion in additional Virginia GDP, and $30 million in personal income for every $1 mil-lion spent on the programs. Both the VALET and Trade Show Assistance Programs more than recoup their costs, generating $1.84 and $1.67 for every $1 spent on the programs, respectively. These amounts are substantially higher than the average Vir-ginia grant program. The economic benefits and returns in revenue are comparable to some of the best performing incentives, which are loan and gap financing programs. (See Economic Development Incentives 2020, JLARC 2020).
Table 5-2 VALET and Trade Show Assistance Program generate high economic benefits and high returns in state revenue Annual average
VALET Trade Show Assistance
Program Net impact to Virginia economy Private employment 86 46 Virginia GDP $13.7M $8.7M Personal income $8.0M $4.6M Impact to Virginia economy per $1 million of incentives Private employment 343 283 Virginia GDP $54.4M $52.3M Personal income $31.9M $27.7M Impact to state revenue Total revenue $0.5M $0.3M Incentive awards $0.3M $0.2M Revenue net of awards $0.2M $0.1M Return in revenue $1.84 for every $1 spent $1.67 for every $1 spent SOURCE: Weldon Cooper Center economic impact analysis of amount of incentive spending between FY10 and FY19 for the VALET program and between FY17 and FY19 for the newer Trade Show Assistance Program. NOTE: Includes direct, indirect, and induced impacts. Gross impact on Virginia’s economy is used to calculate impact per $1 million in incentive awards. This is consistent with how the economic development research literature typically calculates these impacts. (See Appendix N [online only] for detailed results on total impact of the incentives, impact of raising income taxes by the amount of the incentives [opportunity cost], and revenue generated by source.) Esti-mates assume that only 12 percent of the activity generated by companies participating in VALET and 5 percent of the activity generated by companies participating in the Trade Show Assistance Program is attributable to the incen-tives. (See Appendix M [online only] for the methodology for these estimates.)
The international trade assistance programs are estimated to have high economic ben-efits and returns in revenue for several reasons. Like the loan and gap financing pro-grams, they have relatively modest expenses and generate outsized performance out-comes. Both programs also are well targeted to businesses expected to have high eco-nomic impacts.
Grants, on average, are estimated to generate an additional 132 jobs, $23 million in Virginia GDP, and $13 million in personal income per $1 million spent and have a return in revenue of 84¢ per $1 spent. (See Eco-nomic Development In-centives 2020, JLARC 2020.)
Net impact is the increase in economic activity induced by the incentives after adjusting for the opportunity cost of increasing taxes to pay for the incentives. (See Appendix N [online only] for information on the total economic im-pact and the opportunity cost of increasing taxes.)
Trade and Transportation Incentives
Commission draft 58
VEDP should continue periodic in-depth evaluation of VALET and better tailor survey to Trade Show Assistance Program participants Substantive changes do not appear necessary to VALET and the Trade Show Assis-tance Program. VALET, in particular, is a well-regarded program and appears to be well targeted to the businesses most likely to benefit from international export assis-tance. Both programs are reported to generate positive impacts for participants, and both programs generate high economic benefits and high returns in state revenue rel-ative to their cost. VEDP should consider further evaluation of VALET outcomes and developing a more tailored survey for Trade Show Assistance Program partici-pants. These additional efforts will help VEDP determine whether any program changes are needed and will also provide more in-depth information for future eco-nomic impact evaluations of these programs.
VEDP should conduct periodic in-depth evaluations of VALET graduates VEDP should conduct periodic in-depth evaluations of VALET graduates, such as those conducted in 2008 and 2012. These evaluations could be useful in making fur-ther improvements to the program, as needed. Periodic evaluations would ensure that program requirements and targeting remain appropriate as international markets re-spond to economic changes, changes to domestic or foreign policy, and other factors. Information from the 2012 comprehensive survey based-evaluation of VALET grad-uates appears to have been used to modify the program and was the only source of information on longer-term post-graduation program impacts. Evidence from these earlier surveys also suggests that international sales gains and other measures of inter-national engagement increased long after graduation.
Periodic in-depth evaluations of VALET every five to 10 years with a 10-year look-back period would provide useful information to show whether graduating cohorts are continuing to realize and sustain gains in international sales, identify if further pro-gram adjustments are needed, and provide other useful information on client satisfac-tion. Specific questions about the impact of VALET can also help isolate the impact of VALET on participant outcomes versus other programs.
VEDP should tailor some questions on the annual international trade program participant survey to trade show participants VEDP should revise its annual international trade program participant survey and in-clude tailored questions to Trade Show Assistance Program participants. These ques-tions should gather information to better understand trade show performance, includ-ing
information about involvement in pre-show and show day activities; intermediate outcomes achieved such as number of customer contacts, litera-
ture distributed, and lead generations; and

Trade and Transportation Incentives
Commission draft 59
final outcomes for the show such as sales secured at the event, sales that ma-terialized within two years of the event, licensing agreements signed, or other nonquantitative outcomes.
Results could be used to determine whether companies with certain characteristics have better outcomes. This information could be used to make the program—which is first-come, first-serve—more selective by better targeting it to certain companies.
These tailored questions could be included in the annual surveys sent to Trade Show Assistance Program participants two years after trade show participation. Questions to help isolate the impact of the Trade Show Assistance Program on trade show out-comes versus other international trade-related services could also be asked.

Trade and Transportation Incentives
Commission draft 60
Appendixes
Commission draft 61
Appendix A: Study mandate
2020–2022 Appropriation Act Passed as Chapter 552 of the Acts Assembly, April 7, 2021 § 1-11 Item 32 F
F.1. The General Assembly hereby designates the Joint Legislative Audit and Review Commission (JLARC) to conduct, on a continuing basis, a review and evaluation of economic development initia-tives and policies and to make such special studies and reports as may be requested by the General Assembly, the House Appropriations Committee, or the Senate Finance Committee.
2. The areas of review and evaluation to be conducted by the Commission shall include, but are not limited to, the following: (i) spending on and performance of individual economic development in-centives, including grants, tax preferences, and other assistance; (ii) economic benefits to Virginia of total spending on economic development initiatives at least biennially; (iii) effectiveness, value to tax-payers, and economic benefits to Virginia of individual economic development initiatives on a cycle approved by the Commission; and (iv) design, oversight, and accountability of economic development entities, initiatives, and policies as needed.
3. For the purpose of carrying out its duties under this authority and notwithstanding any contrary provision of law, JLARC shall have the legal authority to access the facilities, employees, information, and records, including confidential information, and the public and executive session meetings and records of the board of VEDP, involved in economic development initiatives and policies for the purpose of carrying out such duties in accordance with the established standards, processes, and prac-tices exercised by JLARC pursuant to its statutory authority. Access shall include the right to attend such meetings for the purpose of carrying out such duties. Any non-disclosure agreement that VEDP enters into on or after July 1, 2016, for the provision of confidential and proprietary information to VEDP by a third party shall require that JLARC also be allowed access to such information for the purposes of carrying out its duties.
4. Notwithstanding the provisions of subsection A or B of § 58.1-3 or any other provision of law, unless prohibited by federal law, an agreement with a federal entity, or a court decree, the Tax Com-missioner is authorized to provide to JLARC such tax information as may be necessary to conduct oversight of economic development initiatives and policies.
5. The following records shall be excluded from the provisions of the Virginia Freedom of Infor-mation Act (§ 2.2-3700 et seq.), and shall not be disclosed by JLARC:
(a) records provided by a public body as defined in § 2.2-3701, Code of Virginia, to JLARC in con-nection with its oversight of economic development initiatives and policies, where the records would not be subject to disclosure by the public body providing the records. The public body providing the records to JLARC shall identify the specific portion of the records to be protected and the applicable provision of the Freedom of Information Act or other provision of law that excludes the record or portions thereof from mandatory disclosure.
(b) confidential proprietary records provided by private entities pursuant to a promise of confidenti-ality from JLARC, used by JLARC in connection with its oversight of economic
Appendixes
Commission draft 62
development initiatives and policies where, if such records are made public, the financial interest of the private entity would be adversely affected.
6. By August 15 of each year, the Secretary of Commerce and Trade shall provide to JLARC all information collected pursuant to § 2.2-206.2, Code of Virginia, in a format and manner specified by JLARC to ensure that the final report to be submitted by the Secretary fulfills the intent of the General Assembly and provides the data and evaluation in a meaningful manner for decision-makers.
7. JLARC shall assist the agencies submitting information to the Secretary of Commerce and Trade pursuant to the provisions of § 2.2-206.2, Code of Virginia, to ensure that the agencies work together to effectively develop standard definitions and measures for the data required to be reported and facilitate the development of appropriate unique project identifiers to be used by the impacted agen-cies.
8. The Chairman of JLARC may appoint a permanent subcommittee to provide guidance and direc-tion for ongoing review and evaluation activities, subject to the full Commission's supervision and such guidelines as the Commission itself may provide.
9. JLARC may employ on a consulting basis such professional or technical experts as may be reason-ably necessary for the Commission to fulfill its responsibilities under this authority.
10. All agencies of the Commonwealth shall cooperate as requested by JLARC in the performance of its duties under this authority.
Appendixes
Commission draft 63
Appendix B: Research methods and activities JLARC contracted with the University of Virginia’s Weldon Cooper Center for Public Service (Weldon Cooper Center) for this review. Key research activities performed by Weldon Cooper Center staff for this study included
collection and analysis of national- and state-level financial and economic data and state agency incentive program data;
analysis of incentive program industry targeting;
program employment performance tracking for the Port of Virginia Economic and Infra-structure Development grant;
estimation of business tax savings and tax revenue impacts from exemption;
quantitative analysis of the economic and fiscal impacts of Virginia incentives using a dynamic economic model (See Appendix O, available online, for more detail on the analyses);
social cost benefit analysis of Barge and Rail Usage Tax Credit;
analysis to convert the cost of the International Trade Facility Tax Credit for capital invest-ment to a per job equivalent;
interviews with agencies and stakeholders;
review of other states’ infrastructure and regional incentive programs; and
review of documents and literature.
Collection and analysis of national- and state-level financial and economic data and state agency incentive program data This report drew on multiple federal, state, and private industry sources of economic data. Some of this data was used primarily for descriptive purposes, including to highlight trends in state economic activity, such as rail transportation employment and merchandise exports (Table B-1).
Information from the Virginia Economic Development Partnership, Virginia Port Authority, Virginia Employment Commission, and Department of Taxation was used for both descriptive and analytical purposes. Project-level information was aggregated to show characteristics of program users and fea-tures of the programs, including industry and employment size. Agency data was used in conjunction with other data, such as confidential Virginia Employment Commission (VEC) Quarterly Census of Employment and Wages (QCEW) payroll employment records, to track employment outcomes and conduct economic analyses. These analyses are described further in the sections that follow.

Appendixes
Commission draft 64
TABLE B-1 Multiple data sources were collected and used for a variety of analyses Data source Description of data Analysis National and state financial and economic data American Association of Port Authorities
Port container (TEU) by port Describe trends in port activity levels
Aeronautical Repair Station Association (2019)
FAA repair station, air carrier, and parts manufacturing & distribution employment by state
Describe state employment in aircraft maintenance, repair, and overhaul industry
Bureau of Transportation Statistics, Form 41 Traffic T-100 Segment (all carriers)
Commercial passenger traffic by airline Determine major passenger carriers in Virginia
Bureau of Transportation Statistics, Form 41 Financial Reports, Schedule P-5.2 and P-10
Airline employment and expenditures on in-house (labor and materials) and out-sourced (engine, airframe, and other systems) services
Compute airlines’ outsourcing of airline maintenance, repair, and overhaul and airline maintenance employment over time
EMSI Employment in shipbuilding and repair, other support activities for water transportation industries, railroad rolling stock manufacturing, and rail transportation
Analyze shipping maintenance, repair, and overhaul; rail transportation; and railroad rolling stock employment over time
Federal Aviation Administration Aircraft Registration Database, 2018 and 2019
Compute aircraft parts, engines, and supplies tax revenue impact
U.S. Census Bureau, Economic Census
Product statistics (Industry by Products for U.S. and states), 2012 and 2017
Determine industries which produce commercial ship repair services at state and national level
U.S. Census Bureau, U.S. Trade Online
Exports from Virginia by industry (NAICS) Describe trends in state merchandise exports
U.S. Department of Transportation, Federal Highway Administration
Freight Analysis Framework (FAF) Determine international freight flows by state of origin for Hampton Roads and other ports
Virginia incentive programs Department of Rail and Public Transportation
Virginia Statewide Rail Plan (2017) data based on Rail Enhancement Fund Model
Determine amenity benefits (i.e., congestion improvement, pollution reduction, and safety improvements) for use in REMI PI+ model
Department of Taxation Tax credit utilization for the Barge and Rail Usage, International Trade Facility, and Virginia Port Volume Increase tax credits; Number of approved applications for tax credits; capital investment and job creation for approved International Trade Facility tax credit program
Computation of tax credit usage by fiscal year and utilization purpose
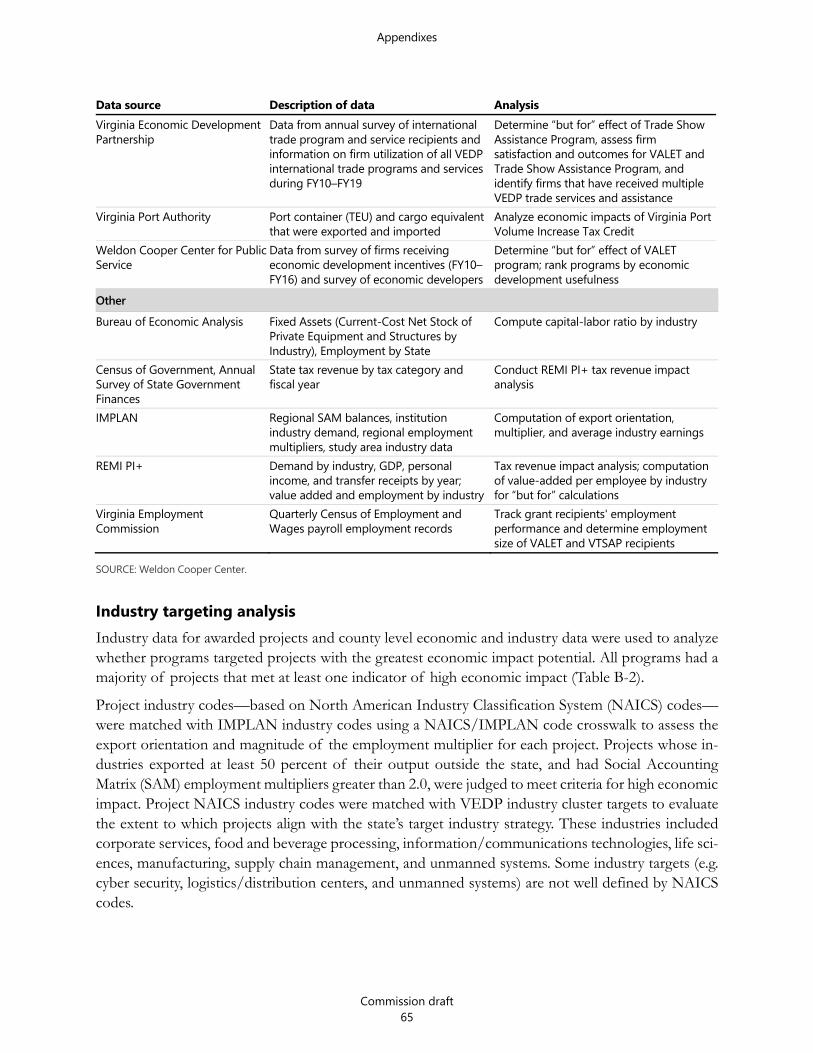
Appendixes
Commission draft 65
Data source Description of data Analysis Virginia Economic Development Partnership
Data from annual survey of international trade program and service recipients and information on firm utilization of all VEDP international trade programs and services during FY10–FY19
Determine “but for” effect of Trade Show Assistance Program, assess firm satisfaction and outcomes for VALET and Trade Show Assistance Program, and identify firms that have received multiple VEDP trade services and assistance
Virginia Port Authority Port container (TEU) and cargo equivalent that were exported and imported
Analyze economic impacts of Virginia Port Volume Increase Tax Credit
Weldon Cooper Center for Public Service
Data from survey of firms receiving economic development incentives (FY10–FY16) and survey of economic developers
Determine “but for” effect of VALET program; rank programs by economic development usefulness
Other Bureau of Economic Analysis Fixed Assets (Current-Cost Net Stock of
Private Equipment and Structures by Industry), Employment by State
Compute capital-labor ratio by industry
Census of Government, Annual Survey of State Government Finances
State tax revenue by tax category and fiscal year
Conduct REMI PI+ tax revenue impact analysis
IMPLAN Regional SAM balances, institution industry demand, regional employment multipliers, study area industry data
Computation of export orientation, multiplier, and average industry earnings
REMI PI+ Demand by industry, GDP, personal income, and transfer receipts by year; value added and employment by industry
Tax revenue impact analysis; computation of value-added per employee by industry for “but for” calculations
Virginia Employment Commission
Quarterly Census of Employment and Wages payroll employment records
Track grant recipients' employment performance and determine employment size of VALET and VTSAP recipients
SOURCE: Weldon Cooper Center.
Industry targeting analysis Industry data for awarded projects and county level economic and industry data were used to analyze whether programs targeted projects with the greatest economic impact potential. All programs had a majority of projects that met at least one indicator of high economic impact (Table B-2).
Project industry codes—based on North American Industry Classification System (NAICS) codes—were matched with IMPLAN industry codes using a NAICS/IMPLAN code crosswalk to assess the export orientation and magnitude of the employment multiplier for each project. Projects whose in-dustries exported at least 50 percent of their output outside the state, and had Social Accounting Matrix (SAM) employment multipliers greater than 2.0, were judged to meet criteria for high economic impact. Project NAICS industry codes were matched with VEDP industry cluster targets to evaluate the extent to which projects align with the state’s target industry strategy. These industries included corporate services, food and beverage processing, information/communications technologies, life sci-ences, manufacturing, supply chain management, and unmanned systems. Some industry targets (e.g. cyber security, logistics/distribution centers, and unmanned systems) are not well defined by NAICS codes.
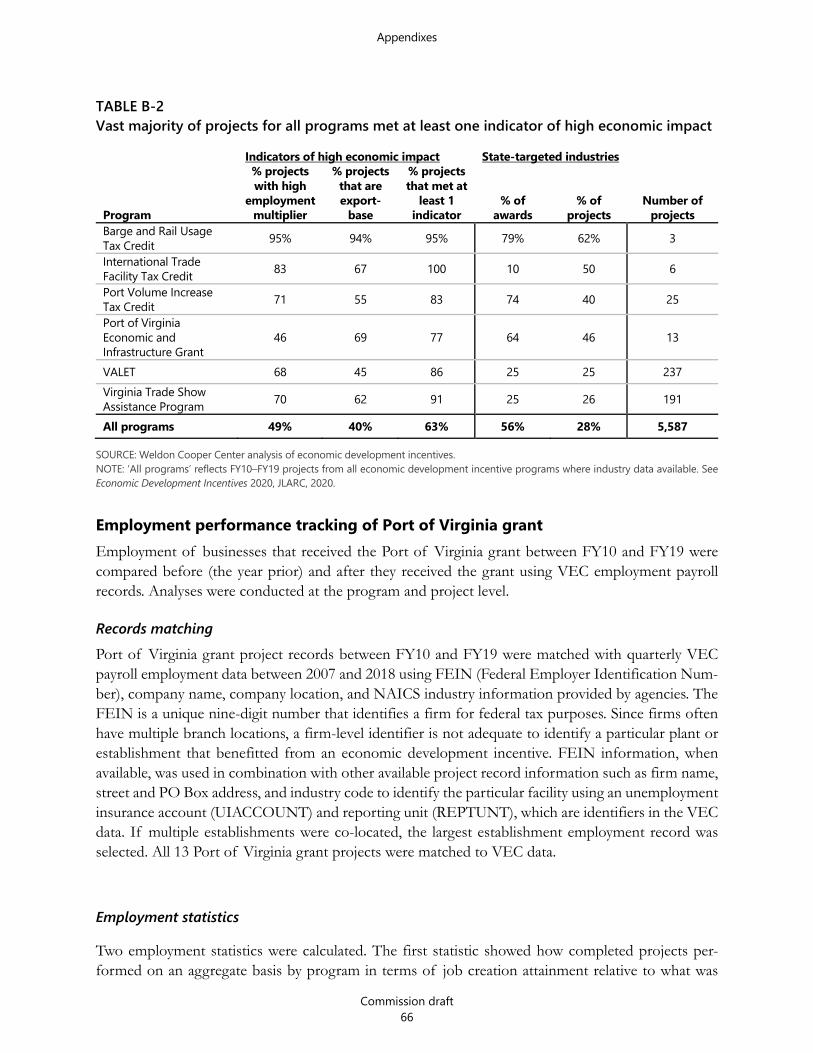
Appendixes
Commission draft 66
TABLE B-2 Vast majority of projects for all programs met at least one indicator of high economic impact
Program
Indicators of high economic impact State-targeted industries
Number of projects
% projects with high
employment multiplier
% projects that are export-
base
% projects that met at
least 1 indicator
% of awards
% of projects
Barge and Rail Usage Tax Credit 95% 94% 95% 79% 62% 3 International Trade Facility Tax Credit 83 67 100 10 50 6 Port Volume Increase Tax Credit 71 55 83 74 40 25 Port of Virginia Economic and Infrastructure Grant
46 69 77 64 46 13
VALET 68 45 86 25 25 237 Virginia Trade Show Assistance Program 70 62 91 25 26 191
All programs 49% 40% 63% 56% 28% 5,587
SOURCE: Weldon Cooper Center analysis of economic development incentives. NOTE: ‘All programs’ reflects FY10–FY19 projects from all economic development incentive programs where industry data available. See Economic Development Incentives 2020, JLARC, 2020.
Employment performance tracking of Port of Virginia grant Employment of businesses that received the Port of Virginia grant between FY10 and FY19 were compared before (the year prior) and after they received the grant using VEC employment payroll records. Analyses were conducted at the program and project level.
Records matching Port of Virginia grant project records between FY10 and FY19 were matched with quarterly VEC payroll employment data between 2007 and 2018 using FEIN (Federal Employer Identification Num-ber), company name, company location, and NAICS industry information provided by agencies. The FEIN is a unique nine-digit number that identifies a firm for federal tax purposes. Since firms often have multiple branch locations, a firm-level identifier is not adequate to identify a particular plant or establishment that benefitted from an economic development incentive. FEIN information, when available, was used in combination with other available project record information such as firm name, street and PO Box address, and industry code to identify the particular facility using an unemployment insurance account (UIACCOUNT) and reporting unit (REPTUNT), which are identifiers in the VEC data. If multiple establishments were co-located, the largest establishment employment record was selected. All 13 Port of Virginia grant projects were matched to VEC data.
Employment statistics
Two employment statistics were calculated. The first statistic showed how completed projects per-formed on an aggregate basis by program in terms of job creation attainment relative to what was

Appendixes
Commission draft 67
reported in agency records. Projects were tracked before and after they received notification of award, between 2010 and 2019. Annual project cohorts were “stacked” by the year of award (-1, 0,+1,+2,+3,+4, etc.). Thus, for a FY12 award cohort, 2010 represents year -1, 2011 year 0, 2012 year 1, etc. Aggregate project employment change over the period was calculated by comparing each year to the baseline year (i.e., year 1, compared to the baseline year (-1) value). These employment change estimates were compared to aggregate job creation “goals” stated in performance agreements or grant applications, with 0 percent representing no aggregate job creation relative to the goal and 100 percent indicating that agencies created all the jobs they promised.
A second statistic computes the percentage of completed projects that had met the job completion benchmarks or job creation goals for each program. To simplify the analysis, this statistic was calcu-lated by identifying the maximum employment change over the award year and comparing it with the project job creation baseline number.
These measures could either undercount or over count aggregate and project-level employment com-pletion rates. First, failure to correctly match project records and VEC establishment data would in-troduce one source of bias. Second, the annualized unit used to verify employment goal attainment may not correspond to the exact benchmark start and end dates used in assessing job creation attain-ment. Thus, monthly or quarterly data would be more appropriate for appraising job creation com-pletion than the annual averages used here. A third source of estimation error is the project comple-tion statistic; projects are assessed based on maximum employment change with regard to the base year which is the year before the Port of Virginia grant award, rather than exact start and finish dates.
Estimation of business savings and tax revenue impacts from incentives Business spending, tax savings, and tax revenue impact estimates for individual incentive programs came from several sources, including agency records, imputation using information from secondary sources, and a Weldon Cooper Center firm survey. Information on amounts awarded and disbursed to VALET and Virginia Trade Show Assistance Program grant recipients were obtained from VEDP project records, while Port of Virginia grant records were obtained from the Virginia Port Authority. Business tax credit utilization data for the Barge and Rail Usage Tax Credit, International Trade Facility Tax Credit, and Virginia Port Volume Increase Tax Credit were obtained from TAX annual reports. Information on business tax savings and associated state revenue impacts for the sales and use tax exemptions were estimated using both primary and secondary data.
Railroad common carriers exemption and airline common carrier exemption Estimates for these exemptions rely primarily on IMPLAN data for Virginia. IMPLAN is an industry-standard, commercial economic impact model and regional economic database. It is based on input-output analysis, which requires estimates of the value of intermediate input purchases for each indus-try. Estimates were obtained for each exemption by identifying the sector that was eligible for the exemption and then identifying the intermediate input purchases that would be exempt. The interme-diate input purchase estimates for Virginia then formed the basis of the relevant sales tax base for sales and use tax revenue impact calculations.
The purchasing sectors in IMPLAN vary by tax exemption. Using the 2018–2019 sector scheme (which differs from the 2014–2017 sector scheme and the 2009–2013 sector scheme), the railroad
Appendixes
Commission draft 68
common carrier falls into sector 415 (rail transportation) and airline common carrier exemption sector 413 (air transportation).
Next, the exempt purchases are identified. For the railroad common carrier exemptions, it is spending on inputs that fall within manufactured commodity sectors 3109–3395 and leased goods commodity sectors 3450–3454 that are exempt. The airline common carrier exemptions covers the same inputs except for fuel and aircraft, which are covered under other exemptions. The taxable purchase amount is estimated by multiplying industry output by gross absorption coefficients for IMPLAN for these commodity sectors. These coefficients represent the input purchases for various commodities per dollar of output. For example, the rail transportation industry spent $0.014817993 per dollar of output on commodity 3132 (Sawmills). This absorption coefficient was multiplied by the output of the rail transportation industry for 2019 ($2,090,576,700) to obtain the estimated expenditure on this input for the year ($30,978,151).
Because the air common carrier exemption is more narrowly targeted than the air transportation IM-PLAN sector, supplemental data from EMSI and Bureau of Transportation Statistics was used to scale the sector purchases to a narrower industry subset. The airline common carrier exemption is restricted to that portion of the air transportation sector that provides scheduled service to Virginia airports at least once per week. Eligible purchases were imputed by apportioning IMPLAN input purchase estimates by the percentage of the air transportation industry (NAICS 481) providing sched-uled service (NAICS 4811---Scheduled Air Transportation) and apportioning again based on the per-centage of scheduled departures performed by airlines that provide service at least once per week based on Bureau of Transportation Statistics T-100 Air Carrier Traffic Segment data.
The estimates for the common carrier exemptions using these methodologies are comparable to pre-vious survey-based estimates provided by JLARC. For a 2012 tax preferences report, JLARC used industry responses from Class I and Class III state railroads to estimate that the railroad common carrier had a tax revenue impact in calendar year 2010 of $18.3 million (JLARC memo) compared with a slightly lower estimate ($15.9 million) for FY10 in this report. JLARC staff used public financial information (BTS Air Carrier Statistics Form 41 Traffic T-100 Segment (All Carriers) CY2010, Form 41 Financial Data Schedule) to estimate the tax revenue impact for the airline common carrier exemp-tion in calendar year 2010, which was $10.1 million. The estimate for FY10 included in this report is slightly higher ($12 million).
Railroad rolling stock exemption Estimates of the revenue impact for the railroad rolling stock exemption were made by drawing on data about the quantity of privately owned railroad freight rolling stock in the U.S. and estimating the portion of replacement stock that would be purchased by Virginia companies. This was done by ap-portioning figures on North American revenue producing railroad stock obtained from RailInc (2020) for the period 2009–2018 to the U.S. based on the size of U.S. GDP as a proportion of Canada, Mexico, and the U.S. According to Blaze (2019a), approximately 40 percent of freight cars are con-trolled by railroads with the other 60 percent owned or leased by other business entities. For this analysis, 60 percent of new freight car inventory was assigned to other private industry. Railroad rolling stock has an estimated life of 40 years (U.S. International Trade Commission 2011), so it was assumed that 2.5 percent of previous year stock is replaced each year.
Appendixes
Commission draft 69
Next, the new estimated freight rail rolling stock by private industry was apportioned to Virginia. Virginia is assumed to have lower railcar demand because of its smaller representation of rail freight dependent industries, such as mining and the chemical industry. U.S. new freight car demand was apportioned to Virginia based on a statewide industry adjustment factor. This factor was determined by first calculating industry demand for freight rail. According to U.S. Census 2012 Commodity Flow data the national mining industry (coal, stone, minerals, etc.) accounted for 54 percent of rail-only mode tonnage and 8 percent of value hauled. Similarly, the chemical manufacturing industry accounts for 20 percent of value and 21 percent of tonnage. It was assumed that freight car usage by industry reflected an average of weight and value since higher value goods may weigh less but have greater volume and space requirements (e.g., the mining industry accounts for 31.2 percent of freight car usage and chemical manufacturing for 20.5 percent).
Virginia’s adjustment factor was estimated by weighting the industry freight car usage factor by Vir-ginia’s share of employment in the industry relative to total U.S. employment in the industry. This resulted in a state industry adjustment factor of approximately 2.2 percent (this is lower than Virginia’s 2.6 percent proportion of total U.S. employment and GDP), meaning that 2.2 percent of national new freight railcar purchases by industry are assigned to Virginia private owners. Now that Virginia’s esti-mated number of purchased freight cars is estimated, it is assumed that the average cost of new rail stock is $125,000, an average of the range of $100,000–$150,000 (Blaze 2019b). This gives an estimate of annual sales. These estimated eligible sales by year were then multiplied by the effective tax rates for each fiscal year (i.e., (3.92 percent in 2010, 3.98 percent in 2011–-2013, and 4.28 percent in 2014–2019) to obtain revenue impacts.
This estimation methodology differs from that used in previous annual incentives reports. For those reports, IMPLAN data was used in a manner similar to that described above for estimating the com-mon carrier exemption revenue impacts. The purchasing sectors for the rolling stock exemption in those calculations include any industry subject to the tax but exclude the rail transportation industry and government passenger rail purchasers who are exempt under other tax provisions or exemptions. The exempt purchase consists of IMPLAN sector 359 (railroad rolling stock manufacturing). This method had the inadvertent effect of counting sales of railroad rolling stock manufactured compo-nents, which are part of the railroad rolling stock manufacturing (359) sector. The average estimate of railroad rolling stock exemption for the FY10–FY19 period was $30.2 million using this prior method compared with the smaller $22.6 million estimate using the revised methodology described above.
Ships and vessels exemption The revenue impact of the ships and vessels exemption was estimated using a survey of Virginia-based shipbuilding and repair, chandler, and dredging firms. The survey was approved by the Univer-sity of Virginia Institutional Review Board. The survey contact list was assembled from membership information provided by the Virginia Maritime Association, information presented on the website of the Virginia Ship Repair Association, and confidential employment records from VEC’s Quarterly Census of Employment and Wages (QCEW) for the shipbuilding and repair industry (NAICS 336611). Using 2019 QCEW data, the annual employment for each firm was computed. This was used to weight survey responses and nonresponses.
Appendixes
Commission draft 70
The assembled contact list consisted of 51 firms (two large defense-only shipbuilding contractors were dropped from the original population). Surveyed firms were asked to provide the total amount of spending that was eligible for the exemption from 2017–2019. They were also asked to estimate the overall percentage of firm revenues derived from the federal government (e.g., Department of Defense). Firms were contacted three times by regular mail to encourage participation in the survey. Survey forms were returned via mail in a postage-paid, self-addressed envelope. Eight firms responded out of an adjusted sample size of 47 firms after accounting for undeliverable mail for an adjusted response rate of 17 percent. Estimates of industry-wide exemption-eligible purchases were made by extrapolating the average spending, weighted by firm employment in the contact database. Although responding firms represented 17 percent of the adjusted firm population, they accounted for 24 per-cent of total employment for the surveyed population in 2019. The 2017 estimate was deflated back-wards in time (2010–2016) to provide constant real estimates for the prior period. State tax revenue impact was obtained by multiplying the effective state sales and use tax rates for each fiscal year (3.92 percent in 2010, 3.98 percent in 2011–2013, and 4.28 percent in 2014–2019) by estimated eligible sales.
The estimate of the state tax revenue impact of the exemption using this survey approach was $5.63 million in FY12. This amount is larger than a survey-based tax revenue impact estimate by the De-partment of Taxation of $2.8 million (JLARC 2012) but smaller than a previous Department of Tax-ation (1995) estimate of $8.2 million. The total sum of state tax revenue impacts for the FY10–FY19 period was $60.9 million, which is smaller than IMPLAN-based estimates reported in the last annual incentives report (JLARC 2020), which totaled $72.1 million for the same period.
Aircraft repair parts exemption Estimates of the revenue impact of the aircraft repair parts exemption rely on a methodology similar to that used by the Pennsylvania Independent Fiscal Office (2013) to provide a revenue impact analysis for a comparable aircraft sales and use tax exemption in that state. Several variables affect aircraft maintenance expenditures, including fleet size, age, engine type (e.g., turbine, turboprop, turbojet, ro-tary), level of utilization, number of landings, size, and weight (Fioriti, Vercella and Viola 2018). Be-cause of data limitations on state aircraft inventory and costs, information on just two characteristics are used here: the number of aircraft registered in the state by number and type of engines. Average annual maintenance, repair, and overhaul expenses are used for general aviation aircraft divided into the categories of: (1) piston engine airplanes, one-engine, (2) piston engine airplanes, multi-engine, (3) turboprop airplanes, one-engine, (4) turboprop airplanes, multi-engine, (5) turbojet/turbofan air-planes, (6) rotorcraft piston, and (7) rotorcraft turbine, one-engine.
Not considered in the estimates are various types of other aircraft (e.g., gliders, unmanned aerial vehi-cles). Although the UAS maintenance and repair market may be important in the future, evidence suggests that drone maintenance forms a negligible part of current aircraft repair and maintenance spending. Most drones are relatively inexpensive, depreciate rapidly and would likely be replaced rather than repaired or repaired via routine “plug and replace” methods rather than requiring certified repair services (Adams 2020). This may change in the future, however, as the industry grows and matures and airworthiness regulatory requirements tighten.
Information on state aircraft inventory by category was obtained from the Federal Aviation Admin-istration (FAA) plane registration database for 2018 and 2019 (Table B-3). Virginia aircraft registrations do not appear to include common carrier aircraft, which are usually assigned to an airline’s chief hub.
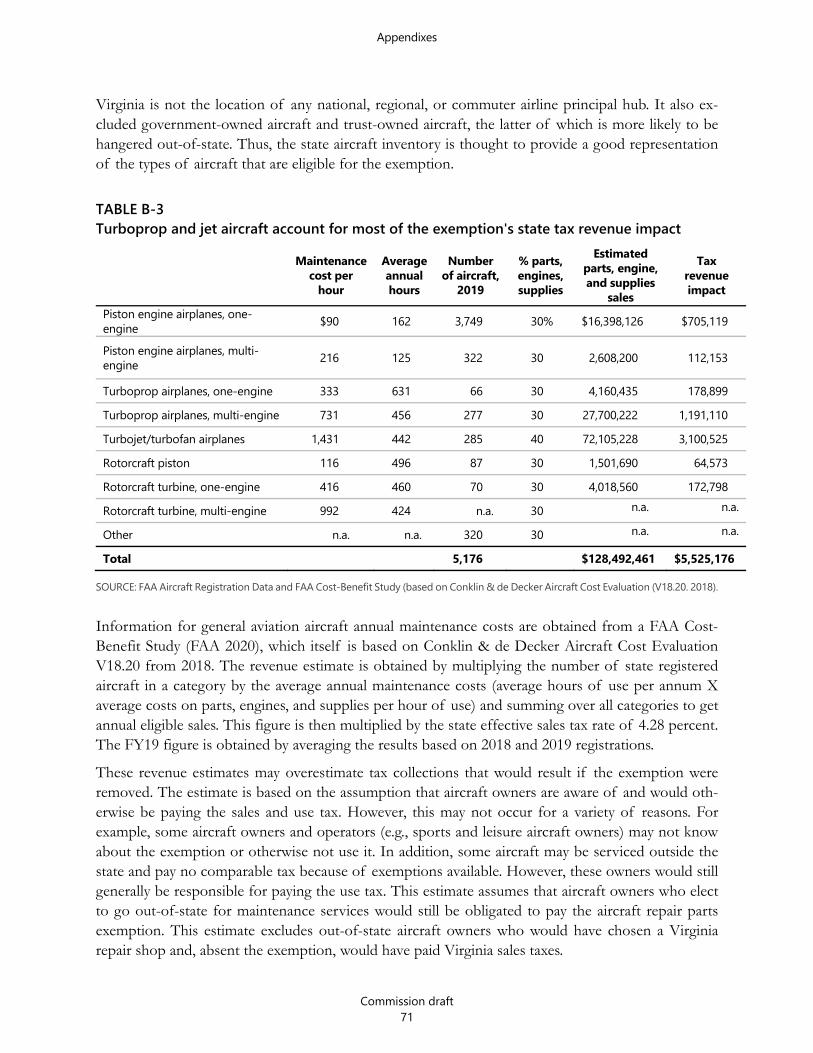
Appendixes
Commission draft 71
Virginia is not the location of any national, regional, or commuter airline principal hub. It also ex-cluded government-owned aircraft and trust-owned aircraft, the latter of which is more likely to be hangered out-of-state. Thus, the state aircraft inventory is thought to provide a good representation of the types of aircraft that are eligible for the exemption.
TABLE B-3 Turboprop and jet aircraft account for most of the exemption's state tax revenue impact
Maintenance
cost per hour
Average annual hours
Number of aircraft,
2019
% parts, engines, supplies
Estimated parts, engine, and supplies
sales
Tax revenue impact
Piston engine airplanes, one-engine $90 162 3,749 30% $16,398,126 $705,119
Piston engine airplanes, multi-engine 216 125 322 30 2,608,200 112,153
Turboprop airplanes, one-engine 333 631 66 30 4,160,435 178,899 Turboprop airplanes, multi-engine 731 456 277 30 27,700,222 1,191,110 Turbojet/turbofan airplanes 1,431 442 285 40 72,105,228 3,100,525 Rotorcraft piston 116 496 87 30 1,501,690 64,573 Rotorcraft turbine, one-engine 416 460 70 30 4,018,560 172,798 Rotorcraft turbine, multi-engine 992 424 n.a. 30 n.a. n.a.
Other n.a. n.a. 320 30 n.a. n.a.
Total 5,176 $128,492,461 $5,525,176
SOURCE: FAA Aircraft Registration Data and FAA Cost-Benefit Study (based on Conklin & de Decker Aircraft Cost Evaluation (V18.20. 2018).
Information for general aviation aircraft annual maintenance costs are obtained from a FAA Cost-Benefit Study (FAA 2020), which itself is based on Conklin & de Decker Aircraft Cost Evaluation V18.20 from 2018. The revenue estimate is obtained by multiplying the number of state registered aircraft in a category by the average annual maintenance costs (average hours of use per annum X average costs on parts, engines, and supplies per hour of use) and summing over all categories to get annual eligible sales. This figure is then multiplied by the state effective sales tax rate of 4.28 percent. The FY19 figure is obtained by averaging the results based on 2018 and 2019 registrations.
These revenue estimates may overestimate tax collections that would result if the exemption were removed. The estimate is based on the assumption that aircraft owners are aware of and would oth-erwise be paying the sales and use tax. However, this may not occur for a variety of reasons. For example, some aircraft owners and operators (e.g., sports and leisure aircraft owners) may not know about the exemption or otherwise not use it. In addition, some aircraft may be serviced outside the state and pay no comparable tax because of exemptions available. However, these owners would still generally be responsible for paying the use tax. This estimate assumes that aircraft owners who elect to go out-of-state for maintenance services would still be obligated to pay the aircraft repair parts exemption. This estimate excludes out-of-state aircraft owners who would have chosen a Virginia repair shop and, absent the exemption, would have paid Virginia sales taxes.

Appendixes
Commission draft 72
This estimate is different than the FY19 estimate provided for the most recent annual economic in-centives report (JLARC 2020), which was based on IMPLAN data. For that estimate the IMPLAN air transportation sector parts and supplies purchases were apportioned to the nonscheduled air trans-portation sector using 6-digit NAICS industry EMSI employment estimates and multiplied by the effective sales and use tax rate. This produced a much lower estimate of FY19 revenue impact of $891,190. The Department of Taxation, using a similar methodology with Census Bureau data that also only accounts for nonscheduled air service, estimated the FY20 revenue impact of the exemption to be $399,629 (Memo from the Department of Taxation on exemption estimate methodology for aircraft repair, parts, and supplies, 2020). These lower estimates appear to be due to counting only revenues attributable to the exemption that apply to services provided by nonscheduled carrier indus-try (e.g., charter aircraft companies) and not the significantly larger universe of general aviation aircraft to which the exemption potentially applies.
Social cost benefit analysis of Barge and Rail Usage Tax Credit A social cost benefit analysis of the Barge and Rail Us-age Tax Credit was conducted to measure the social welfare effects of diverting cargo from trucks to barge transport. Information from the De-partment of Rail and Public Transportation’s Rail Enhancement Fund User’s Model was used to ana-lyze the potential social, environmental and economic benefits of the tax credit. This model was cre-ated by a national transportation consulting firm. Appendix H of the Virginia Statewide Rail Plan (Freight and Passenger Rail Benefit Methodology) describes the methodology and parameters used to translate rail traffic diversion figures into social and environmental benefits.
Benefits are divided into user cost savings, pavement maintenance savings, air pollutant emissions benefits by source (NOX, CO, VOC, CO2, PM2.5 and PM10), and benefits from reduced vehicular crashes. For the purposes of the analysis, it was assumed that
there were no user cost savings and that one 20-foot equivalent unit (TEU) equated to one ve-hicle removed from traffic,
10,000 TEUs were approved at a cost of $250,000 in credits ($25 credit X 10,000 TEU), and
the incentive induced the entire traffic diversion.
User inputs include TEU to tonnage conversion (assumed to be 14 tons per TEU), average highway length (assumed to be the shortest road distance from the Richmond Marine Terminal to the Norfolk Terminal or 86 miles), percentage of travel in rural versus urban areas (assumed 76 percent rural and 24 percent urban).
According to calculations, the benefits that accrue include $103,000 in pavement maintenance cost savings, $392,000 in accident reduction benefits, $124,000 in congestion cost savings, and $84,000 in benefit from air pollutant reduction. These sum to $703,000 in total benefits, which is more than 2.5 times larger than the cost of the credits. This simplified cost-benefit analysis suggest that the social, environmental, and economic benefits substantially outweighed the costs of the program.
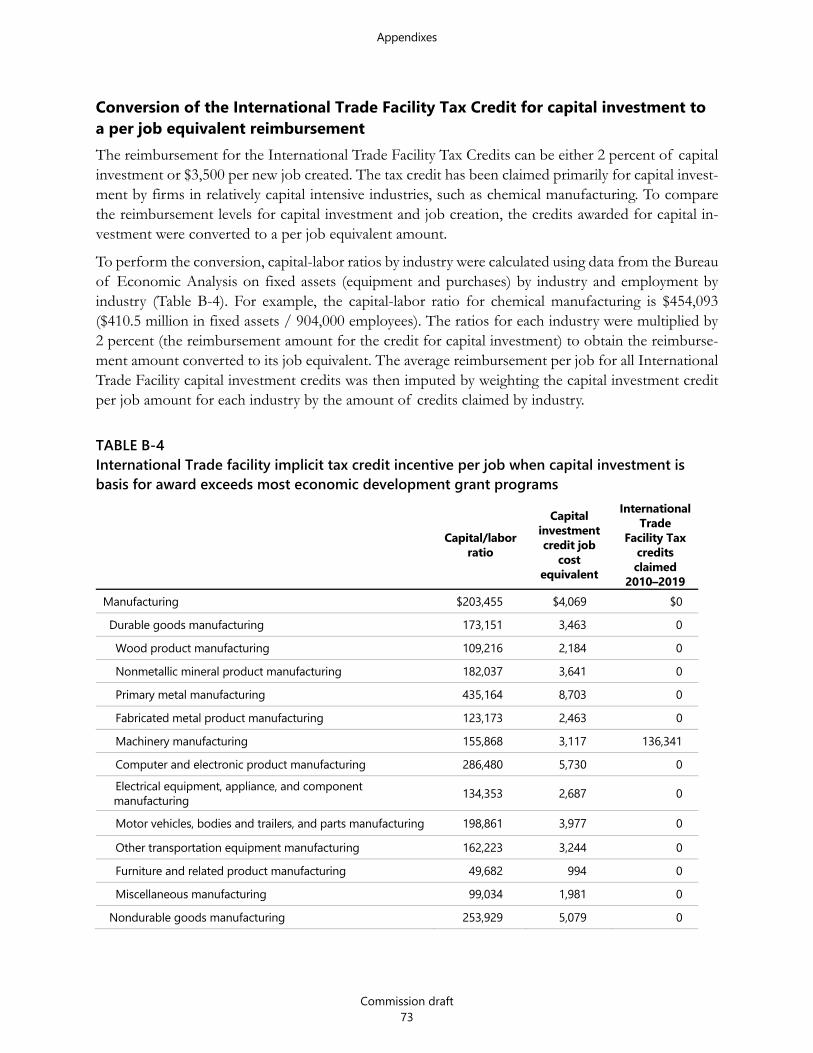
Appendixes
Commission draft 73
Conversion of the International Trade Facility Tax Credit for capital investment to a per job equivalent reimbursement The reimbursement for the International Trade Facility Tax Credits can be either 2 percent of capital investment or $3,500 per new job created. The tax credit has been claimed primarily for capital invest-ment by firms in relatively capital intensive industries, such as chemical manufacturing. To compare the reimbursement levels for capital investment and job creation, the credits awarded for capital in-vestment were converted to a per job equivalent amount.
To perform the conversion, capital-labor ratios by industry were calculated using data from the Bureau of Economic Analysis on fixed assets (equipment and purchases) by industry and employment by industry (Table B-4). For example, the capital-labor ratio for chemical manufacturing is $454,093 ($410.5 million in fixed assets / 904,000 employees). The ratios for each industry were multiplied by 2 percent (the reimbursement amount for the credit for capital investment) to obtain the reimburse-ment amount converted to its job equivalent. The average reimbursement per job for all International Trade Facility capital investment credits was then imputed by weighting the capital investment credit per job amount for each industry by the amount of credits claimed by industry.
TABLE B-4 International Trade facility implicit tax credit incentive per job when capital investment is basis for award exceeds most economic development grant programs
Capital/labor ratio
Capital investment credit job
cost equivalent
International Trade
Facility Tax credits claimed
2010–2019 Manufacturing $203,455 $4,069 $0 Durable goods manufacturing 173,151 3,463 0 Wood product manufacturing 109,216 2,184 0 Nonmetallic mineral product manufacturing 182,037 3,641 0 Primary metal manufacturing 435,164 8,703 0 Fabricated metal product manufacturing 123,173 2,463 0 Machinery manufacturing 155,868 3,117 136,341 Computer and electronic product manufacturing 286,480 5,730 0 Electrical equipment, appliance, and component
manufacturing 134,353 2,687 0
Motor vehicles, bodies and trailers, and parts manufacturing 198,861 3,977 0 Other transportation equipment manufacturing 162,223 3,244 0 Furniture and related product manufacturing 49,682 994 0 Miscellaneous manufacturing 99,034 1,981 0 Nondurable goods manufacturing 253,929 5,079 0
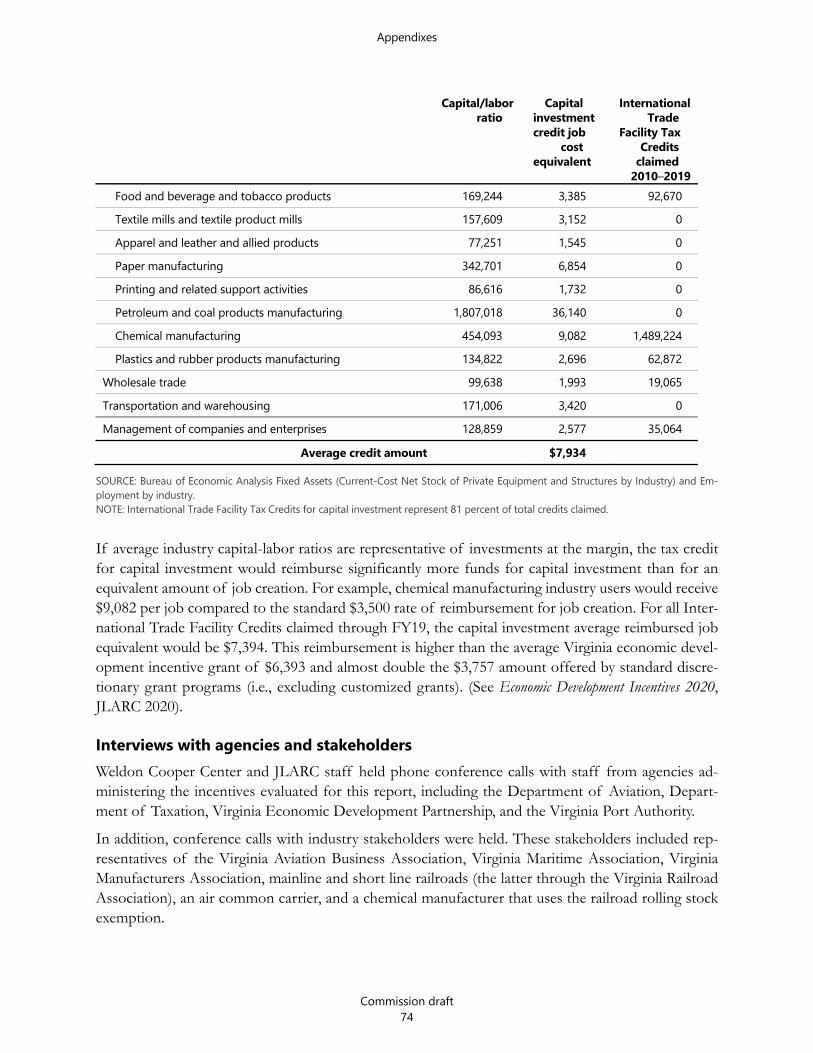
Appendixes
Commission draft 74
Capital/labor ratio
Capital investment credit job
cost equivalent
International Trade
Facility Tax Credits
claimed 2010–2019
Food and beverage and tobacco products 169,244 3,385 92,670 Textile mills and textile product mills 157,609 3,152 0 Apparel and leather and allied products 77,251 1,545 0 Paper manufacturing 342,701 6,854 0 Printing and related support activities 86,616 1,732 0 Petroleum and coal products manufacturing 1,807,018 36,140 0 Chemical manufacturing 454,093 9,082 1,489,224 Plastics and rubber products manufacturing 134,822 2,696 62,872 Wholesale trade 99,638 1,993 19,065 Transportation and warehousing 171,006 3,420 0 Management of companies and enterprises 128,859 2,577 35,064
Average credit amount $7,934
SOURCE: Bureau of Economic Analysis Fixed Assets (Current-Cost Net Stock of Private Equipment and Structures by Industry) and Em-ployment by industry. NOTE: International Trade Facility Tax Credits for capital investment represent 81 percent of total credits claimed.
If average industry capital-labor ratios are representative of investments at the margin, the tax credit for capital investment would reimburse significantly more funds for capital investment than for an equivalent amount of job creation. For example, chemical manufacturing industry users would receive $9,082 per job compared to the standard $3,500 rate of reimbursement for job creation. For all Inter-national Trade Facility Credits claimed through FY19, the capital investment average reimbursed job equivalent would be $7,394. This reimbursement is higher than the average Virginia economic devel-opment incentive grant of $6,393 and almost double the $3,757 amount offered by standard discre-tionary grant programs (i.e., excluding customized grants). (See Economic Development Incentives 2020, JLARC 2020).
Interviews with agencies and stakeholders Weldon Cooper Center and JLARC staff held phone conference calls with staff from agencies ad-ministering the incentives evaluated for this report, including the Department of Aviation, Depart-ment of Taxation, Virginia Economic Development Partnership, and the Virginia Port Authority.
In addition, conference calls with industry stakeholders were held. These stakeholders included rep-resentatives of the Virginia Aviation Business Association, Virginia Maritime Association, Virginia Manufacturers Association, mainline and short line railroads (the latter through the Virginia Railroad Association), an air common carrier, and a chemical manufacturer that uses the railroad rolling stock exemption.
Appendixes
Commission draft 75
Review of trade and transportation industry incentives in other states Weldon Cooper Center staff reviewed several sources of information to obtain information on com-parable trade and transportation incentives offered by other states. Sources often varied by the type of incentive, since there is no authoritative comprehensive source on all state incentives.
Port incentive information was obtained from Kruse (2015), Frisman (2014), Rappa (2010), and an analysis supporting an earlier JLARC study of tax incentives (JLARC 2012) supplemented, by a review of economic development material posted on each Port Authority’s website.
Information on ship building and repair tax exemptions was obtained from Wolters Kluwer Chee-tahTM for Tax Law, Lohman (2002) and review of state Department of Taxation or Revenue websites. This information was checked against a much earlier Department of Taxation (1995) inventory of state ships and vessels exemptions to ensure that no exemptions were missed.
Information on rail-related tax exemptions were obtained from Wolters Kluwer Cheetah for Tax Law, Colorado Office of the State Auditor (2020), and review of state Department of Taxation or Revenue websites.
For the air transportation exemptions, information from Conklin and De Decker’s State Tax Guide, PFM Group Consulting LLC (2019), and state Department of Taxation or Revenue websites were the primary sources. Information on trade incentives and programming was obtained from the State In-ternational Development Organizations 2020 survey.
Review of documents and literature Several sources of information, including documents, reports, and published or unpublished research were examined for this report. The purpose of this literature review was to understand the purpose and goals of Virginia incentive programs, industry locational factors, role and importance of eco-nomic incentives, market imperfection rationales for programs, and methodological approaches for quantifying the economic and tax revenue impacts of economic incentives. Sources consulted in-cluded:
program materials describing the programs, Virginia agency reports describing program usage, and legislative statutes authorizing the programs;
state evaluations and economic impact studies published by state agencies or their consultants in other states; and
scholarly books and articles that examine the economic effects of economic incentives for seaports, water transportation, rail transportation, air transportation, and international trade.
Appendixes
Commission draft 76
Appendix C: Economic benefits and return in revenue for all Virginia incentives reviewed to date Economic development incentives vary in their economic benefit and return in revenue to the state. To provide context to the economic benefits and return in revenue generated by each incentive, in-centives have been categorized as having a negligible, low, moderate, or high economic benefit and return in revenue. To determine the category, each incentive is scored from 0 to 3 on four measures: the amount of jobs, Virginia GDP, and personal income generated per $1 million spent on the incen-tive and the return in revenue generated per $1 spent on the incentive. The scoring is based on the distribution of all 43 incentives reviewed to date for each of the four measures, with a score of ‘0’ meaning the incentive fell below the 25th percentile (or first quartile) of the distribution for the meas-ure and a score of ‘three’ meaning the incentive was in the highest quartile (above the 75th percentile) for the measure.
The scores for the three measures of economic benefits (jobs, Virginia GDP, and personal income) were averaged to arrive at an overall average score for economic benefits for each incentive. Incentives with average scores for the three measures near ‘0’ were categorized as having negligible economic benefits relative to other incentives. Incentives with average scores near ‘1’, ‘2’, or ‘3’ were categorized as having low, moderate, or high economic benefits, respectively, relative to other incentives. For return in revenue, an incentive with a ‘0’ score on that measure was categorized as having a negligible return in revenue relative to other incentives. An incentive with a score of ‘1’, ‘2’, or ‘3’ was categorized as having a low, moderate, or high return in revenue, respectively, relative to other incentives.
An incentive’s category may change over time. Only 43 of more than 70 Virginia economic develop-ment incentives have been evaluated so far, and because incentives are categorized relative to other incentives evaluated, incentives may change categories as additional incentives are evaluated each year. Once all incentives are evaluated, re-evaluation of incentives will begin. The category may change for re-evaluated incentives because of new or improved outcomes data, program changes, and changes to the state economy and industry mix.
Of the incentives evaluated through June 2021, grants tend to generate moderate or relatively high economic benefits and returns in revenue. Tax incentives tend to generate low or negligible economic benefits and returns in revenue (Table C-1). Grant programs have higher economic benefits than other types of incentives because a higher percentage of grant funding is directed to businesses in manu-facturing industries, which generally have high economic multipliers and pay higher wages. In addition, businesses that receive grants must agree to create jobs and make capital investments, and usually above minimum job creation and capital investment levels, but other incentives may not have similar requirements for businesses to receive an award.

Appendixes
Commission draft 77
TABLE C-1 Grants tend to generate higher economic benefits and returns in revenue than tax incentives
Incentive Incentive
type Economic benefits
Return in state revenue
Airline common carrier exemption Exemption Aircraft parts, engines, and supplies exemption Exemption Biodiesel and Green Diesel Tax Credit Tax credit Coal Employment and Production Incentive Tax Credit Tax credit Coalfield Employment Enhancement Tax Credit Tax credit Film exemption Exemption Green Job Tax Credit Tax credit Recyclable Materials Tax Credit Tax credit Railroad rolling stock exemption Exemption Ships and vessels exemption Exemption Telework Tax Credit Tax credit Transportation Partnership Opportunity Fund Grant Barge and Rail Usage Tax Credit Tax credit Economic Development Access Program Grant International Trade Facility Tax Credit Tax credit Motion Picture Production Tax Credit Tax credit Pollution control equipment exemption Exemption Railroad common carrier exemption Exemption Real Property Investment Grant Grant Semiconductor manufacturing exemption Exemption Semiconductor wafer exemption Exemption Tobacco Commission Megasite Grant Grant Virginia Business Ready Sites Program Grant n.a. n.a. Worker Retraining Tax Credit Tax credit Data center exemption Exemption Governor’s Motion Picture Opportunity Fund Grant Job Creation Grant Grant Manufacturers SSF apportionment Other Qimonda (semiconductor) grant Grant Port of Virginia Economic and Infrastructure Grant Grant Port Volume Increase Tax Credit Tax credit Rail Industrial Access Program Grant Tobacco Region Opportunity Fund Grant
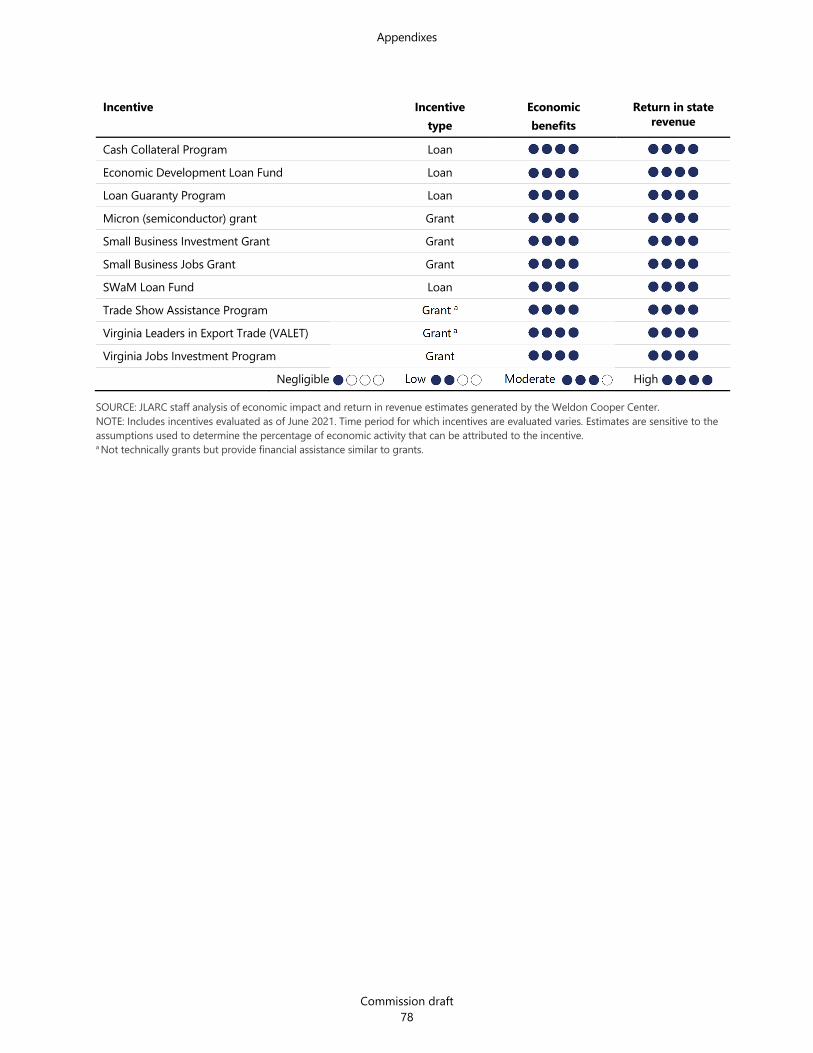
Appendixes
Commission draft 78
Incentive Incentive type
Economic benefits
Return in state revenue
Cash Collateral Program Loan Economic Development Loan Fund Loan Loan Guaranty Program Loan Micron (semiconductor) grant Grant Small Business Investment Grant Grant Small Business Jobs Grant Grant SWaM Loan Fund Loan Trade Show Assistance Program Grant a Virginia Leaders in Export Trade (VALET) Grant a Virginia Jobs Investment Program Grant Negligible Low Moderate High
SOURCE: JLARC staff analysis of economic impact and return in revenue estimates generated by the Weldon Cooper Center. NOTE: Includes incentives evaluated as of June 2021. Time period for which incentives are evaluated varies. Estimates are sensitive to the assumptions used to determine the percentage of economic activity that can be attributed to the incentive. a Not technically grants but provide financial assistance similar to grants.

Appendixes
Commission draft 79
Appendix D: Railroad common carrier and rolling stock exemptions by state Almost all states offer some form of railroad common carrier exemption (Table D-1). Rolling stock is the most common item exempted, and a majority cover parts for maintenance and repair. Thirty-four states (including Virginia) have broader exemptions that cover purchases of rolling stock by other industries such as manufacturers and utilities.
TABLE D-1 State railroad common carrier and rolling stock exemptions
State Railroad common carrier exemption Railroad rolling stock exemption
Has exemption Restrictions/limitations Has exemption Restrictions/limitations
Alabama PARTIAL
Crossties and timbers are exempt from sales tax. Railroad cars of over five tons are exempt when sold by the builder or manufacturer.
YES Railroad cars of over five tons are exempt when sold by the builder or manufacturer.
Alaska No sales tax in state Arizona YES YES
Arkansas YES Use in interstate commerce. Track materials and structures not covered.
YES Use in interstate commerce.
California YES Track materials and structures not covered. YES Use in interstate commerce.
Colorado YES
Used or purchased for use in interstate commerce by a railroad company. Track materials and structures not covered.
NO
Connecticut YES YES
Delaware No sales tax in state
Florida PARTIAL Common carrier. The tax is imposed only on that portion used in Florida.
NO
Georgia YES Common carrier. Track materials and structures not covered.
NO
Hawaii NO NO

Appendixes
Commission draft 80
State Railroad common carrier exemption Railroad rolling stock exemption
Has exemption Restrictions/limitations Has exemption Restrictions/limitations
Idaho PARTIAL
Railroad rolling stock rebuilt or remanufactured in Idaho and used in interstate commerce. Track materials and structures not covered.
PARTIAL Railroad rolling stock rebuilt or remanufactured in Idaho and used in interstate commerce.
Illinois YES Common carrier. Track materials and structures not covered.
YES
Indiana YES Track materials and structures not covered. YES
Iowa YES Track materials and structures not covered. YES
Kansas YES Use in interstate or foreign commerce. Track materials and structures not covered.
YES Railroad used in interstate commerce.
Kentucky YES Common carrier. Track materials and structures not covered.
NO
Louisiana YES Track materials and structures not covered. YES
Maine YES Use in interstate or foreign commerce. YES Use in interstate or foreign
commerce.
Maryland YES Used to cross State lines. Track materials and structures not covered.
YES Used to cross State lines.
Massachusetts NO NO
Michigan YES Track materials and structures not covered. YES
Minnesota YES
Railroad businesses involved in interstate or intrastate commerce. Track materials and structures not covered.
NO
Mississippi YES Track materials and structures sold to a railroad are taxed at special industrial rate of 3%.
YES Used in interstate commerce.
Missouri YES
Tangible personal property used for railroad infrastructure that is brought into state for processing, fabrication, or other modification for use outside the state in the regular course of business is exempt.
YES Use in interstate commerce.
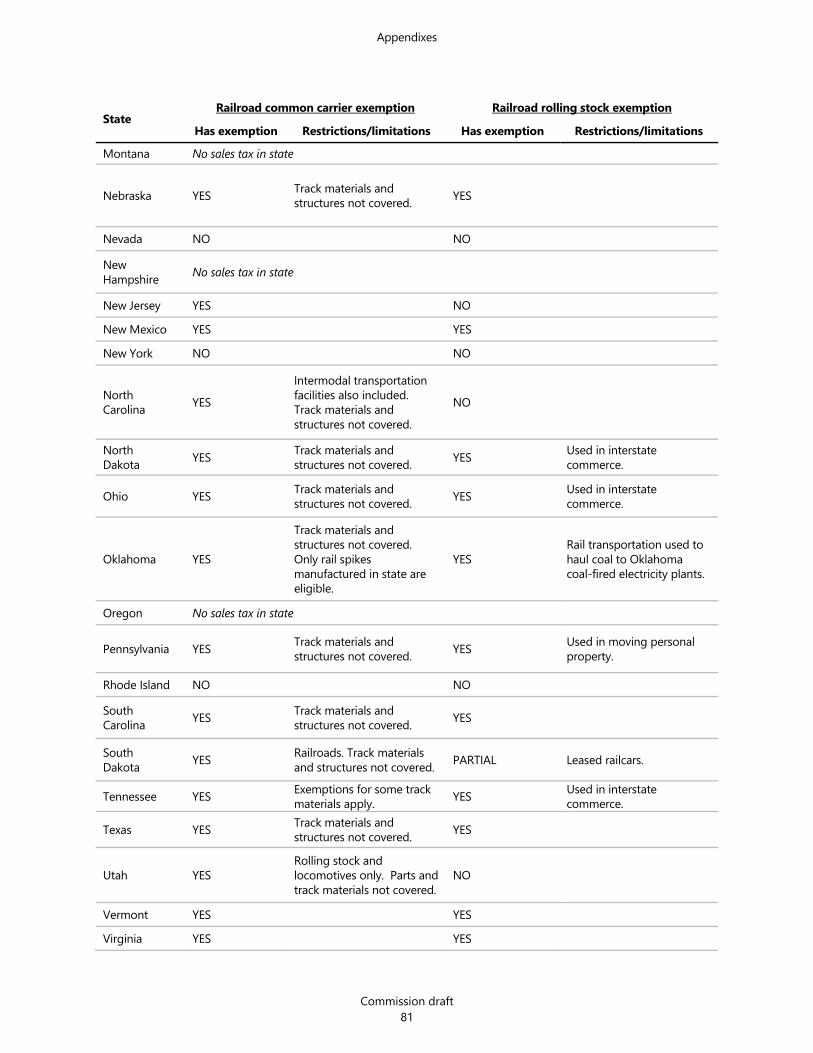
Appendixes
Commission draft 81
State Railroad common carrier exemption Railroad rolling stock exemption
Has exemption Restrictions/limitations Has exemption Restrictions/limitations Montana No sales tax in state
Nebraska YES Track materials and structures not covered. YES
Nevada NO NO
New Hampshire No sales tax in state
New Jersey YES NO New Mexico YES YES New York NO NO
North Carolina YES
Intermodal transportation facilities also included. Track materials and structures not covered.
NO
North Dakota YES Track materials and
structures not covered. YES Used in interstate commerce.
Ohio YES Track materials and structures not covered. YES Used in interstate
commerce.
Oklahoma YES
Track materials and structures not covered. Only rail spikes manufactured in state are eligible.
YES Rail transportation used to haul coal to Oklahoma coal-fired electricity plants.
Oregon No sales tax in state
Pennsylvania YES Track materials and structures not covered. YES Used in moving personal
property.
Rhode Island NO NO
South Carolina YES Track materials and
structures not covered. YES
South Dakota YES Railroads. Track materials
and structures not covered. PARTIAL Leased railcars.
Tennessee YES Exemptions for some track materials apply. YES Used in interstate
commerce.
Texas YES Track materials and structures not covered. YES
Utah YES Rolling stock and locomotives only. Parts and track materials not covered.
NO
Vermont YES YES Virginia YES YES

Appendixes
Commission draft 82
State Railroad common carrier exemption Railroad rolling stock exemption
Has exemption Restrictions/limitations Has exemption Restrictions/limitations
Washington YES Used for interstate or foreign commerce. YES Used for interstate or
foreign commerce. West Virginia YES YES
Wisconsin YES Exemptions for some track materials apply. PARTIAL Utility rail cars.
Wyoming YES Track materials and structures not covered. YES
Used in interstate commerce.
SOURCE: Weldon Cooper Center analysis based on Wolters Kluwer Cheetah for Tax Law, Colorado Office of the State Auditor (2020), and review of state Department of Taxation or Revenue websites. NOTE: Rail and track materials or structures may be covered under other state statutory provisions such as those for public utilities.
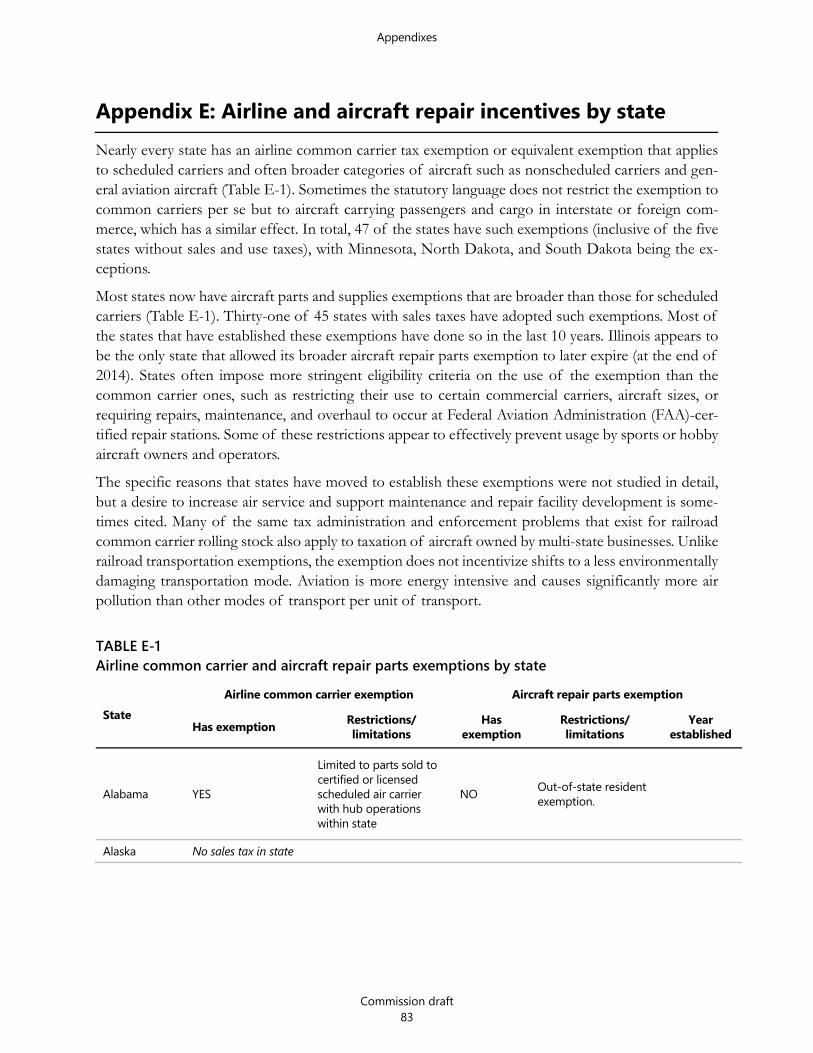
Appendixes
Commission draft 83
Appendix E: Airline and aircraft repair incentives by state Nearly every state has an airline common carrier tax exemption or equivalent exemption that applies to scheduled carriers and often broader categories of aircraft such as nonscheduled carriers and gen-eral aviation aircraft (Table E-1). Sometimes the statutory language does not restrict the exemption to common carriers per se but to aircraft carrying passengers and cargo in interstate or foreign com-merce, which has a similar effect. In total, 47 of the states have such exemptions (inclusive of the five states without sales and use taxes), with Minnesota, North Dakota, and South Dakota being the ex-ceptions.
Most states now have aircraft parts and supplies exemptions that are broader than those for scheduled carriers (Table E-1). Thirty-one of 45 states with sales taxes have adopted such exemptions. Most of the states that have established these exemptions have done so in the last 10 years. Illinois appears to be the only state that allowed its broader aircraft repair parts exemption to later expire (at the end of 2014). States often impose more stringent eligibility criteria on the use of the exemption than the common carrier ones, such as restricting their use to certain commercial carriers, aircraft sizes, or requiring repairs, maintenance, and overhaul to occur at Federal Aviation Administration (FAA)-cer-tified repair stations. Some of these restrictions appear to effectively prevent usage by sports or hobby aircraft owners and operators.
The specific reasons that states have moved to establish these exemptions were not studied in detail, but a desire to increase air service and support maintenance and repair facility development is some-times cited. Many of the same tax administration and enforcement problems that exist for railroad common carrier rolling stock also apply to taxation of aircraft owned by multi-state businesses. Unlike railroad transportation exemptions, the exemption does not incentivize shifts to a less environmentally damaging transportation mode. Aviation is more energy intensive and causes significantly more air pollution than other modes of transport per unit of transport.
TABLE E-1 Airline common carrier and aircraft repair parts exemptions by state
State Airline common carrier exemption Aircraft repair parts exemption
Has exemption Restrictions/ limitations
Has exemption
Restrictions/ limitations
Year established
Alabama YES
Limited to parts sold to certified or licensed scheduled air carrier with hub operations within state
NO Out-of-state resident exemption.
Alaska No sales tax in state
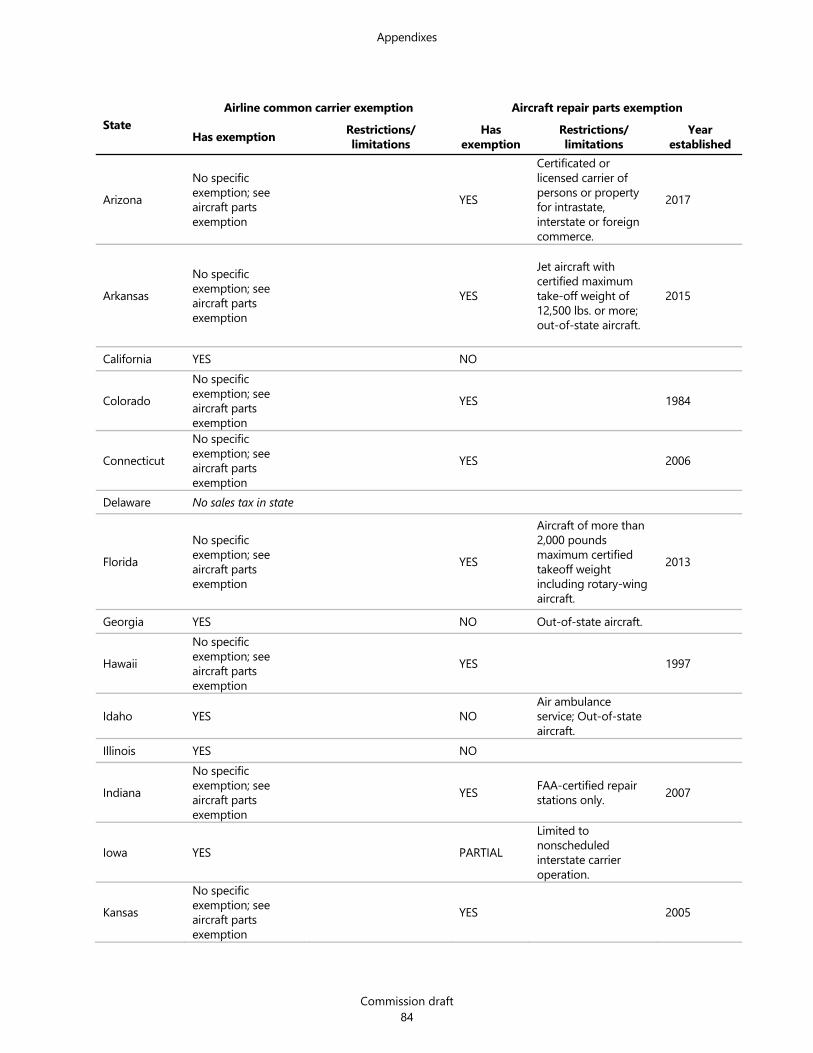
Appendixes
Commission draft 84
State Airline common carrier exemption Aircraft repair parts exemption
Has exemption Restrictions/ limitations
Has exemption
Restrictions/ limitations
Year established
Arizona No specific exemption; see aircraft parts exemption
YES
Certificated or licensed carrier of persons or property for intrastate, interstate or foreign commerce.
2017
Arkansas No specific exemption; see aircraft parts exemption
YES
Jet aircraft with certified maximum take-off weight of 12,500 lbs. or more; out-of-state aircraft.
2015
California YES NO
Colorado No specific exemption; see aircraft parts exemption
YES 1984
Connecticut No specific exemption; see aircraft parts exemption
YES 2006
Delaware No sales tax in state
Florida No specific exemption; see aircraft parts exemption
YES
Aircraft of more than 2,000 pounds maximum certified takeoff weight including rotary-wing aircraft.
2013
Georgia YES NO Out-of-state aircraft.
Hawaii No specific exemption; see aircraft parts exemption
YES 1997
Idaho YES NO Air ambulance service; Out-of-state aircraft.
Illinois YES NO
Indiana No specific exemption; see aircraft parts exemption
YES FAA-certified repair stations only. 2007
Iowa YES PARTIAL Limited to nonscheduled interstate carrier operation.
Kansas No specific exemption; see aircraft parts exemption
YES 2005
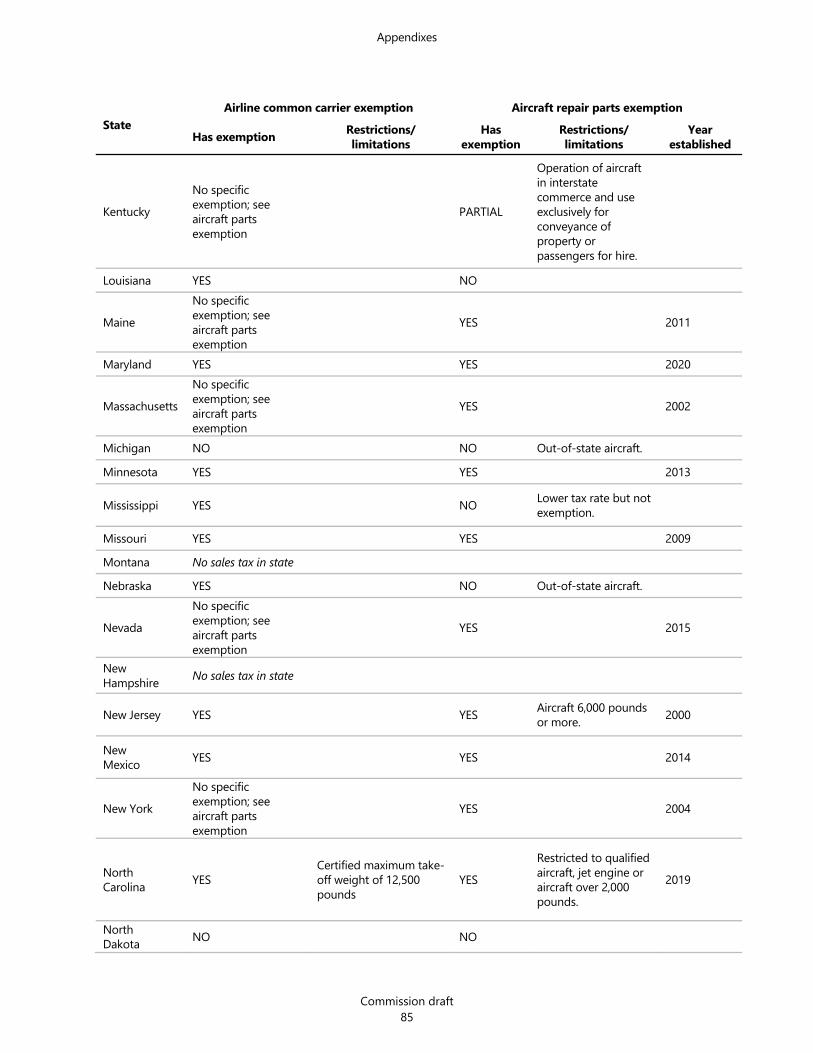
Appendixes
Commission draft 85
State Airline common carrier exemption Aircraft repair parts exemption
Has exemption Restrictions/ limitations
Has exemption
Restrictions/ limitations
Year established
Kentucky No specific exemption; see aircraft parts exemption
PARTIAL
Operation of aircraft in interstate commerce and use exclusively for conveyance of property or passengers for hire.
Louisiana YES NO
Maine No specific exemption; see aircraft parts exemption
YES 2011
Maryland YES YES 2020
Massachusetts No specific exemption; see aircraft parts exemption
YES 2002
Michigan NO NO Out-of-state aircraft.
Minnesota YES YES 2013
Mississippi YES NO Lower tax rate but not exemption.
Missouri YES YES 2009 Montana No sales tax in state
Nebraska YES NO Out-of-state aircraft.
Nevada No specific exemption; see aircraft parts exemption
YES 2015
New Hampshire No sales tax in state
New Jersey YES YES Aircraft 6,000 pounds or more. 2000
New Mexico YES YES 2014
New York No specific exemption; see aircraft parts exemption
YES 2004
North Carolina YES
Certified maximum take-off weight of 12,500 pounds
YES Restricted to qualified aircraft, jet engine or aircraft over 2,000 pounds.
2019
North Dakota NO NO
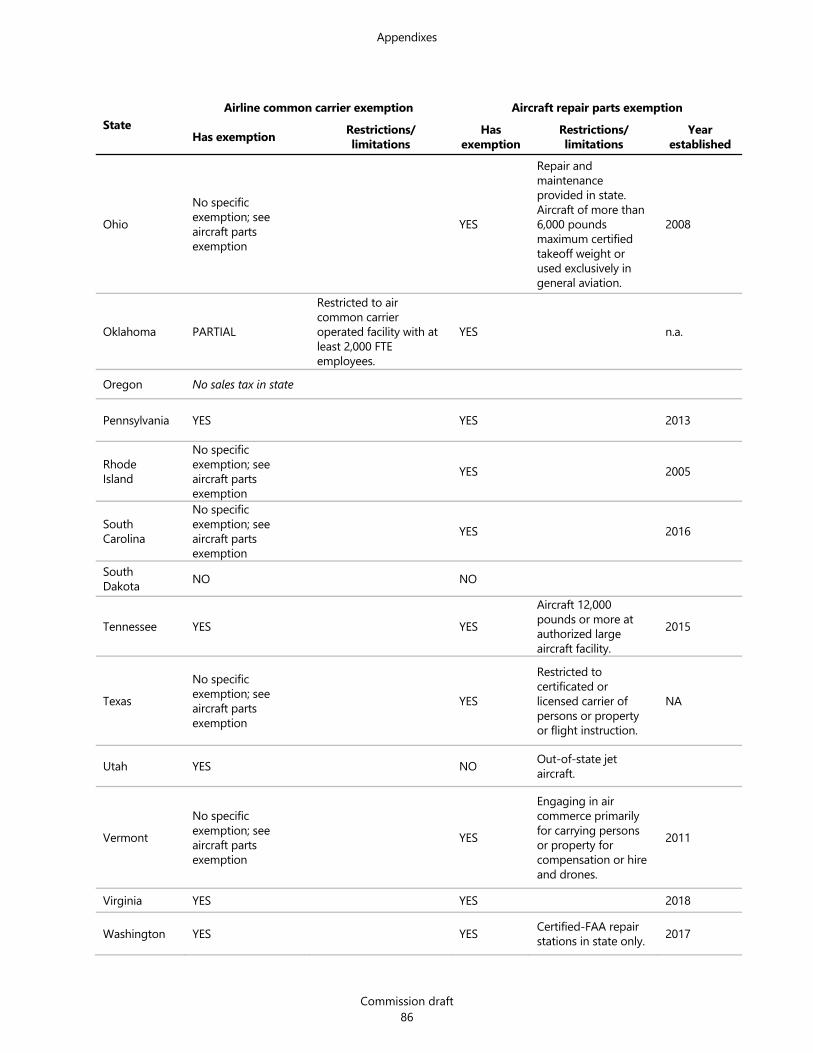
Appendixes
Commission draft 86
State Airline common carrier exemption Aircraft repair parts exemption
Has exemption Restrictions/ limitations
Has exemption
Restrictions/ limitations
Year established
Ohio No specific exemption; see aircraft parts exemption
YES
Repair and maintenance provided in state. Aircraft of more than 6,000 pounds maximum certified takeoff weight or used exclusively in general aviation.
2008
Oklahoma PARTIAL
Restricted to air common carrier operated facility with at least 2,000 FTE employees.
YES n.a.
Oregon No sales tax in state
Pennsylvania YES YES 2013
Rhode Island
No specific exemption; see aircraft parts exemption
YES 2005
South Carolina
No specific exemption; see aircraft parts exemption
YES 2016
South Dakota NO NO
Tennessee YES YES Aircraft 12,000 pounds or more at authorized large aircraft facility.
2015
Texas No specific exemption; see aircraft parts exemption
YES
Restricted to certificated or licensed carrier of persons or property or flight instruction.
NA
Utah YES NO Out-of-state jet aircraft.
Vermont No specific exemption; see aircraft parts exemption
YES
Engaging in air commerce primarily for carrying persons or property for compensation or hire and drones.
2011
Virginia YES YES 2018
Washington YES YES Certified-FAA repair stations in state only. 2017

Appendixes
Commission draft 87
State Airline common carrier exemption Aircraft repair parts exemption
Has exemption Restrictions/ limitations
Has exemption
Restrictions/ limitations
Year established
West Virginia YES YES
Certified or licensed carrier of persons or property.
2020
Wisconsin No specific exemption; see aircraft parts exemption
YES 2014
Wyoming
No specific exemption; see aircraft parts exemption YES
Certified FAA repair stations only. n.a.
SOURCE: Weldon Cooper Center analysis based on Conklin and de Decker (2020), PFM Group Consulting LLC (2019), and review of state Department of Taxation or Revenue websites. NOTE: Georgia does exempt aircraft repair parts, but it is only for out-of-state aircraft, which is different than most states.
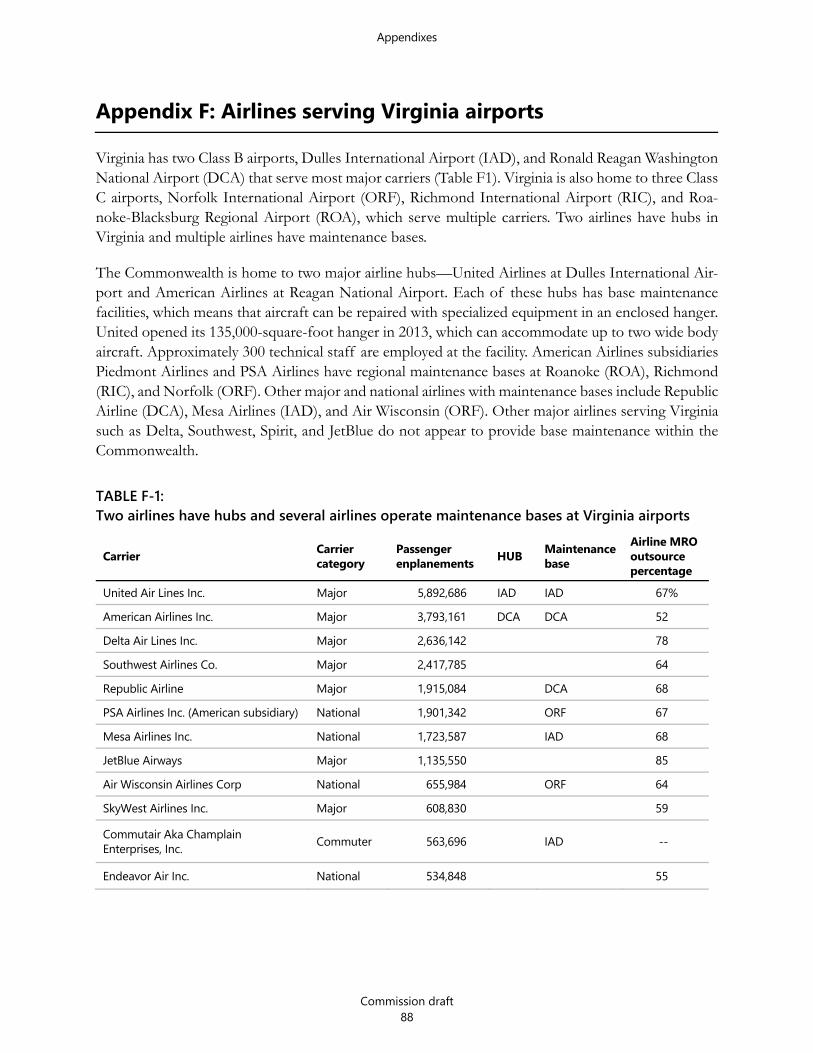
Appendixes
Commission draft 88
Appendix F: Airlines serving Virginia airports Virginia has two Class B airports, Dulles International Airport (IAD), and Ronald Reagan Washington National Airport (DCA) that serve most major carriers (Table F1). Virginia is also home to three Class C airports, Norfolk International Airport (ORF), Richmond International Airport (RIC), and Roa-noke-Blacksburg Regional Airport (ROA), which serve multiple carriers. Two airlines have hubs in Virginia and multiple airlines have maintenance bases.
The Commonwealth is home to two major airline hubs—United Airlines at Dulles International Air-port and American Airlines at Reagan National Airport. Each of these hubs has base maintenance facilities, which means that aircraft can be repaired with specialized equipment in an enclosed hanger. United opened its 135,000-square-foot hanger in 2013, which can accommodate up to two wide body aircraft. Approximately 300 technical staff are employed at the facility. American Airlines subsidiaries Piedmont Airlines and PSA Airlines have regional maintenance bases at Roanoke (ROA), Richmond (RIC), and Norfolk (ORF). Other major and national airlines with maintenance bases include Republic Airline (DCA), Mesa Airlines (IAD), and Air Wisconsin (ORF). Other major airlines serving Virginia such as Delta, Southwest, Spirit, and JetBlue do not appear to provide base maintenance within the Commonwealth.
TABLE F-1: Two airlines have hubs and several airlines operate maintenance bases at Virginia airports
Carrier Carrier category
Passenger enplanements HUB Maintenance
base Airline MRO outsource percentage
United Air Lines Inc. Major 5,892,686 IAD IAD 67% American Airlines Inc. Major 3,793,161 DCA DCA 52 Delta Air Lines Inc. Major 2,636,142 78 Southwest Airlines Co. Major 2,417,785 64 Republic Airline Major 1,915,084 DCA 68 PSA Airlines Inc. (American subsidiary) National 1,901,342 ORF 67 Mesa Airlines Inc. National 1,723,587 IAD 68 JetBlue Airways Major 1,135,550 85 Air Wisconsin Airlines Corp National 655,984 ORF 64 SkyWest Airlines Inc. Major 608,830 59
Commutair Aka Champlain Enterprises, Inc. Commuter 563,696 IAD --
Endeavor Air Inc. National 534,848 55

Appendixes
Commission draft 89
Carrier Carrier category
Passenger enplanements HUB Maintenance
base Airline MRO outsource percentage
Alaska Airlines Inc. Major 503,003 74 Piedmont Airlines (American subsidiary) Commuter 450,870 RIC; ROA --
Frontier Airlines Inc. Major 363,350 46 Envoy Air (American subsidiary) Major 319,581 39
ExpressJet Airlines LLC (United subsidiary) National 222,579 51
Lufthansa German Airlines International 216,196 -- Compagnie Natl Air France International 171,919 -- British Airways Plc International 164,835 -- Subtotal 26,191,028 Other airlines 2,548,790 Total 28,739,818
SOURCE: U.S. Department of Transportation, T-100 Market (All Carriers) for 2019; Weldon Cooper Center analysis using airline website and other sources NOTE: DCA=Ronald Reagan Washington National Airport; IAD=Dulles International Airport; ORF=Norfolk International Airport; RIC=Rich-mond International Airport; ROA=Roanoke-Blacksburg Regional Airport. Major (carrier with annual revenue over $1 billion); National (car-rier with annual revenue over $100 million to $1 billion); Commuter (air taxi operator which performs at least five round trips per week between two or more points).

Appendixes
Commission draft 90
Appendix G: Aircraft repair employment by state The consulting firm Oliver Wyman publishes annual data for the Aeronautical Repair Station Associ-ation that attempts to capture employment in three different segments of the civil aviation mainte-nance industry: Federal Aviation Administration (FAA) repair stations, air carrier maintenance bases, and aircraft parts manufacturing and distribution. Virginia is generally underrepresented in civil avia-tion employment, largely because of low repair station employment (location quotient of only 0.27). The relative size of its air carrier and parts manufacturing and distribution segments are slightly higher than the nation with location quotients of 1.14 and 1.30 respectively (Table G-1).
TABLE G-1: Virginia has a relatively low concentration of aviation maintenance employment
State
FAA repair station (MRO)
Air carrier (MRO)
Parts manufacturing & distribution
Total employment
Location quotient (LQ) FAA
repair station (MRO)
Air carrier (MRO)
Parts manufacturing
& distribution Total
Alaska 453 93 9 555 1.06 1.36 0.06 0.85 Alabama 4,754 38 28 4,820 1.87 0.09 0.03 1.24 Arkansas 1,391 60 62 1,513 0.90 0.24 0.11 0.64 Arizona 5,924 770 10,169 16,863 1.61 1.31 7.51 3.00 California 24,432 3,126 5,638 33,196 1.07 0.85 0.67 0.95 Colorado 1,413 932 16 2,361 0.39 1.59 0.01 0.42 Connecticut 4,559 103 7,253 11,915 2.11 0.30 9.11 3.61 Delaware 956 0 85 1,041 1.70 0.00 0.41 1.21 Florida 18,153 2,459 1,002 21,614 1.52 1.29 0.23 1.19 Georgia 18,576 1,991 1,473 22,040 3.12 2.09 0.67 2.42 Hawaii 635 531 8 1,174 0.73 3.83 0.03 0.89 Iowa 2,710 45 4,560 7,315 1.40 0.14 6.38 2.47 Idaho 498 49 34 581 0.50 0.31 0.09 0.38 Illinois 3,163 1,940 1,479 6,582 0.43 1.64 0.54 0.58 Indiana 2,685 136 1,195 4,016 0.72 0.23 0.87 0.71 Kansas 5,980 155 5,062 11,197 3.32 0.54 7.62 4.06 Kentucky 1,451 1,421 45 2,917 0.61 3.72 0.05 0.80 Louisiana 2,157 229 192 2,578 0.85 0.56 0.20 0.66 Massachusetts 2,103 612 275 2,990 0.46 0.83 0.16 0.43 Maryland 407 233 609 1,249 0.12 0.41 0.47 0.23 Maine 1,087 0 133 1,220 1.37 0.00 0.46 1.01
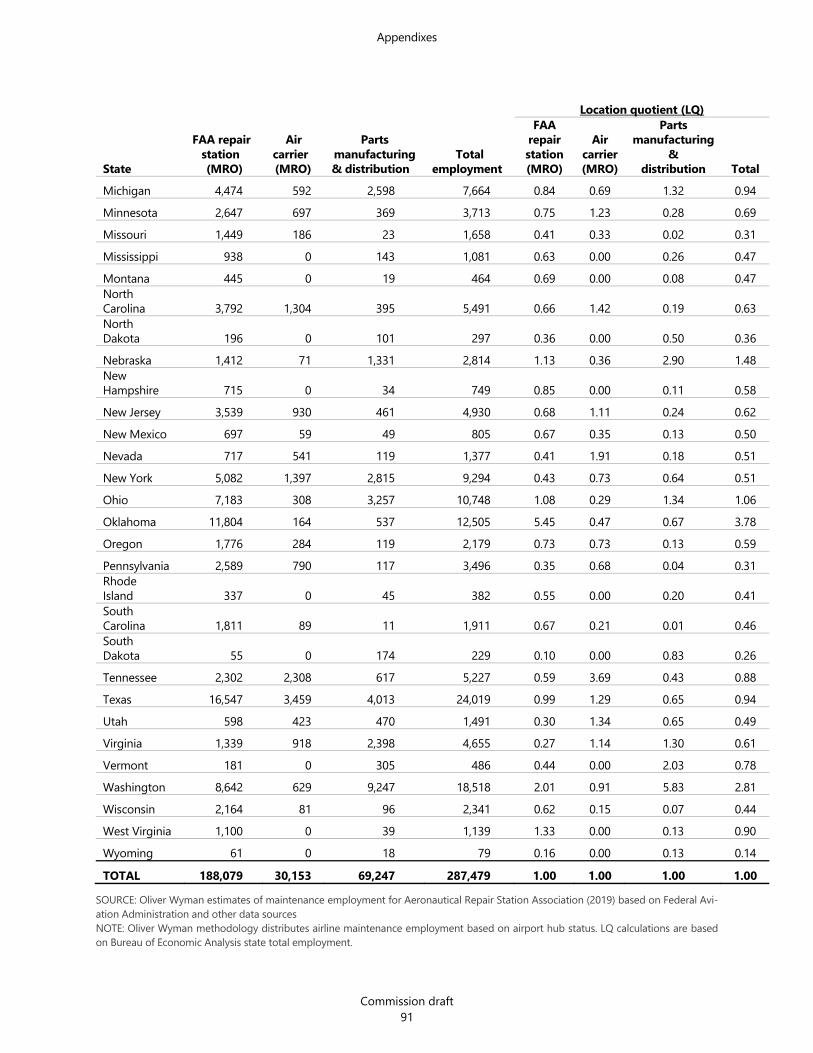
Appendixes
Commission draft 91
State
FAA repair station (MRO)
Air carrier (MRO)
Parts manufacturing & distribution
Total employment
Location quotient (LQ) FAA
repair station (MRO)
Air carrier (MRO)
Parts manufacturing
& distribution Total
Michigan 4,474 592 2,598 7,664 0.84 0.69 1.32 0.94 Minnesota 2,647 697 369 3,713 0.75 1.23 0.28 0.69 Missouri 1,449 186 23 1,658 0.41 0.33 0.02 0.31 Mississippi 938 0 143 1,081 0.63 0.00 0.26 0.47 Montana 445 0 19 464 0.69 0.00 0.08 0.47 North Carolina 3,792 1,304 395 5,491 0.66 1.42 0.19 0.63 North Dakota 196 0 101 297 0.36 0.00 0.50 0.36 Nebraska 1,412 71 1,331 2,814 1.13 0.36 2.90 1.48 New Hampshire 715 0 34 749 0.85 0.00 0.11 0.58 New Jersey 3,539 930 461 4,930 0.68 1.11 0.24 0.62 New Mexico 697 59 49 805 0.67 0.35 0.13 0.50 Nevada 717 541 119 1,377 0.41 1.91 0.18 0.51 New York 5,082 1,397 2,815 9,294 0.43 0.73 0.64 0.51 Ohio 7,183 308 3,257 10,748 1.08 0.29 1.34 1.06 Oklahoma 11,804 164 537 12,505 5.45 0.47 0.67 3.78 Oregon 1,776 284 119 2,179 0.73 0.73 0.13 0.59 Pennsylvania 2,589 790 117 3,496 0.35 0.68 0.04 0.31 Rhode Island 337 0 45 382 0.55 0.00 0.20 0.41 South Carolina 1,811 89 11 1,911 0.67 0.21 0.01 0.46 South Dakota 55 0 174 229 0.10 0.00 0.83 0.26 Tennessee 2,302 2,308 617 5,227 0.59 3.69 0.43 0.88 Texas 16,547 3,459 4,013 24,019 0.99 1.29 0.65 0.94 Utah 598 423 470 1,491 0.30 1.34 0.65 0.49 Virginia 1,339 918 2,398 4,655 0.27 1.14 1.30 0.61 Vermont 181 0 305 486 0.44 0.00 2.03 0.78 Washington 8,642 629 9,247 18,518 2.01 0.91 5.83 2.81 Wisconsin 2,164 81 96 2,341 0.62 0.15 0.07 0.44 West Virginia 1,100 0 39 1,139 1.33 0.00 0.13 0.90 Wyoming 61 0 18 79 0.16 0.00 0.13 0.14 TOTAL 188,079 30,153 69,247 287,479 1.00 1.00 1.00 1.00
SOURCE: Oliver Wyman estimates of maintenance employment for Aeronautical Repair Station Association (2019) based on Federal Avi-ation Administration and other data sources NOTE: Oliver Wyman methodology distributes airline maintenance employment based on airport hub status. LQ calculations are based on Bureau of Economic Analysis state total employment.

Appendixes
Commission draft 92
The aircraft maintenance, repair, and overhaul activity is not well represented by NAICS industries, which makes estimating employment with precision difficult. For example, FAA-certified repair sta-tions (i.e., an aircraft maintenance facility that has a certificate issued by the FAA under Title 14 of the Code of Federal Regulations) for Virginia operate in several NAICS industries, including 336412 (aircraft engine and engine parts manufacturing), 481211 (Nonscheduled Chartered Passenger Air Transportation), 488119 (Other Airport Operations), and 488190 (Other Support Activities for Air Transportation). While some firms operate strictly as repair facilities, others provide other services such as flight school training, aircraft leasing and operation, and Fixed Base Operator FBO services such as fueling, parking, and hangar rental. Aerospace product manufacturing companies also provide such services, often as part of service agreements with aircraft owners and operators.
The change in aircraft maintenance, repair, and overhaul employment over time is not discussed in this report. The primary reason is because the methodology used by Oliver Wyman changed over time.

Appendixes
Commission draft 93
Appendix H: Ships and vessels exemptions by state Most states offer sales and use tax exemptions to the shipping industry (Table H-1). According to a Department of Taxation review (1995), 30 states did not tax in whole or part tangible personal prop-erty used directly in building or repairing ships, and 31 did not tax in whole or part fuel or supplies used in interstate commerce. These numbers have slightly expanded to 37 (35 fully for interstate/for-eign commerce and two partly) and 36 (25 fully and 11 for mainly fuel), respectively. No other state exemptions were found to exempt dredging activities though some offered exemptions for intrastate ship and vessel use. Generally, those states that do not offer ship maintenance and repair tax exemp-tions are landlocked; the exceptions being Michigan (which borders Lakes Michigan, Huron, and Erie) and Connecticut. Virginia’s Atlantic Coast neighbors generally offer similar exemptions. Some states stipulate that eligible vessels meet some minimum weight threshold, commonly 50 tons displacement or more.
TABLE H-1 State ships and vessels sales and use tax exemptions
Parts and repairs Supplies State Has exemption Restrictions/limitations Has exemption Restrictions/limitations
Alabama YES Over 5 tons of displacement. YES Foreign or interstate
commerce.
Alaska No sales tax in state Arizona NO NO
Arkansas YES 50 tons of displacement or more. PARTIAL Fuel but not other supplies.
California YES Also some intrastate transport vessels qualify. YES Sales to common carrier
for use outside state.
Colorado NO NO
Connecticut NO PARTIAL Fuel but not other supplies.
Delaware No sales tax in state
Florida YES PARTIAL Fuel but not other supplies. Georgia YES YES
Hawaii PARTIAL Use tax exemption for oceangoing vessels. NO
Idaho NO NO
Illinois YES Use in interstate commerce at least 50% of time. NO

Appendixes
Commission draft 94
State
Parts and repairs Supplies Has exemption Restrictions/limitations Has exemption Restrictions/limitations
Indiana YES PARTIAL Fuel but not other supplies.
Iowa YES Use on rivers bordering the state. PARTIAL Fuel but not other supplies.
Kansas NO NO Kentucky YES YES
Louisiana YES 50 tons load displacement and over. YES Interstate commerce.
Maine YES YES Maryland YES YES
Massachusetts YES Also includes commuting passenger vessel uses. YES
Michigan NO PARTIAL Fuel for boats 500 tons or more.
Minnesota YES Vessels with a gross registered tonnage of at least 3,000 tons.
PARTIAL Fuel but not other supplies.
Mississippi YES
Also includes commercial fishing vessels and vessels and barges of 50 or more tons displacement when not involved in interstate commerce.
YES
Missouri YES PARTIAL Fuel but not other supplies. Montana No sales tax in state
Nebraska YES PARTIAL Fuel but not other supplies.
Nevada NO NO
New Hampshire No sales tax in state
New Jersey YES
50-ton burden or over. Exemption also covers commercial fishing, sports fishing, and passenger ferry.
YES Also covers commercial fishing, sports fishing, and passenger ferry.
New Mexico NO NO
New York YES YES Ferry boat fuel and supplies also exempt.
North Carolina YES YES North Dakota NO NO
Ohio YES PARTIAL Fuel but not other supplies.

Appendixes
Commission draft 95
State
Parts and repairs Supplies Has exemption Restrictions/limitations Has exemption Restrictions/limitations
Oklahoma YES YES Oregon No sales tax in state
Pennsylvania YES Vessels with a registered tonnage of at least 50 tons that are designed for commercial use.
YES Ships operated out-of-state.
Rhode Island YES
Ships, barges, and other vessels of 50 tons burden or over, commercial fishing vessels, or vessels brought into state for winter storage, maintenance or sale.
YES Ships, barges, and other vessels of 50 tons burden or over or commercial fishing vessels.
South Carolina PARTIAL
TPP sold to international shipping lines which have a contractual relationship with the South Carolina State Ports Authority and which are used in the import or export of goods.
YES Ships in intercoastal trade or foreign commerce.
South Dakota NO NO
Tennessee YES 50 tons and over in displacement and used in interstate commerce.
YES Deliveries are made in midstream of waterways constituting geographical boundaries of the state.
Texas YES YES YES Vessel operates exclusively in foreign or interstate coastal commerce.
Utah NO NO Vermont NO NO Virginia YES YES
Washington YES Commercial fishing vessels or interstate or foreign commerce uses.
YES
West Virginia YES NO
Wisconsin YES Vessel is net volumetric tonnage of 50 tons or more.
PARTIAL Fuel but not other supplies.
Wyoming NO NO SOURCE: Weldon Cooper Center analysis based on Wolters Kluwer CheetahTM for Tax Law, Virginia Department of Taxation (1995), Lohman (2002) and review of state Department of Taxation or Revenue websites
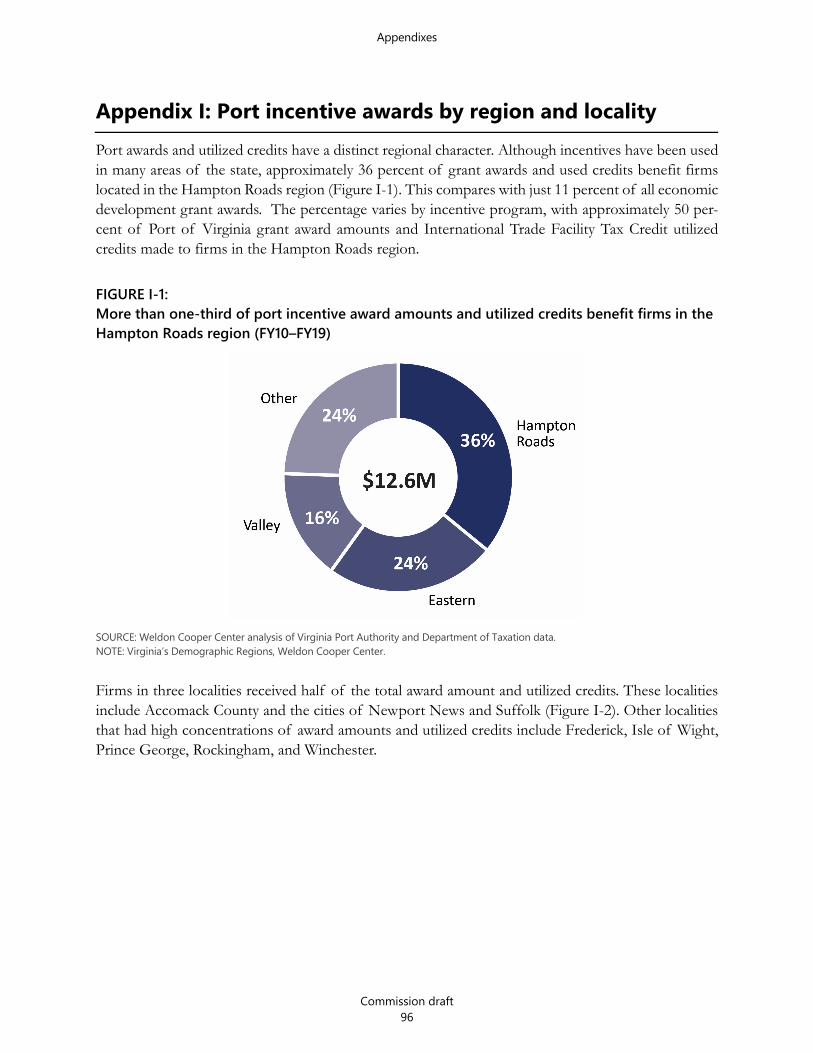
Appendixes
Commission draft 96
Appendix I: Port incentive awards by region and locality Port awards and utilized credits have a distinct regional character. Although incentives have been used in many areas of the state, approximately 36 percent of grant awards and used credits benefit firms located in the Hampton Roads region (Figure I-1). This compares with just 11 percent of all economic development grant awards. The percentage varies by incentive program, with approximately 50 per-cent of Port of Virginia grant award amounts and International Trade Facility Tax Credit utilized credits made to firms in the Hampton Roads region.
FIGURE I-1: More than one-third of port incentive award amounts and utilized credits benefit firms in the Hampton Roads region (FY10–FY19)
SOURCE: Weldon Cooper Center analysis of Virginia Port Authority and Department of Taxation data. NOTE: Virginia’s Demographic Regions, Weldon Cooper Center.
Firms in three localities received half of the total award amount and utilized credits. These localities include Accomack County and the cities of Newport News and Suffolk (Figure I-2). Other localities that had high concentrations of award amounts and utilized credits include Frederick, Isle of Wight, Prince George, Rockingham, and Winchester.

Appendixes
Commission draft 97
FIGURE I-2: Port incentive program award amounts and utilized credits have been made to firms in the Hampton Roads region (FY12–FY19)
SOURCE: Weldon Cooper Center analysis of Virginia Port Authority and Department of Taxation data.
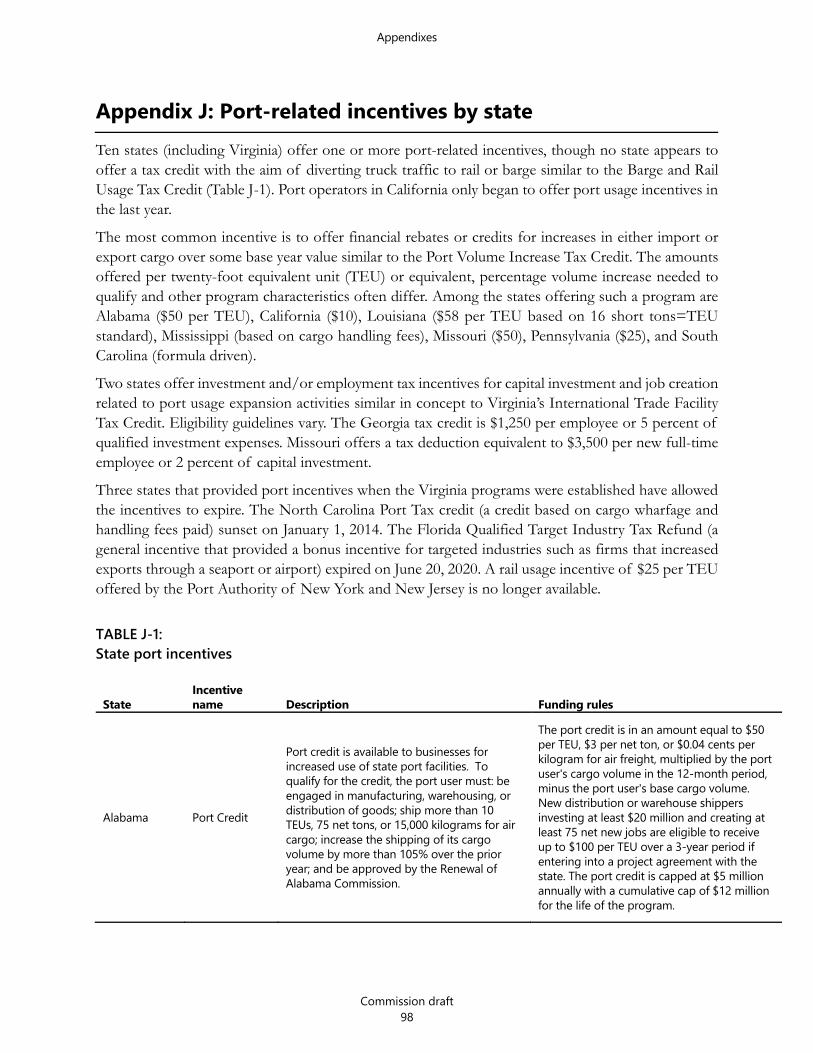
Appendixes
Commission draft 98
Appendix J: Port-related incentives by state Ten states (including Virginia) offer one or more port-related incentives, though no state appears to offer a tax credit with the aim of diverting truck traffic to rail or barge similar to the Barge and Rail Usage Tax Credit (Table J-1). Port operators in California only began to offer port usage incentives in the last year.
The most common incentive is to offer financial rebates or credits for increases in either import or export cargo over some base year value similar to the Port Volume Increase Tax Credit. The amounts offered per twenty-foot equivalent unit (TEU) or equivalent, percentage volume increase needed to qualify and other program characteristics often differ. Among the states offering such a program are Alabama ($50 per TEU), California ($10), Louisiana ($58 per TEU based on 16 short tons=TEU standard), Mississippi (based on cargo handling fees), Missouri ($50), Pennsylvania ($25), and South Carolina (formula driven).
Two states offer investment and/or employment tax incentives for capital investment and job creation related to port usage expansion activities similar in concept to Virginia’s International Trade Facility Tax Credit. Eligibility guidelines vary. The Georgia tax credit is $1,250 per employee or 5 percent of qualified investment expenses. Missouri offers a tax deduction equivalent to $3,500 per new full-time employee or 2 percent of capital investment.
Three states that provided port incentives when the Virginia programs were established have allowed the incentives to expire. The North Carolina Port Tax credit (a credit based on cargo wharfage and handling fees paid) sunset on January 1, 2014. The Florida Qualified Target Industry Tax Refund (a general incentive that provided a bonus incentive for targeted industries such as firms that increased exports through a seaport or airport) expired on June 20, 2020. A rail usage incentive of $25 per TEU offered by the Port Authority of New York and New Jersey is no longer available.
TABLE J-1: State port incentives
State Incentive name Description Funding rules
Alabama Port Credit
Port credit is available to businesses for increased use of state port facilities. To qualify for the credit, the port user must: be engaged in manufacturing, warehousing, or distribution of goods; ship more than 10 TEUs, 75 net tons, or 15,000 kilograms for air cargo; increase the shipping of its cargo volume by more than 105% over the prior year; and be approved by the Renewal of Alabama Commission.
The port credit is in an amount equal to $50 per TEU, $3 per net ton, or $0.04 cents per kilogram for air freight, multiplied by the port user's cargo volume in the 12-month period, minus the port user's base cargo volume. New distribution or warehouse shippers investing at least $20 million and creating at least 75 net new jobs are eligible to receive up to $100 per TEU over a 3-year period if entering into a project agreement with the state. The port credit is capped at $5 million annually with a cumulative cap of $12 million for the life of the program.
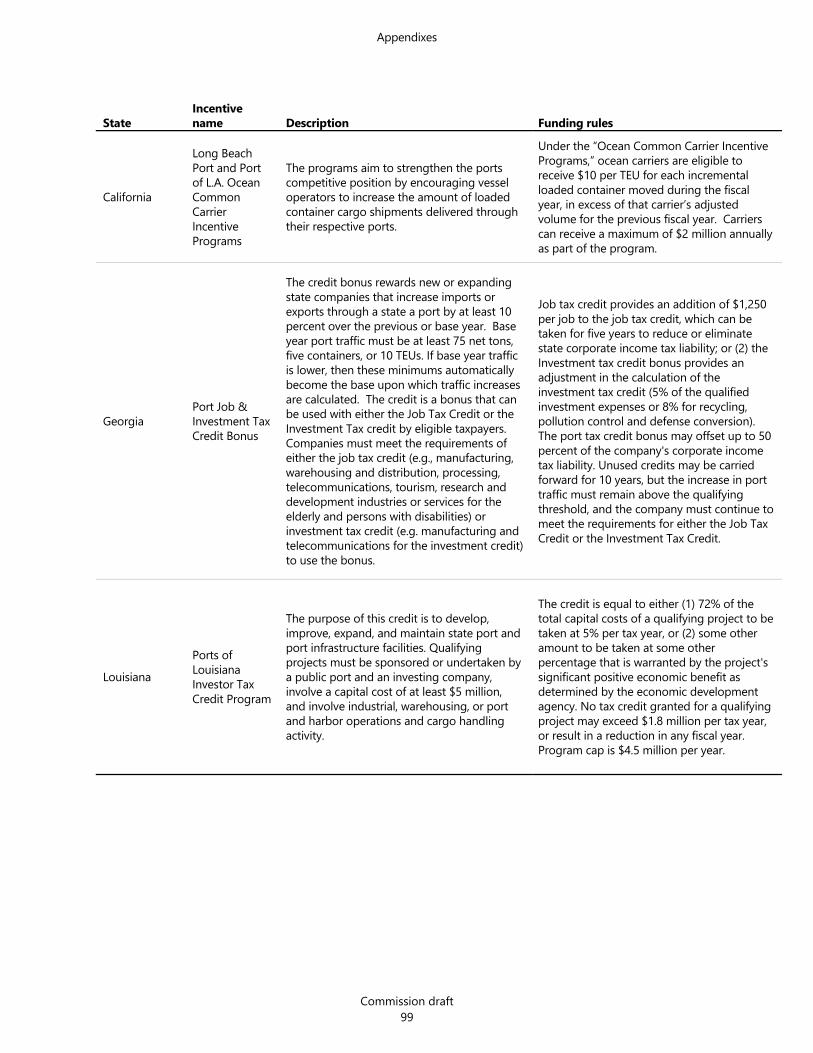
Appendixes
Commission draft 99
State Incentive name Description Funding rules
California
Long Beach Port and Port of L.A. Ocean Common Carrier Incentive Programs
The programs aim to strengthen the ports competitive position by encouraging vessel operators to increase the amount of loaded container cargo shipments delivered through their respective ports.
Under the “Ocean Common Carrier Incentive Programs,” ocean carriers are eligible to receive $10 per TEU for each incremental loaded container moved during the fiscal year, in excess of that carrier’s adjusted volume for the previous fiscal year. Carriers can receive a maximum of $2 million annually as part of the program.
Georgia Port Job & Investment Tax Credit Bonus
The credit bonus rewards new or expanding state companies that increase imports or exports through a state a port by at least 10 percent over the previous or base year. Base year port traffic must be at least 75 net tons, five containers, or 10 TEUs. If base year traffic is lower, then these minimums automatically become the base upon which traffic increases are calculated. The credit is a bonus that can be used with either the Job Tax Credit or the Investment Tax credit by eligible taxpayers. Companies must meet the requirements of either the job tax credit (e.g., manufacturing, warehousing and distribution, processing, telecommunications, tourism, research and development industries or services for the elderly and persons with disabilities) or investment tax credit (e.g. manufacturing and telecommunications for the investment credit) to use the bonus.
Job tax credit provides an addition of $1,250 per job to the job tax credit, which can be taken for five years to reduce or eliminate state corporate income tax liability; or (2) the Investment tax credit bonus provides an adjustment in the calculation of the investment tax credit (5% of the qualified investment expenses or 8% for recycling, pollution control and defense conversion). The port tax credit bonus may offset up to 50 percent of the company's corporate income tax liability. Unused credits may be carried forward for 10 years, but the increase in port traffic must remain above the qualifying threshold, and the company must continue to meet the requirements for either the Job Tax Credit or the Investment Tax Credit.
Louisiana Ports of Louisiana Investor Tax Credit Program
The purpose of this credit is to develop, improve, expand, and maintain state port and port infrastructure facilities. Qualifying projects must be sponsored or undertaken by a public port and an investing company, involve a capital cost of at least $5 million, and involve industrial, warehousing, or port and harbor operations and cargo handling activity.
The credit is equal to either (1) 72% of the total capital costs of a qualifying project to be taken at 5% per tax year, or (2) some other amount to be taken at some other percentage that is warranted by the project's significant positive economic benefit as determined by the economic development agency. No tax credit granted for a qualifying project may exceed $1.8 million per tax year, or result in a reduction in any fiscal year. Program cap is $4.5 million per year.

Appendixes
Commission draft 100
State Incentive name Description Funding rules
Import Export Tax Credit
The purpose of the credit is to encourage the utilization of public port facilities for the import and export of cargo. Tax credit is based on number of tons of qualified cargo imported and exported from or to manufacturing, fabrication, assembly, distribution, and processing facilities located in state. Project must receive agency certification and provide verified statement of cargo volume data for calendar year, including total annual volume of cargo imported and exported. In addition, credit is only allowed if it increases utilization of public facilities and other activity associated with import or export of international business entity's qualified cargo and results in a "significant positive economic benefit" to the state.
The credit is equal to the lesser of (1) $3.60 multiplied by the tons of qualified cargo for the tax year that exceeds the pre-certification tonnage, or (2) multiplying the number of dollars by the number of tons of qualified cargo for the taxable year or portion of taxable year that exceeds the precertification tonnage warranted by the "significant positive economic benefit." Credit may not exceed $1.8 million per tax year or $4.5 million per fiscal year.
Massachusetts Harbor Maintenance Tax Credit
A corporation subject to corporate excise tax may claim a dollar-for-dollar state tax credit equal to the amount of "qualifying harbor maintenance tax" (HMT) it pays to the federal government for "port use" at one of three Massachusetts ports during the taxable year. Only for break-bulk and containerized cargo. Bulk cargo is not eligible.
There is no cap for the program or per tax payer.
Mississippi
Export Port Charge Tax Credit
The credit is available to businesses that export cargo through certain state ports. The purpose of the credit is to promote the increased use of ports and related facilities and increase the number of port-related jobs and other economic development associated with increase port usage.
The amount of the credit is the total of all charges paid on export cargo for receiving into the port, handling to a vessel, and wharfage. Credit cannot exceed 50% of income tax liability for any year. Any excess credit will not be refunded but can be carried forward for up to five years.
Import Port Charges credit
The credit is available to businesses that import cargo (except for forest products) through certain state ports. An eligible business must locate its U.S. headquarters in the state, have at least five permanent full-time employees, and have a minimum capital investment of $2,000,000 in the state.
The credit is equal to the total charges for receiving cargo into the port, handling from a vessel and wharfage fees. Maximum cumulative credit is $1 million if employment between 5 and 25 employees, $2 million for 25–100, $3 million for 100-–200 and $4 million for more than 200. Credit cannot exceed 50% of income tax liability for any year. Any excess credit will not be refunded but can be carried forward for up to five years.

Appendixes
Commission draft 101
State Incentive name Description Funding rules
Missouri
Water Port Facility or Airport Cargo Deduction
Manufacturers or distributors shipping cargo by waterborne vessel through a water port facility or by airplane through an airport located in state may be eligible for the deduction. Taxpayer must increase cargo volume through a port facility by 5% over the prior year. Agency may waive 5% increase requirement if cargo is transported through a major facility (facility expected to transport at last 25,000 TEUs). Taxpayer must have transported at least 75 net tons of noncontainerized cargo or 10 loaded TEUs in the prior year to be eligible.
The deduction equals $50 per TEU or noncontainerized cargo equivalent. Taxpayers are generally limited to $250,000 deduction in year (no more than $3.5 million for all qualifying taxpayer in calendar year).
International Trade Facility Cargo Deduction
Taxpayer operating an international trade facility may qualify based on amount of cargo transported by air, rail or barge.
Deduction equals $25 per TEU or noncontainerized cargo equivalent. There is a $2 million deduction cap for all taxpayers.
Qualified Trade Activities Deduction
Taxpayers operating an international trade facility and increasing volume of cargo by 10% over prior year may qualify for the deduction.
Deduction is equal to $3,500 per new full-time employee or 2% of the capital investment made in the facility. Deduction may not exceed 50% of taxpayer adjusted gross income. Cap of $500,000 in deductions for all taxpayers in year.
Pennsylvania
Pennsylvania Intermodal Cargo Growth Incentive Program
Program provides an economic incentive to ocean carriers to move their cargo through a state port instead of other U.S. ports. The incentive is offered to eligible ocean carriers starting a new service to a state port as well as to ocean carriers currently calling a state port and increasing containerized cargo volumes based on benchmarks established by state department of transportation.
The incentive is $25 per verified container “lift” loaded or discharged from vessels moving through a state port. The program is appropriated $1,000,000 each year through SFY 2021.
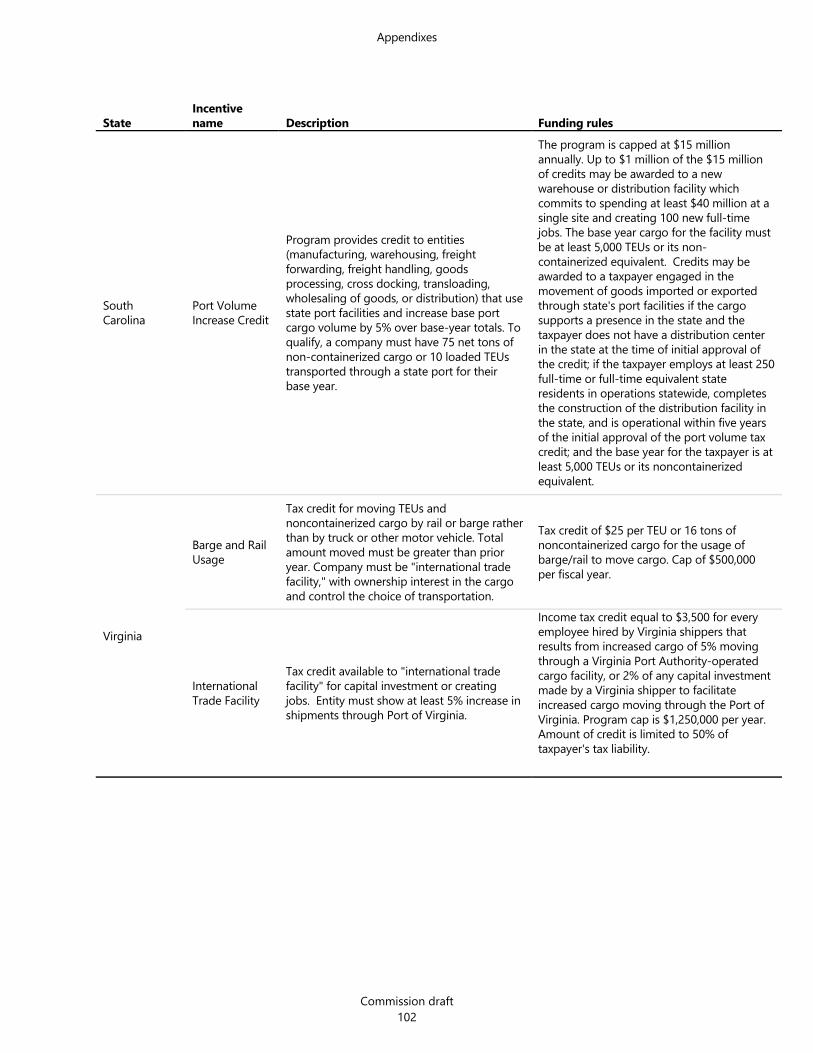
Appendixes
Commission draft 102
State Incentive name Description Funding rules
South Carolina
Port Volume Increase Credit
Program provides credit to entities (manufacturing, warehousing, freight forwarding, freight handling, goods processing, cross docking, transloading, wholesaling of goods, or distribution) that use state port facilities and increase base port cargo volume by 5% over base-year totals. To qualify, a company must have 75 net tons of non-containerized cargo or 10 loaded TEUs transported through a state port for their base year.
The program is capped at $15 million annually. Up to $1 million of the $15 million of credits may be awarded to a new warehouse or distribution facility which commits to spending at least $40 million at a single site and creating 100 new full-time jobs. The base year cargo for the facility must be at least 5,000 TEUs or its non-containerized equivalent. Credits may be awarded to a taxpayer engaged in the movement of goods imported or exported through state's port facilities if the cargo supports a presence in the state and the taxpayer does not have a distribution center in the state at the time of initial approval of the credit; if the taxpayer employs at least 250 full-time or full-time equivalent state residents in operations statewide, completes the construction of the distribution facility in the state, and is operational within five years of the initial approval of the port volume tax credit; and the base year for the taxpayer is at least 5,000 TEUs or its noncontainerized equivalent.
Virginia
Barge and Rail Usage
Tax credit for moving TEUs and noncontainerized cargo by rail or barge rather than by truck or other motor vehicle. Total amount moved must be greater than prior year. Company must be "international trade facility," with ownership interest in the cargo and control the choice of transportation.
Tax credit of $25 per TEU or 16 tons of noncontainerized cargo for the usage of barge/rail to move cargo. Cap of $500,000 per fiscal year.
International Trade Facility
Tax credit available to "international trade facility" for capital investment or creating jobs. Entity must show at least 5% increase in shipments through Port of Virginia.
Income tax credit equal to $3,500 for every employee hired by Virginia shippers that results from increased cargo of 5% moving through a Virginia Port Authority-operated cargo facility, or 2% of any capital investment made by a Virginia shipper to facilitate increased cargo moving through the Port of Virginia. Program cap is $1,250,000 per year. Amount of credit is limited to 50% of taxpayer's tax liability.
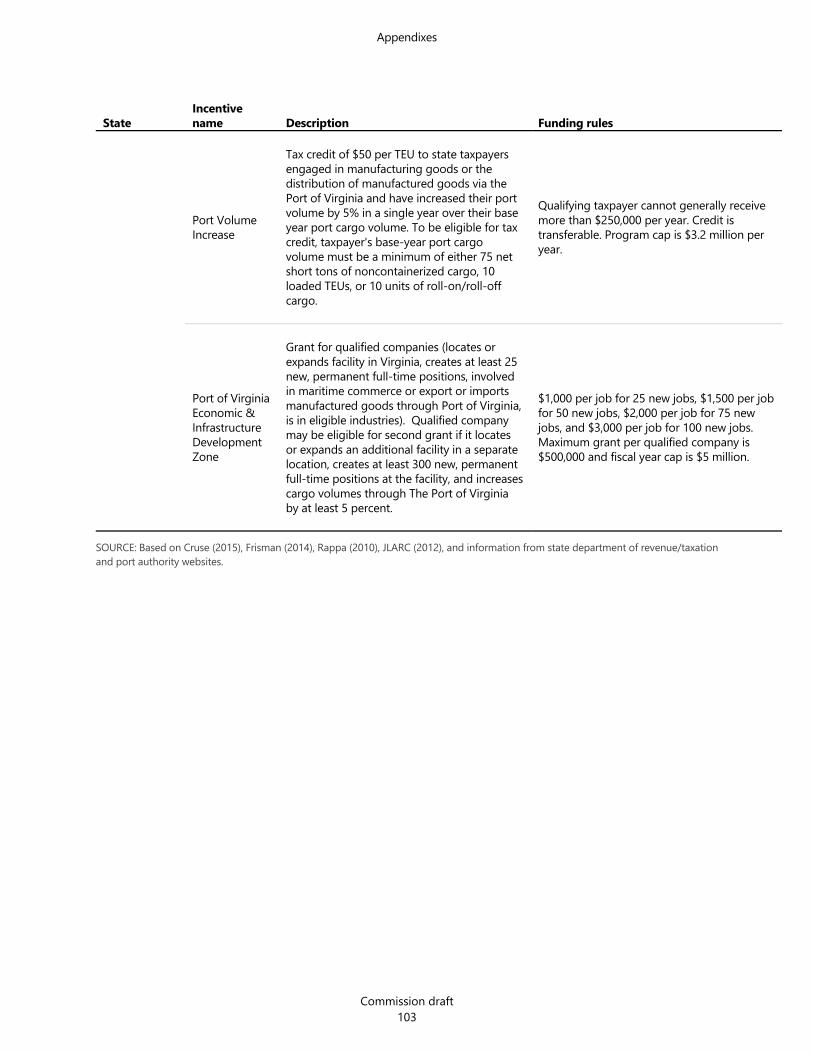
Appendixes
Commission draft 103
State Incentive name Description Funding rules
Port Volume Increase
Tax credit of $50 per TEU to state taxpayers engaged in manufacturing goods or the distribution of manufactured goods via the Port of Virginia and have increased their port volume by 5% in a single year over their base year port cargo volume. To be eligible for tax credit, taxpayer's base-year port cargo volume must be a minimum of either 75 net short tons of noncontainerized cargo, 10 loaded TEUs, or 10 units of roll-on/roll-off cargo.
Qualifying taxpayer cannot generally receive more than $250,000 per year. Credit is transferable. Program cap is $3.2 million per year.
Port of Virginia Economic & Infrastructure Development Zone
Grant for qualified companies (locates or expands facility in Virginia, creates at least 25 new, permanent full-time positions, involved in maritime commerce or export or imports manufactured goods through Port of Virginia, is in eligible industries). Qualified company may be eligible for second grant if it locates or expands an additional facility in a separate location, creates at least 300 new, permanent full-time positions at the facility, and increases cargo volumes through The Port of Virginia by at least 5 percent.
$1,000 per job for 25 new jobs, $1,500 per job for 50 new jobs, $2,000 per job for 75 new jobs, and $3,000 per job for 100 new jobs. Maximum grant per qualified company is $500,000 and fiscal year cap is $5 million.
SOURCE: Based on Cruse (2015), Frisman (2014), Rappa (2010), JLARC (2012), and information from state department of revenue/taxation and port authority websites.

Appendixes
Commission draft 104
Appendix K: VALET and Trade Show Assistance Program awards by locality International trade assistance program awards are widely distributed across Virginia’s counties and cities, particularly when compared with other Virginia incentive programs which tend to be more concentrated in Northern Virginia and the Tobacco Region. (See Economic Development Incentives 2020, JLARC 2020). This result is because trade managers are allotted a quota of firms to recruit from each service region to ensure geographical balance in both programs (Figure K-1).
FIGURE K-1 International trade program grants are fairly evenly distributed across the state
Virginia Leaders in Export Trade (VALET) (FY10–FY19)
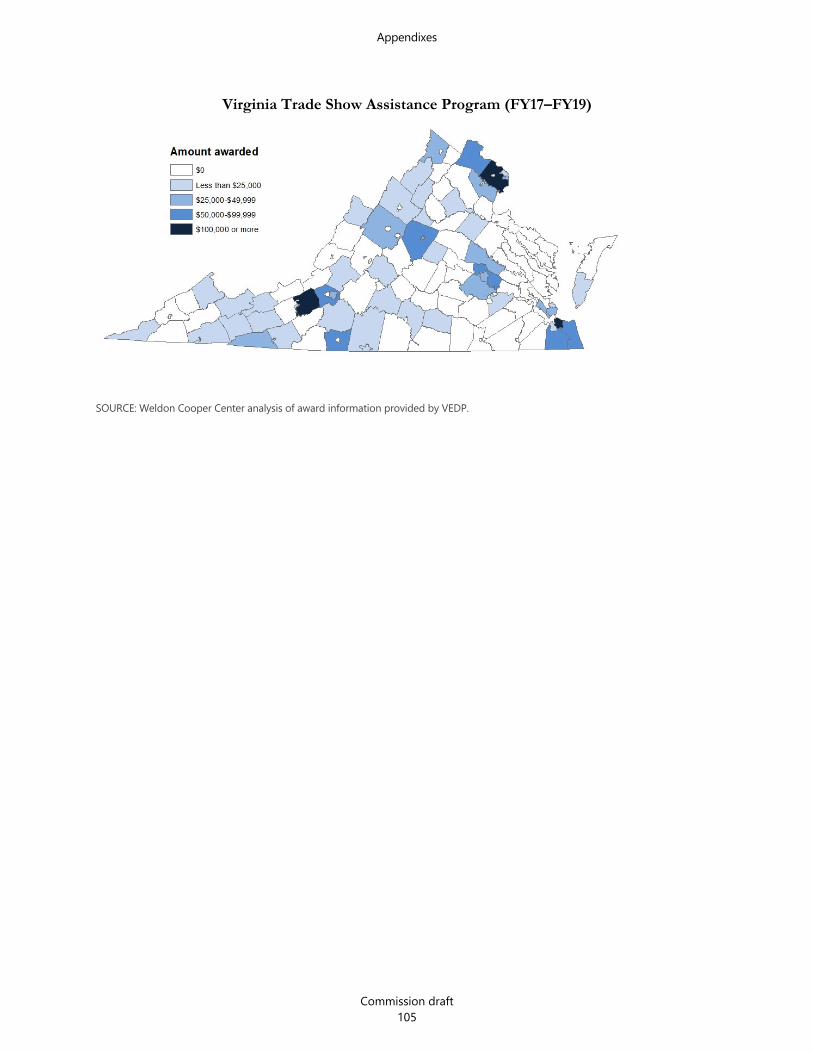
Appendixes
Commission draft 105
Virginia Trade Show Assistance Program (FY17–FY19)
SOURCE: Weldon Cooper Center analysis of award information provided by VEDP.

Appendixes
Commission draft 106
Appendix L: Agency responses As part of an extensive validation process, the state agencies and other entities that are subject to a JLARC assessment are given the opportunity to comment on an exposure draft of the report. JLARC staff sent an exposure draft of this report to the Virginia Economic Development Partnership, De-partment of Taxation, Virginia Port Authority, Secretary of Finance, Secretary of Commerce and Trade, and Secretary of Transportation.
Appropriate corrections resulting from technical and substantive comments are incorporated in this version of the report. This appendix includes response letters from the
Virginia Economic Development Partnership and the
Department of Taxation.

901 E. Cary Street, Suite 900Richmond, Virginia 23219 VEDP.org
May 28, 2021 Mr. Hal E. Greer, Director Joint Legislative Audit & Review Commission 919 East Main Street, Suite 2101 Richmond, VA 23219 Re: VEDP response to the draft JLARC report, Trade and Transportation Incentives Dear Mr. Greer: Thank you for providing an opportunity for us to comment on the Joint Legislative Audit & Review Commission’s (JLARC’s) draft report, Trade and Transportation Incentives. The report provides a helpful overview of incentives that promote economic activity by businesses in the transportation industry and that promote international trade. Among other things, we appreciate your analysis showing that VEDP’s Virginia Leaders in Export Trade (VALET) and Trade Show Assistance Programs have a high economic benefit to Virginia, including the generation of 300 additional jobs, $50 million in additional Virginia GDP, and $30 million in personal income for every $1 million spent on the programs. This is more than double the average economic benefit generated by other grants. Your report demonstrates the impact of some of VEDP’s most important international trade assistance programs. As noted in the report, VALET is a nationally recognized program, acclaimed for its combination of strategy development and implementation and expense reimbursement for participating companies, which are thoroughly evaluated prior to being accepted into the program. Companies report not only a 47% average increase in international sales as a result of participating in VALET, but also that the program facilitated their implementation of new marketing strategies and entry into new international markets. Furthermore, the Trade Show Assistance Program in just five years has enabled over 190 companies to participate in international trade shows, with 92% of program participants served only through this program reporting that it helped them achieve their international goals.
We appreciate and agree with the recommendation to conduct periodic in-depth evaluations of graduates of the VALET Program. As noted, we conducted such studies in 2008 and 2012 and found them to be useful in evaluating the program’s long-term impacts on past participants and suggesting program modifications that could enhance its impact. Because international sales can take several years to materialize, it is important to survey companies to learn what additional sales develop after they graduate. We will endeavor to undertake another VALET Program evaluation in 2022, with a 10-year look-back period, as recommended in your report. We also agree with your recommendation to survey Trade Show Assistance Program participants using specific questions tailored to the nuances of the program and the specific activities associated with participating in an international trade show, as well as their impact. Upon completion of the program, we will send a survey to each participant including questions about trade show performance, such as pre-show preparations, onsite show activities, number of customer contacts gained, leads generated, and final show outcomes, such as sales and agreements made.
Mr. Greer Page 2 of 2
In addition to reviewing VEDP’s international trade assistance programs, the report also reviewed several incentives managed by the Virginia Port Authority (VPA). We appreciate the recommendation that VEDP be included in efforts to enhance some of these programs and look forward to working with our colleagues at VPA to do so. As usual, we appreciated the professionalism of JLARC staff during the project, and compliment your team on its insightful analysis and reporting. Sincerely, Stephen Moret President & CEO


JLARC.VIRGINIA.GOV919 East Main St. Suite 2101
Richmond, VA 23219