Embed Size (px)
Citation preview
COMMERCIALIZATION OF IMPROVED COOKSTOVES FOR
REDUCED INDOOR AIR POLLUTION IN URBAN SLUMS OF NORTHWEST BANGLADESH
May 2009 This publication was produced by Winrock International under a cooperative agreement for the United States Agency for International Development. The views expressed in this publication do not necessarily reflect the views of the United States Agency for International Development or the United States Government.
USAID/Winrock Commercialization of Improved Cookstoves for Reduced IAP in NW Bangladesh
i
TABLE OF CONTENTS ACRONYMS ........................................................................................................... III EXECUTIVE SUMMARY ......................................................................................... 1
I. PROJECT OVERVIEW ........................................................................................ 3 A. Background ...................................................................................................................... 3
B. Project Objectives ............................................................................................................ 5
C. Approach .......................................................................................................................... 5
D. Project Team .................................................................................................................... 6
II. PROJECT ACTIVITIES ....................................................................................... 7 A. Baseline Assessment ......................................................................................................... 7
1. Household questionnaire survey ...................................................................................................... 7 2. Indoor air quality monitoring ........................................................................................................... 8
B. Establishing Community-Level Organization Infrastructure ..................................... 9
C. Raising Awareness and Promoting Effective Behavior .............................................. 10 1. Message and material development ............................................................................................... 10 2. Promotional activities..................................................................................................................... 11
D. Promoting Appropriate Technology ............................................................................ 12
E. Developing a Market and Establishing Entrepreneurs .............................................. 14 1. Entrepreneur training ..................................................................................................................... 15 2. Cookstove marketing materials ...................................................................................................... 16 3. Linking entrepreneurs and community/customers ......................................................................... 16 4. Stove pricing .................................................................................................................................. 17 5. Financing support ........................................................................................................................... 17
III. PROJECT RESULTS ....................................................................................... 19 A. Summary ........................................................................................................................ 19
B. Detailed Results .............................................................................................................. 20 1. Community organizations established............................................................................................ 20 2. Awareness raised and behaviors changed .................................................................................... 20 3. Appropriate technology adopted .................................................................................................... 21 4. Market system developed for sustainability ................................................................................... 22
a. Local entrepreneur training ....................................................................................................... 22 b. Financing support ...................................................................................................................... 23 c. Selling improved cookstoves ..................................................................................................... 23 d. Micro-finance institution training .............................................................................................. 24
IV. KEY OBSERVATIONS AND LESSONS LEARNED ....................................... 25 A. Project Design ................................................................................................................ 25
B. Strengthening Local Health Networks ......................................................................... 26
C. Raising Awareness and Changing Behaviors .............................................................. 27
D. Promoting Appropriate Technology ............................................................................ 28
E. Developing a Market and Establishing Entrepreneurs .............................................. 29
F. Dissemination of Project Model .................................................................................... 30 1. Concern Worldwide Bangladesh .................................................................................................... 31
USAID/Winrock Commercialization of Improved Cookstoves for Reduced IAP in NW Bangladesh
ii
2. The World Bank ............................................................................................................................. 31 3. Village Education Resource Center ............................................................................................... 31
LIST OF TABLES Table 1. Mean PM2.5 levels (µg/m3) in selected households in Saidpur and Parbatipur ....... 8Table 2. Project results (as of September 2007) .................................................................. 19 LIST OF ANNEXES I. BASELINE SURVEY ON HOUSEHOLD ENERGY PRACTICES, INDOOR AIR POLLUTION, AND HEALTH II. BASELINE SURVEY QUESTIONNAIRE III. BASELINE INDOOR AIR POLLUTION MONITORING REPORT IV. POST-MONITORING QUESTIONNAIRE V. COOKSTOVE PERFORMANCE REPORT VI. BEHAVIOR CHANGE COMMUNICATIONS MATERIALS
USAID/Winrock Commercialization of Improved Cookstoves for Reduced IAP in NW Bangladesh
iii
ACRONYMS
ARI Acute Respiratory Infection ARECOP Asia Regional Cookstove Program ARTI Appropriate Rural Technology Institute BCC Behavior Change Communication BRAC Bangladesh Rural Advancement Committee CHV Community Health Volunteer CMC Community Management Committee CO Carbon Monoxide CSP Child Survival Program GOB Government of Bangladesh IAP Indoor Air Pollution IAQ Indoor Air Quality KPT Kitchen Performance Test MFI Micro-finance Institution MPA Methodology for Participatory Assessment NGO Non-governmental Organization PM Particulate Matter PPR Parbatipur SPR Saidpur USAID United States Agency for International Development USEPA United States Environmental Protection Agency VERC Village Education Resource Center WBT Water Boiling Test WHC Ward Health Committee WHO World Health Organization
USAID/Winrock Commercialization of Improved Cookstoves for Reduced IAP in NW Bangladesh
1
EXECUTIVE SUMMARY
In Bangladesh the majority of the population relies on biomass for cooking and heating. To date efforts to promote improved cookstoves and wood fuel conservation have focused primarily on the energy side of the problem, neglecting the health impacts associated with the indoor air pollution (IAP) caused by burning biomass indoors. Acute respiratory infections (ARI), many caused or exacerbated by IAP, are one of the leading causes of under-five deaths in the country, which has an under-five mortality rate of 77 per 1,000 live births.1
Winrock, in collaboration with Concern Worldwide Bangladesh and the Village Education Resource Center (VERC), implemented the Bangladesh pilot project from 2005-2007 in selected wards
Beginning in 2003, the energy team of USAID’s Bureau for Economic Growth, Agriculture, and Trade, and the environmental health team of the Bureau for Global Health jointly supported a cooperative agreement with Winrock International to develop models to reduce indoor air pollution by combining fuel-efficient cooking technologies with behavior change messages and market-based distribution mechanisms. Winrock developed two project models: a rural model piloted in the highlands of Peru for indigenous communities, and a peri-urban model piloted in Bangladesh for poor households.
2
The objective of the pilot project was to reduce indoor air pollution and fuel consumption via the dissemination and commercialization of efficient cookstoves among peri-urban communities through an integrated and sustainable household energy intervention. The project aimed to establish a sustainable market for improved and appropriate stoves to avoid the need for subsidies, either current or future. Three models of fuel-efficient cookstoves, each significantly less polluting than traditional stoves, were selected and promoted in this project. Winrock coupled product promotion with a multi-faceted communication campaign to raise awareness about the risks of indoor smoke and the benefits of behavior change and using improved stoves to reduce IAP exposure. The project team worked with existing local government institutions and health networks to disseminate behavior change messages, and teamed up with local entrepreneurs to disseminate stoves commercially. The project has strong potential for use as a model for incorporating IAP into child survival and health programming activities, particularly those implemented by donor agencies such as the USAID/Bangladesh Mission.
of Saidpur and Parbatipur municipalities in Nilphamari and Dinajpur districts in the northwest part of the country.
The impact and results of the project included: sales of efficient stoves to 583 households; IAP-related awareness-raising messages disseminated to over 50,000 people; increased commitment from the local government to mitigate indoor air pollution; and more than 25
1 Mortality Country Fact Sheet 2006, World Health Organization http://www.who.int/whosis/mort/profiles/mort searo bgd bangladesh.pdf 2 The ward is the smallest bureaucratic unit of the municipality population.
USAID/Winrock Commercialization of Improved Cookstoves for Reduced IAP in NW Bangladesh
2
cookstove entrepreneurs established or supported to continue cookstove dissemination in Bangladesh beyond the dates of the pilot project. There is potential for sustained and expanded adoption of improved stoves in the areas where the established entrepreneurs’ businesses are operating and municipal governments continue to support stove promotion. Since the end of the project, the entrepreneurs have expanded their businesses beyond the pilot municipalities, and some municipal government leaders continue to advocate for a larger IAP reduction initiative within their constituencies.
USAID/Winrock Commercialization of Improved Cookstoves for Reduced IAP in NW Bangladesh
3
I. PROJECT OVERVIEW
A. Background
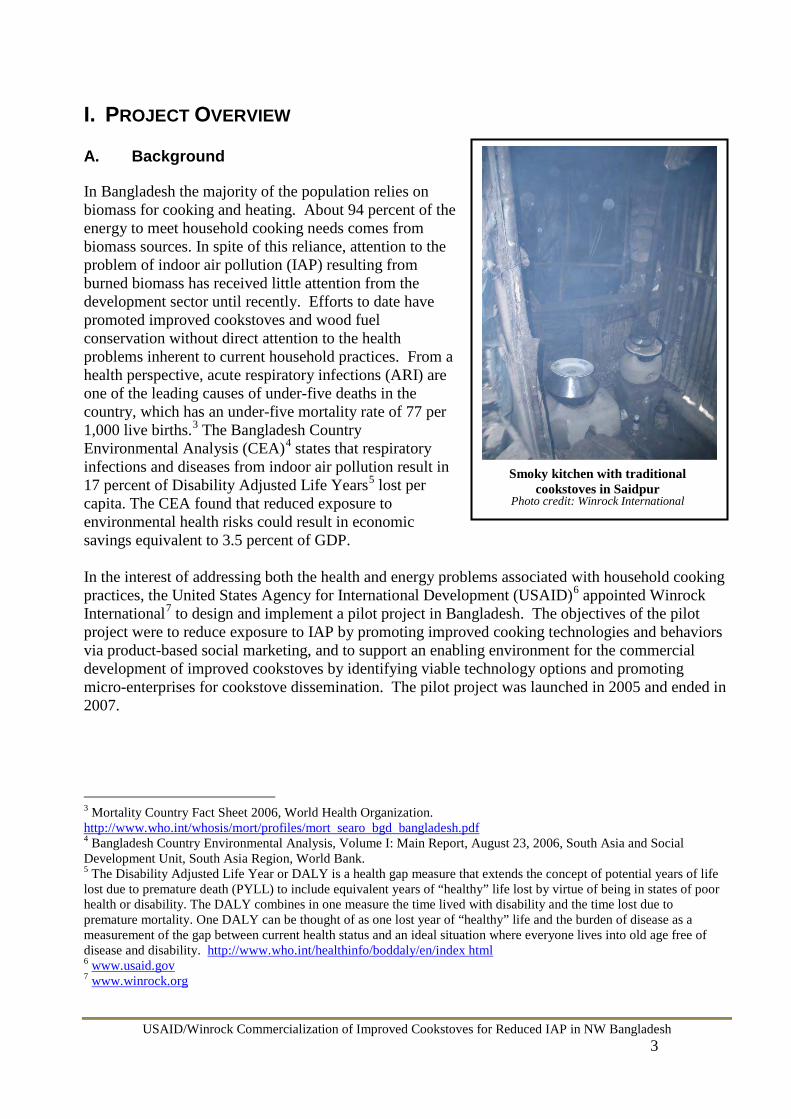
In Bangladesh the majority of the population relies on biomass for cooking and heating. About 94 percent of the energy to meet household cooking needs comes from biomass sources. In spite of this reliance, attention to the problem of indoor air pollution (IAP) resulting from burned biomass has received little attention from the development sector until recently. Efforts to date have promoted improved cookstoves and wood fuel conservation without direct attention to the health problems inherent to current household practices. From a health perspective, acute respiratory infections (ARI) are one of the leading causes of under-five deaths in the country, which has an under-five mortality rate of 77 per 1,000 live births.3 The Bangladesh Country Environmental Analysis (CEA)4 states that respiratory infections and diseases from indoor air pollution result in 17 percent of Disability Adjusted Life Years5
In the interest of addressing both the health and energy problems associated with household cooking practices, the United States Agency for International Development (USAID)
lost per capita. The CEA found that reduced exposure to environmental health risks could result in economic savings equivalent to 3.5 percent of GDP.
6 appointed Winrock International7
3 Mortality Country Fact Sheet 2006, World Health Organization.
to design and implement a pilot project in Bangladesh. The objectives of the pilot project were to reduce exposure to IAP by promoting improved cooking technologies and behaviors via product-based social marketing, and to support an enabling environment for the commercial development of improved cookstoves by identifying viable technology options and promoting micro-enterprises for cookstove dissemination. The pilot project was launched in 2005 and ended in 2007.
http://www.who.int/whosis/mort/profiles/mort searo bgd bangladesh.pdf 4 Bangladesh Country Environmental Analysis, Volume I: Main Report, August 23, 2006, South Asia and Social Development Unit, South Asia Region, World Bank. 5 The Disability Adjusted Life Year or DALY is a health gap measure that extends the concept of potential years of life lost due to premature death (PYLL) to include equivalent years of “healthy” life lost by virtue of being in states of poor health or disability. The DALY combines in one measure the time lived with disability and the time lost due to premature mortality. One DALY can be thought of as one lost year of “healthy” life and the burden of disease as a measurement of the gap between current health status and an ideal situation where everyone lives into old age free of disease and disability. http://www.who.int/healthinfo/boddaly/en/index html 6 www.usaid.gov 7 www.winrock.org
Smoky kitchen with traditional
cookstoves in Saidpur Photo credit: Winrock International
USAID/Winrock Commercialization of Improved Cookstoves for Reduced IAP in NW Bangladesh
4
To implement the project, Winrock partnered with two local organizations, Concern Worldwide Bangladesh (Concern)8
and Village Education Resource Center (VERC), entities with experience in health and energy issues, respectively. Concern has past experience collaborating with USAID, notably under its Child Survival Program, which established a promising municipal model with demonstrated, significant increases in health coverage and effective civil society and local government engagement.
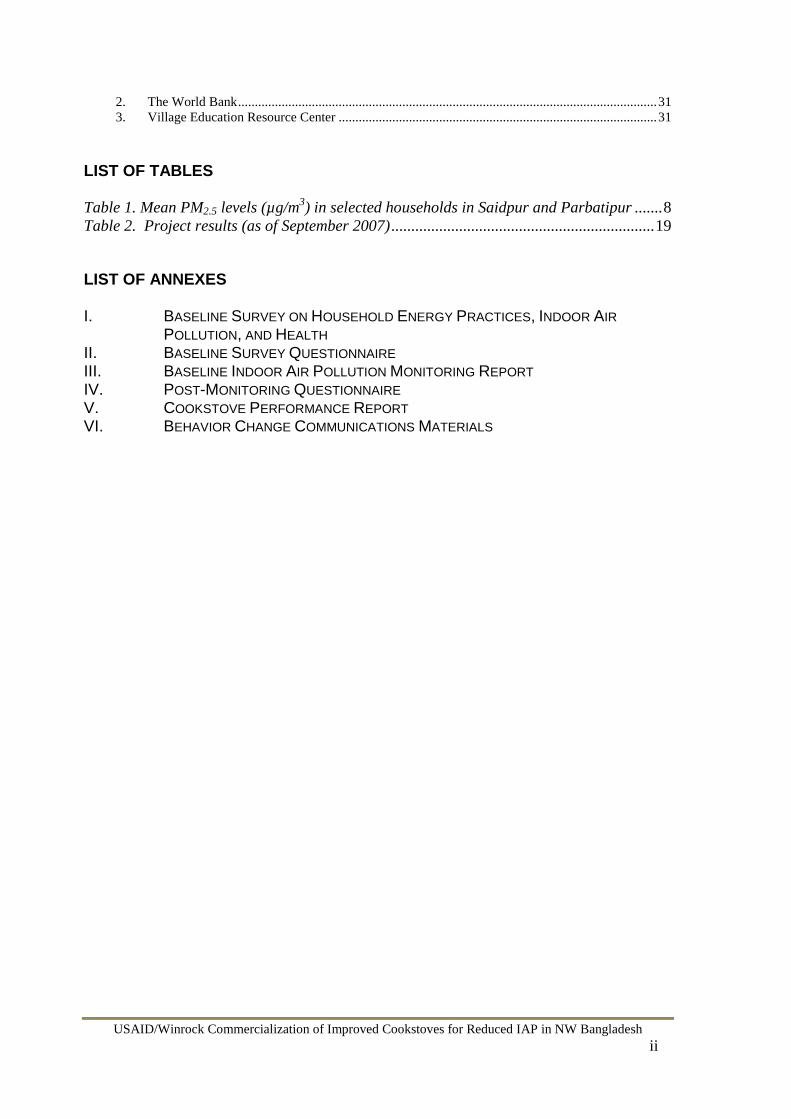
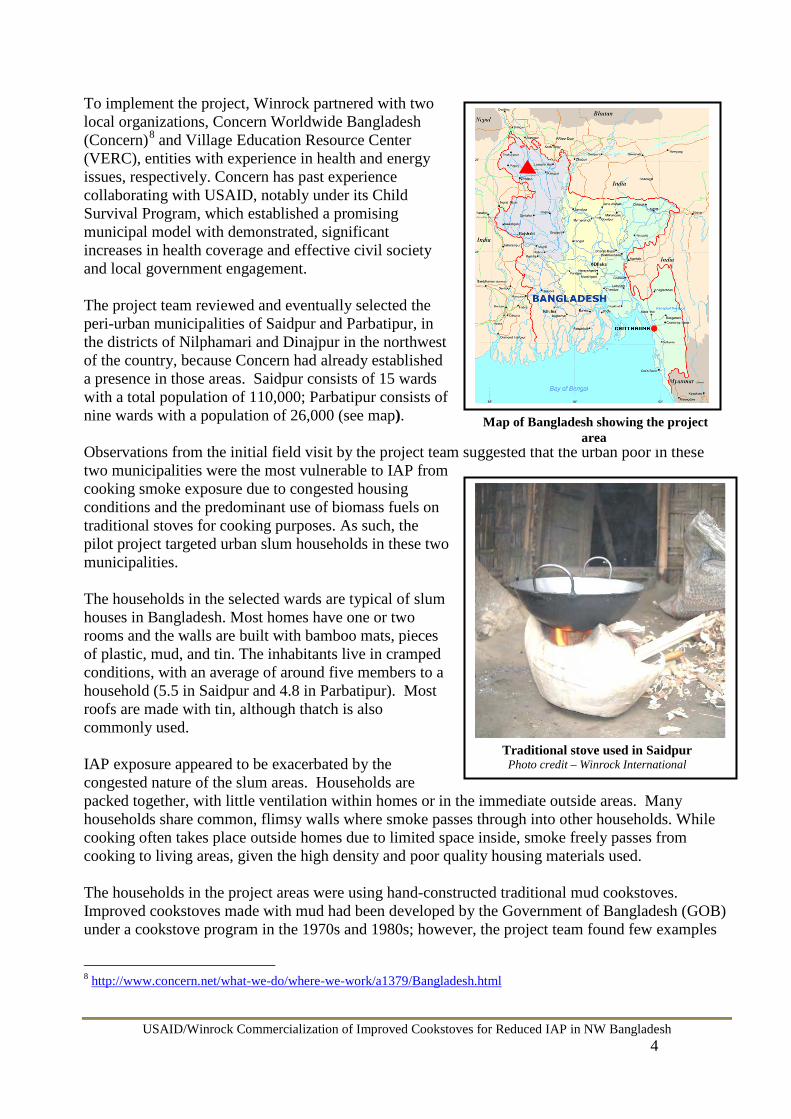
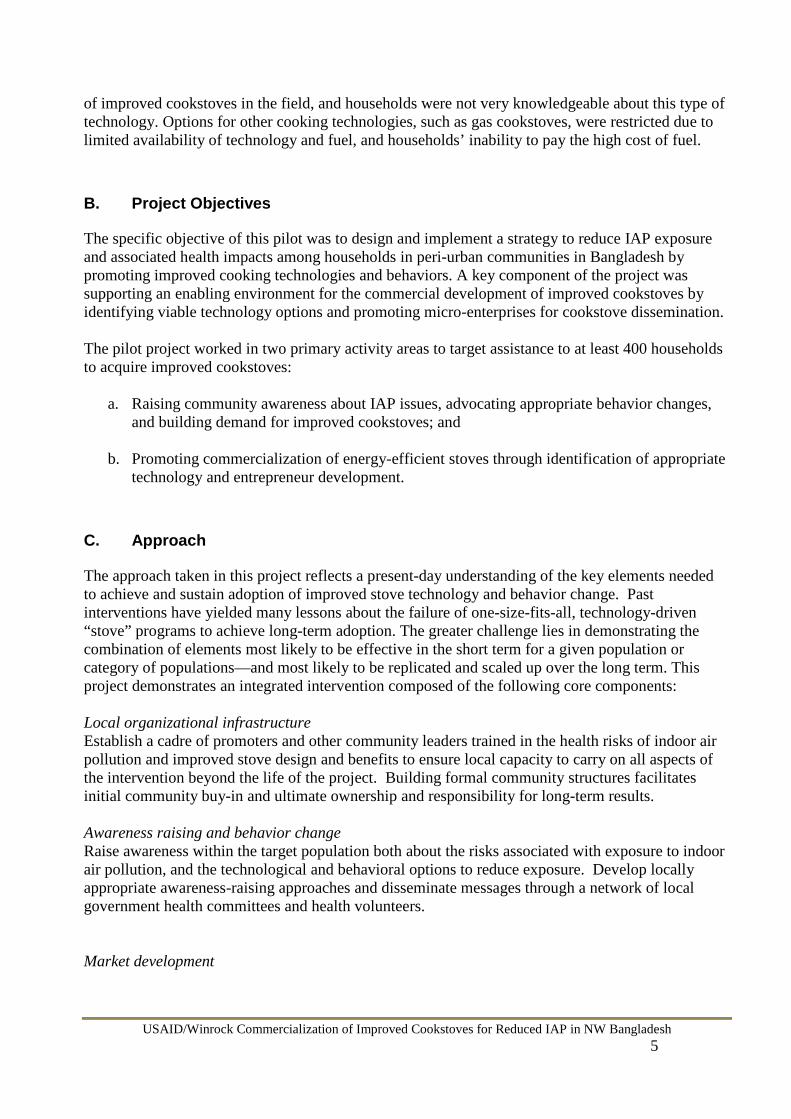
The project team reviewed and eventually selected the peri-urban municipalities of Saidpur and Parbatipur, in the districts of Nilphamari and Dinajpur in the northwest of the country, because Concern had already established a presence in those areas. Saidpur consists of 15 wards with a total population of 110,000; Parbatipur consists of nine wards with a population of 26,000 (see map). Observations from the initial field visit by the project team suggested that the urban poor in these two municipalities were the most vulnerable to IAP from cooking smoke exposure due to congested housing conditions and the predominant use of biomass fuels on traditional stoves for cooking purposes. As such, the pilot project targeted urban slum households in these two municipalities. The households in the selected wards are typical of slum houses in Bangladesh. Most homes have one or two rooms and the walls are built with bamboo mats, pieces of plastic, mud, and tin. The inhabitants live in cramped conditions, with an average of around five members to a household (5.5 in Saidpur and 4.8 in Parbatipur). Most roofs are made with tin, although thatch is also commonly used. IAP exposure appeared to be exacerbated by the congested nature of the slum areas. Households are packed together, with little ventilation within homes or in the immediate outside areas. Many households share common, flimsy walls where smoke passes through into other households. While cooking often takes place outside homes due to limited space inside, smoke freely passes from cooking to living areas, given the high density and poor quality housing materials used. The households in the project areas were using hand-constructed traditional mud cookstoves. Improved cookstoves made with mud had been developed by the Government of Bangladesh (GOB) under a cookstove program in the 1970s and 1980s; however, the project team found few examples
8 http://www.concern.net/what-we-do/where-we-work/a1379/Bangladesh.html
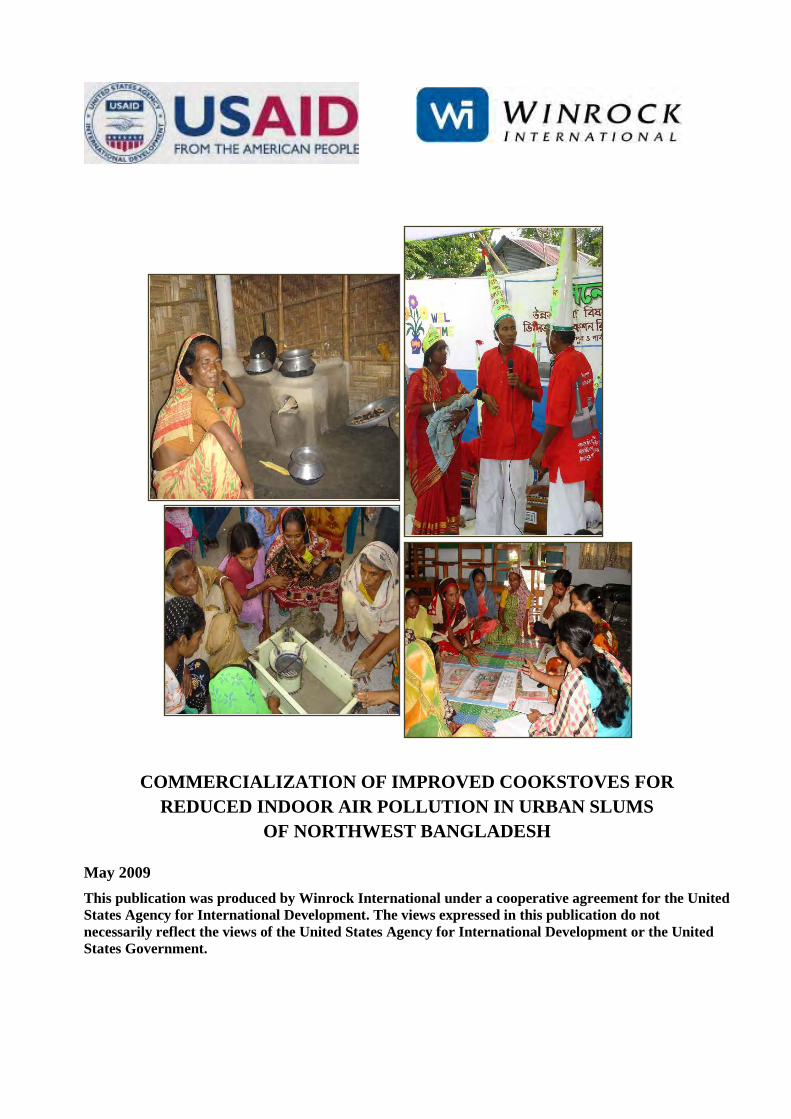
Traditional stove used in Saidpur Photo credit – Winrock International
Map of Bangladesh showing the project area
USAID/Winrock Commercialization of Improved Cookstoves for Reduced IAP in NW Bangladesh
5
of improved cookstoves in the field, and households were not very knowledgeable about this type of technology. Options for other cooking technologies, such as gas cookstoves, were restricted due to limited availability of technology and fuel, and households’ inability to pay the high cost of fuel.
B. Project Objectives
The specific objective of this pilot was to design and implement a strategy to reduce IAP exposure and associated health impacts among households in peri-urban communities in Bangladesh by promoting improved cooking technologies and behaviors. A key component of the project was supporting an enabling environment for the commercial development of improved cookstoves by identifying viable technology options and promoting micro-enterprises for cookstove dissemination. The pilot project worked in two primary activity areas to target assistance to at least 400 households to acquire improved cookstoves:
a. Raising community awareness about IAP issues, advocating appropriate behavior changes, and building demand for improved cookstoves; and
b. Promoting commercialization of energy-efficient stoves through identification of appropriate
technology and entrepreneur development. C. Approach
The approach taken in this project reflects a present-day understanding of the key elements needed to achieve and sustain adoption of improved stove technology and behavior change. Past interventions have yielded many lessons about the failure of one-size-fits-all, technology-driven “stove” programs to achieve long-term adoption. The greater challenge lies in demonstrating the combination of elements most likely to be effective in the short term for a given population or category of populations—and most likely to be replicated and scaled up over the long term. This project demonstrates an integrated intervention composed of the following core components: Local organizational infrastructure Establish a cadre of promoters and other community leaders trained in the health risks of indoor air pollution and improved stove design and benefits to ensure local capacity to carry on all aspects of the intervention beyond the life of the project. Building formal community structures facilitates initial community buy-in and ultimate ownership and responsibility for long-term results. Awareness raising and behavior change Raise awareness within the target population both about the risks associated with exposure to indoor air pollution, and the technological and behavioral options to reduce exposure. Develop locally appropriate awareness-raising approaches and disseminate messages through a network of local government health committees and health volunteers. Market development
USAID/Winrock Commercialization of Improved Cookstoves for Reduced IAP in NW Bangladesh
6
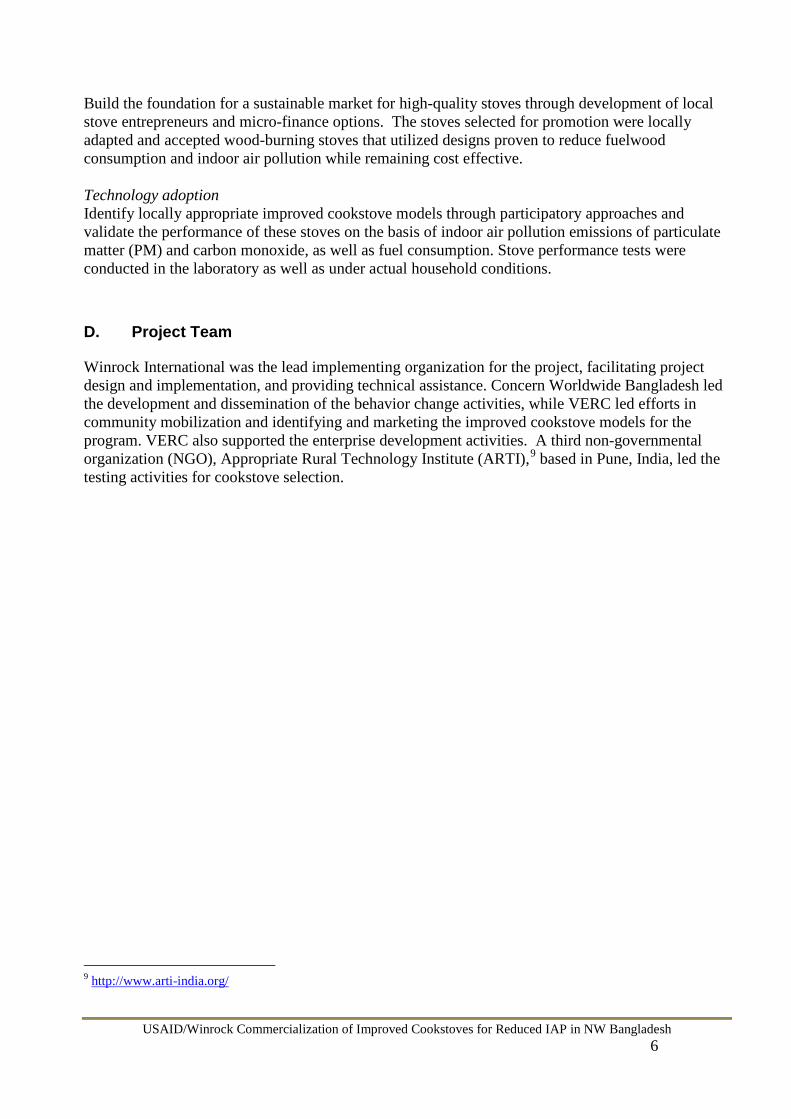
Build the foundation for a sustainable market for high-quality stoves through development of local stove entrepreneurs and micro-finance options. The stoves selected for promotion were locally adapted and accepted wood-burning stoves that utilized designs proven to reduce fuelwood consumption and indoor air pollution while remaining cost effective. Technology adoption Identify locally appropriate improved cookstove models through participatory approaches and validate the performance of these stoves on the basis of indoor air pollution emissions of particulate matter (PM) and carbon monoxide, as well as fuel consumption. Stove performance tests were conducted in the laboratory as well as under actual household conditions.
D. Project Team
Winrock International was the lead implementing organization for the project, facilitating project design and implementation, and providing technical assistance. Concern Worldwide Bangladesh led the development and dissemination of the behavior change activities, while VERC led efforts in community mobilization and identifying and marketing the improved cookstove models for the program. VERC also supported the enterprise development activities. A third non-governmental organization (NGO), Appropriate Rural Technology Institute (ARTI),9
9
based in Pune, India, led the testing activities for cookstove selection.
http://www.arti-india.org/
USAID/Winrock Commercialization of Improved Cookstoves for Reduced IAP in NW Bangladesh
7
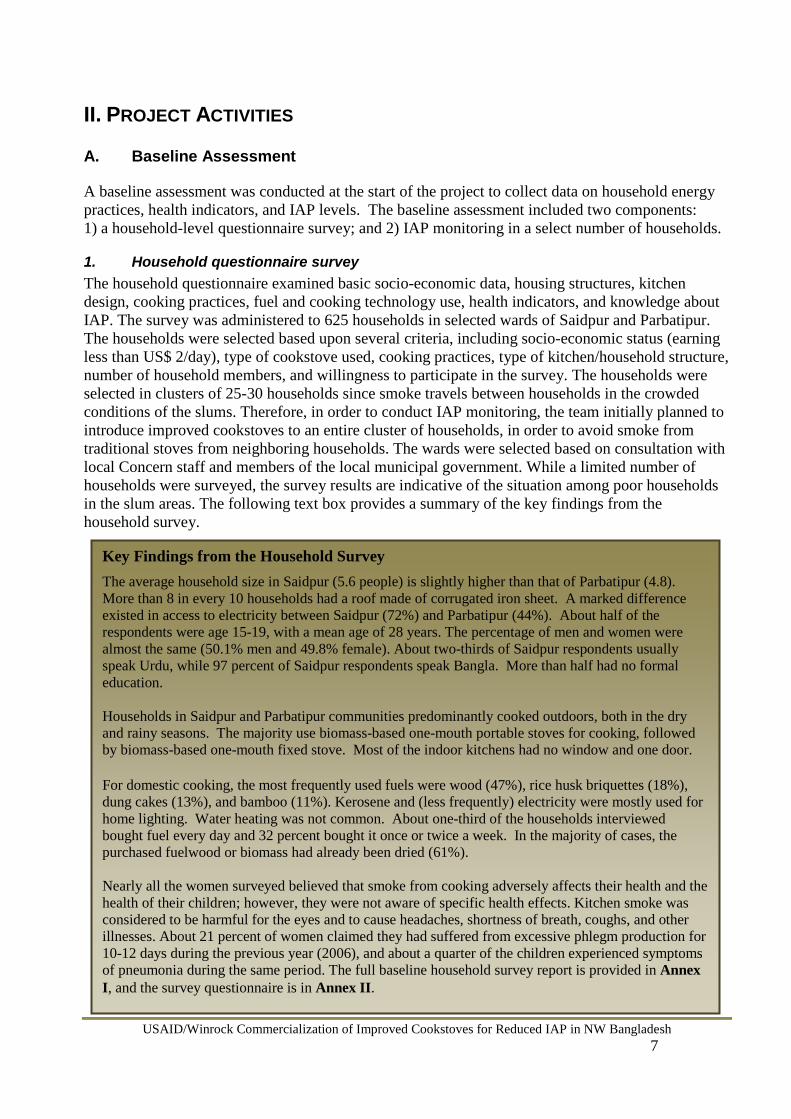
Key Findings from the Household Survey The average household size in Saidpur (5.6 people) is slightly higher than that of Parbatipur (4.8). More than 8 in every 10 households had a roof made of corrugated iron sheet. A marked difference existed in access to electricity between Saidpur (72%) and Parbatipur (44%). About half of the respondents were age 15-19, with a mean age of 28 years. The percentage of men and women were almost the same (50.1% men and 49.8% female). About two-thirds of Saidpur respondents usually speak Urdu, while 97 percent of Saidpur respondents speak Bangla. More than half had no formal education. Households in Saidpur and Parbatipur communities predominantly cooked outdoors, both in the dry and rainy seasons. The majority use biomass-based one-mouth portable stoves for cooking, followed by biomass-based one-mouth fixed stove. Most of the indoor kitchens had no window and one door. For domestic cooking, the most frequently used fuels were wood (47%), rice husk briquettes (18%), dung cakes (13%), and bamboo (11%). Kerosene and (less frequently) electricity were mostly used for home lighting. Water heating was not common. About one-third of the households interviewed bought fuel every day and 32 percent bought it once or twice a week. In the majority of cases, the purchased fuelwood or biomass had already been dried (61%). Nearly all the women surveyed believed that smoke from cooking adversely affects their health and the health of their children; however, they were not aware of specific health effects. Kitchen smoke was considered to be harmful for the eyes and to cause headaches, shortness of breath, coughs, and other illnesses. About 21 percent of women claimed they had suffered from excessive phlegm production for 10-12 days during the previous year (2006), and about a quarter of the children experienced symptoms of pneumonia during the same period. The full baseline household survey report is provided in Annex I, and the survey questionnaire is in Annex II.
II. PROJECT ACTIVITIES
A. Baseline Assessment
A baseline assessment was conducted at the start of the project to collect data on household energy practices, health indicators, and IAP levels. The baseline assessment included two components: 1) a household-level questionnaire survey; and 2) IAP monitoring in a select number of households.
1. Household questionnaire survey The household questionnaire examined basic socio-economic data, housing structures, kitchen design, cooking practices, fuel and cooking technology use, health indicators, and knowledge about IAP. The survey was administered to 625 households in selected wards of Saidpur and Parbatipur. The households were selected based upon several criteria, including socio-economic status (earning less than US$ 2/day), type of cookstove used, cooking practices, type of kitchen/household structure, number of household members, and willingness to participate in the survey. The households were selected in clusters of 25-30 households since smoke travels between households in the crowded conditions of the slums. Therefore, in order to conduct IAP monitoring, the team initially planned to introduce improved cookstoves to an entire cluster of households, in order to avoid smoke from traditional stoves from neighboring households. The wards were selected based on consultation with local Concern staff and members of the local municipal government. While a limited number of households were surveyed, the survey results are indicative of the situation among poor households in the slum areas. The following text box provides a summary of the key findings from the household survey.
USAID/Winrock Commercialization of Improved Cookstoves for Reduced IAP in NW Bangladesh
8
2. Indoor air quality monitoring To establish the baseline for indoor air pollution levels, indoor air quality monitoring was conducted in 42 households in September 2005. The sample size was determined by estimating 10 percent of the initial target of 400 households. Particulate matter 2.5 (PM2.5) and carbon monoxide (CO) were measured for 24 hours in indoor cooking and living areas of households. Table 1 provides information on the mean PM2.5 concentrations in households monitored in Saidpur and Parbatipur. Table 1. Mean PM2.5 levels (µg/m3) in selected households in Saidpur and Parbatipur HOUSEHOLD COOKING PERIOD
(24H AVG) NON-COOKING PERIOD
(24H AVG) OVERALL AVERAGE: COOKING
AREA
OVERALL AVERAGE:
LIVING AREA
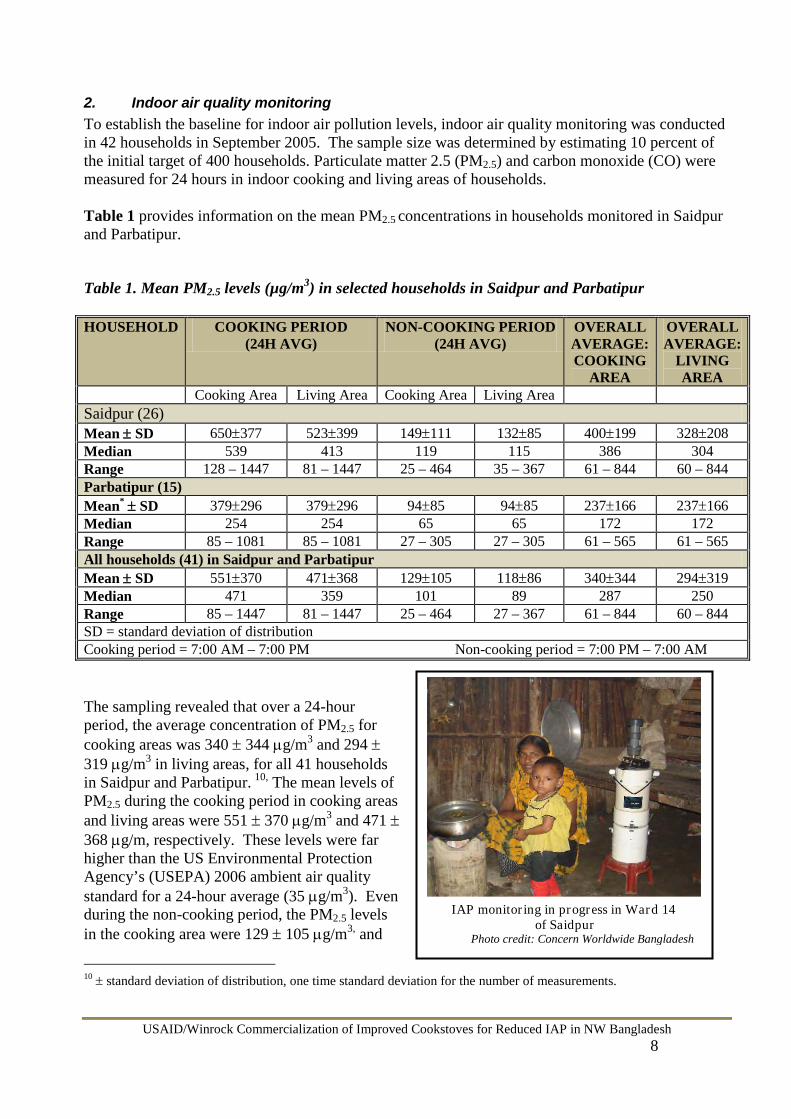
Cooking Area Living Area Cooking Area Living Area Saidpur (26) Mean ± SD 650±377 523±399 149±111 132±85 400±199 328±208 Median 539 413 119 115 386 304 Range 128 – 1447 81 – 1447 25 – 464 35 – 367 61 – 844 60 – 844 Parbatipur (15) Mean* ± SD 379±296 379±296 94±85 94±85 237±166 237±166 Median 254 254 65 65 172 172 Range 85 – 1081 85 – 1081 27 – 305 27 – 305 61 – 565 61 – 565 All households (41) in Saidpur and Parbatipur Mean ± SD 551±370 471±368 129±105 118±86 340±344 294±319 Median 471 359 101 89 287 250 Range 85 – 1447 81 – 1447 25 – 464 27 – 367 61 – 844 60 – 844 SD = standard deviation of distribution Cooking period = 7:00 AM – 7:00 PM Non-cooking period = 7:00 PM – 7:00 AM The sampling revealed that over a 24-hour period, the average concentration of PM2.5 for cooking areas was 340 ± 344 µg/m3 and 294 ± 319 µg/m3 in living areas, for all 41 households in Saidpur and Parbatipur. 10
10 ± standard deviation of distribution, one time standard deviation for the number of measurements.
, The mean levels of PM2.5 during the cooking period in cooking areas and living areas were 551 ± 370 µg/m3 and 471 ± 368 µg/m, respectively. These levels were far higher than the US Environmental Protection Agency’s (USEPA) 2006 ambient air quality standard for a 24-hour average (35 µg/m3). Even during the non-cooking period, the PM2.5 levels in the cooking area were 129 ± 105 µg/m3, and
IAP monitor ing in progress in Ward 14
of Saidpur Photo credit: Concern Worldwide Bangladesh

USAID/Winrock Commercialization of Improved Cookstoves for Reduced IAP in NW Bangladesh
9
118 ± 86 µg/m3 in the living area, still well above USEPA recommended exposure levels.
High levels of PM2.5 resulted from burning biomass and solid fuels in poorly ventilated spaces; most of the households had no windows in the cooking or living areas. Particulate matter from these households remains stagnant in the air due to the clustering of households and poor air circulation indoors. Overall, mean PM2.5 levels in households from Saidpur (650 ± 377 µg/m3 for cooking area; 523 ± 399 µg/m3 for living area during cooking) were higher than those in Parbatipur (379 ± 296 µg/m3 for both cooking and living area during cooking) because the households in Saidpur were more densely situated and had less ventilation compared to the households in Parbatipur. This data suggests that women and young children, particularly those under the age of five, are at risk of exposure to high levels of indoor air pollution, as they spend the most time in cooking areas. A World Bank study11
B. Establishing Community-Level Organization Infrastructure
to assess individuals’ exposure to indoor pollution in Bangladesh found that women’s exposure was nearly twice that of men in the 20–60 age group, and about 40% higher for older women (over 60). The same study cited that infants and children, regardless of gender, were also exposed to high IAP levels. For mean 24-hour CO concentrations, most households showed an 8-hour CO average much below the USEPA 8-hour average permissible level of 9 ppm. Since the USEPA standard is for 8-hour averages, the 24-hour CO monitoring period was divided into three 8-hour periods. The second and third 8-hour averages in all 42 households did not exceed the EPA permissible level of 9 ppm CO, however the first 8-hour period (7:00 AM - 3:00 PM) did show higher CO levels. The IAP Baseline Monitoring Report is provided in Annex III. Further information on cooking practices, kitchen layout, ventilation, and other factors affecting IAP was obtained by conducting a post-monitoring questionnaire, which is provided in Annex IV.
Under the USAID-funded Municipality Partnership Child Survival Program (CSP) in Bangladesh, Concern gained experience disseminating behavior change messages for maternal and child health issues to urban slum households. They did this by creating a network of local volunteers and reviving ward-level health committees, with support from the municipal governments. For the improved cookstoves pilot activity, the project team selected target communities in these areas because this existing infrastructure presented a good vehicle for the dissemination of new behavior change messages for indoor air pollution mitigation. In addition to improving the success of information dissemination, involving these existing health/government channels increases the likelihood of continued dissemination beyond the life of the pilot project. Participatory tools are important for community mobilization in designing project interventions. The team utilized the Methodology for Participatory Assessment (MPA), a collection of participatory tools developed for the World Bank’s Water Supply and Sanitation programs and adapted by the Asia Regional Cookstove Program (ARECOP)12
11 Dasgupta, S., M. Huq, M. Khaliquzzaman, K. Pandey, and D. Wheeler (2004). “Who Suffers from Indoor Air Pollution? Evidence from Bangladesh,” World Bank Policy Research Working Paper 3428.
for the household energy sector. As an ARECOP network partner, VERC received training in how to use this methodology for household energy
12 http://www.arecop.org/
USAID/Winrock Commercialization of Improved Cookstoves for Reduced IAP in NW Bangladesh
10
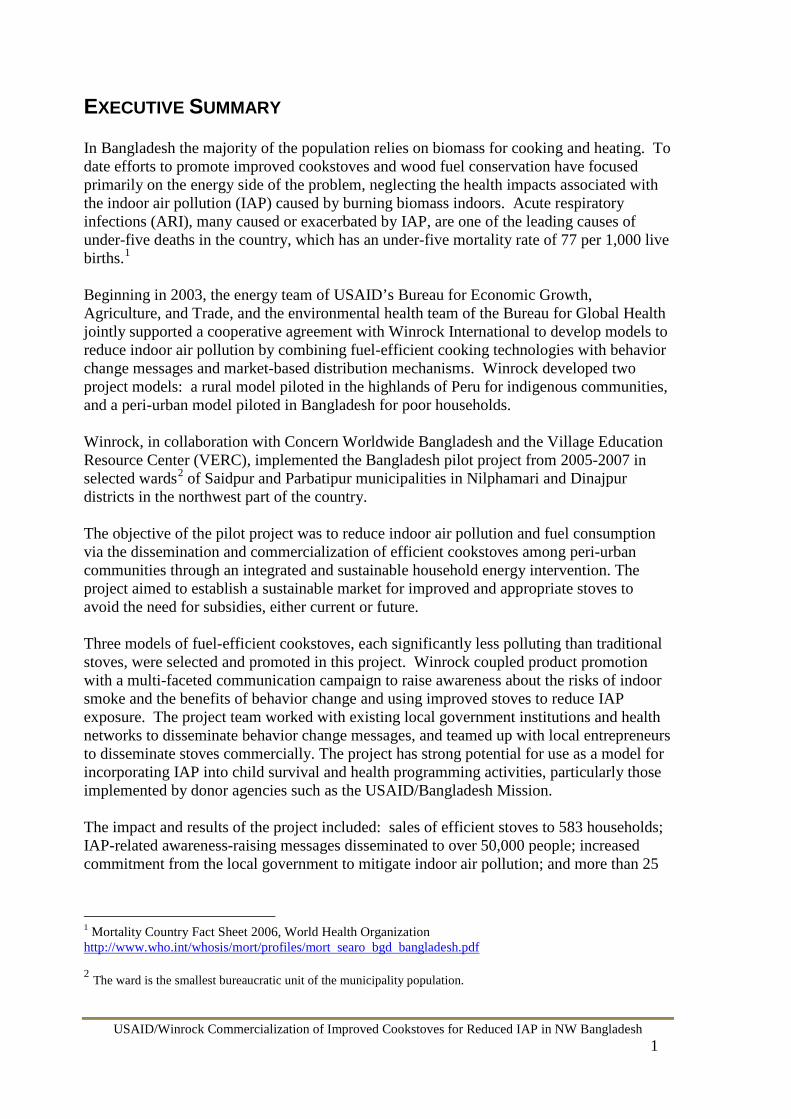
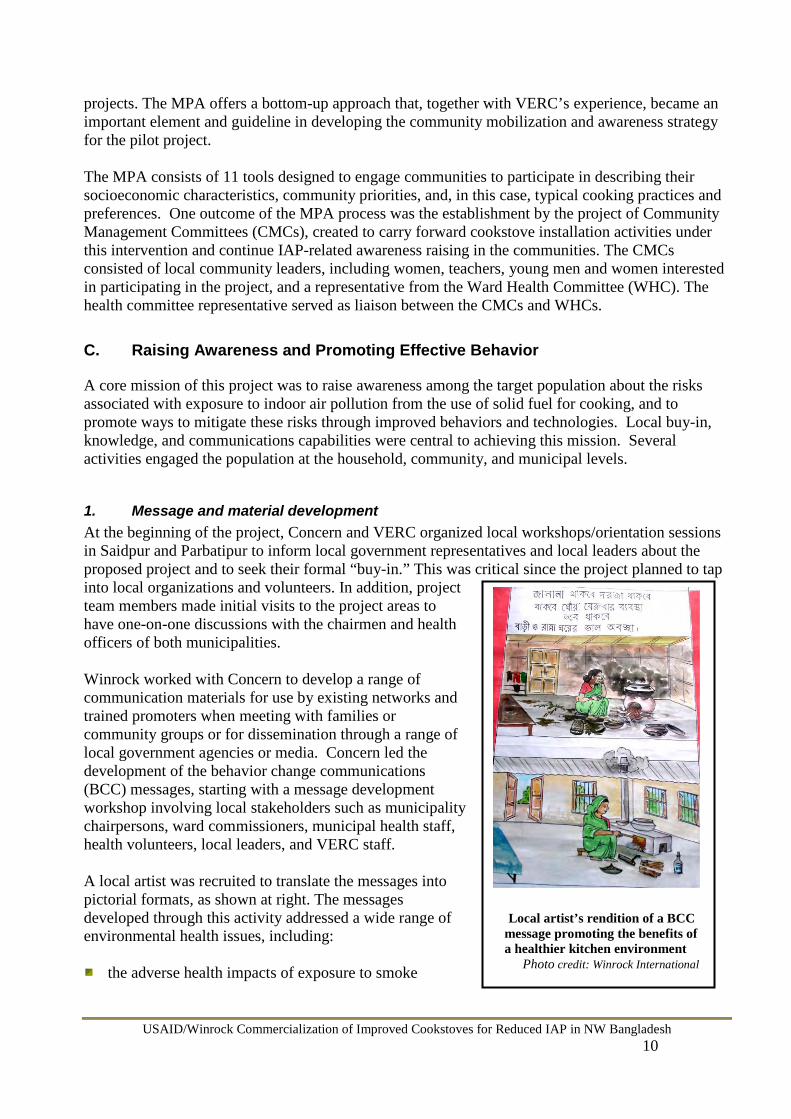
Local artist’s rendition of a BCC message promoting the benefits of a healthier kitchen environment
Photo credit: Winrock International
projects. The MPA offers a bottom-up approach that, together with VERC’s experience, became an important element and guideline in developing the community mobilization and awareness strategy for the pilot project. The MPA consists of 11 tools designed to engage communities to participate in describing their socioeconomic characteristics, community priorities, and, in this case, typical cooking practices and preferences. One outcome of the MPA process was the establishment by the project of Community Management Committees (CMCs), created to carry forward cookstove installation activities under this intervention and continue IAP-related awareness raising in the communities. The CMCs consisted of local community leaders, including women, teachers, young men and women interested in participating in the project, and a representative from the Ward Health Committee (WHC). The health committee representative served as liaison between the CMCs and WHCs.
C. Raising Awareness and Promoting Effective Behavior
A core mission of this project was to raise awareness among the target population about the risks associated with exposure to indoor air pollution from the use of solid fuel for cooking, and to promote ways to mitigate these risks through improved behaviors and technologies. Local buy-in, knowledge, and communications capabilities were central to achieving this mission. Several activities engaged the population at the household, community, and municipal levels.
1. Message and material development At the beginning of the project, Concern and VERC organized local workshops/orientation sessions in Saidpur and Parbatipur to inform local government representatives and local leaders about the proposed project and to seek their formal “buy-in.” This was critical since the project planned to tap into local organizations and volunteers. In addition, project team members made initial visits to the project areas to have one-on-one discussions with the chairmen and health officers of both municipalities. Winrock worked with Concern to develop a range of communication materials for use by existing networks and trained promoters when meeting with families or community groups or for dissemination through a range of local government agencies or media. Concern led the development of the behavior change communications (BCC) messages, starting with a message development workshop involving local stakeholders such as municipality chairpersons, ward commissioners, municipal health staff, health volunteers, local leaders, and VERC staff. A local artist was recruited to translate the messages into pictorial formats, as shown at right. The messages developed through this activity addressed a wide range of environmental health issues, including:
the adverse health impacts of exposure to smoke
USAID/Winrock Commercialization of Improved Cookstoves for Reduced IAP in NW Bangladesh
11
care of newborn infants hygiene and cleanliness in kitchens, ventilation in kitchens fuel use, and the adverse impacts of exposure to smoke
The pictures were accompanied by text, often conveying the message in verse format. Annex VI shows several of the BCC posters developed for this project. These pictures were shared with workshop participants and project partners for review. Concern then field-tested the pictures through focus group discussions and individual interviews. The pictures were modified, based on feedback from the field tests, and finalized. The messages in their pictorial formats were disseminated through a range of communication materials and activities, including posters and billboards. The posters and billboards depicted good and bad practices related to household energy use, along with the relevant behavior change message. Posters were distributed to local health centers, clinics, NGOs, WHCs,13
2. Promotional activities
and community households. Trained health volunteers and other communicators used these materials during meetings with households or committees. Billboards were posted at key intersections of Saidpur and Parbatipur. Finally, the project used folk song performances with behavior change messages. Disseminating health messages through folk songs is a very common approach in Bangladesh, and this method of educating through entertainment proved very successful and popular in this project. Concern had previous success with this approach during their child health project. Music from popular songs was used with lyrics containing behavior change messages. Concern hired another local partner, Bina Pani, to perform at the song and drama events.
The project employed three types of activities to raise awareness among a broad audience that included households, school students and teachers, health workers, and other local government representatives:
Courtyard meetings for households, health volunteers and members of Community Management Committees, organized specifically to support this project;
School sessions for students and teachers at local schools and colleges; and
Film screenings for communities, including household members, local government representatives (i.e., Ward Commissioners), health workers, health volunteers, and entrepreneurs.
Community Health Volunteers (CHVs) were engaged as one of the primary BCC dissemination channels. While the CHVs were aware for the most part of basic health issues, they did not know
13 Each municipality is required by law to have a Ward Health Committee (WHC). The WHC includes the ward commissioner, ward secretary, a community health volunteer, representatives from NGOs, representatives from private service providers (e.g., rural medical practitioners, traditional birth attendants), ward municipality health staff, sub district-level health staff working in the ward, and key community workers and leaders — e.g., religious leaders, teachers, social workers, and leaders of community-based organizations. The WHCs are mandated to coordinate health and family planning activities for their residents; to ensure health education sessions in schools and satellite clinics; and to take necessary steps for treatment or hospital referral by collecting funds locally. < http://www.solutions-site.org/artman/publish/article 204.shtml>
USAID/Winrock Commercialization of Improved Cookstoves for Reduced IAP in NW Bangladesh
12
about the hazards of indoor air pollution and preventive measures. There was thus a need to train the health volunteers and orient them on IAP problems and mitigation options. The courtyard meetings and school sessions were led by VERC, whereas the film screenings were led by Concern. Concern and VERC worked together to coordinate the consistency and delivery of messages through a wide range of awareness-raising activities. The local teams met on a monthly basis to agree on the activities to be organized. In some cases, activities such as folk song and film shows were organized jointly to attract a larger audience and maximize the use of resources. Concern and VERC staff members also participated in the WHC and CMC meetings to provide updates and ensure that the stakeholders clearly understood the project activities.
D. Promoting Appropriate Technology
Early in the project, using data provided from the baseline assessment, the project team reviewed cookstove models and dissemination strategies to select the most appropriate technology for the target populations. The households in the project areas were using hand-constructed traditional mud cookstoves, which typically accommodate one or two pots and are either portable or affixed to the ground. The average efficiency of these traditional stoves has been rated at an estimated 13-15 percent.14
Improved cookstoves made with mud had been developed by the Government of Bangladesh (GOB) under a cookstove program in the 1970s-1980s, but Winrock found very few examples in use in the pilot program area, and households were not very knowledgeable about this type of technology. There was no solid information available on emissions of the GOB mud stove models, but some efficiency data is available. The government-promoted stoves have been estimated to have 25-28 percent thermal efficiency and fuel savings of between 55-58 percent compared to a traditional stove.
These stoves typically are made by women at home. In a few instances, families had purchased cement stoves from local entrepreneurs.
15
During the initial community mobilization for the project, the team used participatory tools to identify the types of improved cookstoves households in the selected wards would prefer. The team presented to the communities a number of known mud-constructed improved cookstove model options from Bangladesh and India. The team held community and household discussions and demonstrations to explain the features and characteristics of the various models, and the households
The materials for constructing the traditional mud stoves are locally available and the cost of construction is low compared to cookstoves made with metal. The team wanted an improved stove model that would be an easy transition for households, rather than a model that would require radical changes in cooking methods or maintenance. Therefore, the project team decided that the best stove model for the pilot project would be one made of mud.
14 Khan, A.M.H.R, Development of Downdraft Wood Burning Stove in Bangladesh, Energex 2000: Proceedings of the 8th International Energy Forum, Las Vegas, Nevada. July 23-28, 2000. 15 Ibid.
USAID/Winrock Commercialization of Improved Cookstoves for Reduced IAP in NW Bangladesh
13
BCSIR 1 pot portable cookstove Photo credit: Winrock International
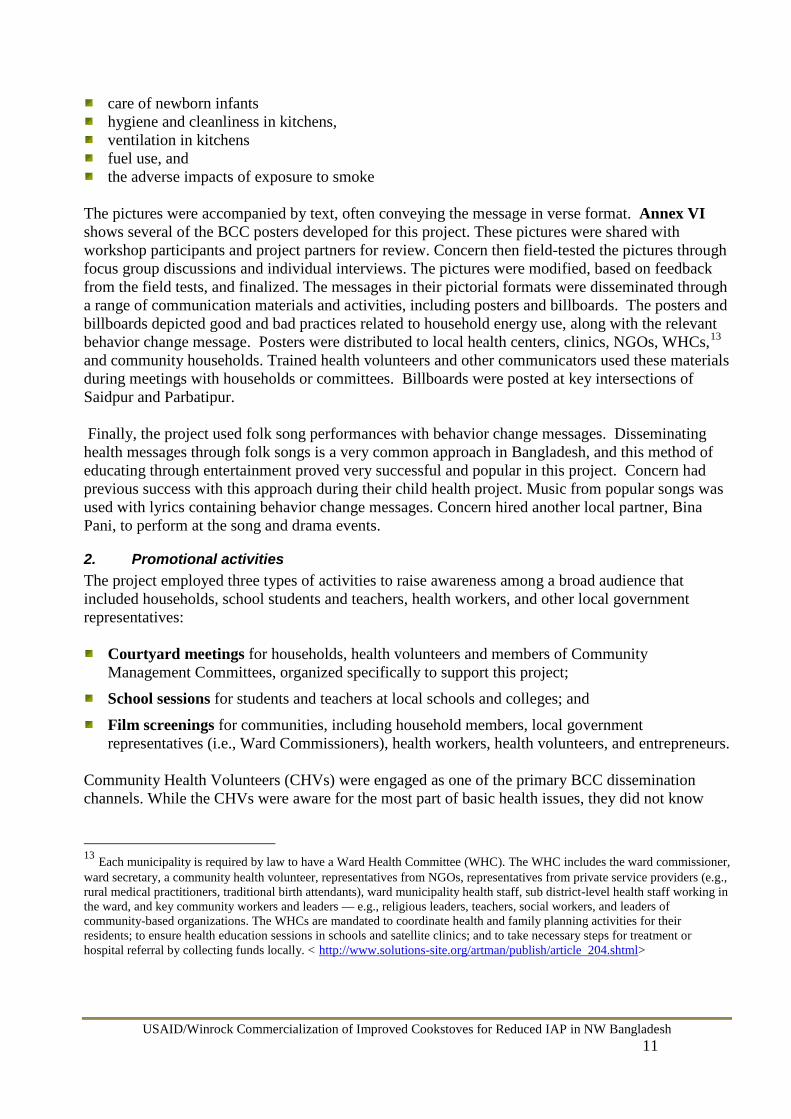
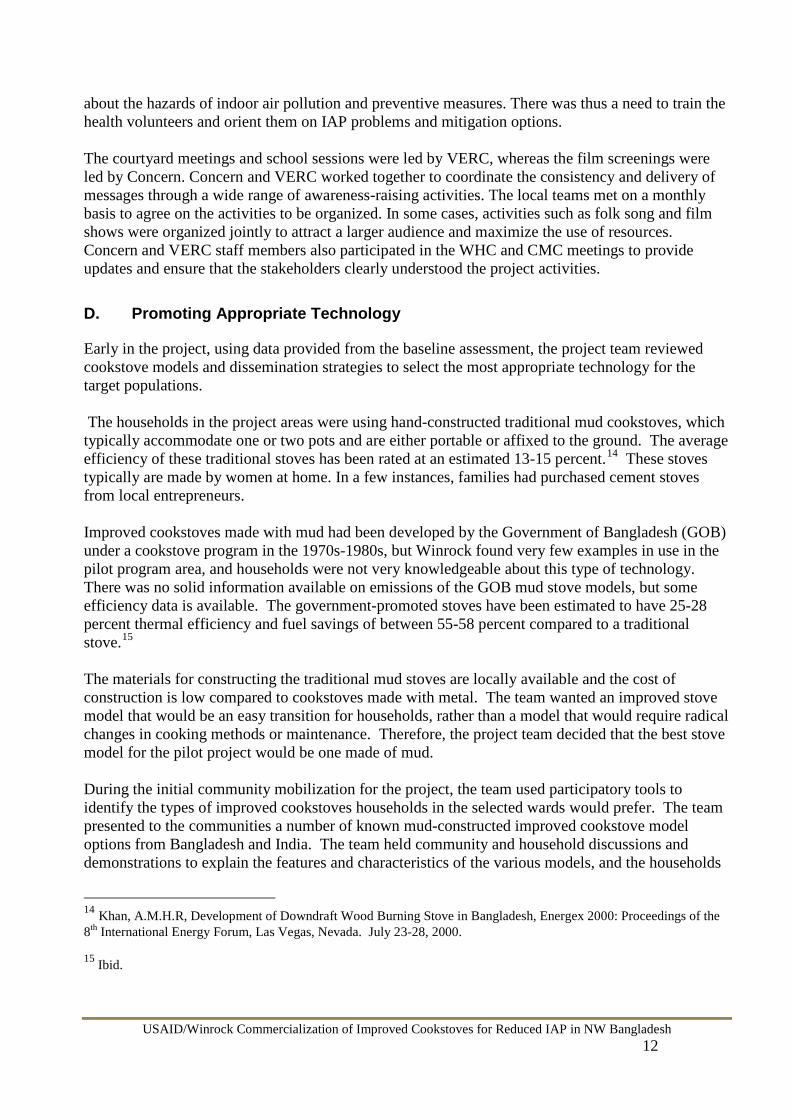
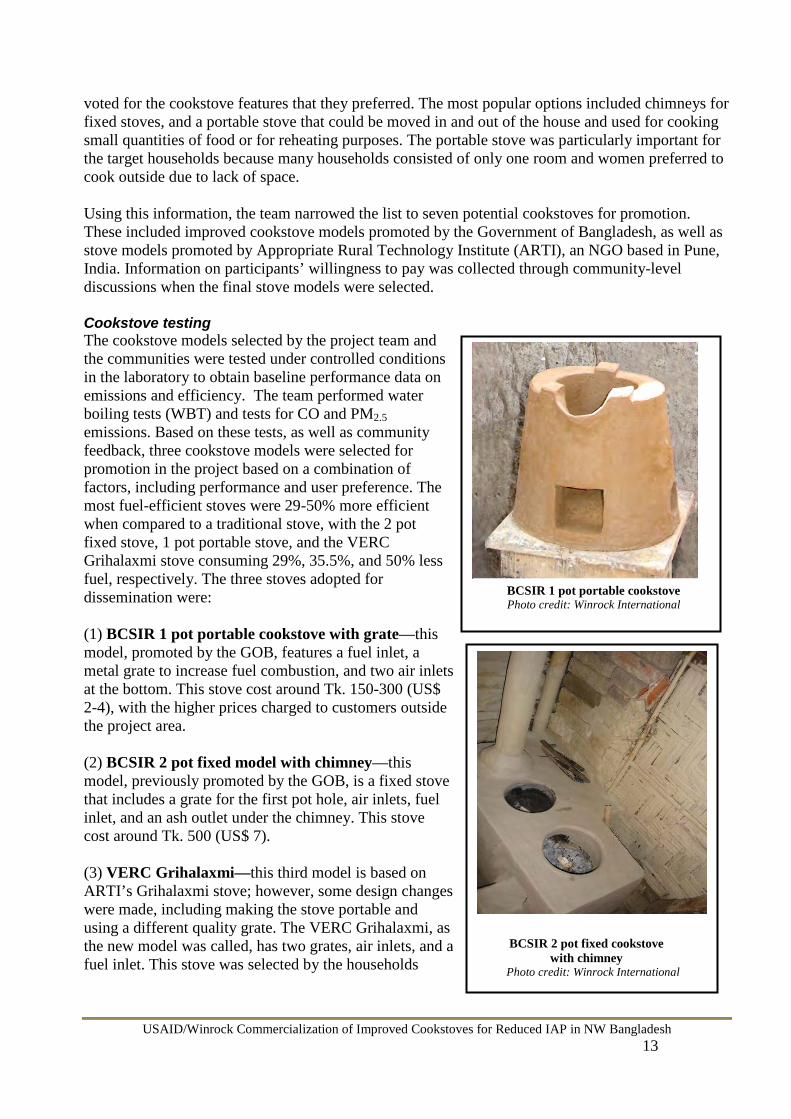
voted for the cookstove features that they preferred. The most popular options included chimneys for fixed stoves, and a portable stove that could be moved in and out of the house and used for cooking small quantities of food or for reheating purposes. The portable stove was particularly important for the target households because many households consisted of only one room and women preferred to cook outside due to lack of space. Using this information, the team narrowed the list to seven potential cookstoves for promotion. These included improved cookstove models promoted by the Government of Bangladesh, as well as stove models promoted by Appropriate Rural Technology Institute (ARTI), an NGO based in Pune, India. Information on participants’ willingness to pay was collected through community-level discussions when the final stove models were selected. Cookstove testing The cookstove models selected by the project team and the communities were tested under controlled conditions in the laboratory to obtain baseline performance data on emissions and efficiency. The team performed water boiling tests (WBT) and tests for CO and PM2.5 emissions. Based on these tests, as well as community feedback, three cookstove models were selected for promotion in the project based on a combination of factors, including performance and user preference. The most fuel-efficient stoves were 29-50% more efficient when compared to a traditional stove, with the 2 pot fixed stove, 1 pot portable stove, and the VERC Grihalaxmi stove consuming 29%, 35.5%, and 50% less fuel, respectively. The three stoves adopted for dissemination were: (1) BCSIR 1 pot portable cookstove with grate—this model, promoted by the GOB, features a fuel inlet, a metal grate to increase fuel combustion, and two air inlets at the bottom. This stove cost around Tk. 150-300 (US$ 2-4), with the higher prices charged to customers outside the project area. (2) BCSIR 2 pot fixed model with chimney—this model, previously promoted by the GOB, is a fixed stove that includes a grate for the first pot hole, air inlets, fuel inlet, and an ash outlet under the chimney. This stove cost around Tk. 500 (US$ 7). (3) VERC Grihalaxmi—this third model is based on ARTI’s Grihalaxmi stove; however, some design changes were made, including making the stove portable and using a different quality grate. The VERC Grihalaxmi, as the new model was called, has two grates, air inlets, and a fuel inlet. This stove was selected by the households
BCSIR 2 pot fixed cookstove with chimney
Photo credit: Winrock International
USAID/Winrock Commercialization of Improved Cookstoves for Reduced IAP in NW Bangladesh
14
because it can accommodate small pots, whereas the other two models typically accommodate larger pots. Like the BCSIR 1 pot portable stove, this stove also cost around Tk. 150-300 (US$ 2-4). In the second year of the project, additional stove testing for the three models was undertaken in homes under actual use conditions to assess IAP and fuel consumption. Indoor air quality (IAQ) tests included obtaining emissions measurements for carbon monoxide (CO) and particulate matter (PM2.5), while stove performance tests included WBTs and KPTs. While initial testing included only newly constructed stoves in simulated conditions, this second testing phase included stoves that had already been in use in households for at least one month. All testing activities for cookstove selection were led by ARTI with support from VERC and Winrock. ARTI was selected because it has extensive testing experience with improved cookstoves. ARTI staff members have also been trained on cookstove performance testing by the Aprovecho Research Center,16
E. Developing a Market and Establishing Entrepreneurs
a non-profit organization that has developed widely recognized cookstove testing protocols for developing countries, including both WBT and KPT, cookstove emissions monitoring, and the household energy use and cooking survey. The Cookstove Performance Report is included in Annex V.
A key mission of this project was to increase access to, and the use of, improved cookstoves on a commercial and self-sustaining basis that would continue beyond the life of this project. This meant the project needed to demonstrate that people are willing to pay for an improved stove. To be self-sustaining, the intervention project would need to develop a growing base of customers who see the value in buying a fuel efficient stove, and ensure that they have regular access to the supply chain (stove producers and sellers). The pilot project faced three challenges in this area. One, prior to this intervention, the households in the target communities did not typically purchase stoves, but instead constructed them at home. Constructing cookstoves at home was not an option for this project since it would be impossible to maintain quality control, and any changes in dimension during construction would affect stove performance. So, households had to be convinced of the value of purchasing a stove from an outside source as opposed to making one themselves. Two, many of the inhabitants of the project area had come to expect free assistance or give-aways from development projects (even the local partners initially
16 http://www.aprovecho.org/
Brochure depicting cookstove
features Photo credit: Winrock International
VERC Grihalaxmi cookstove Photo credit: Winrock International

USAID/Winrock Commercialization of Improved Cookstoves for Reduced IAP in NW Bangladesh
15
expected the stoves to be distributed for free). So, again, households had to be convinced to pay the real cost of the improved cookstoves. These challenges were met by the extensive awareness activities and the identification of high quality, locally appropriate cookstove models. The final challenge to achieving a commercial and self-sustaining cookstove initiative was to build the technical, financial, and business management capacity of local entrepreneurs to help them create legitimate businesses dedicated to producing the fuel efficient cookstoves, thus ensuring that customer demand could be met by a ready supply of high quality stoves. To accomplish these tasks, the project provided local entrepreneurs with business training, helped identify or create financing mechanisms for both businesses and customers, and helped new businesses market their stoves.
1. Entrepreneur training The project team identified a range of potential stove entrepreneurs from the pilot area, from established small business holders to housewives who were interested in starting their own stove businesses. The initial selection of entrepreneurs was primarily based on interest in starting or expanding a stove business and eligibility to become a loan group member. Three types of entrepreneurs were supported:
Manufacturing entrepreneurs to manufacture and supply one or more components of a fuel-efficient cookstove;
Installation entrepreneurs to purchase components from the manufacturing entrepreneurs and install fuel efficient cookstoves on a turn-key basis for customers; and
Retail entrepreneurs
to buy one or more components from the manufacturing entrepreneurs and sell the components retail to the installation entrepreneurs or directly to the customers.
The project formally supported 25 entrepreneurs, including manufacturing entrepreneurs, installation entrepreneurs, and retail entrepreneurs. All the entrepreneurs were women, as VERC’s loan policy dictated that only women can receive micro-loans for stove businesses. However, in many cases male members of the family, including husbands and sons, participated in the training sessions and provided critical bookkeeping and marketing support to the businesses. VERC trained all these entrepreneurs on basic business development practices and bookkeeping techniques. A training session was organized for new entrepreneurs, focusing on the design, construction, and use and maintenance of improved cookstoves. Given the long gap between the training and the start of the businesses, refresher training was provided to the entrepreneurs.
A man selling metal grates for
improved stoves at the family’s shop in Ward 3 of Saidpur
Photo credit: Winrock International
USAID/Winrock Commercialization of Improved Cookstoves for Reduced IAP in NW Bangladesh
16
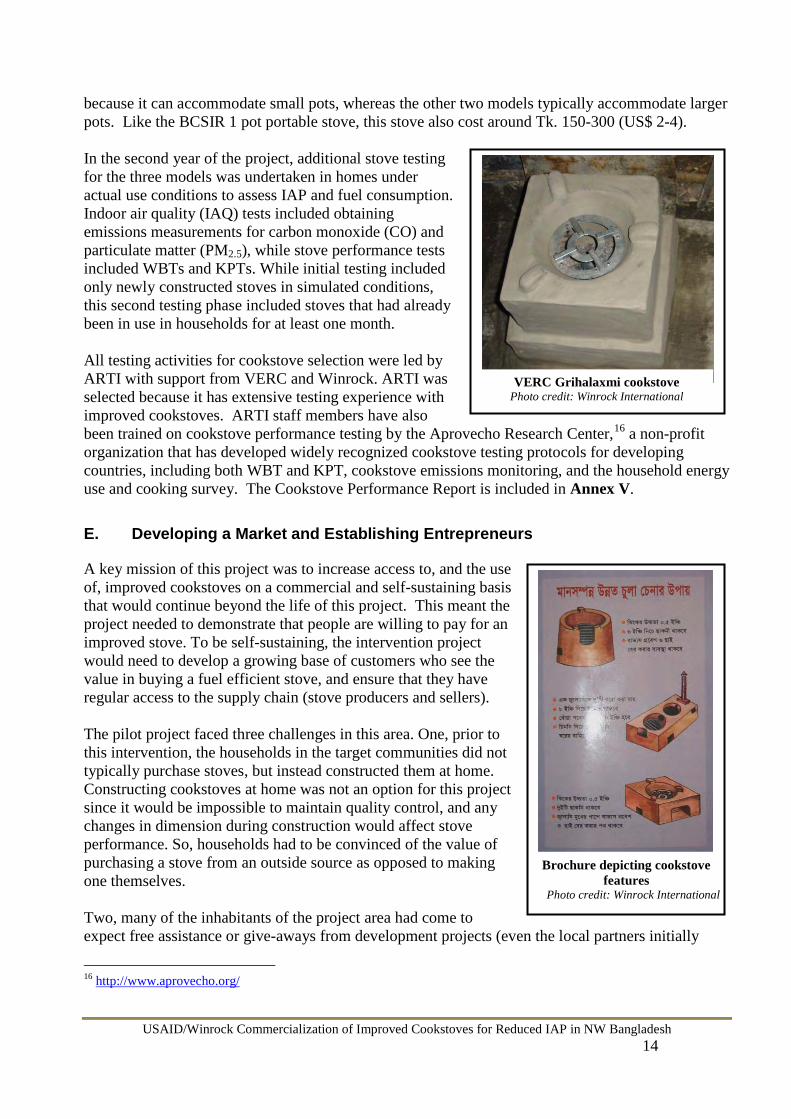
2. Cookstove marketing materials In addition to the awareness-raising BCC materials, VERC and Winrock also developed marketing materials for the selected cookstove models. These materials were developed to assist the entrepreneurs in marketing their stoves, with special focus on informing customers about types of cookstoves and use and maintenance issues. The materials included:
Billboards displaying the three cookstoves, and Laminated booklets and posters with information on the cookstoves, such as characteristics for
buyer recognition, and instructions on cookstove use and maintenance. Five billboards were installed at key traffic intersections to ensure maximum exposure. Some 7,000 booklets and posters were disseminated among entrepreneurs, micro-finance institutions (MFIs), and local government institutions in the project area. At project end the entrepreneurs were continuing to use the marketing materials.
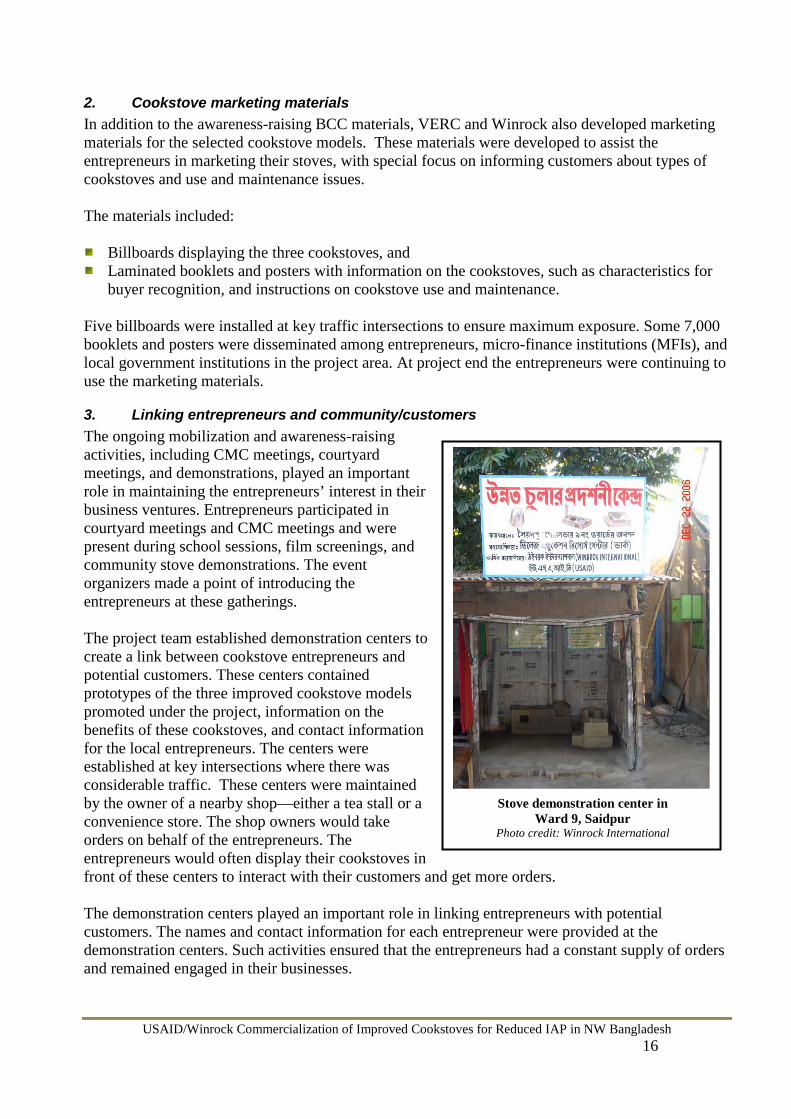
3. Linking entrepreneurs and community/customers The ongoing mobilization and awareness-raising activities, including CMC meetings, courtyard meetings, and demonstrations, played an important role in maintaining the entrepreneurs’ interest in their business ventures. Entrepreneurs participated in courtyard meetings and CMC meetings and were present during school sessions, film screenings, and community stove demonstrations. The event organizers made a point of introducing the entrepreneurs at these gatherings. The project team established demonstration centers to create a link between cookstove entrepreneurs and potential customers. These centers contained prototypes of the three improved cookstove models promoted under the project, information on the benefits of these cookstoves, and contact information for the local entrepreneurs. The centers were established at key intersections where there was considerable traffic. These centers were maintained by the owner of a nearby shop—either a tea stall or a convenience store. The shop owners would take orders on behalf of the entrepreneurs. The entrepreneurs would often display their cookstoves in front of these centers to interact with their customers and get more orders. The demonstration centers played an important role in linking entrepreneurs with potential customers. The names and contact information for each entrepreneur were provided at the demonstration centers. Such activities ensured that the entrepreneurs had a constant supply of orders and remained engaged in their businesses.
Stove demonstration center in
Ward 9, Saidpur Photo credit: Winrock International
USAID/Winrock Commercialization of Improved Cookstoves for Reduced IAP in NW Bangladesh
17
4. Stove pricing The prices (US$ 2 -7) 17 of the improved cookstoves sold within the project target areas were determined by taking into consideration factors such as cost of raw materials and stove accessories, transportation costs, cost of labor (based on prevailing wages for unskilled laborers), and a profit margin. The range of stove prices thus tended to reflect variations in input and labor costs among the entrepreneurs. Stove entrepreneurs also charged slightly higher prices to households outside the target areas. Stove project entrepreneurs received training on how to price stoves, but had the final word on what price to charge their customers. Given that the target households were typically earning around US$2 per day, it was often difficult for families to cover upfront the full price of the cookstoves. Therefore, to build demand, entrepreneurs began offering customers the option of paying for cookstoves in installments. A household could install an improved cookstove in one of two ways:
Order an improved stove (on a turnkey basis) from an installation entrepreneur, or Purchase the stove components from a retail entrepreneur and hire someone to do the
installation.
Since the households were not familiar with improved stoves, the project team anticipated that there would be some initial resistance to paying the full price of the stoves. However, by the end of the project, many households in the area were receptive to the idea of paying a higher price for stoves. This change in attitude was due largely to the awareness raising and marketing work conducted by the project team, as well as positive word of mouth as improved stove users began to share their experiences with friends and neighbors. Local households spend, on average, Tk. 250-300 (US$ 3.50-4.00) per month on cooking fuel. The project’s baseline assessment revealed that the project households were spending almost one-third of their income on fuel costs. Lower fuel costs are an incentive for using fuel efficient cookstoves, particularly when the payback period of such a purchase can be as low as 2-4 months, depending on the type of improved stove.
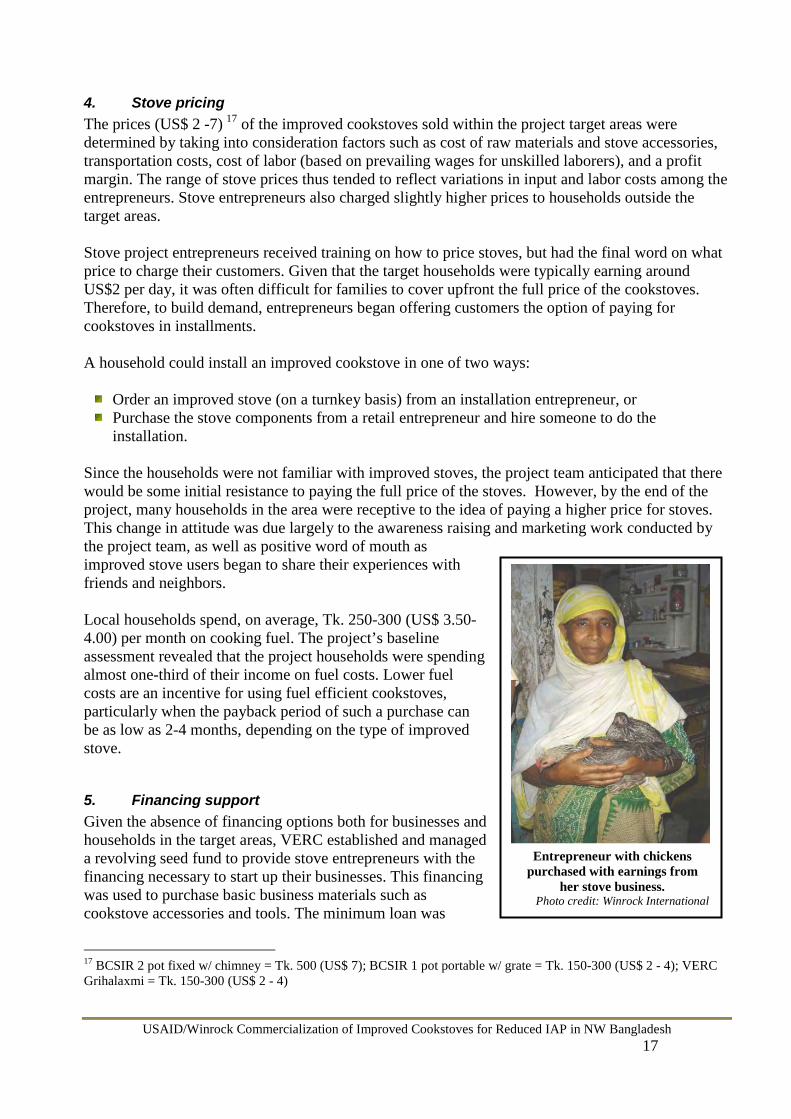
5. Financing support Given the absence of financing options both for businesses and households in the target areas, VERC established and managed a revolving seed fund to provide stove entrepreneurs with the financing necessary to start up their businesses. This financing was used to purchase basic business materials such as cookstove accessories and tools. The minimum loan was
17 BCSIR 2 pot fixed w/ chimney = Tk. 500 (US$ 7); BCSIR 1 pot portable w/ grate = Tk. 150-300 (US$ 2 - 4); VERC Grihalaxmi = Tk. 150-300 (US$ 2 - 4)
Entrepreneur with chickens purchased with earnings from
her stove business. Photo credit: Winrock International

USAID/Winrock Commercialization of Improved Cookstoves for Reduced IAP in NW Bangladesh
18
Tk. 4,000 (US$ 56); the maximum was Tk. 50,000 (US$ 700). Loans were recovered in 45 weekly installments, and were provided to an entrepreneur only when the total savings of that entrepreneur was at least 10 percent of the requested loan. Borrowers regularly attended group meetings and deposited savings at each meeting. VERC maintained a separate bank account and a separate cash book and ledger for the operation of the fund. VERC disbursed loans to applicants who satisfied the following criteria:
Sound knowledge of stove construction of the three improved cookstove designs approved by Winrock International, and interest in being a stove entrepreneur;
Physically able/fit to carry out the business; and Resident of Saidpur or Parbatipur sub-district.
Other factors considered included: business experience; knowledge of accounting; presence of fixed or durable assets; and some source of income to minimize the risk of taking loans. By the end of 2007, all of the funds had been distributed. The payback rate was very high, reaching over 95%.
USAID/Winrock Commercialization of Improved Cookstoves for Reduced IAP in NW Bangladesh
19
III. Project Results
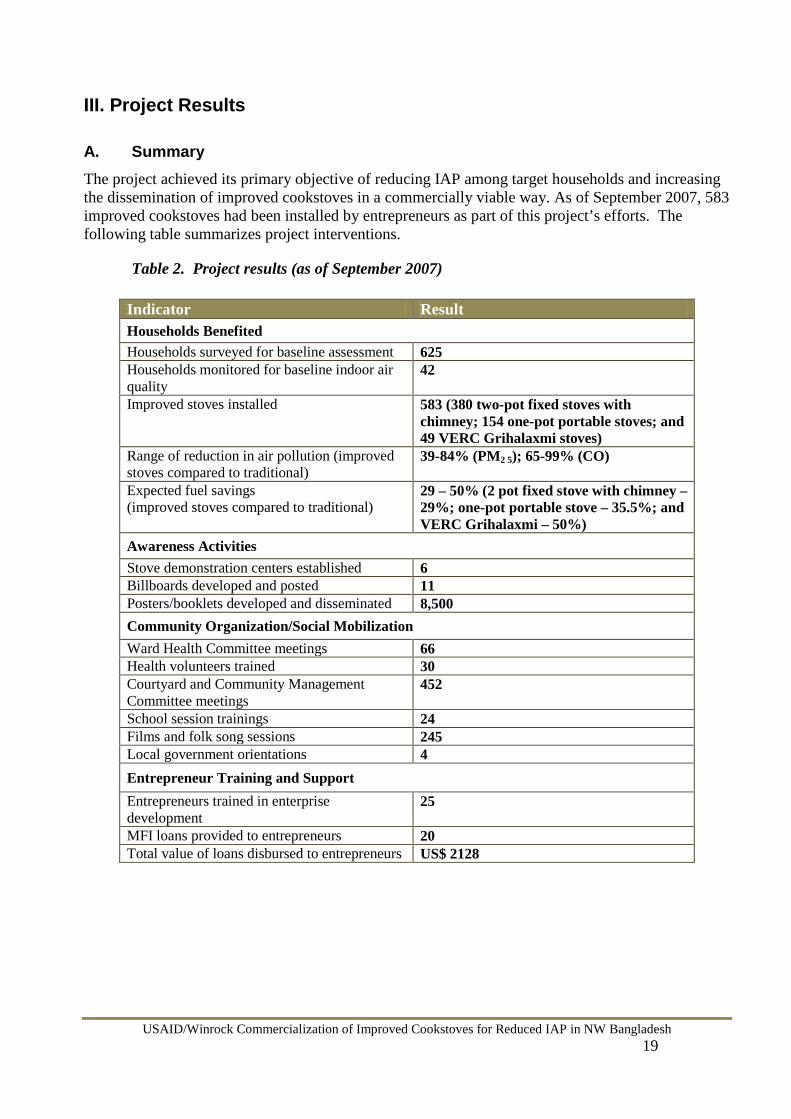
A. Summary The project achieved its primary objective of reducing IAP among target households and increasing the dissemination of improved cookstoves in a commercially viable way. As of September 2007, 583 improved cookstoves had been installed by entrepreneurs as part of this project’s efforts. The following table summarizes project interventions.
Table 2. Project results (as of September 2007)
Indicator Result Households Benefited Households surveyed for baseline assessment 625 Households monitored for baseline indoor air quality
42
Improved stoves installed 583 (380 two-pot fixed stoves with chimney; 154 one-pot portable stoves; and 49 VERC Grihalaxmi stoves)
Range of reduction in air pollution (improved stoves compared to traditional)
39-84% (PM2 5); 65-99% (CO)
Expected fuel savings (improved stoves compared to traditional)
29 – 50% (2 pot fixed stove with chimney – 29%; one-pot portable stove – 35.5%; and VERC Grihalaxmi – 50%)
Awareness Activities Stove demonstration centers established 6 Billboards developed and posted 11 Posters/booklets developed and disseminated 8,500 Community Organization/Social Mobilization Ward Health Committee meetings 66 Health volunteers trained 30 Courtyard and Community Management Committee meetings
452
School session trainings 24 Films and folk song sessions 245 Local government orientations 4 Entrepreneur Training and Support Entrepreneurs trained in enterprise development
25
MFI loans provided to entrepreneurs 20 Total value of loans disbursed to entrepreneurs US$ 2128
USAID/Winrock Commercialization of Improved Cookstoves for Reduced IAP in NW Bangladesh
20
B. Detailed Results
1. Community organizations established VERC helped form 13 Community Management Committees, one for each of the 13 clusters in the five wards in which the project was operational. These Committees were established to help monitor cookstove installation activities in their respective communities. Each committee consisted of 10-12 members, mostly women leaders from the communities, who expressed interest in the project activities. VERC organized Leadership Training for the CMC members, which focused on motivating community leaders to take ownership of the project. The training included role plays and discussions on potential issues and conflict mitigation. VERC staff members attended the weekly CMC meetings, facilitated discussions, and answered questions regarding project implementation, particularly issues regarding stove installation and sale. VERC staff also helped to link these committees with entrepreneurs so that the entrepreneurs could promote their stoves to these committees and get new orders for installations.
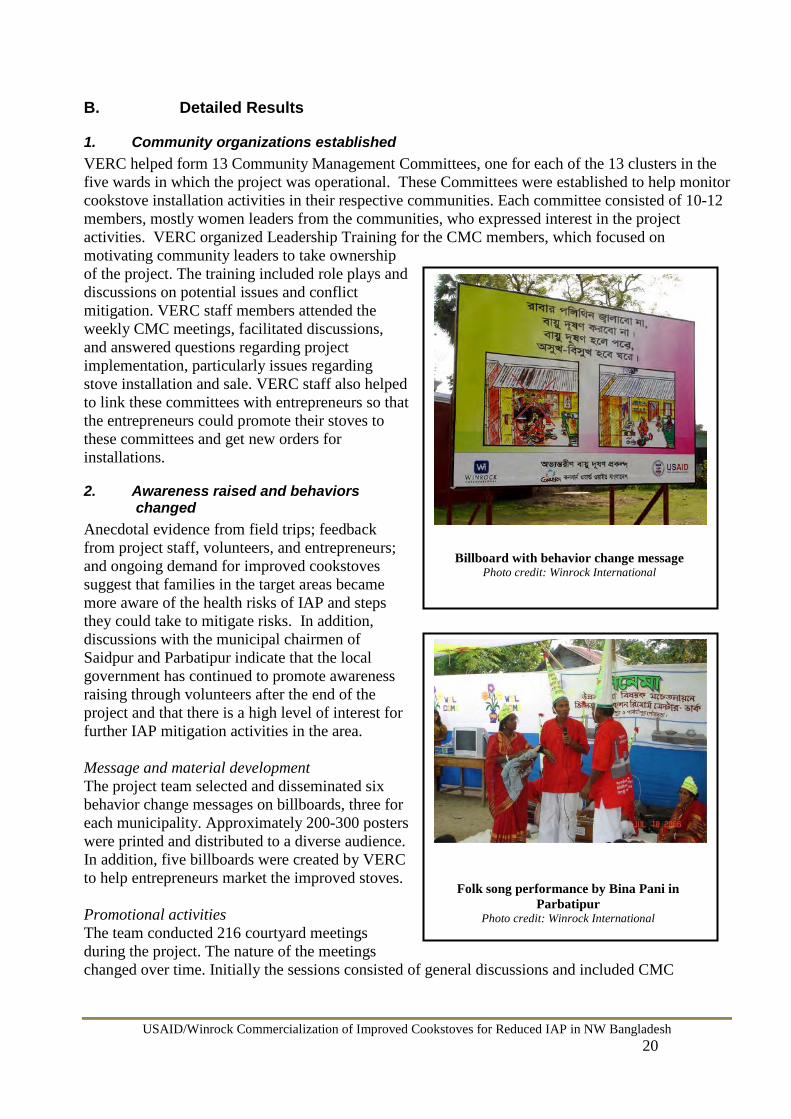
2. Awareness raised and behaviors changed Anecdotal evidence from field trips; feedback from project staff, volunteers, and entrepreneurs; and ongoing demand for improved cookstoves suggest that families in the target areas became more aware of the health risks of IAP and steps they could take to mitigate risks. In addition, discussions with the municipal chairmen of Saidpur and Parbatipur indicate that the local government has continued to promote awareness raising through volunteers after the end of the project and that there is a high level of interest for further IAP mitigation activities in the area. Message and material development The project team selected and disseminated six behavior change messages on billboards, three for each municipality. Approximately 200-300 posters were printed and distributed to a diverse audience. In addition, five billboards were created by VERC to help entrepreneurs market the improved stoves. Promotional activities The team conducted 216 courtyard meetings during the project. The nature of the meetings changed over time. Initially the sessions consisted of general discussions and included CMC
Folk song performance by Bina Pani in Parbatipur
Photo credit: Winrock International
Billboard with behavior change message Photo credit: Winrock International
USAID/Winrock Commercialization of Improved Cookstoves for Reduced IAP in NW Bangladesh
21
members, health volunteers, project staff, and interested households. In some cases, the local ward commissioners also attended these meetings. After the cookstoves were available commercially, discussions were more focused and included topics such as problems with stove construction, use and maintenance of stoves, and stove availability and prices. The discussions gradually took on a troubleshooting mode and also helped to resolve misunderstandings among entrepreneurs and customers. The team organized 24 sessions focused on students and teachers of local schools and colleges. School sessions consisted of cookstove demonstrations and in some cases, film shows followed by a quiz competition. These activities were quite popular, and once the improved cookstoves became available on the market, many entrepreneurs received orders for cookstoves from the mothers of the students. Films and folk song shows were popular ways to get information out to the communities. VERC produced a film about IAP and cookstoves and showed it at 216 film screenings to audiences in each of the five wards, sometimes in conjunction with folk song performances. The films were followed by competitive challenges featuring questions related to IAP and local officials awarded token prizes (provided by the project) such as household items to competition winners. This was a very effective strategy to engage both the local community and municipal government. Entrepreneurs also attended these sessions to promote their stoves. 3. Appropriate technology adopted As of September 2007, 583 improved cookstoves had been sold in the project area. Of these, 380 were the BCSIR 2 pot fixed models with chimney; 154 were the BCSIR 1 pot portable cookstoves with grates; and 49 were the VERC Grihalaxmi model. During the post-installation stove performance monitoring, ARTI found that the BCSIR 2 pot fixed model decreased PM2.5 by 71-84% and CO by 98-99%. VERC Grihalaxmi decreased PM2.5 by 39% and CO by 65%, as compared to a one-pot portable traditional stove. However, it should be noted that these tests were conducted for a total of 8 stoves, two each for the improved models, and 2 traditional stoves. Further testing is required for statistically significant results. The kitchen performance test (KPT) was carried out over a period of 7 days for each stove to assess such factors as fuel use and cooking time, and gain insights into how beneficiaries were using their stoves. After the initial round of stove installations, the project team identified a number of problematic usage issues, including burning excessive fuelwood; placing the grate in a position lower than required; and increasing the diameter of the fuel inlet and ash outlet. Some maintenance issues included ash accumulating under the space beneath the chimney; a decrease in chimney diameter due to soot accumulation; a decrease in the diameter of the air passage from the first to the second pot; and a decrease in the distance from the bottom of the pot in the second mouth to the bottom of the stove. Households tended to clean the stove with a mixture of water and mud, and this caused most of the changes in dimension. These issues were identified during field visits and were discussed during the entrepreneur refresher training so that entrepreneurs knew what type of usage and maintenance issues to expect and what guidance to give to their clients. The entrepreneurs were members of local CMCs and discussed stove usage issues at these meetings as well.

USAID/Winrock Commercialization of Improved Cookstoves for Reduced IAP in NW Bangladesh
22
4. Market system developed for sustainability
a. Local entrepreneur training The project team formally trained 25 people, all women, how to design, construct, maintain, repair, and market the improved cookstoves promoted in the project. Some men from these households also joined the women for the training sessions. All of these entrepreneurs also received training in enterprise development, which included instructions on how to develop a business plan, bookkeeping, simple accounting, and marketing tips. Initially, the women were conducting stove-related business activities along with their other household responsibilities and any other income-generating activities. Typically, other household members assisted them with the stove businesses, especially to transport materials and parts, and in stove installation activities. It was expected that as the businesses developed, they would employ the women full time. Enterprise development activities were monitored three months beyond the end of the project. Since the stove businesses were established toward the end of project, the entrepreneurs were still relying on their second businesses for income generation. Overall, stove sales in Saidpur were higher than those in Parbatipur. This was possibly due to increased communication and road networks in Saidpur. The project focused on a greater number of households in Saidpur as the municipality has a larger population compared to Parbatipur. Consequently, Saidpur also had more field staff presence since the target population was larger. Although IAP levels in Saidpur were higher than those found in Parbatipur, there is no direct correlation between stove sales and IAP levels in the municipality. Throughout the life of the project there was demand from existing entrepreneurs for refresher training on stove construction and business development. This training gave the project team an opportunity to revisit concerns such as sourcing good building materials; the importance of maintaining stove design specifications; proper stove construction; stove pricing; stronger marketing messages, including health components; messages to provide to customers during installation on better stove use and maintenance; and recommendations for follow-up customer service and monitoring. Over time, some of the functions of the installation entrepreneurs had increasing overlap with those of the manufacturing entrepreneurs. By the end of the project there were a total of 11 entrepreneurs who were manufacturing and installing improved cookstoves. Initially, the entrepreneurs were classified into three categories (manufacturing, installation, and retail) because the program wanted to have the right mix of installers as well as suppliers of various accessories. In retrospect, the manufacturing and installation entrepreneurs need not be separate entrepreneurs since they have very similar functions. Some entrepreneurs not only manufactured/installed stoves, they also conducted retail businesses for stove accessories. Over 40% of the entrepreneurs were involved in both accessory retail and stove installation businesses. About 50% of the entrepreneurs doing both types of businesses were able to repay their loans far enough ahead of the one-year mark to take a second loan for their businesses. This indicates that having a combined retail and installation business is more profitable since the products are more diversified and there are more income-generating opportunities. Typically, the stand-alone retail entrepreneurs were those who either did not want to invest significant time in their businesses, (as compared to an installation entrepreneur), or those who had existing road-side shops and wanted to include stove accessories as a new item for sale.

USAID/Winrock Commercialization of Improved Cookstoves for Reduced IAP in NW Bangladesh
23
b. Financing support A revolving seed fund (provided by USAID) valued at Tk. 215,000 (US$ 3,010) and managed by VERC was established to provide entrepreneurs with much-needed financing to launch their businesses. The entrepreneurs were first formed into loan groups, with 10-12 entrepreneurs to a group. Loan groups typically are formed to ensure that all the members are repaying the loan on time. If one entrepreneur defaults on a payment then the entire group has to pay a penalty. As per VERC’s loan policy, the loans averaged about Tk. 7,000 (US$ 100) for a one-year term with a 12.5% interest rate. The loans were used as start-up capital, primarily to purchase raw materials for stove construction and accessories, and to cover material transportation costs. A total of 20 entrepreneurs received seed funds worth Tk. 152,000 (US$ 2,128) thru September 2007. Winrock and VERC managed the funds through September 2007, and all funds were disbursed by the end of 2007. Nearly all of the loans were repaid within a year’s time.
c. Selling improved cookstoves During the community consultations, households indicated that they would be willing to pay Tk. 30 (US$ 0.42) for an improved cookstove, on average. When the stoves were priced by the project team in consultation with the entrepreneurs, based on the local cost of materials, labor, transportation, and other inputs, the cost ranged from Tk. 150-550 (US$ 2.00-7.70), depending on the design. Given gift/subsidy expectations, the fact that households were not accustomed to purchasing cookstoves, and the wide disconnect between prices consumers were willing to pay and the actual cost of the stoves, entrepreneurs initially had some difficulty getting households to pay the full cost of the stoves. Some initial customers, particularly those from lower socio-economic households, were paying for the stoves in installments. Entrepreneurs did not report using their VERC financing to help finance stove purchases in installments, however, and did not charge interest for purchases made using installment payments. To address the pricing issues, the project team organized training sessions for a local MFI, detailed in the next section, and the entrepreneurs began to modify their pricing policies. The pricing changes included charging a discounted fee in the areas where the entrepreneurs live, but charging a higher fee for “out of area” orders where they were not personally acquainted with the customers and transport fees were higher. Within the project area, entrepreneurs recouped the full price through installment payments and various schemes whereby households provided the soil or labor, for example, to bring down the total cost. There were no fixed installment amounts, and no interest was charged; the financing arrangement depended on the relationship between the entrepreneur and the seller. Even with a discounted fee, some households did not want to pay the full cost of the stoves all at once. This resulted in customers with incomplete stoves (missing either a chimney or a grate, or both), and it took many months of follow up for these households to eventually complete their purchases and have fully functional stoves. Based on this experience, entrepreneurs needed to ensure that the households purchased the stove accessories before stove construction began. Three months after the end of the project, the two-pot fixed stoves were selling for Tk. 500-600 (US$ 7-8) within the project area and as much as Tk. 800-1000 (US$ 11-14) outside the area. Stove entrepreneurs found that the marketing activities were attracting wealthier households outside the project area, and charged the higher prices to reflect higher transportation costs as well as these households’ willingness to pay a premium for the improved cookstoves. The fixed stove appeared to be the most popular model, despite higher installation costs. Anecdotal information suggests that the added benefit of getting the smoke out of the living area through the chimney appealed to many customers.
USAID/Winrock Commercialization of Improved Cookstoves for Reduced IAP in NW Bangladesh
24
d. Micro-finance institution training The project households had previously constructed traditional stoves on their own and were not accustomed to purchasing stoves. Additionally, as mentioned earlier, it was difficult for many families to organize the total amount required to buy one of the improved stoves. Since the majority of these households were taking micro-credit loans from local MFIs for other goods and activities, Winrock recommended that VERC field staff give the MFIs an orientation on IAP and cookstoves to encourage them to provide additional loans of Tk. 1000 (US$ 14) for the purchase of improved stoves. Loan officer orientations were organized to motivate loan officers to provide loans for the purchase of improved cookstoves. VERC conducted an orientation on IAP and cookstoves for 30 loan officers from a local micro-finance organization, Come to Work. Loan officers received orientation training on the costs and benefits of the new cookstoves, and the health risks of IAP. Consumer financing appeared to be an important element in making the stoves affordable, and increasing demand. In retrospect, the MFI orientations should have been initiated early on in the project, in tandem with awareness-raising activities, so that the households would have access to micro-credit for stove purchases as soon as the improved cookstoves were available in the market.
USAID/Winrock Commercialization of Improved Cookstoves for Reduced IAP in NW Bangladesh
25
IV. KEY OBSERVATIONS AND LESSONS LEARNED
The following are lessons learned and observations formulated by the Winrock team over the course of project implementation.
A. Project Design
The project was implemented through two primary partners, one with experience in maternal and child health issues, and the other in household energy. The partners had strong experience in their respective fields but very different approaches to program implementation. To alleviate conflict, continuous dialogue was required between all parties concerned, as well as coordination at the local level and programmatic level in Dhaka.
Selection of local partners is a key consideration during the project design and implementation phases. Ideally, one partner would have responsibility for all field-level activities, either by direct implementation or by working with its partners. However, given the multi-sectoral nature of IAP and household energy issues, it is difficult to find one partner that can address both the health and energy aspects of the project. While selecting partners, it is important to look into the partner’s implementation history, approaches, reporting structure, and presence at the field level.
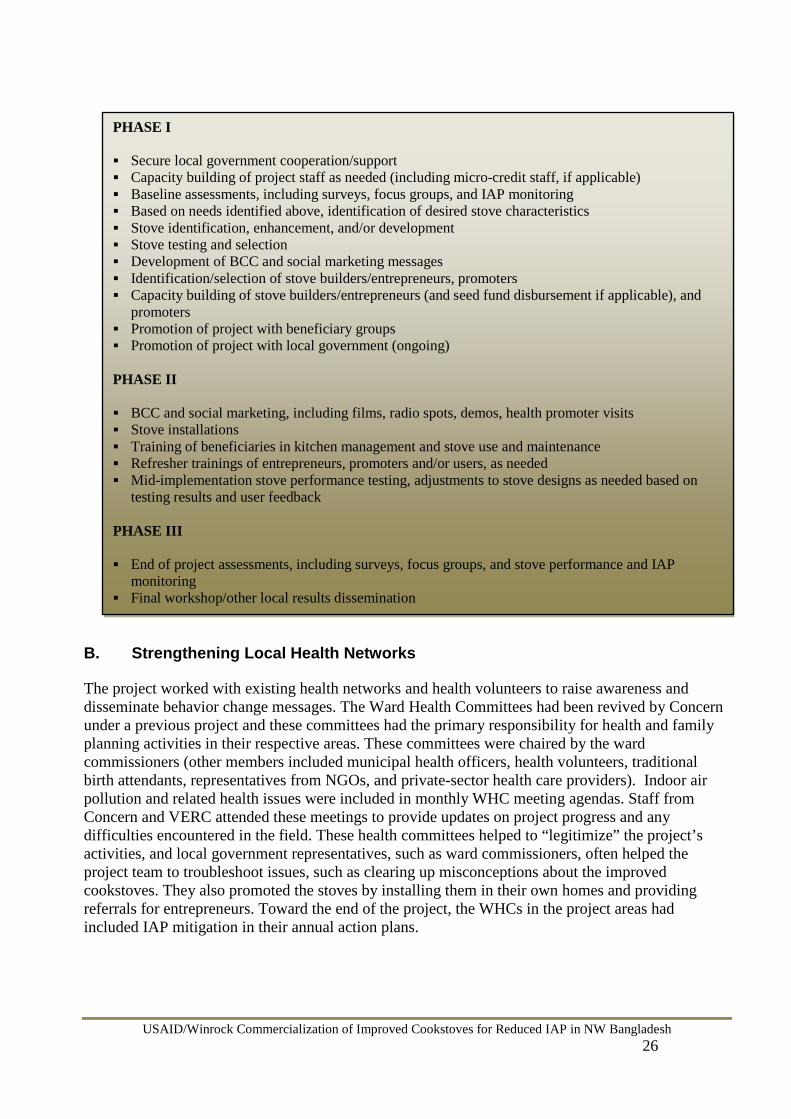
Timing and sequencing of activities is another key consideration, particularly when there are multiple partners. The key activities for a project of this type can generally be broken down into three phases, with Phase I including project planning, baseline assessments, stove identification and validation, and capacity building activities; Phase II focusing on behavior change and outreach activities, seed fund disbursement, and refresher training; and Phase III dedicated to final assessments and results dissemination. The text box on the next page lists Winrock’s recommended sequence of key activities for an IAP stove distribution project.
USAID/Winrock Commercialization of Improved Cookstoves for Reduced IAP in NW Bangladesh
26
B. Strengthening Local Health Networks
The project worked with existing health networks and health volunteers to raise awareness and disseminate behavior change messages. The Ward Health Committees had been revived by Concern under a previous project and these committees had the primary responsibility for health and family planning activities in their respective areas. These committees were chaired by the ward commissioners (other members included municipal health officers, health volunteers, traditional birth attendants, representatives from NGOs, and private-sector health care providers). Indoor air pollution and related health issues were included in monthly WHC meeting agendas. Staff from Concern and VERC attended these meetings to provide updates on project progress and any difficulties encountered in the field. These health committees helped to “legitimize” the project’s activities, and local government representatives, such as ward commissioners, often helped the project team to troubleshoot issues, such as clearing up misconceptions about the improved cookstoves. They also promoted the stoves by installing them in their own homes and providing referrals for entrepreneurs. Toward the end of the project, the WHCs in the project areas had included IAP mitigation in their annual action plans.
PHASE I Secure local government cooperation/support Capacity building of project staff as needed (including micro-credit staff, if applicable) Baseline assessments, including surveys, focus groups, and IAP monitoring Based on needs identified above, identification of desired stove characteristics Stove identification, enhancement, and/or development Stove testing and selection Development of BCC and social marketing messages Identification/selection of stove builders/entrepreneurs, promoters Capacity building of stove builders/entrepreneurs (and seed fund disbursement if applicable), and
promoters Promotion of project with beneficiary groups Promotion of project with local government (ongoing) PHASE II BCC and social marketing, including films, radio spots, demos, health promoter visits Stove installations Training of beneficiaries in kitchen management and stove use and maintenance Refresher trainings of entrepreneurs, promoters and/or users, as needed Mid-implementation stove performance testing, adjustments to stove designs as needed based on
testing results and user feedback PHASE III End of project assessments, including surveys, focus groups, and stove performance and IAP
monitoring Final workshop/other local results dissemination
USAID/Winrock Commercialization of Improved Cookstoves for Reduced IAP in NW Bangladesh
27
The Community Health Volunteers, who typically disseminate maternal and child health-related behavior change messages door to door, were trained in IAP-related BCC dissemination techniques. Volunteers tended to be young men and women from the local communities who were also working with the local municipal government to disseminate information about maternal and child health issues. These workers (most often unpaid volunteers) were members of the local community and were well respected for their social work and proved to be an important resource for message dissemination. The target households were more receptive to their messages, and this strategy also ensured continued dissemination of IAP-related messages, in coordination with the WHCs, well beyond the project, as part of their overall responsibilities as CHVs.
Working with the existing health infrastructure, particularly health committees and volunteers, contributes greatly to project sustainability and is a good investment of project resources. Local committees should be well briefed on the issue and have a clear understanding of their roles and responsibilities.
Winrock noted that the CHVs were not always engaged in the work, and the municipal health supervisors played a key role in motivating the CHVs. While the Parbatipur CHVs were more active, taking a greater interest in disseminating messages and attending project activities, their counterparts in Saidpur disseminated the messages on an ad hoc basis. The Parbatipur municipal health supervisor took a personal interest in disseminating behavior change messages and has continued after the end of the project to disseminate messages about improved cookstoves and cooking practices and link entrepreneurs with potential customers.
While implementing field-level activities, it is important to identify and cultivate local leaders who are invested in the process and share the vision of the project team. These leaders will in turn motivate local volunteers, field workers, and household members. The selection of appropriate field-level counterparts requires extended dialogue with local stakeholders, such as the local government. This should be part of the project planning process and there should be adequate time and resources budgeted for this initial phase.
WHC representatives or health volunteers participating at the Community Management Committee meetings were not always engaged in the process and did not adequately facilitate the transfer of information between WHCs and CMCs. The representatives were usually nominated by the WHC and sometimes the selection was not appropriate. There were instances where the representatives could not devote enough time to the CMCs.
The WHC representative has an important role as s/he is responsible for communications between two committees and keeping these stakeholders informed. Representatives should be chosen who are recognized community leaders and, ideally, who have experience playing a similar role elsewhere. Financial remuneration for the representatives would be helpful, although it is difficult to impossible to sustain after donor support ends.
C. Raising Awareness and Changing Behaviors
It was challenging to engage men in activities that focused on cookstoves and kitchens, a further indication of the existing gender divisions in household-related activities.

USAID/Winrock Commercialization of Improved Cookstoves for Reduced IAP in NW Bangladesh
28
Projects should consider organizing training sessions and orientations separately for men and women, or having content that is specifically targeted to men, such as highlighting their role in reducing exposure to IAP, to increase male awareness about the issue and motivate men to actively participate. Men can be given specific roles in awareness-raising activities, such as during stove demonstrations, to increase their participation. Although many of the awareness-raising activities, such as film shows and folks songs, attracted men, they were not necessarily part of the target audience for other more focused activities such as courtyard and CMC meetings. Since men play an important role in household purchase decisions, it is important to engage them early in the process to ensure adoption of improved stoves and necessary repairs. The CMCs or similar committees should actively engage men who can reach out to the general male population of the target areas. Awareness-raising activities can be held in strategic places, such as weekly markets, where men tend to congregate. The project organized a broad range of outreach activities, but some were less effective than others. For example, the film shows and folk songs were very popular, attracting hundreds of people, while the CMC meetings were not as popular. The meetings did not always have a clear focus and proved to be time consuming for the participants. Thus, resources were stretched and project staff sometimes found it difficult to focus on the core activities. The effectiveness of outreach activities should be evaluated at regular points during the project by conducting random surveys of participants to assess their level of awareness about IAP and household energy, and obtain their feedback on making these activities more focused.
Pursuing a smaller number of well-designed, targeted activities is a more effective strategy than implementing a larger number of more broadly themed activities. In addition to focusing on a smaller number of outreach activities, planners should examine carefully the frequency of these activities to ensure they do not overburden participating households and project staff.
D. Promoting Appropriate Technology
While the stoves promoted by the project had been tested in other contexts for energy efficiency, they had not been tested for IAP emissions, and the project team had to test these stoves for IAP reduction before they could be promoted in the project areas. This delayed implementation of core project activities such as entrepreneur development and sale of the cookstoves.
Any project or program seeking to recommend improved stove models for dissemination should ensure that the stove models have been designed and tested not only for improved efficiency but also for IAP reduction, or should allow enough time in the project to conduct appropriate testing. Such testing needs to occur in a variety of conditions, including dry and rainy seasons; thus, a testing period could take up to a year or more. Beyond this initial testing, the technology should be validated by actual use in households to identify any required design changes based on prevailing cooking and household energy practices.
USAID/Winrock Commercialization of Improved Cookstoves for Reduced IAP in NW Bangladesh
29
E. Developing a Market and Establishing Entrepreneurs
Developing the market At the beginning of the project there was an underlying expectation from some households that the project would provide cookstoves either free or at a subsidized rate. Although households in these slum areas were purchasing all their cooking fuel and were eager to obtain fuel efficient cookstoves, they were not enthusiastic about paying the full cost of the stoves. For a project promoting commercialization of fuel efficient cookstoves, it makes sense to focus initially on those who can most easily pay for the stoves— mid- to upper-income households that use biomass fuels for cooking and have health concerns. The stove businesses would initially target these higher-income groups, such as the mid- to upper-income households adjacent to the slum areas in Saidpur and Parbatipur, and then gradually focus on the bottom of the pyramid, once the businesses are self sustaining. Focusing on the lower-end market at the onset limits profit margins and hampers the growth of the businesses. Supporting entrepreneurs Some of the people who received entrepreneur training and support did not go on to start their own stove businesses. At the time of selection, many participants did not fully understand the responsibilities and commitments related to launching a business. The project targeted women entrepreneurs, but many women were not allowed by their husbands to work outside the home and others felt that they did not need to earn additional income through a stove business.
While it is important to develop women as energy entrepreneurs, the selection criteria should ensure that those who are selected for entrepreneurship training have the required experience and skill set to be successful businesswomen. This is particularly true for projects that are implemented for short durations (1 or 2 years). The project found that women who had prior experience with small businesses (not necessarily involving stoves), were more successful than those with no prior business experience. They had stronger marketing and bookkeeping skills. Moreover, since they were already involved in commercial activities, many of their husbands were already supporting their efforts and helped launch the new business. Similar initiatives in the future should focus initially on training existing entrepreneurs, rather than creating new ones. New entrepreneurs should be developed gradually by giving them limited roles, such as stove marketing.
Training appeared to be very beneficial to the new entrepreneurs, and many benefited from multiple “refresher” training sessions.
The project planned initial training to entrepreneurs without a plan for follow-on refresher trainings. However, once customers started using the improved cookstoves, it became apparent that there were a number of design and maintenance issues that had to be addressed. As the entrepreneurs were often new to the technology, they benefited from training that helped them understand and troubleshoot the design and maintenance issues. The entrepreneurs encountered issues such as how to install chimneys in homes with different roof configurations, given that customers were predominantly living in slum structures. Therefore, it was important to include and budget for frequent refresher trainings to ensure continued quality control of the technology and installation as well as satisfactory customer service.

USAID/Winrock Commercialization of Improved Cookstoves for Reduced IAP in NW Bangladesh
30
The project team developed marketing materials on the cookstoves for the entrepreneurs, but it became apparent that some entrepreneurs, particularly first-time business women, did not know how to use the materials. Women with prior business experience tended to rely on word of mouth to sell their products instead of using marketing materials. The refresher training sessions included a segment on the use of marketing materials.
It is important to ensure that the entrepreneurs know how to use marketing materials effectively. They need to “buy into” the materials, otherwise they will not utilize them once the project stops designing and paying for the production of these materials. Some new entrepreneurs need support and hands-on guidance in the art of selling and customer service.
Financing support Integrating a revolving fund specifically for improved cookstove business loans required a great deal of discussion and negotiations with the partner NGO. Issues such as criteria for acceptance as a group member and loan disbursement in a timely manner had to be addressed. As some of these negotiations may take time, these discussions should take place early on in the project. Low-income households typically do not have upfront cash to purchase improved cookstoves. However, many households can manage payments in installments. While these households typically already have access to micro-credit, the credit was established for other purchases, mostly related to income generation, and not for something like a stove that is considered a home improvement. If households had access to micro-credit for the purchase of stoves, they not only would be able to purchase the stoves but also reduce their household fuel costs while supporting the stove businesses.
For efforts seeking to ramp up stove commercialization, it is important to firm up cooperation with local MFIs as early as possible so that customers have access to finance as soon as stove models are introduced.
Product marketing Once the stove businesses had been established and the stoves were gaining popularity among the project households, some “untrained” entrepreneurs attempted to sell their stoves as the improved models endorsed by the project. While competition among entrepreneurs can be indicative of increasing popularity and market growth, poor quality products can undermine the work of project-supported entrepreneurs and also adversely affect consumer confidence.
A strong branding campaign can help maintain quality control. This has to be done from the very onset of stove promotion and should be coordinated with any marketing campaign. While the pilot project did not include a branding mechanism, households were given information on how to identify the design features of improved cookstoves. The names and contact information of the entrepreneurs were posted on notice boards in the demonstrations centers. Moreover, the local government representatives, such as the health officers, promoted the entrepreneurs by name.
F. Dissemination of Project Model
During the project period, Winrock and the project partners shared information about the project’s activities through a number of forums. A project advisory committee was formed in late 2006,
USAID/Winrock Commercialization of Improved Cookstoves for Reduced IAP in NW Bangladesh
31
consisting of representatives from local organizations and the local offices of international organizations working on energy and health issues with an interest in household energy and IAP, including Grameen Shakti, Bangladesh Rural Advancement Committee (BRAC), USAID, World Health Organization (WHO), United Nations Children’s Fund (UNICEF), German Technical Cooperation (GTZ), and the World Bank. The main purpose of the advisory committee was to ensure dissemination of information about the progress of the project among key household energy stakeholders in the country and to increase awareness about the need for further IAP interventions. The project has strong scaling-up potential in its working areas, and a number of organizations, including the project partners, have indicated an interest in either continuing project activities or addressing IAP more comprehensively in Bangladesh. 1. Concern Worldwide Bangladesh Concern has expanded its Child Survival program in seven additional municipalities in the northwest region of Bangladesh. Given that this improved stove pilot project was implemented in two adjacent municipalities, expansion of the model into these areas is possible. Concern is working with local governments in the new municipalities to improve maternal and child health. Since IAP is one of the well-established risk factors for acute respiratory infections, particularly for children under five, addressing IAP mitigation can be a logical “add-on” to existing activities. Concern is exploring opportunities to introduce IAP mitigation in the new working areas, specifically through behavior change intervention but also through the promotion of improved cookstoves, where appropriate. Some entrepreneurs from the pilot areas are already selling cookstoves in the neighboring districts. These businesses could be further strengthened, while training and financial support could be provided for new entrepreneurs. 2. The World Bank The World Bank has been in discussions with key household energy and health stakeholders in Bangladesh to develop an IAP reduction pilot project that will focus on commercialization of a range of improved cooking technologies and appropriate awareness-raising approaches. Based on the experience of USAID’s IAP reduction project, the World Bank contracted Winrock, in partnership with VERC, to develop an institutional model for an IAP reducing pilot project. Documents produced under this contract have been used to develop the institutional model, which will be implemented in the near future. 3. Village Education Resource Center Experience implementing USAID’s IAP reduction pilot project, coupled with other relevant household energy experiences, enabled VERC to obtain a grant from GTZ’s Sustainable Energy for Development Program, which aims to disseminate energy-efficient technologies, including improved cookstoves, through a commercialization approach. VERC has organized training programs on improved stove construction under GTZ’s guidance. More recently, VERC received funding from ARECOP via the Netherlands Development Organization to conduct an assessment of improved cookstoves in Bangladesh.
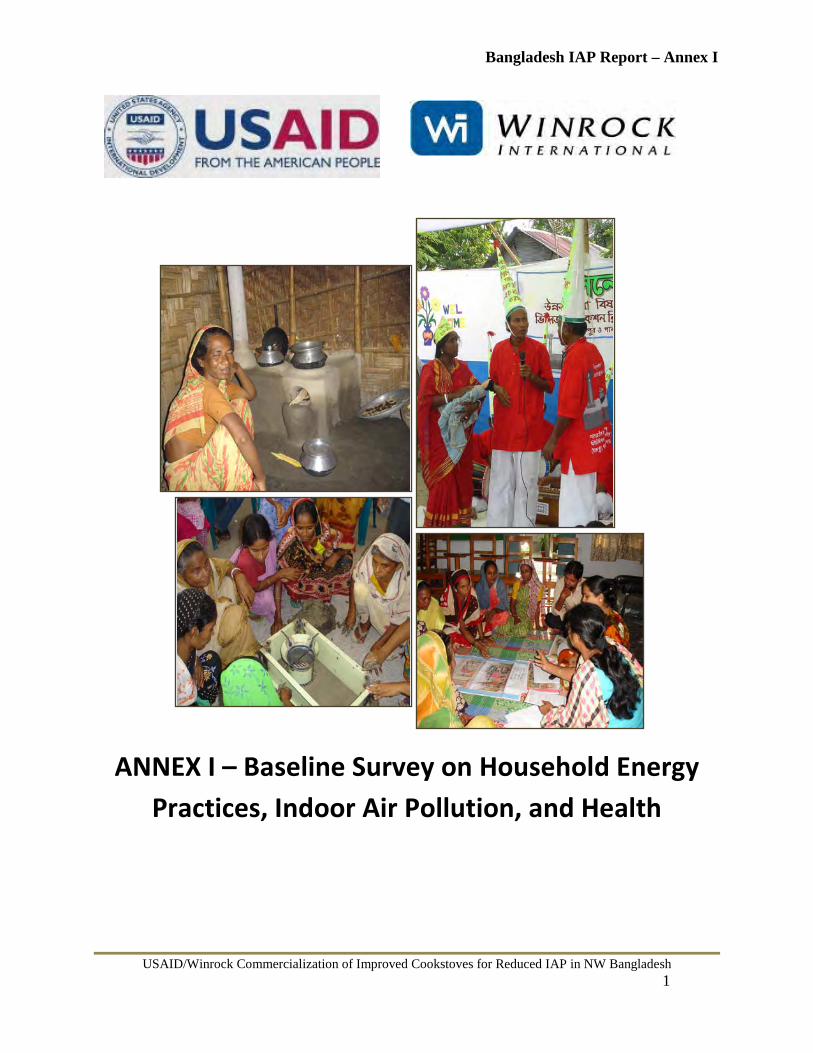
Bangladesh IAP Report – Annex I
USAID/Winrock Commercialization of Improved Cookstoves for Reduced IAP in NW Bangladesh
1
ANNEX I – Baseline Survey on Household Energy Practices, Indoor Air Pollution, and Health
Bangladesh IAP Report – Annex I
USAID/Winrock Commercialization of Improved Cookstoves for Reduced IAP in NW Bangladesh
0
ANNEX I. Baseline Survey on Household Energy Practices, Indoor Air Pollution, and Health
COMMERCIALIZATION OF IMPROVED COOKSTOVES FOR
REDUCED INDOOR AIR POLLUTION IN URBAN SLUMS
OF NORTHWEST BANGLADESH November 2005
Concern Worldwide Bangladesh www.concern.net
Bangladesh IAP Report – Annex I
USAID/Winrock Commercialization of Improved Cookstoves for Reduced IAP in NW Bangladesh
1
Glossary BDHS Bangladesh Demographic and Health Survey
BMMS Bangladesh Maternal Mortality Survey
IAP Indoor Air Pollution
ITDG Intermediate Technology Development Group
LPG Liquid Petroleum Gas
NGO Non-government Organization
NSDP NGO Service Delivery Program
PI Principal Investigator
SES Socio-Economic Status
SD Standard Deviation
VCD Video Compact Disk
VERC Village Education Resource Center
WHO World Health Organization
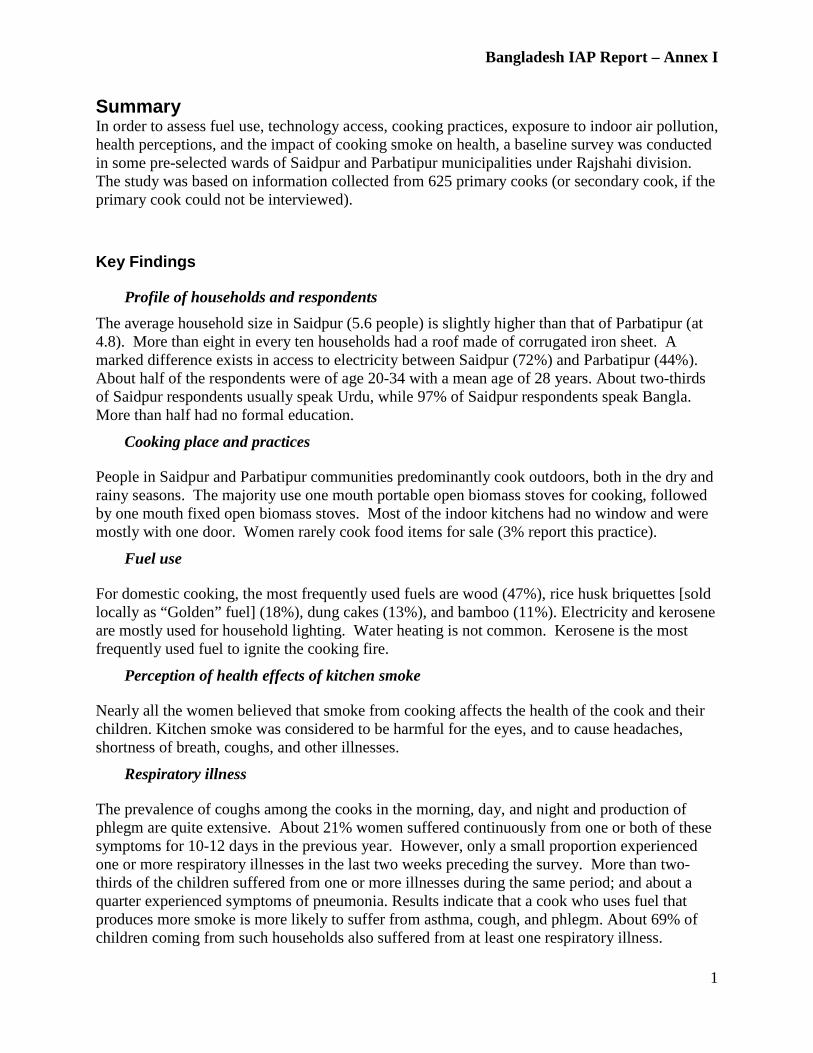
Bangladesh IAP Report – Annex I
1
Summary In order to assess fuel use, technology access, cooking practices, exposure to indoor air pollution, health perceptions, and the impact of cooking smoke on health, a baseline survey was conducted in some pre-selected wards of Saidpur and Parbatipur municipalities under Rajshahi division. The study was based on information collected from 625 primary cooks (or secondary cook, if the primary cook could not be interviewed).
Key Findings
Profile of households and respondents The average household size in Saidpur (5.6 people) is slightly higher than that of Parbatipur (at 4.8). More than eight in every ten households had a roof made of corrugated iron sheet. A marked difference exists in access to electricity between Saidpur (72%) and Parbatipur (44%). About half of the respondents were of age 20-34 with a mean age of 28 years. About two-thirds of Saidpur respondents usually speak Urdu, while 97% of Saidpur respondents speak Bangla. More than half had no formal education.
Cooking place and practices
People in Saidpur and Parbatipur communities predominantly cook outdoors, both in the dry and rainy seasons. The majority use one mouth portable open biomass stoves for cooking, followed by one mouth fixed open biomass stoves. Most of the indoor kitchens had no window and were mostly with one door. Women rarely cook food items for sale (3% report this practice).
Fuel use
For domestic cooking, the most frequently used fuels are wood (47%), rice husk briquettes [sold locally as “Golden” fuel] (18%), dung cakes (13%), and bamboo (11%). Electricity and kerosene are mostly used for household lighting. Water heating is not common. Kerosene is the most frequently used fuel to ignite the cooking fire.
Perception of health effects of kitchen smoke
Nearly all the women believed that smoke from cooking affects the health of the cook and their children. Kitchen smoke was considered to be harmful for the eyes, and to cause headaches, shortness of breath, coughs, and other illnesses.
Respiratory illness
The prevalence of coughs among the cooks in the morning, day, and night and production of phlegm are quite extensive. About 21% women suffered continuously from one or both of these symptoms for 10-12 days in the previous year. However, only a small proportion experienced one or more respiratory illnesses in the last two weeks preceding the survey. More than two-thirds of the children suffered from one or more illnesses during the same period; and about a quarter experienced symptoms of pneumonia. Results indicate that a cook who uses fuel that produces more smoke is more likely to suffer from asthma, cough, and phlegm. About 69% of children coming from such households also suffered from at least one respiratory illness.
Bangladesh IAP Report – Annex I
2
Conclusion Household energy practices, indoor air pollution, and their associated health impacts comprise a relatively new area of investigation. The project area households use mostly biomass as cooking fuel, and stoves that usually produce lot of smoke. However, about half of the households cook outdoors and this practice diminishes, to some extent, the adverse effects of cooking smoke. Since the prevalence of respiratory illness among the women (cooks) and children is high, and there is an indication of a relationship between exposure to kitchen smoke and such illness, efforts to reduce dependency on biomass fuel and limit household exposure to cooking smoke will improve indoor air pollution levels in the project areas.
Bangladesh IAP Report – Annex I
3
1. Introduction
1.1 Background
Bangladesh has over 141 million inhabitants living in an area of 147,570 square kilometers, making it one of the most densely populated countries in the world. Bangladesh has one of the highest under-five mortality rates in the world. There is evidence of a high prevalence of respiratory illness among children under five. This is more pronounced among children under two. A significant proportion of deaths are indicated due to diarrhea-related disease and respiratory infections associated with environmental factors (water and sanitation, hygiene practices, crowding, and indoor pollution).
There is growing evidence that indoor air pollution is a risk factor for respiratory tract infections. Biomass energy, primary fuel wood, agricultural residues, and dung dominate energy production and supply in the country. A severe fuel wood scarcity prevails throughout the country. The domestic sector accounts for the major share of energy consumed in Bangladesh with more than 90% coming from traditional energy sources, like biomass, to meet cooking needs. Indoor air pollution is caused by the use of low-grade cooking fuels (e.g., dung, straw, and wood), and the presence of stoves in poorly ventilated single-roomed houses. Women and their young children have the highest risk of exposure to indoor air pollution. To address this issue, Concern Worldwide Bangladesh and Village Education Resource Center (VERC) worked with Winrock International to design a pilot cookstove project, Commercialization of Improved Cookstoves for Reduced Indoor Air Pollution in Urban Slums of Northwest Bangladesh. Concern Bangladesh commissioned a baseline survey in selected areas of Saidpur and Parbatipur municipalities to ascertain household energy practices, indoor air pollution, and their adverse effect on health. 1.2 Objectives The main objective of the baseline survey was to assess fuel use, technology access, cooking practices, and health perceptions in the selected areas. The specific objectives were to assess:
- cooking practices and fuel use - level of exposure to indoor air pollution - health impacts of kitchen smoke
1.3 Organization of the survey
Sample design and methods
The baseline study was conducted in some pre-selected wards of Saidpur and Parbatipur municipalities under Rajshahi division. It covered 625 households, taking equally from five wards; three in Saidpur and two in Parbatipur. All the households of the five wards were listed, and then 125 households were randomly selected from each ward. The primary cooks, or in their absence the secondary cook, of the selected households were chosen as the main respondents. Only one respondent from a household was allowed in the sample.
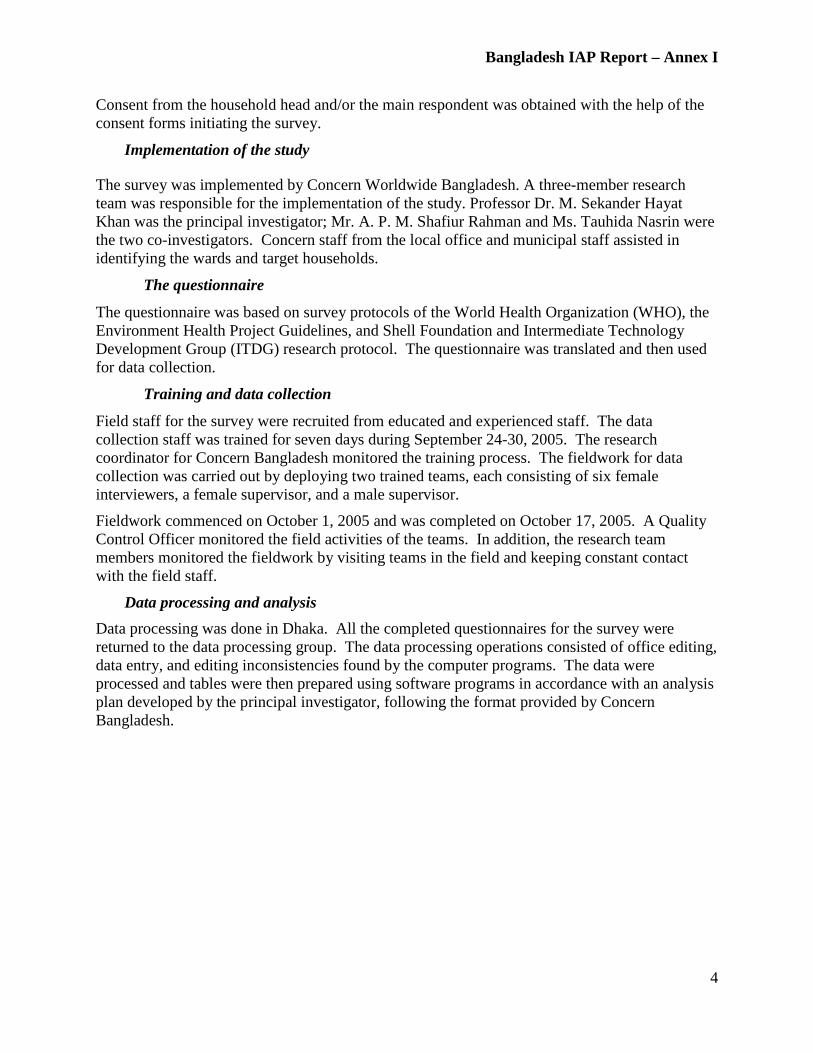
Bangladesh IAP Report – Annex I
4
Consent from the household head and/or the main respondent was obtained with the help of the consent forms initiating the survey.
Implementation of the study
The survey was implemented by Concern Worldwide Bangladesh. A three-member research team was responsible for the implementation of the study. Professor Dr. M. Sekander Hayat Khan was the principal investigator; Mr. A. P. M. Shafiur Rahman and Ms. Tauhida Nasrin were the two co-investigators. Concern staff from the local office and municipal staff assisted in identifying the wards and target households.
The questionnaire
The questionnaire was based on survey protocols of the World Health Organization (WHO), the Environment Health Project Guidelines, and Shell Foundation and Intermediate Technology Development Group (ITDG) research protocol. The questionnaire was translated and then used for data collection.
Training and data collection
Field staff for the survey were recruited from educated and experienced staff. The data collection staff was trained for seven days during September 24-30, 2005. The research coordinator for Concern Bangladesh monitored the training process. The fieldwork for data collection was carried out by deploying two trained teams, each consisting of six female interviewers, a female supervisor, and a male supervisor.
Fieldwork commenced on October 1, 2005 and was completed on October 17, 2005. A Quality Control Officer monitored the field activities of the teams. In addition, the research team members monitored the fieldwork by visiting teams in the field and keeping constant contact with the field staff.
Data processing and analysis Data processing was done in Dhaka. All the completed questionnaires for the survey were returned to the data processing group. The data processing operations consisted of office editing, data entry, and editing inconsistencies found by the computer programs. The data were processed and tables were then prepared using software programs in accordance with an analysis plan developed by the principal investigator, following the format provided by Concern Bangladesh.
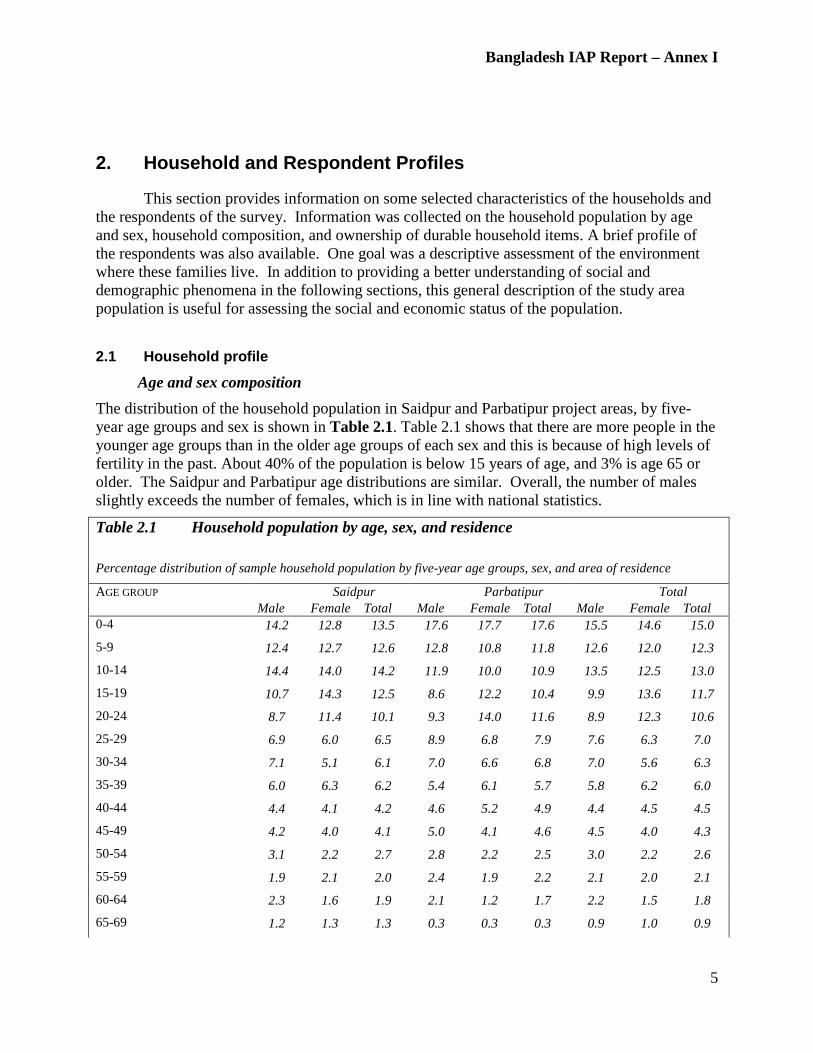
Bangladesh IAP Report – Annex I
5
2. Household and Respondent Profiles
This section provides information on some selected characteristics of the households and the respondents of the survey. Information was collected on the household population by age and sex, household composition, and ownership of durable household items. A brief profile of the respondents was also available. One goal was a descriptive assessment of the environment where these families live. In addition to providing a better understanding of social and demographic phenomena in the following sections, this general description of the study area population is useful for assessing the social and economic status of the population. 2.1 Household profile
Age and sex composition The distribution of the household population in Saidpur and Parbatipur project areas, by five-year age groups and sex is shown in Table 2.1. Table 2.1 shows that there are more people in the younger age groups than in the older age groups of each sex and this is because of high levels of fertility in the past. About 40% of the population is below 15 years of age, and 3% is age 65 or older. The Saidpur and Parbatipur age distributions are similar. Overall, the number of males slightly exceeds the number of females, which is in line with national statistics.
Table 2.1 Household population by age, sex, and residence Percentage distribution of sample household population by five-year age groups, sex, and area of residence
AGE GROUP Saidpur Parbatipur Total Male Female Total Male Female Total Male Female Total
0-4 14.2 12.8 13.5 17.6 17.7 17.6 15.5 14.6 15.0 5-9 12.4 12.7 12.6 12.8 10.8 11.8 12.6 12.0 12.3 10-14 14.4 14.0 14.2 11.9 10.0 10.9 13.5 12.5 13.0 15-19 10.7 14.3 12.5 8.6 12.2 10.4 9.9 13.6 11.7 20-24 8.7 11.4 10.1 9.3 14.0 11.6 8.9 12.3 10.6
25-29 6.9 6.0 6.5 8.9 6.8 7.9 7.6 6.3 7.0 30-34 7.1 5.1 6.1 7.0 6.6 6.8 7.0 5.6 6.3 35-39 6.0 6.3 6.2 5.4 6.1 5.7 5.8 6.2 6.0 40-44 4.4 4.1 4.2 4.6 5.2 4.9 4.4 4.5 4.5 45-49 4.2 4.0 4.1 5.0 4.1 4.6 4.5 4.0 4.3 50-54 3.1 2.2 2.7 2.8 2.2 2.5 3.0 2.2 2.6 55-59 1.9 2.1 2.0 2.4 1.9 2.2 2.1 2.0 2.1 60-64 2.3 1.6 1.9 2.1 1.2 1.7 2.2 1.5 1.8 65-69 1.2 1.3 1.3 0.3 0.3 0.3 0.9 1.0 0.9

Bangladesh IAP Report – Annex I
6
70-74 1.2 1.1 1.2 0.7 0.5 0.6 1.0 0.9 1.0 75-79 0.4 0.3 0.3 0.5 0.2 0.3 0.4 0.2 0.3 80+ 0.9 0.7 0.8 0.2 0.3 0.2 0.6 0.5 0.6 MEAN 23.14 22.52 22.83 21.91 21.44 21.68 22.68 22.13 22.41 TOTAL 100.0 100.0 100.0 100.0 100.0 100.0 100.0 100.0 100.0 N (SAMPLE SIZE) 1048 1060 2108 615 592 1207 1663 1652 3315
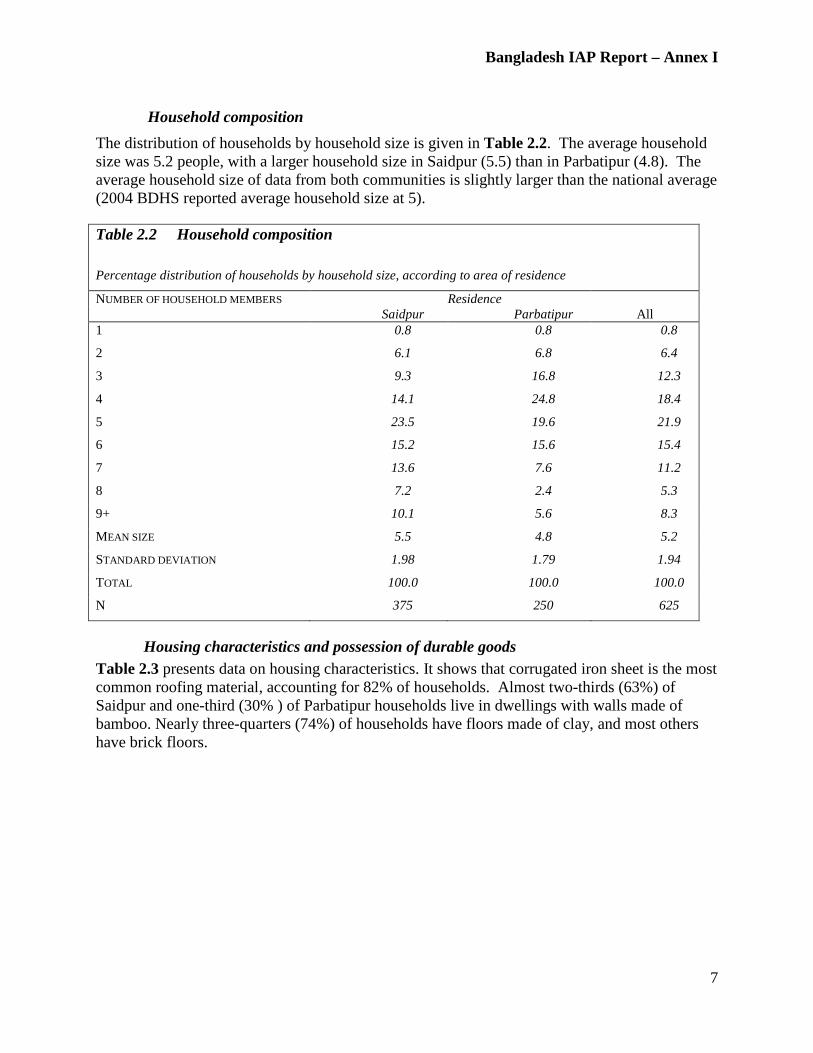
Bangladesh IAP Report – Annex I
7
Household composition The distribution of households by household size is given in Table 2.2. The average household size was 5.2 people, with a larger household size in Saidpur (5.5) than in Parbatipur (4.8). The average household size of data from both communities is slightly larger than the national average (2004 BDHS reported average household size at 5).
Housing characteristics and possession of durable goods Table 2.3 presents data on housing characteristics. It shows that corrugated iron sheet is the most common roofing material, accounting for 82% of households. Almost two-thirds (63%) of Saidpur and one-third (30% ) of Parbatipur households live in dwellings with walls made of bamboo. Nearly three-quarters (74%) of households have floors made of clay, and most others have brick floors.
Table 2.2 Household composition Percentage distribution of households by household size, according to area of residence
NUMBER OF HOUSEHOLD MEMBERS Residence All Saidpur Parbatipur
1 0.8 0.8 0.8
2 6.1 6.8 6.4
3 9.3 16.8 12.3
4 14.1 24.8 18.4
5 23.5 19.6 21.9
6 15.2 15.6 15.4
7 13.6 7.6 11.2
8 7.2 2.4 5.3
9+ 10.1 5.6 8.3
MEAN SIZE 5.5 4.8 5.2
STANDARD DEVIATION 1.98 1.79 1.94
TOTAL 100.0 100.0 100.0
N 375 250 625
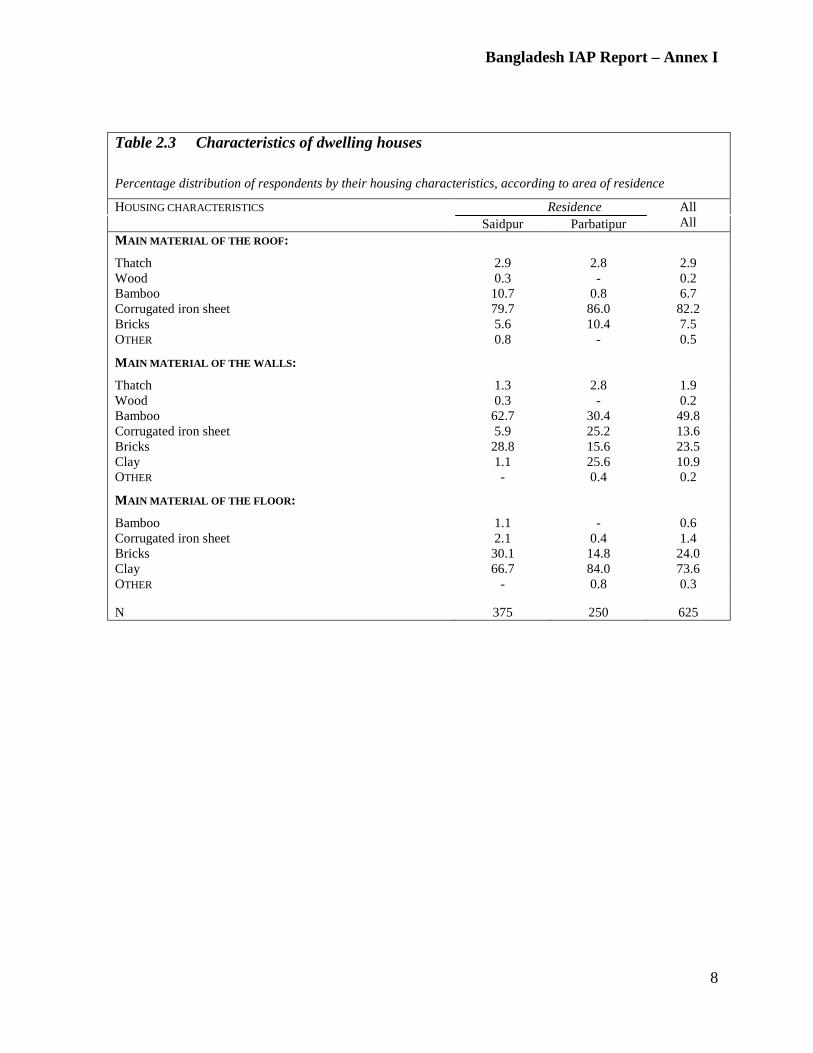
Bangladesh IAP Report – Annex I
8
Table 2.3 Characteristics of dwelling houses Percentage distribution of respondents by their housing characteristics, according to area of residence
HOUSING CHARACTERISTICS Residence All All Saidpur Parbatipur
MAIN MATERIAL OF THE ROOF:
Thatch 2.9 2.8 2.9 Wood 0.3 - 0.2 Bamboo 10.7 0.8 6.7 Corrugated iron sheet 79.7 86.0 82.2 Bricks 5.6 10.4 7.5 OTHER 0.8 - 0.5
MAIN MATERIAL OF THE WALLS:
Thatch 1.3 2.8 1.9 Wood 0.3 - 0.2 Bamboo 62.7 30.4 49.8 Corrugated iron sheet 5.9 25.2 13.6 Bricks 28.8 15.6 23.5 Clay 1.1 25.6 10.9 OTHER - 0.4 0.2
MAIN MATERIAL OF THE FLOOR:
Bamboo 1.1 - 0.6 Corrugated iron sheet 2.1 0.4 1.4 Bricks 30.1 14.8 24.0 Clay 66.7 84.0 73.6 OTHER - 0.8 0.3
N 375 250 625
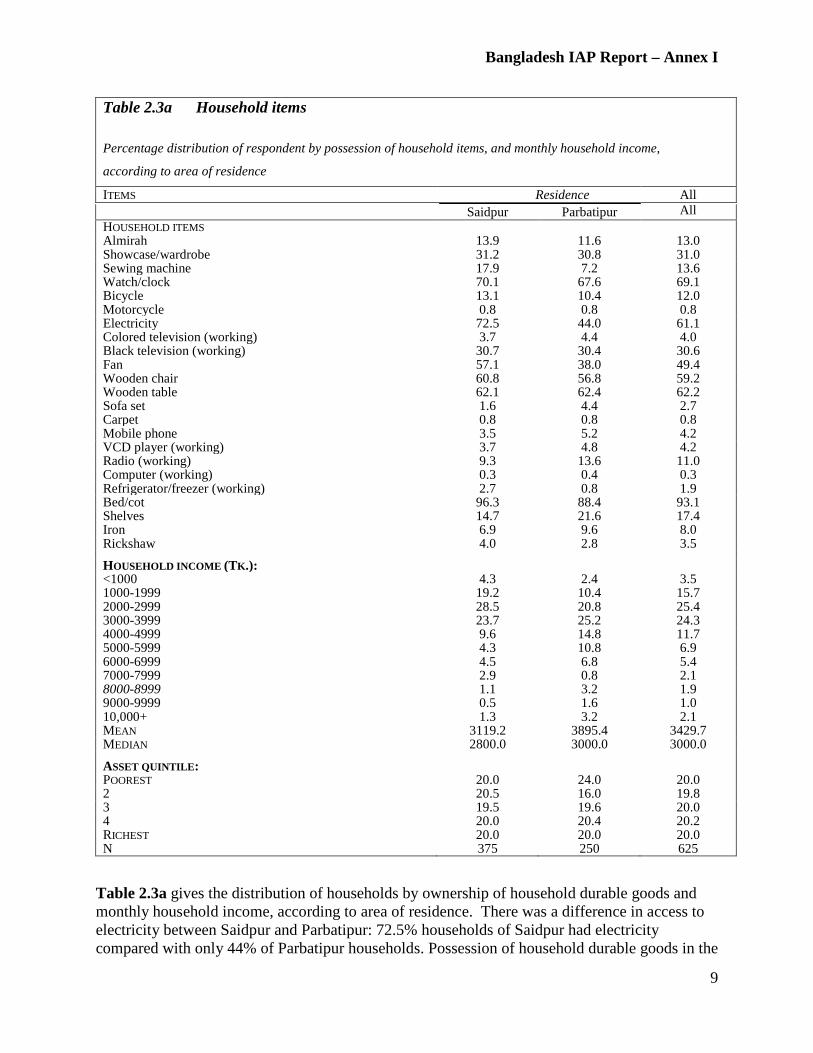
Bangladesh IAP Report – Annex I
9
Table 2.3a Household items Percentage distribution of respondent by possession of household items, and monthly household income,
according to area of residence
ITEMS Residence All All Saidpur Parbatipur
HOUSEHOLD ITEMS Almirah 13.9 11.6 13.0 Showcase/wardrobe 31.2 30.8 31.0 Sewing machine 17.9 7.2 13.6 Watch/clock 70.1 67.6 69.1 Bicycle 13.1 10.4 12.0 Motorcycle 0.8 0.8 0.8 Electricity 72.5 44.0 61.1 Colored television (working) 3.7 4.4 4.0 Black television (working) 30.7 30.4 30.6 Fan 57.1 38.0 49.4 Wooden chair 60.8 56.8 59.2 Wooden table 62.1 62.4 62.2 Sofa set 1.6 4.4 2.7 Carpet 0.8 0.8 0.8 Mobile phone 3.5 5.2 4.2 VCD player (working) 3.7 4.8 4.2 Radio (working) 9.3 13.6 11.0 Computer (working) 0.3 0.4 0.3 Refrigerator/freezer (working) 2.7 0.8 1.9 Bed/cot 96.3 88.4 93.1 Shelves 14.7 21.6 17.4 Iron 6.9 9.6 8.0 Rickshaw 4.0 2.8 3.5 HOUSEHOLD INCOME (TK.): <1000 4.3 2.4 3.5 1000-1999 19.2 10.4 15.7 2000-2999 28.5 20.8 25.4 3000-3999 23.7 25.2 24.3 4000-4999 9.6 14.8 11.7 5000-5999 4.3 10.8 6.9 6000-6999 4.5 6.8 5.4 7000-7999 2.9 0.8 2.1 8000-8999 1.1 3.2 1.9 9000-9999 0.5 1.6 1.0 10,000+ 1.3 3.2 2.1 MEAN 3119.2 3895.4 3429.7 MEDIAN 2800.0 3000.0 3000.0 ASSET QUINTILE: POOREST 20.0 24.0 20.0 2 20.5 16.0 19.8 3 19.5 19.6 20.0 4 20.0 20.4 20.2 RICHEST 20.0 20.0 20.0 N 375 250 625
Table 2.3a gives the distribution of households by ownership of household durable goods and monthly household income, according to area of residence. There was a difference in access to electricity between Saidpur and Parbatipur: 72.5% households of Saidpur had electricity compared with only 44% of Parbatipur households. Possession of household durable goods in the
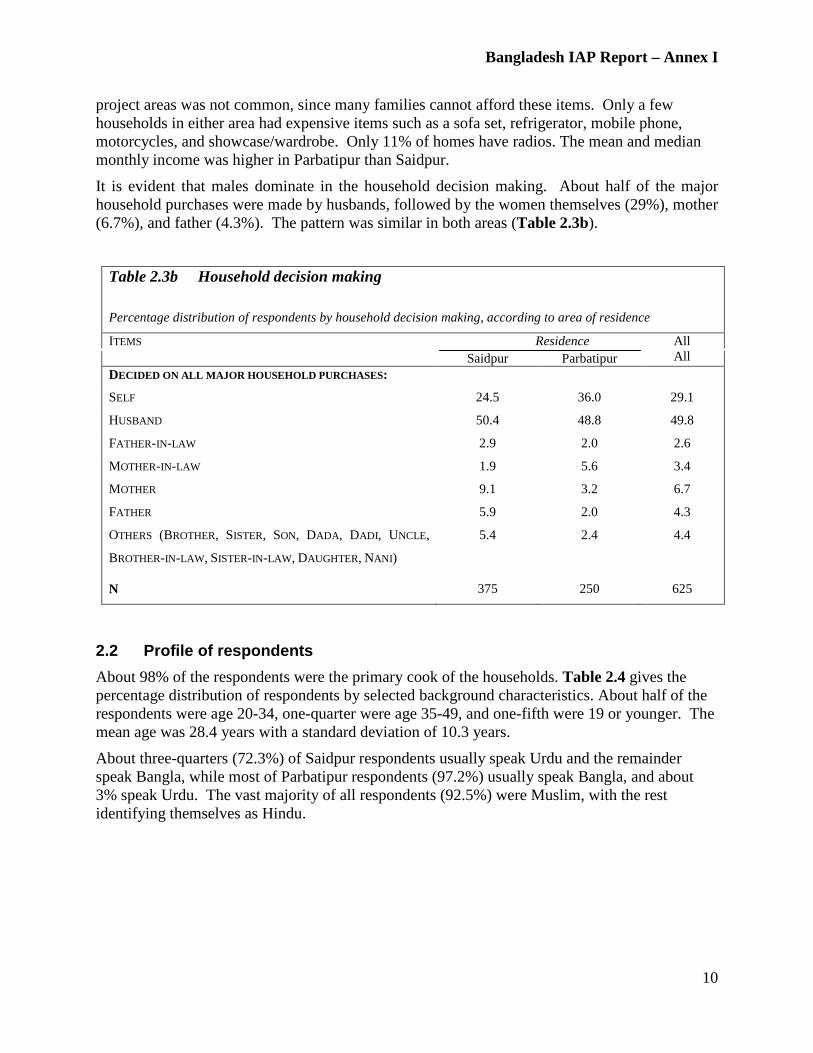
Bangladesh IAP Report – Annex I
10
project areas was not common, since many families cannot afford these items. Only a few households in either area had expensive items such as a sofa set, refrigerator, mobile phone, motorcycles, and showcase/wardrobe. Only 11% of homes have radios. The mean and median monthly income was higher in Parbatipur than Saidpur.
It is evident that males dominate in the household decision making. About half of the major household purchases were made by husbands, followed by the women themselves (29%), mother (6.7%), and father (4.3%). The pattern was similar in both areas (Table 2.3b).
Table 2.3b Household decision making Percentage distribution of respondents by household decision making, according to area of residence
ITEMS Residence All All Saidpur Parbatipur
DECIDED ON ALL MAJOR HOUSEHOLD PURCHASES:
SELF 24.5 36.0 29.1
HUSBAND 50.4 48.8 49.8
FATHER-IN-LAW 2.9 2.0 2.6
MOTHER-IN-LAW 1.9 5.6 3.4
MOTHER 9.1 3.2 6.7
FATHER 5.9 2.0 4.3
OTHERS (BROTHER, SISTER, SON, DADA, DADI, UNCLE,
BROTHER-IN-LAW, SISTER-IN-LAW, DAUGHTER, NANI)
5.4 2.4 4.4
N 375 250 625
2.2 Profile of respondents About 98% of the respondents were the primary cook of the households. Table 2.4 gives the percentage distribution of respondents by selected background characteristics. About half of the respondents were age 20-34, one-quarter were age 35-49, and one-fifth were 19 or younger. The mean age was 28.4 years with a standard deviation of 10.3 years.
About three-quarters (72.3%) of Saidpur respondents usually speak Urdu and the remainder speak Bangla, while most of Parbatipur respondents (97.2%) usually speak Bangla, and about 3% speak Urdu. The vast majority of all respondents (92.5%) were Muslim, with the rest identifying themselves as Hindu.
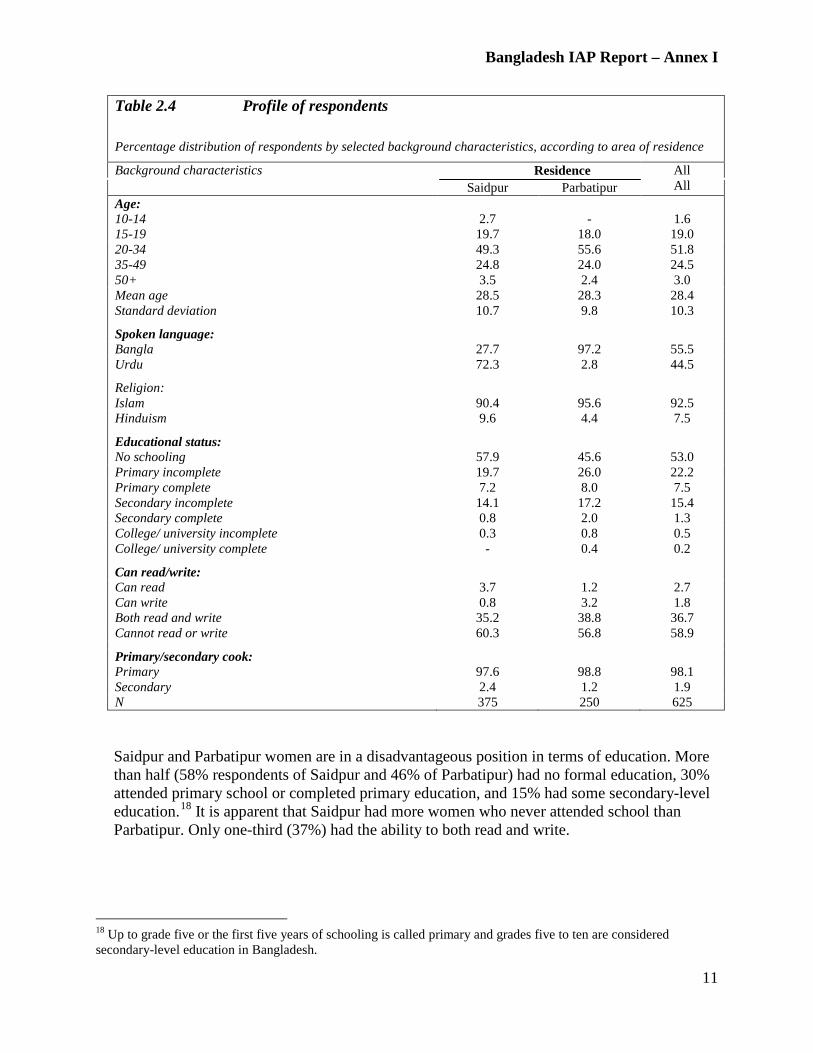
Bangladesh IAP Report – Annex I
11
Table 2.4 Profile of respondents Percentage distribution of respondents by selected background characteristics, according to area of residence
Background characteristics Residence All All Saidpur Parbatipur
Age: 10-14 2.7 - 1.6 15-19 19.7 18.0 19.0 20-34 49.3 55.6 51.8 35-49 24.8 24.0 24.5 50+ 3.5 2.4 3.0 Mean age 28.5 28.3 28.4 Standard deviation 10.7 9.8 10.3 Spoken language: Bangla 27.7 97.2 55.5 Urdu 72.3 2.8 44.5 Religion: Islam 90.4 95.6 92.5 Hinduism 9.6 4.4 7.5 Educational status: No schooling 57.9 45.6 53.0 Primary incomplete 19.7 26.0 22.2 Primary complete 7.2 8.0 7.5 Secondary incomplete 14.1 17.2 15.4 Secondary complete 0.8 2.0 1.3 College/ university incomplete 0.3 0.8 0.5 College/ university complete - 0.4 0.2 Can read/write: Can read 3.7 1.2 2.7 Can write 0.8 3.2 1.8 Both read and write 35.2 38.8 36.7 Cannot read or write 60.3 56.8 58.9 Primary/secondary cook: Primary 97.6 98.8 98.1 Secondary 2.4 1.2 1.9 N 375 250 625
Saidpur and Parbatipur women are in a disadvantageous position in terms of education. More than half (58% respondents of Saidpur and 46% of Parbatipur) had no formal education, 30% attended primary school or completed primary education, and 15% had some secondary-level education.18
18 Up to grade five or the first five years of schooling is called primary and grades five to ten are considered secondary-level education in Bangladesh.
It is apparent that Saidpur had more women who never attended school than Parbatipur. Only one-third (37%) had the ability to both read and write.

Bangladesh IAP Report – Annex I
12
3. Cooking Practices
Information about cooking place and practices during the dry and rainy seasons, cooking devices in use, extent of cooking for the family and for sale, cooking technology, fuel use, and cost incurred are analyzed in the following sub-sections. 3.1 Cooking place and practices
Table 3.1a showed that the families involved in the Parbatipur and Saidpur pilot project predominantly cook outdoors. In the dry season, 50% of households overall cook outdoors. Outdoor cooking practices are more prevalent inn Parbatipur, where 67% cook outdoors rather than inside the home. Outdoor cooking areas are mostly under open air with no structural support. Indoor cooking places tend to be located in a separate building (14%), in the living/sleeping room (14%), inside the veranda/at doorway (14%), and in a separate room of the living house (9%).
Table 3.1a Cooking places and practices during dry season Percentage distribution of respondents by their cooking place and practices during dry season, according to area
of residence
PRACTICES Residence All All Saidpur Parbatipur
COOKING PLACES:
Living/ sleeping room 20.0 4.4 13.8 Outdoors away from doorway 38.4 67.2 49.9 Inside veranda/at doorway 12.8 14.8 13.6 In a separate room used as kitchen 12.0 3.6 8.6 In a separate building used as kitchen 16.8 10.0 14.1 Cooking devices used in dry season: Biomass 99.7 99.6 99.7 LPG stove 0.3 0.4 0.3 Frequency of cooking in a day: 1 25.6 63.2 40.6 2 46.1 26.0 38.1 3+ 28.3 10.8 21.3 Mean 2.03 1.48 1.81 N 375 250 625
Nearly all the households (99.7%) use one mouth portable/fixed type biomass stoves for cooking in both the dry and rainy seasons. On average, a Saidpur household cooks 2 times per day and Parbatipur households cook 1.5 times per day.
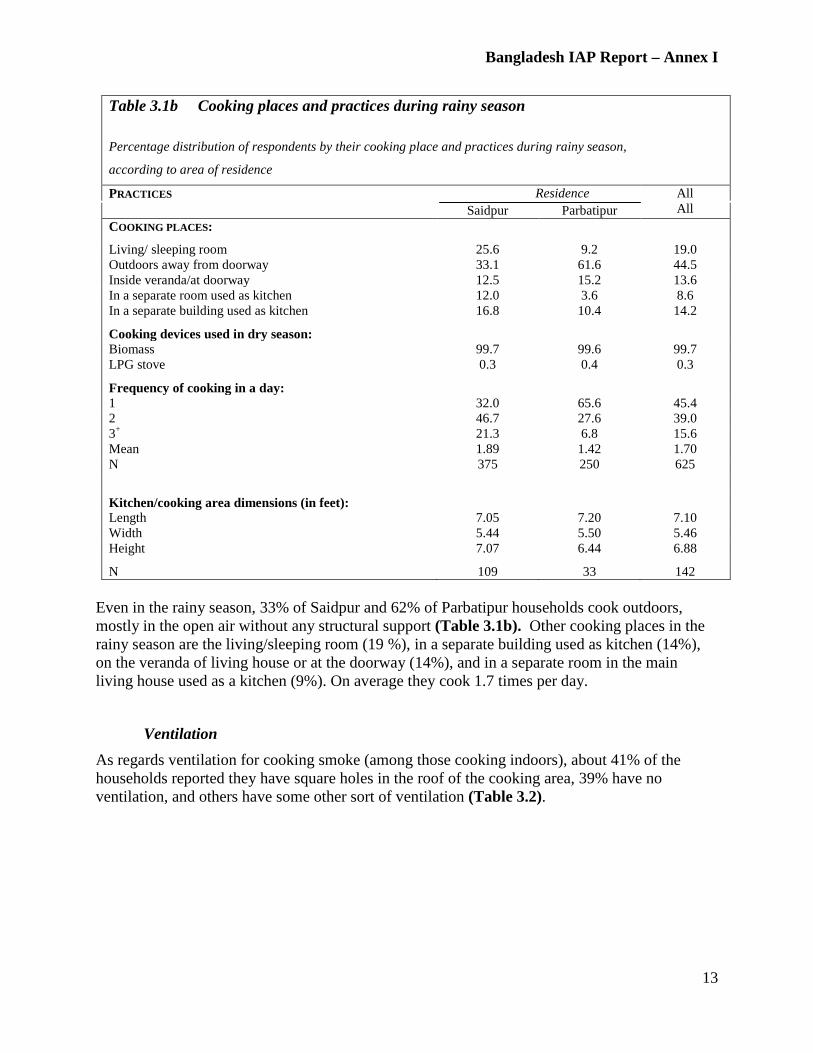
Bangladesh IAP Report – Annex I
13
Table 3.1b Cooking places and practices during rainy season Percentage distribution of respondents by their cooking place and practices during rainy season,
according to area of residence
PRACTICES Residence All All Saidpur Parbatipur
COOKING PLACES:
Living/ sleeping room 25.6 9.2 19.0 Outdoors away from doorway 33.1 61.6 44.5 Inside veranda/at doorway 12.5 15.2 13.6 In a separate room used as kitchen 12.0 3.6 8.6 In a separate building used as kitchen 16.8 10.4 14.2 Cooking devices used in dry season: Biomass 99.7 99.6 99.7 LPG stove 0.3 0.4 0.3 Frequency of cooking in a day: 1 32.0 65.6 45.4 2 46.7 27.6 39.0 3+ 21.3 6.8 15.6 Mean 1.89 1.42 1.70 N 375 250 625
Kitchen/cooking area dimensions (in feet): Length 7.05 7.20 7.10 Width 5.44 5.50 5.46 Height 7.07 6.44 6.88 N 109 33 142
Even in the rainy season, 33% of Saidpur and 62% of Parbatipur households cook outdoors, mostly in the open air without any structural support (Table 3.1b). Other cooking places in the rainy season are the living/sleeping room (19 %), in a separate building used as kitchen (14%), on the veranda of living house or at the doorway (14%), and in a separate room in the main living house used as a kitchen (9%). On average they cook 1.7 times per day.
Ventilation As regards ventilation for cooking smoke (among those cooking indoors), about 41% of the households reported they have square holes in the roof of the cooking area, 39% have no ventilation, and others have some other sort of ventilation (Table 3.2).
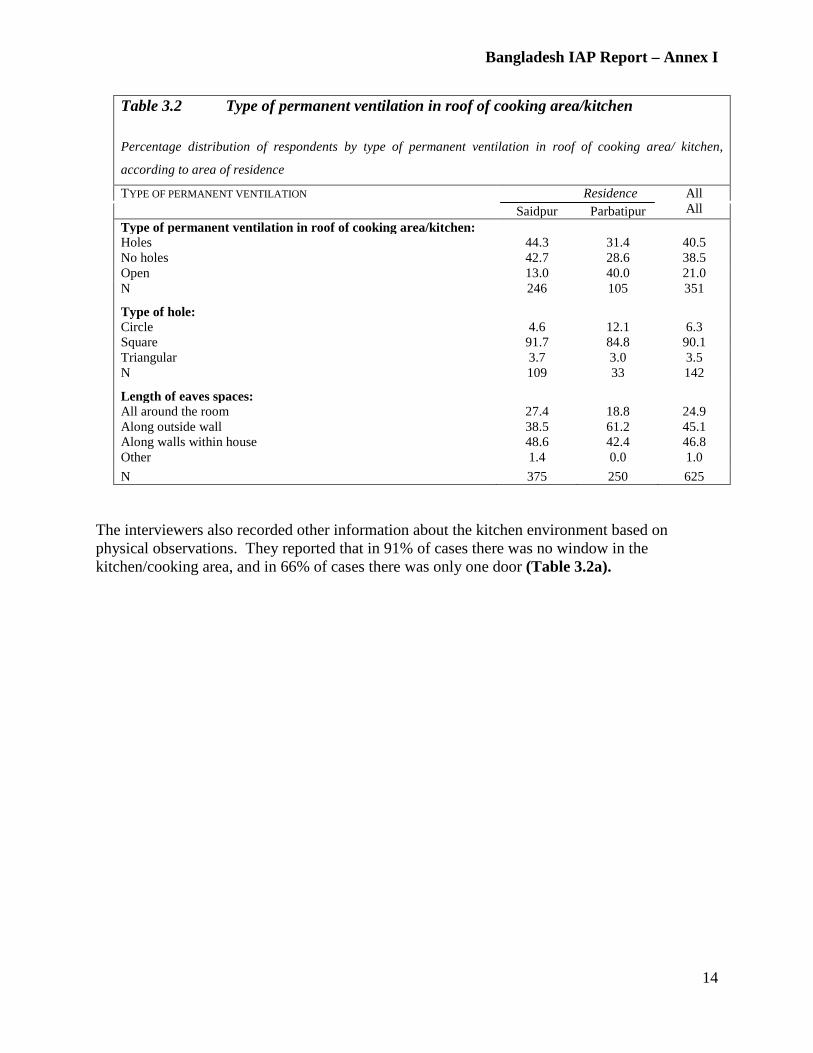
Bangladesh IAP Report – Annex I
14
Table 3.2 Type of permanent ventilation in roof of cooking area/kitchen Percentage distribution of respondents by type of permanent ventilation in roof of cooking area/ kitchen,
according to area of residence
TYPE OF PERMANENT VENTILATION Residence All All Saidpur Parbatipur
Type of permanent ventilation in roof of cooking area/kitchen: Holes 44.3 31.4 40.5 No holes 42.7 28.6 38.5 Open 13.0 40.0 21.0 N 246 105 351 Type of hole: Circle 4.6 12.1 6.3 Square 91.7 84.8 90.1 Triangular 3.7 3.0 3.5 N 109 33 142 Length of eaves spaces: All around the room 27.4 18.8 24.9 Along outside wall 38.5 61.2 45.1 Along walls within house 48.6 42.4 46.8 Other 1.4 0.0 1.0 N 375 250 625
The interviewers also recorded other information about the kitchen environment based on physical observations. They reported that in 91% of cases there was no window in the kitchen/cooking area, and in 66% of cases there was only one door (Table 3.2a).
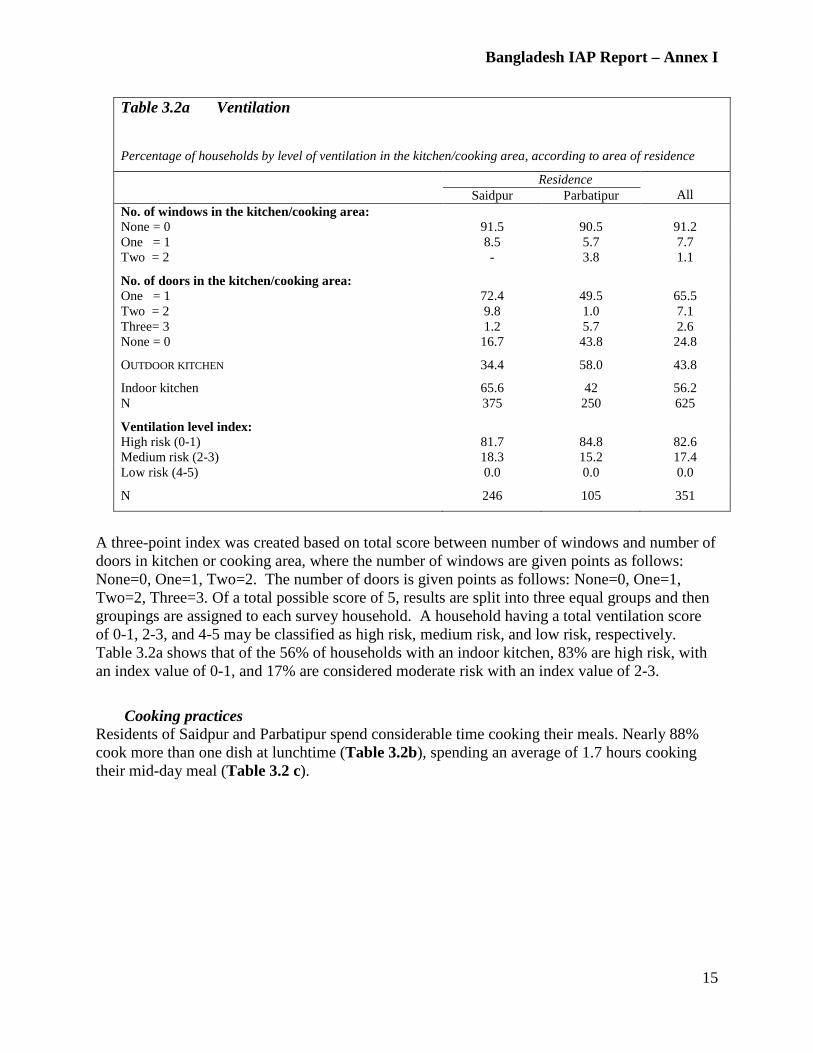
Bangladesh IAP Report – Annex I
15
Table 3.2a Ventilation
Percentage of households by level of ventilation in the kitchen/cooking area, according to area of residence
Residence All Saidpur Parbatipur
No. of windows in the kitchen/cooking area: None = 0 91.5 90.5 91.2 One = 1 8.5 5.7 7.7 Two = 2 - 3.8 1.1 No. of doors in the kitchen/cooking area: One = 1 72.4 49.5 65.5 Two = 2 9.8 1.0 7.1 Three= 3 1.2 5.7 2.6 None = 0 16.7 43.8 24.8 OUTDOOR KITCHEN 34.4 58.0 43.8
Indoor kitchen 65.6 42 56.2 N 375 250 625 Ventilation level index: High risk (0-1) 81.7 84.8 82.6 Medium risk (2-3) 18.3 15.2 17.4 Low risk (4-5) 0.0 0.0 0.0 N 246 105 351
A three-point index was created based on total score between number of windows and number of doors in kitchen or cooking area, where the number of windows are given points as follows: None=0, One=1, Two=2. The number of doors is given points as follows: None=0, One=1, Two=2, Three=3. Of a total possible score of 5, results are split into three equal groups and then groupings are assigned to each survey household. A household having a total ventilation score of 0-1, 2-3, and 4-5 may be classified as high risk, medium risk, and low risk, respectively. Table 3.2a shows that of the 56% of households with an indoor kitchen, 83% are high risk, with an index value of 0-1, and 17% are considered moderate risk with an index value of 2-3.
Cooking practices
Residents of Saidpur and Parbatipur spend considerable time cooking their meals. Nearly 88% cook more than one dish at lunchtime (Table 3.2b), spending an average of 1.7 hours cooking their mid-day meal (Table 3.2 c).
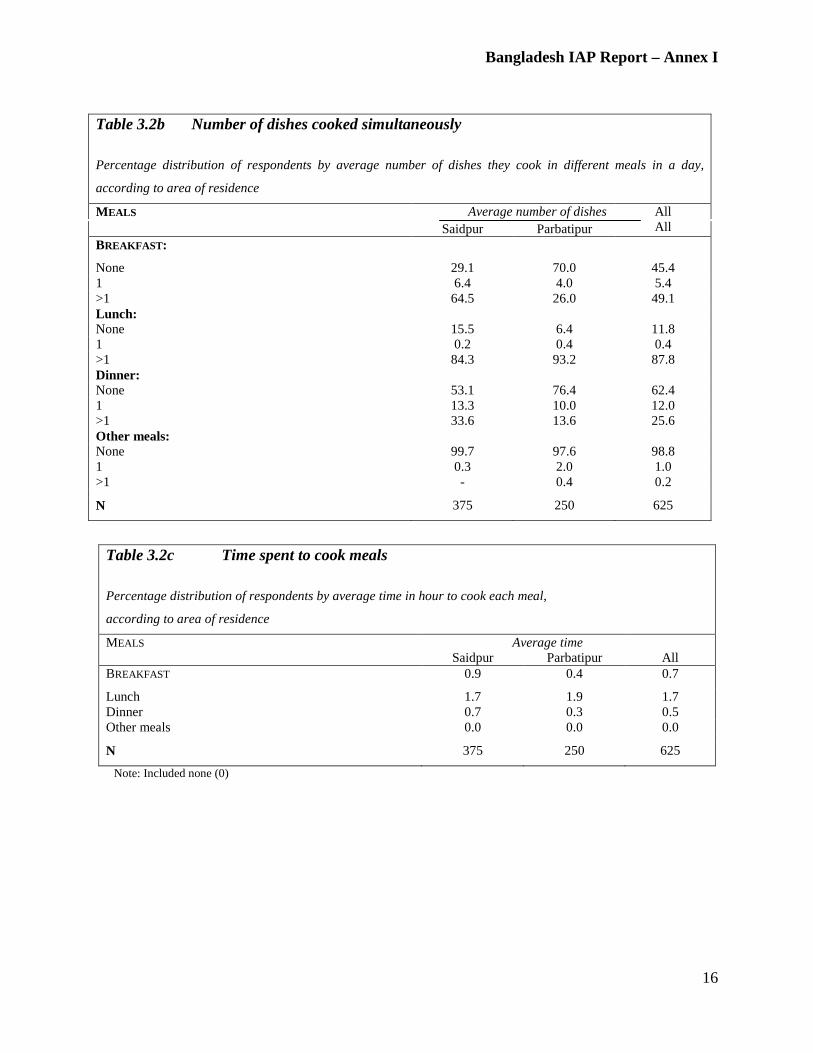
Bangladesh IAP Report – Annex I
16
Table 3.2b Number of dishes cooked simultaneously Percentage distribution of respondents by average number of dishes they cook in different meals in a day,
according to area of residence
MEALS Average number of dishes All All Saidpur Parbatipur
BREAKFAST:
None 29.1 70.0 45.4 1 6.4 4.0 5.4 >1 64.5 26.0 49.1 Lunch: None 15.5 6.4 11.8 1 0.2 0.4 0.4 >1 84.3 93.2 87.8 Dinner: None 53.1 76.4 62.4 1 13.3 10.0 12.0 >1 33.6 13.6 25.6 Other meals: None 99.7 97.6 98.8 1 0.3 2.0 1.0 >1 - 0.4 0.2 N 375 250 625
Note: Included none (0)
Table 3.2c Time spent to cook meals Percentage distribution of respondents by average time in hour to cook each meal,
according to area of residence
MEALS Average time All Saidpur Parbatipur
BREAKFAST 0.9 0.4 0.7
Lunch 1.7 1.9 1.7 Dinner 0.7 0.3 0.5 Other meals 0.0 0.0 0.0 N 375 250 625
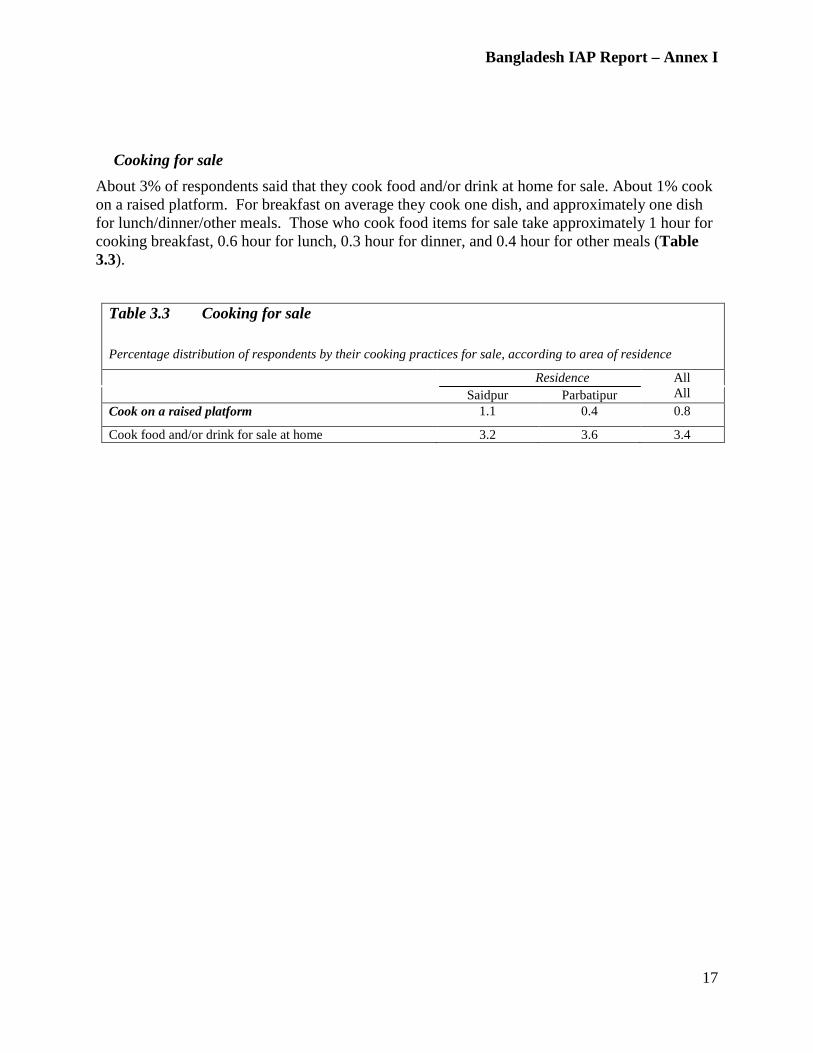
Bangladesh IAP Report – Annex I
17
Cooking for sale
About 3% of respondents said that they cook food and/or drink at home for sale. About 1% cook on a raised platform. For breakfast on average they cook one dish, and approximately one dish for lunch/dinner/other meals. Those who cook food items for sale take approximately 1 hour for cooking breakfast, 0.6 hour for lunch, 0.3 hour for dinner, and 0.4 hour for other meals (Table 3.3).
Table 3.3 Cooking for sale Percentage distribution of respondents by their cooking practices for sale, according to area of residence
Residence All All Saidpur Parbatipur
Cook on a raised platform 1.1 0.4 0.8
Cook food and/or drink for sale at home 3.2 3.6 3.4
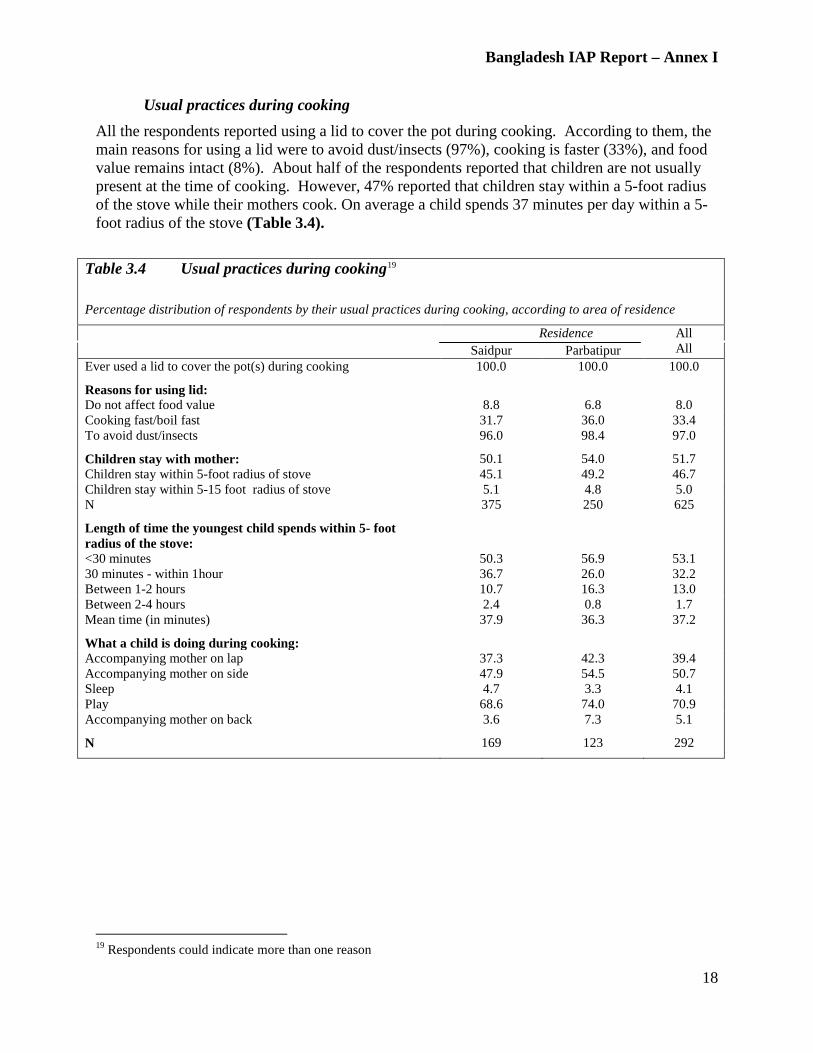
Bangladesh IAP Report – Annex I
18
Usual practices during cooking All the respondents reported using a lid to cover the pot during cooking. According to them, the main reasons for using a lid were to avoid dust/insects (97%), cooking is faster (33%), and food value remains intact (8%). About half of the respondents reported that children are not usually present at the time of cooking. However, 47% reported that children stay within a 5-foot radius of the stove while their mothers cook. On average a child spends 37 minutes per day within a 5-foot radius of the stove (Table 3.4).
Table 3.4 Usual practices during cooking19
Percentage distribution of respondents by their usual practices during cooking, according to area of residence
Residence All All Saidpur Parbatipur
Ever used a lid to cover the pot(s) during cooking 100.0 100.0 100.0 Reasons for using lid: Do not affect food value 8.8 6.8 8.0 Cooking fast/boil fast 31.7 36.0 33.4 To avoid dust/insects 96.0 98.4 97.0 Children stay with mother: 50.1 54.0 51.7 Children stay within 5-foot radius of stove 45.1 49.2 46.7 Children stay within 5-15 foot radius of stove 5.1 4.8 5.0 N 375 250 625 Length of time the youngest child spends within 5- foot radius of the stove:
<30 minutes 50.3 56.9 53.1 30 minutes - within 1hour 36.7 26.0 32.2 Between 1-2 hours 10.7 16.3 13.0 Between 2-4 hours 2.4 0.8 1.7 Mean time (in minutes) 37.9 36.3 37.2 What a child is doing during cooking: Accompanying mother on lap 37.3 42.3 39.4 Accompanying mother on side 47.9 54.5 50.7 Sleep 4.7 3.3 4.1 Play 68.6 74.0 70.9 Accompanying mother on back 3.6 7.3 5.1 N 169 123 292
19 Respondents could indicate more than one reason
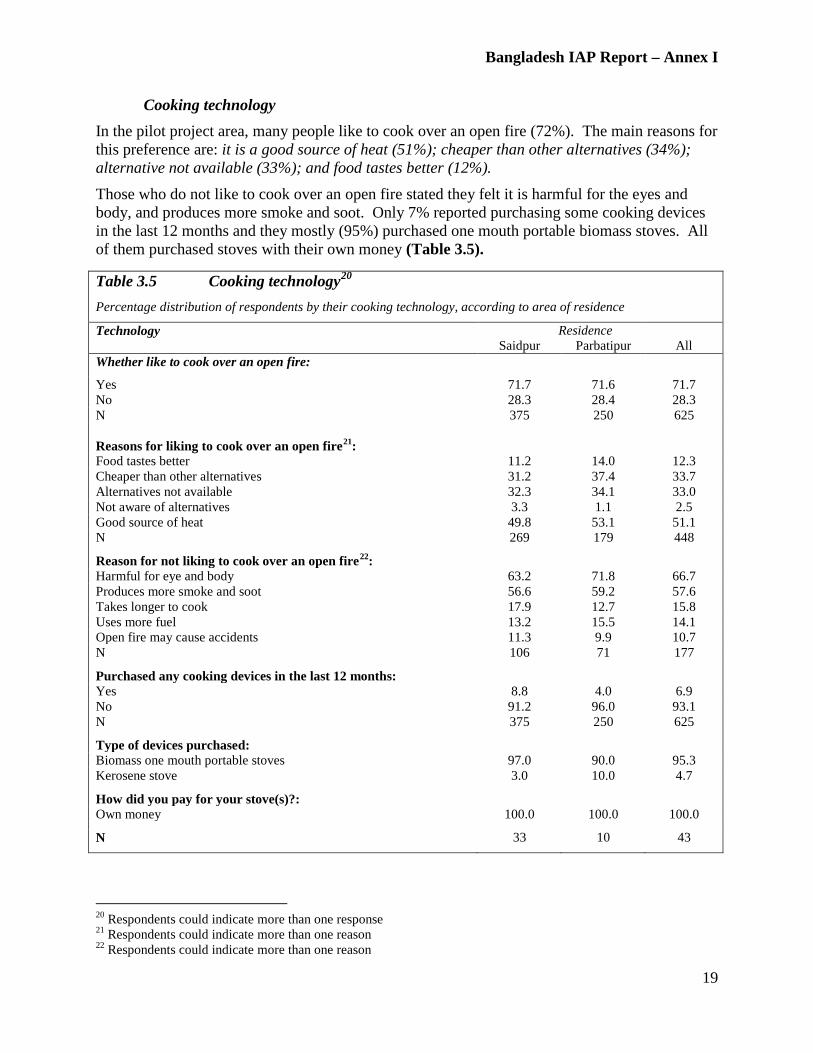
Bangladesh IAP Report – Annex I
19
Cooking technology In the pilot project area, many people like to cook over an open fire (72%). The main reasons for this preference are: it is a good source of heat (51%); cheaper than other alternatives (34%); alternative not available (33%); and food tastes better (12%). Those who do not like to cook over an open fire stated they felt it is harmful for the eyes and body, and produces more smoke and soot. Only 7% reported purchasing some cooking devices in the last 12 months and they mostly (95%) purchased one mouth portable biomass stoves. All of them purchased stoves with their own money (Table 3.5).
20 Respondents could indicate more than one response 21 Respondents could indicate more than one reason 22 Respondents could indicate more than one reason
Table 3.5 Cooking technology20 Percentage distribution of respondents by their cooking technology, according to area of residence
Technology Residence All Saidpur Parbatipur
Whether like to cook over an open fire:
Yes 71.7 71.6 71.7 No 28.3 28.4 28.3 N 375 250 625 Reasons for liking to cook over an open fire21
:
Food tastes better 11.2 14.0 12.3 Cheaper than other alternatives 31.2 37.4 33.7 Alternatives not available 32.3 34.1 33.0 Not aware of alternatives 3.3 1.1 2.5 Good source of heat 49.8 53.1 51.1 N 269 179 448 Reason for not liking to cook over an open fire22 : Harmful for eye and body 63.2 71.8 66.7 Produces more smoke and soot 56.6 59.2 57.6 Takes longer to cook 17.9 12.7 15.8 Uses more fuel 13.2 15.5 14.1 Open fire may cause accidents 11.3 9.9 10.7 N 106 71 177 Purchased any cooking devices in the last 12 months: Yes 8.8 4.0 6.9 No 91.2 96.0 93.1 N 375 250 625 Type of devices purchased: Biomass one mouth portable stoves 97.0 90.0 95.3 Kerosene stove 3.0 10.0 4.7 How did you pay for your stove(s)?: Own money 100.0 100.0 100.0 N 33 10 43
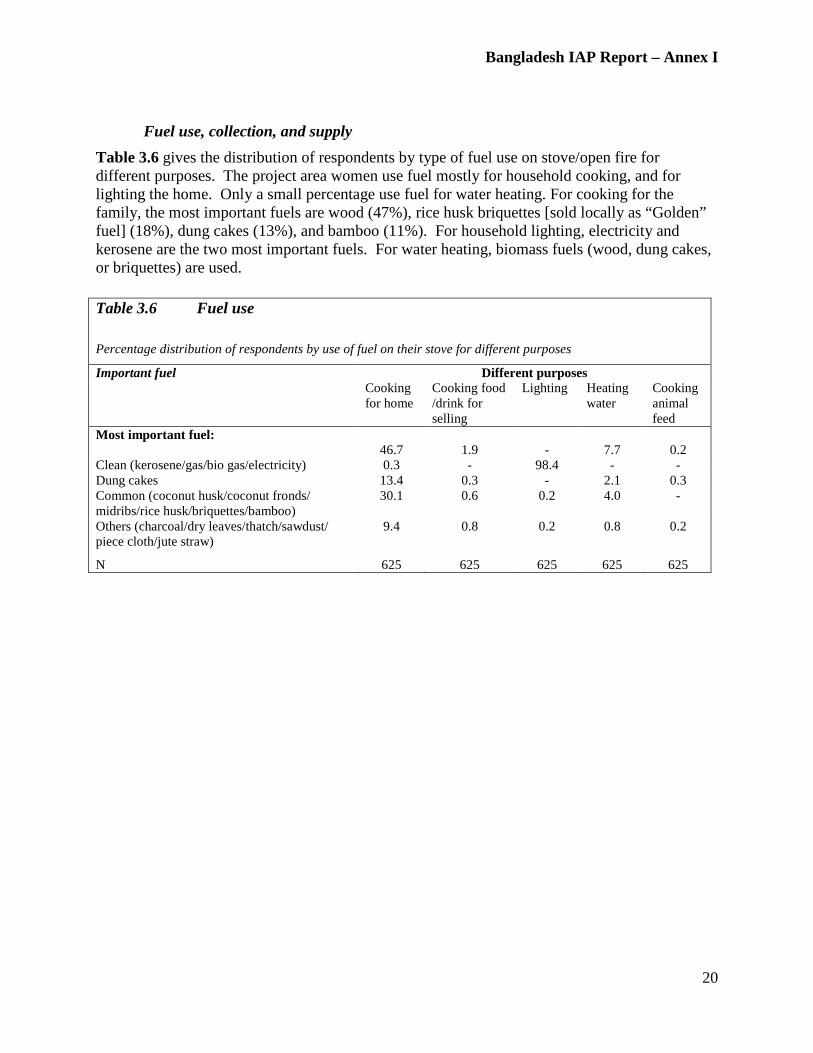
Bangladesh IAP Report – Annex I
20
Fuel use, collection, and supply Table 3.6 gives the distribution of respondents by type of fuel use on stove/open fire for different purposes. The project area women use fuel mostly for household cooking, and for lighting the home. Only a small percentage use fuel for water heating. For cooking for the family, the most important fuels are wood (47%), rice husk briquettes [sold locally as “Golden” fuel] (18%), dung cakes (13%), and bamboo (11%). For household lighting, electricity and kerosene are the two most important fuels. For water heating, biomass fuels (wood, dung cakes, or briquettes) are used.
Table 3.6 Fuel use Percentage distribution of respondents by use of fuel on their stove for different purposes
Important fuel Different purposes Cooking for home
Cooking food /drink for selling
Lighting Heating water
Cooking animal feed
Most important fuel: 46.7 1.9 - 7.7 0.2 Clean (kerosene/gas/bio gas/electricity) 0.3 - 98.4 - - Dung cakes 13.4 0.3 - 2.1 0.3 Common (coconut husk/coconut fronds/ midribs/rice husk/briquettes/bamboo)
30.1 0.6 0.2 4.0 -
Others (charcoal/dry leaves/thatch/sawdust/ piece cloth/jute straw)
9.4 0.8 0.2 0.8 0.2
N 625 625 625 625 625
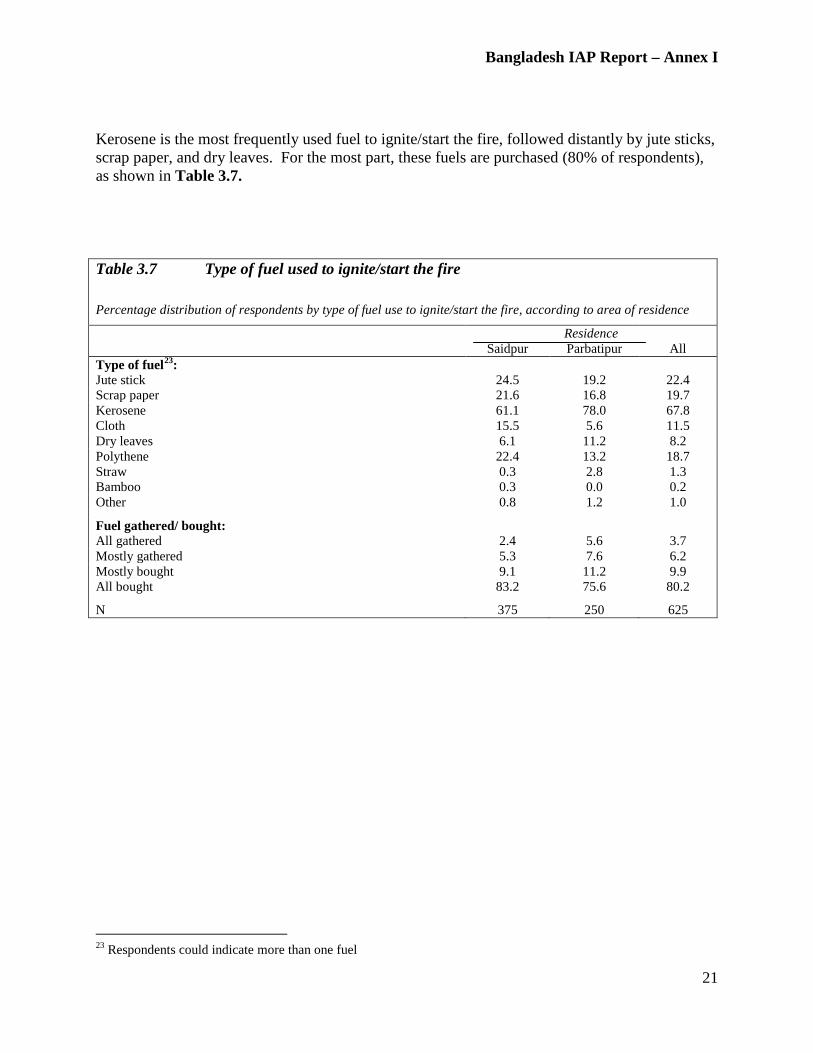
Bangladesh IAP Report – Annex I
21
Kerosene is the most frequently used fuel to ignite/start the fire, followed distantly by jute sticks, scrap paper, and dry leaves. For the most part, these fuels are purchased (80% of respondents), as shown in Table 3.7.
23 Respondents could indicate more than one fuel
Table 3.7 Type of fuel used to ignite/start the fire Percentage distribution of respondents by type of fuel use to ignite/start the fire, according to area of residence
Residence All Saidpur Parbatipur
Type of fuel23 : Jute stick 24.5 19.2 22.4 Scrap paper 21.6 16.8 19.7 Kerosene 61.1 78.0 67.8 Cloth 15.5 5.6 11.5 Dry leaves 6.1 11.2 8.2 Polythene 22.4 13.2 18.7 Straw 0.3 2.8 1.3 Bamboo 0.3 0.0 0.2 Other 0.8 1.2 1.0 Fuel gathered/ bought: All gathered 2.4 5.6 3.7 Mostly gathered 5.3 7.6 6.2 Mostly bought 9.1 11.2 9.9 All bought 83.2 75.6 80.2 N 375 250 625

Bangladesh IAP Report – Annex I
22
About one-third of respondents buy fuel every day, while nearly another third (32% ) buy once or twice weekly in the dry season. The practice is also similar in the rainy season. In the majority of cases, the fuel wood and biomass that they buy are dry (61%). About 37% reported that they always dry fuel before use, 34% usually dry, and 28% occasionally dry fuel wood/biomass before use. The fuel wood/other biomass used by respondents are usually dried in the sun (86%), as shown in Table 3.8.
Table 3.8 Gathering and use of fuel
Percentage distribution of respondents by process of gathering and drying fuel, according to area of residence
Residence All Saidpur Parbatipur
How often gather most important fuel during dry seasons: Every day 42.1 22.8 34.4 Every second day 14.7 9.6 12.6 Once or twice weekly 27.2 38.4 31.7 Less often 16.0 29.2 21.3 How often gather most important fuel during rainy seasons: Every day 42.9 21.2 34.2 Every second day 14.4 10.8 13.0 Once or twice weekly 25.9 38.4 30.9 Less often 16.8 29.6 21.9 How dry was the main fuel wood/ other biomass that was used: Not applicable 0.5 0.8 0.6 Dry 56.8 67.2 61.0 Damp 26.1 24.4 25.4 Wet 14.1 6.0 10.9 Green 2.4 1.6 2.1 How often the household dries fuel before use: Never 1.3 2.5 1.7 Occasionally 23.1 36.3 27.5 Usually 34.4 32.5 33.8 Always 41.3 28.8 37.1 How main fuel wood/other biomass are dried before use: In the sun 83.5 91.0 86.0 Hanging on top of open fire 8.2 3.8 6.8 Next to an open fire 7.0 5.1 6.4 In a closed shelter 1.3 - 0.8 N 158 78 236
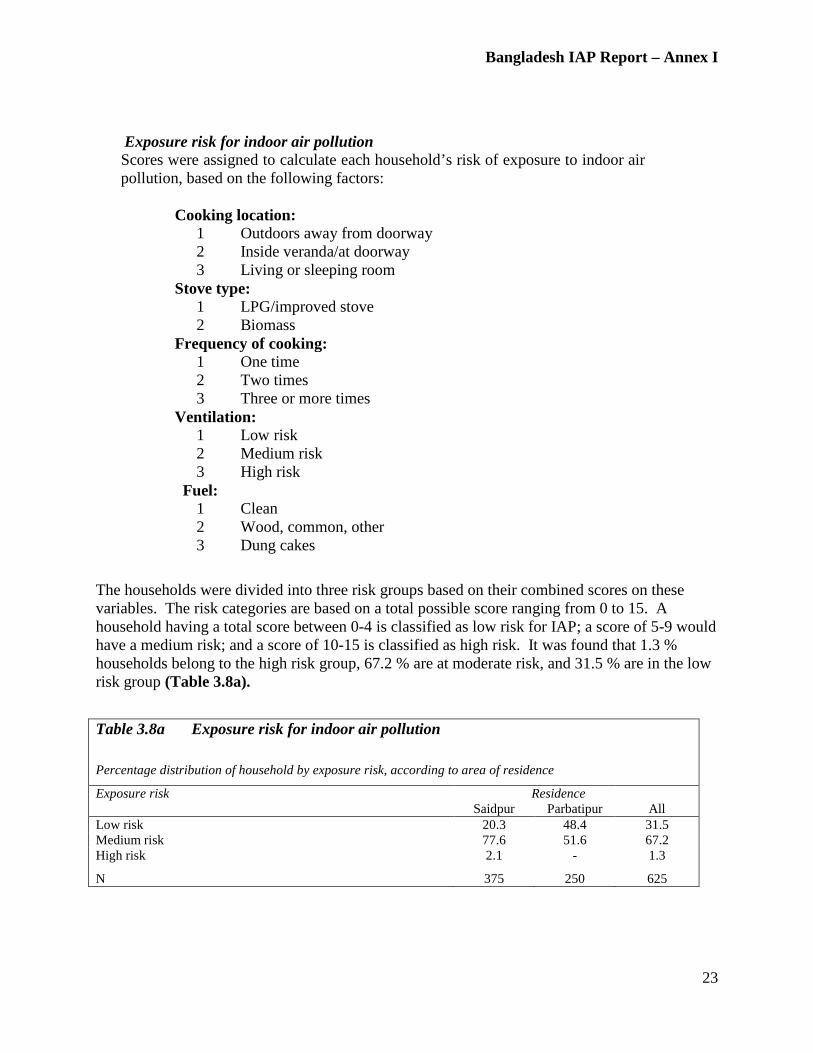
Bangladesh IAP Report – Annex I
23
Exposure risk for indoor air pollution Scores were assigned to calculate each household’s risk of exposure to indoor air pollution, based on the following factors: Cooking location: 1 Outdoors away from doorway 2 Inside veranda/at doorway 3 Living or sleeping room Stove type: 1 LPG/improved stove 2 Biomass Frequency of cooking: 1 One time 2 Two times 3 Three or more times Ventilation: 1 Low risk 2 Medium risk 3 High risk Fuel: 1 Clean 2 Wood, common, other 3 Dung cakes
The households were divided into three risk groups based on their combined scores on these variables. The risk categories are based on a total possible score ranging from 0 to 15. A household having a total score between 0-4 is classified as low risk for IAP; a score of 5-9 would have a medium risk; and a score of 10-15 is classified as high risk. It was found that 1.3 % households belong to the high risk group, 67.2 % are at moderate risk, and 31.5 % are in the low risk group (Table 3.8a).
Table 3.8a Exposure risk for indoor air pollution Percentage distribution of household by exposure risk, according to area of residence
Exposure risk Residence All Saidpur Parbatipur
Low risk 20.3 48.4 31.5 Medium risk 77.6 51.6 67.2 High risk 2.1 - 1.3 N 375 250 625
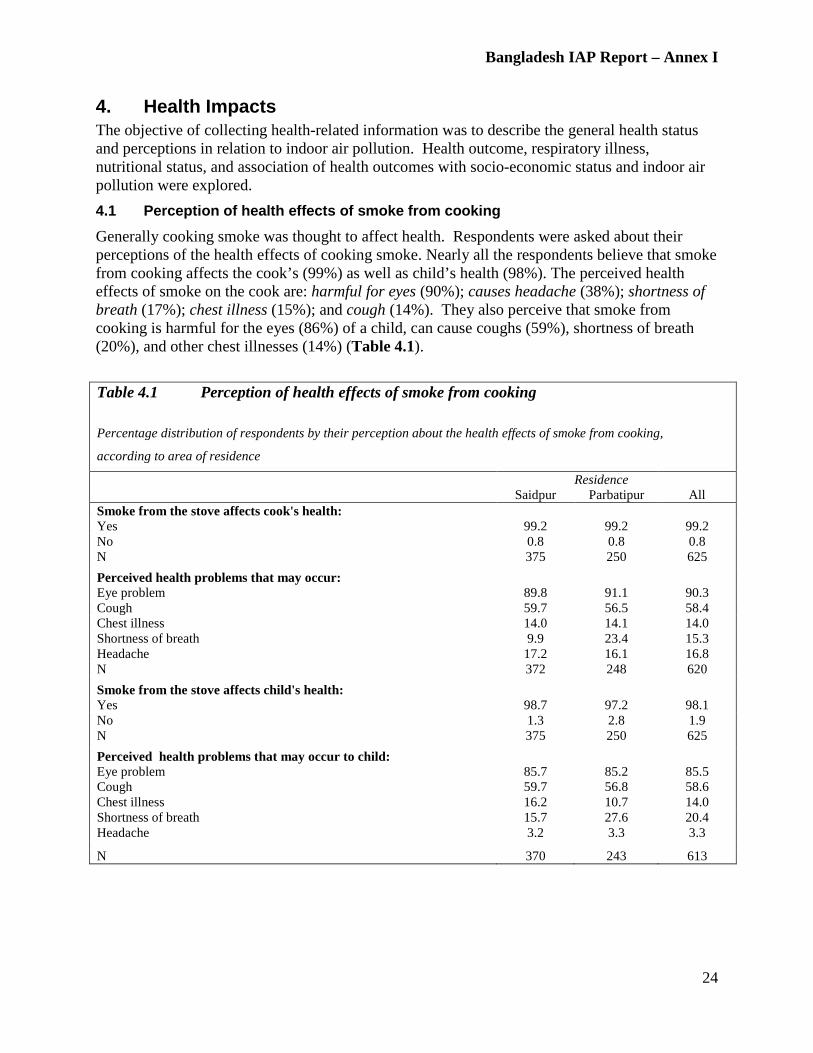
Bangladesh IAP Report – Annex I
24
4. Health Impacts The objective of collecting health-related information was to describe the general health status and perceptions in relation to indoor air pollution. Health outcome, respiratory illness, nutritional status, and association of health outcomes with socio-economic status and indoor air pollution were explored. 4.1 Perception of health effects of smoke from cooking
Generally cooking smoke was thought to affect health. Respondents were asked about their perceptions of the health effects of cooking smoke. Nearly all the respondents believe that smoke from cooking affects the cook’s (99%) as well as child’s health (98%). The perceived health effects of smoke on the cook are: harmful for eyes (90%); causes headache (38%); shortness of breath (17%); chest illness (15%); and cough (14%). They also perceive that smoke from cooking is harmful for the eyes (86%) of a child, can cause coughs (59%), shortness of breath (20%), and other chest illnesses (14%) (Table 4.1).
Table 4.1 Perception of health effects of smoke from cooking Percentage distribution of respondents by their perception about the health effects of smoke from cooking,
according to area of residence
Residence All Saidpur Parbatipur
Smoke from the stove affects cook's health: Yes 99.2 99.2 99.2 No 0.8 0.8 0.8 N 375 250 625 Perceived health problems that may occur: Eye problem 89.8 91.1 90.3 Cough 59.7 56.5 58.4 Chest illness 14.0 14.1 14.0 Shortness of breath 9.9 23.4 15.3 Headache 17.2 16.1 16.8 N 372 248 620 Smoke from the stove affects child's health: Yes 98.7 97.2 98.1 No 1.3 2.8 1.9 N 375 250 625 Perceived health problems that may occur to child: Eye problem 85.7 85.2 85.5 Cough 59.7 56.8 58.6 Chest illness 16.2 10.7 14.0 Shortness of breath 15.7 27.6 20.4 Headache 3.2 3.3 3.3 N 370 243 613
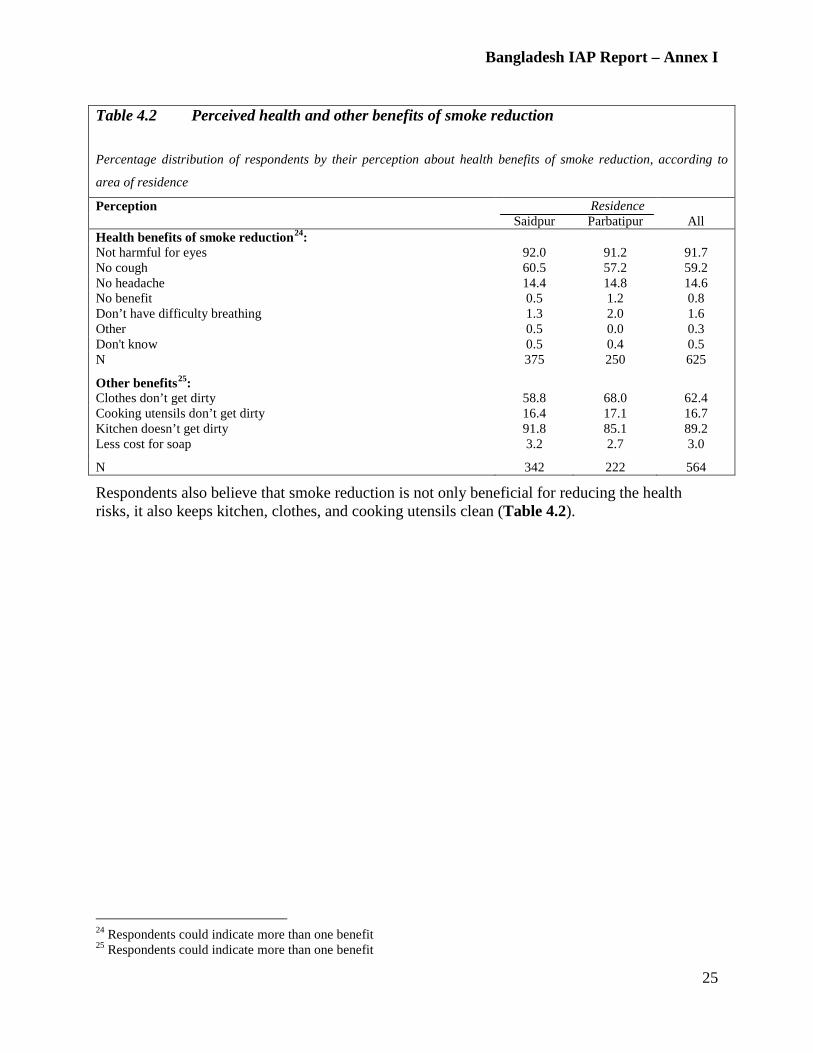
Bangladesh IAP Report – Annex I
25
Respondents also believe that smoke reduction is not only beneficial for reducing the health risks, it also keeps kitchen, clothes, and cooking utensils clean (Table 4.2).
24 Respondents could indicate more than one benefit 25 Respondents could indicate more than one benefit
Table 4.2 Perceived health and other benefits of smoke reduction
Percentage distribution of respondents by their perception about health benefits of smoke reduction, according to
area of residence
Perception Residence All Saidpur Parbatipur
Health benefits of smoke reduction24 : Not harmful for eyes 92.0 91.2 91.7 No cough 60.5 57.2 59.2 No headache 14.4 14.8 14.6 No benefit 0.5 1.2 0.8 Don’t have difficulty breathing 1.3 2.0 1.6 Other 0.5 0.0 0.3 Don't know 0.5 0.4 0.5 N 375 250 625 Other benefits25 : Clothes don’t get dirty 58.8 68.0 62.4 Cooking utensils don’t get dirty 16.4 17.1 16.7 Kitchen doesn’t get dirty 91.8 85.1 89.2 Less cost for soap 3.2 2.7 3.0 N 342 222 564

Bangladesh IAP Report – Annex I
26
Table 4.3 Measures taken to prevent/reduce exposure to smoke26
Percentage distribution of respondents who are bothered by cooking smoke, and measures taken to prevent/reduce
exposure from smoke, according to area of residence
Residence All All Saidpur Parbatipur
Bothered by smoke emitted when cooking: Yes 84.0 85.6 84.6 No 16.0 14.4 15.4 N 375 250 625 Measures taken to prevent/reduce exposure from smoke27 : Dried fuel before using 61.0 56.1 59.0 Cooked outside 5.4 4.2 4.9 Kept children away while cooking 0.3 2.3 1.1 Increased ventilation 3.5 4.2 3.8 Adopted cleaner fuel 12.1 12.1 12.1 Adopted cleaner stove 1.3 2.8 1.9 Installed chimney 0.0 0.5 0.2 Increased window size 0.6 0.0 0.4 Added windows 0.0 0.5 0.2 Increased door size 0.3 0.0 0.2 Constructed separate cooking area 1.6 2.3 1.9 Nothing 28.3 32.7 30.1 N 315 214 529
Table 4.3 shows that more than eight of ten respondents are bothered by smoke emitted from cooking. About 30% did not take any measure to prevent or reduce exposure from smoke. However, 59% reported that they dry fuel before use to reduce smoke, and 12% adopted cleaner fuel such as kerosene, gas, biogas, and electricity.
26 Respondents could indicate more than one measure 27 Respondents could indicate more than one measure

Bangladesh IAP Report – Annex I
27
Respondents were prompted with a few specific questions about the possible effects of kitchen smoke. It is evident from Table 4.4 that the majority do not have clear knowledge. Only about one-third believe that kitchen smoke is responsible for respiratory diseases like pneumonia, and believe acute respiratory illness may cause the death of children. About 40% believe that kitchen smoke is responsible for long-term lung problems in adults. The main sources of this knowledge are neighbor, health worker, personal experience, and ward health committee members (Table 4.4).
Table 4.4 Knowledge of effects of kitchen smoke illness Percentage distribution of respondents by knowledge about the effects of kitchen smoke on certain illnesses and sources
of knowledge, according to area of residence
Residence All All Saidpur Parbatipur
Knowledge about the effects of kitchen smoke on certain illness: Respiratory diseases like pneumonia in children 26.7 39.2 31.7 Death of children and infants due to acute respiratory illnesses 29.1 38.8 33.0 Long -term lung problems in adults 38.9 47.6 42.4 N 375 250 625 Sources of knowledge: Personal experience 19.5 27.5 23.2 Family 6.5 5.6 6.1 Neighbor 27.8 28.2 28.0 Village doctor 8.3 12.0 10.0 Television 11.8 13.4 12.5 Health worker 16.0 34.5 24.4 Health center 11.2 7.0 9.3 Newspapers 0.6 0.0 0.3 Volunteer 7.1 4.9 6.1 Member of ward health committee 26.6 13.4 20.6 By reading a book 1.8 0.7 1.3 N 169 142 311
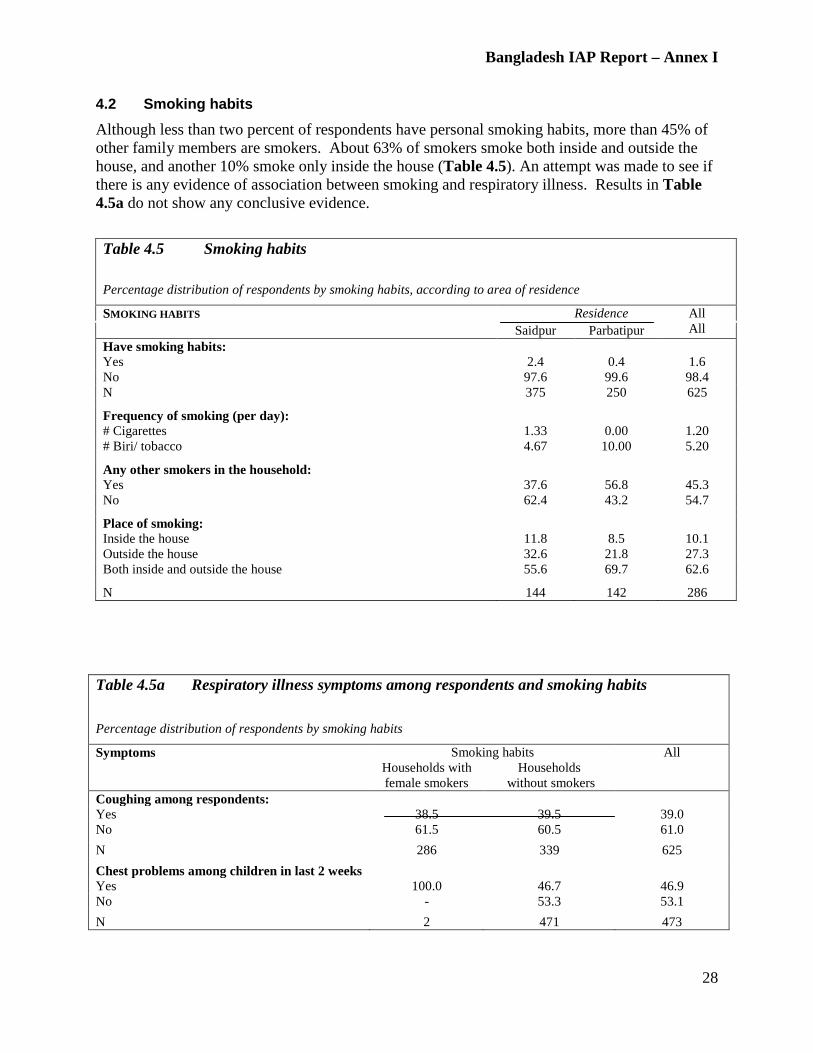
Bangladesh IAP Report – Annex I
28
4.2 Smoking habits
Although less than two percent of respondents have personal smoking habits, more than 45% of other family members are smokers. About 63% of smokers smoke both inside and outside the house, and another 10% smoke only inside the house (Table 4.5). An attempt was made to see if there is any evidence of association between smoking and respiratory illness. Results in Table 4.5a do not show any conclusive evidence.
Table 4.5 Smoking habits Percentage distribution of respondents by smoking habits, according to area of residence
SMOKING HABITS Residence All All Saidpur Parbatipur
Have smoking habits: Yes 2.4 0.4 1.6 No 97.6 99.6 98.4 N 375 250 625 Frequency of smoking (per day): # Cigarettes 1.33 0.00 1.20 # Biri/ tobacco 4.67 10.00 5.20 Any other smokers in the household: Yes 37.6 56.8 45.3 No 62.4 43.2 54.7 Place of smoking: Inside the house 11.8 8.5 10.1 Outside the house 32.6 21.8 27.3 Both inside and outside the house 55.6 69.7 62.6 N 144 142 286
Table 4.5a Respiratory illness symptoms among respondents and smoking habits
Percentage distribution of respondents by smoking habits
Symptoms Smoking habits All Households with female smokers
Households without smokers
Coughing among respondents: Yes 38.5 39.5 39.0 No 61.5 60.5 61.0 N 286 339 625 Chest problems among children in last 2 weeks Yes 100.0 46.7 46.9 No - 53.3 53.1 N 2 471 473
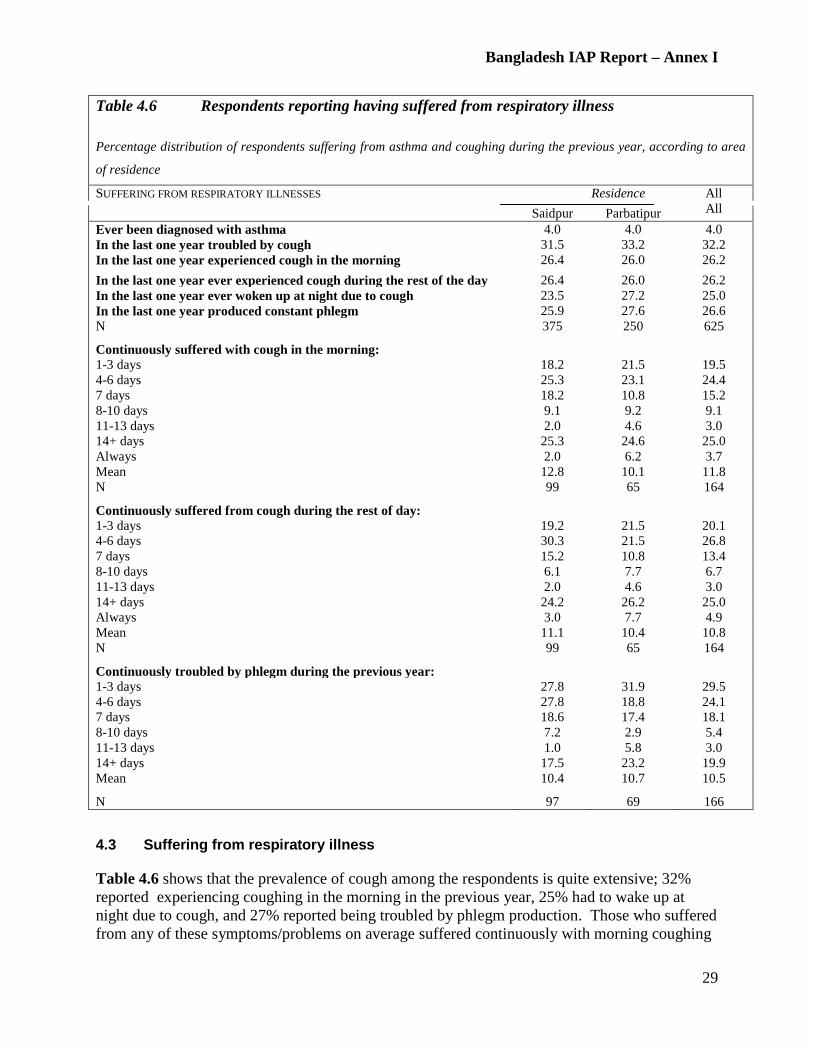
Bangladesh IAP Report – Annex I
29
Table 4.6 Respondents reporting having suffered from respiratory illness Percentage distribution of respondents suffering from asthma and coughing during the previous year, according to area
of residence
SUFFERING FROM RESPIRATORY ILLNESSES Residence All All Saidpur Parbatipur
Ever been diagnosed with asthma 4.0 4.0 4.0 In the last one year troubled by cough 31.5 33.2 32.2 In the last one year experienced cough in the morning 26.4 26.0 26.2 In the last one year ever experienced cough during the rest of the day 26.4 26.0 26.2 In the last one year ever woken up at night due to cough 23.5 27.2 25.0 In the last one year produced constant phlegm 25.9 27.6 26.6 N 375 250 625 Continuously suffered with cough in the morning: 1-3 days 18.2 21.5 19.5 4-6 days 25.3 23.1 24.4 7 days 18.2 10.8 15.2 8-10 days 9.1 9.2 9.1 11-13 days 2.0 4.6 3.0 14+ days 25.3 24.6 25.0 Always 2.0 6.2 3.7 Mean 12.8 10.1 11.8 N 99 65 164 Continuously suffered from cough during the rest of day: 1-3 days 19.2 21.5 20.1 4-6 days 30.3 21.5 26.8 7 days 15.2 10.8 13.4 8-10 days 6.1 7.7 6.7 11-13 days 2.0 4.6 3.0 14+ days 24.2 26.2 25.0 Always 3.0 7.7 4.9 Mean 11.1 10.4 10.8 N 99 65 164 Continuously troubled by phlegm during the previous year: 1-3 days 27.8 31.9 29.5 4-6 days 27.8 18.8 24.1 7 days 18.6 17.4 18.1 8-10 days 7.2 2.9 5.4 11-13 days 1.0 5.8 3.0 14+ days 17.5 23.2 19.9 Mean 10.4 10.7 10.5 N 97 69 166 4.3 Suffering from respiratory illness
Table 4.6 shows that the prevalence of cough among the respondents is quite extensive; 32% reported experiencing coughing in the morning in the previous year, 25% had to wake up at night due to cough, and 27% reported being troubled by phlegm production. Those who suffered from any of these symptoms/problems on average suffered continuously with morning coughing

Bangladesh IAP Report – Annex I
30
for 12 days, and 11 days for coughing during the day. The mean number of days they were continuously troubled with phlegm was 11 days. The usual color of phlegm was either white or brown (Table 4.7).
Table 4.7 Suffering with phlegm Percentage distribution of respondents suffering with phlegm in the chest, according to area of residence
Residence All All Saidpur Parbatipur
Usual color of phlegm: White 49.5 44.9 47.6 Light green 7.2 13.0 9.6 Dark green 2.1 4.3 3.0 Brown 40.2 33.3 37.3 Green with streaks of blood 1.0 1.4 1.2 Red - 2.9 1.2 N 97 69 166
About 69% of those who suffered from asthma, cough, or phlegm reported they had sought treatment. More than half of them (52%) sought treatment at a local pharmacy, 30% were treated by a village doctor, and 11% visited a government health facility (Table 4.7a).
Experiencing respiratory illness in the last two weeks
About one-fifth of adult respondents (21%) experienced one or more symptoms of respiratory illness in the last two weeks, including, for example, wheezing or whistling breath, wheezing
Table 4.7a Respiratory treatment and sources Percentage distribution of respondents who suffered from asthma, cough, or phlegm and received treatment and
sources of treatment, according to area of residence
Residence All Saidpur Parbatipur
Receive any treatment: Yes 68.6 68.7 68.7 No 31.4 31.3 31.3 N 118 83 201 Treatment sought from: Religious healer - 1.8 0.7 Village doctor 24.7 38.6 30.4 Local pharmacy 56.8 45.6 52.2 NGO health center 1.2 1.8 1.4 Government health center 11.1 10.5 10.9 Homeopathy 4.9 1.8 3.6 Professional doctor 1.2 - 0.7 N 81 57 138
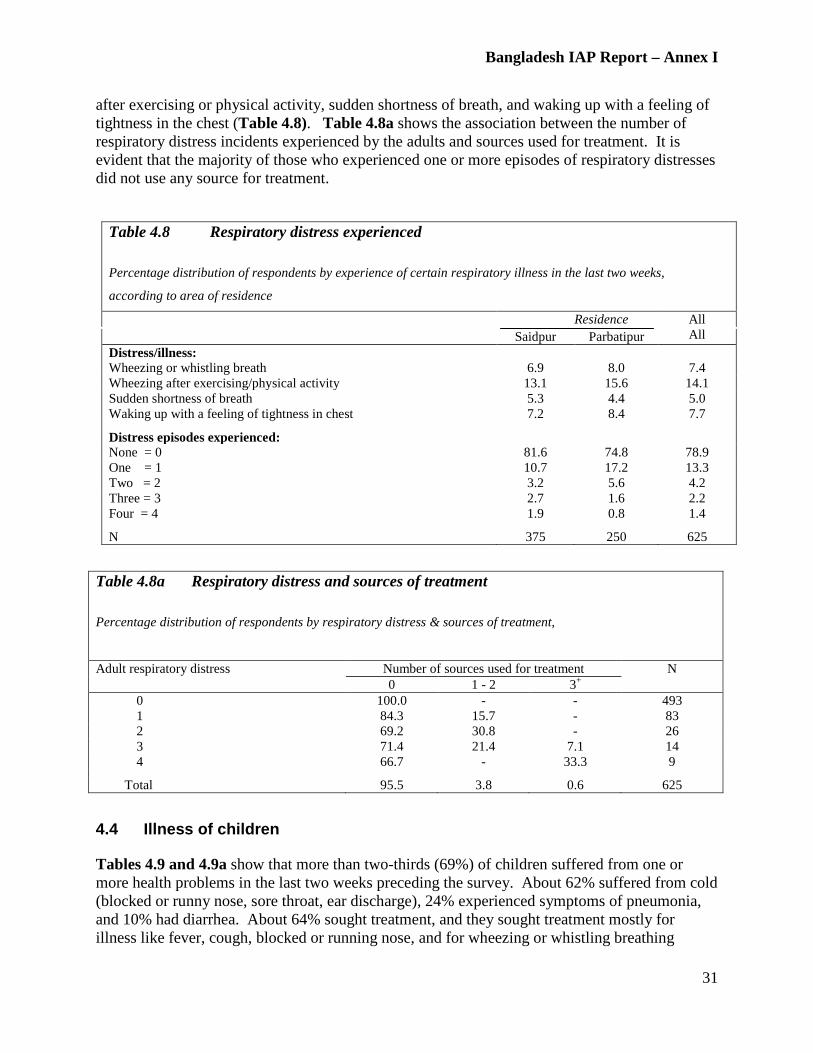
Bangladesh IAP Report – Annex I
31
after exercising or physical activity, sudden shortness of breath, and waking up with a feeling of tightness in the chest (Table 4.8). Table 4.8a shows the association between the number of respiratory distress incidents experienced by the adults and sources used for treatment. It is evident that the majority of those who experienced one or more episodes of respiratory distresses did not use any source for treatment.
Table 4.8 Respiratory distress experienced Percentage distribution of respondents by experience of certain respiratory illness in the last two weeks,
according to area of residence
Residence All All Saidpur Parbatipur
Distress/illness: Wheezing or whistling breath 6.9 8.0 7.4 Wheezing after exercising/physical activity 13.1 15.6 14.1 Sudden shortness of breath 5.3 4.4 5.0 Waking up with a feeling of tightness in chest 7.2 8.4 7.7 Distress episodes experienced: None = 0 81.6 74.8 78.9 One = 1 10.7 17.2 13.3 Two = 2 3.2 5.6 4.2 Three = 3 2.7 1.6 2.2 Four = 4 1.9 0.8 1.4 N 375 250 625
4.4 Illness of children
Tables 4.9 and 4.9a show that more than two-thirds (69%) of children suffered from one or more health problems in the last two weeks preceding the survey. About 62% suffered from cold (blocked or runny nose, sore throat, ear discharge), 24% experienced symptoms of pneumonia, and 10% had diarrhea. About 64% sought treatment, and they sought treatment mostly for illness like fever, cough, blocked or running nose, and for wheezing or whistling breathing
Table 4.8a Respiratory distress and sources of treatment Percentage distribution of respondents by respiratory distress & sources of treatment,
Adult respiratory distress Number of sources used for treatment N 0 1 - 2 3+
0 100.0 - - 493 1 84.3 15.7 - 83 2 69.2 30.8 - 26 3 71.4 21.4 7.1 14 4 66.7 - 33.3 9 Total 95.5 3.8 0.6 625
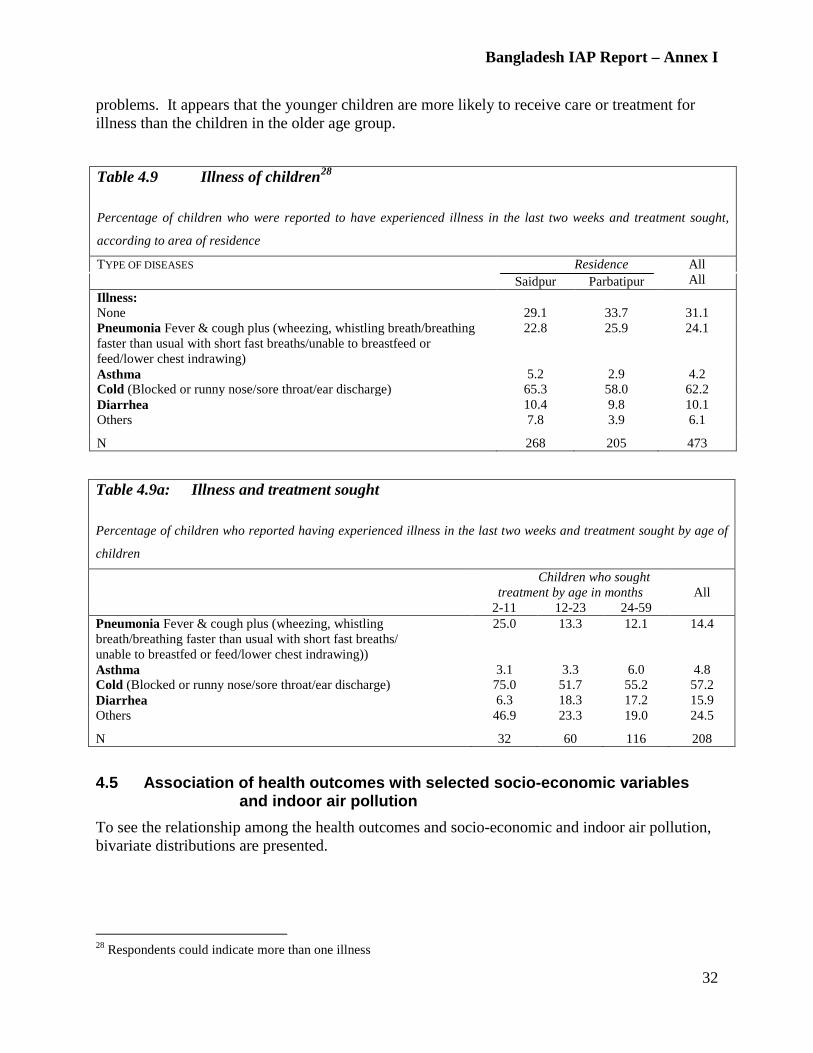
Bangladesh IAP Report – Annex I
32
problems. It appears that the younger children are more likely to receive care or treatment for illness than the children in the older age group.
Table 4.9 Illness of children28
Percentage of children who were reported to have experienced illness in the last two weeks and treatment sought,
according to area of residence
TYPE OF DISEASES Residence All All Saidpur Parbatipur
Illness: None 29.1 33.7 31.1 Pneumonia Fever & cough plus (wheezing, whistling breath/breathing faster than usual with short fast breaths/unable to breastfeed or feed/lower chest indrawing)
22.8 25.9 24.1
Asthma 5.2 2.9 4.2 Cold (Blocked or runny nose/sore throat/ear discharge) 65.3 58.0 62.2 Diarrhea 10.4 9.8 10.1 Others 7.8 3.9 6.1 N 268 205 473
4.5 Association of health outcomes with selected socio-economic variables and indoor air pollution To see the relationship among the health outcomes and socio-economic and indoor air pollution, bivariate distributions are presented.
28 Respondents could indicate more than one illness
Table 4.9a: Illness and treatment sought Percentage of children who reported having experienced illness in the last two weeks and treatment sought by age of
children
Children who sought treatment by age in months
All
2-11 12-23 24-59 Pneumonia Fever & cough plus (wheezing, whistling breath/breathing faster than usual with short fast breaths/ unable to breastfed or feed/lower chest indrawing))
25.0 13.3 12.1 14.4
Asthma 3.1 3.3 6.0 4.8 Cold (Blocked or runny nose/sore throat/ear discharge) 75.0 51.7 55.2 57.2 Diarrhea 6.3 18.3 17.2 15.9 Others 46.9 23.3 19.0 24.5 N 32 60 116 208
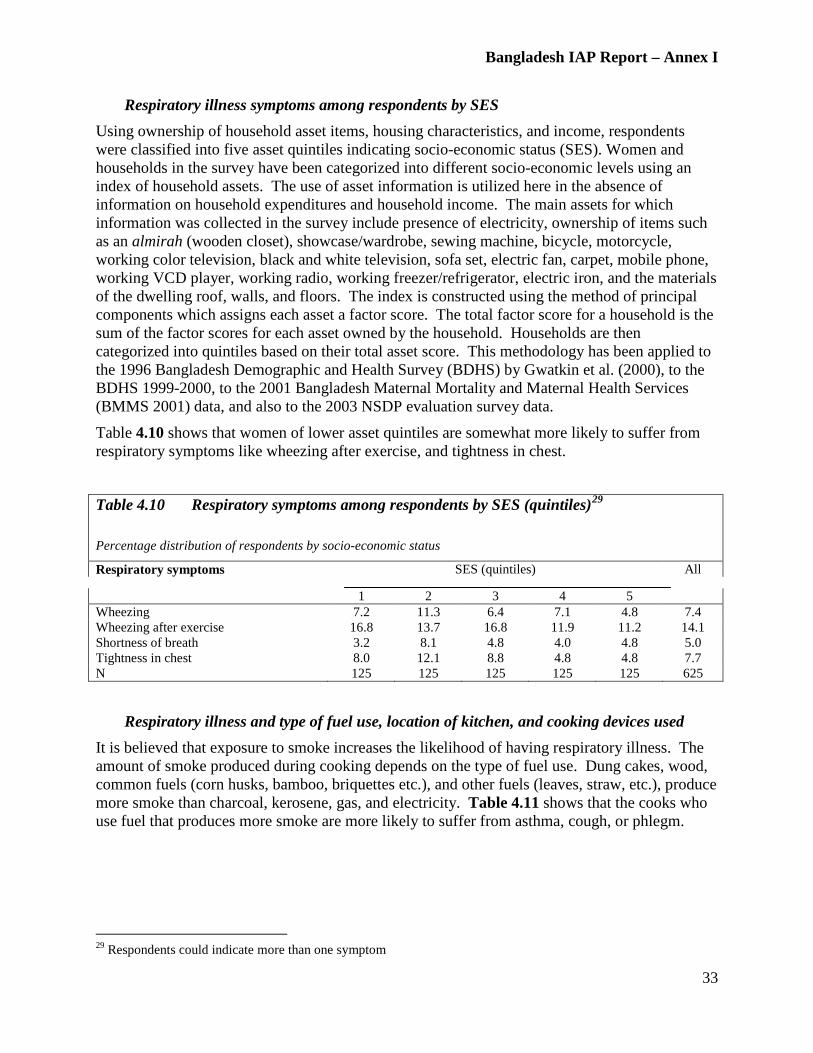
Bangladesh IAP Report – Annex I
33
Respiratory illness symptoms among respondents by SES Using ownership of household asset items, housing characteristics, and income, respondents were classified into five asset quintiles indicating socio-economic status (SES). Women and households in the survey have been categorized into different socio-economic levels using an index of household assets. The use of asset information is utilized here in the absence of information on household expenditures and household income. The main assets for which information was collected in the survey include presence of electricity, ownership of items such as an almirah (wooden closet), showcase/wardrobe, sewing machine, bicycle, motorcycle, working color television, black and white television, sofa set, electric fan, carpet, mobile phone, working VCD player, working radio, working freezer/refrigerator, electric iron, and the materials of the dwelling roof, walls, and floors. The index is constructed using the method of principal components which assigns each asset a factor score. The total factor score for a household is the sum of the factor scores for each asset owned by the household. Households are then categorized into quintiles based on their total asset score. This methodology has been applied to the 1996 Bangladesh Demographic and Health Survey (BDHS) by Gwatkin et al. (2000), to the BDHS 1999-2000, to the 2001 Bangladesh Maternal Mortality and Maternal Health Services (BMMS 2001) data, and also to the 2003 NSDP evaluation survey data.
Table 4.10 shows that women of lower asset quintiles are somewhat more likely to suffer from respiratory symptoms like wheezing after exercise, and tightness in chest.
Table 4.10 Respiratory symptoms among respondents by SES (quintiles)29
Percentage distribution of respondents by socio-economic status
Respiratory symptoms SES (quintiles) All
1 2 3 4 5 Wheezing 7.2 11.3 6.4 7.1 4.8 7.4 Wheezing after exercise 16.8 13.7 16.8 11.9 11.2 14.1 Shortness of breath 3.2 8.1 4.8 4.0 4.8 5.0 Tightness in chest 8.0 12.1 8.8 4.8 4.8 7.7 N 125 125 125 125 125 625
Respiratory illness and type of fuel use, location of kitchen, and cooking devices used It is believed that exposure to smoke increases the likelihood of having respiratory illness. The amount of smoke produced during cooking depends on the type of fuel use. Dung cakes, wood, common fuels (corn husks, bamboo, briquettes etc.), and other fuels (leaves, straw, etc.), produce more smoke than charcoal, kerosene, gas, and electricity. Table 4.11 shows that the cooks who use fuel that produces more smoke are more likely to suffer from asthma, cough, or phlegm.
29 Respondents could indicate more than one symptom
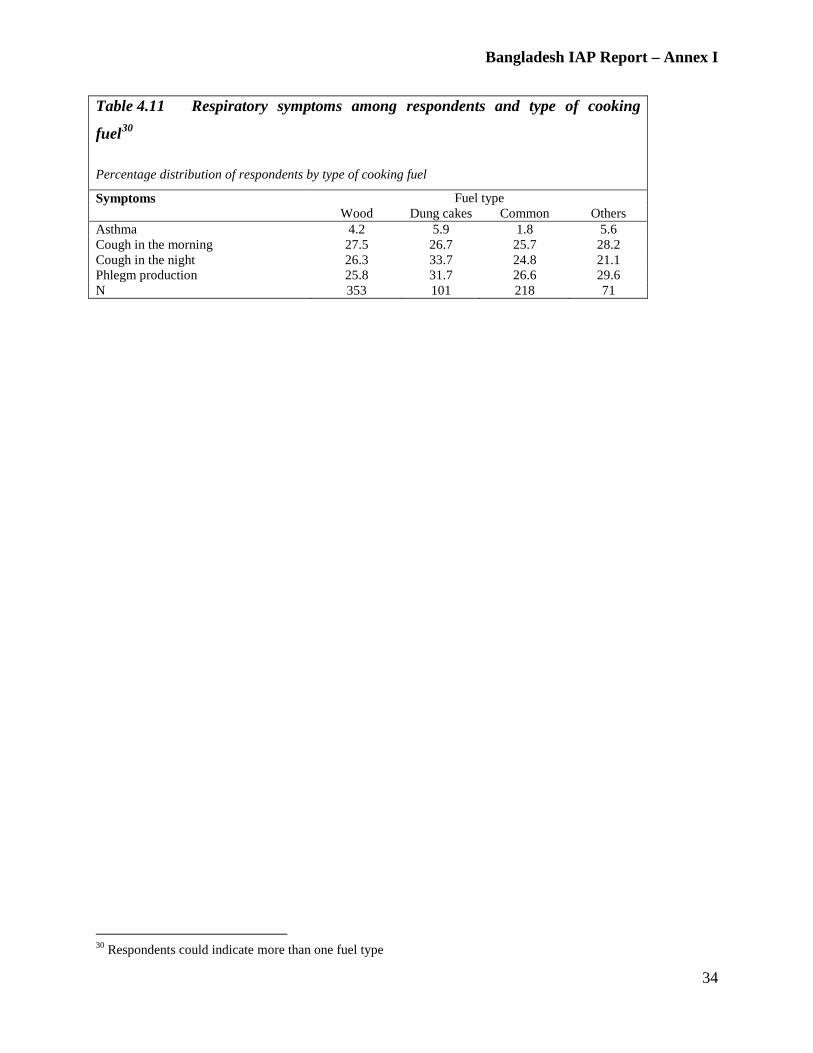
Bangladesh IAP Report – Annex I
34
30 Respondents could indicate more than one fuel type
Table 4.11 Respiratory symptoms among respondents and type of cooking
fuel30
Percentage distribution of respondents by type of cooking fuel
Symptoms Fuel type Wood Dung cakes Common Others
Asthma 4.2 5.9 1.8 5.6 Cough in the morning 27.5 26.7 25.7 28.2 Cough in the night 26.3 33.7 24.8 21.1 Phlegm production 25.8 31.7 26.6 29.6 N 353 101 218 71
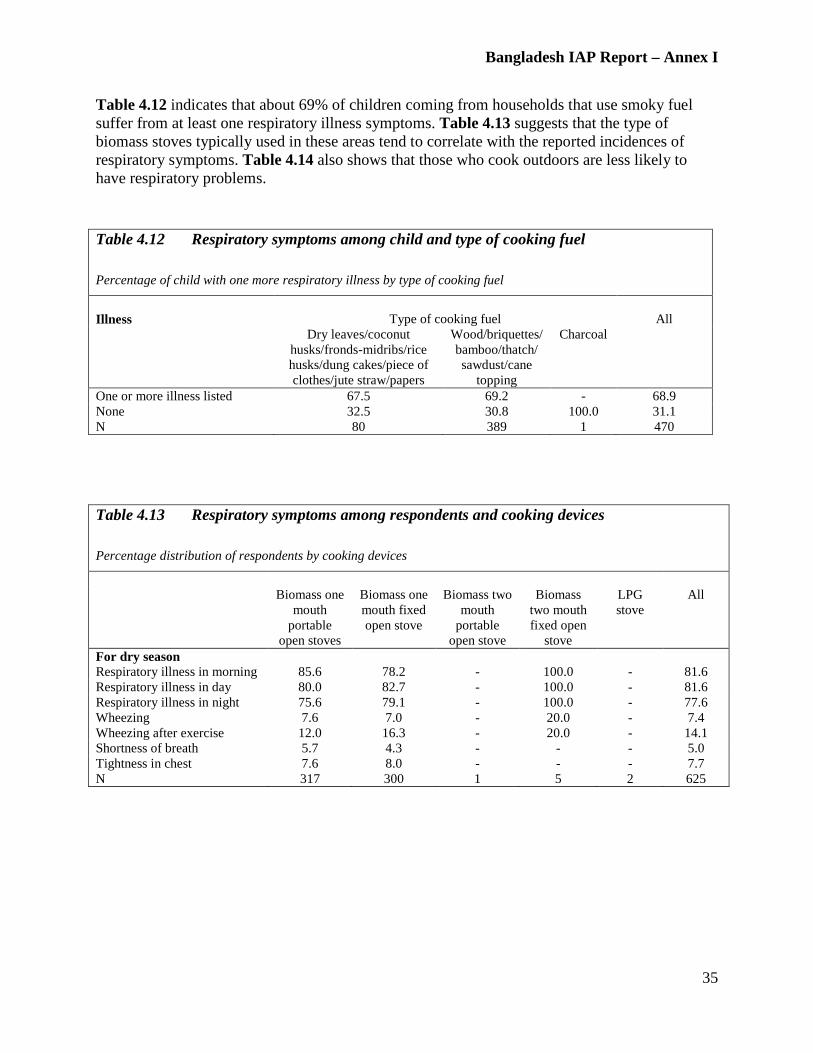
Bangladesh IAP Report – Annex I
35
Table 4.12 indicates that about 69% of children coming from households that use smoky fuel suffer from at least one respiratory illness symptoms. Table 4.13 suggests that the type of biomass stoves typically used in these areas tend to correlate with the reported incidences of respiratory symptoms. Table 4.14 also shows that those who cook outdoors are less likely to have respiratory problems.
Table 4.12 Respiratory symptoms among child and type of cooking fuel Percentage of child with one more respiratory illness by type of cooking fuel
Illness
Type of cooking fuel
All
Dry leaves/coconut husks/fronds-midribs/rice husks/dung cakes/piece of clothes/jute straw/papers
Wood/briquettes/bamboo/thatch/ sawdust/cane
topping
Charcoal
One or more illness listed 67.5 69.2 - 68.9 None 32.5 30.8 100.0 31.1 N 80 389 1 470
Table 4.13 Respiratory symptoms among respondents and cooking devices Percentage distribution of respondents by cooking devices
All Biomass one
mouth portable
open stoves
Biomass one mouth fixed open stove
Biomass two mouth
portable open stove
Biomass two mouth fixed open
stove
LPG stove
For dry season Respiratory illness in morning 85.6 78.2 - 100.0 - 81.6 Respiratory illness in day 80.0 82.7 - 100.0 - 81.6 Respiratory illness in night 75.6 79.1 - 100.0 - 77.6 Wheezing 7.6 7.0 - 20.0 - 7.4 Wheezing after exercise 12.0 16.3 - 20.0 - 14.1 Shortness of breath 5.7 4.3 - - - 5.0 Tightness in chest 7.6 8.0 - - - 7.7 N 317 300 1 5 2 625
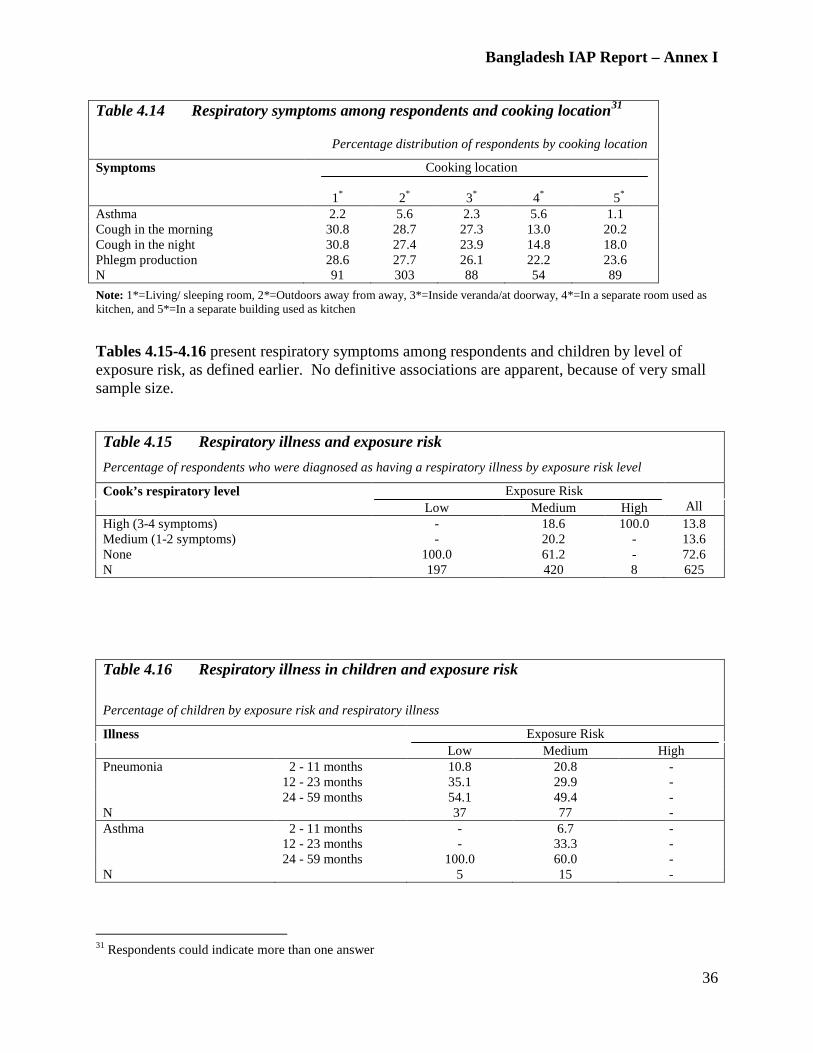
Bangladesh IAP Report – Annex I
36
Note: 1*=Living/ sleeping room, 2*=Outdoors away from away, 3*=Inside veranda/at doorway, 4*=In a separate room used as kitchen, and 5*=In a separate building used as kitchen Tables 4.15-4.16 present respiratory symptoms among respondents and children by level of exposure risk, as defined earlier. No definitive associations are apparent, because of very small sample size.
Table 4.15 Respiratory illness and exposure risk
Percentage of respondents who were diagnosed as having a respiratory illness by exposure risk level
Cook’s respiratory level Exposure Risk All Low Medium High
High (3-4 symptoms) - 18.6 100.0 13.8 Medium (1-2 symptoms) - 20.2 - 13.6 None 100.0 61.2 - 72.6 N 197 420 8 625
Table 4.16 Respiratory illness in children and exposure risk Percentage of children by exposure risk and respiratory illness
Illness Exposure Risk Low Medium High
Pneumonia 2 - 11 months 10.8 20.8 - 12 - 23 months 35.1 29.9 - 24 - 59 months 54.1 49.4 - N 37 77 - Asthma 2 - 11 months - 6.7 - 12 - 23 months - 33.3 - 24 - 59 months 100.0 60.0 - N 5 15 -
31 Respondents could indicate more than one answer
Table 4.14 Respiratory symptoms among respondents and cooking location31
Percentage distribution of respondents by cooking location
Symptoms Cooking location
1*
2*
3*
4*
5* Asthma 2.2 5.6 2.3 5.6 1.1 Cough in the morning 30.8 28.7 27.3 13.0 20.2 Cough in the night 30.8 27.4 23.9 14.8 18.0 Phlegm production 28.6 27.7 26.1 22.2 23.6 N 91 303 88 54 89
Bangladesh IAP Report – Annex II
1
ANNEX II – Baseline Survey Questionnaire

Bangladesh IAP Report – Annex II
2
Annex II. Baseline Survey Questionnaire
General Information
1 District Nilphamari 1 Dinajpur 2
2 Municipality Saidpur 1 Parbatipur 2 3 Ward
4 Cluster
5 Household ID Number
6 Date of interview
Day Month 2005 7 Name and code of enumerator
Name:__________________________
8 Status of interview Completed 1 Incomplete 2 9 Name of Household Head
Name:__________________________ 10 ID no of Respondent
11 Primary or secondary cook Primary cook 1 Secondary cook 2
12 Selected for IAP monitoring Yes 1 No 2
Bangladesh IAP Report – Annex II
3
Individual Survey Consent Form Survey on Household Energy Practices, Indoor Air Pollution & Health in Bangladesh
Dear Participant,
You have been randomly selected to be part of this survey and we would like to interview you. This survey is conducted by Concern Worldwide and Winrock International and will be carried out by enumerators from _____________ [Area], as staff or consultants to Concern and Winrock. This survey is currently taking place in Saidpur and Parbatipur municipalities. The information you provide will only be used to understand the cooking practices of households, the level of awareness about associated health effects, and the health of children in households. The interview will take approximately 90 minutes. I will ask you questions about: --Some personal details, --Your cooking and fuel use practices, --Any cooking related health problems you may have experienced and treatment you may have received, How you think you can address various cooking and health related issues. You will be visited again soon in order to check on the health of the youngest child in the household. This visit will take approximately 30 minutes. When we visit again we would like to: --Ask about any illnesses of the youngest child, --Measure the weight and height of the youngest child, --Take 2-3 drops of blood from the finger-tip of the youngest child It is very safe to take 2-3 drops of blood from the finger and will not harm your child in any way. If you agree, we would like to visit to ask about the health of your child two more times next year. If your child is very ill when we visit, we will arrange for him or her to see a doctor. The information you provide is totally confidential and will not be disclosed to anyone. It will only be used for research purposes. Your name, address, and other personal information will not be recorded in the questionnaire, and only a code will be used to connect your name and your answers without identifying you.
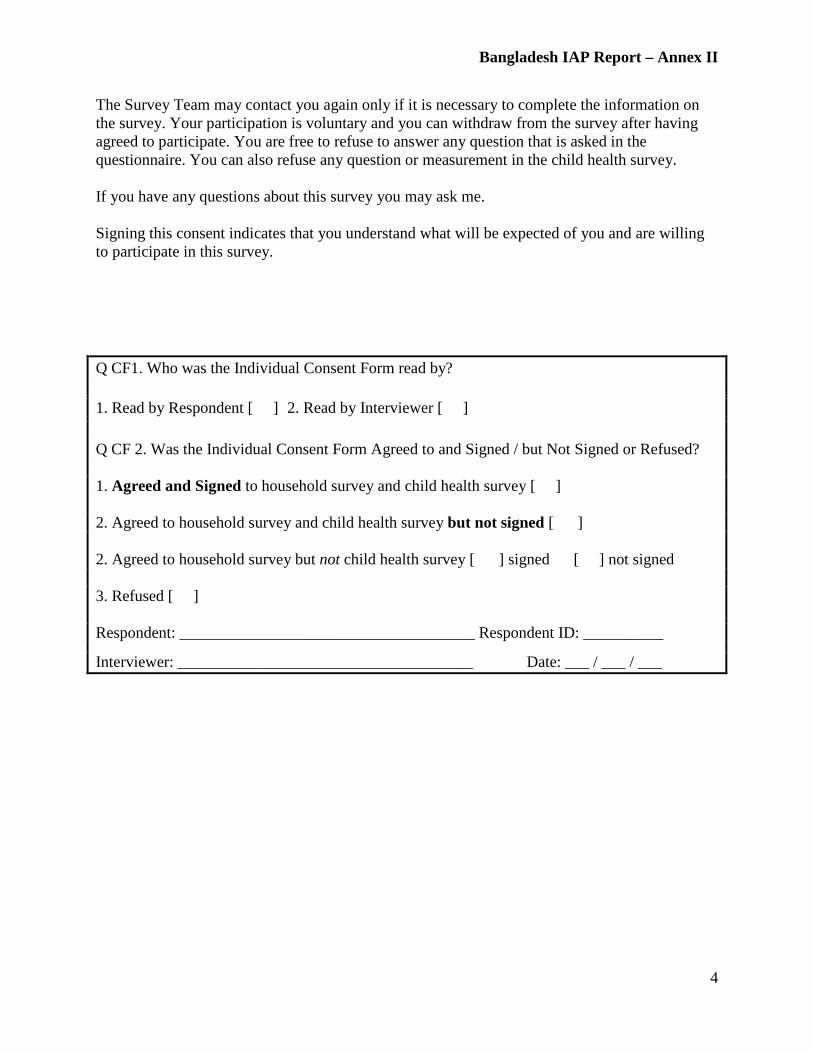
Bangladesh IAP Report – Annex II
4
The Survey Team may contact you again only if it is necessary to complete the information on the survey. Your participation is voluntary and you can withdraw from the survey after having agreed to participate. You are free to refuse to answer any question that is asked in the questionnaire. You can also refuse any question or measurement in the child health survey. If you have any questions about this survey you may ask me. Signing this consent indicates that you understand what will be expected of you and are willing to participate in this survey.
Q CF1. Who was the Individual Consent Form read by?
1. Read by Respondent [ ] 2. Read by Interviewer [ ]
Q CF 2. Was the Individual Consent Form Agreed to and Signed / but Not Signed or Refused? 1. Agreed and Signed to household survey and child health survey [ ] 2. Agreed to household survey and child health survey but not signed [ ] 2. Agreed to household survey but not child health survey [ ] signed [ ] not signed 3. Refused [ ] Respondent: _____________________________________ Respondent ID: __________
Interviewer: _____________________________________ Date: ___ / ___ / ___

Bangladesh IAP Report – Annex II
5
GENERAL INFORMATION
GENERAL INSTRUCTIONS: This survey attempts to assess the household energy patterns and heath perceptions by the household inhabitants, specifically the Primary Cook who is directly involved in stove related activities. Since there may be more than one cook in the household, the enumerator should determine who is the Primary Cook and who is the Secondary Cook. The Primary Cook should be the respondent (unless he/she is not available in which case, the Secondary Cook may answer the questions). This survey also captures information about children's nutritional status and presence of acute lower respiratory illness.
Starting time: Hour Minute
NO. QUESTIONS AND FILTERS CODING CATEGORIES SKIP 13. Age of respondent:
Years old .....................................
14. Main language of respondent: Bengali ......................................1 Urdu ...........................................2 Others_____________ ..............6 (Specify)
15. Respondent's religion?
Islam ..........................................1 Hindu .........................................2 Christian ....................................3 Others_____________ ..............6 (Specify)
A. The Household
Please list the age and sex of each household member, including their relationship to the respondent. (Please note that ID# 1 should be designated to the respondent. For age of household members and relationship with respondent, enter the appropriate code from the list provided below. )
ID # Name Sex Age of Household Members including children (IF LESS THAN 1 YEAR WRITE 00)
Relationship with Respondent **
1 2 3 4 5 01
Respon- dent
Male ......... 1 Female ..... 2
Year ........................ ...............................
02 Male ......... 1 Female ..... 2
Year ........................ ...............................
03 Male ......... 1 Female ..... 2
Year ........................ ...............................
04 Male ......... 1
Year ........................
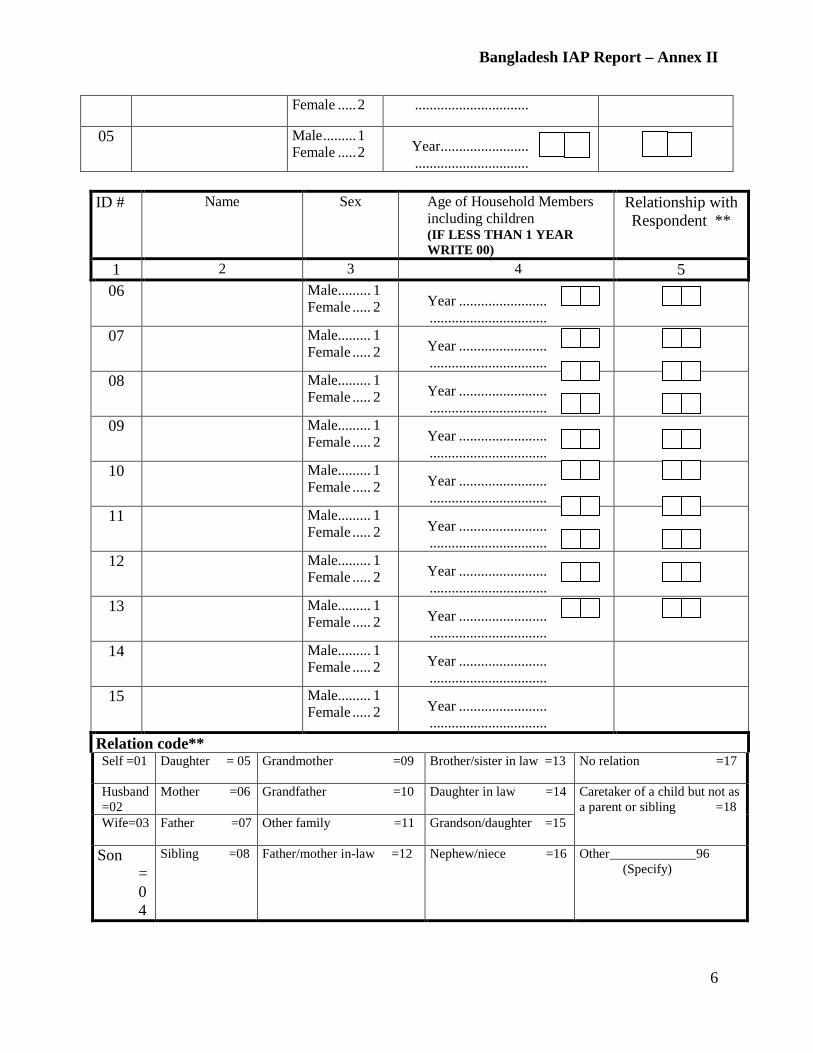
Bangladesh IAP Report – Annex II
6
Female ..... 2 ...............................
05 Male ......... 1 Female ..... 2
Year ........................ ...............................
ID # Name Sex Age of Household Members including children (IF LESS THAN 1 YEAR WRITE 00)
Relationship with Respondent **
1 2 3 4 5 06 Male ......... 1
Female ..... 2
Year ........................ ................................
07 Male ......... 1 Female ..... 2
Year ........................ ................................
08 Male ......... 1 Female ..... 2
Year ........................ ................................
09 Male ......... 1 Female ..... 2
Year ........................ ................................
10 Male ......... 1 Female ..... 2
Year ........................ ................................
11 Male ......... 1 Female ..... 2
Year ........................ ................................
12 Male ......... 1 Female ..... 2
Year ........................ ................................
13 Male ......... 1 Female ..... 2
Year ........................ ................................
14 Male ......... 1 Female ..... 2
Year ........................ ................................
15 Male ......... 1 Female ..... 2
Year ........................ ................................
Relation code** Self =01 Daughter = 05 Grandmother =09 Brother/sister in law =13 No relation =17
Husband =02
Mother =06 Grandfather =10 Daughter in law =14 Caretaker of a child but not as a parent or sibling =18
Wife=03 Father =07 Other family =11 Grandson/daughter =15
Son =04
Sibling =08 Father/mother in-law =12 Nephew/niece =16 Other_____________96 (Specify)

Bangladesh IAP Report – Annex II
7
NO. QUESTIONS AND FILTERS CODING CATEGORIES SKIP A4. What is the education of respondent? No schooling ................................ 01
Primary, incomplete ..................... 02 Primary, completed ...................... 03 Secondary, incomplete ................. 04 Secondary, completed . ...……….05 Vocational, incomplete ................ 06 Vocational, completed .................. 07 College/univ, incomplete ............. 08 College/univ, completed .............. 09
A6
A5. Can the respondent read, write or both? Can read ......................................... 1 Can write ........................................ 2 Both read and write ........................ 3 Cannot read or write ....................... 4
A6. Does your household own the following items? (Please read out)
Items Yes No
Almirah ......................... 1 2 Showcase/Wardrobe ...... 1 2 Sewing machine ............ 1 2 Watch/clock ................... 1 2 Bicycle ........................... 1 2 Motorcycle .................... 1 2 Electricity ...................... 1 2 Colored television(working) .............
1 2
Black and white television(Working) ......
1 2
Fan ................................. 1 2 Wooden chair ................ 1 2 Wooden table ................ 1 2 Sofa set .......................... 1 2 Floor mat ....................... 1 2 Carpet ............................ 1 2
NO. QUESTIONS AND FILTERS CODING CATEGORIES SKIP A2. Is the Respondent also the head of the
household? Yes .................................................. 1 No ................................................... 2
A4
A3. What is the education of household head? No schooling ................................. 01 Primary, incomplete ..................... 02 Primary, completed ...................... 03 Secondary, incomplete ................. 04 Secondary, completed .. ...……….05 Vocational, incomplete ................. 06 Vocational, completed .................. 07 College/univ, incomplete .............. 08 College/univ, completed ............... 09

Bangladesh IAP Report – Annex II
8
NO. QUESTIONS AND FILTERS CODING CATEGORIES SKIP Mobile phone ................ 1 2
VCD player(Working) .. 1 2 Radio(Working) ............ 1 2 Computer(Working) ...... 1 2 Refrigerator/freezer (Working) ......................
1 2
Bed/cot .......................... 1 2 Shelves .......................... 1 2 Iron ................................ 1 2 Rickshaw ....................... 1 2
A7. Who usually decide on all major purchases in the household?
Self ................................................. 1 Husband .......................................... 2 Father-in-law .................................. 3 Mother-in-law ................................ 4 Others_____________ ................... 6 (Specify)
A8. List the main income earners in your household and their occupation. (Interviewer: Identify the earning members and select the occupation from the list.)
Name ID # Occupation code* Other___________
(Specify) Other___________
(Specify)
Other___________ (Specify)
Other___________ (Specify)
Other___________ (Specify)
Other___________ (Specify)
*Occupation code Rickshaw/cart/v
an driver 01
Hawker/petty trader
05
Social worker 10 Teacher 14
Auto rickshaw driver
02
Store owner 06 Household helper
11 Border business ___________ (Specify)
15
Day laborer(Unskilled)
03
Truck driver 07 Government employee
12 Homemaker 16
Day laborer(Skilled)
04 Railway worker 08 Overseas worker 13 Unemployed 17
Health worker 09
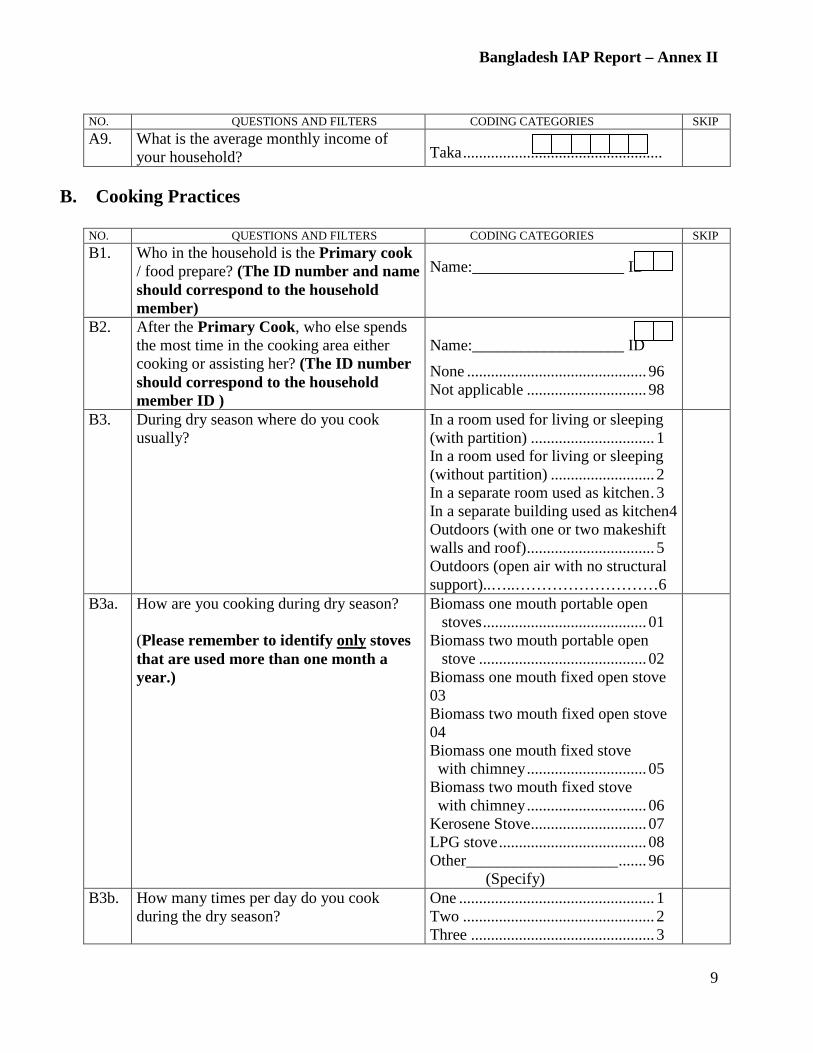
Bangladesh IAP Report – Annex II
9
NO. QUESTIONS AND FILTERS CODING CATEGORIES SKIP A9. What is the average monthly income of
your household? Taka ..................................................
B. Cooking Practices
NO. QUESTIONS AND FILTERS CODING CATEGORIES SKIP B1. Who in the household is the Primary cook
/ food prepare? (The ID number and name should correspond to the household member)
Name:___________________ ID
B2. After the Primary Cook, who else spends the most time in the cooking area either cooking or assisting her? (The ID number should correspond to the household member ID )
Name:___________________ ID
None ............................................. 96 Not applicable .............................. 98
B3. During dry season where do you cook usually?
In a room used for living or sleeping (with partition) ............................... 1 In a room used for living or sleeping (without partition) .......................... 2 In a separate room used as kitchen . 3 In a separate building used as kitchen4 Outdoors (with one or two makeshift walls and roof) ................................ 5 Outdoors (open air with no structural support)..…..………………………6
B3a. How are you cooking during dry season? (Please remember to identify only
Biomass one mouth portable open stoves ......................................... 01 Biomass two mouth portable open stove .......................................... 02 Biomass one mouth fixed open stove 03 Biomass two mouth fixed open stove 04 Biomass one mouth fixed stove with chimney .............................. 05 Biomass two mouth fixed stove with chimney .............................. 06 Kerosene Stove ............................. 07 LPG stove ..................................... 08 Other___________________ ....... 96 (Specify)
stoves that are used more than one month a year.)
B3b. How many times per day do you cook during the dry season?
One ................................................. 1 Two ................................................ 2 Three .............................................. 3
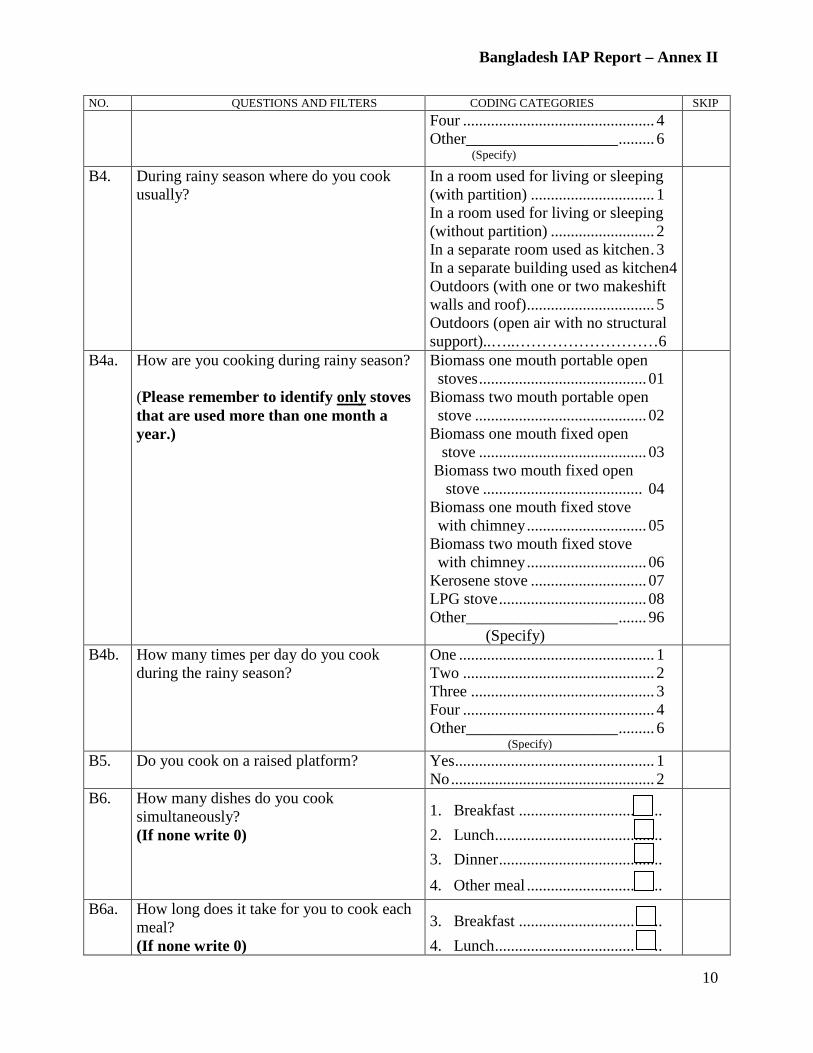
Bangladesh IAP Report – Annex II
10
NO. QUESTIONS AND FILTERS CODING CATEGORIES SKIP Four ................................................ 4 Other___________________ ......... 6 (Specify)
B4. During rainy season where do you cook
usually? In a room used for living or sleeping (with partition) ............................... 1 In a room used for living or sleeping (without partition) .......................... 2 In a separate room used as kitchen . 3 In a separate building used as kitchen4 Outdoors (with one or two makeshift walls and roof) ................................ 5 Outdoors (open air with no structural support)..…..………………………6
B4a. How are you cooking during rainy season?
(Please remember to identify only
Biomass one mouth portable open stoves .......................................... 01 Biomass two mouth portable open stove ........................................... 02 Biomass one mouth fixed open stove .......................................... 03 Biomass two mouth fixed open stove ........................................ 04 Biomass one mouth fixed stove with chimney .............................. 05 Biomass two mouth fixed stove with chimney .............................. 06 Kerosene stove ............................. 07 LPG stove ..................................... 08 Other___________________ ....... 96 (Specify)
stoves that are used more than one month a year.)
B4b. How many times per day do you cook during the rainy season?
One ................................................. 1 Two ................................................ 2 Three .............................................. 3 Four ................................................ 4 Other___________________ ......... 6 (Specify)
B5. Do you cook on a raised platform? Yes .................................................. 1 No ................................................... 2
B6. How many dishes do you cook simultaneously? (If none write 0)
1. Breakfast ............................. ..
2. Lunch ..........................................
3. Dinner .........................................
4. Other meal ........................... ..
B6a. How long does it take for you to cook each
meal? (If none write 0)
3. Breakfast ............................. ..
4. Lunch ................................... ..

Bangladesh IAP Report – Annex II
11
NO. QUESTIONS AND FILTERS CODING CATEGORIES SKIP (Record the appropriate code from the list provided.)
3. Dinner .........................................
4. Other meal ..................................
Time code: <1 Hour = 1 1 -2 Hours =
2 3-5 Hours = 3
>5 Hours = 4
Other ______= 6 (Specify)
B7. Do you cook food and/or drink for sale at home?
Yes .................................................. 1 No ................................................... 2
B8
B7a. How many dishes do you cook simultaneously for sale? (If none write 0)
1. Breakfast for sale ........................
2. Lunch for sale .............................
3. Dinner for sale ............................
4. Other meal for sale ......... .......
B7b. How long does it take for you to cook each meal? (If none write 0)
(Record the appropriate code from the list provided.)
1. Breakfast for sale ............ .......
2. Lunch for sale ................. .......
3. Dinner for sale ................ .......
4. Other meal for sale ......... .......
Time code:
<1 Hour = 1 1 -2 Hours = 2
3-5 Hours = 3
>5 Hours = 4
Other ______= 6 (Specify)
B8. When you cook, do you ever use a lid to cover the pot(s)?
Yes .................................................. 1 No ................................................... 2
B8b
B8a. Why do you use a lid to cover the pot(s) during cook? (Multiple answer)
Do not affect food value ............... 01 Cooking fast/boil fast ................... 02 To avoid dust/insect ..................... 03 Other___________________ ....... 96 (Specify)
B9
B8b. Why don’t you use a lid to cover the pot(s) during cook?
Verbatim:_____________________________
_____________________________________
B8c. Interviewer: Check Column 4 in A. Household section, if there is an under 5 child in household then ask B9 or else skip to C1.
B9. Are the children present when you cook? Yes .................................................. 1 No ................................................... 2
C1
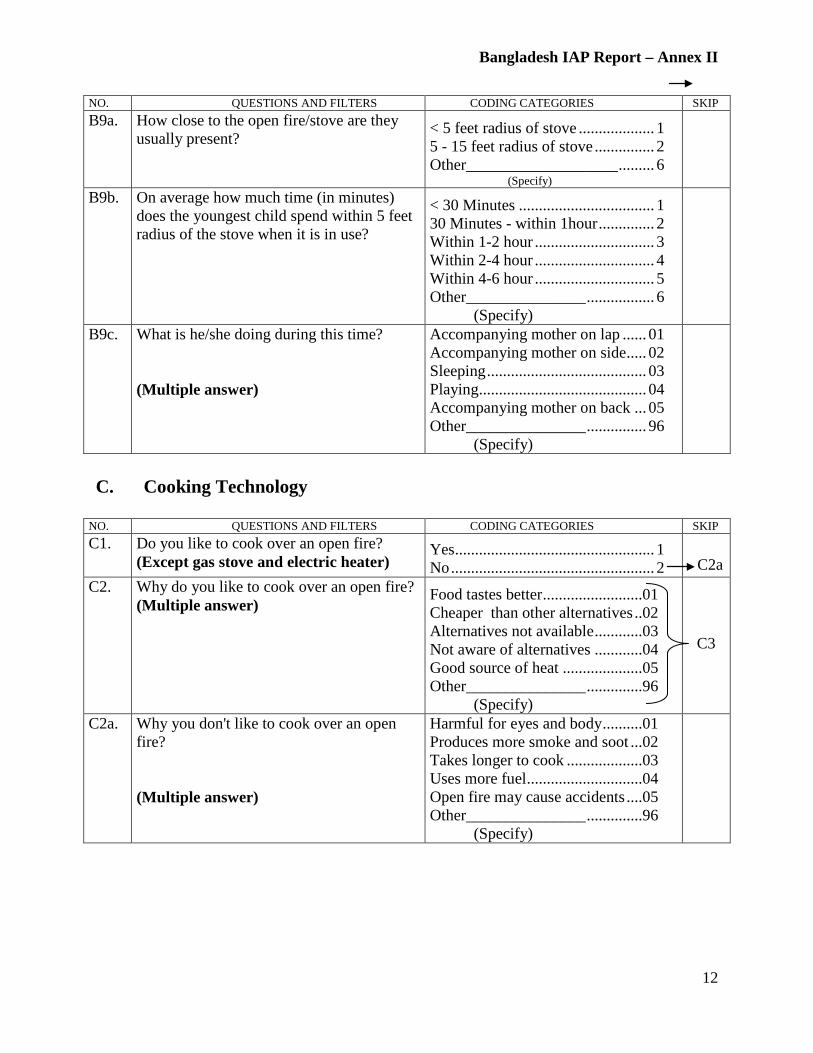
Bangladesh IAP Report – Annex II
12
NO. QUESTIONS AND FILTERS CODING CATEGORIES SKIP B9a. How close to the open fire/stove are they
usually present?
< 5 feet radius of stove ................... 1 5 - 15 feet radius of stove ............... 2 Other___________________ ......... 6 (Specify)
B9b. On average how much time (in minutes) does the youngest child spend within 5 feet radius of the stove when it is in use?
< 30 Minutes .................................. 1 30 Minutes - within 1hour .............. 2 Within 1-2 hour .............................. 3 Within 2-4 hour .............................. 4 Within 4-6 hour .............................. 5 Other_______________ ................. 6 (Specify)
B9c. What is he/she doing during this time? (Multiple answer)
Accompanying mother on lap ...... 01 Accompanying mother on side ..... 02 Sleeping ........................................ 03 Playing .......................................... 04 Accompanying mother on back ... 05 Other_______________ ............... 96 (Specify)
C. Cooking Technology
NO. QUESTIONS AND FILTERS CODING CATEGORIES SKIP C1. Do you like to cook over an open fire?
(Except gas stove and electric heater)
Yes .................................................. 1 No ................................................... 2
C2a
C2. Why do you like to cook over an open fire? (Multiple answer)
Food tastes better .........................01 Cheaper than other alternatives ..02 Alternatives not available ............03 Not aware of alternatives ............04 Good source of heat ....................05 Other_______________ ..............96 (Specify)
C3
C2a. Why you don't like to cook over an open
fire? (Multiple answer)
Harmful for eyes and body ..........01 Produces more smoke and soot ...02 Takes longer to cook ...................03 Uses more fuel .............................04 Open fire may cause accidents ....05 Other_______________ ..............96 (Specify)
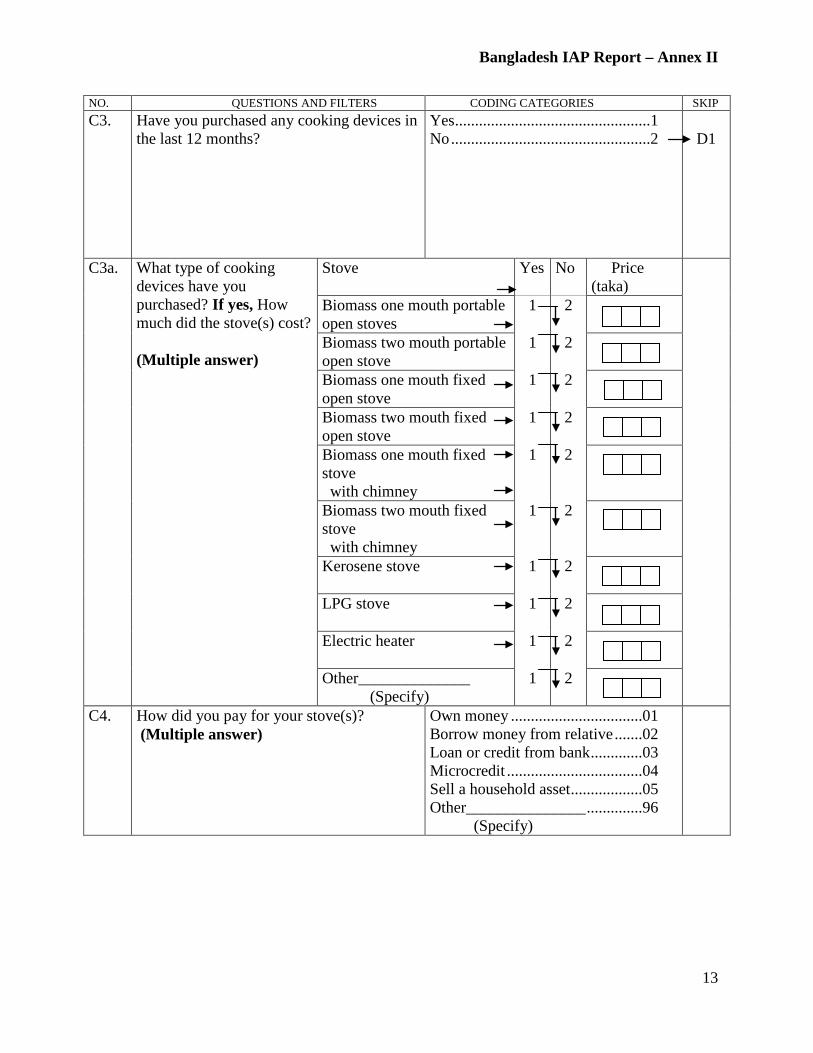
Bangladesh IAP Report – Annex II
13
NO. QUESTIONS AND FILTERS CODING CATEGORIES SKIP C3. Have you purchased any cooking devices in
the last 12 months? Yes .................................................1 No ..................................................2
D1
C3a.
What type of cooking devices have you purchased? If yes, How much did the stove(s) cost? (Multiple answer)
Stove Yes No Price (taka)
Biomass one mouth portable open stoves
1 2
Biomass two mouth portable open stove
1 2
Biomass one mouth fixed open stove
1 2
Biomass two mouth fixed open stove
1 2
Biomass one mouth fixed stove with chimney
1 2
Biomass two mouth fixed stove with chimney
1 2
Kerosene stove 1 2
LPG stove 1 2
Electric heater 1 2
Other______________ (Specify)
1 2
C4. How did you pay for your stove(s)? (Multiple answer)
Own money .................................01 Borrow money from relative .......02 Loan or credit from bank .............03 Microcredit ..................................04 Sell a household asset ..................05 Other_______________ ..............96 (Specify)
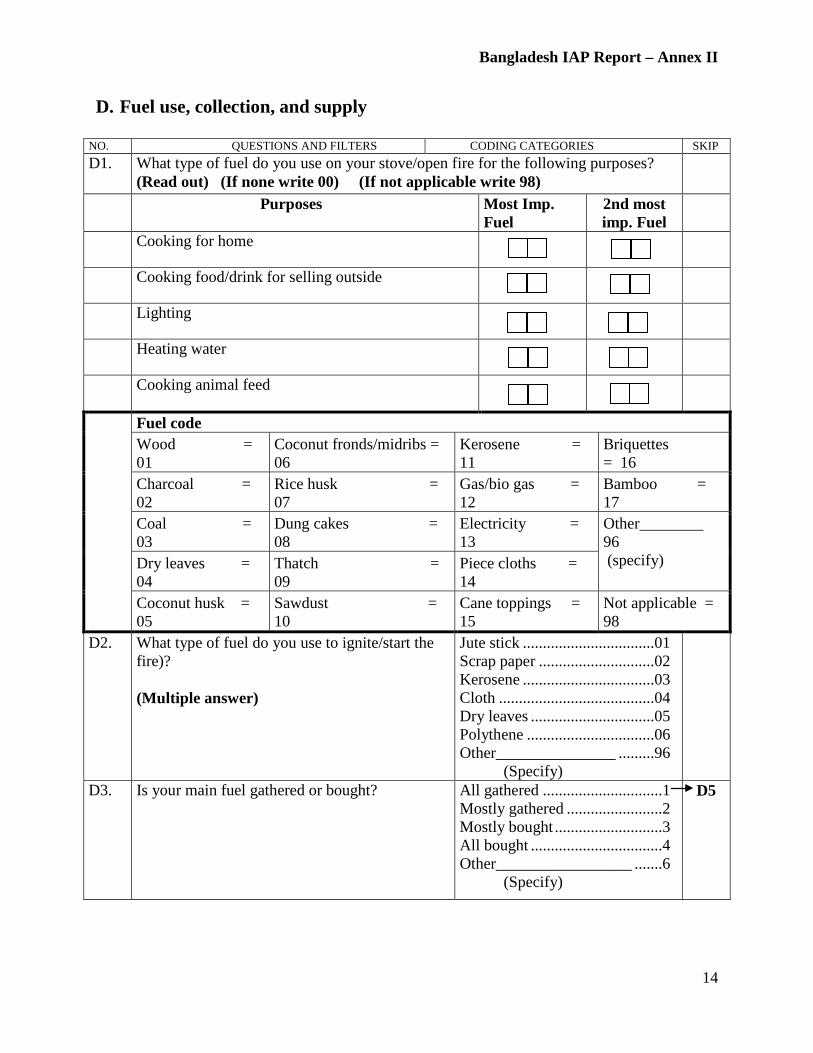
Bangladesh IAP Report – Annex II
14
D. Fuel use, collection, and supply
NO. QUESTIONS AND FILTERS CODING CATEGORIES SKIP D1. What type of fuel do you use on your stove/open fire for the following purposes?
(Read out) (If none write 00) (If not applicable write 98)
Purposes Most Imp. Fuel
2nd most imp. Fuel
Cooking for home
Cooking food/drink for selling outside
Lighting
Heating water
Cooking animal feed
Fuel code Wood = 01
Coconut fronds/midribs = 06
Kerosene = 11
Briquettes = 16
Charcoal = 02
Rice husk = 07
Gas/bio gas = 12
Bamboo = 17
Coal = 03
Dung cakes = 08
Electricity = 13
Other________ 96 (specify) Dry leaves =
04 Thatch = 09
Piece cloths = 14
Coconut husk = 05
Sawdust = 10
Cane toppings = 15
Not applicable = 98
D2. What type of fuel do you use to ignite/start the fire)? (Multiple answer)
Jute stick .................................01 Scrap paper .............................02 Kerosene .................................03 Cloth .......................................04 Dry leaves ...............................05 Polythene ................................06 Other_______________ .........96 (Specify)
D3. Is your main fuel gathered or bought? All gathered ..............................1 Mostly gathered ........................2 Mostly bought ...........................3 All bought .................................4 Other_________________ .......6 (Specify)
D5
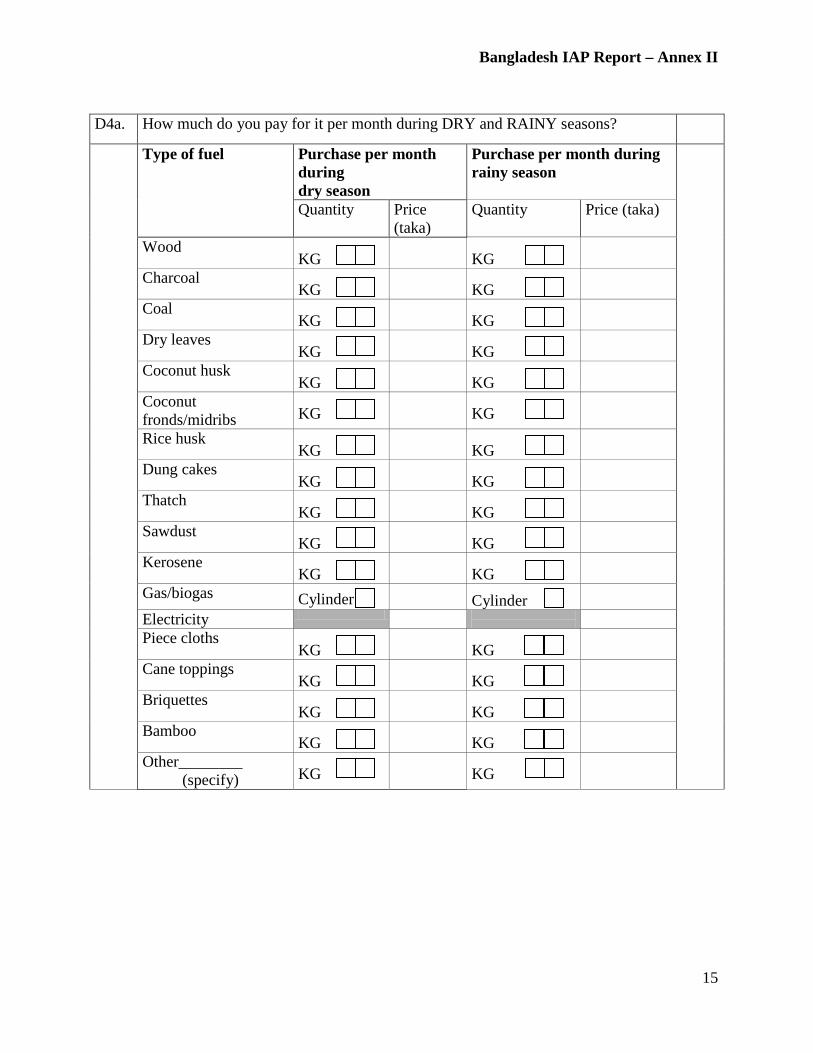
Bangladesh IAP Report – Annex II
15
D4a. How much do you pay for it per month during DRY and RAINY seasons?
Type of fuel Purchase per month during dry season
Purchase per month during rainy season
Quantity Price (taka)
Quantity Price (taka)
Wood KG
KG
Charcoal KG
KG
Coal KG
KG
Dry leaves KG
KG
Coconut husk KG
KG
Coconut fronds/midribs
KG
KG
Rice husk KG
KG
Dung cakes KG
KG
Thatch KG
KG
Sawdust KG
KG
Kerosene KG
KG
Gas/biogas
Cylinder
Cylinder Electricity
Piece cloths KG
KG
Cane toppings KG
KG
Briquettes KG
KG
Bamboo KG
KG
Other________ (specify)
KG
KG
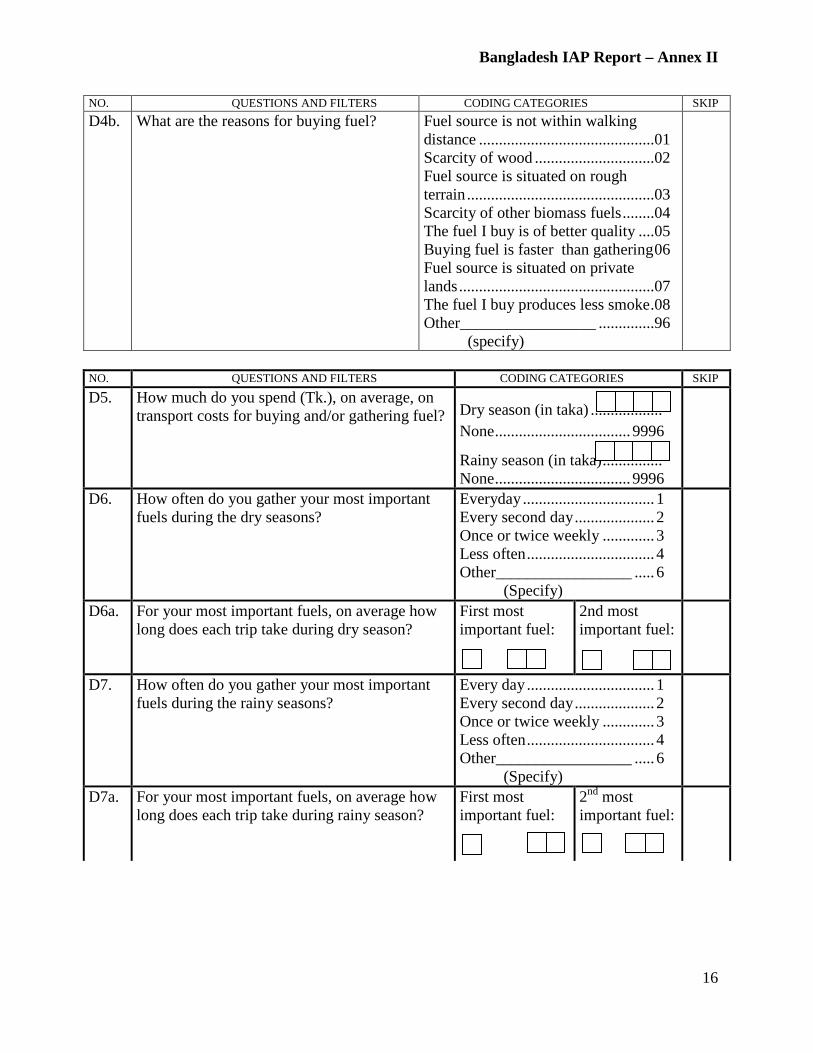
Bangladesh IAP Report – Annex II
16
NO. QUESTIONS AND FILTERS CODING CATEGORIES SKIP D4b. What are the reasons for buying fuel? Fuel source is not within walking
distance ............................................01 Scarcity of wood ..............................02 Fuel source is situated on rough terrain ...............................................03 Scarcity of other biomass fuels ........04 The fuel I buy is of better quality ....05 Buying fuel is faster than gathering 06 Fuel source is situated on private lands .................................................07 The fuel I buy produces less smoke .08 Other_________________ ..............96 (specify)
NO. QUESTIONS AND FILTERS CODING CATEGORIES SKIP
D5. How much do you spend (Tk.), on average, on transport costs for buying and/or gathering fuel?
Dry season (in taka) ..................
None .................................. 9996
Rainy season (in taka) ............... None .................................. 9996
D6. How often do you gather your most important fuels during the dry seasons?
Everyday ................................. 1 Every second day .................... 2 Once or twice weekly ............. 3 Less often ................................ 4 Other_________________ ..... 6 (Specify)
D6a. For your most important fuels, on average how long does each trip take during dry season?
First most important fuel:
2nd most important fuel:
D7. How often do you gather your most important fuels during the rainy seasons?
Every day ................................ 1 Every second day .................... 2 Once or twice weekly ............. 3 Less often ................................ 4 Other_________________ ..... 6 (Specify)
D7a. For your most important fuels, on average how long does each trip take during rainy season?
First most important fuel:
2nd most important fuel:

Bangladesh IAP Report – Annex II
17
D8. Interviewer: Check D3 and circle inappropriate code.
All gathered ............................ 1 Mostly gathered ...................... 2 Mostly bought ......................... 3 All bought ............................... 4 Other_________________ ..... 6 (Specify)
D9
D8a. Who in your household spends the most time gathering fuel?
Primary fuel gatherer: ________ID# Other than family member ........................... 96
D8b. Who helps with gathering fuel? Secondary fuel gatherer ______ID# None ....................................................... 00
D9. How dry is the main fuel wood or other biomass that you use?
Not applicable .........................01 Dry ..........................................02 Damp .......................................03 Wet ..........................................04 Green .......................................05 Other_________________ .....96 (Specify)
E1a
D10. How often do you dry this fuel before use? Never .........................................1 Occasionally .............................2 Usually ......................................3 Always ......................................4
E1a
D11. How do you dry your main fuel wood or other biomass before use?
In the sun ...................................1 Hanging on top of open fire .....2 Next to an open fire ..................3 In a closed shelter .....................4 Other_________________ .......6 (Specify)
E. Health Impacts
NO. QUESTIONS AND FILTERS CODING CATEGORIES SKIP E1. Do you think the smoke from the stove is in
any way beneficial?
Yes .................................................. 1 No ................................................... 2
E2
E1b. Why do you think the smoke from the stove is in any way beneficial? Verbatim:_____________________________ ___________________________________
E2. Do you think the smoke from the stove has an effect on primary cook's health?
Yes .................................................. 1 No ................................................... 2
E3
E2a. What type of health problems may occur? (Multiple answer)
Eye problem ................................. 01 Cough ........................................... 02
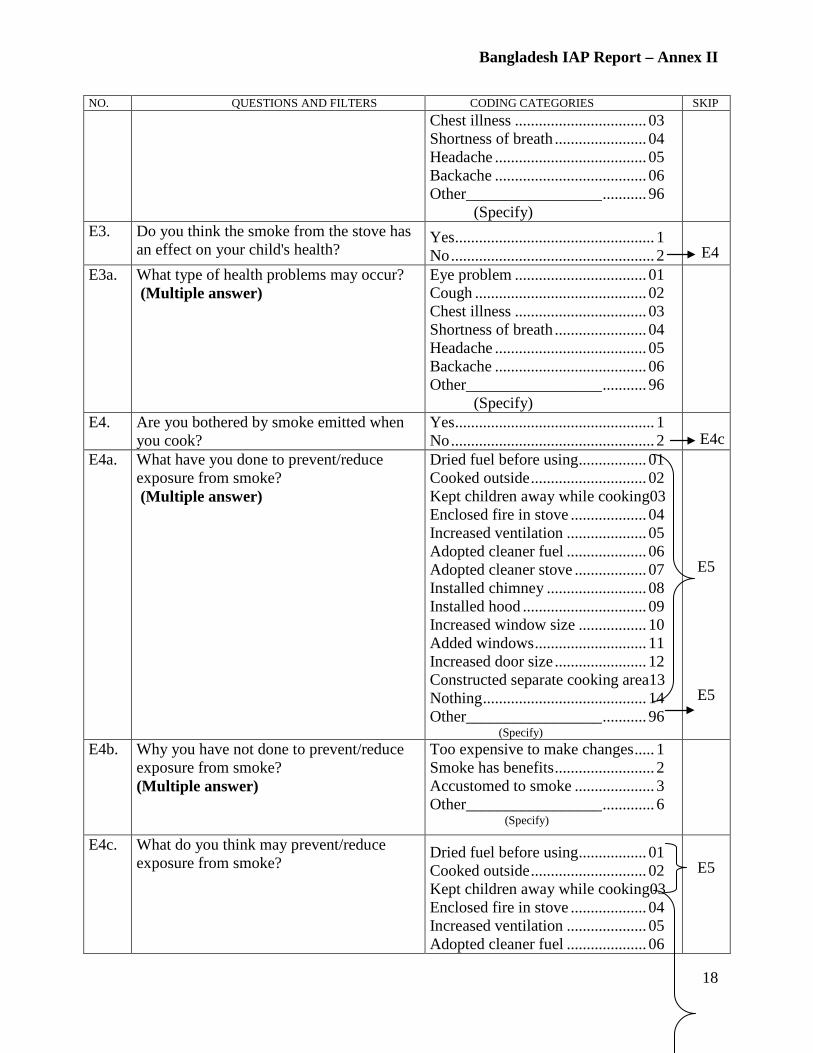
Bangladesh IAP Report – Annex II
18
NO. QUESTIONS AND FILTERS CODING CATEGORIES SKIP Chest illness ................................. 03 Shortness of breath ....................... 04 Headache ...................................... 05 Backache ...................................... 06 Other_________________ ........... 96 (Specify)
E3. Do you think the smoke from the stove has an effect on your child's health?
Yes .................................................. 1 No ................................................... 2
E4
E3a. What type of health problems may occur? (Multiple answer)
Eye problem ................................. 01 Cough ........................................... 02 Chest illness ................................. 03 Shortness of breath ....................... 04 Headache ...................................... 05 Backache ...................................... 06 Other_________________ ........... 96 (Specify)
E4. Are you bothered by smoke emitted when you cook?
Yes .................................................. 1 No ................................................... 2
E4c E4a. What have you done to prevent/reduce
exposure from smoke? (Multiple answer)
Dried fuel before using ................. 01 Cooked outside ............................. 02 Kept children away while cooking03 Enclosed fire in stove ................... 04 Increased ventilation .................... 05 Adopted cleaner fuel .................... 06 Adopted cleaner stove .................. 07 Installed chimney ......................... 08 Installed hood ............................... 09 Increased window size ................. 10 Added windows ............................ 11 Increased door size ....................... 12 Constructed separate cooking area13 Nothing ......................................... 14 Other_________________ ........... 96 (Specify)
E5
E5
E4b. Why you have not done to prevent/reduce exposure from smoke? (Multiple answer)
Too expensive to make changes ..... 1 Smoke has benefits ......................... 2 Accustomed to smoke .................... 3 Other_________________ ............. 6 (Specify)
E4c. What do you think may prevent/reduce exposure from smoke?
Dried fuel before using ................. 01 Cooked outside ............................. 02 Kept children away while cooking03 Enclosed fire in stove ................... 04 Increased ventilation .................... 05 Adopted cleaner fuel .................... 06
E5
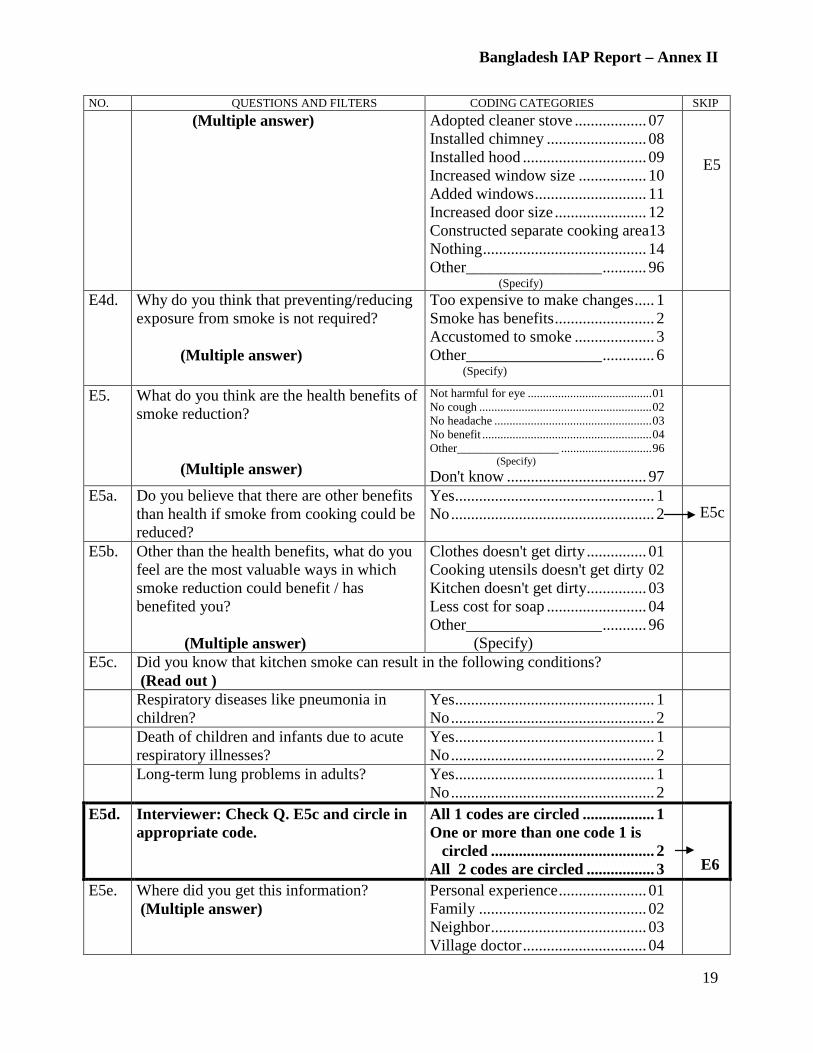
Bangladesh IAP Report – Annex II
19
NO. QUESTIONS AND FILTERS CODING CATEGORIES SKIP (Multiple answer) Adopted cleaner stove .................. 07
Installed chimney ......................... 08 Installed hood ............................... 09 Increased window size ................. 10 Added windows ............................ 11 Increased door size ....................... 12 Constructed separate cooking area13 Nothing ......................................... 14 Other_________________ ........... 96 (Specify)
E5
E4d. Why do you think that preventing/reducing exposure from smoke is not required? (Multiple answer)
Too expensive to make changes ..... 1 Smoke has benefits ......................... 2 Accustomed to smoke .................... 3 Other_________________ ............. 6 (Specify)
E5. What do you think are the health benefits of smoke reduction? (Multiple answer)
Not harmful for eye ......................................... 01 No cough ......................................................... 02 No headache .................................................... 03 No benefit ........................................................ 04 Other_________________ .............................. 96 (Specify) Don't know ................................... 97
E5a. Do you believe that there are other benefits than health if smoke from cooking could be reduced?
Yes .................................................. 1 No ................................................... 2
E5c
E5b. Other than the health benefits, what do you feel are the most valuable ways in which smoke reduction could benefit / has benefited you? (Multiple answer)
Clothes doesn't get dirty ............... 01 Cooking utensils doesn't get dirty 02 Kitchen doesn't get dirty............... 03 Less cost for soap ......................... 04 Other_________________ ........... 96 (Specify)
E5c. Did you know that kitchen smoke can result in the following conditions? (Read out )
Respiratory diseases like pneumonia in children?
Yes .................................................. 1 No ................................................... 2
Death of children and infants due to acute respiratory illnesses?
Yes .................................................. 1 No ................................................... 2
Long-term lung problems in adults? Yes .................................................. 1 No ................................................... 2
E5d. Interviewer: Check Q. E5c and circle in appropriate code.
All 1 codes are circled .................. 1 One or more than one code 1 is circled ......................................... 2 All 2 codes are circled ................. 3
E6 E5e. Where did you get this information?
(Multiple answer) Personal experience ...................... 01 Family .......................................... 02 Neighbor ....................................... 03 Village doctor ............................... 04
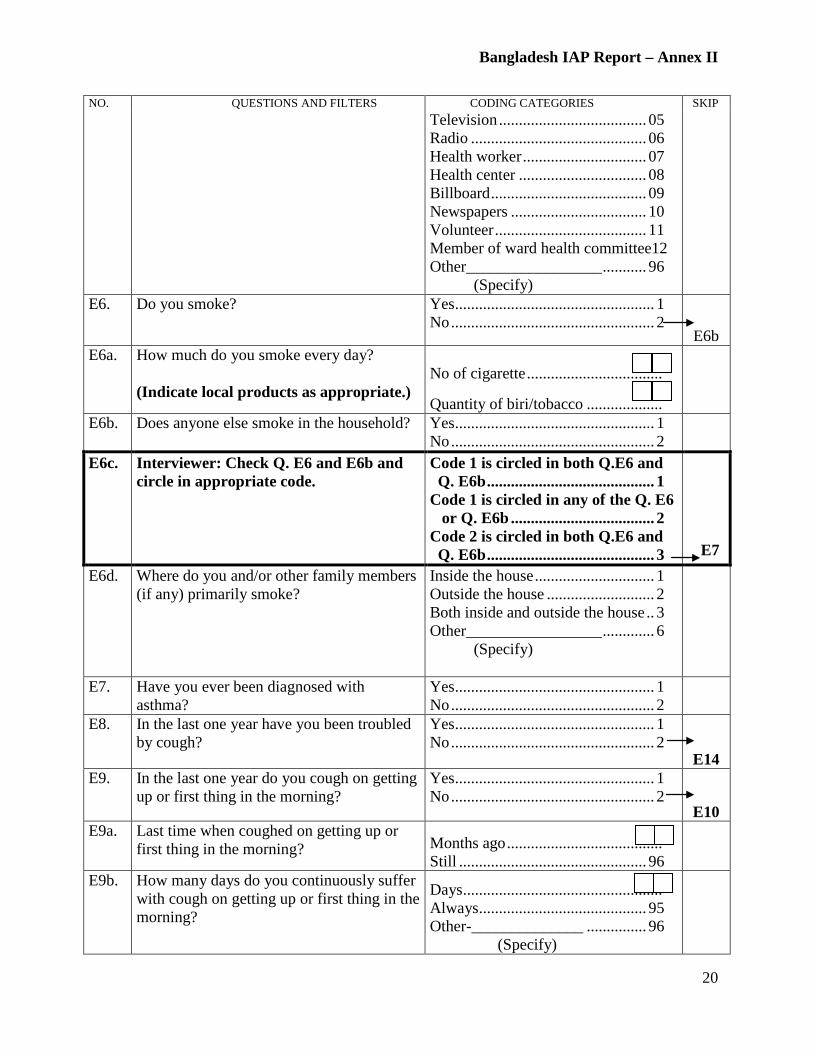
Bangladesh IAP Report – Annex II
20
NO. QUESTIONS AND FILTERS CODING CATEGORIES SKIP Television ..................................... 05 Radio ............................................ 06 Health worker ............................... 07 Health center ................................ 08 Billboard ....................................... 09 Newspapers .................................. 10 Volunteer ...................................... 11 Member of ward health committee12 Other_________________ ........... 96 (Specify)
E6. Do you smoke? Yes .................................................. 1 No ................................................... 2
E6b
E6a. How much do you smoke every day? (Indicate local products as appropriate.)
No of cigarette .................................. Quantity of biri/tobacco ...................
E6b. Does anyone else smoke in the household? Yes .................................................. 1 No ................................................... 2
E6c. Interviewer: Check Q. E6 and E6b and circle in appropriate code.
Code 1 is circled in both Q.E6 and Q. E6b .......................................... 1 Code 1 is circled in any of the Q. E6 or Q. E6b .................................... 2 Code 2 is circled in both Q.E6 and Q. E6b .......................................... 3
E7 E6d. Where do you and/or other family members
(if any) primarily smoke? Inside the house .............................. 1 Outside the house ........................... 2 Both inside and outside the house .. 3 Other_________________ ............. 6 (Specify)
E7. Have you ever been diagnosed with asthma?
Yes .................................................. 1 No ................................................... 2
E8. In the last one year have you been troubled by cough?
Yes .................................................. 1 No ................................................... 2
E14
E9. In the last one year do you cough on getting up or first thing in the morning?
Yes .................................................. 1 No ................................................... 2
E10
E9a. Last time when coughed on getting up or first thing in the morning?
Months ago ....................................... Still ............................................... 96
E9b. How many days do you continuously suffer with cough on getting up or first thing in the morning?
Days .................................................. Always .......................................... 95 Other-______________ ............... 96 (Specify)
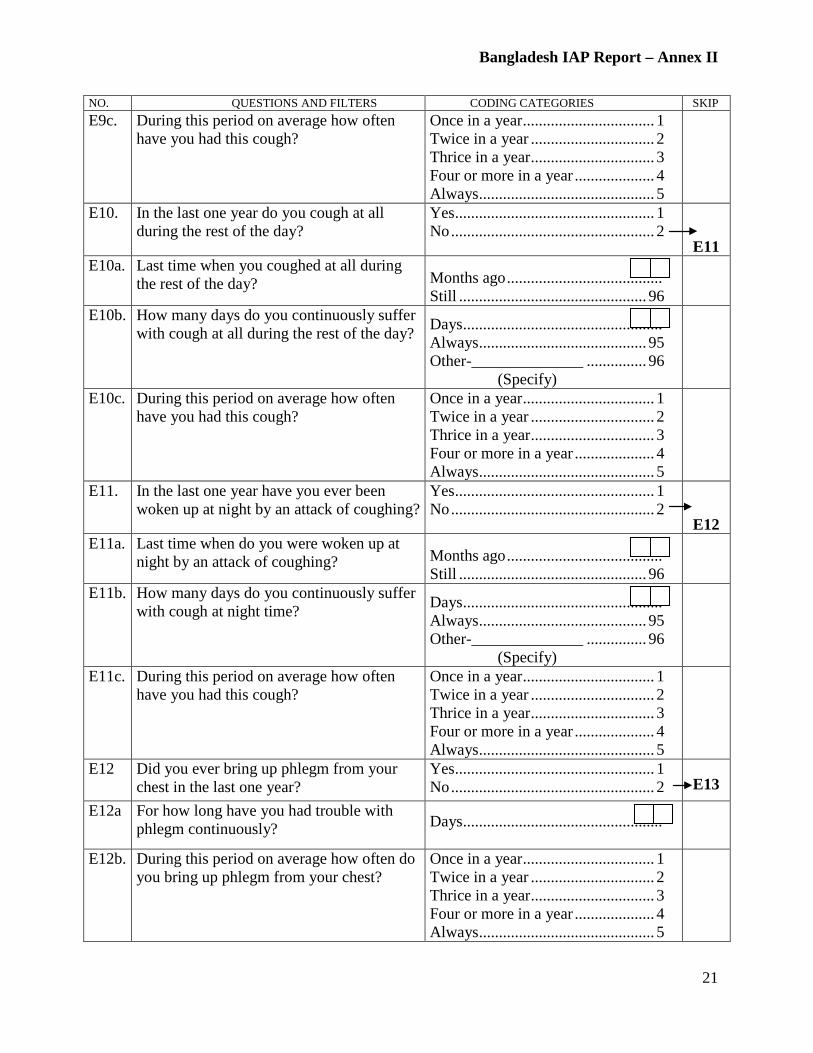
Bangladesh IAP Report – Annex II
21
NO. QUESTIONS AND FILTERS CODING CATEGORIES SKIP E9c. During this period on average how often
have you had this cough? Once in a year ................................. 1 Twice in a year ............................... 2 Thrice in a year ............................... 3 Four or more in a year .................... 4 Always ............................................ 5
E10. In the last one year do you cough at all during the rest of the day?
Yes .................................................. 1 No ................................................... 2
E11
E10a. Last time when you coughed at all during the rest of the day?
Months ago ....................................... Still ............................................... 96
E10b. How many days do you continuously suffer with cough at all during the rest of the day?
Days .................................................. Always .......................................... 95 Other-______________ ............... 96 (Specify)
E10c. During this period on average how often have you had this cough?
Once in a year ................................. 1 Twice in a year ............................... 2 Thrice in a year ............................... 3 Four or more in a year .................... 4 Always ............................................ 5
E11. In the last one year have you ever been woken up at night by an attack of coughing?
Yes .................................................. 1 No ................................................... 2
E12
E11a. Last time when do you were woken up at night by an attack of coughing?
Months ago ....................................... Still ............................................... 96
E11b. How many days do you continuously suffer with cough at night time?
Days .................................................. Always .......................................... 95 Other-______________ ............... 96 (Specify)
E11c. During this period on average how often have you had this cough?
Once in a year ................................. 1 Twice in a year ............................... 2 Thrice in a year ............................... 3 Four or more in a year .................... 4 Always ............................................ 5
E12 Did you ever bring up phlegm from your chest in the last one year?
Yes .................................................. 1 No ................................................... 2
E13
E12a For how long have you had trouble with phlegm continuously?
Days ..................................................
E12b. During this period on average how often do you bring up phlegm from your chest?
Once in a year ................................. 1 Twice in a year ............................... 2 Thrice in a year ............................... 3 Four or more in a year .................... 4 Always ............................................ 5

Bangladesh IAP Report – Annex II
22
NO. QUESTIONS AND FILTERS CODING CATEGORIES SKIP E12c What color is your phlegm usually? White .............................................. 1
Light green ..................................... 2 Dark green ...................................... 3 Brown ............................................. 4 Green with streaks of blood ........... 5 Red ................................................. 6
E12d. Proceed to Question E 13. if the respondent answers 'YES' to ANY the options in Questions E9, E10, E11, and E12 or else skip to E14.
E13. Did you seek treatment for any of these conditions?
Yes .................................................. 1 No ................................................... 2
E14
E13a Please specify where you sought treatment for these conditions
Religious healer ............................ 01 Village doctor ............................... 02 Local pharmacy ............................ 03 NGO health center ........................ 04 Government health center ............ 05 Other_________________ ........... 96 (Specify)
E14. In the last two weeks have you experienced any of the following? (Read out)
E15. Did you seek treatment for this condition?
E15a. Please specify where you sought treatment for this
condition?
a. Attacks of wheezing or whistling breath?
Yes 1 No 2
Yes 1 No 2
b. Attacks of wheezing that came on after exercising or other physical activity
Yes 1 No 2
Yes 1 No 2
c. Sudden attack of shortness of breath when not exercising or doing physical activity
Yes 1 No 2
Yes 1 No 2
d. Have you, at any time, woken up with a feeling of tightness in your chest first thing in the morning?
Yes 1 No 2
Yes 1 No 2
Code*
Religious healer =01
Village doctor =02 Local pharmacy =03
NGO health center=04
Govt. health center=05
Other_________=96 (Specify)
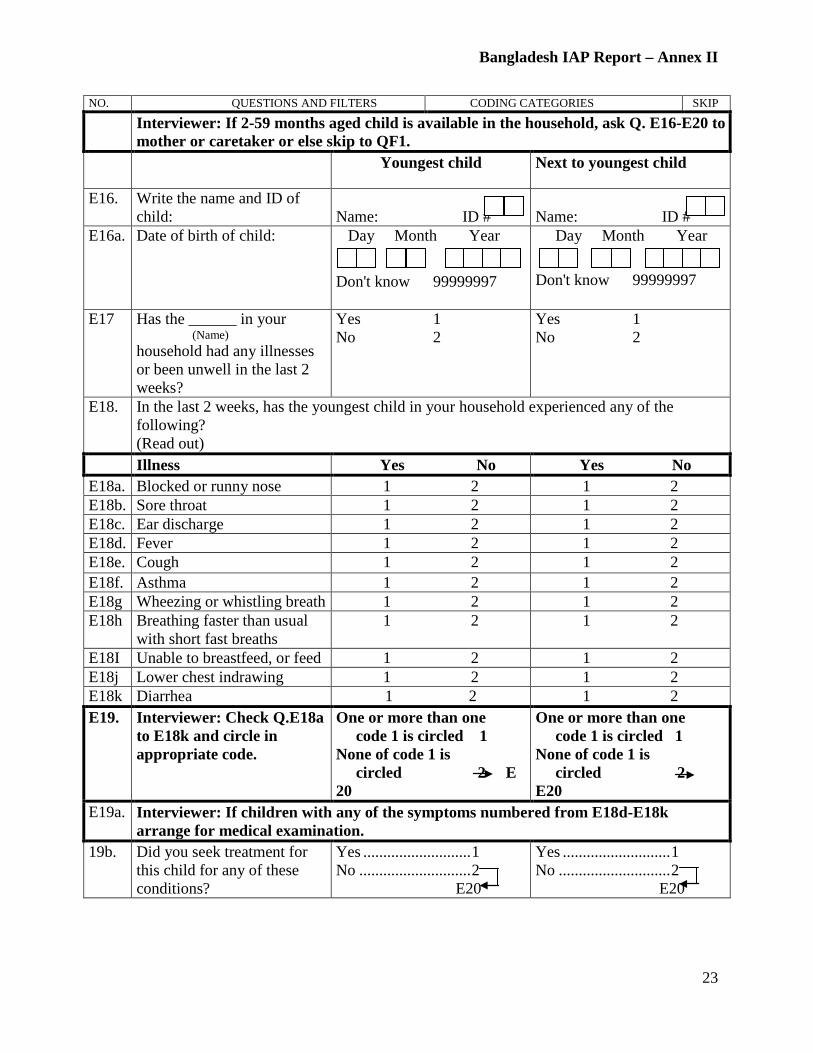
Bangladesh IAP Report – Annex II
23
NO. QUESTIONS AND FILTERS CODING CATEGORIES SKIP
Interviewer: If 2-59 months aged child is available in the household, ask Q. E16-E20 to mother or caretaker or else skip to QF1.
Youngest child Next to youngest child
E16. Write the name and ID of child:
Name: ID #
Name: ID #
E16a. Date of birth of child:
Day Month Year
Don't know 99999997
Day Month Year
Don't know 99999997
E17 Has the ______ in your (Name) household had any illnesses or been unwell in the last 2 weeks?
Yes 1 No 2
Yes 1 No 2
E18. In the last 2 weeks, has the youngest child in your household experienced any of the following? (Read out)
Illness Yes No Yes No E18a. Blocked or runny nose 1 2 1 2 E18b. Sore throat 1 2 1 2 E18c. Ear discharge 1 2 1 2 E18d. Fever 1 2 1 2 E18e. Cough 1 2 1 2 E18f. Asthma 1 2 1 2 E18g Wheezing or whistling breath 1 2 1 2 E18h Breathing faster than usual
with short fast breaths 1 2 1 2
E18I Unable to breastfeed, or feed 1 2 1 2 E18j Lower chest indrawing 1 2 1 2 E18k Diarrhea 1 2 1 2 E19. Interviewer: Check Q.E18a
to E18k and circle in appropriate code.
One or more than one code 1 is circled 1 None of code 1 is circled 2 E 20
One or more than one code 1 is circled 1 None of code 1 is circled 2 E20
E19a. Interviewer: If children with any of the symptoms numbered from E18d-E18k arrange for medical examination.
19b. Did you seek treatment for this child for any of these conditions?
Yes ........................... 1 No ............................ 2 E20
Yes ........................... 1 No ............................ 2 E20
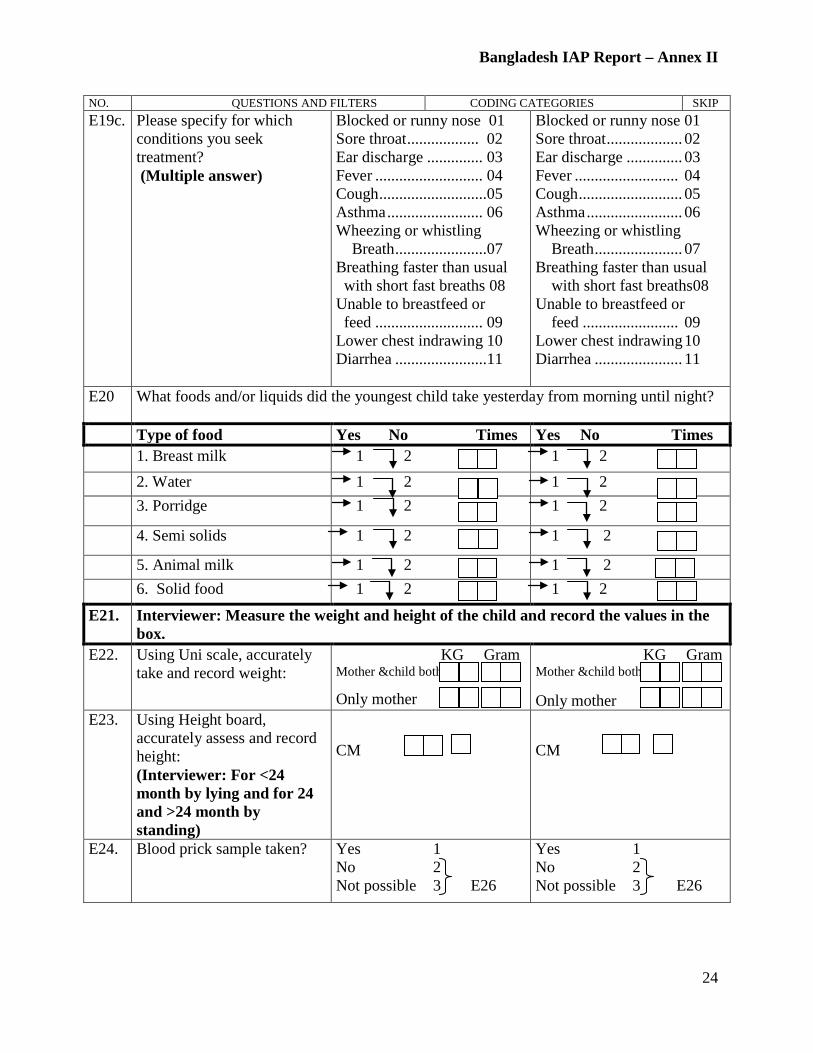
Bangladesh IAP Report – Annex II
24
NO. QUESTIONS AND FILTERS CODING CATEGORIES SKIP E19c. Please specify for which
conditions you seek treatment? (Multiple answer)
Blocked or runny nose 01 Sore throat .................. 02 Ear discharge .............. 03 Fever ........................... 04 Cough ...........................05 Asthma ........................ 06 Wheezing or whistling Breath .......................07 Breathing faster than usual with short fast breaths 08 Unable to breastfeed or feed ........................... 09 Lower chest indrawing 10 Diarrhea .......................11
Blocked or runny nose 01 Sore throat ................... 02 Ear discharge .............. 03 Fever .......................... 04 Cough .......................... 05 Asthma ........................ 06 Wheezing or whistling Breath ...................... 07 Breathing faster than usual with short fast breaths08 Unable to breastfeed or feed ........................ 09 Lower chest indrawing 10 Diarrhea ...................... 11
E20 What foods and/or liquids did the youngest child take yesterday from morning until night?
Type of food Yes No Times Yes No Times 1. Breast milk 1 2 1 2 2. Water 1 2 1 2 3. Porridge 1 2 1 2
4. Semi solids 1 2 1 2
5. Animal milk 1 2 1 2 6. Solid food 1 2 1 2
E21. Interviewer: Measure the weight and height of the child and record the values in the box.
E22. Using Uni scale, accurately take and record weight:
KG Gram Mother &child both
Only mother
KG Gram Mother &child both Only mother
E23. Using Height board, accurately assess and record height: (Interviewer: For <24 month by lying and for 24 and >24 month by standing)
CM
CM
E24. Blood prick sample taken? Yes 1 No 2 Not possible 3 E26
Yes 1 No 2
Not possible 3 E26
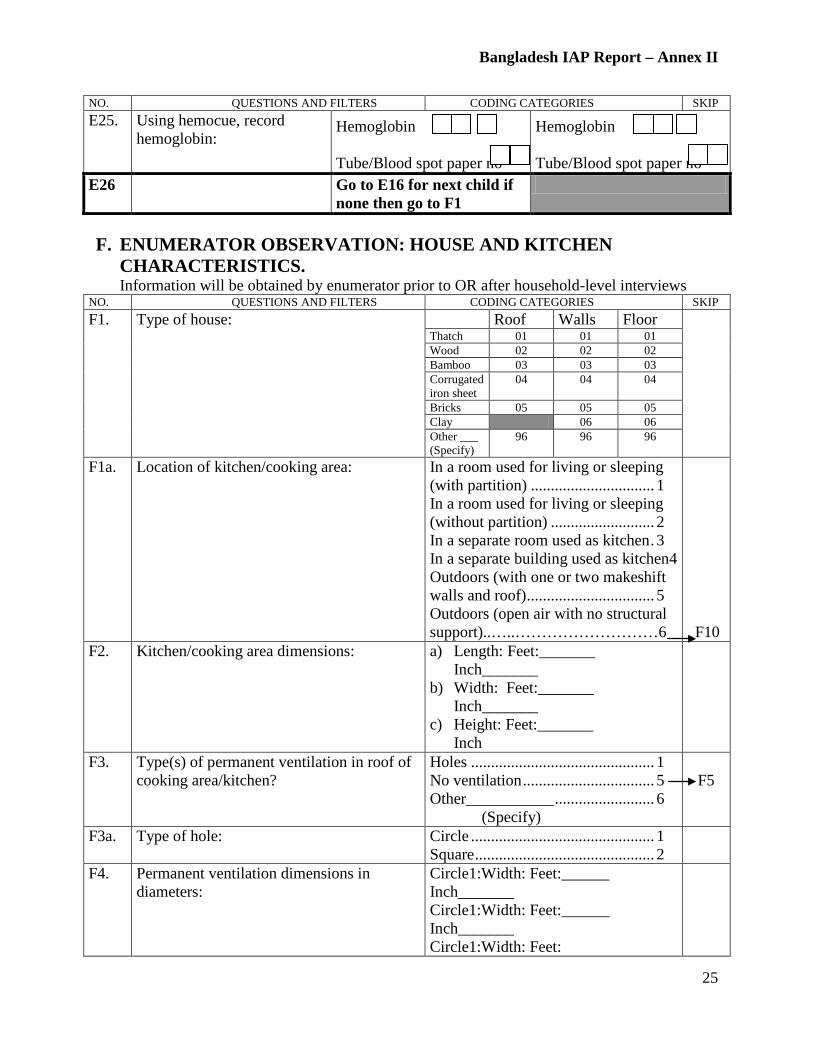
Bangladesh IAP Report – Annex II
25
NO. QUESTIONS AND FILTERS CODING CATEGORIES SKIP E25. Using hemocue, record
hemoglobin:
Hemoglobin Tube/Blood spot paper no
Hemoglobin Tube/Blood spot paper no
E26 Go to E16 for next child if none then go to F1
F. ENUMERATOR OBSERVATION: HOUSE AND KITCHEN
CHARACTERISTICS. Information will be obtained by enumerator prior to OR after household-level interviews
NO. QUESTIONS AND FILTERS CODING CATEGORIES SKIP F1. Type of house: Roof Walls Floor
Thatch 01 01 01 Wood 02 02 02 Bamboo 03 03 03 Corrugated iron sheet
04 04 04
Bricks 05 05 05 Clay 06 06 Other ___ (Specify)
96 96 96
F1a. Location of kitchen/cooking area: In a room used for living or sleeping (with partition) ............................... 1 In a room used for living or sleeping (without partition) .......................... 2 In a separate room used as kitchen . 3 In a separate building used as kitchen4 Outdoors (with one or two makeshift walls and roof) ................................ 5 Outdoors (open air with no structural support)..…..………………………6
F10 F2. Kitchen/cooking area dimensions: a) Length: Feet:_______
Inch_______ b) Width: Feet:_______
Inch_______ c) Height: Feet:_______
Inch
F3. Type(s) of permanent ventilation in roof of cooking area/kitchen?
Holes .............................................. 1 No ventilation ................................. 5 Other___________ ......................... 6 (Specify)
F5
F3a. Type of hole: Circle .............................................. 1 Square ............................................. 2
F4. Permanent ventilation dimensions in diameters:
Circle1:Width: Feet:______ Inch_______ Circle1:Width: Feet:______ Inch_______ Circle1:Width: Feet:

Bangladesh IAP Report – Annex II
26
NO. QUESTIONS AND FILTERS CODING CATEGORIES SKIP Inch_______ Square1:Length: Feet:______ Inch_____ Width: Feet:____ Inch_______ Square2:Length: Feet:______ Inch_____ Width: Feet:____ Inch_______ Square3:Length: Feet:______ Inch_____ Width: Feet:____ Inch_______
F5. Depth of eaves spaces: Inch:________________________ No eaves spaces .............................. 6
F7
F6 Length of eaves spaces: (Multiple answer)
All around the room ....................... 1 Along outside wall ......................... 2 Along walls within house ............... 3 Other________________ ............... 6 (Specify)
F7. How many windows are there in the kitchen/cooking area?
None ............................................... 0 One ................................................. 1 Two ................................................ 2 Three .............................................. 3 Four ................................................ 4 Five ................................................. 5 Six or more______________ ......... 6 (Specify)
F9
F8. Window dimensions (width): Window 1: ................................. Feet Window 2: ................................. Feet Window 3: ................................. Feet Window 4: ................................. Feet Window 5: ................................. Feet Window 6: ................................. Feet Other:______________ ............. Feet (Specify)
F9. How many doors are there in the kitchen/cooking area?
None ............................................... 0 One ................................................. 1 Two ................................................ 2 Three .............................................. 3 Four ................................................ 4 Five ................................................. 5 Other___________________ ......... 6 (Specify)
F10. Cooking Area/Kitchen Layout:
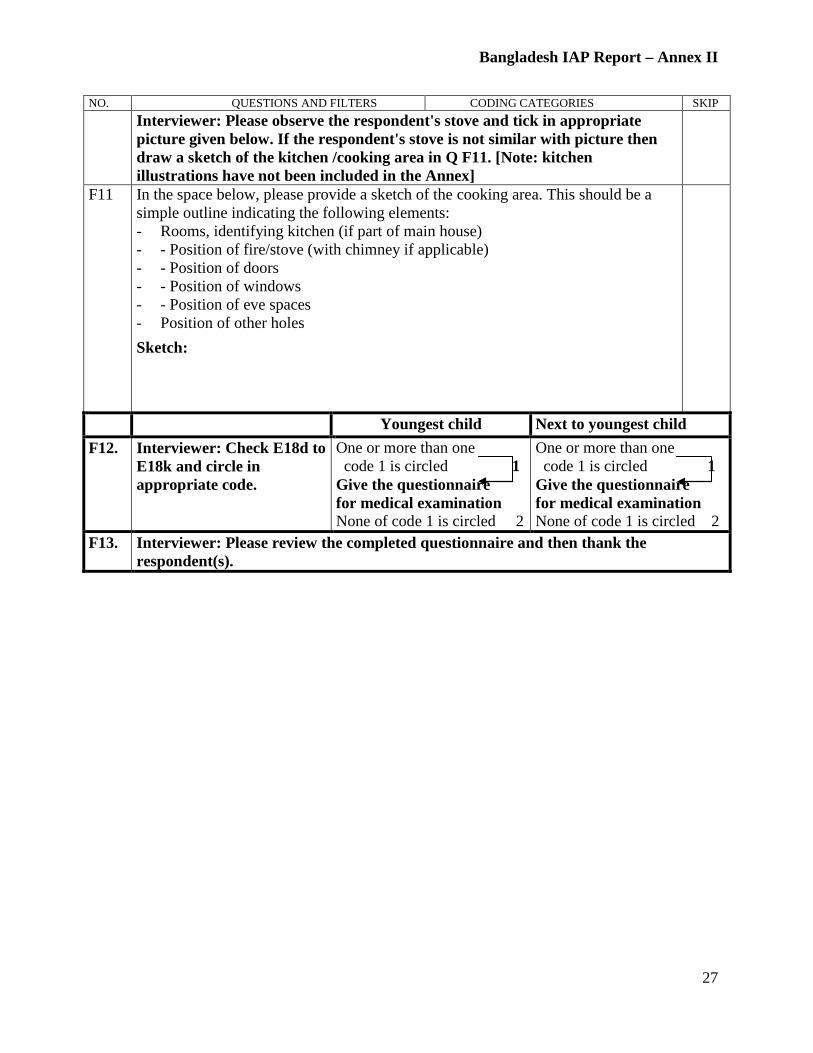
Bangladesh IAP Report – Annex II
27
NO. QUESTIONS AND FILTERS CODING CATEGORIES SKIP Interviewer: Please observe the respondent's stove and tick in appropriate
picture given below. If the respondent's stove is not similar with picture then draw a sketch of the kitchen /cooking area in Q F11. [Note: kitchen illustrations have not been included in the Annex]
F11 In the space below, please provide a sketch of the cooking area. This should be a simple outline indicating the following elements: - Rooms, identifying kitchen (if part of main house) - - Position of fire/stove (with chimney if applicable) - - Position of doors - - Position of windows - - Position of eve spaces - Position of other holes
Sketch:
Youngest child Next to youngest child F12. Interviewer: Check E18d to
E18k and circle in appropriate code.
One or more than one code 1 is circled 1 Give the questionnaire for medical examination None of code 1 is circled 2
One or more than one code 1 is circled 1 Give the questionnaire for medical examination None of code 1 is circled 2
F13. Interviewer: Please review the completed questionnaire and then thank the respondent(s).
Bangladesh IAP Report – Annex III
ANNEX III – Baseline IAP Monitoring Report

Bangladesh IAP Report – Annex III
ANNEX III. Baseline Indoor Air Pollution Monitoring Report
February 15, 2006
Mohammad Alauddin, IAP Consultant, Winrock International A.B.M. Zakaria, IAP Consultant, Winrock International
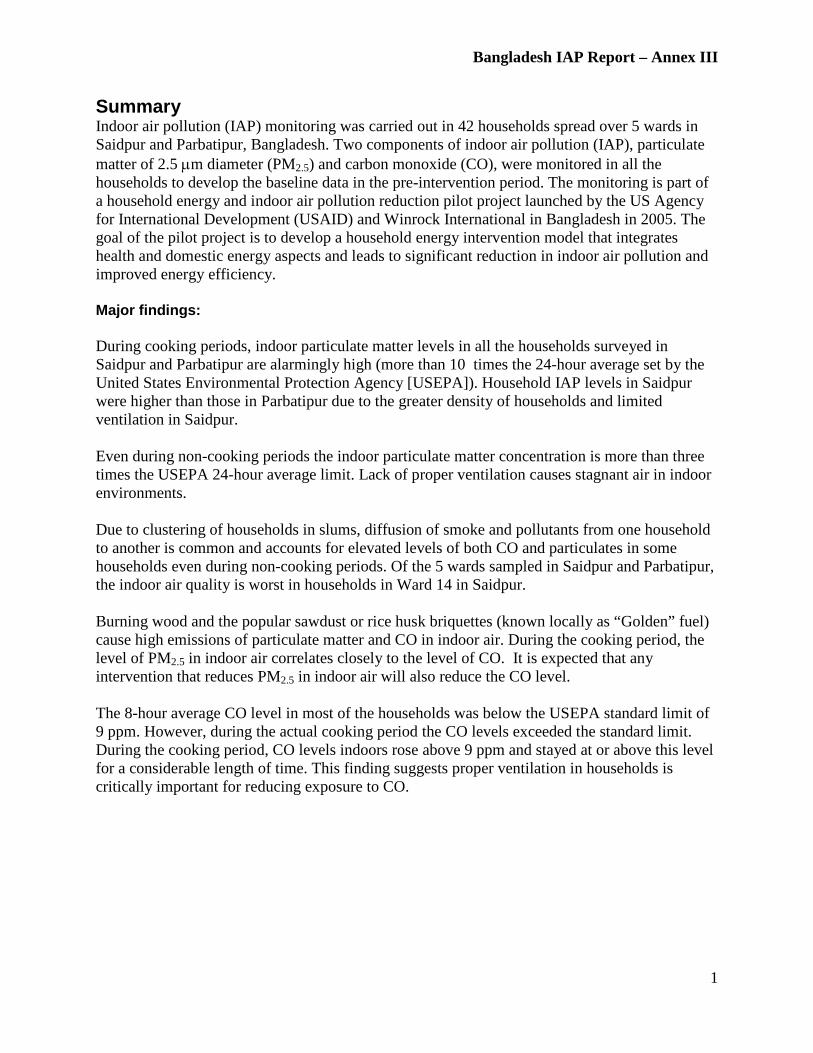
Bangladesh IAP Report – Annex III
1
Summary Indoor air pollution (IAP) monitoring was carried out in 42 households spread over 5 wards in Saidpur and Parbatipur, Bangladesh. Two components of indoor air pollution (IAP), particulate matter of 2.5 µm diameter (PM2.5) and carbon monoxide (CO), were monitored in all the households to develop the baseline data in the pre-intervention period. The monitoring is part of a household energy and indoor air pollution reduction pilot project launched by the US Agency for International Development (USAID) and Winrock International in Bangladesh in 2005. The goal of the pilot project is to develop a household energy intervention model that integrates health and domestic energy aspects and leads to significant reduction in indoor air pollution and improved energy efficiency. Major findings: During cooking periods, indoor particulate matter levels in all the households surveyed in Saidpur and Parbatipur are alarmingly high (more than 10 times the 24-hour average set by the United States Environmental Protection Agency [USEPA]). Household IAP levels in Saidpur were higher than those in Parbatipur due to the greater density of households and limited ventilation in Saidpur. Even during non-cooking periods the indoor particulate matter concentration is more than three times the USEPA 24-hour average limit. Lack of proper ventilation causes stagnant air in indoor environments. Due to clustering of households in slums, diffusion of smoke and pollutants from one household to another is common and accounts for elevated levels of both CO and particulates in some households even during non-cooking periods. Of the 5 wards sampled in Saidpur and Parbatipur, the indoor air quality is worst in households in Ward 14 in Saidpur. Burning wood and the popular sawdust or rice husk briquettes (known locally as “Golden” fuel) cause high emissions of particulate matter and CO in indoor air. During the cooking period, the level of PM2.5 in indoor air correlates closely to the level of CO. It is expected that any intervention that reduces PM2.5 in indoor air will also reduce the CO level. The 8-hour average CO level in most of the households was below the USEPA standard limit of 9 ppm. However, during the actual cooking period the CO levels exceeded the standard limit. During the cooking period, CO levels indoors rose above 9 ppm and stayed at or above this level for a considerable length of time. This finding suggests proper ventilation in households is critically important for reducing exposure to CO.

Bangladesh IAP Report – Annex III
2
1. Introduction
Indoor and outdoor air pollution have been identified as major causes of a number of respiratory diseases in both developing as well as developed countries (5, 6). Over the years, outdoor pollution resulting mainly from automobile and industrial emissions has drawn attention from researchers, health workers, and policy makers for the health risks associated with this type of pollution. Although somewhat overlooked in the past, indoor air pollution has been attributed to major illnesses in developing countries in recent years (4). Since most people spend more time indoors than outdoors, exposure to air pollutants mostly depends on the pollutant levels in indoor air and the time spent in indoor environments. In many countries, exposure to air pollutants from indoor sources often exceeds the exposure to the same pollutants from outdoor sources (7). In this respect, indoor air pollution poses a much greater health risk than outdoor pollution. Many studies on indoor air pollution have been carried out in developed countries. However, exposure to harmful pollutants is the highest in rural and urban households in developing countries (8). About half of the world’s population, an estimated 3 billion people (and up to 90% of poor households) use solid fuels and biomass such as wood, coal, animal dung, and crop residues that are burnt indoors on open fires or inefficient stoves, leading to high levels of indoor pollution. Poverty, poor housing conditions, and lack of adequate ventilation exacerbate this situation. Even with good ventilation, the emission factors for solid fuels are so high that exposure from smoke and pollutants can be significant (3). Harmful pollutants in the emissions from poorly functioning stoves operating indoors include respirable particulate matter (PM), carbon monoxide (CO), nitrogen oxides, benzene, formaldehyde, 1,3-butadiene, and polyaromatic hydrocarbons such as benzopyrene (7). Some solid fuels may emit toxic trace elements such as arsenic, lead, and fluorine. Burning solid fuels on inefficient stoves in poorly ventilated households may raise the indoor pollutant levels far higher than those found in outdoor air of cities (8). Indoor air pollution primarily affects women and children because of the time they spend near the stoves. The “years of life lost,” which is estimated at about 35,000 years due to IAP, is much higher than 6,400 years resulting from outdoor pollution in urban areas (1). On a global basis, 60% of acute respiratory infections (ARI), particularly pneumonia, has been linked to smoke exposure and indoor air pollution. In addition, poor indoor air quality and smoke have been implicated in chronic obstructive pulmonary disease (COPD) and lung cancer among women in developing countries (6). An estimated 2.5 million deaths occur worldwide each year due to exposure to indoor PM in rural areas in developing countries (4). Acute lower respiratory infection (ALRI) has been attributed to 20% of an estimated 12 million deaths among children under five years old (2). It has been reported that compared to gas stoves, stoves using wood release 50 times more PM and CO in cooking an equivalent meal (8). The USEPA standard for 24-hour average exposure to particulate matter less than 2.5 µm in diameter (PM2.5) is 35 µg/m3 air and for carbon monoxide the standard for 8-hour average exposure is 9 ppm (10). During cooking periods in the Bangladesh pilot areas, the household levels of these pollutants far exceed the standard limits.
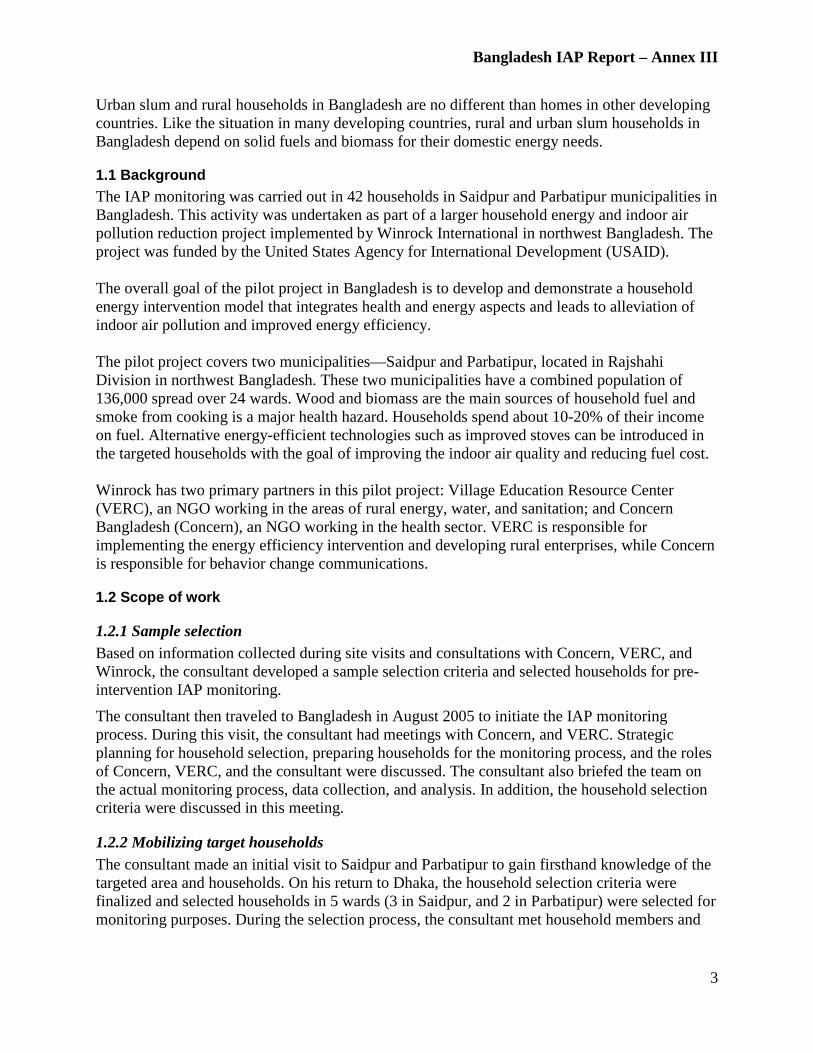
Bangladesh IAP Report – Annex III
3
Urban slum and rural households in Bangladesh are no different than homes in other developing countries. Like the situation in many developing countries, rural and urban slum households in Bangladesh depend on solid fuels and biomass for their domestic energy needs.
1.1 Background The IAP monitoring was carried out in 42 households in Saidpur and Parbatipur municipalities in Bangladesh. This activity was undertaken as part of a larger household energy and indoor air pollution reduction project implemented by Winrock International in northwest Bangladesh. The project was funded by the United States Agency for International Development (USAID). The overall goal of the pilot project in Bangladesh is to develop and demonstrate a household energy intervention model that integrates health and energy aspects and leads to alleviation of indoor air pollution and improved energy efficiency. The pilot project covers two municipalities—Saidpur and Parbatipur, located in Rajshahi Division in northwest Bangladesh. These two municipalities have a combined population of 136,000 spread over 24 wards. Wood and biomass are the main sources of household fuel and smoke from cooking is a major health hazard. Households spend about 10-20% of their income on fuel. Alternative energy-efficient technologies such as improved stoves can be introduced in the targeted households with the goal of improving the indoor air quality and reducing fuel cost. Winrock has two primary partners in this pilot project: Village Education Resource Center (VERC), an NGO working in the areas of rural energy, water, and sanitation; and Concern Bangladesh (Concern), an NGO working in the health sector. VERC is responsible for implementing the energy efficiency intervention and developing rural enterprises, while Concern is responsible for behavior change communications.
1.2 Scope of work
1.2.1 Sample selection Based on information collected during site visits and consultations with Concern, VERC, and Winrock, the consultant developed a sample selection criteria and selected households for pre-intervention IAP monitoring.
The consultant then traveled to Bangladesh in August 2005 to initiate the IAP monitoring process. During this visit, the consultant had meetings with Concern, and VERC. Strategic planning for household selection, preparing households for the monitoring process, and the roles of Concern, VERC, and the consultant were discussed. The consultant also briefed the team on the actual monitoring process, data collection, and analysis. In addition, the household selection criteria were discussed in this meeting.
1.2.2 Mobilizing target households The consultant made an initial visit to Saidpur and Parbatipur to gain firsthand knowledge of the targeted area and households. On his return to Dhaka, the household selection criteria were finalized and selected households in 5 wards (3 in Saidpur, and 2 in Parbatipur) were selected for monitoring purposes. During the selection process, the consultant met household members and

Bangladesh IAP Report – Annex III
4
explained the IAP monitoring process, rationale for monitoring, and roles of household members in the process. The selection criteria included the following:
1. Low-income households (cannot afford fuel cost) 2. Congested households (attached to other households, so cooking smoke poses serious
health risks) 3. Households cooking indoors throughout the year 4. Households with children under 5 years of age
1.2.3 Pre-intervention IAP monitoring IAP monitoring was undertaken consisting of PM2.5 and CO level measurements in indoor air in 42 households (26 spread over 3 wards in Saidpur, and 16 spread over 2 wards in Parbatipur). The following box gives a breakdown of the IDs used to denote selected households for which IAP measurements were carried out in the cooking area and living area of each home. Saidpur: Total of 26 households Ward 14: ID S-141, S-142, S-142(2), S-143, S-144, S-145, S-146, S-147, S-148 Ward 3: ID S-31, S-32, S-33, S-34, S-35, S-36, S-37, S-37(2), S-38 Ward 9: ID S-91, S-92, S-93, S-94, S-95, S-96, S-97, S-98 Parbatipur: Total of 16 households Ward 8: ID P-81, P-82, P-83, P-84, P-85, P-86, P-87, P-88 Ward 7: ID P-71, P-72, P-73, P-74, P-75, P-76, P-77, P-78 In many households there were no separate kitchen and living rooms; rather the household had a single room where family members cook and sleep. Therefore these households had one common cooking and living area. Particulate matter (PM2.5) in the air was measured by two Minivol (Airmetrics Co., Oregon, USA) air samplers and CO was monitored every minute over a 24-hour period in all households by two T82 real time potentiometric area monitors manufactured by Industrial Scientific Corporation (USA). The consultant provided two Minivol air samplers while Winrock provided two T82 CO monitors for the project. The consultant was responsible for transporting all equipment between the two municipalities and preparing all the samples.
1.2.4 Filter preparation and pre-monitoring weighing All the air filters were coded, labeled, and weighed before being transported to Bangladesh.
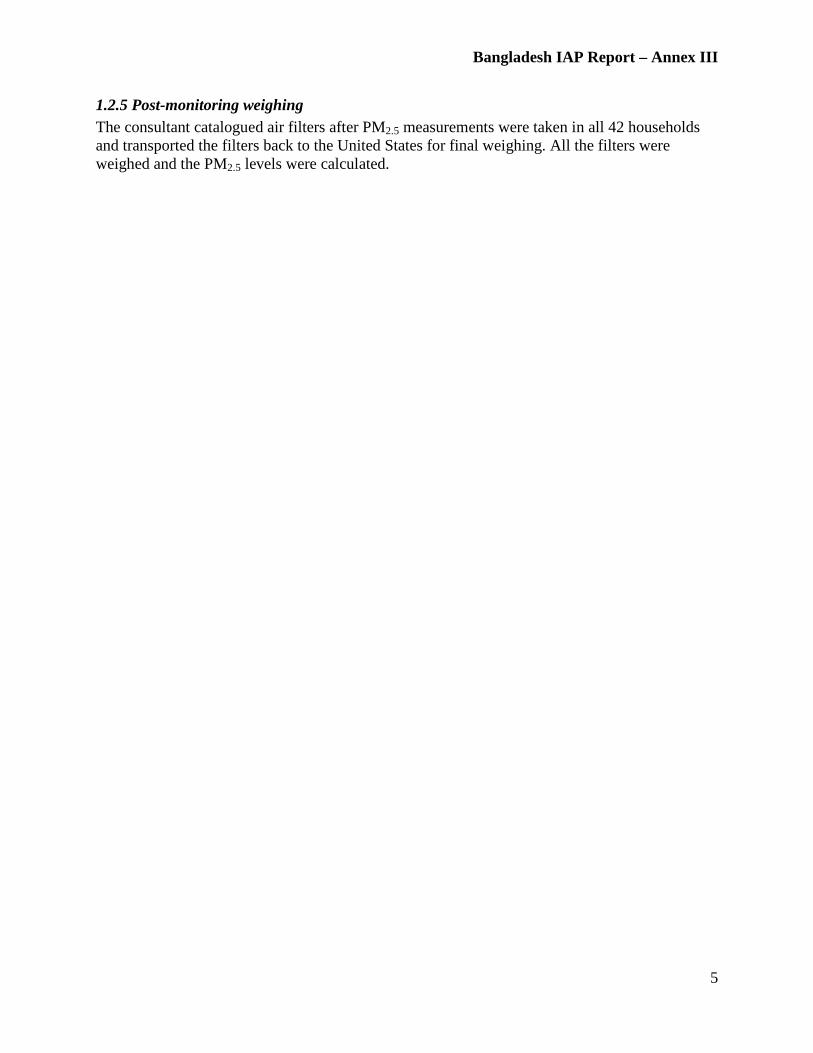
Bangladesh IAP Report – Annex III
5
1.2.5 Post-monitoring weighing The consultant catalogued air filters after PM2.5 measurements were taken in all 42 households and transported the filters back to the United States for final weighing. All the filters were weighed and the PM2.5 levels were calculated.
Bangladesh IAP Report – Annex III
6
2. Pre-intervention IAP monitoring in Saidpur and Parbatipur, Bangladesh Two types of pollutants were measured: particulate matter with a diameter less than 2.5 micrometer (PM2.5); and carbon monoxide (CO).
The monitoring team was composed of the consultant and an assistant. The consultant was responsible for making sure the instruments were functioning properly. He was also responsible for calibration of the equipments, training the assistant consultant in operating the equipment properly, and checking the flow rate of air in the air sampler.
2.1 Post-monitoring questionnaire The post-monitoring questionnaire had several objectives:
1. Provide information about household members, and identify the primary cook.
2. Determine the number of times each household cooks each day, and duration of the cooking period.
3. Determine the number of people residing in the house at the time of cooking, and length of time any member stays with the primary cook during cooking.
4. List the fuels used and proximity of the living area, and make any observations that may be useful in the determination of exposure levels from PM and CO.
A post-monitoring interview in each household was performed to obtain pertinent data. The sample questionnaire is included in Annex IV.
2.2 Measuring pollutant levels in all households Prior to the actual monitoring process, a trial monitoring took place in one household for 24 hours to make sure the equipment was functioning properly over a 24-hour cycle. Trial CO data was collected and downloaded in the computer, and the air sampler and CO monitors were prepared in timely fashion. Two Minivol air samplers were employed for collecting PM2.5 data and two T82 CO monitors were employed for CO monitoring.
2.3 Air filter weighing A Sartorius MC5 electronic microbalance with a minimum resolution of 0.001 mg and a precision of ± 0.001 mg was used for weighing all air filters. The zero of the microbalance was checked at the beginning and periodically in the middle of weighing each batch of samples. Relative humidity and temperature of the room were recorded. Weights of 100 mg and 200 mg which are certified as traceable to National Institute of Standards and Technology (NIST) mass standards were used for calibrating the microbalance. Teflon forceps were used to handle air filters (47 mm diameter) all the times. All air filters were stored in filter support cassettes with a cover. The air filters were then carried by the consultant to Bangladesh in a cassette rack wrapped in a polyethylene bag. Each air filter was labeled with code numbers for the household cooking area and living area and all the filter codes and household identification codes were recorded as soon as the IAP monitoring was finished in a household.
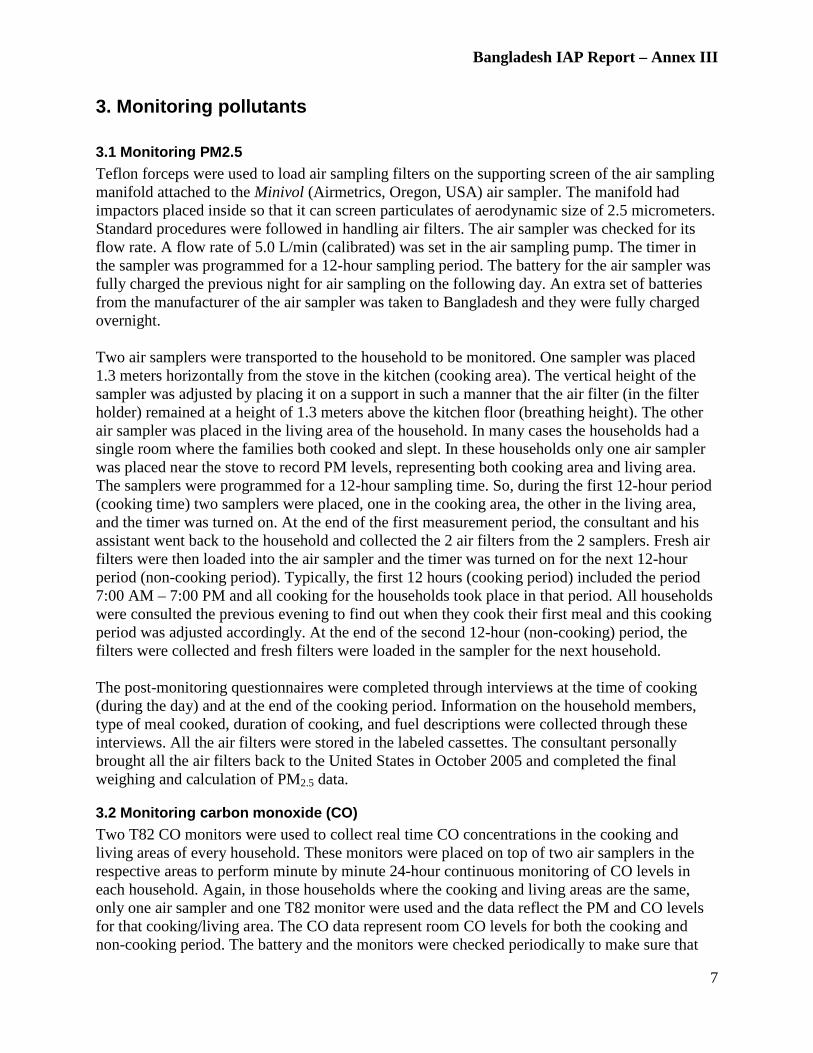
Bangladesh IAP Report – Annex III
7
3. Monitoring pollutants
3.1 Monitoring PM2.5 Teflon forceps were used to load air sampling filters on the supporting screen of the air sampling manifold attached to the Minivol (Airmetrics, Oregon, USA) air sampler. The manifold had impactors placed inside so that it can screen particulates of aerodynamic size of 2.5 micrometers. Standard procedures were followed in handling air filters. The air sampler was checked for its flow rate. A flow rate of 5.0 L/min (calibrated) was set in the air sampling pump. The timer in the sampler was programmed for a 12-hour sampling period. The battery for the air sampler was fully charged the previous night for air sampling on the following day. An extra set of batteries from the manufacturer of the air sampler was taken to Bangladesh and they were fully charged overnight. Two air samplers were transported to the household to be monitored. One sampler was placed 1.3 meters horizontally from the stove in the kitchen (cooking area). The vertical height of the sampler was adjusted by placing it on a support in such a manner that the air filter (in the filter holder) remained at a height of 1.3 meters above the kitchen floor (breathing height). The other air sampler was placed in the living area of the household. In many cases the households had a single room where the families both cooked and slept. In these households only one air sampler was placed near the stove to record PM levels, representing both cooking area and living area. The samplers were programmed for a 12-hour sampling time. So, during the first 12-hour period (cooking time) two samplers were placed, one in the cooking area, the other in the living area, and the timer was turned on. At the end of the first measurement period, the consultant and his assistant went back to the household and collected the 2 air filters from the 2 samplers. Fresh air filters were then loaded into the air sampler and the timer was turned on for the next 12-hour period (non-cooking period). Typically, the first 12 hours (cooking period) included the period 7:00 AM – 7:00 PM and all cooking for the households took place in that period. All households were consulted the previous evening to find out when they cook their first meal and this cooking period was adjusted accordingly. At the end of the second 12-hour (non-cooking) period, the filters were collected and fresh filters were loaded in the sampler for the next household. The post-monitoring questionnaires were completed through interviews at the time of cooking (during the day) and at the end of the cooking period. Information on the household members, type of meal cooked, duration of cooking, and fuel descriptions were collected through these interviews. All the air filters were stored in the labeled cassettes. The consultant personally brought all the air filters back to the United States in October 2005 and completed the final weighing and calculation of PM2.5 data.
3.2 Monitoring carbon monoxide (CO) Two T82 CO monitors were used to collect real time CO concentrations in the cooking and living areas of every household. These monitors were placed on top of two air samplers in the respective areas to perform minute by minute 24-hour continuous monitoring of CO levels in each household. Again, in those households where the cooking and living areas are the same, only one air sampler and one T82 monitor were used and the data reflect the PM and CO levels for that cooking/living area. The CO data represent room CO levels for both the cooking and non-cooking period. The battery and the monitors were checked periodically to make sure that

Bangladesh IAP Report – Annex III
8
the monitors were working properly. Fresh batteries were placed in both the CO monitors prior to use in the very first house in the list. At the end of the 24-hour CO monitoring, the data were downloaded to the computer and saved. The memory of the T82 monitor was cleared before the monitoring began in the next household. The CO data for each household was then plotted as a function of time in minutes over the 24-hour period. Data on household cooking activities were also substantiated from the responses in the post-monitoring questionnaire.
3.3 Fuel use in household stoves Table 1 gives the distribution of households by the type of fuel used in stoves for cooking. In the households where IAP was monitored, wood and briquettes happen to be the common type of fuel in Saidpur, while wood, bamboo, dung cakes are the most common fuels used in Parbatipur. “Briquette” is the local name for a type of fuel composed of rice husk and sawdust compressed in a solid cylindrical shape. The user then chops it into small pieces prior to burning in the stoves. Overall, important fuels for cooking are found to be wood (41%), briquettes (29%), bamboo (19%), and dung cakes (21%). A number of households use a combination of fuels. Although the number of households sampled for IAP is small, it is interesting to note the difference in fuel use in two municipalities separated by a distance of 20 kilometers.
Table 1. Distribution of fuel use in households in Saidpur and Parbatipur32
Type of fuel Number of households % households Saidpur Parbatipur Coconut husk 2 - 4.8 Briquette 12 - 28.6 Wood 12 5 40.5 Bamboo 3 5 19.0 Dung cakes 3 6 21.4 Other (jute sticks, dry leaves, paper, cane)
4 7 16.7
32 Respondents could pick more than one fuel
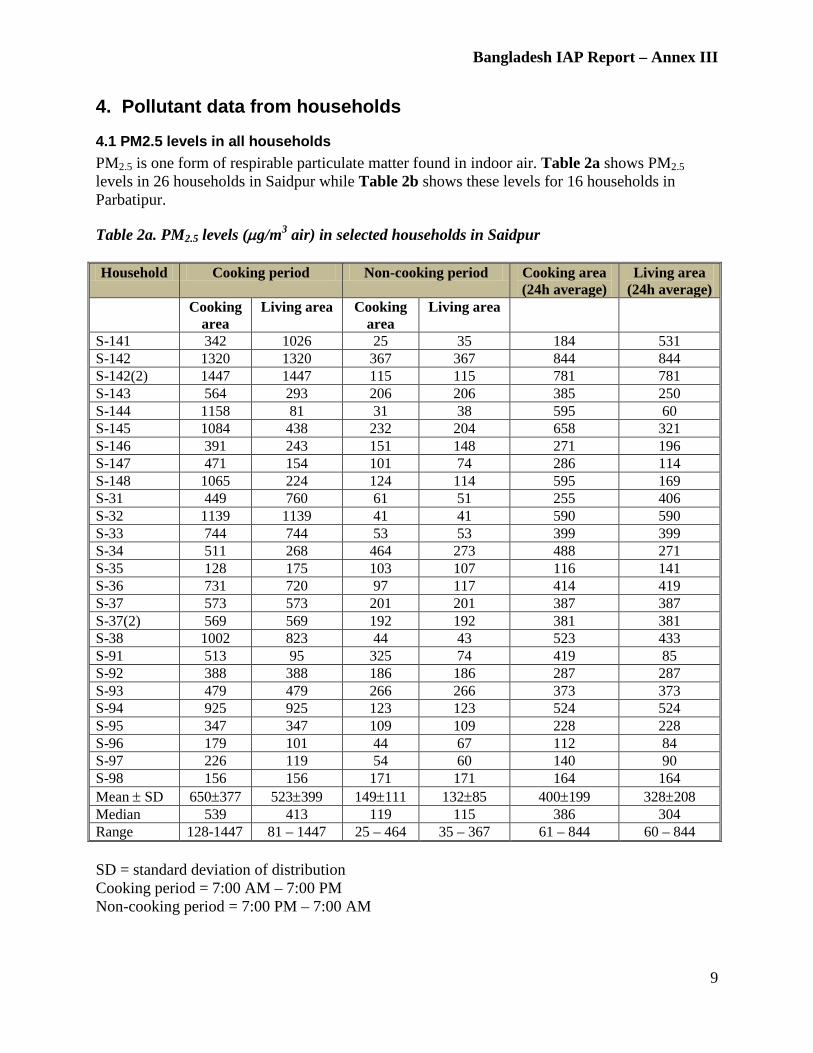
Bangladesh IAP Report – Annex III
9
4. Pollutant data from households
4.1 PM2.5 levels in all households PM2.5 is one form of respirable particulate matter found in indoor air. Table 2a shows PM2.5 levels in 26 households in Saidpur while Table 2b shows these levels for 16 households in Parbatipur. Table 2a. PM2.5 levels (µg/m3 air) in selected households in Saidpur Household Cooking period Non-cooking period Cooking area
(24h average) Living area
(24h average) Cooking
area Living area Cooking
area Living area
S-141 342 1026 25 35 184 531 S-142 1320 1320 367 367 844 844 S-142(2) 1447 1447 115 115 781 781 S-143 564 293 206 206 385 250 S-144 1158 81 31 38 595 60 S-145 1084 438 232 204 658 321 S-146 391 243 151 148 271 196 S-147 471 154 101 74 286 114 S-148 1065 224 124 114 595 169 S-31 449 760 61 51 255 406 S-32 1139 1139 41 41 590 590 S-33 744 744 53 53 399 399 S-34 511 268 464 273 488 271 S-35 128 175 103 107 116 141 S-36 731 720 97 117 414 419 S-37 573 573 201 201 387 387 S-37(2) 569 569 192 192 381 381 S-38 1002 823 44 43 523 433 S-91 513 95 325 74 419 85 S-92 388 388 186 186 287 287 S-93 479 479 266 266 373 373 S-94 925 925 123 123 524 524 S-95 347 347 109 109 228 228 S-96 179 101 44 67 112 84 S-97 226 119 54 60 140 90 S-98 156 156 171 171 164 164 Mean ± SD 650±377 523±399 149±111 132±85 400±199 328±208 Median 539 413 119 115 386 304 Range 128-1447 81 – 1447 25 – 464 35 – 367 61 – 844 60 – 844 SD = standard deviation of distribution Cooking period = 7:00 AM – 7:00 PM Non-cooking period = 7:00 PM – 7:00 AM

Bangladesh IAP Report – Annex III
10
Unusually high (3020 µg/m3 air) PM levels were recorded for household P-73 in Parbatipur. This household has unusual cooking practices, compared to others. Four families share a common stove in the house, and cook on the same stove one after the other. For the same cooking period for all households, this household had a much longer actual cooking time. Accordingly, the accumulated PM during the cooking period was high in this household. The smoke and PM seem to disperse well during the non-cooking period and a low PM was observed during this period. Since unusually high PM values during the cooking period might skew the overall mean for all households in the cohort, the PM data from this household was excluded in calculating the grand mean. Table 2b. PM2.5 levels (µg/m3 air) in selected households in Parbatipur Household Cooking period Non-cooking period Cooking area
(24h average) Living area
(24h average) Cooking
area Living area Cooking
area Living area
P-81 393 393 28 28 211 211 P-82 474 474 79 79 277 277 P-83 458 458 34 34 245 246 P-84 789 789 134 134 462 462 P-85 791 791 273 273 532 532 P-86 254 254 89 89 172 172 P-87 156 156 27 27 92 92 P-88 244 244 64 64 154 154 P-71 359 359 305 305 332 332 P-72 85 85 37 37 61 61 P-73 3020 3020 72 72 1546 1546 P-74 172 172 67 67 120 120 P-75 111 111 65 65 88 88 P-76 1081 1081 48 48 565 565 P-77 191 191 116 116 154 154 P-78 127 127 40 40 84 84 Mean ± SD 379±296 379±296 94±85 94±85 237±166 237±166 Median 254 254 65 65 172 172 Range 85-1081 85 – 1081 27 – 305 27 – 305 61 – 565 61 – 565 NOTE: Household P-73 was excluded from the calculations because there were multiple families using the stove(s) in that household and this caused high emissions. SD = standard deviation of distribution Cooking period = 7:00 AM – 7:00 PM Non-cooking period = 7:00 PM – 7:00 AM
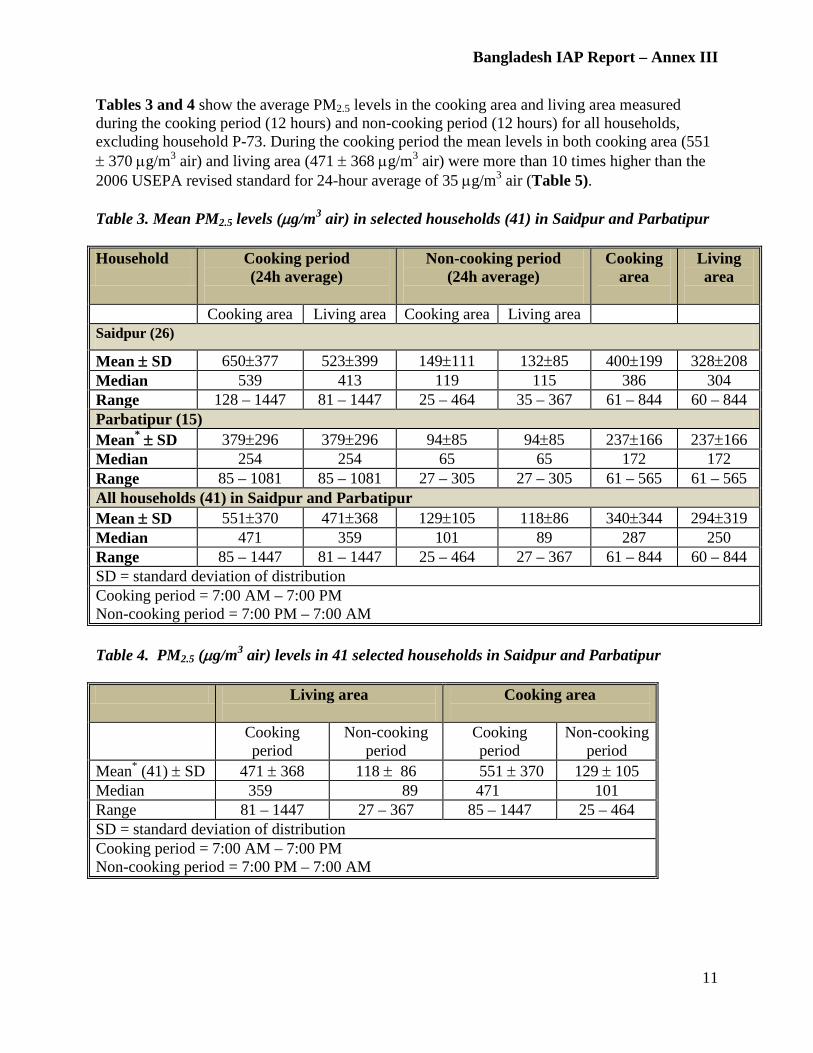
Bangladesh IAP Report – Annex III
11
Tables 3 and 4 show the average PM2.5 levels in the cooking area and living area measured during the cooking period (12 hours) and non-cooking period (12 hours) for all households, excluding household P-73. During the cooking period the mean levels in both cooking area (551 ± 370 µg/m3 air) and living area (471 ± 368 µg/m3 air) were more than 10 times higher than the 2006 USEPA revised standard for 24-hour average of 35 µg/m3 air (Table 5). Table 3. Mean PM2.5 levels (µg/m3 air) in selected households (41) in Saidpur and Parbatipur Household
Cooking period (24h average)
Non-cooking period (24h average)
Cooking area
Living area
Cooking area Living area Cooking area Living area Saidpur (26)
Mean ± SD 650±377 523±399 149±111 132±85 400±199 328±208 Median 539 413 119 115 386 304 Range 128 – 1447 81 – 1447 25 – 464 35 – 367 61 – 844 60 – 844 Parbatipur (15) Mean* ± SD 379±296 379±296 94±85 94±85 237±166 237±166 Median 254 254 65 65 172 172 Range 85 – 1081 85 – 1081 27 – 305 27 – 305 61 – 565 61 – 565 All households (41) in Saidpur and Parbatipur Mean ± SD 551±370 471±368 129±105 118±86 340±344 294±319 Median 471 359 101 89 287 250 Range 85 – 1447 81 – 1447 25 – 464 27 – 367 61 – 844 60 – 844 SD = standard deviation of distribution Cooking period = 7:00 AM – 7:00 PM Non-cooking period = 7:00 PM – 7:00 AM Table 4. PM2.5 (µg/m3 air) levels in 41 selected households in Saidpur and Parbatipur Living area
Cooking area
Cooking
period Non-cooking
period Cooking period
Non-cooking period
Mean* (41) ± SD 471 ± 368 118 ± 86 551 ± 370 129 ± 105 Median 359 89 471 101 Range 81 – 1447 27 – 367 85 – 1447 25 – 464 SD = standard deviation of distribution Cooking period = 7:00 AM – 7:00 PM Non-cooking period = 7:00 PM – 7:00 AM
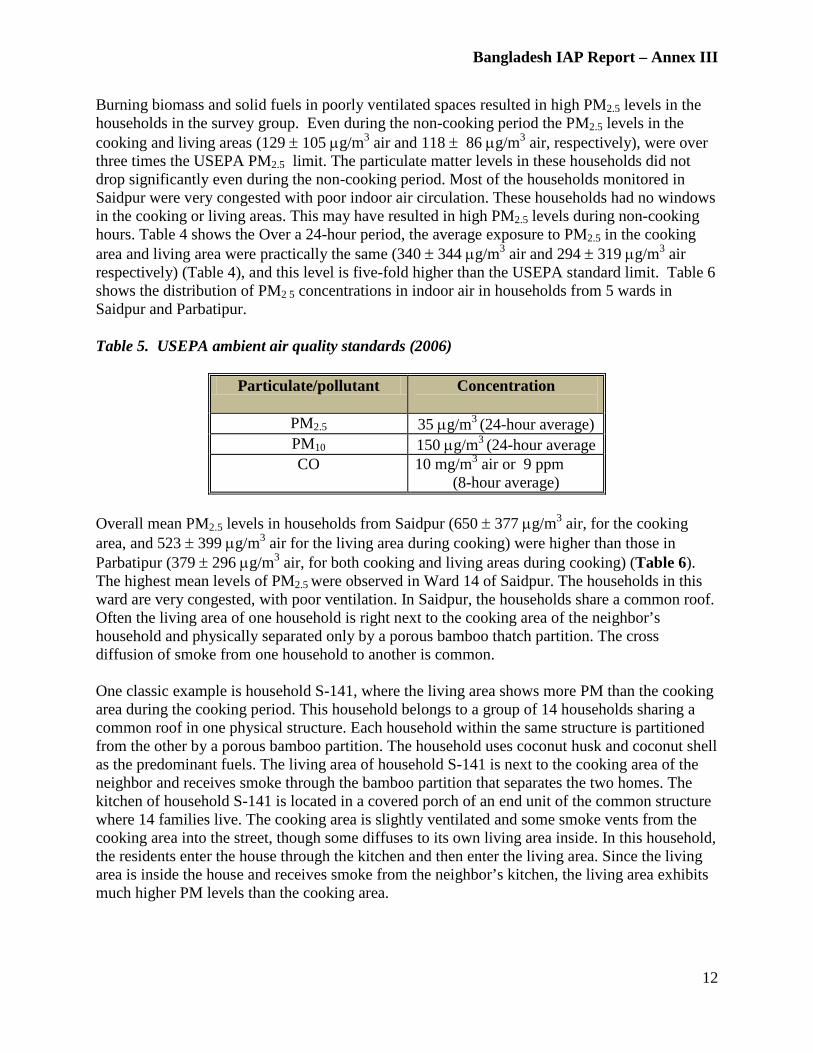
Bangladesh IAP Report – Annex III
12
Burning biomass and solid fuels in poorly ventilated spaces resulted in high PM2.5 levels in the households in the survey group. Even during the non-cooking period the PM2.5 levels in the cooking and living areas (129 ± 105 µg/m3 air and 118 ± 86 µg/m3 air, respectively), were over three times the USEPA PM2.5 limit. The particulate matter levels in these households did not drop significantly even during the non-cooking period. Most of the households monitored in Saidpur were very congested with poor indoor air circulation. These households had no windows in the cooking or living areas. This may have resulted in high PM2.5 levels during non-cooking hours. Table 4 shows the Over a 24-hour period, the average exposure to PM2.5 in the cooking area and living area were practically the same (340 ± 344 µg/m3 air and 294 ± 319 µg/m3 air respectively) (Table 4), and this level is five-fold higher than the USEPA standard limit. Table 6 shows the distribution of PM2 5 concentrations in indoor air in households from 5 wards in Saidpur and Parbatipur. Table 5. USEPA ambient air quality standards (2006)
Particulate/pollutant Concentration
PM2.5 35 µg/m3 (24-hour average) PM10 150 µg/m3 (24-hour average CO 10 mg/m3 air or 9 ppm
(8-hour average) Overall mean PM2.5 levels in households from Saidpur (650 ± 377 µg/m3 air, for the cooking area, and 523 ± 399 µg/m3 air for the living area during cooking) were higher than those in Parbatipur (379 ± 296 µg/m3 air, for both cooking and living areas during cooking) (Table 6). The highest mean levels of PM2.5 were observed in Ward 14 of Saidpur. The households in this ward are very congested, with poor ventilation. In Saidpur, the households share a common roof. Often the living area of one household is right next to the cooking area of the neighbor’s household and physically separated only by a porous bamboo thatch partition. The cross diffusion of smoke from one household to another is common. One classic example is household S-141, where the living area shows more PM than the cooking area during the cooking period. This household belongs to a group of 14 households sharing a common roof in one physical structure. Each household within the same structure is partitioned from the other by a porous bamboo partition. The household uses coconut husk and coconut shell as the predominant fuels. The living area of household S-141 is next to the cooking area of the neighbor and receives smoke through the bamboo partition that separates the two homes. The kitchen of household S-141 is located in a covered porch of an end unit of the common structure where 14 families live. The cooking area is slightly ventilated and some smoke vents from the cooking area into the street, though some diffuses to its own living area inside. In this household, the residents enter the house through the kitchen and then enter the living area. Since the living area is inside the house and receives smoke from the neighbor’s kitchen, the living area exhibits much higher PM levels than the cooking area.
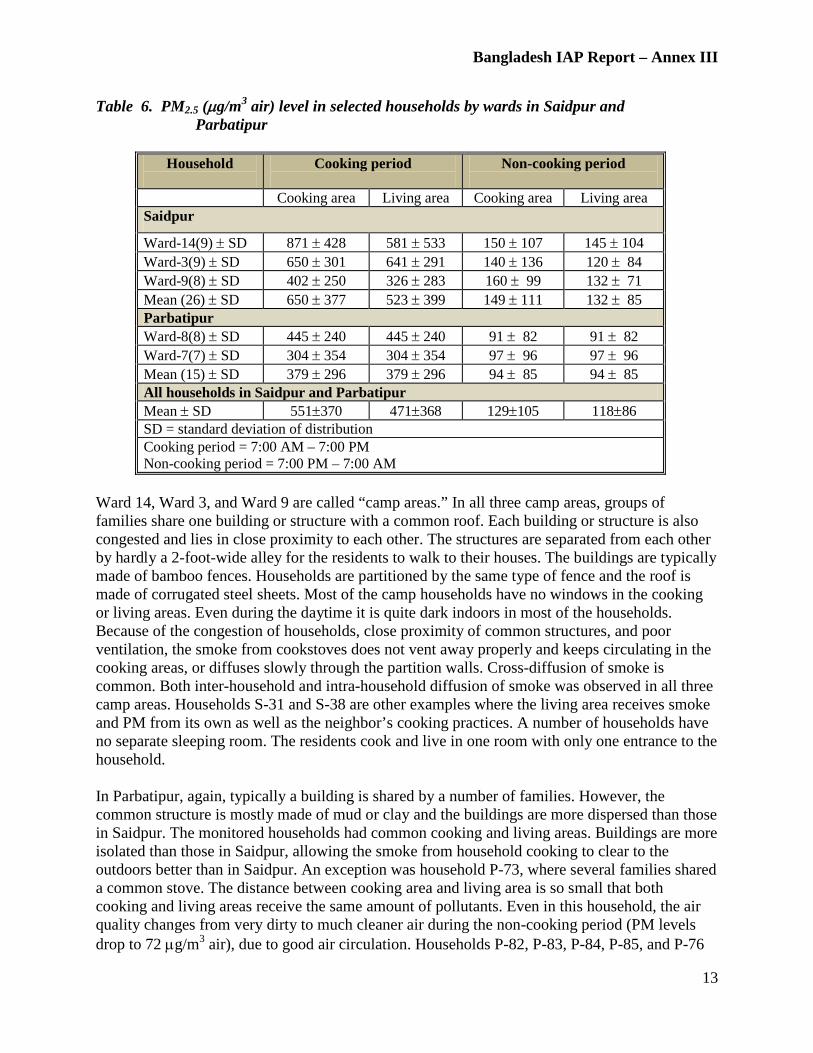
Bangladesh IAP Report – Annex III
13
Table 6. PM2.5 (µg/m3 air) level in selected households by wards in Saidpur and Parbatipur
Household
Cooking period
Non-cooking period
Cooking area Living area Cooking area Living area Saidpur
Ward-14(9) ± SD 871 ± 428 581 ± 533 150 ± 107 145 ± 104 Ward-3(9) ± SD 650 ± 301 641 ± 291 140 ± 136 120 ± 84 Ward-9(8) ± SD 402 ± 250 326 ± 283 160 ± 99 132 ± 71 Mean (26) ± SD 650 ± 377 523 ± 399 149 ± 111 132 ± 85 Parbatipur Ward-8(8) ± SD 445 ± 240 445 ± 240 91 ± 82 91 ± 82 Ward-7(7) ± SD 304 ± 354 304 ± 354 97 ± 96 97 ± 96 Mean (15) ± SD 379 ± 296 379 ± 296 94 ± 85 94 ± 85 All households in Saidpur and Parbatipur Mean ± SD 551±370 471±368 129±105 118±86 SD = standard deviation of distribution Cooking period = 7:00 AM – 7:00 PM Non-cooking period = 7:00 PM – 7:00 AM
Ward 14, Ward 3, and Ward 9 are called “camp areas.” In all three camp areas, groups of families share one building or structure with a common roof. Each building or structure is also congested and lies in close proximity to each other. The structures are separated from each other by hardly a 2-foot-wide alley for the residents to walk to their houses. The buildings are typically made of bamboo fences. Households are partitioned by the same type of fence and the roof is made of corrugated steel sheets. Most of the camp households have no windows in the cooking or living areas. Even during the daytime it is quite dark indoors in most of the households. Because of the congestion of households, close proximity of common structures, and poor ventilation, the smoke from cookstoves does not vent away properly and keeps circulating in the cooking areas, or diffuses slowly through the partition walls. Cross-diffusion of smoke is common. Both inter-household and intra-household diffusion of smoke was observed in all three camp areas. Households S-31 and S-38 are other examples where the living area receives smoke and PM from its own as well as the neighbor’s cooking practices. A number of households have no separate sleeping room. The residents cook and live in one room with only one entrance to the household. In Parbatipur, again, typically a building is shared by a number of families. However, the common structure is mostly made of mud or clay and the buildings are more dispersed than those in Saidpur. The monitored households had common cooking and living areas. Buildings are more isolated than those in Saidpur, allowing the smoke from household cooking to clear to the outdoors better than in Saidpur. An exception was household P-73, where several families shared a common stove. The distance between cooking area and living area is so small that both cooking and living areas receive the same amount of pollutants. Even in this household, the air quality changes from very dirty to much cleaner air during the non-cooking period (PM levels drop to 72 µg/m3 air), due to good air circulation. Households P-82, P-83, P-84, P-85, and P-76
Bangladesh IAP Report – Annex III
14
also show high PM levels during the cooking period due to poor ventilation. Interestingly, in most of these households, PM levels drop much lower during non-cooking periods since the smoke clears out during this period and fresh air recycles. In this pre-intervention study, the PM levels in Saidpur and Parbatipur were dependent on the configuration and ventilation of households. The use of improved cookstoves would have reduced the level of indoor air pollution even without adequate ventilation. For the 42 households monitored, there was no observed trend in PM levels as a function of types of fuel. The 42 households chosen in this study belong to the larger pool of households where a comprehensive survey has been carried out by Concern and VERC regarding the structure, configuration of households, cooking practices, fuel use, frequency of cooking, prevalence of respiratory infections, and adverse health effects of poor indoor air (11). The overall survey report also mentions that the household structure, cooking place, and type of ventilation are different in Saidpur and Parbatipur. The report (11) mentions that most of the households in these municipalities cook outdoors. However, the IAP monitoring conducted in this study was done in households where families cook indoors.
4.2 Particulate matter in cooking area and living area Because of the proximity of living areas to the cooking areas, the smoke and particulate matter can easily diffuse from the cooking area to the living area. In general, the PM levels were observed to be higher in cooking areas than the living areas in Saidpur during the cooking period. For Parbatipur, the cooking area was an integral part of the living area for all households surveyed, resulting in similar PM levels in the cooking and living areas, especially during the non-cooking period, although during the cooking period, PM in the cooking area is greater than in the living area. The PM levels depend on a number of factors such as frequency of cooking, length of cooking period for each household, the configuration of the house, and the adequacy of ventilation.
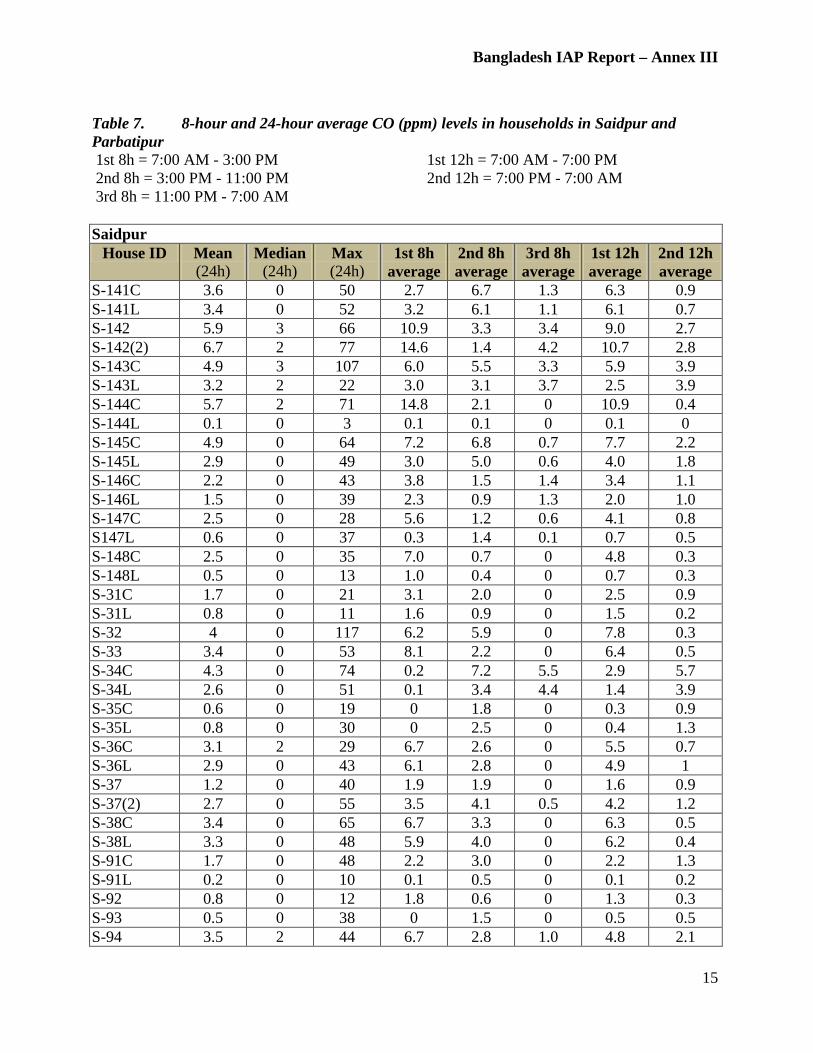
Bangladesh IAP Report – Annex III
15
Table 7. 8-hour and 24-hour average CO (ppm) levels in households in Saidpur and Parbatipur 1st 8h = 7:00 AM - 3:00 PM 2nd 8h = 3:00 PM - 11:00 PM 3rd 8h = 11:00 PM - 7:00 AM
1st 12h = 7:00 AM - 7:00 PM 2nd 12h = 7:00 PM - 7:00 AM
Saidpur
House ID Mean (24h)
Median (24h)
Max (24h)
1st 8h average
2nd 8h average
3rd 8h average
1st 12h average
2nd 12h average
S-141C 3.6 0 50 2.7 6.7 1.3 6.3 0.9 S-141L 3.4 0 52 3.2 6.1 1.1 6.1 0.7 S-142 5.9 3 66 10.9 3.3 3.4 9.0 2.7 S-142(2) 6.7 2 77 14.6 1.4 4.2 10.7 2.8 S-143C 4.9 3 107 6.0 5.5 3.3 5.9 3.9 S-143L 3.2 2 22 3.0 3.1 3.7 2.5 3.9 S-144C 5.7 2 71 14.8 2.1 0 10.9 0.4 S-144L 0.1 0 3 0.1 0.1 0 0.1 0 S-145C 4.9 0 64 7.2 6.8 0.7 7.7 2.2 S-145L 2.9 0 49 3.0 5.0 0.6 4.0 1.8 S-146C 2.2 0 43 3.8 1.5 1.4 3.4 1.1 S-146L 1.5 0 39 2.3 0.9 1.3 2.0 1.0 S-147C 2.5 0 28 5.6 1.2 0.6 4.1 0.8 S147L 0.6 0 37 0.3 1.4 0.1 0.7 0.5 S-148C 2.5 0 35 7.0 0.7 0 4.8 0.3 S-148L 0.5 0 13 1.0 0.4 0 0.7 0.3 S-31C 1.7 0 21 3.1 2.0 0 2.5 0.9 S-31L 0.8 0 11 1.6 0.9 0 1.5 0.2 S-32 4 0 117 6.2 5.9 0 7.8 0.3 S-33 3.4 0 53 8.1 2.2 0 6.4 0.5 S-34C 4.3 0 74 0.2 7.2 5.5 2.9 5.7 S-34L 2.6 0 51 0.1 3.4 4.4 1.4 3.9 S-35C 0.6 0 19 0 1.8 0 0.3 0.9 S-35L 0.8 0 30 0 2.5 0 0.4 1.3 S-36C 3.1 2 29 6.7 2.6 0 5.5 0.7 S-36L 2.9 0 43 6.1 2.8 0 4.9 1 S-37 1.2 0 40 1.9 1.9 0 1.6 0.9 S-37(2) 2.7 0 55 3.5 4.1 0.5 4.2 1.2 S-38C 3.4 0 65 6.7 3.3 0 6.3 0.5 S-38L 3.3 0 48 5.9 4.0 0 6.2 0.4 S-91C 1.7 0 48 2.2 3.0 0 2.2 1.3 S-91L 0.2 0 10 0.1 0.5 0 0.1 0.2 S-92 0.8 0 12 1.8 0.6 0 1.3 0.3 S-93 0.5 0 38 0 1.5 0 0.5 0.5 S-94 3.5 2 44 6.7 2.8 1.0 4.8 2.1
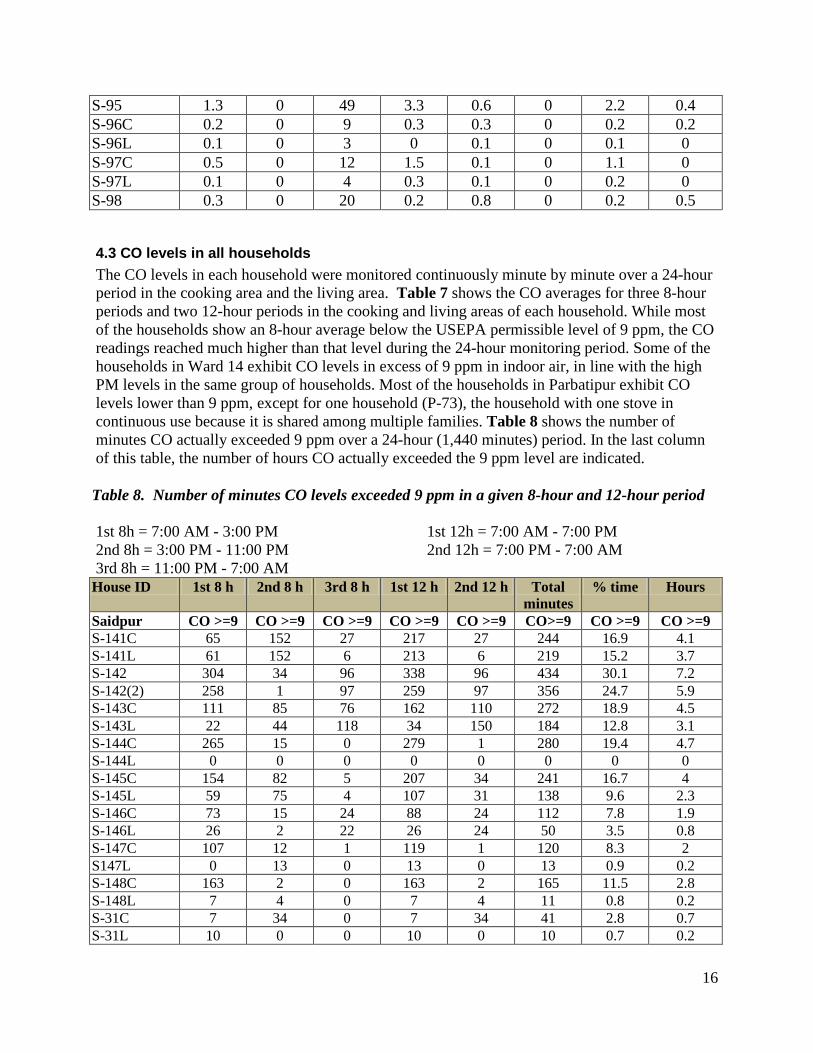
16
S-95 1.3 0 49 3.3 0.6 0 2.2 0.4 S-96C 0.2 0 9 0.3 0.3 0 0.2 0.2 S-96L 0.1 0 3 0 0.1 0 0.1 0 S-97C 0.5 0 12 1.5 0.1 0 1.1 0 S-97L 0.1 0 4 0.3 0.1 0 0.2 0 S-98 0.3 0 20 0.2 0.8 0 0.2 0.5
4.3 CO levels in all households The CO levels in each household were monitored continuously minute by minute over a 24-hour period in the cooking area and the living area. Table 7 shows the CO averages for three 8-hour periods and two 12-hour periods in the cooking and living areas of each household. While most of the households show an 8-hour average below the USEPA permissible level of 9 ppm, the CO readings reached much higher than that level during the 24-hour monitoring period. Some of the households in Ward 14 exhibit CO levels in excess of 9 ppm in indoor air, in line with the high PM levels in the same group of households. Most of the households in Parbatipur exhibit CO levels lower than 9 ppm, except for one household (P-73), the household with one stove in continuous use because it is shared among multiple families. Table 8 shows the number of minutes CO actually exceeded 9 ppm over a 24-hour (1,440 minutes) period. In the last column of this table, the number of hours CO actually exceeded the 9 ppm level are indicated. Table 8. Number of minutes CO levels exceeded 9 ppm in a given 8-hour and 12-hour period
1st 8h = 7:00 AM - 3:00 PM 2nd 8h = 3:00 PM - 11:00 PM 3rd 8h = 11:00 PM - 7:00 AM
1st 12h = 7:00 AM - 7:00 PM 2nd 12h = 7:00 PM - 7:00 AM
House ID 1st 8 h 2nd 8 h 3rd 8 h 1st 12 h 2nd 12 h Total minutes
% time Hours
Saidpur CO >=9 CO >=9 CO >=9 CO >=9 CO >=9 CO>=9 CO >=9 CO >=9 S-141C 65 152 27 217 27 244 16.9 4.1 S-141L 61 152 6 213 6 219 15.2 3.7 S-142 304 34 96 338 96 434 30.1 7.2 S-142(2) 258 1 97 259 97 356 24.7 5.9 S-143C 111 85 76 162 110 272 18.9 4.5 S-143L 22 44 118 34 150 184 12.8 3.1 S-144C 265 15 0 279 1 280 19.4 4.7 S-144L 0 0 0 0 0 0 0 0 S-145C 154 82 5 207 34 241 16.7 4 S-145L 59 75 4 107 31 138 9.6 2.3 S-146C 73 15 24 88 24 112 7.8 1.9 S-146L 26 2 22 26 24 50 3.5 0.8 S-147C 107 12 1 119 1 120 8.3 2 S147L 0 13 0 13 0 13 0.9 0.2 S-148C 163 2 0 163 2 165 11.5 2.8 S-148L 7 4 0 7 4 11 0.8 0.2 S-31C 7 34 0 7 34 41 2.8 0.7 S-31L 10 0 0 10 0 10 0.7 0.2
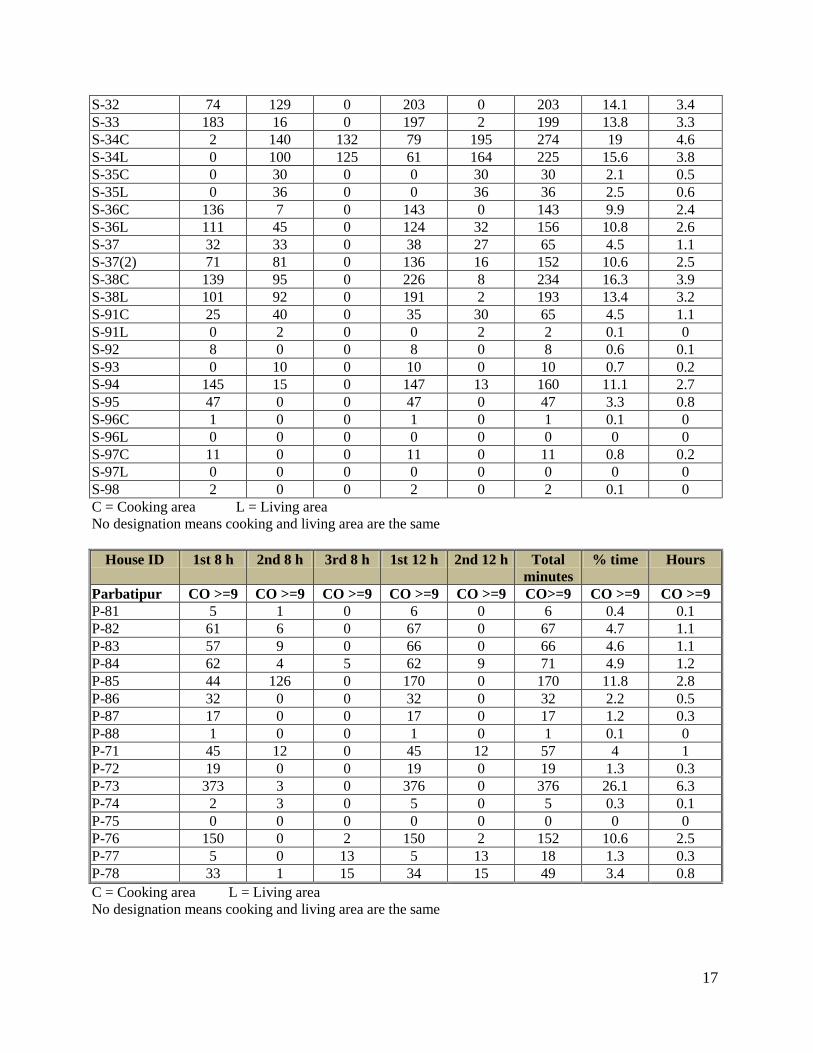
17
S-32 74 129 0 203 0 203 14.1 3.4 S-33 183 16 0 197 2 199 13.8 3.3 S-34C 2 140 132 79 195 274 19 4.6 S-34L 0 100 125 61 164 225 15.6 3.8 S-35C 0 30 0 0 30 30 2.1 0.5 S-35L 0 36 0 0 36 36 2.5 0.6 S-36C 136 7 0 143 0 143 9.9 2.4 S-36L 111 45 0 124 32 156 10.8 2.6 S-37 32 33 0 38 27 65 4.5 1.1 S-37(2) 71 81 0 136 16 152 10.6 2.5 S-38C 139 95 0 226 8 234 16.3 3.9 S-38L 101 92 0 191 2 193 13.4 3.2 S-91C 25 40 0 35 30 65 4.5 1.1 S-91L 0 2 0 0 2 2 0.1 0 S-92 8 0 0 8 0 8 0.6 0.1 S-93 0 10 0 10 0 10 0.7 0.2 S-94 145 15 0 147 13 160 11.1 2.7 S-95 47 0 0 47 0 47 3.3 0.8 S-96C 1 0 0 1 0 1 0.1 0 S-96L 0 0 0 0 0 0 0 0 S-97C 11 0 0 11 0 11 0.8 0.2 S-97L 0 0 0 0 0 0 0 0 S-98 2 0 0 2 0 2 0.1 0 C = Cooking area L = Living area No designation means cooking and living area are the same
House ID 1st 8 h 2nd 8 h 3rd 8 h 1st 12 h 2nd 12 h Total minutes
% time Hours
Parbatipur CO >=9 CO >=9 CO >=9 CO >=9 CO >=9 CO>=9 CO >=9 CO >=9 P-81 5 1 0 6 0 6 0.4 0.1 P-82 61 6 0 67 0 67 4.7 1.1 P-83 57 9 0 66 0 66 4.6 1.1 P-84 62 4 5 62 9 71 4.9 1.2 P-85 44 126 0 170 0 170 11.8 2.8 P-86 32 0 0 32 0 32 2.2 0.5 P-87 17 0 0 17 0 17 1.2 0.3 P-88 1 0 0 1 0 1 0.1 0 P-71 45 12 0 45 12 57 4 1 P-72 19 0 0 19 0 19 1.3 0.3 P-73 373 3 0 376 0 376 26.1 6.3 P-74 2 3 0 5 0 5 0.3 0.1 P-75 0 0 0 0 0 0 0 0 P-76 150 0 2 150 2 152 10.6 2.5 P-77 5 0 13 5 13 18 1.3 0.3 P-78 33 1 15 34 15 49 3.4 0.8 C = Cooking area L = Living area No designation means cooking and living area are the same
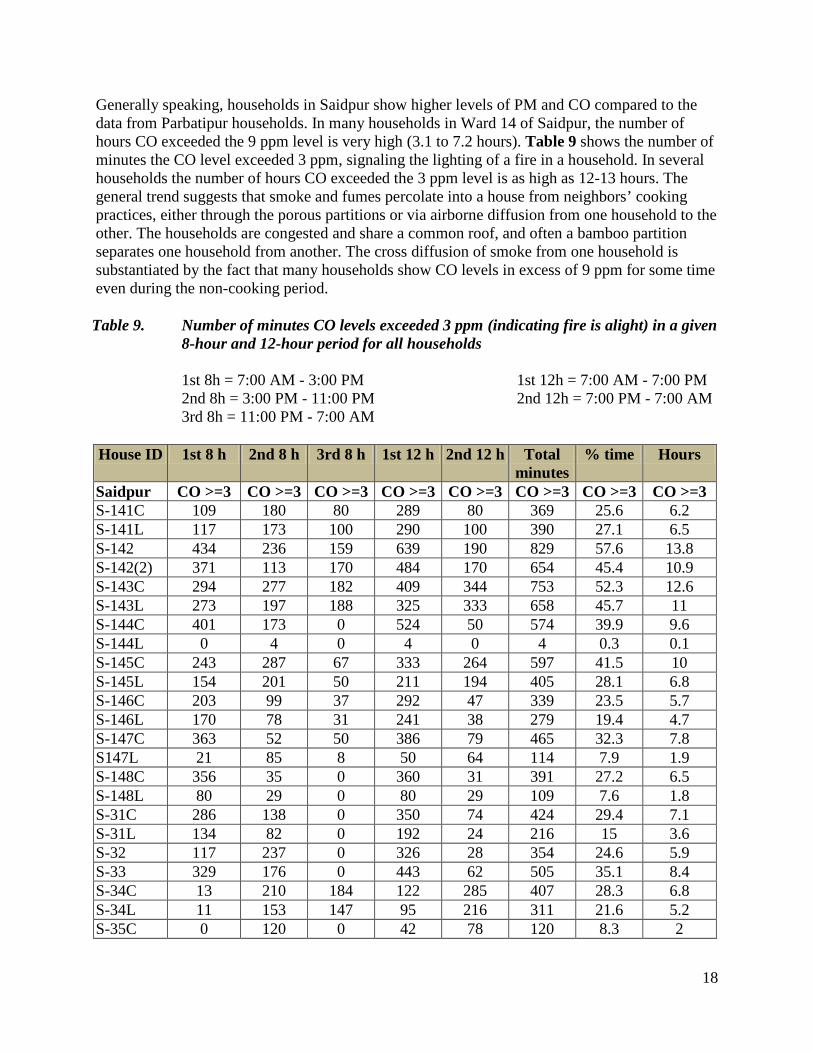
18
Generally speaking, households in Saidpur show higher levels of PM and CO compared to the data from Parbatipur households. In many households in Ward 14 of Saidpur, the number of hours CO exceeded the 9 ppm level is very high (3.1 to 7.2 hours). Table 9 shows the number of minutes the CO level exceeded 3 ppm, signaling the lighting of a fire in a household. In several households the number of hours CO exceeded the 3 ppm level is as high as 12-13 hours. The general trend suggests that smoke and fumes percolate into a house from neighbors’ cooking practices, either through the porous partitions or via airborne diffusion from one household to the other. The households are congested and share a common roof, and often a bamboo partition separates one household from another. The cross diffusion of smoke from one household is substantiated by the fact that many households show CO levels in excess of 9 ppm for some time even during the non-cooking period. Table 9. Number of minutes CO levels exceeded 3 ppm (indicating fire is alight) in a given
8-hour and 12-hour period for all households 1st 8h = 7:00 AM - 3:00 PM 2nd 8h = 3:00 PM - 11:00 PM 3rd 8h = 11:00 PM - 7:00 AM
1st 12h = 7:00 AM - 7:00 PM 2nd 12h = 7:00 PM - 7:00 AM
House ID 1st 8 h 2nd 8 h 3rd 8 h 1st 12 h 2nd 12 h Total
minutes % time Hours
Saidpur CO >=3 CO >=3 CO >=3 CO >=3 CO >=3 CO >=3 CO >=3 CO >=3 S-141C 109 180 80 289 80 369 25.6 6.2 S-141L 117 173 100 290 100 390 27.1 6.5 S-142 434 236 159 639 190 829 57.6 13.8 S-142(2) 371 113 170 484 170 654 45.4 10.9 S-143C 294 277 182 409 344 753 52.3 12.6 S-143L 273 197 188 325 333 658 45.7 11 S-144C 401 173 0 524 50 574 39.9 9.6 S-144L 0 4 0 4 0 4 0.3 0.1 S-145C 243 287 67 333 264 597 41.5 10 S-145L 154 201 50 211 194 405 28.1 6.8 S-146C 203 99 37 292 47 339 23.5 5.7 S-146L 170 78 31 241 38 279 19.4 4.7 S-147C 363 52 50 386 79 465 32.3 7.8 S147L 21 85 8 50 64 114 7.9 1.9 S-148C 356 35 0 360 31 391 27.2 6.5 S-148L 80 29 0 80 29 109 7.6 1.8 S-31C 286 138 0 350 74 424 29.4 7.1 S-31L 134 82 0 192 24 216 15 3.6 S-32 117 237 0 326 28 354 24.6 5.9 S-33 329 176 0 443 62 505 35.1 8.4 S-34C 13 210 184 122 285 407 28.3 6.8 S-34L 11 153 147 95 216 311 21.6 5.2 S-35C 0 120 0 42 78 120 8.3 2
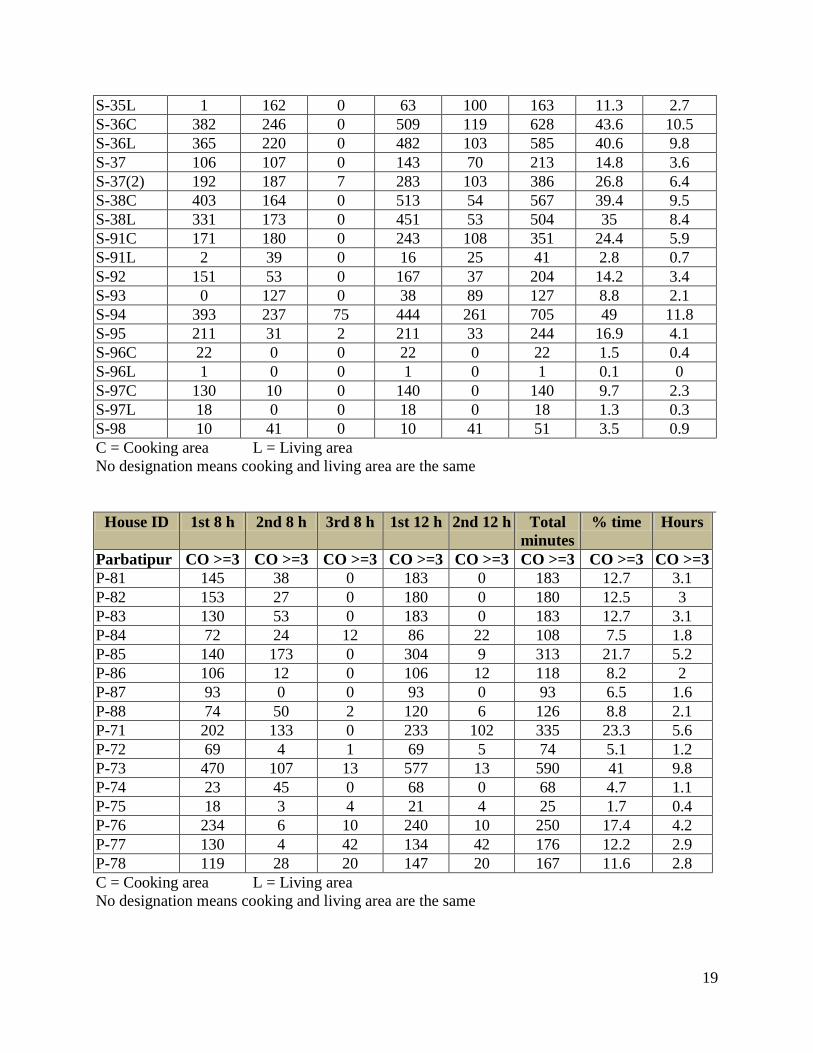
19
S-35L 1 162 0 63 100 163 11.3 2.7 S-36C 382 246 0 509 119 628 43.6 10.5 S-36L 365 220 0 482 103 585 40.6 9.8 S-37 106 107 0 143 70 213 14.8 3.6 S-37(2) 192 187 7 283 103 386 26.8 6.4 S-38C 403 164 0 513 54 567 39.4 9.5 S-38L 331 173 0 451 53 504 35 8.4 S-91C 171 180 0 243 108 351 24.4 5.9 S-91L 2 39 0 16 25 41 2.8 0.7 S-92 151 53 0 167 37 204 14.2 3.4 S-93 0 127 0 38 89 127 8.8 2.1 S-94 393 237 75 444 261 705 49 11.8 S-95 211 31 2 211 33 244 16.9 4.1 S-96C 22 0 0 22 0 22 1.5 0.4 S-96L 1 0 0 1 0 1 0.1 0 S-97C 130 10 0 140 0 140 9.7 2.3 S-97L 18 0 0 18 0 18 1.3 0.3 S-98 10 41 0 10 41 51 3.5 0.9 C = Cooking area L = Living area No designation means cooking and living area are the same
House ID 1st 8 h 2nd 8 h 3rd 8 h 1st 12 h 2nd 12 h Total
minutes % time Hours
Parbatipur CO >=3 CO >=3 CO >=3 CO >=3 CO >=3 CO >=3 CO >=3 CO >=3 P-81 145 38 0 183 0 183 12.7 3.1 P-82 153 27 0 180 0 180 12.5 3 P-83 130 53 0 183 0 183 12.7 3.1 P-84 72 24 12 86 22 108 7.5 1.8 P-85 140 173 0 304 9 313 21.7 5.2 P-86 106 12 0 106 12 118 8.2 2 P-87 93 0 0 93 0 93 6.5 1.6 P-88 74 50 2 120 6 126 8.8 2.1 P-71 202 133 0 233 102 335 23.3 5.6 P-72 69 4 1 69 5 74 5.1 1.2 P-73 470 107 13 577 13 590 41 9.8 P-74 23 45 0 68 0 68 4.7 1.1 P-75 18 3 4 21 4 25 1.7 0.4 P-76 234 6 10 240 10 250 17.4 4.2 P-77 130 4 42 134 42 176 12.2 2.9 P-78 119 28 20 147 20 167 11.6 2.8 C = Cooking area L = Living area No designation means cooking and living area are the same
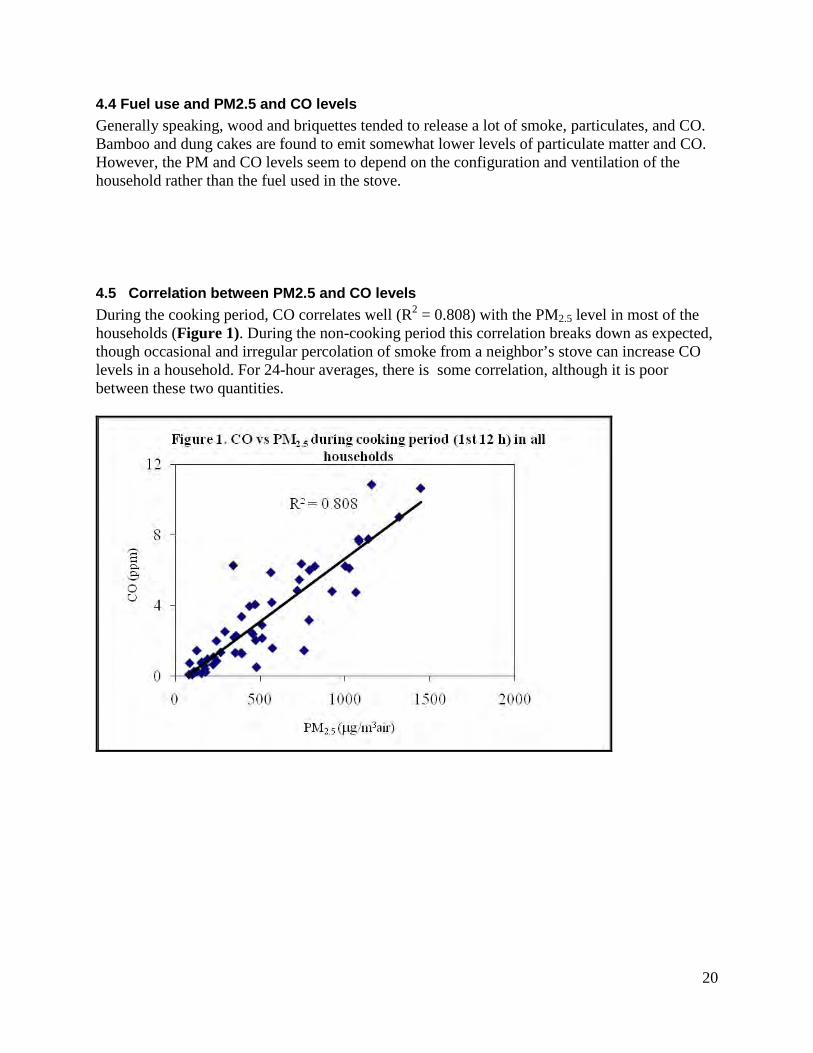
20
4.4 Fuel use and PM2.5 and CO levels Generally speaking, wood and briquettes tended to release a lot of smoke, particulates, and CO. Bamboo and dung cakes are found to emit somewhat lower levels of particulate matter and CO. However, the PM and CO levels seem to depend on the configuration and ventilation of the household rather than the fuel used in the stove.
4.5 Correlation between PM2.5 and CO levels During the cooking period, CO correlates well (R2 = 0.808) with the PM2.5 level in most of the households (Figure 1). During the non-cooking period this correlation breaks down as expected, though occasional and irregular percolation of smoke from a neighbor’s stove can increase CO levels in a household. For 24-hour averages, there is some correlation, although it is poor between these two quantities.
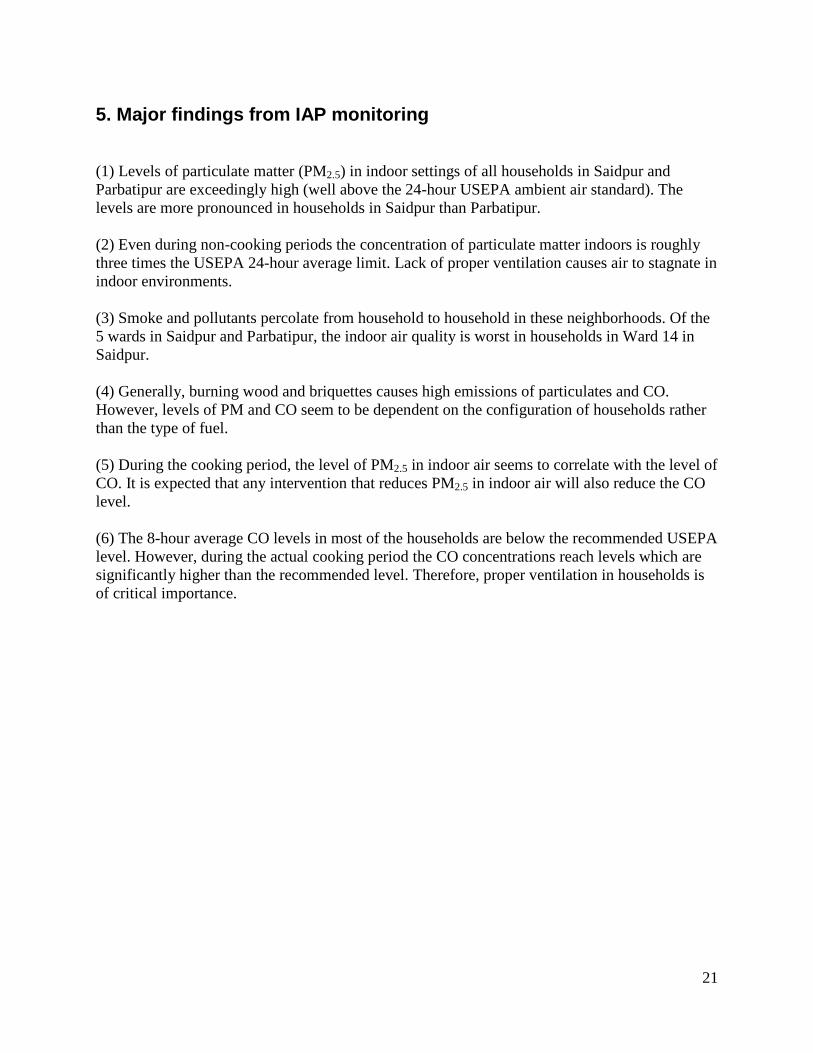
21
5. Major findings from IAP monitoring
(1) Levels of particulate matter (PM2.5) in indoor settings of all households in Saidpur and Parbatipur are exceedingly high (well above the 24-hour USEPA ambient air standard). The levels are more pronounced in households in Saidpur than Parbatipur. (2) Even during non-cooking periods the concentration of particulate matter indoors is roughly three times the USEPA 24-hour average limit. Lack of proper ventilation causes air to stagnate in indoor environments. (3) Smoke and pollutants percolate from household to household in these neighborhoods. Of the 5 wards in Saidpur and Parbatipur, the indoor air quality is worst in households in Ward 14 in Saidpur. (4) Generally, burning wood and briquettes causes high emissions of particulates and CO. However, levels of PM and CO seem to be dependent on the configuration of households rather than the type of fuel. (5) During the cooking period, the level of PM2.5 in indoor air seems to correlate with the level of CO. It is expected that any intervention that reduces PM2.5 in indoor air will also reduce the CO level. (6) The 8-hour average CO levels in most of the households are below the recommended USEPA level. However, during the actual cooking period the CO concentrations reach levels which are significantly higher than the recommended level. Therefore, proper ventilation in households is of critical importance.
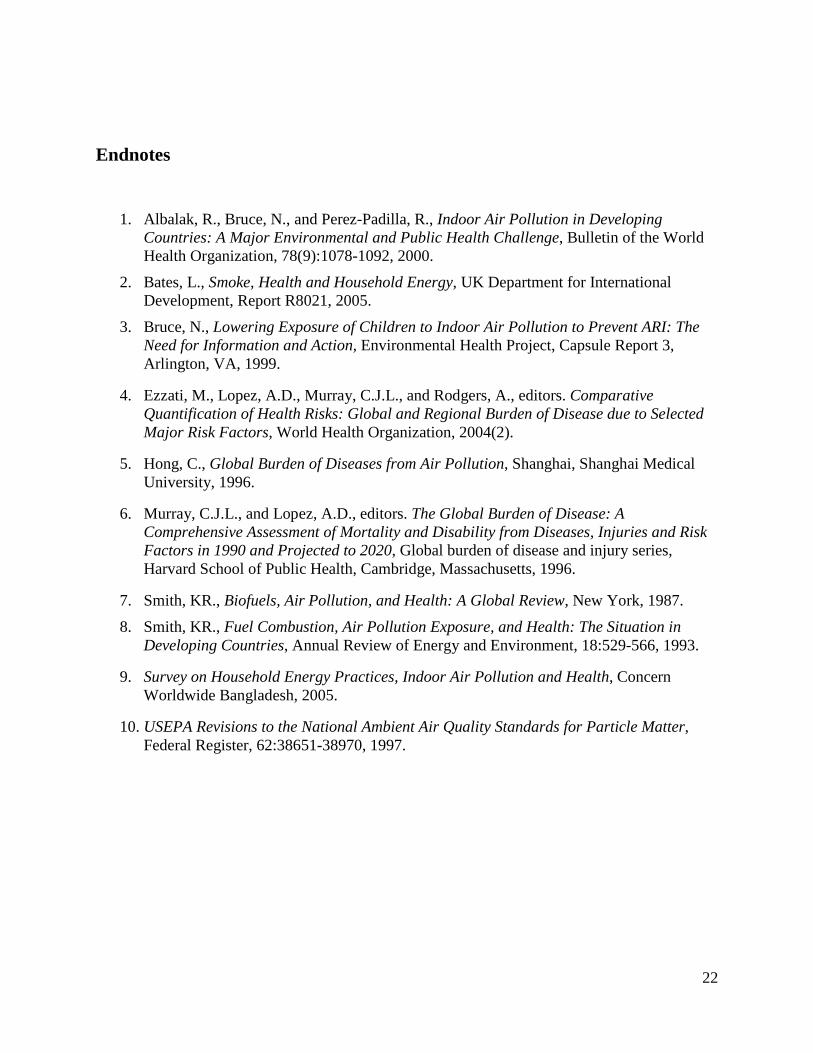
22
Endnotes
1. Albalak, R., Bruce, N., and Perez-Padilla, R., Indoor Air Pollution in Developing Countries: A Major Environmental and Public Health Challenge, Bulletin of the World Health Organization, 78(9):1078-1092, 2000.
2. Bates, L., Smoke, Health and Household Energy, UK Department for International Development, Report R8021, 2005.
3. Bruce, N., Lowering Exposure of Children to Indoor Air Pollution to Prevent ARI: The Need for Information and Action, Environmental Health Project, Capsule Report 3, Arlington, VA, 1999.
4. Ezzati, M., Lopez, A.D., Murray, C.J.L., and Rodgers, A., editors. Comparative Quantification of Health Risks: Global and Regional Burden of Disease due to Selected Major Risk Factors, World Health Organization, 2004(2).
5. Hong, C., Global Burden of Diseases from Air Pollution, Shanghai, Shanghai Medical University, 1996.
6. Murray, C.J.L., and Lopez, A.D., editors. The Global Burden of Disease: A Comprehensive Assessment of Mortality and Disability from Diseases, Injuries and Risk Factors in 1990 and Projected to 2020, Global burden of disease and injury series, Harvard School of Public Health, Cambridge, Massachusetts, 1996.
7. Smith, KR., Biofuels, Air Pollution, and Health: A Global Review, New York, 1987.
8. Smith, KR., Fuel Combustion, Air Pollution Exposure, and Health: The Situation in Developing Countries, Annual Review of Energy and Environment, 18:529-566, 1993.
9. Survey on Household Energy Practices, Indoor Air Pollution and Health, Concern Worldwide Bangladesh, 2005.
10. USEPA Revisions to the National Ambient Air Quality Standards for Particle Matter, Federal Register, 62:38651-38970, 1997.
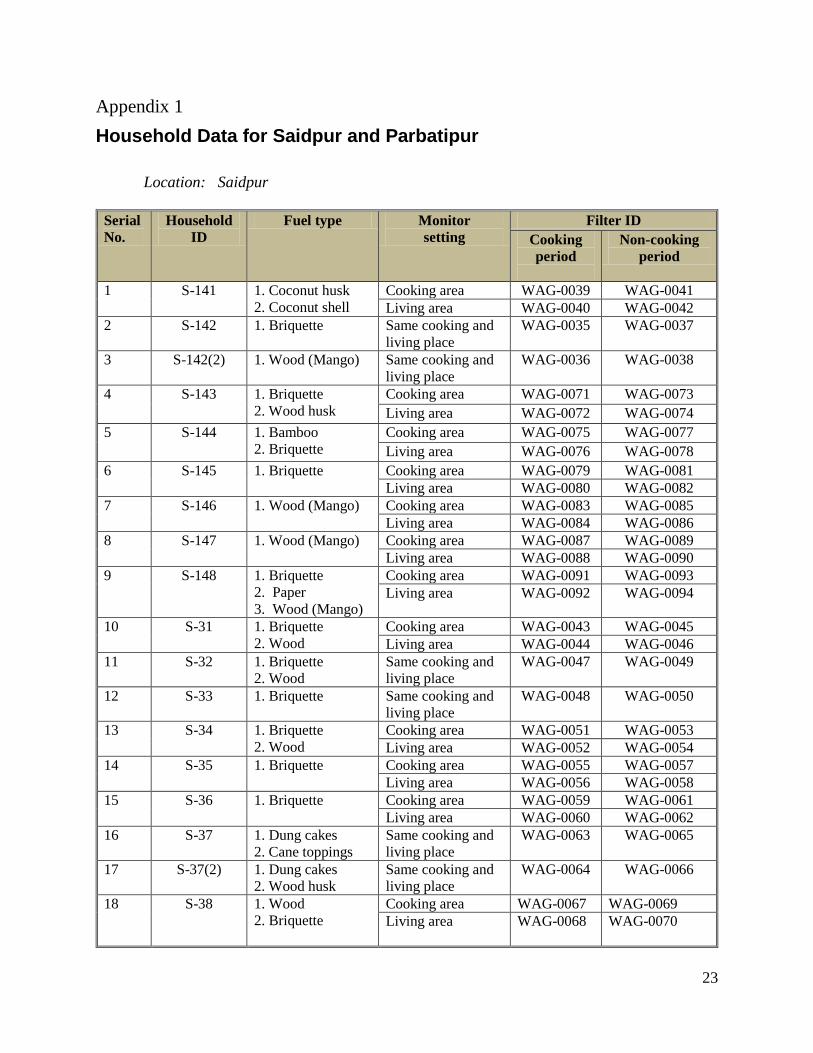
23
Appendix 1 Household Data for Saidpur and Parbatipur
Location: Saidpur
Serial No.
Household ID
Fuel type Monitor setting
Filter ID Cooking period
Non-cooking period
1 S-141 1. Coconut husk 2. Coconut shell
Cooking area WAG-0039 WAG-0041 Living area WAG-0040 WAG-0042
2 S-142 1. Briquette Same cooking and living place
WAG-0035 WAG-0037
3 S-142(2) 1. Wood (Mango)
Same cooking and living place
WAG-0036 WAG-0038
4 S-143 1. Briquette 2. Wood husk
Cooking area WAG-0071 WAG-0073 Living area WAG-0072 WAG-0074
5 S-144 1. Bamboo 2. Briquette
Cooking area WAG-0075 WAG-0077 Living area WAG-0076 WAG-0078
6 S-145 1. Briquette Cooking area WAG-0079 WAG-0081 Living area WAG-0080 WAG-0082
7 S-146 1. Wood (Mango) Cooking area WAG-0083 WAG-0085 Living area WAG-0084 WAG-0086
8 S-147 1. Wood (Mango) Cooking area WAG-0087 WAG-0089 Living area WAG-0088 WAG-0090
9 S-148 1. Briquette 2. Paper 3. Wood (Mango)
Cooking area WAG-0091 WAG-0093 Living area WAG-0092 WAG-0094
10 S-31 1. Briquette 2. Wood
Cooking area WAG-0043 WAG-0045 Living area WAG-0044 WAG-0046
11 S-32 1. Briquette 2. Wood
Same cooking and living place
WAG-0047 WAG-0049
12 S-33 1. Briquette
Same cooking and living place
WAG-0048 WAG-0050
13 S-34 1. Briquette 2. Wood
Cooking area WAG-0051 WAG-0053 Living area WAG-0052 WAG-0054
14 S-35 1. Briquette
Cooking area WAG-0055 WAG-0057 Living area WAG-0056 WAG-0058
15 S-36 1. Briquette
Cooking area WAG-0059 WAG-0061 Living area WAG-0060 WAG-0062
16 S-37 1. Dung cakes 2. Cane toppings
Same cooking and living place
WAG-0063 WAG-0065
17 S-37(2) 1. Dung cakes 2. Wood husk
Same cooking and living place
WAG-0064 WAG-0066
18 S-38 1. Wood 2. Briquette
Cooking area WAG-0067 WAG-0069 Living area WAG-0068 WAG-0070

24
19 S-91 1. Sawdust
Cooking area WAG-0097 WAG-0099 Living area WAG-0098 WAG-0100
20 S-92 1.Coconut husk
Same cooking and living place
WAG-0101 WAG-0103
21 S-93 1.Jute stick Same cooking and living place
WAG-0102 WAG-0104
22 S-94 1. Dung cakes
Same cooking and living place
WAG-0105 WAG-0107
23 S-95 1. Bamboo stick 2. Wood (Mango)
Same cooking and living place
WAG-0106 WAG-0108
24 S-96 1. Sawdust 2. Bamboo stick
Cooking area WAG-0109 WAG-0111 Living area WAG-0110 WAG-0112
25 S-97 1. Dry leaves Cooking area WAG-0113 WAG-0115
Living area WAG-0114 WAG-0116
26 S-98 1. Jute stick Same cooking and living place
WAG-0117 WAG-0118
Location: Parbatipur Serial No.
Household ID
Fuel type Monitor setting Filter ID Cooking period
Non-cooking period
1 P-81 1. Dung cakes
Same cooking and living place
WAG-0119 WAG-0121
2 P-82 1.Dry leaves Same cooking and living place
WAG-0120 WAG-0122
3 P-83 1. Dung cakes
Same cooking and living place
WAG-0123 WAG-0125
4 P-84 1.Dry leaves (Banana)
Same cooking and living place
WAG-0124 WAG-0126
5 P-85 1. Wood (Mango) Same cooking and living place
WAG-0127 WAG-0129
6 P-86 1. Dung cakes
Same cooking and living place
WAG-0128 WAG-0130
7 P-87 1.Bamboo (Chatai) Same cooking and living place
WAG-0131 WAG-0133
8 P-88 1.Bamboo Same cooking and living place
WAG-0132 WAG-0134
9 P-71 1.Bamboo Same cooking and living place
WAG-0135 WAG-0137
10 P-72 1. Wood (Mango) Same cooking and living place
WAG-0136 WAG-0138
11 P-73 1. Dung cakes
Same cooking and living place
WAG-0139 WAG-0141
12 P-74 1.Bamboo Same cooking and living place
WAG-0140 WAG-0142
13 P-75 1. Dung cakes Same cooking and living place
WAG-0143 WAG-0145
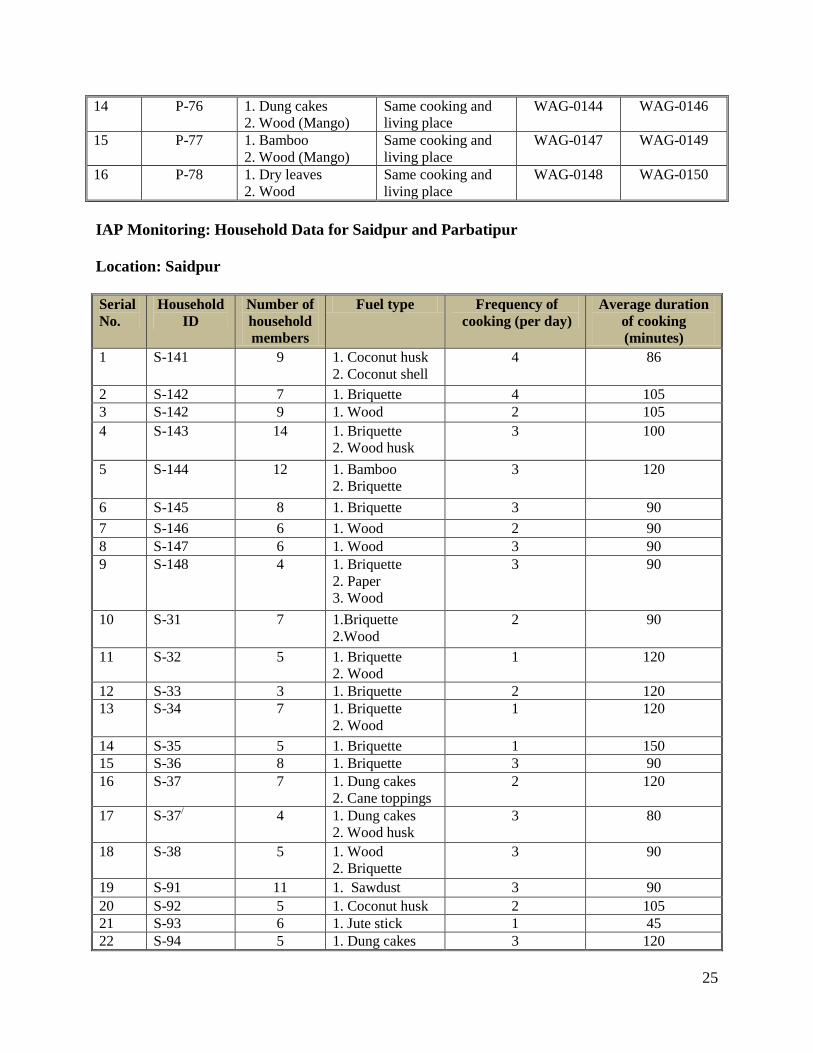
25
14 P-76 1. Dung cakes 2. Wood (Mango)
Same cooking and living place
WAG-0144 WAG-0146
15 P-77 1. Bamboo 2. Wood (Mango)
Same cooking and living place
WAG-0147 WAG-0149
16 P-78 1. Dry leaves 2. Wood
Same cooking and living place
WAG-0148 WAG-0150
IAP Monitoring: Household Data for Saidpur and Parbatipur
Location: Saidpur Serial No.
Household ID
Number of household members
Fuel type Frequency of cooking (per day)
Average duration of cooking (minutes)
1 S-141 9 1. Coconut husk 2. Coconut shell
4 86
2 S-142 7 1. Briquette 4 105 3 S-142 9 1. Wood 2 105 4 S-143 14 1. Briquette
2. Wood husk 3 100
5 S-144 12 1. Bamboo 2. Briquette
3 120
6 S-145 8 1. Briquette 3 90 7 S-146 6 1. Wood 2 90 8 S-147 6 1. Wood 3 90 9 S-148 4 1. Briquette
2. Paper 3. Wood
3 90
10 S-31 7 1.Briquette 2.Wood
2 90
11 S-32 5 1. Briquette 2. Wood
1 120
12 S-33 3 1. Briquette 2 120 13 S-34 7 1. Briquette
2. Wood 1 120
14 S-35 5 1. Briquette 1 150 15 S-36 8 1. Briquette 3 90 16 S-37 7 1. Dung cakes
2. Cane toppings 2 120
17 S-37/ 4
1. Dung cakes 2. Wood husk
3 80
18 S-38 5 1. Wood 2. Briquette
3 90
19 S-91 11 1. Sawdust 3 90 20 S-92 5 1. Coconut husk 2 105 21 S-93 6 1. Jute stick 1 45 22 S-94 5 1. Dung cakes 3 120

26
23 S-95 3 1.Bamboo stick 2. Wood
2 105
24 S-96 9 1. Sawdust 2. Bamboo stick
3 80
25 S-97 5 1. Dry leaves 2 90 26 S-98 6 1. Jute stick 2 45
Location: Parbatipur
Serial No.
Household ID
Number of household members
Fuel type Frequency of cooking (per day)
Average duration of
cooking (minutes)
1 P-81 5 1. Dung cakes 3 70 2 P-82 5 1. Dry leaves 2 60 3 P-83 7 1. Dung cakes 1 120 4 P-84 5 1. Dry leaves 1 90 5 P-85 7 1. Wood 3 80 6 P-86 4 1. Dung cakes 1 120 7 P-87 4 1. Bamboo 2 90 8 P-88 7 1. Bamboo 2 105 9 P-71 4 1. Bamboo 2 120 10 P-72 5 1. Wood 2 60 11 P-73 4 1. Dung cakes 3 90 12 P-74 6 1. Bamboo 2 105 13 P-75 4 1. Dung cakes 2 53 14 P-76 4 1. Dung cakes
2. Wood 2 90
15 P-77 8 1. Bamboo 2. Wood
3 70
16 P-78 7 1. Dry leaves 2. Wood
3 70
Bangladesh IAP Report – Annex IV
ANNEX IV – Post-Monitoring Questionnaire for Saidpur and Parbatipur
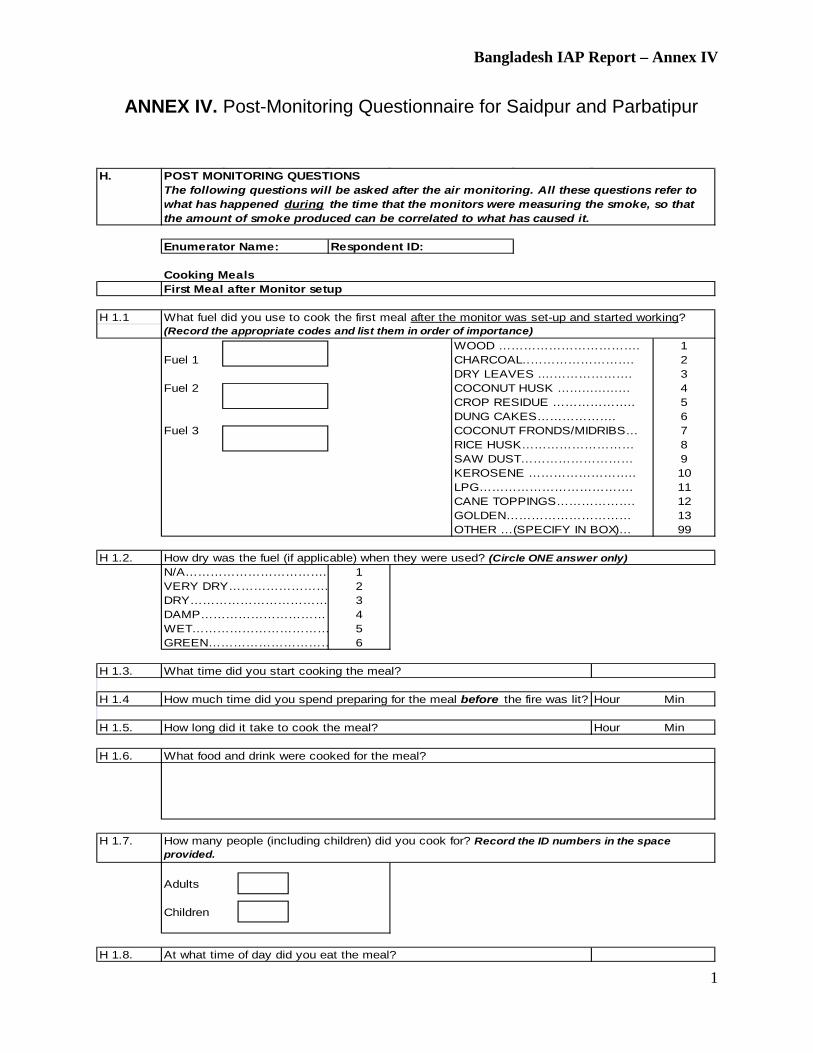
Bangladesh IAP Report – Annex IV
1
ANNEX IV. Post-Monitoring Questionnaire for Saidpur and Parbatipur
H. POST MONITORING QUESTIONS
Enumerator Name: Respondent ID:
Cooking MealsFirst Meal after Monitor setup
H 1.1
WOOD ……………………………. 1Fuel 1 CHARCOAL..……………………. 2
DRY LEAVES ....………………. 3Fuel 2 COCONUT HUSK ……………… 4
CROP RESIDUE ……………….. 5DUNG CAKES………………. 6
Fuel 3 COCONUT FRONDS/MIDRIBS… 7RICE HUSK……………………… 8SAW DUST……………………… 9KEROSENE …………………….. 10LPG………………………………. 11CANE TOPPINGS………………. 12GOLDEN………………………… 13OTHER …(SPECIFY IN BOX)… 99
H 1.2. How dry was the fuel (if applicable) when they were used? (Circle ONE answer only)N/A……………………………. 1VERY DRY…………………… 2DRY…………………………… 3DAMP………………………… 4WET…………………………… 5GREEN………………………… 6
H 1.3. What time did you start cooking the meal?
H 1.4 How much time did you spend preparing for the meal before the fire was lit?
H 1.5. How long did it take to cook the meal?
H 1.6. What food and drink were cooked for the meal?
H 1.7.
Adults
Children
H 1.8. At what time of day did you eat the meal?
How many people (including children) did you cook for? Record the ID numbers in the space provided.
The following questions will be asked after the air monitoring. All these questions refer to what has happened during the time that the monitors were measuring the smoke, so that the amount of smoke produced can be correlated to what has caused it.
What fuel did you use to cook the first meal after the monitor was set-up and started working? (Record the appropriate codes and list them in order of importance)
Hour Min
Hour Min
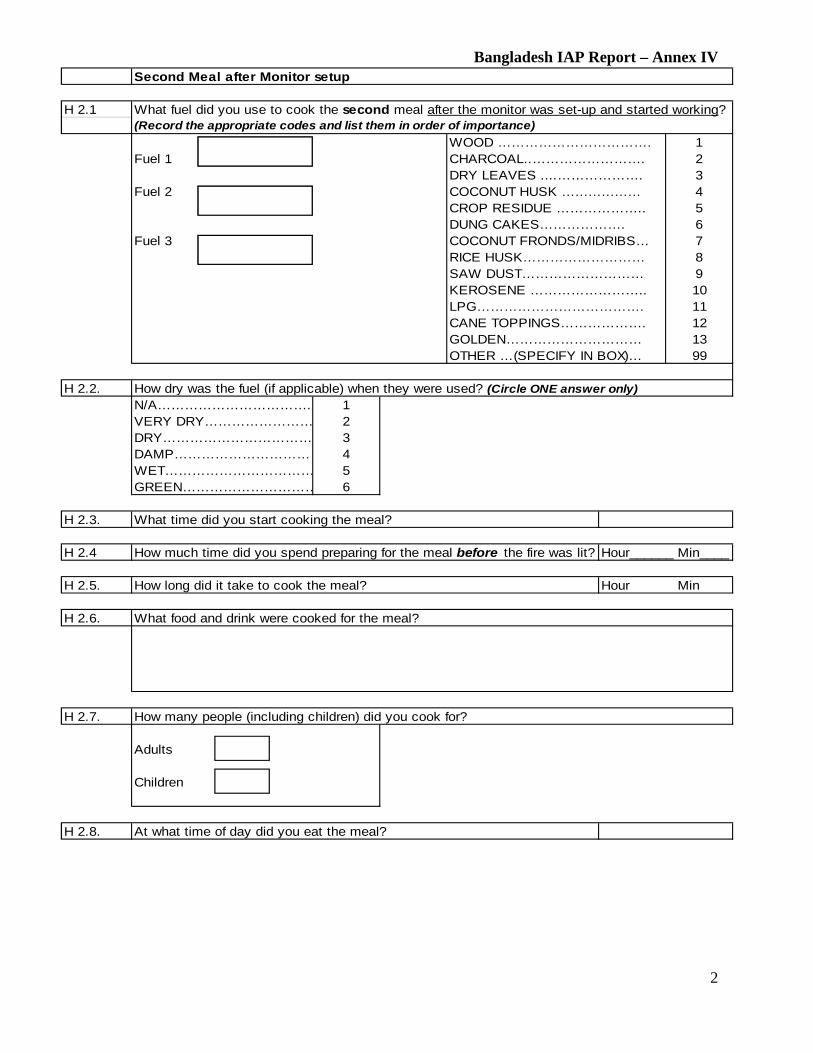
Bangladesh IAP Report – Annex IV
2
Second Meal after Monitor setup
H 2.1
WOOD ……………………………. 1Fuel 1 CHARCOAL..……………………. 2
DRY LEAVES ....………………. 3Fuel 2 COCONUT HUSK ……………… 4
CROP RESIDUE ……………….. 5DUNG CAKES………………. 6
Fuel 3 COCONUT FRONDS/MIDRIBS… 7RICE HUSK……………………… 8SAW DUST……………………… 9KEROSENE …………………….. 10LPG………………………………. 11CANE TOPPINGS………………. 12GOLDEN………………………… 13OTHER …(SPECIFY IN BOX)… 99
H 2.2. How dry was the fuel (if applicable) when they were used? (Circle ONE answer only)N/A……………………………. 1VERY DRY…………………… 2DRY…………………………… 3DAMP………………………… 4WET…………………………… 5GREEN………………………… 6
H 2.3. What time did you start cooking the meal?
H 2.4 How much time did you spend preparing for the meal before the fire was lit?
H 2.5. How long did it take to cook the meal?
H 2.6. What food and drink were cooked for the meal?
H 2.7.
Adults
Children
H 2.8. At what time of day did you eat the meal?
What fuel did you use to cook the second meal after the monitor was set-up and started working? (Record the appropriate codes and list them in order of importance)
How many people (including children) did you cook for?
Hour______ Min____
Hour Min

Bangladesh IAP Report – Annex IV
3
Third Meal after Monitor setup
H 3.1
WOOD ……………………………. 1Fuel 1 CHARCOAL..……………………. 2
DRY LEAVES ....………………. 3Fuel 2 COCONUT HUSK ……………… 4
CROP RESIDUE ……………….. 5DUNG CAKES………………. 6
Fuel 3 COCONUT FRONDS/MIDRIBS… 7RICE HUSK……………………… 8SAW DUST……………………… 9KEROSENE …………………….. 10LPG………………………………. 11CANE TOPPINGS………………. 12GOLDEN………………………… 13OTHER …(SPECIFY IN BOX)… 99
H 3.2. How dry was the fuel (if applicable) when they were used? (Circle ONE answer only)N/A……………………………. 1VERY DRY…………………… 2DRY…………………………… 3DAMP………………………… 4WET…………………………… 5GREEN………………………… 6
H 3.3. What time did you start cooking the meal?
H 3.4 How much time did you spend preparing for the meal before the fire was lit?
H 3.5. How long did it take to cook the meal?
H 3.6. What food and drink were cooked for the meal?
H 3.7.
Adults
Children
H 3.8. At what time of day did you eat the meal?
How many people (including children) did you cook for?
Hour______ Min____
What fuel did you use to cook the third meal after the monitor was set-up and started working? (Record the appropriate codes and list them in order of importance)
Hour Min

Bangladesh IAP Report – Annex IV
4
Fourth Meal after Monitor setup
H 4.1
WOOD ……………………………. 1Fuel 1 CHARCOAL..……………………. 2
DRY LEAVES ....………………. 3Fuel 2 COCONUT HUSK ……………… 4
CROP RESIDUE ……………….. 5DUNG CAKES………………. 6
Fuel 3 COCONUT FRONDS/MIDRIBS… 7RICE HUSK……………………… 8SAW DUST……………………… 9KEROSENE …………………….. 10LPG………………………………. 11CANE TOPPINGS………………. 12GOLDEN………………………… 13OTHER …(SPECIFY IN BOX)… 99
H 4.2. How dry was the fuel when they were used? (Circle ONE answer only)N/A……………………………. 1VERY DRY…………………… 2DRY…………………………… 3DAMP………………………… 4WET…………………………… 5GREEN………………………… 6
H 4.3. What time did you start cooking the meal?
H 4.4 How much time did you spend preparing for the meal before the fire was lit?
H 4.5. How long did it take to cook the meal?
H 4.6. What food and drink were cooked for the meal?
H 4.7.
Adults
Children
H 4.8. At what time of day did you eat the meal?
How many people (including children) did you cook for?
Hour Min
Hour______ Min____
What fuel did you use to cook the fourth meal after the monitor was set-up and started working? (Record the appropriate codes and list them in order of importance)
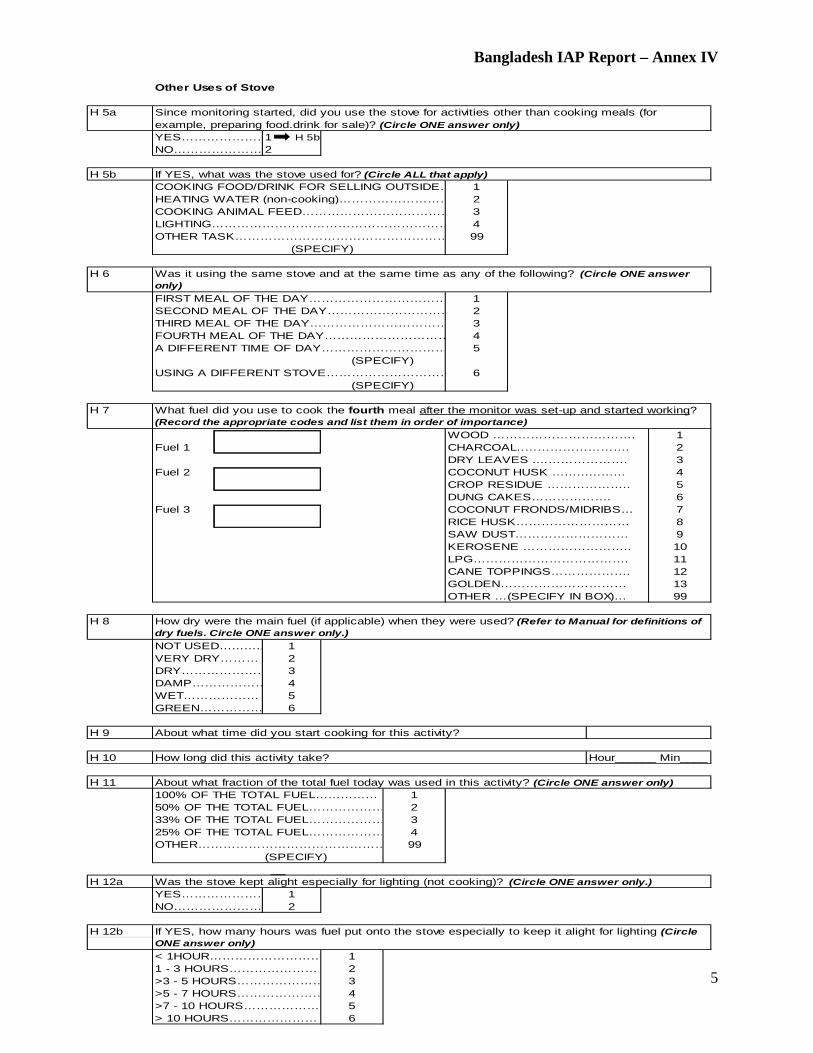
Bangladesh IAP Report – Annex IV
5
Other Uses of Stove
H 5a
YES…………………1 H 5bNO………………… 2
H 5b If YES, what was the stove used for? (Circle ALL that apply)COOKING FOOD/DRINK FOR SELLING OUTSIDE… 1HEATING WATER (non-cooking)……………………… 2COOKING ANIMAL FEED……………………………… 3LIGHTING………………………………………………… 4OTHER TASK…………………………………………… 99
H 6
FIRST MEAL OF THE DAY…………………………… 1SECOND MEAL OF THE DAY………………………… 2THIRD MEAL OF THE DAY…………………………… 3FOURTH MEAL OF THE DAY………………………… 4A DIFFERENT TIME OF DAY………………………… 5
USING A DIFFERENT STOVE………………………… 6
H 7
WOOD ……………………………. 1Fuel 1 CHARCOAL..……………………. 2
DRY LEAVES ....………………. 3Fuel 2 COCONUT HUSK ……………… 4
CROP RESIDUE ……………….. 5DUNG CAKES………………. 6
Fuel 3 COCONUT FRONDS/MIDRIBS… 7RICE HUSK……………………… 8SAW DUST……………………… 9KEROSENE …………………….. 10LPG………………………………. 11CANE TOPPINGS………………. 12GOLDEN………………………… 13OTHER …(SPECIFY IN BOX)… 99
H 8
NOT USED………… 1VERY DRY……… 2DRY………………… 3DAMP……………… 4WET……………… 5GREEN…………… 6
H 9 About what time did you start cooking for this activity?
H 10 How long did this activity take?
H 11 About what fraction of the total fuel today was used in this activity? (Circle ONE answer only)100% OF THE TOTAL FUEL…………… 150% OF THE TOTAL FUEL……………… 233% OF THE TOTAL FUEL……………… 325% OF THE TOTAL FUEL……………… 4OTHER……………………………………… 99
(SPECIFY)
H 12aYES………………… 1NO………………… 2
H 12b
< 1HOUR……………………… 11 - 3 HOURS………………… 2>3 - 5 HOURS………………… 3>5 - 7 HOURS………………… 4>7 - 10 HOURS……………… 5> 10 HOURS………………… 6
What fuel did you use to cook the fourth meal after the monitor was set-up and started working? (Record the appropriate codes and list them in order of importance)
How dry were the main fuel (if applicable) when they were used? (Refer to Manual for definitions of dry fuels. Circle ONE answer only.)
(SPECIFY)
Was it using the same stove and at the same time as any of the following? (Circle ONE answer only)
If YES, how many hours was fuel put onto the stove especially to keep it alight for lighting (Circle ONE answer only)
Hour______ Min____
Was the stove kept alight especially for lighting (not cooking)? (Circle ONE answer only.)
(SPECIFY)
(SPECIFY)
Since monitoring started, did you use the stove for activities other than cooking meals (for example, preparing food.drink for sale)? (Circle ONE answer only)
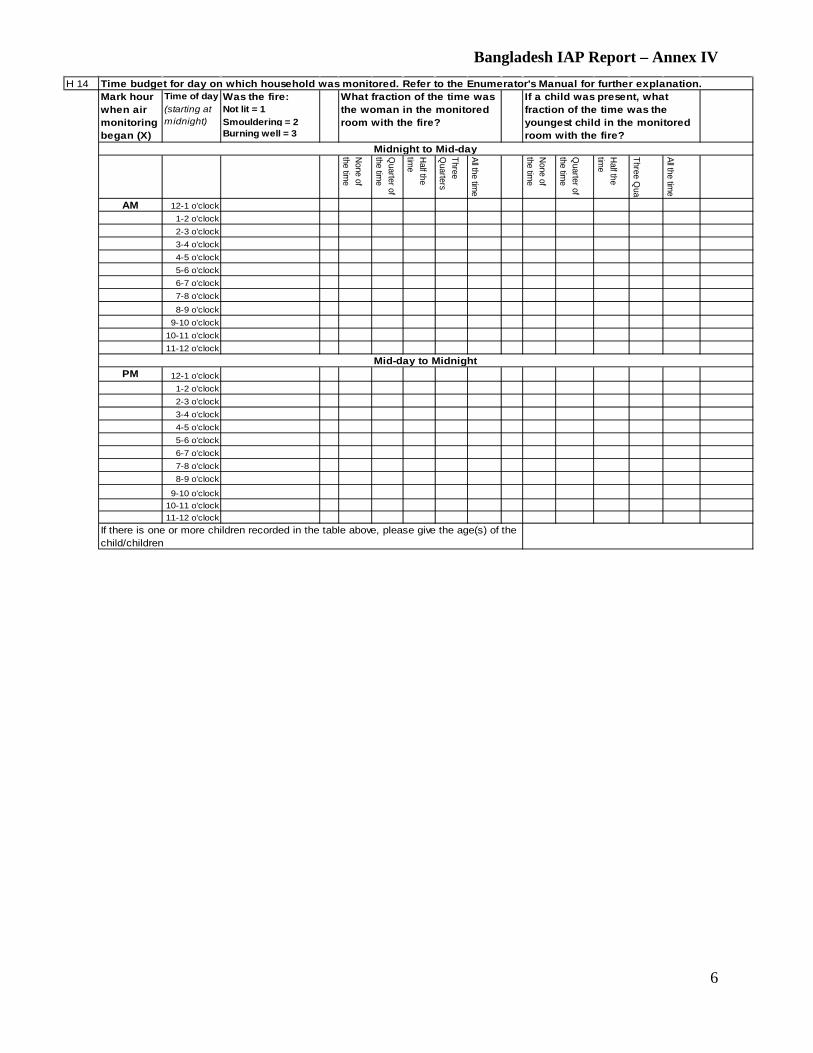
Bangladesh IAP Report – Annex IV
6
H 14Time of day Was the fire:
Not lit = 1
Burning well = 3
None of
the time
Quarter of
the time
Half the
time
Three Q
uarters
All the time
None of
the time
Quarter of
the time
Half the
time
Three Qua
All the time
AM 12-1 o'clock1-2 o'clock2-3 o'clock3-4 o'clock4-5 o'clock5-6 o'clock6-7 o'clock7-8 o'clock8-9 o'clock
9-10 o'clock10-11 o'clock11-12 o'clock
PM 12-1 o'clock1-2 o'clock2-3 o'clock3-4 o'clock4-5 o'clock5-6 o'clock6-7 o'clock7-8 o'clock8-9 o'clock
9-10 o'clock10-11 o'clock11-12 o'clock
Midnight to Mid-day
Mid-day to Midnight
If there is one or more children recorded in the table above, please give the age(s) of the child/children
Time budget for day on which household was monitored. Refer to the Enumerator's Manual for further explanation.Mark hour when air monitoring began (X)
What fraction of the time was the woman in the monitored room with the fire?
If a child was present, what fraction of the time was the youngest child in the monitored room with the fire?
(starting at midnight) Smouldering = 2

Bangladesh IAP Report – Annex IV
7
Comments and Observations
H 15a Can you think of any ways in which your day is different from how it would have been if monitoring had not been taking place?
H 15b Other comments and observation from repondent (please feel welcome but not obliged to fill this in)
H 15c Other comments and observation from enumerator (please feel welcome but not obliged to fill this in. You may also include information about the respondent's attitude toward particular questions)
Bangladesh IAP Report – Annex V
1
ANNEX V – Cookstove Performance Report
Bangladesh IAP Report – Annex V
2
ANNEX V: Cookstove Performance Report
June 26, 2007 Dr. Karabi Dutta, Project Coordinator Appropriate Rural Technology Institute 2nd Floor Manini Apartments, Dhayarigaon, Pune, Maharashtra, India
Bangladesh IAP Report – Annex V
3
COOKSTOVE PERFORMANCE REPORT Background
The improved cookstove testing activities were conducted under a USAID-supported project for indoor air pollution reduction in the urban slum areas of Saidpur and Parbatipur municipalities in Nilphamari and Dinajpur districts of northwest Bangladesh. The project was implemented by Winrock International with local partners Concern Worldwide, Bangladesh and Village Education Resource Center. The cookstove testing activities were carried out in two phases during the summers of 2006 and 2007, respectively, by Appropriate Rural Technology Institute (ARTI). In Phase I of the cookstove testing, ARTI conducted baseline cookstove assessments to determine how various stoves performed under laboratory conditions. ARTI tested five improved stove models, using the Water Boiling Test (WBT), and tests for carbon monoxide (CO) and particulate (PM2.5) emissions. In Phase II, in 2007, the CO and PM2.5 emissions were repeated in households, along with the Kitchen Performance Test (KPT). The WBT and emissions tests were performed in 2 households each for the three stove models selected for promotion in the USAID/Winrock, and the KPT was carried out in 112 households.
Monitoring & Evaluation (M&E)
Monitoring and evaluation of the impacts of a household intervention with improved cooking stoves was done in 2007 following the methodology established by the School of Public Health, University of California at Berkeley. Actual protocols and data worksheets are found on the Household Energy and Health (HEH) website, now maintained by UC Berkeley’s Center for Entrepreneurship in International Health and Development (CEIHD): http://ceihd.berkeley.edu/heh.IAPprotocols.htm. The KPT was conducted along with CO and PM2.5 emissions monitoring and a 100-household survey. As described by CEIHD: “Effectiveness trials (KPT) are conducted in the course of an actual dissemination effort with real populations cooking normally and give the best indication of real-world changes. Only these can determine actual usage under realistic promotion schemes. Evaluating such trials is more expensive, difficult, and time-consuming, partly because the nature of real households is highly variable and thus sample sizes must be fairly large to obtain statistically significant results.” As the original impetus behind this study was to understand the impact on populations, it was decided that the focus would be on effectiveness, i.e., M&E as much as possible aimed to determine the effects in real populations. For this reason, an effectiveness measure was chosen for each outcome:
• Stove Performance: The Kitchen Performance Test (KPT) was chosen as the primary measure, which involves measurements of fuel use in real households over several days. In addition, given its common use and relative simplicity, improved protocols were used for the Water Boiling Test (WBT), a controlled test to assess stove efficiency.
• Indoor Air Quality (IAQ): Using “Before and After” intervention design, a field survey of IAQ levels in actual households that were part of the stove dissemination projects was developed and implemented.
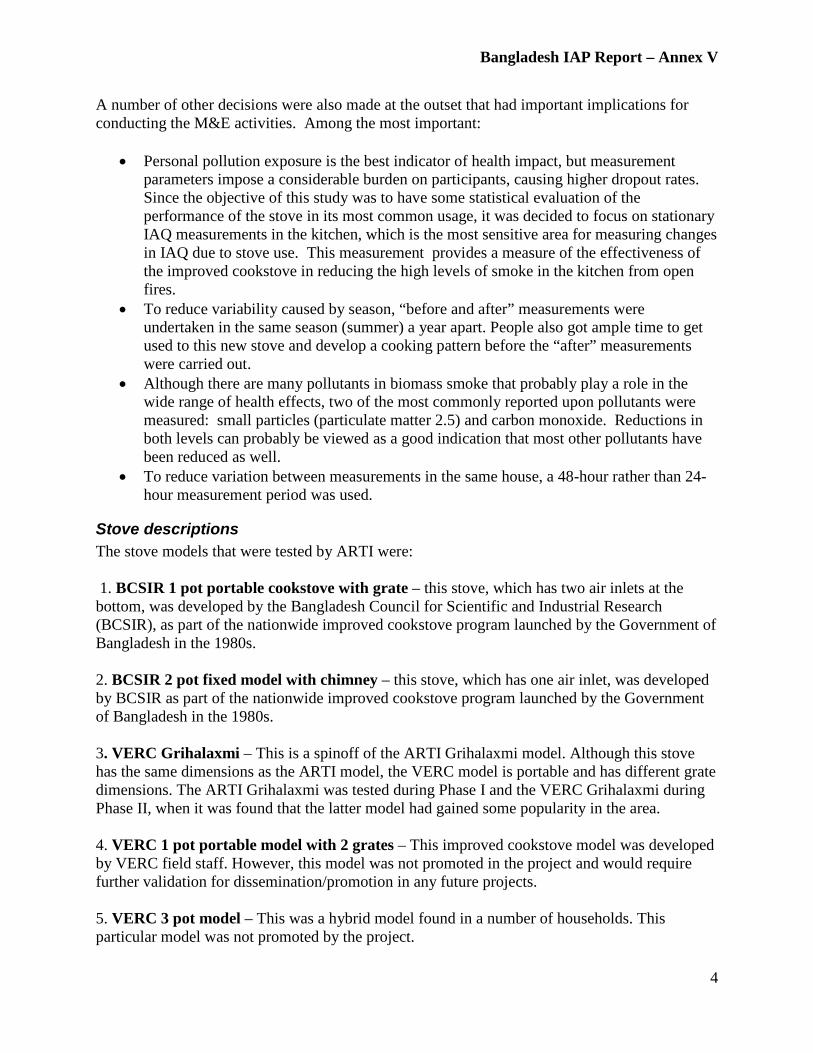
Bangladesh IAP Report – Annex V
4
A number of other decisions were also made at the outset that had important implications for conducting the M&E activities. Among the most important:
• Personal pollution exposure is the best indicator of health impact, but measurement parameters impose a considerable burden on participants, causing higher dropout rates. Since the objective of this study was to have some statistical evaluation of the performance of the stove in its most common usage, it was decided to focus on stationary IAQ measurements in the kitchen, which is the most sensitive area for measuring changes in IAQ due to stove use. This measurement provides a measure of the effectiveness of the improved cookstove in reducing the high levels of smoke in the kitchen from open fires.
• To reduce variability caused by season, “before and after” measurements were undertaken in the same season (summer) a year apart. People also got ample time to get used to this new stove and develop a cooking pattern before the “after” measurements were carried out.
• Although there are many pollutants in biomass smoke that probably play a role in the wide range of health effects, two of the most commonly reported upon pollutants were measured: small particles (particulate matter 2.5) and carbon monoxide. Reductions in both levels can probably be viewed as a good indication that most other pollutants have been reduced as well.
• To reduce variation between measurements in the same house, a 48-hour rather than 24-hour measurement period was used.
Stove descriptions The stove models that were tested by ARTI were: 1. BCSIR 1 pot portable cookstove with grate – this stove, which has two air inlets at the bottom, was developed by the Bangladesh Council for Scientific and Industrial Research (BCSIR), as part of the nationwide improved cookstove program launched by the Government of Bangladesh in the 1980s. 2. BCSIR 2 pot fixed model with chimney – this stove, which has one air inlet, was developed by BCSIR as part of the nationwide improved cookstove program launched by the Government of Bangladesh in the 1980s. 3. VERC Grihalaxmi – This is a spinoff of the ARTI Grihalaxmi model. Although this stove has the same dimensions as the ARTI model, the VERC model is portable and has different grate dimensions. The ARTI Grihalaxmi was tested during Phase I and the VERC Grihalaxmi during Phase II, when it was found that the latter model had gained some popularity in the area. 4. VERC 1 pot portable model with 2 grates – This improved cookstove model was developed by VERC field staff. However, this model was not promoted in the project and would require further validation for dissemination/promotion in any future projects. 5. VERC 3 pot model – This was a hybrid model found in a number of households. This particular model was not promoted by the project.
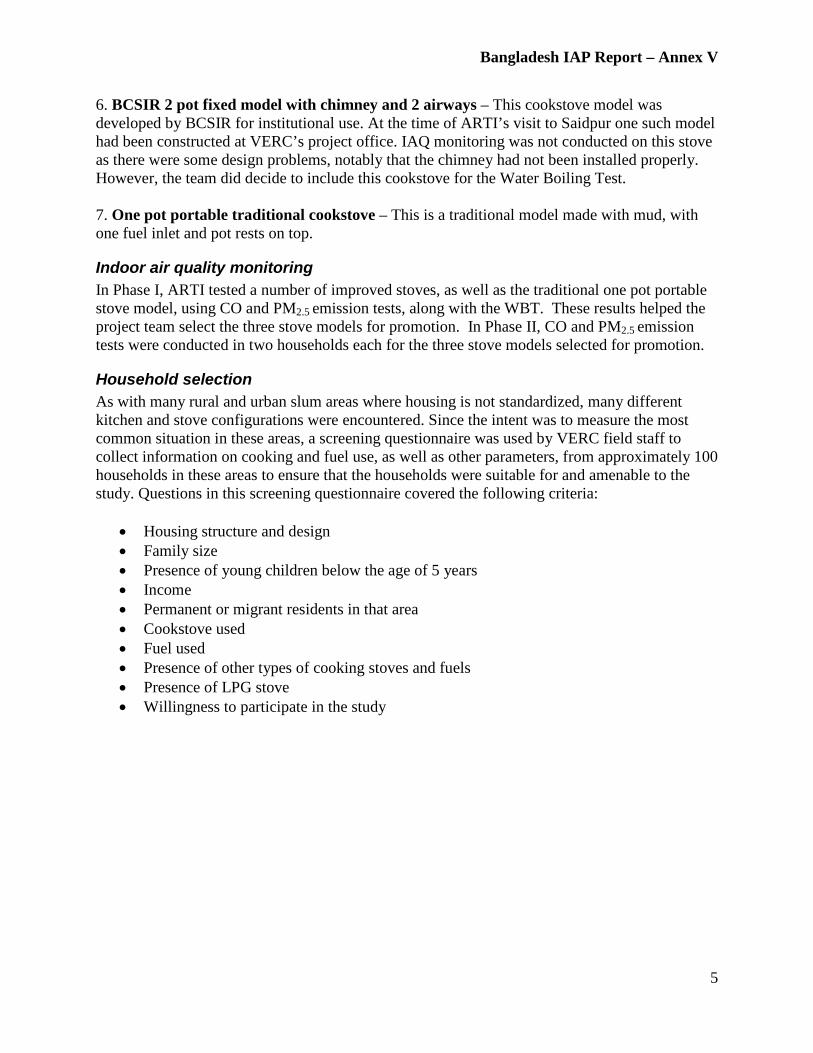
Bangladesh IAP Report – Annex V
5
6. BCSIR 2 pot fixed model with chimney and 2 airways – This cookstove model was developed by BCSIR for institutional use. At the time of ARTI’s visit to Saidpur one such model had been constructed at VERC’s project office. IAQ monitoring was not conducted on this stove as there were some design problems, notably that the chimney had not been installed properly. However, the team did decide to include this cookstove for the Water Boiling Test. 7. One pot portable traditional cookstove – This is a traditional model made with mud, with one fuel inlet and pot rests on top.
Indoor air quality monitoring In Phase I, ARTI tested a number of improved stoves, as well as the traditional one pot portable stove model, using CO and PM2.5 emission tests, along with the WBT. These results helped the project team select the three stove models for promotion. In Phase II, CO and PM2.5 emission tests were conducted in two households each for the three stove models selected for promotion.
Household selection As with many rural and urban slum areas where housing is not standardized, many different kitchen and stove configurations were encountered. Since the intent was to measure the most common situation in these areas, a screening questionnaire was used by VERC field staff to collect information on cooking and fuel use, as well as other parameters, from approximately 100 households in these areas to ensure that the households were suitable for and amenable to the study. Questions in this screening questionnaire covered the following criteria:
• Housing structure and design • Family size • Presence of young children below the age of 5 years • Income • Permanent or migrant residents in that area • Cookstove used • Fuel used • Presence of other types of cooking stoves and fuels • Presence of LPG stove • Willingness to participate in the study
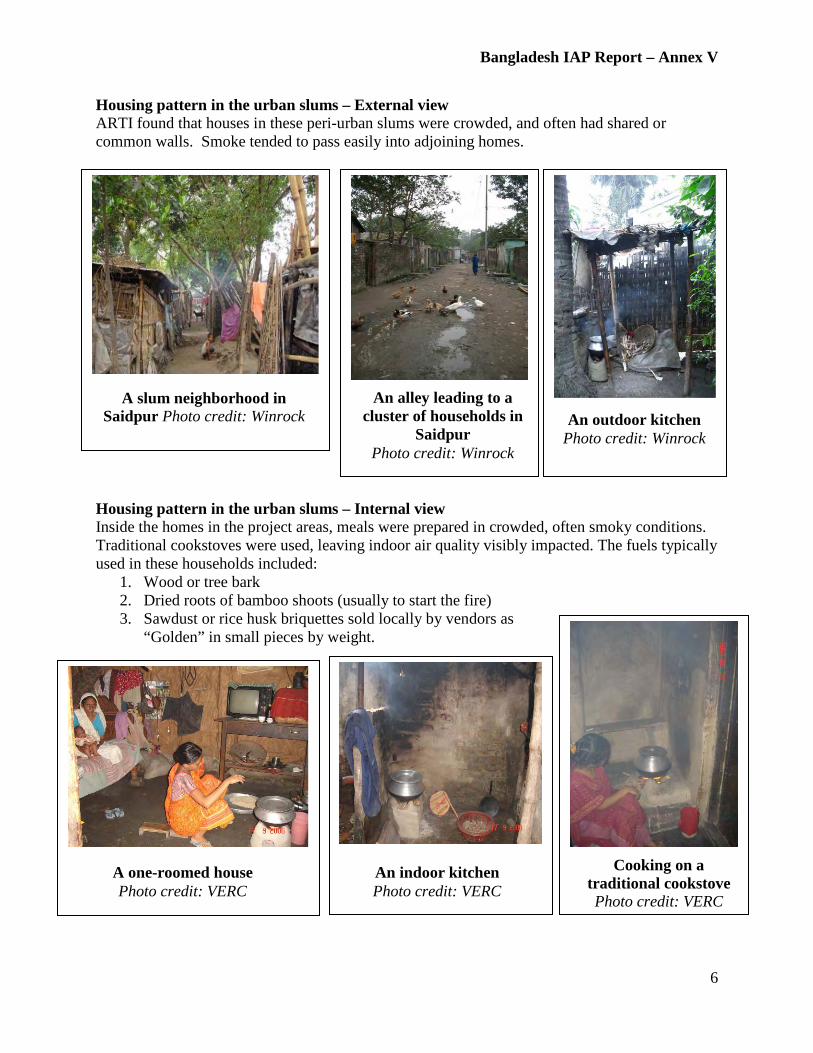
Bangladesh IAP Report – Annex V
6
A slum neighborhood in Saidpur Photo credit: Winrock
Housing pattern in the urban slums – External view ARTI found that houses in these peri-urban slums were crowded, and often had shared or common walls. Smoke tended to pass easily into adjoining homes. Housing pattern in the urban slums – Internal view Inside the homes in the project areas, meals were prepared in crowded, often smoky conditions. Traditional cookstoves were used, leaving indoor air quality visibly impacted. The fuels typically used in these households included:
1. Wood or tree bark 2. Dried roots of bamboo shoots (usually to start the fire) 3. Sawdust or rice husk briquettes sold locally by vendors as
“Golden” in small pieces by weight.
An alley leading to a
cluster of households in Saidpur
Photo credit: Winrock
An outdoor kitchen Photo credit: Winrock
A one-roomed house Photo credit: VERC
Cooking on a
traditional cookstove Photo credit: VERC
An indoor kitchen Photo credit: VERC
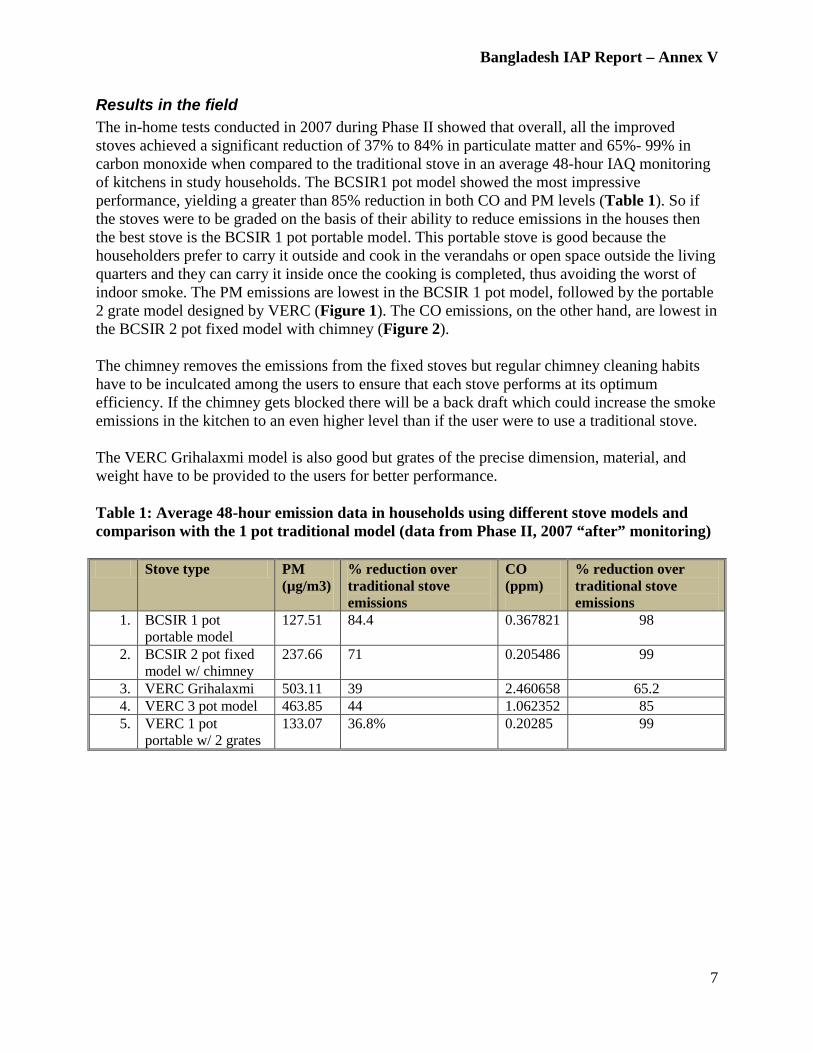
Bangladesh IAP Report – Annex V
7
Results in the field The in-home tests conducted in 2007 during Phase II showed that overall, all the improved stoves achieved a significant reduction of 37% to 84% in particulate matter and 65%- 99% in carbon monoxide when compared to the traditional stove in an average 48-hour IAQ monitoring of kitchens in study households. The BCSIR1 pot model showed the most impressive performance, yielding a greater than 85% reduction in both CO and PM levels (Table 1). So if the stoves were to be graded on the basis of their ability to reduce emissions in the houses then the best stove is the BCSIR 1 pot portable model. This portable stove is good because the householders prefer to carry it outside and cook in the verandahs or open space outside the living quarters and they can carry it inside once the cooking is completed, thus avoiding the worst of indoor smoke. The PM emissions are lowest in the BCSIR 1 pot model, followed by the portable 2 grate model designed by VERC (Figure 1). The CO emissions, on the other hand, are lowest in the BCSIR 2 pot fixed model with chimney (Figure 2). The chimney removes the emissions from the fixed stoves but regular chimney cleaning habits have to be inculcated among the users to ensure that each stove performs at its optimum efficiency. If the chimney gets blocked there will be a back draft which could increase the smoke emissions in the kitchen to an even higher level than if the user were to use a traditional stove. The VERC Grihalaxmi model is also good but grates of the precise dimension, material, and weight have to be provided to the users for better performance. Table 1: Average 48-hour emission data in households using different stove models and comparison with the 1 pot traditional model (data from Phase II, 2007 “after” monitoring) Stove type PM
(µg/m3)
% reduction over traditional stove emissions
CO (ppm)
% reduction over traditional stove emissions
1. BCSIR 1 pot portable model
127.51 84.4 0.367821 98
2. BCSIR 2 pot fixed model w/ chimney
237.66 71 0.205486 99
3. VERC Grihalaxmi 503.11 39 2.460658 65.2 4. VERC 3 pot model 463.85 44 1.062352 85 5. VERC 1 pot
portable w/ 2 grates 133.07 36.8% 0.20285 99
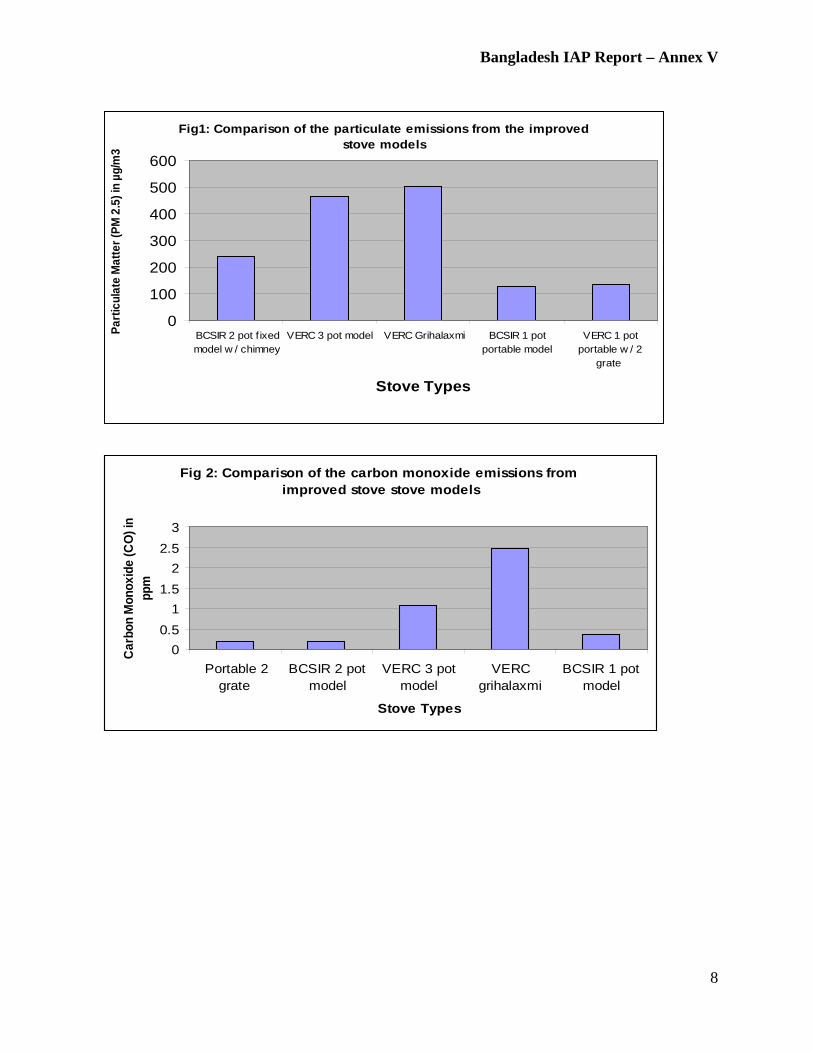
Bangladesh IAP Report – Annex V
8
Fig 2: Comparison of the carbon monoxide emissions from improved stove stove models
00.5
11.5
22.5
3
Portable 2grate
BCSIR 2 potmodel
VERC 3 potmodel
VERCgrihalaxmi
BCSIR 1 potmodel
Stove Types
Car
bon
Mon
oxid
e (C
O) i
n pp
mFig1: Comparison of the particulate emissions from the improved
stove models
0
100
200
300
400
500
600
BCSIR 2 pot f ixedmodel w / chimney
VERC 3 pot model VERC Grihalaxmi BCSIR 1 potportable model
VERC 1 potportable w / 2
grate
Stove Types
Parti
cula
te M
atte
r (PM
2.5
) in
µg/m
3
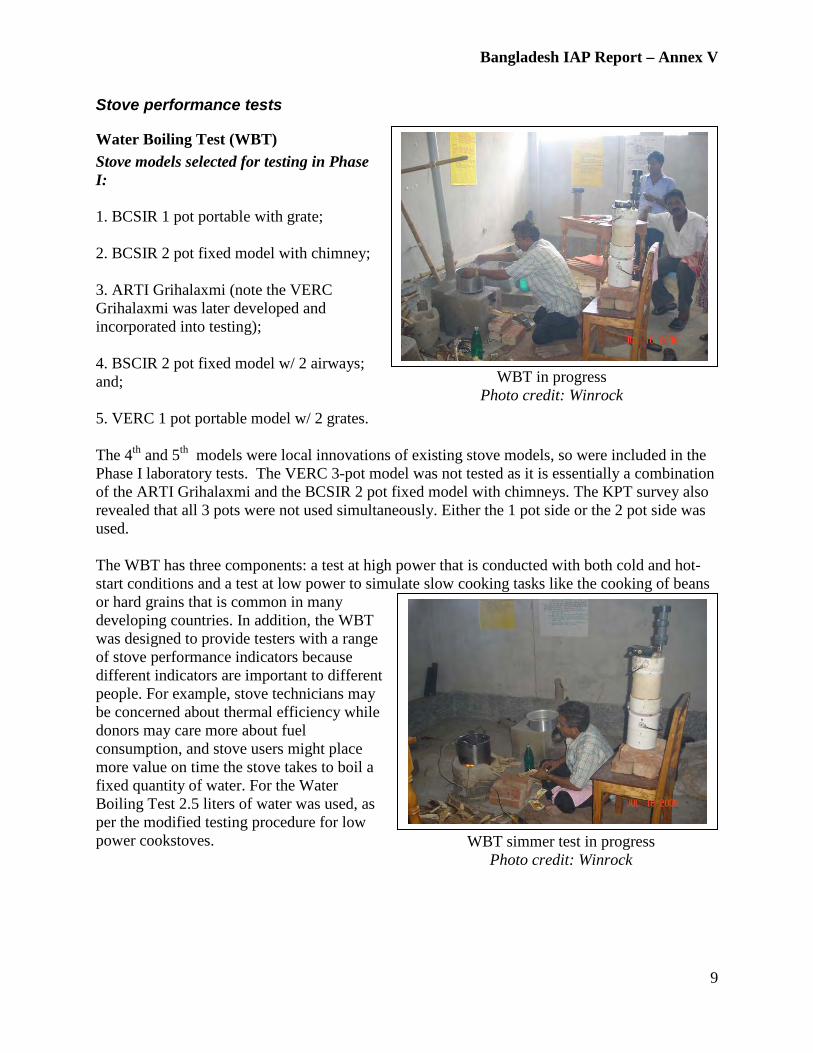
Bangladesh IAP Report – Annex V
9
Stove performance tests
Water Boiling Test (WBT) Stove models selected for testing in Phase I: 1. BCSIR 1 pot portable with grate; 2. BCSIR 2 pot fixed model with chimney; 3. ARTI Grihalaxmi (note the VERC Grihalaxmi was later developed and incorporated into testing); 4. BSCIR 2 pot fixed model w/ 2 airways; and; 5. VERC 1 pot portable model w/ 2 grates. The 4th and 5th models were local innovations of existing stove models, so were included in the Phase I laboratory tests. The VERC 3-pot model was not tested as it is essentially a combination of the ARTI Grihalaxmi and the BCSIR 2 pot fixed model with chimneys. The KPT survey also revealed that all 3 pots were not used simultaneously. Either the 1 pot side or the 2 pot side was used. The WBT has three components: a test at high power that is conducted with both cold and hot-start conditions and a test at low power to simulate slow cooking tasks like the cooking of beans or hard grains that is common in many developing countries. In addition, the WBT was designed to provide testers with a range of stove performance indicators because different indicators are important to different people. For example, stove technicians may be concerned about thermal efficiency while donors may care more about fuel consumption, and stove users might place more value on time the stove takes to boil a fixed quantity of water. For the Water Boiling Test 2.5 liters of water was used, as per the modified testing procedure for low power cookstoves.
WBT in progress
Photo credit: Winrock
WBT simmer test in progress
Photo credit: Winrock
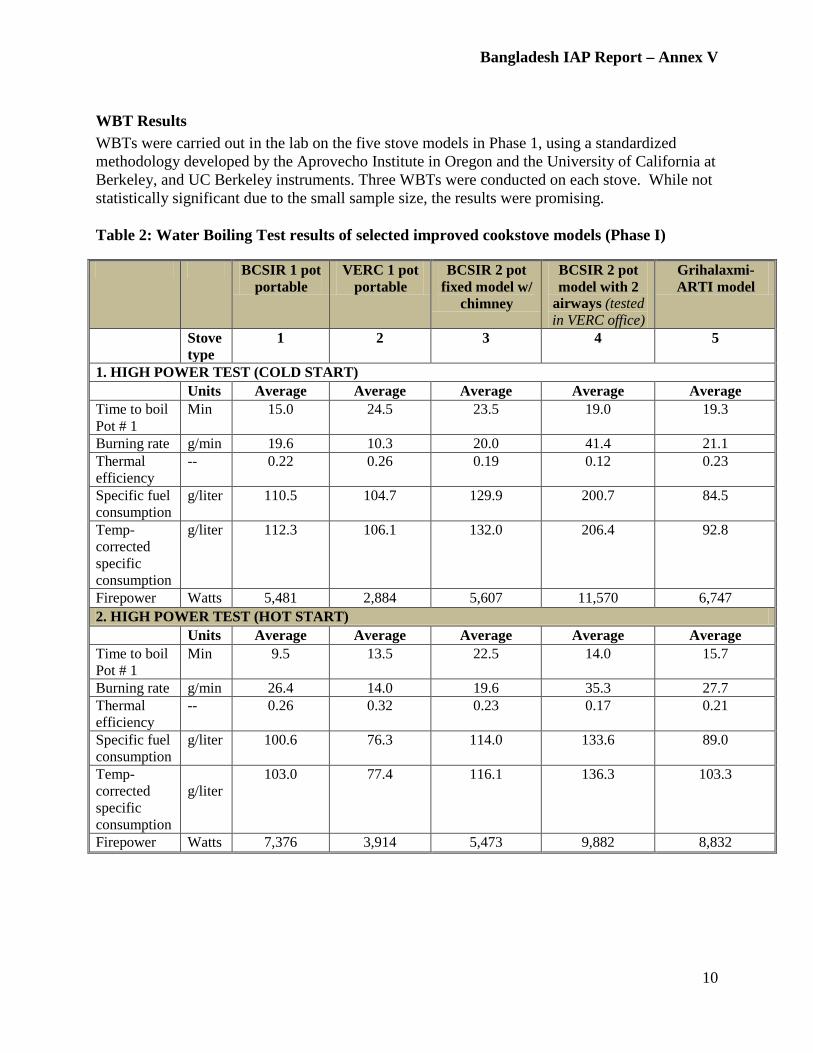
Bangladesh IAP Report – Annex V
10
WBT Results WBTs were carried out in the lab on the five stove models in Phase 1, using a standardized methodology developed by the Aprovecho Institute in Oregon and the University of California at Berkeley, and UC Berkeley instruments. Three WBTs were conducted on each stove. While not statistically significant due to the small sample size, the results were promising. Table 2: Water Boiling Test results of selected improved cookstove models (Phase I)
BCSIR 1 pot portable
VERC 1 pot portable
BCSIR 2 pot fixed model w/
chimney
BCSIR 2 pot model with 2
airways (tested in VERC office)
Grihalaxmi-ARTI model
Stove type
1 2 3 4 5
1. HIGH POWER TEST (COLD START) Units Average Average Average Average Average Time to boil Pot # 1
Min 15.0 24.5 23.5 19.0 19.3
Burning rate g/min 19.6 10.3 20.0 41.4 21.1 Thermal efficiency
-- 0.22 0.26 0.19 0.12 0.23
Specific fuel consumption
g/liter 110.5 104.7 129.9 200.7 84.5
Temp-corrected specific consumption
g/liter 112.3 106.1 132.0 206.4 92.8
Firepower Watts 5,481 2,884 5,607 11,570 6,747 2. HIGH POWER TEST (HOT START) Units Average Average Average Average Average Time to boil Pot # 1
Min 9.5 13.5 22.5 14.0 15.7
Burning rate g/min 26.4 14.0 19.6 35.3 27.7 Thermal efficiency
-- 0.26 0.32 0.23 0.17 0.21
Specific fuel consumption
g/liter 100.6 76.3 114.0 133.6 89.0
Temp-corrected specific consumption
g/liter
103.0 77.4 116.1 136.3 103.3
Firepower Watts 7,376 3,914 5,473 9,882 8,832
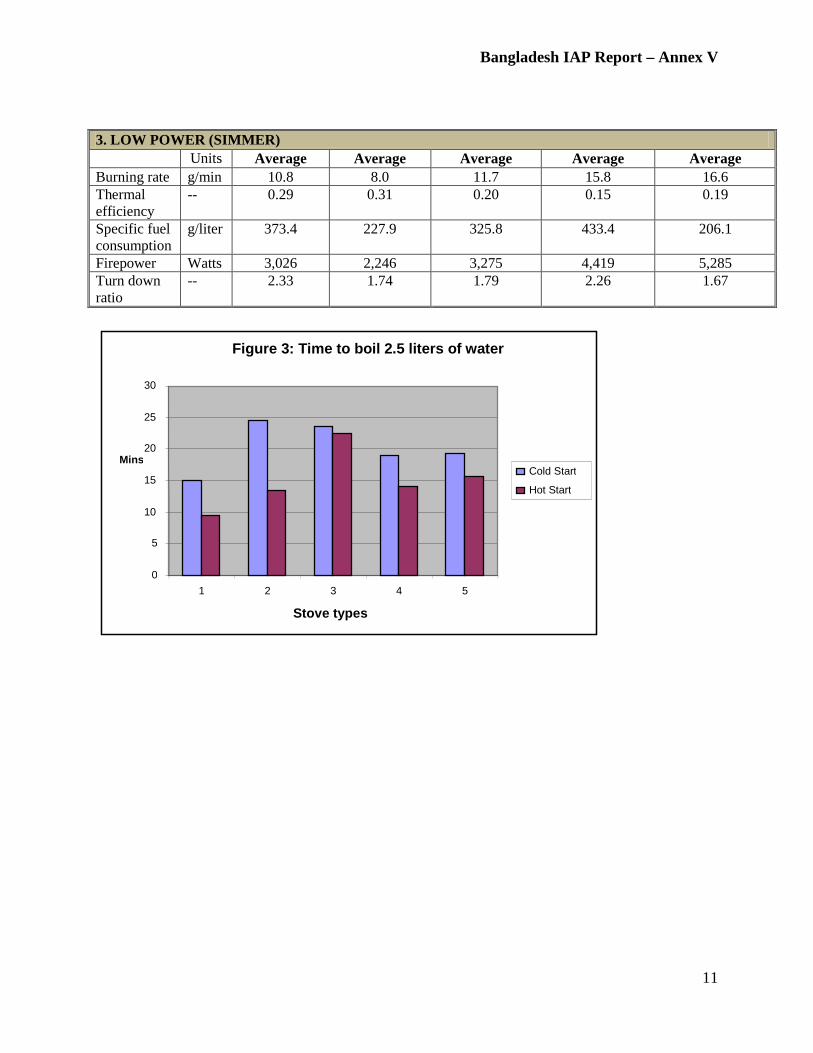
Bangladesh IAP Report – Annex V
11
3. LOW POWER (SIMMER) Units Average Average Average Average Average Burning rate g/min 10.8 8.0 11.7 15.8 16.6 Thermal efficiency
-- 0.29 0.31 0.20 0.15 0.19
Specific fuel consumption
g/liter 373.4 227.9 325.8 433.4 206.1
Firepower Watts 3,026 2,246 3,275 4,419 5,285 Turn down ratio
-- 2.33 1.74 1.79 2.26 1.67
Figure 3: Time to boil 2.5 liters of water
0
5
10
15
20
25
30
1 2 3 4 5 Stove types
Mins Cold Start Hot Start
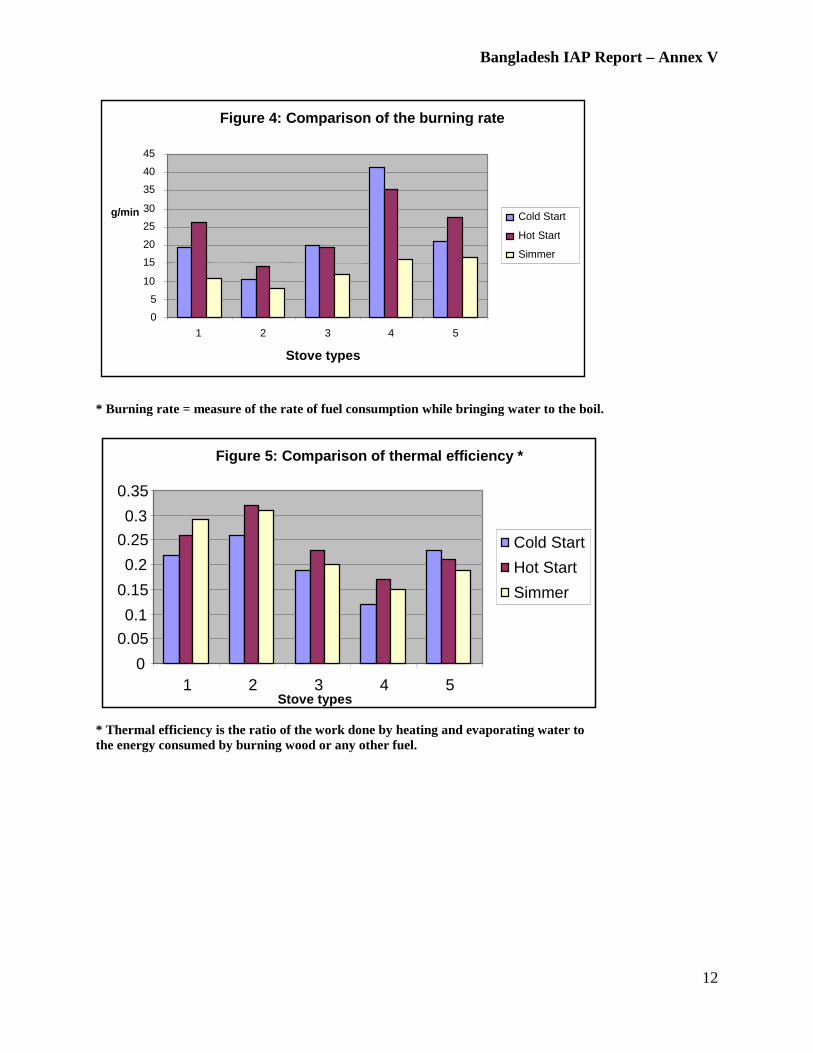
Bangladesh IAP Report – Annex V
12
* Burning rate = measure of the rate of fuel consumption while bringing water to the boil.
* Thermal efficiency is the ratio of the work done by heating and evaporating water to the energy consumed by burning wood or any other fuel.
Figure 4: Comparison of the burning rate
0 5
10 15 20 25 30 35 40 45
1 2 3 4 5 Stove types
g/min Cold Start Hot Start Simmer
Figure 5: Comparison of thermal efficiency *
0 0.05 0.1
0.15 0.2
0.25 0.3
0.35
1 2 3 4 5 Stove types
Cold Start Hot Start Simmer
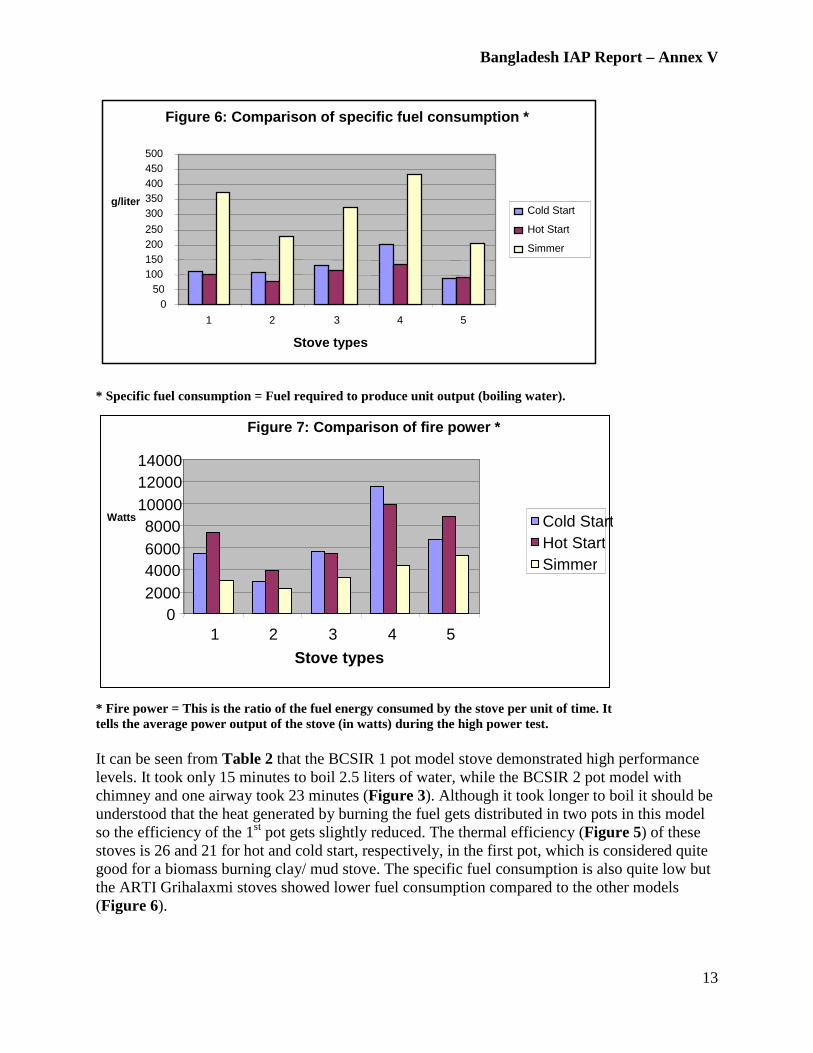
Bangladesh IAP Report – Annex V
13
* Specific fuel consumption = Fuel required to produce unit output (boiling water).
* Fire power = This is the ratio of the fuel energy consumed by the stove per unit of time. It tells the average power output of the stove (in watts) during the high power test. It can be seen from Table 2 that the BCSIR 1 pot model stove demonstrated high performance levels. It took only 15 minutes to boil 2.5 liters of water, while the BCSIR 2 pot model with chimney and one airway took 23 minutes (Figure 3). Although it took longer to boil it should be understood that the heat generated by burning the fuel gets distributed in two pots in this model so the efficiency of the 1st pot gets slightly reduced. The thermal efficiency (Figure 5) of these stoves is 26 and 21 for hot and cold start, respectively, in the first pot, which is considered quite good for a biomass burning clay/ mud stove. The specific fuel consumption is also quite low but the ARTI Grihalaxmi stoves showed lower fuel consumption compared to the other models (Figure 6).
Figure 6: Comparison of specific fuel consumption *
0 50
100 150 200 250 300 350 400 450 500
1 2 3 4 5 Stove types
g/liter Cold Start Hot Start Simmer
Figure 7: Comparison of fire power *
0 2000 4000 6000 8000
10000 12000 14000
1 2 3 4 5 Stove types
Watts Cold Start Hot Start Simmer
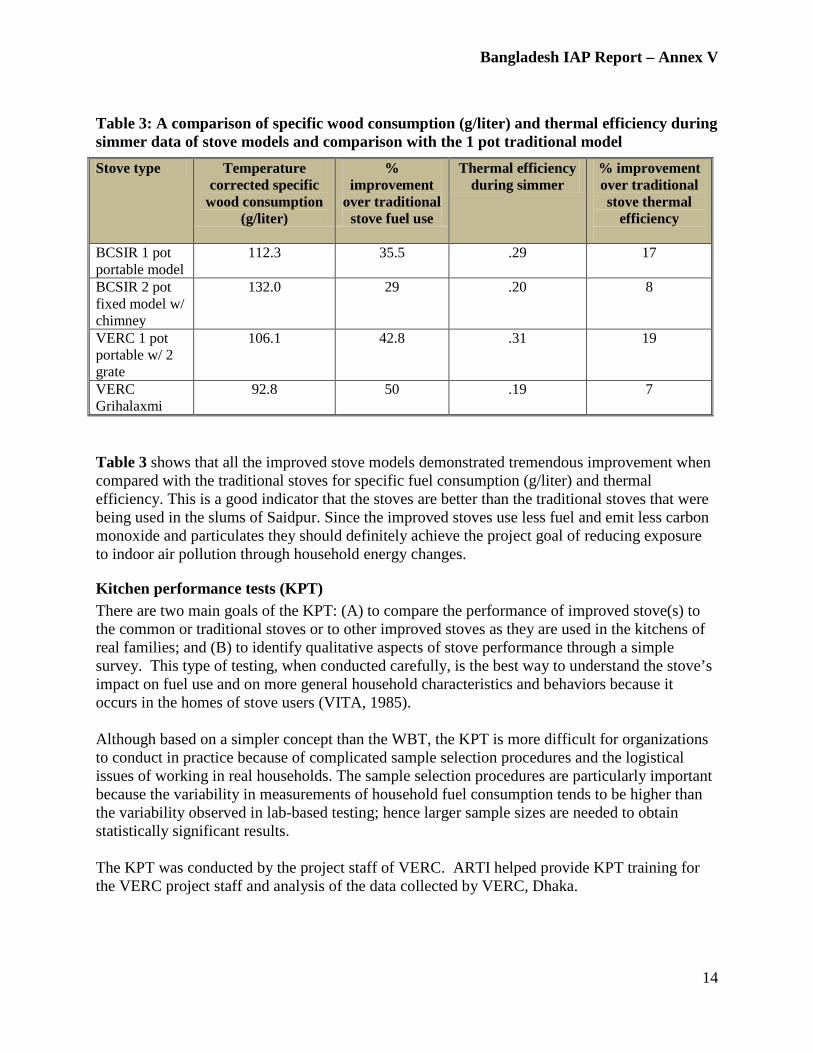
Bangladesh IAP Report – Annex V
14
Table 3: A comparison of specific wood consumption (g/liter) and thermal efficiency during simmer data of stove models and comparison with the 1 pot traditional model
Table 3 shows that all the improved stove models demonstrated tremendous improvement when compared with the traditional stoves for specific fuel consumption (g/liter) and thermal efficiency. This is a good indicator that the stoves are better than the traditional stoves that were being used in the slums of Saidpur. Since the improved stoves use less fuel and emit less carbon monoxide and particulates they should definitely achieve the project goal of reducing exposure to indoor air pollution through household energy changes.
Kitchen performance tests (KPT) There are two main goals of the KPT: (A) to compare the performance of improved stove(s) to the common or traditional stoves or to other improved stoves as they are used in the kitchens of real families; and (B) to identify qualitative aspects of stove performance through a simple survey. This type of testing, when conducted carefully, is the best way to understand the stove’s impact on fuel use and on more general household characteristics and behaviors because it occurs in the homes of stove users (VITA, 1985). Although based on a simpler concept than the WBT, the KPT is more difficult for organizations to conduct in practice because of complicated sample selection procedures and the logistical issues of working in real households. The sample selection procedures are particularly important because the variability in measurements of household fuel consumption tends to be higher than the variability observed in lab-based testing; hence larger sample sizes are needed to obtain statistically significant results. The KPT was conducted by the project staff of VERC. ARTI helped provide KPT training for the VERC project staff and analysis of the data collected by VERC, Dhaka.
Stove type Temperature corrected specific
wood consumption (g/liter)
% improvement
over traditional stove fuel use
Thermal efficiency during simmer
% improvement over traditional stove thermal
efficiency
BCSIR 1 pot portable model
112.3 35.5 .29 17
BCSIR 2 pot fixed model w/ chimney
132.0 29 .20 8
VERC 1 pot portable w/ 2 grate
106.1 42.8 .31 19
VERC Grihalaxmi
92.8 50 .19 7
Bangladesh IAP Report – Annex V
15
During the KPT the project staff visited the participant households daily for a minimum of 7 days to weigh out the fuel that would be used for the daily cooking. During the daily visits the project staff:
• Weighed out fresh wood • Recorded the weight of the wood remaining from the previous day as well as charcoal
and ash • Questioned the cook regarding the food cooked during the whole day on the stove and
persons cooked for, including adults and children.
A questionnaire form was provided for this purpose and the staff filled in the information and also did the data entry in EXCEL sheets. Since there were 8 stove models, each model was tested in14 households. Staff visited each household daily to monitor the wood usage and ask questions for 7 consecutive days. This critical test requires a high level of cooperation between the project staff and participants and the VERC project staff must be commended for their excellent work.
The KPT was conducted for the following stove models:
1. 1 pot portable traditional wood-burning cookstove;
2. BCSIR 1 pot portable cookstove w/ grate;
3. BCSIR 2 pot fixed cookstove w/ chimney;
4. VERC Grihalaxmi;
5. VERC 1 pot portable cookstove w/ 2 grates; and
6. VERC 3 pot cookstove.
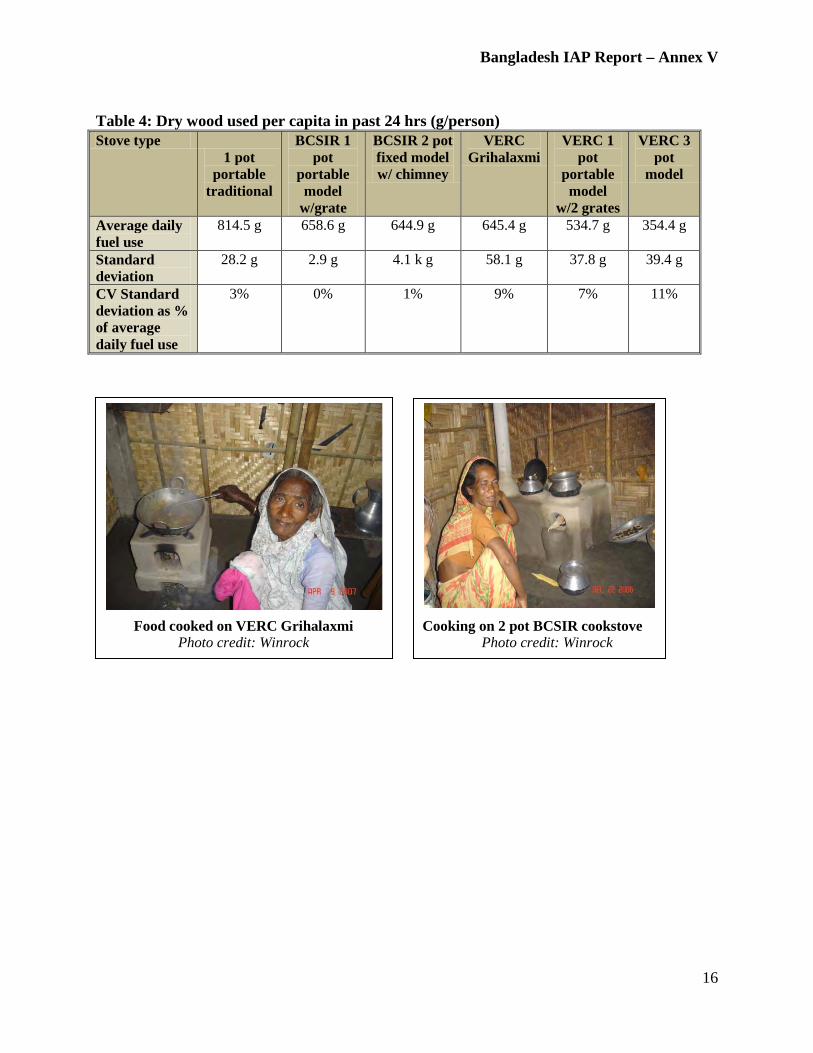
Bangladesh IAP Report – Annex V
16
Table 4: Dry wood used per capita in past 24 hrs (g/person) Stove type
1 pot portable
traditional
BCSIR 1 pot
portable model
w/grate
BCSIR 2 pot fixed model w/ chimney
VERC Grihalaxmi
VERC 1 pot
portable model
w/2 grates
VERC 3 pot
model
Average daily fuel use
814.5 g 658.6 g 644.9 g 645.4 g 534.7 g 354.4 g
Standard deviation
28.2 g 2.9 g 4.1 k g 58.1 g 37.8 g 39.4 g
CV Standard deviation as % of average daily fuel use
3%
0% 1% 9% 7% 11%
Food cooked on VERC Grihalaxmi
Photo credit: Winrock
Cooking on 2 pot BCSIR cookstove
Photo credit: Winrock

Bangladesh IAP Report – Annex V
17
KPT Results Each family had 4-5 members of which 2-3 were adults and 2 were children below 14 years of age. They cook for 2 hours in the morning and about 30 minutes to 1 hour in the evening. The evening cooking is mostly heating up whatever has been cooked in the morning in most households. The food cooked is more or less same in all houses. Rice is the staple food and is eaten for breakfast, lunch, and dinner. Bread and rotis are not very common here. The other food items cooked daily are lentils, vegetable curry which has gravy, a non-vegetarian item which may be fish or meat. Tea and milk are also boiled on these stoves. In all these households only one type of stove is used by the participants, and the KPT was conducted indoors on these stoves. Figure 8 gives the range of per capita fuel consumption revealed by the KPT.
Household survey A simple household survey was conducted at the end of the study period in 100 random households in the study areas of Saidpur and Parbatipur where the improved stove models had been sold. Since the project team had introduced 3 types of improved models of stoves the objective was to see the acceptance and usage pattern of the participants, the fuel use, and total size of the families who are using these stoves. This survey was conducted by the project staff of VERC. The questionnaire form was prepared and given to VERC by ARTI, Pune. The project staff of VERC also did the data entry of the 100 forms in Excel sheets and the data was analyzed by ARTI, Pune.
Figure 8: Average daily per capita fuel consumption from KPT
100 200 300 400 500 600 700 800 900 1000
1100
1 Pot Portable BCSIR model
2 pot BCSIR model
1 Pot 2 grate VERC
model
3 pot model 4 pot model VERC Grihalaxmi
Erath batch Traditional
stove
1 Pot Portable
traditional
Stove types
Dry wood / capita (dry)
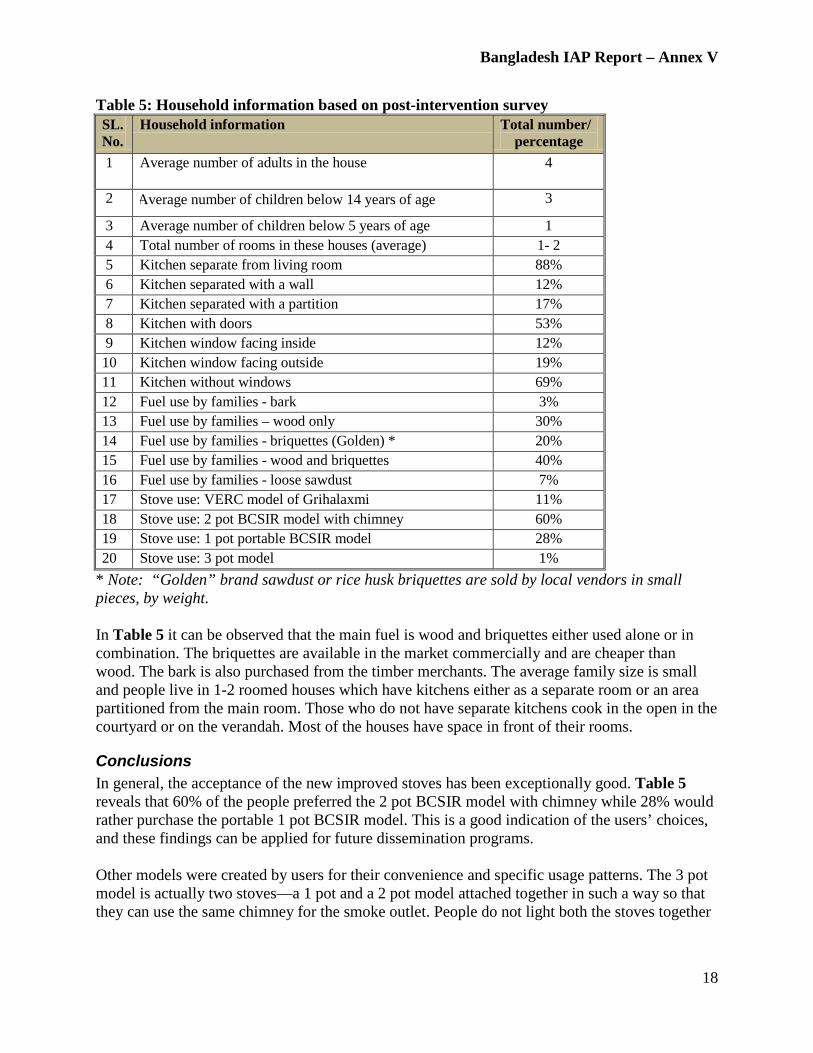
Bangladesh IAP Report – Annex V
18
Table 5: Household information based on post-intervention survey SL. No.
Household information Total number/ percentage
1 Average number of adults in the house
4
2 Average number of children below 14 years of age
3
3 Average number of children below 5 years of age 1 4 Total number of rooms in these houses (average) 1- 2 5 Kitchen separate from living room 88% 6 Kitchen separated with a wall 12% 7 Kitchen separated with a partition 17% 8 Kitchen with doors 53% 9 Kitchen window facing inside 12% 10 Kitchen window facing outside 19% 11 Kitchen without windows 69% 12 Fuel use by families - bark 3% 13 Fuel use by families – wood only 30% 14 Fuel use by families - briquettes (Golden) * 20% 15 Fuel use by families - wood and briquettes 40% 16 Fuel use by families - loose sawdust 7% 17 Stove use: VERC model of Grihalaxmi 11% 18 Stove use: 2 pot BCSIR model with chimney 60% 19 Stove use: 1 pot portable BCSIR model 28% 20 Stove use: 3 pot model 1%
* Note: “Golden” brand sawdust or rice husk briquettes are sold by local vendors in small pieces, by weight. In Table 5 it can be observed that the main fuel is wood and briquettes either used alone or in combination. The briquettes are available in the market commercially and are cheaper than wood. The bark is also purchased from the timber merchants. The average family size is small and people live in 1-2 roomed houses which have kitchens either as a separate room or an area partitioned from the main room. Those who do not have separate kitchens cook in the open in the courtyard or on the verandah. Most of the houses have space in front of their rooms.
Conclusions In general, the acceptance of the new improved stoves has been exceptionally good. Table 5 reveals that 60% of the people preferred the 2 pot BCSIR model with chimney while 28% would rather purchase the portable 1 pot BCSIR model. This is a good indication of the users’ choices, and these findings can be applied for future dissemination programs. Other models were created by users for their convenience and specific usage patterns. The 3 pot model is actually two stoves—a 1 pot and a 2 pot model attached together in such a way so that they can use the same chimney for the smoke outlet. People do not light both the stoves together

Bangladesh IAP Report – Annex V
19
but depending upon the quantity of food to be cooked they light either of the stoves. The 4 pot model is similar, in that two of the 2 pot models have been similarly joined together. Some of these “enhanced” models may be convenient for users. In some cases, however, the user simply looked at his neighbors’ models and constructed his own stoves without molds in order to save money (this way they do not have to pay the entrepreneurs who make the improved stoves). These stoves may not follow the dimensions specified for the improved stoves. The grates used in these self-designed models also may not be to specifications. In some cases the grate is made of fired clay, which is cheaper than the cast iron grates. In some of the entrepreneur-installed stoves, the chimneys have been installed but have not been cleaned since installation, which will surely cause blockages and then back drafts in the near future. This type of maintenance issue may become an obstacle in the cookstove program, as people will start complaining and rejecting the stoves. Many households did not bother to put the cap on top of the chimney since the cap is an additional expense. Without the cap, however, leakage is likely during the monsoons. Overall, the improved stove program has been a success and has achieved its objective for now and can be emulated elsewhere in the country with the BCSIR stove models as well as other stove models. The caveat is that great emphasis has to be given to quality control in stove manufacture, education in stove usage, and awareness generation for proper use and long-term maintenance of the stoves. Without these components, stove programs to reduce indoor air pollution may meet with initial success but in the long run will fail in their objectives since poorly constructed and maintained stoves will fail to perform at optimum levels and then the people will reject them or refuse to buy them later.

Bangladesh IAP Report – Annex VI
ANNEX VI – Behavior Change Communications Materials
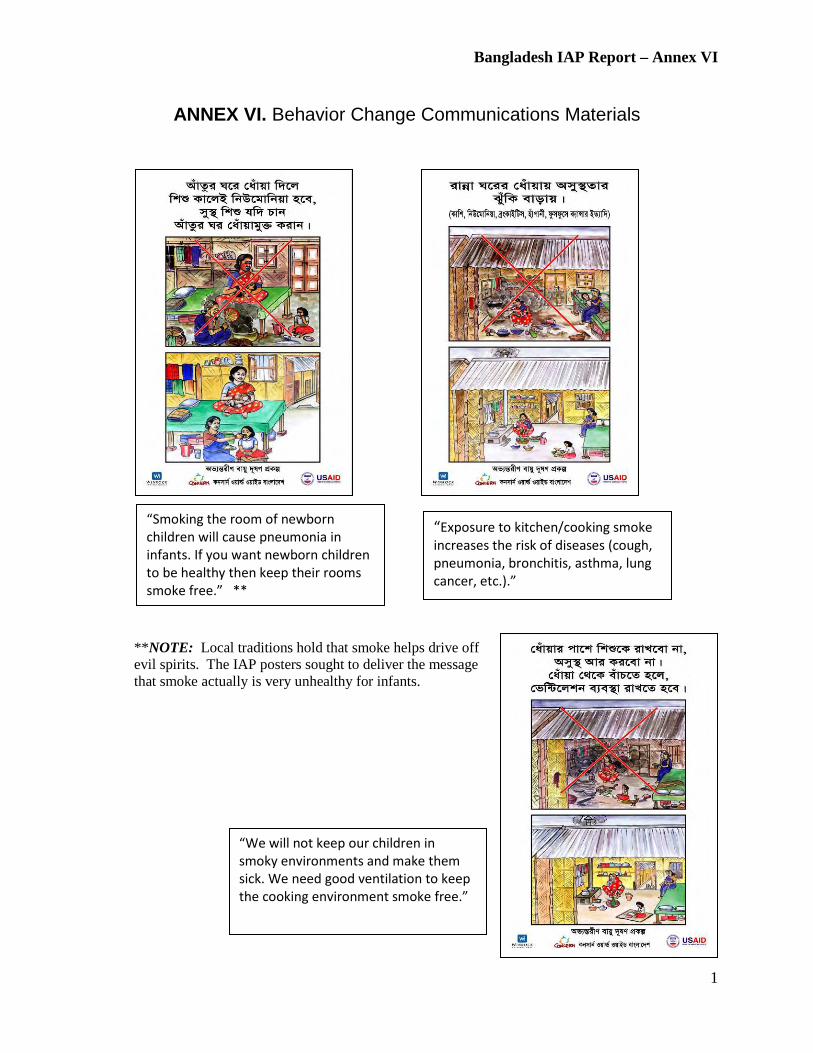
Bangladesh IAP Report – Annex VI
1
ANNEX VI. Behavior Change Communications Materials
**NOTE: Local traditions hold that smoke helps drive off evil spirits. The IAP posters sought to deliver the message that smoke actually is very unhealthy for infants.
“Smoking the room of newborn children will cause pneumonia in infants. If you want newborn children to be healthy then keep their rooms smoke free.” **
“Exposure to kitchen/cooking smoke increases the risk of diseases (cough, pneumonia, bronchitis, asthma, lung cancer, etc.).”
“We will not keep our children in smoky environments and make them sick. We need good ventilation to keep the cooking environment smoke free.”
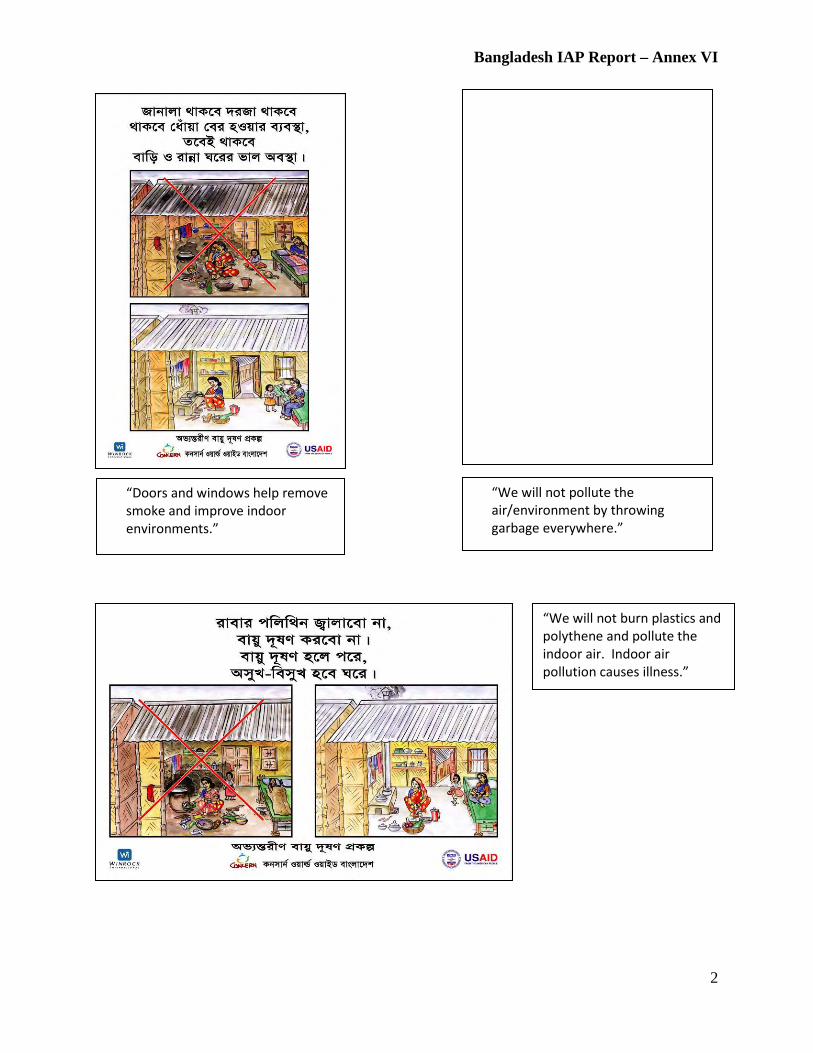
Bangladesh IAP Report – Annex VI
2
“We will not pollute the air/environment by throwing garbage everywhere.”
“We will not burn plastics and polythene and pollute the indoor air. Indoor air pollution causes illness.”
“Doors and windows help remove smoke and improve indoor environments.”