Embed Size (px)
Citation preview

August 9, 2010
1
www.stcmanagement.com www.stcmanagement.blogspot.com 10722 Beverly Blvd, Suite P, Whittier, CA 91601 (P) 562.695.1513 | (F) 562.695.1834
COMMERCIAL REAL ESTATE
MARKET UPDATES
GENERAL 市場概括
PCAs and CRE Proving Effective Indicators of Bank Failures
2010 年至今已有 108 家銀行被關閉;這些銀行的問題貸款中 80%與商業
地產有關
Re-Priced Assets Key to Commercial Real Estate Rebound
商業地產復蘇的關鍵在於資產的重新定價
CoStar's July 2010 Commercial Repeat-Sale Indices Indicates a Pause and Softening in Institutional Grade Investing
Costar 七月份的指標顯示機構級別的商業地產投資有暫停及軟化的跡象
MULTIFAMILY 公寓
Apartment Demand, Large Sales Transactions Bounce Back in First-Half 2010
公寓需求與大型出售在 2010 前半年反彈
HOTEL 酒店
California Hotel Defaults Continue To Escalate
加州酒店貸款的拖欠率持續上升
FINANCING 貸款與資金
Commercial Office, Industrial Mortgage Volume Picking Up
辦公樓與工業倉庫的貸款發行增加
CMBS, CDO Loan Defaults Continue To Move Up
商業地產抵押證券與债务抵押债券的拖欠率持續上升
Consumer Money Rates (Mortgage Rate, Prime Rate, etc.)
消費者市場利率:房貸、基本利率、等等
STC LISTINGS STC 獨家代理物業出售
San Gabriel Office/Retail
聖蓋博獨棟商用物業
Santa Ana Preschool/Redevelopment Opportunity
橙縣幼稚園/重新開發機會
Main St. Alhambra Retail-Office Mixed Use
阿罕布拉零售/辦公樓

August 9, 2010
2
www.stcmanagement.com www.stcmanagement.blogspot.com 10722 Beverly Blvd, Suite P, Whittier, CA 91601 (P) 562.695.1513 | (F) 562.695.1834
PCAs and CRE Proving Effective Indicators of Bank Failures
2010 年至今已有 108 家銀行被關閉;這些銀行的問題貸款中 80%與商業地產有關
(CoStar) Federal banking regulatory enforcements known as Prompt Corrective Actions (PCA) are proving to be a strong indicator of impending bank failures. Eight of the 22 banks that failed last month had PCAs enforcements issued against them this year. In addition, 28 of the 42 banks that had PCAs enforcements issued against them this year have failed. In this column, we've commonly referred to PCAs as "30 day or else notices." Prompt corrective actions are generally given to banks that are deemed severely undercapitalized. The banks are typically given 30 days to come up with new capital, find a partner or buyer or face takeover action by federal regulators. The PCAs most often are issued either by the Federal Reserve Board or the Federal Deposit Insurance Corp. In total this year, 108 banks have failed and the FDIC is on track to close nearly 200 banks this year, according Christopher Moyer, an associate at Cushman & Wakefield Sonnenblick-Goldman in New York in the firm's August issue of its Capital Markets Update. More interestingly, Moyer said: "Among the closed banks, real estate loans represented 94% of their non-performing loans, with commercial real estate constituting a whopping 80% of non-performing loans." The following is a list of banks and their levels of commercial real estate distress that are still operating but that have also had PCAs issued against them this year.
Bank, City, State
PCA Action
Date
Total CRE Distress (as of
3/31/2010) % CRE Distress
To Assets Comment
Pacific State Bank, Stockton, CA
7/20/2010 $55,083 17%
North County Bank, Arlington, WA
6/24/2010 $56,008 17%
Pierce Commercial Bank, Tacoma, WA
6/10/2010 $9,495
4%
Blue Ridge Savings Bank, Inc., Asheville, NC
5/28/2010 $19,605 9%
Horizon Bank, Bradenton, FL
2/27/2010 $17,135 9% Has engaged financial advisors for a recapitalization since PCA
Shoreline Bank, Shoreline, WA
5/27/2010 $13,328 12%
Legacy Bank, Scottsdale, AZ
5/24/2010 $22,672 13%
Ravenswood Bank, Chicago, IL
5/6/2010 $92,156 31%
Badger State Bank, Cassville, WI
5/5/2010 $4,627 5%
Butte Community Bank, Chico, CA
5/3/2010 $89,753 17%

August 9, 2010
3
www.stcmanagement.com www.stcmanagement.blogspot.com 10722 Beverly Blvd, Suite P, Whittier, CA 91601 (P) 562.695.1513 | (F) 562.695.1834
First Sound Bank, Seattle, WA
4/28/2010 $29,661 16% Has raised new capital since PCA
Sonoma Valley Bank, Sonoma, CA
4/13/2010 $53,886 15% Entered into Written Agreement with banking regulators and reported 2Q profit since PCA
American West Bank, Spokane, WA
2/24/2010 $134,726 9% Has cut losses, nonperforming loans and provisions for loan losses since PCA
Ventura County Business Bank, Oxnard, CA
2/5/2010 $5,779 7%

August 9, 2010
4
www.stcmanagement.com www.stcmanagement.blogspot.com 10722 Beverly Blvd, Suite P, Whittier, CA 91601 (P) 562.695.1513 | (F) 562.695.1834
Re-Priced Assets Key to Commercial Real Estate Rebound
商業地產復蘇的關鍵在於資產的重新定價
By Mark Heschmeyer (CoStar) The commercial real estate recovery has become dependent on, and stands precariously linked to, the re-pricing and deleveraging of property positions, according to the CCIM Institute and the Real Estate Research Corp. (RERC). That is a change from being less contingent on access to capital, the groups said, given that liquidity has returned to the CRE markets -- and in some cases, is scarily reminiscent of the pre-credit crisis capital market environment. "The money is there," said Richard Juge, CCIM, the 2010 president of the CCIM Institute and president of RE/MAX Commercial Brokers in Metairie, LA. "It's a re-pricing and deleveraging issue versus a liquidity issue. Capital is being invested in commercial real estate assets that have been re-priced to a level that makes sense and with sufficient deleveraging, meaning there's not too much of a loan above the value of the asset. The large institutions and other investors have been able to re-price their assets down by 40% to 50% while still maintaining a positive equity position." The CCIM Institute's chief real estate economist, Ken Riggs, CCIM, said he believes that given the amount of liquidity in the market and the ability of lenders to re-price assets at a level that will clear the market, the process of refinancing debt will be at a more measured pace than most predict and will serve as a guiding hand out of this severe and Draconian commercial real estate recession. "I don't see this huge onslaught where large volumes of distressed assets are placed in the market and the supply of properties at distressed levels overwhelms the investment demand side," said Riggs, who is also president and CEO of the Chicago-based Real Estate Research Corp. "There's equity sitting on the sidelines now, waiting for this to play out." "The process will be very selective," Riggs added, "with some banks and insurance companies taking back properties and leaving them on the balance sheet. They will take them to the market when it's the right time and when the pricing can be properly achieved. It will be a slow, arduous, and challenging process, but I don't see it as being catastrophic or disrupting the current recovery." CCIM and RERC said the industry is at a stabilization point with commercial property becoming attractive on a relative basis and getting the attention of many diverse investors. "We are starting to get traction. The recovery is becoming real," said Juge. "While it's still not as attractive as it was in 2006 and 2007, commercial real estate came into this recession in better shape than it had in the past with less building than in other downturns. If you put that in context, there is equity that wants to invest in the market. It's a question of re-pricing." According to Riggs, REITs have been able to recapitalize the quickest and are primarily leading the buying. "It's the buyers that are well capitalized-the public and private REITs, institutional capital, and pension funds that are out there buying" said Riggs. "On the sell side you see rebalancing and some stress situations, but it's not to the level where banks are dumping large portfolios. Thus we like what we see from the buy/sell perspective and hope that the dynamics continue along those lines. We're watching carefully to make sure it doesn't become a market that's ruled by distressed sellers and distressed pricing.

August 9, 2010
5
www.stcmanagement.com www.stcmanagement.blogspot.com 10722 Beverly Blvd, Suite P, Whittier, CA 91601 (P) 562.695.1513 | (F) 562.695.1834
"In the end, commercial real estate investments are linked and compared to investment alternatives of stocks, bonds, and cash investments in a global financial environment that has been laced with risk and unquantifiable uncertainty, and commercial real estate is offering a relatively predictable investment alternative, if re-pricing has taken place," said Riggs. "Commercial real estate offers a tangible asset that has reasonable transparency and information in which an informed investment decision can be made. Further, it offers risk-adjusted and absolute returns that will likely outpace all alternatives over the next 10 years. Put it all together and commercial real estate has gained the attention of local, regional, national, and international investors in search of a rational place to put their money and meet investment returns requirements. They'll soon be able to sleep at night."

August 9, 2010
6
www.stcmanagement.com www.stcmanagement.blogspot.com 10722 Beverly Blvd, Suite P, Whittier, CA 91601 (P) 562.695.1513 | (F) 562.695.1834
CoStar's July 2010 Commercial Repeat-Sale Indices Indicates a Pause and Softening in Institutional Grade Investing
Costar 七月份的指標顯示機構級別的商業地產投資有暫停及軟化的跡象 By Mark Heschmeyer (CoStar) Commercial real estate pricing has been a tale of two worlds, with the largest metropolitan markets attracting significant institutional capital and forcing prices upward over the first two quarters of 2010, while the broader market has continued to soften, according to the first monthly CoStar Commercial Repeat-Sale Indices (CCRSI), produced by CoStar Group, Inc. This divergence may soon change, however, with the indices, compiled over the last 10 months, now indicating a pause and softening in overall investor activity, even within the primary markets for investment- or institutional-grade property. Over the past 10 months, the overall composite CCRSI oscillated from positive to negative and back again, with preliminary July figures very likely to be down for investment-grade property markets. From May to June, the composite CCRSI was down 7.78%, with the investment grade property declining by 4.83%, reversing previous positive gains. The pause in some of the positive price trends corresponds to renewed uncertainty in the U.S. economy, persistent weakness in the housing market and concerns surrounding the European economy. In addition, financial reform has slowed commercial mortgage markets as lenders are now in the process of analyzing and interpreting capital requirements and "skin-in-the-game" provisions. Many of the opportunity funds continue to seek out distressed properties, which are affecting the prices shown in the index. But the expectation of a "tsunami of opportunities" has not materialized and overall transaction volumes remain below normal, according to the CoStar indices. Distressed sales as a percent of transaction volume are highest for hospitality at 35%, followed by multifamily at 28%, office at 22%, retail at just under 20% and industrial at about 17%. These volumes appear to be stabilizing and the "extend and pretend" behavior of some lenders is likely to continue for the next several months, according to index findings. CoStar Group launched the Commercial Repeat-Sale Indices as a measure intended to provide consistent and timely information to help answer some of the fundamental economic questions regarding the commercial real estate industry, including, 'Are prices climbing or falling?' and 'On a month-to-month basis are property values going up or down?' "Currently, there are no effective, non-biased indices to measure commercial real estate price movements, and even less comparative information by property type or geographies," said CoStar Group Chief Executive Officer Andrew Florance. "In response to this void, we've developed the CCRSI to provide a comprehensive set of benchmarks that investors and other market participants can use to better understand and predict CRE price movements." CoStar has identified more than 85,000 repeat sale pairs in its U.S. database, which it believes is the largest and most comprehensive comparable sales database in the U.S. commercial real estate industry.

August 9, 2010
7
www.stcmanagement.com www.stcmanagement.blogspot.com 10722 Beverly Blvd, Suite P, Whittier, CA 91601 (P) 562.695.1513 | (F) 562.695.1834
"An accurate measure of real estate price changes is a critical component to understanding investment or market performance. With commonly used average, median price and price per square foot indices, there are no controls for the ever-changing mix of properties sold during different time periods," added Florance. "Therefore, we do not believe average or median price indices per square foot are useful for rigorous analysis of market cycles. Appraisal-based indices are ineffective because they introduce lag and bias and minimum price cut indices are a circular reference in that they use price to define price." "By covering all levels and all types of CRE transactions, and by using well-tested available methodologies, we believe that CoStar's indices will provide one of the most comprehensive benchmarks for tracking and analyzing CRE price movements to date." The development and release of the CCRSI is important for two significant reasons, Florance said. "First, this will come out a month earlier than any other index out there, so when the market is in flux like right now or is going to turn, this information provides a leading indicator of how the other larger property indices will be turning," Florance said. "Second, this is the only set of indices really reflective of the broader market. In terms of sales volume, the existing indices ignore 70% to 80% of the property transactions. So this really is more indicative of what the typical real estate owner is experiencing, and a better index for this broader market." In addition to the overall CCRSI, CoStar has constructed more than two dozen sub indices using the unique breadth of CoStar's property and comparable sales data. SUB-INDICES SHOW BROAD SOFTENING When all commercial real estate transactions are considered, every major property type appeared to soften in terms of prices in the last three months. However, the top-10 largest office markets posted a positive 6.2% price change as did the top-10 industrial markets which rose 2%. Retail prices suffered the most in the second quarter of 2010 with a drop of 12%, in part because the top 10 retail markets had a -17% loss in prices. By region, Northeast and West suffered more of a pullback than the South and Midwest, although both are coming off much higher peaks than South and Midwest. The only positive price trends out of 16 regional indices provided below were Midwest office at 5.7%, Northeast apartments at 3.5%, West industrial at 1.8% and South apartments at 1%. SALES PAIRS TREND UPWARD The CCRSI July report is based on data through the end of June. In June, 665 sales pairs were recorded, up significantly from May, during which 506 transactions occurred. Overall, there has been an upward trend in pair volume going back to 2009. February 2009 appears to have been the low point in the downturn in terms of pair volume, when 374 transactions were recorded. Since then, pair volume has increased overall, and beginning in November 2009, year-over-year changes in pair volume have been positive every month. In terms of the mix of pairs that have sold, June saw an increase in the proportion of repeat investment grade properties trading hands. Investment grade sales amounted to 31% of the total number of sales in June, the highest level it has been going back to January 2008. This indicates an increased mix of larger properties changing hands, which had been at decreased levels since the beginning of the recession.

August 9, 2010
8
www.stcmanagement.com www.stcmanagement.blogspot.com 10722 Beverly Blvd, Suite P, Whittier, CA 91601 (P) 562.695.1513 | (F) 562.695.1834
Prior to June, 24% of sales pairs in 2010 were considered investment grade. This compares to an average of 33% of sales pairs being investment grade in 2006 and 2007, before the start of the downturn. Distress is also a factor in the mix of properties being traded. Since 2007, the ratio of distressed sales to overall sales has gone from around 1% to above 23% currently. Hospitality properties are seeing the highest ratio, with 35% of all sales occurring being distressed. Multifamily properties are seeing the next highest level of distress at 28%, followed by office properties at 21%, retail properties at 18%, and industrial properties at 17%. CoStar Group said it plans to provide CCRSI updates on the first Wednesday of each month to serve as timely indicators of the overall health of the commercial real estate industry.
August 9, 2010
9
www.stcmanagement.com www.stcmanagement.blogspot.com 10722 Beverly Blvd, Suite P, Whittier, CA 91601 (P) 562.695.1513 | (F) 562.695.1834
Apartment Demand, Large Sales Transactions Bounce Back in First-Half 2010
公寓需求與大型出售在 2010 前半年反彈
By Randyl Drummer (CoStar) Nearly 90% of the top apartment markets in the U.S. experienced demand growth during a solid performance for multifamily leasing in the first half of 2010. The first six months also brought an uptick in investment sales, particularly in the number of transactions valued at $100 million or more. Some of the markets most ravaged by the housing collapse posted the strongest gains at midyear, with 47 of the 54 largest metro areas tracked by CoStar Group seeing declines in apartment vacancy. "It has been a great six months for apartment fundamentals," said CoStar Global Strategist Michael Cohen, who this week co-presented the Mid-Year 2010 Multifamily Review and Outlook, the final installment in CoStar’s second-quarter series on the state of commercial real estate. The apartment, office, industrial and retail sectors all enjoyed a modest but relatively broad recovery at the year's halfway point. The hangover from the mortgage meltdown and housing recession continues to impact the apartment market. Home ownership has fallen from a high of 70% of households to less than 67%, and "what’s bad for single-family [residential] is generally good for multifamily," said CoStar Vice President of Analytics Norm Miller. In a few years, 3.5 million households have transitioned from single-family ownership to the rental market, said Miller, who joined Cohen and CoStar Director of Analytics Jay Spivey in the apartment update and forecast. The national apartment vacancy rate ended 2009 at 8.4%, and apartment inventory last year saw negative absorption of 57,000 units. Both metrics are the worst since at least 1982. However, the national multifamily vacancy rate has fallen 30 basis points over the last two quarters to 8.1% as of June 30. Demand reclaimed some lost ground in the first six months, with positive net absorption of 76,000 units, in part because new construction is at an all-time low, with just 50,000 units scheduled for delivery this year. Phoenix, one of the metros hurt worst by the housing bubble, topped the list with more than 2.2% demand growth in the first half, with Jacksonville, FL, and Raleigh, NC, also showing signs of strengthening. Oklahoma City, Miami and Detroit were among a small group of metros that saw demand continue to erode. Some analysts have attributed part of the increased demand to "decoupling," a term in the multifamily industry for individuals, usually in their 20s, who are confident enough in their economic future to leave their parents or roommates to get a place of their own. However, Cohen said there are a number of factors for the bounce, including the decline in single-family home ownership, moderation in the amount of shadow inventory of rented-out single-family homes, and continuing inability by many renters to qualify for a home mortgage. One factor largely overlooked by market watchers is the relatively quiet growth in job creation, Cohen said. The nation added a higher-than-expected 900,000 jobs in the first half, including 600,000 private-sector jobs. Markets like Phoenix and Raleigh reported some of the strongest job growth. Phoenix saw its vacancy rate fall by 185 basis points at mid-year. Jacksonville’s rate declined by 112 bps, San Jose, CA, 100; Hartford, CT, 94; and Dallas-Fort Worth, 89 bps. Class A and B properties have seen sharper declines in vacancy than Class C as renters "trade up" to take advantage of lower base rents, free rent and other landlord incentives, CoStar reports. Falling vacancies and

August 9, 2010
10
www.stcmanagement.com www.stcmanagement.blogspot.com 10722 Beverly Blvd, Suite P, Whittier, CA 91601 (P) 562.695.1513 | (F) 562.695.1834
modest rent bumps in Class A apartments are also a sign that owners are regaining some control over rents. With apartment supply tightening, owners in many metro markets are starting to dial back the level of concessions dangled to potential renters. Only 14 metros, led by New Orleans, Oklahoma City, Milwaukee, Cleveland and Houston, saw an increase in the amount of concessions, measured as a percentage of asking rents, according to data from Axiometrics and CoStar. Long Island, NY; San Jose, the San Francisco Bay Area, St. Louis and Honolulu saw the largest drops in tenant concessions. On the other hand, concessions are still "uncomfortably high" in many metros, especially those suffering the worst in the housing bust, Cohen said. Detroit, Atlanta, Las Vegas and Orlando are all dealing with double-digit levels of tenant perks, while supply constrained coastal markets in California and the East Coast are seeing the lowest concessions. Overall, about 47% of Class A properties tracked by Axiometrics offered concessions, down a full 7 percentage points from the end of 2009 -- with about 50% of Class B and 62% of Class C offering concessions. "The happy music for landlords is that finally, we’re beginning to see some positive effective rent growth," Cohen said. "It’s nice to see landlords gaining a little bit of pricing power." Effective rents turned positive in the second quarter, with Class A rates up 1.6% and Class B up 1.0%. Rents in vacancy challenged Class C properties fell another 0.4%. With employment and economic growth expected to moderate in the second half, CoStar expects that fundamentals will continue to improve, albeit at a more modest clip, with 22 metros seeing flat or modest vacancy increases in second half. "Given the pace of absorption we saw in the first half, it’s reasonable to assume a more moderate pace in the second half, but there’s still positive momentum," Cohen said. Fueled by a burst of strong economic growth in 2011-13, CoStar forecasts that supply, demand and vacancy fundamentals will remain positive through 2014. At the same time, growing number of echo boomers -- the children and grandchildren of baby boomers -- will start forming their own households. "The outlook is very promising overall," Cohen said. Quarterly multifamily investment sales volume, which hit bottom in first-quarter 2009, continued to trend upward in the first half of 2010, Spivey said. Average sales prices are also moving up. No deals of more than $100 million occurred in first quarter 2009, compared to 75 such deals in 2007 and 38 in 2008. "In 2010, we’ve seen 18 transactions over $100 million so far," Spivey said. "We're starting to see the big market coming back." New York led in sales volume with $2.3 billion with an average size of $11 million so far in 2010, followed by Washington, D.C. at $1.28 billion ($21 million average); Los Angeles at $1.17 billion ($2.2 million average). South Florida, Atlanta and Phoenix are also seeing higher volume, but with a higher percentage of distressed sales. Top sales in the second quarter included Equity Residential (NYSE: EQR)’s purchase of 425 Massachusetts Ave. in Washington, D.C. from Broadway Management for $167 million, or $298,748 per unit, in April. Chartwell Senior

August 9, 2010
11
www.stcmanagement.com www.stcmanagement.blogspot.com 10722 Beverly Blvd, Suite P, Whittier, CA 91601 (P) 562.695.1513 | (F) 562.695.1834
Housing REIT bought a portfolio of four properties in Colorado and Texas from ING Real Estate in May for $110 million, or $105,944 per unit. In Los Angeles, Watermarke Properties bought Watermarke Tower from Meruela Maddox in late April for $110 million, or $514,019 per unit.

August 9, 2010
12
www.stcmanagement.com www.stcmanagement.blogspot.com 10722 Beverly Blvd, Suite P, Whittier, CA 91601 (P) 562.695.1513 | (F) 562.695.1834
California Hotel Defaults Continue To Escalate
加州酒店貸款的拖欠率持續上升
(CoStar) The number of California hotels in default or foreclosed on continued to escalate through the second quarter, according to Atlas Hospitality Group's latest survey. A lot of recent industry news has spotlighted the turnaround in occupancy and average daily rate and there is certainly a much more positive attitude in the minds of investors, the group said. However, there is still a lot of pain in the market. Second quarter 2010 highlights from the Atlas Hospital survey were as follows:
478 California hotels are in default or have been foreclosed on, an 18% increase from the 1st quarter 2010 and 132% over the 2nd quarter of 2009. Atlas Hospitality estimates that the true number of distressed California hotels is much larger, with more than 1,000 properties operating under some form of forbearance agreement.
The number of foreclosed hotels increased 27% from the 1st quarter, from 79 to 100.
The total number of hotel rooms foreclosed on was at 7,560, up 255% from the same period in 2009.
The largest hotel to be foreclosed on was the 512-room Holiday Inn in San Jose.
78% of the hotels foreclosed on were independent properties, down from 90% in the first quarter 2010.
Riverside County led in the number of foreclosed hotels with 11, 11% of the total. San Bernardino County followed with nine and Los Angeles County had eight.
Of the 100 hotels that had been foreclosed on, only 12 (12%) had been resold to new investors.

August 9, 2010
13
www.stcmanagement.com www.stcmanagement.blogspot.com 10722 Beverly Blvd, Suite P, Whittier, CA 91601 (P) 562.695.1513 | (F) 562.695.1834
Commercial Office, Industrial Mortgage Volume Picking Up
辦公樓與工業倉庫的貸款發行增加 (CoStar) Second quarter 2010 commercial and multifamily mortgage loan originations were 1% higher than during the same period last year and 35% higher than during the first quarter, according to the Mortgage Bankers Association's (MBA) Quarterly Survey of Commercial/Multifamily Mortgage Bankers Originations. The 1% overall increase in commercial/multifamily lending activity during the second quarter was driven by increases in originations for office and industrial properties. When compared to the second quarter of 2009, the increase included a 183% increase in loans for industrial properties, a 180% increase in loans for office properties, an 18% increase in loans for hotel properties, a 76% decrease in loans for health care properties, a 25% decrease in multifamily property loans, and a 9% decrease in retail property loans. Among investor types, loans for conduits for CMBS saw an increase of 173% compared to last year's second quarter. There was also a 148% increase in loans for life insurance companies, a 12% decrease in loans for commercial bank portfolios, and the dollar volume of loans for Government Sponsored Enterprises (or GSEs – Fannie Mae and Freddie Mac) saw a decrease of 55%. "Borrowing remains light as few commercial property owners are selling or refinancing their properties unless they have to," said Jamie Woodwell, MBA's vice president of commercial real estate research. "Life insurers, CMBS conduits and others are back in the market and lending, and rates are at extremely attractive levels. However, low volumes of property sales, depressed property values, stressed cash flows and modest loan maturities are all keeping borrowing to a minimum."

August 9, 2010
14
www.stcmanagement.com www.stcmanagement.blogspot.com 10722 Beverly Blvd, Suite P, Whittier, CA 91601 (P) 562.695.1513 | (F) 562.695.1834
CMBS, CDO Loan Defaults Continue To Move Up
商業地產抵押證券與债务抵押债券的拖欠率持續上升 (CoStar) Fitch Ratings' U.S. CMBS cumulative default rate for its fixed-rate conduit universe stood at 9.48% as of the end of the second quarter, a 133 basis point (bp) movement from the first quarter and 289 bps from its year end 2009 study. The overall cumulative default rate is on track with Fitch Ratings' expectation of 11% by year end 2010. Large highly leveraged loans in later vintages are continuing to add to the increased pace of defaults. So far in 2010, 14 of more than $100 million defaulted. The largest newly defaulted loans in Q2 2010 were as follows. Columbia Center, Office, WA, $380 million, 2007 vintage Four Seasons Resort Maui, Hotel, HI $250 million, 2007 vintage World Market Center, Other, NV, $225 million, 2005 vintage. Hotel and multifamily loans lead the overall cumulative default rate by property type and saw a 409 and 498 basis point change from year end respectively. Newly added hotel defaults make up 12% of the year to date defaults, with three loans of more than $100 million defaulting. The remaining loans of more than $100 million that defaulted in 2010 are four office and four retail loans. These property types did not see as large of an increase in their overall cumulative default rate due to their large contribution to overall CMBS at 29% and 31%, respectively. The following is a breakdown of year-to-date June 2010 and cumulative defaults by property type.
Property Type, $ (bil.), Default Rate
Hotel, $45.40, 17.98%
Multifamily, $99.48, 14.13%
Office, $158.57, 6.42%
Other, $33.91, 4.46%
Retail, $164.92, 8.25%
Industrial, $31.28, 7.37%
Health Care, $5.79, 22.37%
Total, $539.34, 9.48%.
Delinquencies for U.S. CREL CDOs also rose last month due to $136.9 million in asset manager repurchases of troubled assets, according to Fitch's latest U.S. CREL CDO delinquency index. The June 2010 delinquency rate increased to 12.2% from 11.6% in May. Asset managers continued to actively repurchase defaulted and credit impaired assets from CDOs. In June, seven whole loans, 58 basis points (bps), were repurchased from three different CDOs, compared to 7 bps for May and 25 bps for April. Aside from these repurchases, new delinquent assets include four term defaults, six matured balloons, and 11 credit-impaired rated securities. There were 35 loan extensions reported in June, including two former matured balloon loans. Realized losses of approximately $39.4 million were reported in June from the disposal or resolution of other troubled assets. The highest asset loss to a CDO was $15 million, reflecting the impact on a real estate bank approximately 50% of par of a mezzanine loan interest on a mall located in Hawaii.

August 9, 2010
15
www.stcmanagement.com www.stcmanagement.blogspot.com 10722 Beverly Blvd, Suite P, Whittier, CA 91601 (P) 562.695.1513 | (F) 562.695.1834
Losses were also incurred on the sale of junior mezzanine and B-notes. Anecdotally, managers have noted an increased interest from prospective loan purchasers with loan-to-own strategies. Acquisition of junior portions of the capital stack of a loan can provide a purchaser with an opportunity to gain control over a collateral asset. Of the 35 CREL CDOs rated by Fitch Ratings, 34 reported delinquencies in June, ranging from 1.2% to 39.8%. Additionally, 15 Fitch rated CREL CDOs were failing at least one OC test, which is one less than last month's total. One CDO manager cured its failure of an overcollateralization (OC) test through its repurchase of defaulted assets; the CDO now has a slight cushion to its lowest OC test. Failure of OC tests leads to the cutoff of interest payments to subordinate classes, including preferred shares, which are typically held by the CDO asset managers.
August 9, 2010
16
www.stcmanagement.com www.stcmanagement.blogspot.com 10722 Beverly Blvd, Suite P, Whittier, CA 91601 (P) 562.695.1513 | (F) 562.695.1834
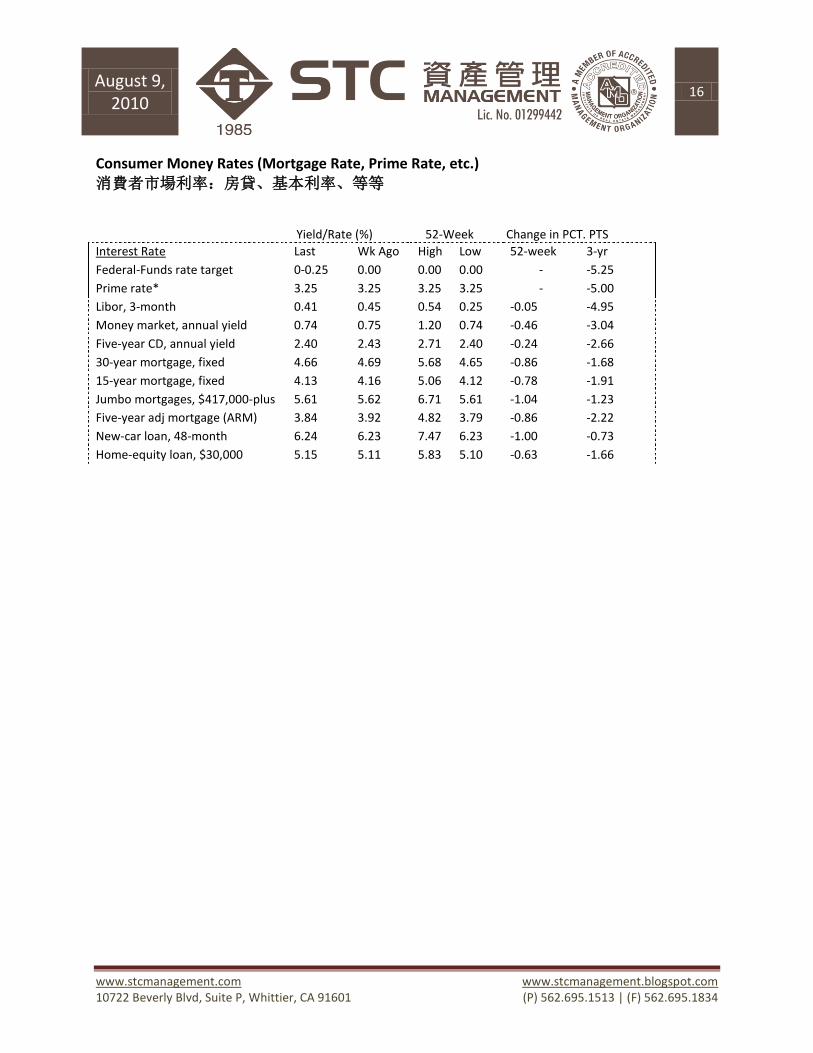
Consumer Money Rates (Mortgage Rate, Prime Rate, etc.)
消費者市場利率:房貸、基本利率、等等
Yield/Rate (%) 52-Week Change in PCT. PTS
Interest Rate Last Wk Ago High Low 52-week 3-yr
Federal-Funds rate target 0-0.25 0.00 0.00 0.00 - -5.25
Prime rate* 3.25 3.25 3.25 3.25 - -5.00
Libor, 3-month 0.41 0.45 0.54 0.25 -0.05 -4.95
Money market, annual yield 0.74 0.75 1.20 0.74 -0.46 -3.04
Five-year CD, annual yield 2.40 2.43 2.71 2.40 -0.24 -2.66
30-year mortgage, fixed 4.66 4.69 5.68 4.65 -0.86 -1.68
15-year mortgage, fixed 4.13 4.16 5.06 4.12 -0.78 -1.91
Jumbo mortgages, $417,000-plus 5.61 5.62 6.71 5.61 -1.04 -1.23
Five-year adj mortgage (ARM) 3.84 3.92 4.82 3.79 -0.86 -2.22
New-car loan, 48-month 6.24 6.23 7.47 6.23 -1.00 -0.73
Home-equity loan, $30,000 5.15 5.11 5.83 5.10 -0.63 -1.66