Embed Size (px)
Citation preview

3/27/2014
1
w w w . I C A 2 0 1 4 . o r g
Commercial Property Insurance Data and
Analytics --- Innovation and Globalization
Presented by Verisk Analytics
Session N-5A April 4, 2014
Commercial Property Insurance Data and
Analytics --- Innovation and Globalization
• Agenda– New approaches to managing accumulations of risk
– New approaches to gathering exposure data
– New approaches to rating
– Innovation in individual risk analysis
– Exporting best practices
– Workflow improvement
3/27/2014
2
Convenient Visual Displays Provide Insight into Clusters of Risk
Ring Analysis Identifies the Cluster of Risk
3/27/2014
3
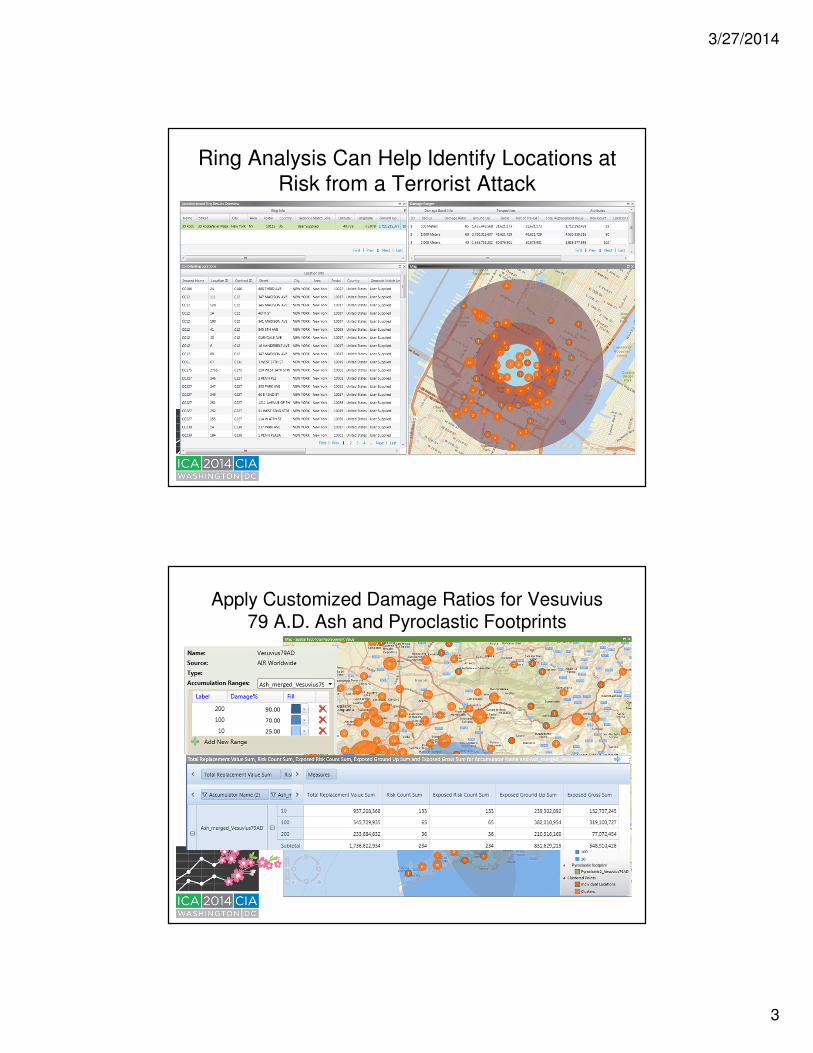
Ring Analysis Can Help Identify Locations at Risk from a Terrorist Attack
Apply Customized Damage Ratios for Vesuvius 79 A.D. Ash and Pyroclastic Footprints
Ash footprint (cm)
Pyroclastic footprint

3/27/2014
4
Geospatial Analysis of Portfolio Can Help Identify Risk Before an Event Occurs
Perform Accumulations and Report on Lloyds Realistic Disaster Scenarios
Construction Wind Speed Band (m/s)
< 80 KMPH
80 – 100 KMPH
100 – 120 KMPH
120 – 150 KMPH
Residential Wood 1,571,355 520,386 176,335 352,896
Concrete 1,881,467 80,600 456,857 421,627
Masonry 444,391 340,087 338,252 358,656
Commercial Steel 4,754,965 1,742,971 22,756 13,104
Concrete 1,346,692 64,948 820,920 317,417
Light Metal 3,243,782 1,174,479 780,265 212,264
Masonry 1,643,686 1,368,987 986,685 213,295
3/27/2014
5
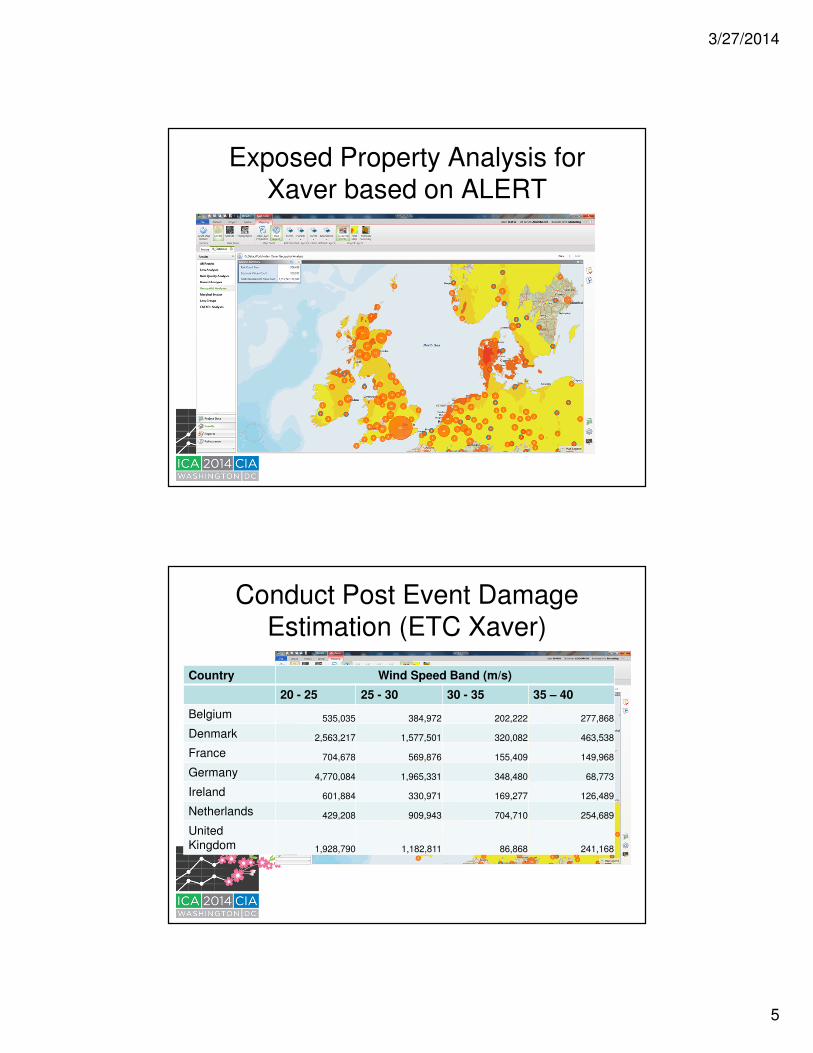
Exposed Property Analysis for Xaver based on ALERT
Conduct Post Event Damage Estimation (ETC Xaver)
Country Wind Speed Band (m/s)
20 - 25 25 - 30 30 - 35 35 – 40
Belgium 535,035 384,972 202,222 277,868
Denmark 2,563,217 1,577,501 320,082 463,538
France 704,678 569,876 155,409 149,968
Germany 4,770,084 1,965,331 348,480 68,773
Ireland 601,884 330,971 169,277 126,489
Netherlands 429,208 909,943 704,710 254,689
United Kingdom 1,928,790 1,182,811 86,868 241,168

3/27/2014
6
New Approaches to Gathering Exposure Data
• ISO/Verisk is employing innovative approaches to gathering detailed exposure information
– On Site Building Surveys now capture wind related building characteristics
– Desktop surveys supplement surveys
– Aerial Imagery – Data Capture Underway
Enhanced Wind Rating -
Background• Exposure to wind losses has grown
significantly in the U.S.
– Exposures along the coast have increased
– “Tornado Alley” presents additional exposure
• Traditionally, wind rating was based on fire construction codes, with modifications
3/27/2014
7
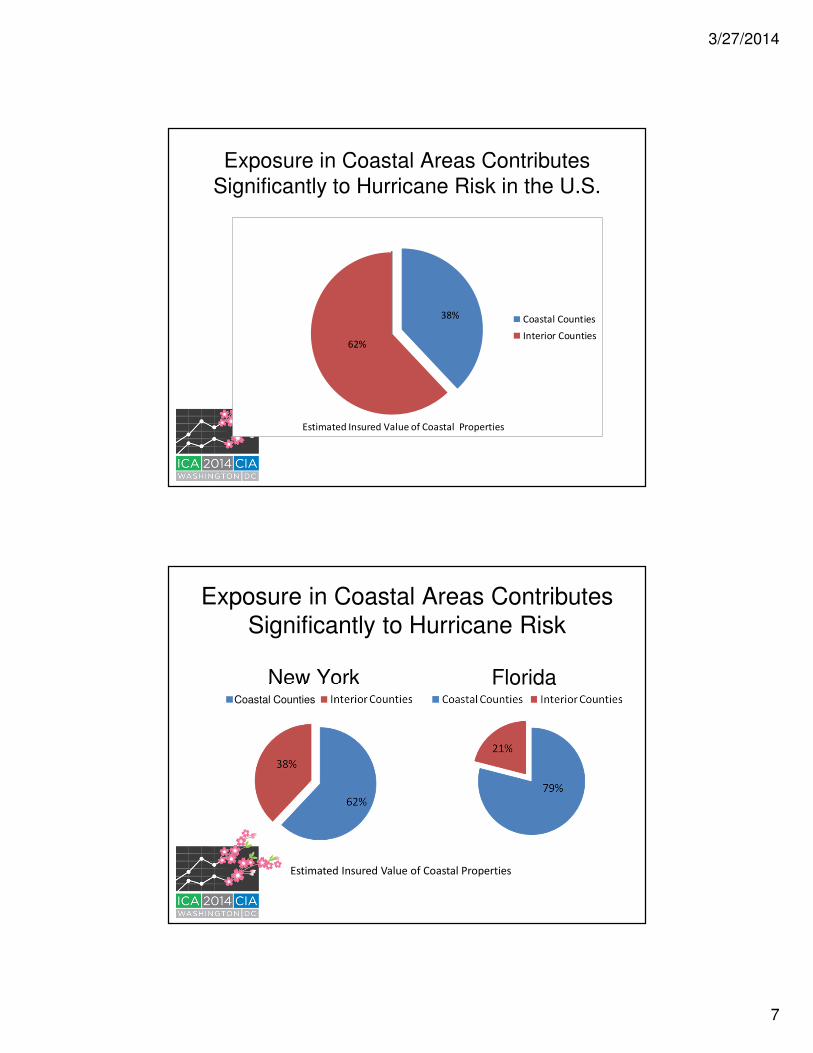
Exposure in Coastal Areas Contributes Significantly to Hurricane Risk in the U.S.
38%
62%
Coastal Counties
Interior Counties
Estimated Insured Value of Coastal Properties
Exposure in Coastal Areas Contributes Significantly to Hurricane Risk
New York Florida
Estimated Insured Value of Coastal Properties
Coastal Counties
3/27/2014
8
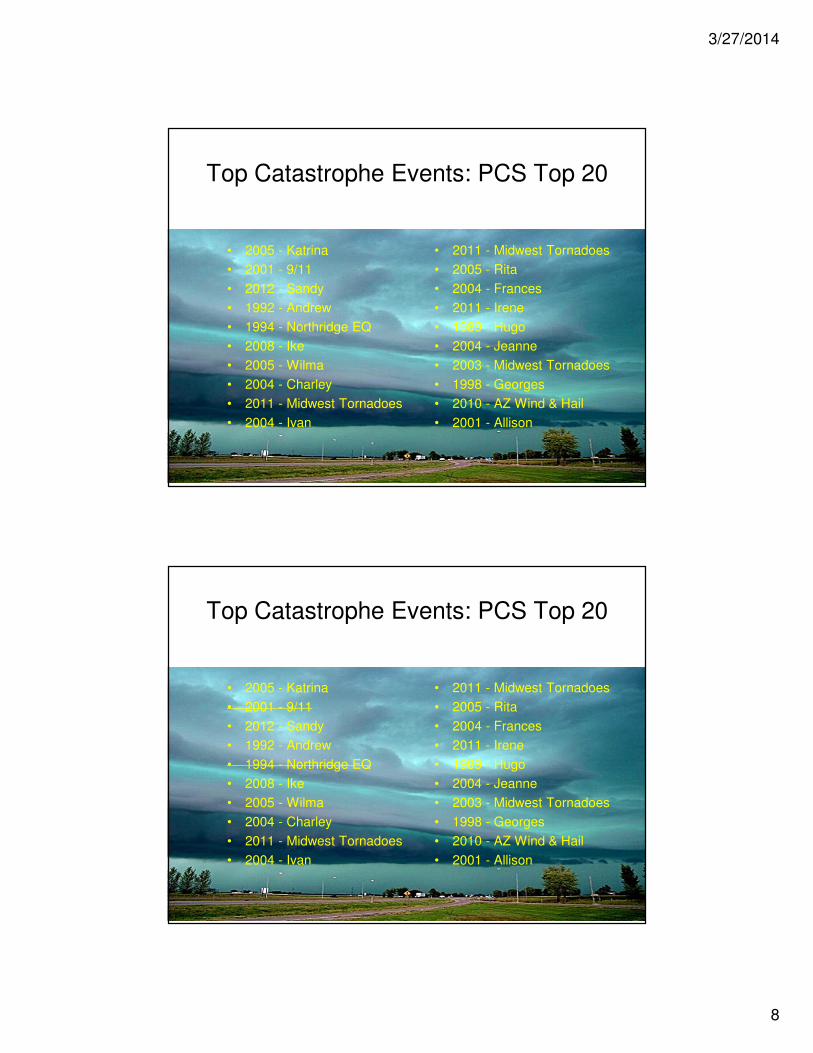
Top Catastrophe Events: PCS Top 20
• 2005 - Katrina
• 2001 - 9/11
• 2012 - Sandy
• 1992 - Andrew
• 1994 - Northridge EQ
• 2008 - Ike
• 2005 - Wilma
• 2004 - Charley
• 2011 - Midwest Tornadoes
• 2004 - Ivan
• 2011 - Midwest Tornadoes
• 2005 - Rita
• 2004 - Frances
• 2011 - Irene
• 1989 - Hugo
• 2004 - Jeanne
• 2003 - Midwest Tornadoes
• 1998 - Georges
• 2010 - AZ Wind & Hail
• 2001 - Allison
3/27/2014
9
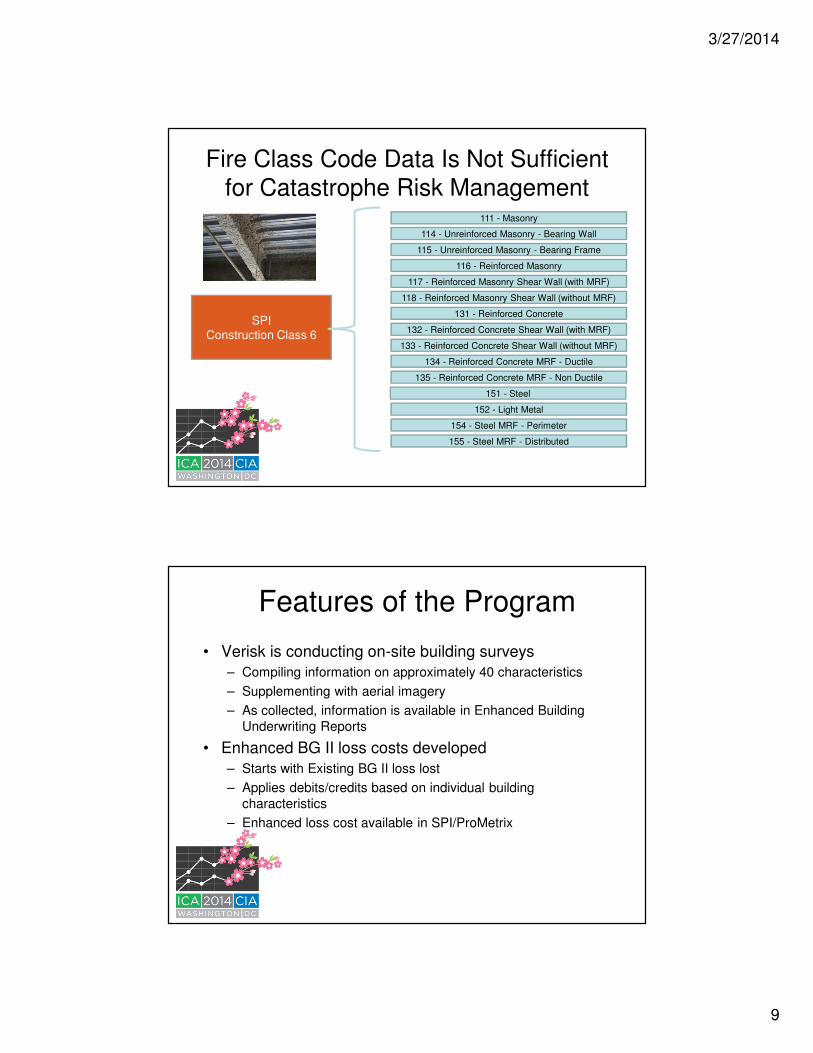
Fire Class Code Data Is Not Sufficientfor Catastrophe Risk Management
SPIConstruction Class 6
111 - Masonry
114 - Unreinforced Masonry - Bearing Wall
115 - Unreinforced Masonry - Bearing Frame
116 - Reinforced Masonry
117 - Reinforced Masonry Shear Wall (with MRF)
118 - Reinforced Masonry Shear Wall (without MRF)
131 - Reinforced Concrete
132 - Reinforced Concrete Shear Wall (with MRF)
133 - Reinforced Concrete Shear Wall (without MRF)
134 - Reinforced Concrete MRF - Ductile
135 - Reinforced Concrete MRF - Non Ductile
151 - Steel
152 - Light Metal
154 - Steel MRF - Perimeter
155 - Steel MRF - Distributed
Features of the Program
• Verisk is conducting on-site building surveys
– Compiling information on approximately 40 characteristics
– Supplementing with aerial imagery
– As collected, information is available in Enhanced Building Underwriting Reports
• Enhanced BG II loss costs developed
– Starts with Existing BG II loss lost
– Applies debits/credits based on individual building characteristics
– Enhanced loss cost available in SPI/ProMetrix
3/27/2014
10
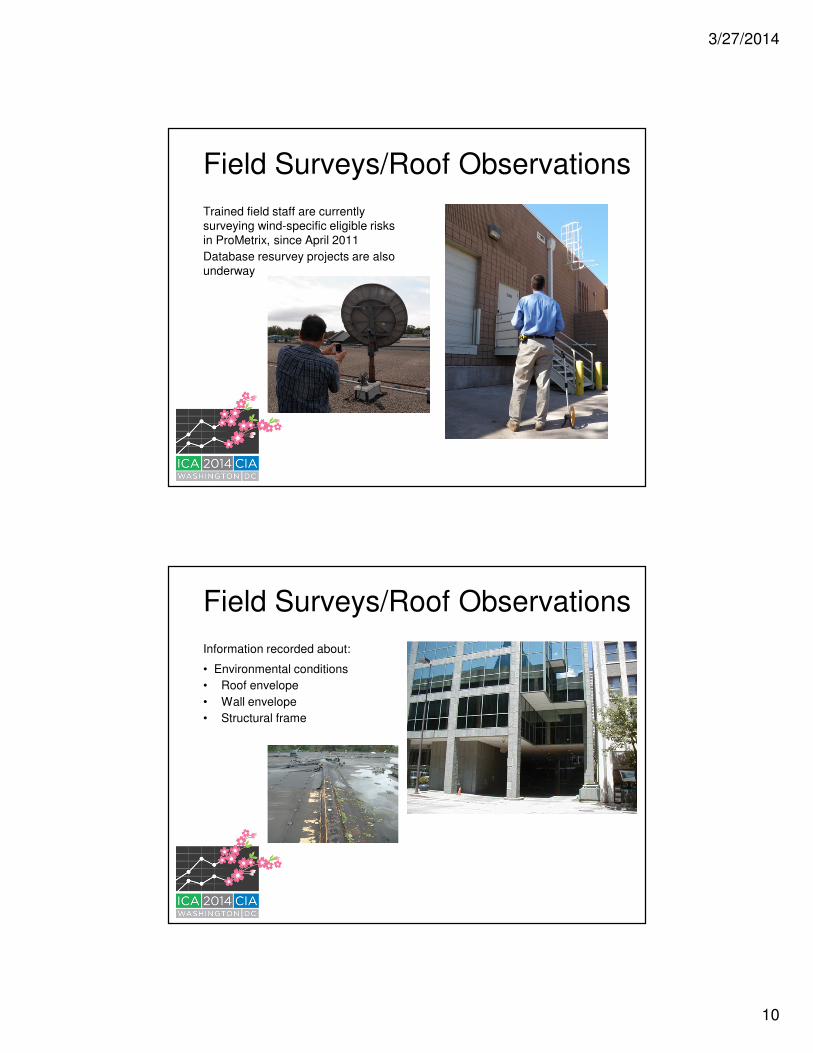
Field Surveys/Roof Observations
Trained field staff are currently surveying wind-specific eligible risks in ProMetrix, since April 2011
Database resurvey projects are also underway
Field Surveys/Roof Observations
Information recorded about:
• Environmental conditions
• Roof envelope
• Wall envelope
• Structural frame

3/27/2014
11
Enhanced Wind Rating Program
EWR Loss Costs
On-Site Survey
(Verisk Insurance Solution –
Commercial Property)
Hurricane and Severe
Thunderstorm Models
(AIR Worldwide)ISO Commercial
Property Insurance Data
(Commercial Property Multi-lines Actuarial
Division)
21
Eligibility for EWR Program– BG II Specific Rated Properties
– Geographic Risk Factor and Building Size Criteria
Geographic
Risk Factor
Building Size (1000 ft2)
10 - 25 >25 - 50 >50
Low
Medium X
High X X
Severe X X X
22
3/27/2014
12
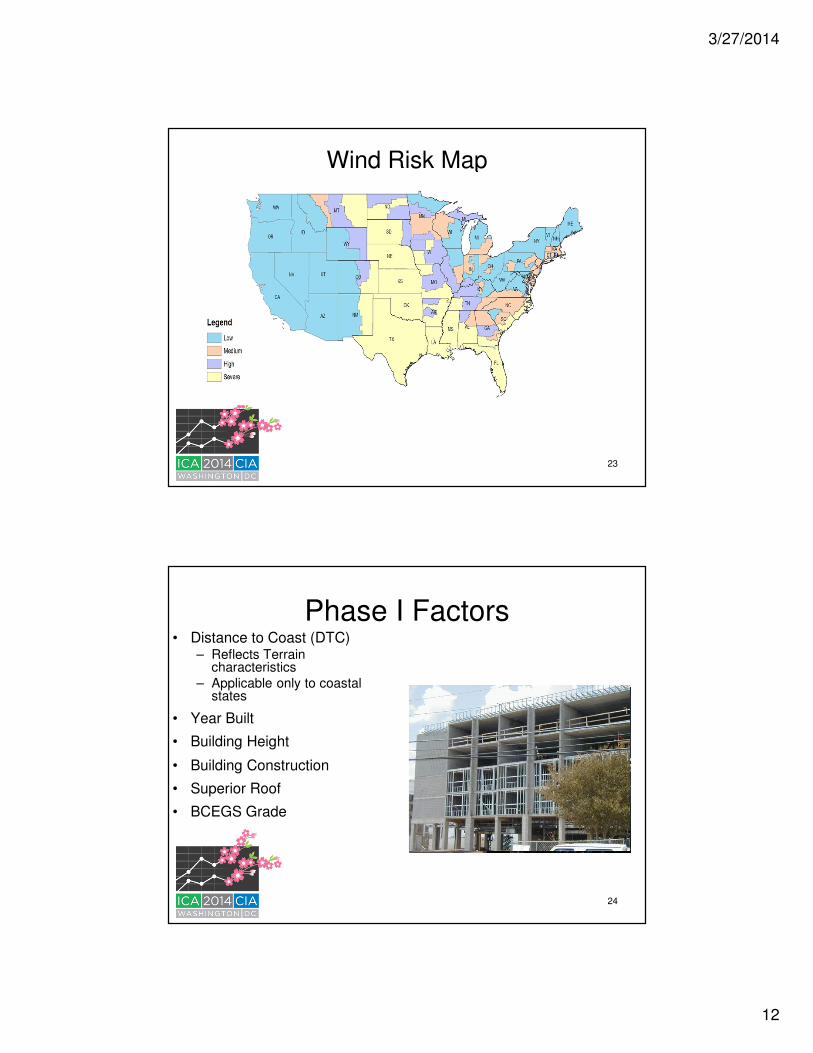
Wind Risk Map
23
Phase I Factors• Distance to Coast (DTC)
– Reflects Terrain characteristics
– Applicable only to coastal states
• Year Built
• Building Height
• Building Construction
• Superior Roof
• BCEGS Grade
24

3/27/2014
13
Data Used to Derive Factors
AIR Data
• Distance-to-Coast
• Year Built
ISO Stat Data
•Building Construction
•Superior Roof Credit• Building Height
25
Summary of EWR Program
Basic Commercial Property BG II Loss Costs
Debits/Credits for Individual Buildings
Balanced to 0% Overall Revenue Change
Debits/Credits Reflect Annual Capped at +25% & -20%
26

3/27/2014
14
Exposure Data Relevant for Modeling Individual Risks
Location
Geocode
Match Level
Street
AddressCity Postal Code
Replacement Value
Building
Primary Building Characteristics
Construction Occupancy Age Height
Policy Terms
Limits Deductibles
Additional Building Characteristics
Window
ProtectionGlass Type Glass Percent Roof Geometry Roof Covering
Roof Covering
Attachment
Roof DeckRoof Deck
AttachmentRoof Anchorage Wall Type Wall Siding Exterior Doors
Soft Story Building Shape TorsionFoundation
Type
Foundation
Connection
Special EQ
Resistant
Systems
Individual Risk Modeling Can Produce a Detailed EP Curve for a Single Property
0
10
20
30
40
50
60
10% 5% 2% 1% 0.4%
Mo
de
led
Lo
ss
es
Th
ou
sa
nd
s
Exceedance Probability
Aggregate Loss
The Monroe Building2001 Pennsylvania Ave.Replacement Value: $38.5m
AAL

3/27/2014
15
Site-Specific Hazard:
• Modeled and non-modeled perils/territories
Complex, High Value Locations May WarrantIndividual Risk Engineering Analysis
Additional considerations:
• Site-specific design standards • Analytical evaluations• Custom damage functions• Custom BI modeling
Data quality enhancements:
• Review of available data sources (client data, literature, public, web)
• Focused discussions with client personnel
• Site-inspections
Development of:
• Risk ranking at different levels (e.g. asset, group, portfolio)
• Conceptual mitigation measures
• Evaluation of benefit of mitigation measures
PolicyConditions
EventGeneration
ExposureInformation
LossCalculation
Mitigation / PolicyConditions
Limit
Deductible
IntensityCalculation
EXPOSUREINFORMATION
ENGINEERING
DamageEstimation
MITIGATIONPolicy Conditions
Physical
Operational
HAZARD
LocalIntensity
EventGeneration
LOSSCALCULATION
Analytics Developed in One Geographical Area Expanded to Other Areas
• Loss costs and Excess layer pricing tools based on US risks are expanded to an International focus.
• As an example, Excess layer pricing tools (Property Size of Loss Distributions) may be extended to an International focus by using COPE-ARM adjustments (Construction, Occupancy, Protection, Exposure, Amount of Insurance, Replacement Costs, Misc).
• These techniques may be applied to Ground-Up loss costs as well.
3/27/2014
16
31
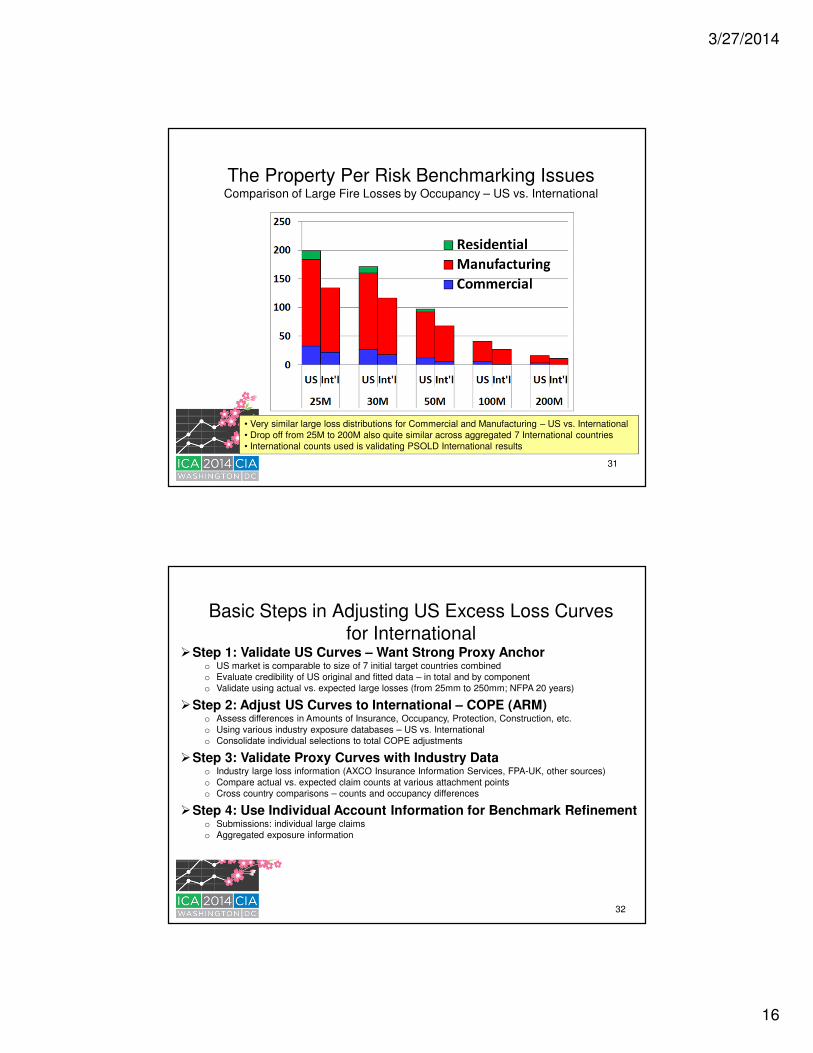
The Property Per Risk Benchmarking IssuesComparison of Large Fire Losses by Occupancy – US vs. International
• Very similar large loss distributions for Commercial and Manufacturing – US vs. International• Drop off from 25M to 200M also quite similar across aggregated 7 International countries• International counts used is validating PSOLD International results
Basic Steps in Adjusting US Excess Loss Curves for International
�Step 1: Validate US Curves – Want Strong Proxy Anchoro US market is comparable to size of 7 initial target countries combinedo Evaluate credibility of US original and fitted data – in total and by componento Validate using actual vs. expected large losses (from 25mm to 250mm; NFPA 20 years)
�Step 2: Adjust US Curves to International – COPE (ARM)o Assess differences in Amounts of Insurance, Occupancy, Protection, Construction, etc.o Using various industry exposure databases – US vs. Internationalo Consolidate individual selections to total COPE adjustments
�Step 3: Validate Proxy Curves with Industry Datao Industry large loss information (AXCO Insurance Information Services, FPA-UK, other sources)o Compare actual vs. expected claim counts at various attachment pointso Cross country comparisons – counts and occupancy differences
�Step 4: Use Individual Account Information for Benchmark Refinemento Submissions: individual large claimso Aggregated exposure information
32
3/27/2014
17
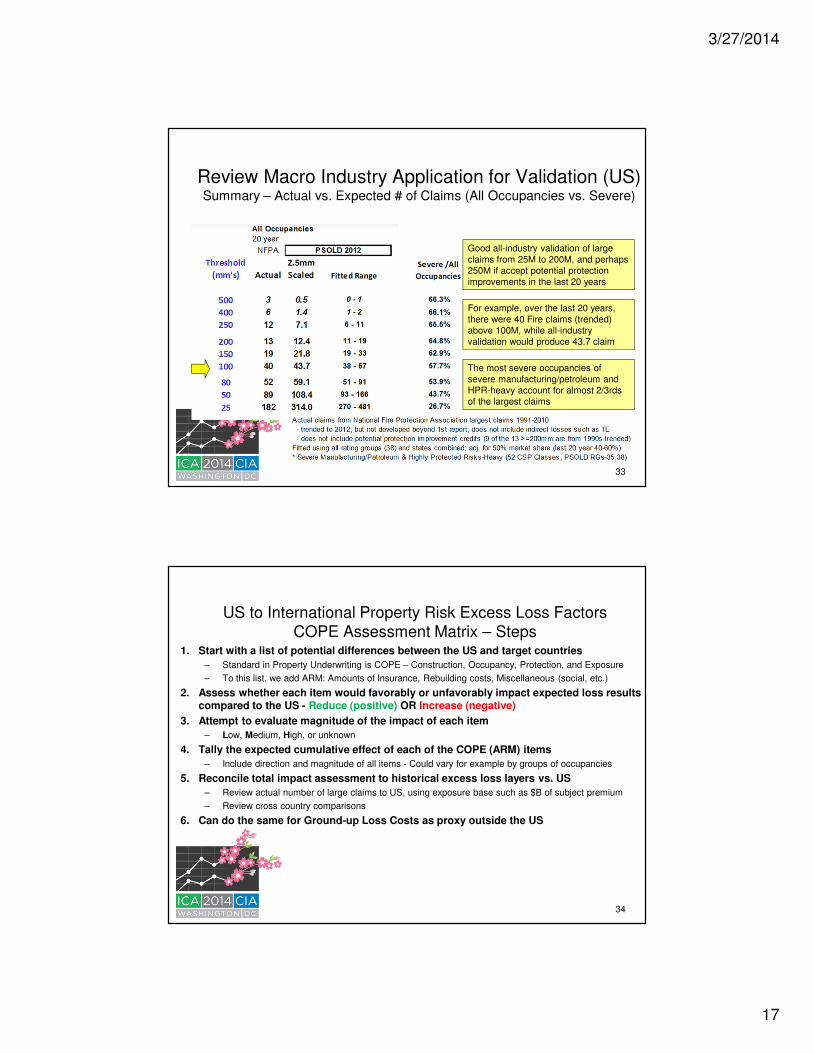
Review Macro Industry Application for Validation (US)Summary – Actual vs. Expected # of Claims (All Occupancies vs. Severe)
Good all-industry validation of large claims from 25M to 200M, and perhaps 250M if accept potential protection improvements in the last 20 years
For example, over the last 20 years, there were 40 Fire claims (trended) above 100M, while all-industry validation would produce 43.7 claim
The most severe occupancies of severe manufacturing/petroleum and HPR-heavy account for almost 2/3rds of the largest claims
33
1. Start with a list of potential differences between the US and target countries
– Standard in Property Underwriting is COPE – Construction, Occupancy, Protection, and Exposure
– To this list, we add ARM: Amounts of Insurance, Rebuilding costs, Miscellaneous (social, etc.)
2. Assess whether each item would favorably or unfavorably impact expected loss results compared to the US - Reduce (positive) OR Increase (negative)
3. Attempt to evaluate magnitude of the impact of each item
– Low, Medium, High, or unknown
4. Tally the expected cumulative effect of each of the COPE (ARM) items
– Include direction and magnitude of all items - Could vary for example by groups of occupancies
5. Reconcile total impact assessment to historical excess loss layers vs. US
– Review actual number of large claims to US, using exposure base such as $B of subject premium
– Review cross country comparisons
6. Can do the same for Ground-up Loss Costs as proxy outside the US
US to International Property Risk Excess Loss Factors COPE Assessment Matrix – Steps
34
3/27/2014
18
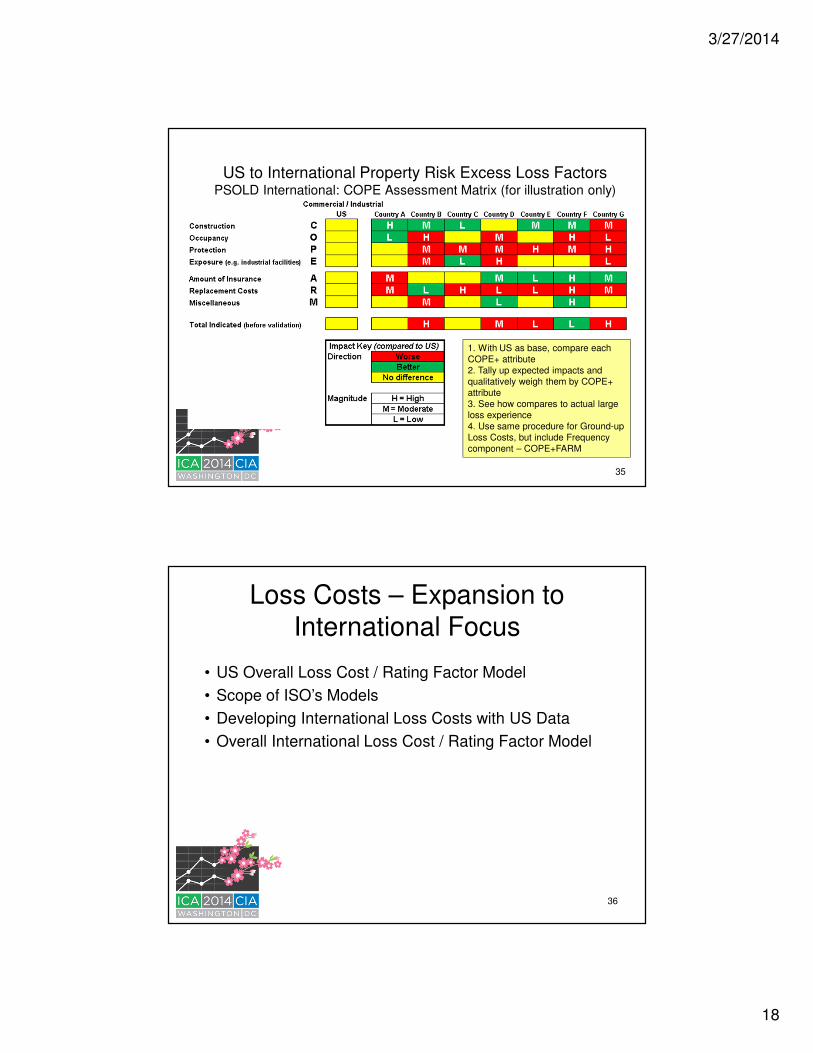
US to International Property Risk Excess Loss Factors PSOLD International: COPE Assessment Matrix (for illustration only)
1. With US as base, compare each COPE+ attribute2. Tally up expected impacts and qualitatively weigh them by COPE+ attribute3. See how compares to actual large loss experience4. Use same procedure for Ground-up Loss Costs, but include Frequency component – COPE+FARM
35
Loss Costs – Expansion to International Focus
• US Overall Loss Cost / Rating Factor Model
• Scope of ISO’s Models
• Developing International Loss Costs with US Data
• Overall International Loss Cost / Rating Factor Model
36

3/27/2014
19
US Overall Loss Costs/Rating Factor Model – Class Rated Risks
37
Base Loss Costs• State• Territory
Relativities• Construction
– 6 Types
• Protection– 10 PPC Grades
• Occupancy– 99 individual Class-
Rated Types
• Rating ID– Class Rated – Non-Sprinklered
• Coverage– Buildings– Contents
Policy-Specific Attributes: Limit of InsuranceDeductibleBlanket Average Rating
US Overall Loss Costs/Rating Factor Model – Specific-Rated Risks
38
Base Loss Costs• State• Territory
Relativities• Construction
– 6 Types
• Protection– 10 PPC Grades
• Occupancy– 50 individual
Specific-Rated Types
• Rating ID– Specific Rated– Sprinklered– Non-Sprinklered
• Coverage– Buildings– Contents
Building-Specific Information
• SCOPES Result• Prometrix Database• Add’l Debits/Credits
Policy-Specific Attributes: Limit of InsuranceDeductibleBlanket Average Rating

3/27/2014
20
Scope of ISO’s Models
• ISO collects credible statistical data at a very detailed level from a broad base of insures in the US
• ISO gathers accurate and high quality building information from field representatives during on-site surveys
• Loss costs and relativities are developed using advanced GLM modeling and sophisticated analytical techniques
• ISO Loss costs are ideal for benchmarking
39
Developing Int’l Loss Costs with US Data
• Starting with ISO’s loss costs and COPE relativities
• Identifying differences in COPE for US vs. Other countries
• Evaluating appropriate territory and protection classifications – protection varies from country to country
• Employing COPE FARM adjustments based on cross country comparisons
• Calibrating and validating with International experience
40

3/27/2014
21
Proposed Overall Loss Costs/Rating Factor Model – International Risks
41
Base Loss Costs• “Country”• Territory
Relativities• Construction
– 6 Types
• Protection– PPC Grades
• Occupancy– 150 individual
Relativities (Class and Specific Underlie)
• Rating ID– Sprinklered – Non-Sprinklered
• Coverage– Buildings– Contents
Policy-Specific Attributes: Limit of InsuranceDeductibleBlanket Average Rating
Calibrating the Model with Data
• ISO would collect international data to make sure the model is accurately reflecting the conditions in that country.
• ISO is able to leverage its rich experience and expertise in data collection and data analysis.
• ISO will protect the privacy of any data. Data provided to ISO will be kept private and confidential and will not be shared with any third parties. ISO has a long history of protecting the confidentiality of data reported to us.
42

3/27/2014
22
Catastrophe Modeling Workflow Can Be Leveraged for Detailed Evaluation of Non-Catastrophe Perils
Import Exposure
Data
Refine and/or
Supplement Data
Determine Catastrophe
Loss
Apply Coverage
Terms
Loss Estimates
for Specified Coverage
Import Exposure
Data
Refine and/or
Supplement Data
Determine Catastrophe
Loss
Apply Coverage
Terms
Loss Estimates
for Specified Coverage
Import Exposure
Data
Evaluate/ Improve
Exposure Data
Determine Non-
catastropheLoss
Apply Coverage
Terms
Loss Estimates for
Specified Coverage
Existing Exposure Data Structure Is Valuable to Both Catastrophe and Non-Catastrophe Analysis
Catastrophe Loss
Analysis
Address
Building Attributes
Coverage Terms
Reinsurance Terms
Non-Catastrophe
Data
e.g. ISO Construction Codes, Sprinkler Indication, Public Protection Class
Non-Catastrophe
Loss Analysis

3/27/2014
23
Combined Loss Results