Embed Size (px)
Citation preview

Commercial Market Analysis Update, Municipality of Clarington
Prepared for:
Municipality of Clarington
January 9, 2012
Photo Credit urbanMetrics

This page intentionally left blank

Clarington Commercial Market Analysis Update
January 9, 2012
Mr. Paul Wirch, Planner II Community Planning and Design Branch The Municipality of Clarington 40 Temperance Street Bowmanville, ON L1C 3A6 Dear Paul:
RE: COMMERCIAL MARKET ANALYSIS UPDATE, MUNICIPALITY OF CLARINGTON
urbanMetrics inc. is pleased to submit our Commercial Market Analysis Update report to the Municipality of Clarington, which provides a summary of our findings as they relate to the supply of and future demand for commercial facilities in Clarington to 2031.
This background report has been prepared as part of Clarington’s broader Official Plan Review which seeks to determine where and how Clarington can accommodate future population growth to 2031 and the associated future demands for commercial floor space, as well as other services and amenities.
The analyses and appendices in the attached report provide our detailed study findings and conclusions. These findings and conclusions represent our best judgement, based on the information that was available to us at the time of our research. Accordingly, the findings, conclusions, projections, and recommendations presented herein should be reviewed and interpreted with reference to evolving circumstances and economic conditions.
Yours truly, urbanMetrics inc.
Douglas R. Annand Lynne L. Davidson Partner Partner

This page intentionally left blank

Clarington Commercial Market Analysis Update
T A B L E O F C O N T E N T S
1 INTRODUCTION ........................................................................................................................ 1
1.1 ISSUES .................................................................................................................................................................. 2 1.2 OUR STUDY APPROACH AND REPORT STRUCTURE ........................................................................ 3 1.3 STUDY AREA ..................................................................................................................................................... 5 1.4 BASIC ASSUMPTONS ...................................................................................................................................... 6
2 WHAT IS THE EXISTING COMMERCIAL POLICY FRAMEWORK? .............................. 7
2.1 SUMMARY ....................................................................................................................................................... 18
3 WHAT IS THE SITUATION TODAY? .................................................................................. 19
3.1 RETAIL AND SERVICE FLOOR SPACE INVENTORY ........................................................................ 19 3.1.1 CLASSIFICATION .......................................................................................................................................... 19 3.1.2 FLOOR SPACE SUMMARY BY LOCATION AND TYPE ................................................................... 21 3.1.3 BOWMANVILLE URBAN AREA .............................................................................................................. 25 3.1.4 COURTICE URBAN AREA .......................................................................................................................... 33 3.1.5 SUMMARY – COURTICE URBAN AREA ............................................................................................... 36 3.1.6 NEWCASTLE URBAN AREA ..................................................................................................................... 37 3.1.7 ORONO URBAN AREA ................................................................................................................................ 39 3.1.8 OTHER CLARINGTON ................................................................................................................................. 41
3.2 SPACE PER CAPITA ...................................................................................................................................... 42 3.3 OFFICIAL PLAN FLOOR SPACE TARGETS AND BUILT/PROPOSED SPACE .......................... 43 3.4 NEIGHBOURING RETAIL COMPETITION (OUTSIDE CLARINGTON) ...................................... 44 3.5 OFFICE FLOOR SPACE ................................................................................................................................ 45 3.6 SUMMARY ....................................................................................................................................................... 50
4 WHAT TRENDS SHOULD WE ANTICIPATE? .................................................................. 53
4.1 POWER CENTRES AND LARGE FORMAT RETAILERS ................................................................... 54 4.2 THE BROADENING OF SHOPPING CENTRE MERCHANDISING ................................................. 55 4.3 NEW DEVELOPMENT FORMATS ........................................................................................................... 55
4.3.1 LIFESTYLE AND HYBRID CENTRES .................................................................................................... 55 4.3.2 NEW URBANISM .......................................................................................................................................... 57 4.3.3 OUTLET CENTRES ....................................................................................................................................... 58
4.4 FOREIGN RETAILERS – THE US INVASION ........................................................................................ 60 4.5 BLURRING OF THE RETAIL HIERARCHY ............................................................................................ 61 4.6 NON-STORE RETAILING ........................................................................................................................... 61 4.7 SUMMARY ....................................................................................................................................................... 62

Clarington Commercial Market Analysis Update
5 WHERE ARE WE HEADED? – MARKET PARAMETERS ............................................... 64
5.1 POPULATION ................................................................................................................................................. 64 5.1.1 PER CAPITA INCOME ................................................................................................................................. 66 5.1.2 PLACE OF WORK/COMMUTING FLOWS ........................................................................................... 66 5.1.3 EMPLOYMENT PROJECTIONS ................................................................................................................ 68 5.1.4 ECONOMIC GROWTH OPPORTUNITIES ............................................................................................ 71 5.1.5 COMMERCIAL LAND SUPPLY ................................................................................................................. 72
5.2 SUMMARY ....................................................................................................................................................... 80
6 WHERE ARE WE HEADED? – RETAIL AND SERVICE FLOOR SPACE NEEDS ANALYSIS.......................................................................................................................................... 81
6.1.1 RETAIL EXPENDITURES ........................................................................................................................... 82 6.1.2 WARRANTED RETAIL FLOOR SPACE ................................................................................................. 84 6.1.3 WARRANTED OTHER RETAIL/SERVICE FLOOR SPACE ............................................................ 94
6.2 SUMMARY - SUPPLY AND DEMAND RECONCILIATION ............................................................... 97
7 WHERE ARE WE HEADED? OFFICE FLOOR SPACE NEEDS .................................... 102
7.1 “MAJOR OFFICE” SPACE NEEDS .......................................................................................................... 103 7.2 OTHER OFFICE SPACE NEEDS ............................................................................................................. 104 7.3 SUMMARY .................................................................................................................................................... 105
8 CONCLUSIONS AND RECOMMENDATIONS .................................................................. 106
8.1 CONCLUSIONS ............................................................................................................................................ 107 8.2 RECOMMENDATIONS ............................................................................................................................. 116
APPENDIX A: DEFINITION OF TERMS AND BACKGROUND DATA ............................. 118
APPENDIX B: SUPPLY AND DEMAND – 2031 – BY STORE TYPE AND LOCATION 125

Clarington Commercial Market Analysis Update
LIST OF FIGURES (EXCLUDING APPENDICES) Figure 2-1: OFFICIAL PLAN THRESHOLDS – TOWN AND VILLAGE CENTRES ...................................... 8Figure 2-2: URBAN AREAS ............................................................................................................................................ 9Figure 2-4: BOWMANVILLE EAST TOWN CENTRE – EAST DISTRICT ................................................... 10Figure 2-3: BOWMANVILLE EAST TOWN CENTRE SECONDARY PLAN – DOWNTOWN ............... 10Figure 2-5: BOWMANVILLE WEST TOWN CENTRE SECONDARY PLAN .............................................. 12Figure 2-6: NEWCASTLE VILLAGE CENTRE SECONDARY PLAN ............................................................. 13Figure 2-7: COURTICE TOWN CENTRE ................................................................................................................ 14Figure 2-8: COURTICE WEST SHOPPING DISTRICT SECONDARY PLAN .............................................. 15Figure 2-9: BROOKHILL NEIGHBOURHOOD SECONDARY PLAN .............................................................. 16Figure 2-10: PORT DARLINGTON NEIGHBOURHOOD SECONDARY PLAN ........................................... 17Figure 3-1: CLARINGTON INVENTORY BY AREA, 2003 and 2011 (Square metres) ........................ 23Figure 3-2: SUMMARY – SERVICE LEVELS BY AREA AND MAJOR STORE TYPE .............................. 24Figure 3-3: TOTAL RETAIL AND SERVICE FLOOR SPACE BY AREA (SQUARE METRES), 2003 and 2011 ........................................................................................................................................................................... 25Figure 3-4: DOWNTOWN BOWMANVILLE VACANCY RATE AND BUSINESSES – 2003 and 2011
............................................................................................................................................................................................... 27Figure 3-5: EAST DISTRICT VACANCY RATE AND BUSINESSES – 2003 and 2011 ........................... 27Figure 3-6: BOWMANVILLE EAST AND WEST TOWN CENTRES (B-1 to B-7) .................................... 29Figure 3-7 BOWMANVILLE WEST TOWN CENTRE - VACANCY RATE AND BUSINESSES – 2003 and 2011 ........................................................................................................................................................................... 31Figure 3-8: BOWMANVILLE NEIGHBOURHOOD CENTRES - VACANCY RATE AND BUSINESSES – 2003 and 2011 ................................................................................................................................................................ 31Figure 3-9: BOWMANVILLE NEIGHBOURHOOD CENTRES (B-8) ............................................................ 32Figure 3-10: BOWMANVILLE URBAN AREA, FLOOR SPACE SUMMARY, 2003 AND 2011 ............ 33Figure 3-11: COURTICE WEST - VACANCY RATE AND BUSINESSES – 2003 and 2011 ................... 34Figure 3-12: COURTICE NEIGHBOURHOOD CENTRES - VACANCY RATE AND BUSINESSES – 2003 and 2011 ................................................................................................................................................................ 35Figure 3-13: COURTICE RETAIL NODES (C-1 to C-4) .................................................................................... 36Figure 3-14: COURTICE URBAN AREA, FLOOR SPACE SUMMARY, 2003 AND 2011 ....................... 36Figure 3-15: NEWCASTLE VILLAGE CENTRE (N-1) ........................................................................................ 37Figure 3-16: NEWCASTLE VILLAGE - VACANCY RATE AND BUSINESSES – 2003 and 2011 ........ 38Figure 3-17: NEWCASTLE URBAN AREA, FLOOR SPACE SUMMARY, 2003 and 2011 .................... 38Figure 3-18: ORONO URBAN AREA ........................................................................................................................ 39Figure 3-19: ORONO - VACANCY RATE AND BUSINESSES – 2003 and 2011 ...................................... 40Figure 3-20: ORONO URBAN AREA, FLOOR SPACE SUMMARY, 2003 and 2011 ............................... 41Figure 3-21: FLOOR SPACE PER CAPITA ............................................................................................................ 42Figure 3-22: OFFICIAL PLAN TARGETS AND BUILT SPACE/PROPOSED COMPARISON ............... 44Figure 3-23: OFFICE FLOOR SPACE IN CLARINGTON, 2011 ...................................................................... 49Figure 3-24: TOTAL BUILT RETAIL AND SERVICE SPACE - SERVICES LEVELS – 2003 and 2011
............................................................................................................................................................................................... 50Figure 3-25: SERVICE LEVELS BY STORE TYPE AND LOCATIOn, 2003 and 2011 ............................ 51

Clarington Commercial Market Analysis Update
Figure 4-1: SHOPPING CENTRE HIERARCHY ................................................................................................... 61Figure 4-2: THE MOVE TOWARDS INTEGRATED COMPLETE COMMUNITIES .................................. 63Figure 5-1: CLARINGTON POPULATION - HEMSON FORECASTS ............................................................ 65Figure 5-2: DISTRIBUTION OF POPULATION BY AREA ................................................................................ 65Figure 5-3: DURHAM REGION SHORT TERM POPULATION ESTIMATES ............................................. 66Figure 5-4: PLACE OF WORK – CLARINGTON RESIDENTS ......................................................................... 67Figure 5-5: PLACE OF RESIDENCE – CLARINGTON EMPLOYEES ............................................................ 68Figure 5-6: CLARINGTON EMPLOYMENT GROWTH FORECAST, 2006 to 2031 ................................ 69Figure 5-7: EMPLOYMENT FORECASTS BY COMMUNITY, 2006 and 2031 ......................................... 69Figure 5-8: EMPLOYMENT BY NAICS CATEGORY – 2001 AND 2006 (BASED ON CENSUS) ........ 70Figure 5-9: HEMSON CONSULTING – EMPLOYMENT FORECAST BY TYPE ......................................... 71Figure 5-10: VACANT COMMERCIAL LAND WITH NO APPLICATIONS .................................................. 76Figure 5-11: OTHER VACANT COMMERCIAL SITES – NO APPLICATION ............................................. 78FIGURE 5-12: PROPOSED/UNDER CONSTRUCTION AND VACANT LAND ASSUMPTIONS – ESTIMATED DISTRIBUTION BY STORE TYPE ................................................................................................... 79Figure 5-13: CLARINGTON POPULATION BASED ON HEMSON CONSULTING FORECAST ........... 80Figure 6-1: MARKET ANALYSIS METHODOLOGY/APPROACH .................................................................. 81Figure 6-2: FOOD STORE RETAIL EXPENDITURE POTENTIAL ................................................................ 83Figure 6-3: NON-FOOD STORE RETAIL EXPENDITURE POTENTIAL ...................................................... 84Figure 6-4: WARRANTED FSR FLOOR SPACE IN CLARINGTON ............................................................... 87Figure 6-5: WARRANTED GAFO FLOOR SPACE IN CLARINGTON ........................................................... 89Figure 6-6: WARRANTED PHARMACIES AND PERSONAL CARE STORE FLOOR SPACE ................ 91Figure 6-7: WARRANTED BOHS FLOOR SPACE IN CLARINGTON .......................................................... 93Figure 6-8: FLOOR SPACE PER CAPITA ANALYSIS – OTHER RETAIL/SERVICES ............................. 96Figure 6-9: RETAIL AND SERVICE SPACE NEEDS, 2031 ............................................................................... 97Figure 6-10: FUTURE SUPPLY (SQUARE METRES) : WARRANTED FLOOR SPACE AND ADDITIONAL LAND AREA REQUIREMENTS ...................................................................................................... 98Figure 6-11: FUTURE SUPPLY OF COMMERCIAL SPACE ............................................................................. 99Figure 6-12: SURPLUS/SHORTFALL OF SPACE AND LAND NEED ....................................................... 100Figure 7-1: “MAJOR OFFICE” FLOOR SPACE DEMAND ANALYSIS ........................................................ 103Figure 7-2: POPULATION RELATED OFFICE SPACE – ESTIMATED FUTURE NEED BY AREA . 104Figure 8-1: CLARINGTON - EXISTING SERVICE LEVELS ........................................................................... 109Figure 8-2: POPULATION DISTRIBUTION – 2011 to 2031 ...................................................................... 110Figure 8-3: WARRANTED ADDITIONAL FLOOR SPACE BY TYPE ......................................................... 111Figure 8-4: ALLOCATION OF WARRANTED ADDITIONAL FLOOR SPACE BY AREA ..................... 112Figure 8-5: VACANT SUPPLY ................................................................................................................................ 113Figure 8-6: SURPLUS/SHORTFALL .................................................................................................................... 114Figure 8-7: ADDITIONAL LAND AREA REQUIRED ...................................................................................... 115Figure 8-8: SERVICE LEVELS – EXISTING AND FUTURE .......................................................................... 116

Clarington Commercial Market Analysis Update
1
1 INTRODUCTION
urbanMetrics inc has been retained by the Municipality of Clarington (“Clarington”) to conduct a Commercial Market Analysis Update. This Commercial Market Analysis Update evaluates the appropriateness of the existing retail and service floor space thresholds in the Clarington Official Plan and assesses whether there is sufficient commercial land designated in each of the Urban Areas to accommodate demand until 2031. Our study is intended as background to Clarington’s comprehensive Official Plan review which is currently underway. The current Official Plan Review seeks to determine where and how Clarington can accommodate future population growth to 2031 and the associated future demands for commercial floor space, as well as other services and amenities.
The Commercial Policy Review (2005) concluded that between population growth, market recapture and changes in retailing over the last decade, there was opportunity for significant additional commercial growth in Clarington. As a result, the Commercial Policy Review (2005) amendment to the Official Plan provided approvals for a number of major developments in Bowmanville (e.g. the SmartCentres project in the Bowmanville West Town Centre, and the Torgan Group Bowmanville Creek project at Baseline Road and Spry Avenue. The policy approach in the current Official Plan combines a range of choice with the protection of the historic downtowns in Bowmanville, Newcastle and Orono.
With continued population and economic growth expected in Clarington, as well as other changing market forces, it will be important that the municipality continues to maintain commercial policy directives that remain relevant, not only for the consumer, but also the development industry and the municipality itself as it relates to the planning for the Urban Areas of Bowmanville, Courtice, Newcastle and Orono.
Although the planning process has the ability to influence commercial activity in terms of location and distribution of floor space, for the Official Plan policies to be appropriate, they must be based on an understanding of the diverse needs for goods and services of all types and the dynamic market forces that govern commercial activity. Under the Ontario planning process, which is governed by the Planning Act and Provincial Policy Statement (2005), the fundamental intent in the planning of commercial land uses is to guide commercial development through appropriate policies in Official Plans in accordance with the public interest. While a municipality cannot intervene in the market place in ways that may restrict economic activity or regulate or interfere with normal business competition, it has the ability to protect the public interest and “planned function” of important commercial areas. Of important is the need to ensure that commercial policies allow for the provision of an appropriate range and mix of commercial facilities to best meet the needs of the public, while at the same time ensuring that the “vitality and viability of the downtowns and main streets” (Provincial Policy Statement (2005)) is maintained, where possible.
Photo Credit urbanMetrics

Clarington Commercial Market Analysis Update
2
Our update has been informed by the previous work undertaken by urbanMetrics inc. for the 2005 Commercial Policy Review, along with two subsequent updates relating to specific applications in April 2008 and June 2010. The Hemson Consulting Ltd. (“Hemson”), Clarington Community Forecast, Population and Employment Projections (March 2010); Hemson Clarington Development Charges Background Study (June 2010); EDP Consulting, Economic Base and Employment Lands Discussion Paper (July 2, 2010); and Hemson’s draft Commercial Land Needs brief have been considered in our study.
1.1 ISSUES
To ensure that the existing commercial policies continue to meet the needs of the community and the changing commercial environment, Clarington requires a Commercial Policy Review Update as input into its Official Plan Review. This study is intended to provide background support to the municipality to ensure that appropriate policy approaches, structures and controls are included in any future updates to the Official Plan.
Specially, the following issues have been addressed:
1. How close has development in Clarington come to achieving the projections/ expectations established in the original 2005 Commercial Policy Review?
What is the commercial situation today?
2. Are there any gaps today in market demand for retail, service and/or office floor space and the
current supply of commercial land – Broadly, for Clarington as a whole, as well as specifically for each major urban/trade area (Courtice, Bowmanville and Newcastle)?
3. What are the shifts or changes that are taking place in commercial development today that will impact how we will need to plan for commercial development in the near, mid and long term?
What trends should we anticipate?
4. Supply versus Future Demand – For Clarington as a whole, and specifically for each urban area (Courtice, Bowmanville and Newcastle), based on the available supply and forecast of market demand for retail, service and population related office floor space, what will the land needs be in the future (i.e. in 5 year increments to 2031)?
Where are we headed?
5. For Orono, based on the inventory of retail and service floor space in this community, is there
any opportunity for a limited expansion of floor space?

Clarington Commercial Market Analysis Update
3
1.2 OUR STUDY APPROACH AND REPORT STRUCTURE
In addition to reviewing all relevant policy documents, background studies and material provided by the municipality (including the Hemson reports, and any information relating to new commercial development applications and commercial developments which have occurred since 2003), the following outlines the various work steps we have undertaken in order to evaluate future commercial land needs and address Clarington’s issues.
•
An overview has been provided of the existing commercial land use designations and commercial framework that exist in the current Official Plan.
Chapter 2 – What is the existing Commercial Policy Framework?
•
A full inventory of all retail and selected service commercial floor space has been undertaken in Clarington. We have also identified any office buildings in the municipality. For retail and selected service commercial floor space, a comparison has been made to our 2003 inventory to identify changes that have occurred. Recognizing that Statistics Canada is now utilizing the North American Industry Classification System (NAICS), our classification of floor space has been based on this system. For each retail and service commercial unit we have identified the business name, commercial type (by NAICS code), street address, planning area and size. Our previous inventory utilized the Standard Industrial Classification (SIC) and therefore has been re-coded to correspond to the NAICS. The current inventory allows us to determine what the current commercial situation is today, including a determination of how close development has come to achieving the expectations in the 2005 Commercial Policy Review.
Chapter 3 - What is the commercial situation today?
A brief competitive review of major nodes outside Clarington (i.e. in Oshawa) has also been included as these areas influence the expenditure patterns of Clarington residents and opportunities for inflow sales from non-Clarington residents. Major developments in Oshawa have also been identified based on information from the City of Oshawa.
•
An overview has been provided of the global changes occurring in commercial development in recent years, including emerging retail formats, retail spending patterns, retailer location strategies and other retail development trends. This review will provide a framework for understanding how well Clarington’s planning policies relate to current trends, and how they may be modified to better reflect the anticipated future environment.
Chapter 4: What trends should we anticipate?
•
In order to estimate future commercial floor space needs, it is necessary to have an understanding of various market parameters and conditions. The following information has been obtained and reviewed:
Chapter 5: Where are we headed? – Market Parameters
o Population and the geographical distribution of the population growth o Per Capita Income levels based on the 2006 Census o Place of Work/Commuting flows

Clarington Commercial Market Analysis Update
4
o Employment projections for Clarington/Urban Areas o Economic growth opportunities o Future supply, including proposed floor space and vacant Commercial Land Supply
•
The future market demand for new retail and service floor space has been estimated to the year 2031 in 5 year intervals, recognizing market trends and conditions.
Chapter 6: Where are we headed? – Retail and Service Floor space Needs
a) Food and Non-Food Store Retail Floor space Needs
Utilizing Statistics Canada Retail Trade data and average per capita income for Clarington (including income levels by urban area), we have calculated the per capita retail expenditures defined using the NAICS (North American Industry Classification System). Expenditures have been estimated for the following major store types:
o Food store retail (FSR) including: supermarkets, grocery stores, convenience food stores and other specialty food stores; and
o Non-food store Retail, including GAFO floor space (general merchandise, apparel, home furnishings, other specialty stores selling department store type merchandise), pharmacies/health care stores, and building/outdoor home supply stores.
A residual market analysis has been undertaken in order to estimate the market opportunity for additional floor space by store type.
This methodology involves the following steps:
• The existing Clarington share of Clarington resident’s expenditures for each store category has been estimated utilizing previous market research conducted in this market by urbanMetrics and other consultants, and recognizing the existing inventory of floor space.
• Future Clarington shares have been forecast over the study period, based on an estimate of the opportunity for recapture of expenditures currently leaving the municipality and our knowledge of retail developments (existing and proposed) located outside of Clarington.
• The residual potential available from Clarington residents or the net additional expenditure growth in the future has been calculated.
• Based on the results of available licence plate and intercept survey data conducted in Clarington in the past by urbanMetrics and other consultants, inflow sales volume from persons whose permanent residence is outside Clarington has been estimated, which would include sales from pass-by traffic and other non-residents (including those who may work in Clarington but reside elsewhere).

Clarington Commercial Market Analysis Update
5
• The warranted floor space in each category has been calculated based on expected average sales performance levels applied to the total sales volume available.
b) Other Retail/Service Floor space Needs
For some categories, expenditure data is either not readily available or not appropriate. As a result, per capita floor space ratios are typically used to determine future floor space requirements. These categories would include personal services, food services, financial services, local/population serving office uses, liquor/beer/wine outlets, medical/dental, consumer services rental, personal & household goods repair & maintenance, and entertainment. The existing service level would be utilized as a guide. The methodology will be similar to that discussed above in (a), except that demand will be based on floor space per capita levels rather than expenditures.
•
Future office floor space needs will be evaluated based on the Hemson employment projections for Clarington, population forecasts and our review of economic trends in the region. Office floor space can occur in many areas, including downtowns, retail strips, shopping centres, industrial areas, residential neighbourhoods and office clusters. Our analysis is intended to review the “major office” floor space forecasts for Clarington provided in the Hemson Clarington Development Charges Background report and provide estimates of the market need for additional office space, including “major” and other population serving office space in general. Currently, there are no office buildings on lands designated “office commercial” in Clarington.
Chapter 7: Where are we headed? – Office Floor space Needs – Employment and Population Based
• Chapter 8: Conclusions/Recommendations
Land Needs - Based on the available supply and our forecasts of future demand, we have estimated how much additional land will be required to accommodate future commercial needs by Urban Area, including Bowmanville, Courtice, Newcastle and Orono. Our estimates for land need are derived from our floor space needs calculations by factoring in typical parking and landscaping requirements.
Evaluation of Existing Commercial Policies - Based on a review of relevant background
material and our market analysis, we have assessed the appropriateness of the current Clarington Commercial Policies, including floor space targets or thresholds, by evaluating the ability of the existing commercial planning framework to meet future commercial land use needs.
Recommendations - We will provide general recommendations with respect to modifications, if any, that should be made to the existing commercial planning framework from a market perspective in order to better meet future commercial land use needs.
1.3 STUDY AREA
The study area utilized for this report is the Municipality of Clarington. This is the geographic area from which the majority of support for existing and future retail commercial facilities in Clarington will likely originate on a consistent basis. The remaining portion of trade or “inflow” will be derived

Clarington Commercial Market Analysis Update
6
from visitors, residents of the neighbouring municipalities, the travelling public and employees working in Clarington who reside outside the municipality. The study area is not intended to reflect a market or trade area for specific retail nodes in Clarington. These trade areas can vary based on many factors, including: size, competition, spatial distribution, accessibility, and market orientation. The Clarington study area has been employed to evaluate the need for additional commercial facilities in the municipality as a whole and therefore represents the focus of our analysis of supply and demand.
1.4 BASIC ASSUMPTONS
In any analysis requiring estimates of future conditions, it is necessary to make certain basic assumptions, as follows:
• Over the forecast period, to the year 2031, a reasonable degree of economic growth and stability will prevail in Canada, Ontario and specifically in Durham Region. It is expected that over this period cyclical downturn and upturn will occur.
• The population forecasts, which are based on information provided by the Municipality of Clarington (as calculated by), are assumed reasonable and will not vary significantly from actual counts in the future.
• The various sources employed in our analysis to calculate retail expenditures, base year Clarington shares or capture rates, and sales per square metre/foot performance levels for the various retail store types analyzed are considered sufficiently reliable.
• Commercial uses examined in this report include office commercial and retail/service commercial. For the purposes of our market analysis, certain commercial uses have not been evaluated, including automotive sales, car rental firms, service stations, and hotel/motel accommodation uses.
• All dollar references are in 2011 dollars, which exclude inflation, unless noted otherwise.
Our research and analysis has been conducted in accordance with the terms of reference for this assignment and our authorized scope of work. The findings and recommendations presented in this report represent our best judgment based upon the information available to us as of the date of our research. Although every effort has been taken to ensure the accuracy, completeness and reliability of the information provided in this report, urbanMetrics assumes no responsibility. We also assume no responsibility for the consequences of use of information in this report. The findings and recommendations presented herein should be reviewed and interpreted with reference to evolving circumstances and economic conditions.
The user of information in this report agrees that information is subject to change. If, for any reason, there are significant deviations from any of these assumptions, the report and its conclusions should be reviewed or re-examined.

Clarington Commercial Market Analysis Update
7
2 WHAT IS THE EXISTING COMMERCIAL POLICY FRAMEWORK?
Commercial activities can generally be defined as those private sector activities that provide retail goods and services to consumers. The location, quality, variety and amount of commercial floor space provided in a community can impact the overall quality of life. In general, it is the size and characteristics of a market that determine the amount and type of commercial facilities that should be provided in a community.
The current Municipality of Clarington Official Plan (“COP”) presents a structural framework for future growth and development in Clarington to 2016, which includes providing for commercial activity and phasing major retail development based on population growth to protect the downtowns. As defined in Chapter 10 of the COP, (Town, Village and Neighbourhood Centres and Commercial Uses), the goals and objectives for the commercial designations provided for in the COP are as follows:
There are six commercial locations in the COP that permit retail and service commercial uses:
Town Centre (i.e. Bowmanville East and West, Courtice),
Village Centre (i.e. Newcastle and Orono),

Clarington Commercial Market Analysis Update
8
Neighbourhood Centres,
Highway Commercial Districts,
the Courtice West Shopping District,
the Port of Newcastle Harbourfront Centre, and
Service Stations.
In addition, limited commercial facilities are permitted on lands designated Residential (corner stores) and within Employment Areas, Rural Settlement Areas (i.e. Hamlets) and Tourism Nodes. The implementing Zoning By-Laws 84-63 and 2005-109 further refine the Official Plan designations, including permitted uses.
Section 10.4.3 (Table 10-1) of the COP sets out targets or floor space thresholds for Town and Village Centres, as indicated in Figure 2-1. The Town and Villages Centres are located in the four Urban Areas (see Figure 2-2).
FIGURE 2-1: OFFICIAL PLAN THRESHOLDS – TOWN AND VILLAGE CENTRES

Clarington Commercial Market Analysis Update
9
FIGURE 2-2: URBAN AREAS
Source: urbanMetrics inc.
The Secondary Plans, available for the Bowmanville East and West Town Centres and the Newcastle Village Centre, further refine the retail and service floor space targets for the areas indicated in Figure 2-1:
• Bowmanville East Town Centre (“BETC”) (see Figures 2-3 and 2-4)- The BETC is comprised of lands on both sides of King Street between the Bowmanville and Soper Creek valleys. It has two distinct sub-areas: the historic Downtown (see Figure 2-3) and the East Business District (includes Bowmanville Mall) (Figure 2-4). Section 4.2 of the BETC Secondary Plan provides for approximately 80,000 square metres of retail and service floorspace, generally as follows:
a) Downtown 35,000 square metres (376,737 square feet), and b) East Business District 45,000 square metres (484,376 square feet).
Within the BETC, commercial floor space is accommodated on lands designated Street-Related Commercial, General Commercial and Mixed-Use.

Clarington Commercial Market Analysis Update
10
FIGURE 2-4: BOWMANVILLE EAST TOWN CENTRE – EAST DISTRICT
FIGURE 2-3: BOWMANVILLE EAST TOWN CENTRE SECONDARY PLAN – DOWNTOWN

Clarington Commercial Market Analysis Update
11
• Bowmanville West Town Centre (“BWTC”) (see Figure 2-5) - The BWTC comprises approximately 74 hectares of land on the north and south sides of Durham Highway 2/King Street, generally between the CP Rail overpass and the west limit of the Bowmanville Urban Boundary. A significant amount of new retail and service floor space has been added in recent years to this area (e.g. Walmart, Home Depot, Canadian Tire, Winners). This area also includes the Garnet B. Rickard Recreation Complex, a firehall, Clarington Central Secondary School, and two churches (Liberty Penecostal Church and Church of Jesus Christ of the Latter Day Saints). There are opportunities for office commercial and additional retail and service floor space in the Bowmanville West Town Centre. Section 4.3 b) of the BWTC Secondary Plan indicates a threshold for retail floor space of 73,000 square metres (785,765 square feet) and service floor space of 7,000 square metres (75,347 square feet) for a total of 80,000 square metres (861,112 square feet). These floor space thresholds apply until such time as the Clarington population reaches 91,000 persons. In the Official Plan (Table 10-1), the total maximum threshold is 100,000 square metres.
Retail floor space is defined in the BWTC Secondary Plan as including department stores and stores selling department store type merchandise, supermarkets, specialty food stores, beer/liquor/wine stores, automotive products and home improvement stores. Service floor space is also defined in the Secondary Plan (as it applies to Section 4.3 b)) and includes restaurants, personal service shops, rental stores, and financial institutions. Not included
The total floor space in the BWTC is further allocated in Section 4.3 c) by location as follows (totaling 83,100 square metres). These space thresholds include retail and service uses as defined above and all other commercial uses:
in the floor space thresholds in Section 4.3b) for the BWTC are medical/dental offices, business and professional offices, government offices, places of entertainment, private clubs, community facilities, gas stations and any other service uses not listed above.
i. 18,600 square metres – Clarington Boulevard, Prince William Boulevard, Green Road and Highway 2 (includes Clarington Centre, anchored by Loblaws and Zellers);
ii. 8,000 square metres - for the lands bounded by Clarington Boulevard, Prince William Boulevard, Pethick Street and Highway 2 (currently occupied by vacant Canadian Tire)
iii. 4,000 square metres for the lands east of Clarington Boulevard, north of Highway 2 iv. 18,000 square metres - for the lands bounded by Clarington Boulevard, the Stevens
Road extension, Green Road and Highway 2 (including Home Depot) v. 34,500 square metres - for the lands north of Highway 2 between Green Road and
Boswell Drive extension (includes SmartCentre development anchored by Walmart, Canadian Tire and Winners)
As indicated in Figure 2-5, commercial designations in the BWTC include General Commercial and Street-Related Commercial. There is also an Office Commercial designation in the BWTC for lands located in the vicinity of Highway 2 and Regional Road 57 (currently vacant lands). A future GO Station is also planned in the area. Accessory retail and service uses are permitted in the Office Commercial and future GO Station lands, which are not included in the space thresholds noted above.

Clarington Commercial Market Analysis Update
12
FIGURE 2-5: BOWMANVILLE WEST TOWN CENTRE SECONDARY PLAN
Clar
ingt
on C
entr
e(1
45,0
00 sq
.ft.)
Vaca
nt C
anad
ian
Tire
Scho
ol
Curr
ent M
axim
um P
erm
issi
ons
for R
etai
l and
Ser
vice
Spa
ce:
i.
18,6
00 s
quar
e m
etre
s (2
00,2
08 s
q.ft
.)ii.
8
,000
squ
are
met
res
(86,
111
sq.ft
.)
Iii
4,0
00 s
quar
e m
etre
s (4
3,05
6 sq
.ft.)
iii.
18,0
00 s
quar
e m
etre
s (1
93,7
50 s
q.ft
)iv
. 34
,500
squ
are
met
res
(371
,354
sq.
ft.)
–no
mor
e th
an 3
0,50
0 sq
uare
m
etre
s (3
28,2
30 s
q.ft
.) is
per
mitt
ed in
the
Gen
eral
Com
mer
cial
Are
a
iii
iv
v
iii

Clarington Commercial Market Analysis Update
13
• Newcastle Village Centre - This area comprises the established historic downtown and development along King Avenue beginning at North Street and extending to just past Arthur Street to the east) (see Figure 2-6). Section 4.2 of the Newcastle Village Centre Secondary Plan provides for 15,000 square metres (161,458 square feet) of retail and service floor space on lands designated Street- Related Commercial, General Commercial Area and Mixed-Use Area. The maximum threshold provided in the Official Plan is for 20,000 square metres. Some new development has occurred in recent years in the Village Centre (e.g. new Shoppers Drug Mart).
• Courtice Town Centre – This area is located on the south-east corner of Trulls Road and Durham Highway 2/King Street in Courtice (see Figure 2-7). A Secondary Plan has not yet been completed for this Town Centre, although as part of the Official Plan Review, the Courtice Main Street Study has been initiated. Section 17.2.2 of the current Official Plan indicates that the 6.4 hectare parcel of land at the south-east corner of King Street and Trulls Road may be permitted to develop with up to a maximum of 13,900 square metres (149,618 square feet) of gross leasable floor space for retail uses prior to the completion and approval of a secondary plan. Any development would be subject to certain urban design and development criteria, including the completion of an urban design study). This site currently remains undeveloped for retail commercial uses (except for a
FIGURE 2-6: NEWCASTLE VILLAGE CENTRE SECONDARY PLAN

Clarington Commercial Market Analysis Update
14
small mixed use centre on Trulls Road which has four commercial units totaling approximately 4,000 square feet).
FIGURE 2-7: COURTICE TOWN CENTRE
Source: urbanMetrics inc. based on Map Durham
In addition to the Secondary Plans for the various Town and Village Centres listed in Figure 2-2, there are also other Secondary Plans which provide for retail and service floor space. These include the following:
CourticeTown Centre

Clarington Commercial Market Analysis Update
15
• The Courtice West Shopping District (Figure 2-8)- Section 4.2 of the Secondary Plan provides for approximately 30,000 square metres (322,830 square feet) of gross leasable floor space for the retailing of goods and services. This shopping district is an established retail corridor, with infill development potential, extending eastward along Highway 2 from Townline Road (see Figure 7). Retail and service commercial uses are permitted on lands designated General Commercial Area, Mixed-Use Area, and Office Commercial Area 1
FIGURE 2-8: COURTICE WEST SHOPPING DISTRICT SECONDARY PLAN
(within Office Commercial Areas, retail and service uses are limited to the ground floor only to a maximum of 20% of the total gross leasable floor area of the entire building).
1 Designated “Office Commercial” lands are currently utilized for a gas station and animal hospital.

Clarington Commercial Market Analysis Update
16
• Brookhill Neighbourhood (see Figure 2-9) - Located to the north of the Bowmanville West Town Centre, the Brookhill Neighbourhood is intended to be developed with the principles of new urbanism. Retail and service commercial uses are provided for in the community in the Village Corridor designation. The Village Corridor, as the primary focal point of the community, is intended to be comprised of a mix of uses including higher density residential development, schools and an array of live/work, retail, office and community facilities. Section 6.4.4 of the Secondary Plan indicates that the retail and service commercial development in the Village Corridor will only be permitted on the ground floor of a mixed use building, with individual retail and service commercial uses generally limited in size to a maximum of approximately 500 square metres (5,380 square feet) each. The total retail and service commercial floor space allocated to the Village Corridor has not been specified in the Secondary Plan.
FIGURE 2-9: BROOKHILL NEIGHBOURHOOD SECONDARY PLAN

Clarington Commercial Market Analysis Update
17
• Port Darlington Neighbourhood (Figure 2-10) - This neighbourhood comprises all lands south of the Canadian National Railway mainline and generally includes all lands from Bennett Road to the West Beach Road. Retail and service commercial uses are provided for in the designated Village Commercial Area. In this area, Section 7.2 of the Secondary Plan indicates that the maximum amount of gross leasable area for retail and personal services uses is 1,500 square metres (16,145 square feet). Certain commercial uses, such as restaurants, are also permitted in the Marine Commercial designation.
FIGURE 2-10: PORT DARLINGTON NEIGHBOURHOOD SECONDARY PLAN
Within three of the Urban Areas, there are also Neighbourhood Centres designated in the Official Plan, which are intended to provide for day-to-day needs of a residential community. These include:
• Bowmanville - Seven Neighbourhood Centres are designated, of which 4 have been developed and one is under construction, .
• Courtice - Seven Neighbourhood Centres designated in Courtice, six of which have been developed. • Orono - One Neighbourhood Centre is designated, which currently includes Foodland and LCBO.
The Official Plan caps these Neighbourhood Centres at 5,000 square metres (53,820 square feet) each with a maximum floor space index of 0.30 for retail uses (0.50 combined floor space index where there is a second storey office or residential uses). Other than a grocery store or supermarket, the Official Plan specifies that no individual store in a Neighbourhood Centre can be greater than 500 square metres (5,380 square feet).

Clarington Commercial Market Analysis Update
18
As defined in the Clarington Official Plan,
• Retail Floor Space is ground floor commercial floor space designed primarily for occupancy by retail uses but may be suitable for office or community uses.
• Retail Uses are defined as uses where goods or merchandise are sold such as, food, general merchandise, apparel, hardware, home furnishings, specialty retail, beer, liquor and wine, automotive products, and home improvement products, including department stores and supermarkets.
• Service Uses, except where defined in the Secondary Plans, include such uses as restaurants, hair salons, dry cleaners, shoe repair, video rental stores, tailors, laundromats, travel agencies, photographers, veterinary clinics, fitness and health clubs, medical and dental offices, legal and real estate offices, financial and insurance offices, bank kiosks, appliance repair shops, and personnel agencies.
2.1 SUMMARY
The existing policy framework in the current Clarington Official Plan provides for a range of commercial land use designations that are intended to provide a “full range of choice” in goods and services for Clarington residents, while protecting the planned function of its downtowns. A significant amount of new commercial space has been developed in recent years in Clarington, with additional space under construction or proposed on designation sites.
The following sections of the report are intended to determine:
• the type and amount of retail and service space existing in Clarington, and particularly in relation to existing floor space thresholds/targets in the Official Plan/Secondary Plans;
• whether the current policy framework provides for enough commercial lands to accommodate the future needs of the population within each urban/settlement/rural area of Clarington and to provide for a “full range of choice” in goods and services for Clarington residents; and
• whether the existing floor space thresholds or targets in the current Official Plan are appropriate.

Clarington Commercial Market Analysis Update
19
3 WHAT IS THE SITUATION TODAY?
An analysis of the amount of commercial floor space existing in a market is essential to understanding the roles and functions that existing Clarington stores and services currently fulfill for local residents, as well as visitors to Clarington. Of importance is also an understanding of existing competitive influences outside of Clarington which influence spending patterns and the ability of Clarington to provide residents with a “full range of choice” within the community. Based on the amount of vacant commercial floor space available in Clarington, the relative health of the commercial sector can also be determined. A retail and service commercial vacancy level in the range of 5% to 8% is typically considered normal for an efficient market.
The supply side of our market analysis has been derived by undertaking an inventory of retail and service commercial floor space in Clarington, completed in December 2011. Vacant commercial floor space has also been inventoried. Our 2011 inventory of commercial floor space has also been compared to the 2003 inventory2
3.1 RETAIL AND SERVICE FLOOR SPACE INVENTORY
to identify changes that have occurred. We have also summarized the existing “major” office floor space (i.e. in buildings 1,858 m2 (20,000 square feet or more) and other office space located in Clarington.
3.1.1 CLASSIFICATION
Recognizing that Statistics Canada is now utilizing the North American Industry Classification System (NAICS), our classification of floor space has been based on this system. Our inventory has been classified into the following store types which correspond to the NAICS:
• Supermarkets/Grocery Stores
Food Store Retail (FSR):
• Other Food Stores, including convenience food stores, meat shops, green grocers, baked goods stores and others
NFSR categories include:
Non-Food Store Retail (NFSR):
• “GAFO” – o General Merchandise Stores, including department stores, warehouse membership
clubs, Canadian Tire stores, certain variety stores, and dollar stores o Apparel and Accessories Stores, including jewelers and luggage/leather goods stores o Furniture, Home Furnishings and Electronics Stores, including computer, camera and
photographic supply stores
2 Some adjustments have been made to the 2003 inventory based on the availability of floor plans, interactive mapping systems, and store classifications.

Clarington Commercial Market Analysis Update
20
o Other Miscellaneous Retailers, including sporting goods, toy, hobby, book, florist, office supply, fabric/wool, gift stores, pet/pet supply, tobacco, antique stores, second hand stores, wine making shops, and others
• Pharmacies and Personal Care Stores, including drug stores, optical stores, nutrition and cosmetic stores
• Building and Outdoor Home Supplies Stores, including home improvement centres, hardware stores, paint and wallpaper stores, nursery/garden centres (excluding those with greenhouse operations), and a wide range of building material stores
• Liquor, beer, and wine stores
Other Retail:
Services uses which typically locate in retail centres and the downtowns have been included:
Selected Services:
• Food services, including restaurants and fast food establishments • Financial services, including banks and credit unions • Personal services, including hair care and esthetic services (includes barber, beauty, hair
salons), coin-operated laundries, dry cleaners , pet care (except veterinary), photofinishing services , day spa, diet centres, hair removal, massage parlours, tanning salons, tattoo parlours, weight reduction centres, fortune tellers, dating services, psychic services, and shoeshine facilities
• Consumer Goods Rental stores, including video, party supply, and equipment rentals
These types of service uses are included in the Secondary Plan thresholds for retail and service floor space in the Bowmanville West Town Centre Clarington (Section 4.3 b) and have been tabulated separately. It should be noted that there is a wide range of other service uses, including professional services, other financial services, insurance, real estate, health services, repair shops, education services, office administration services (includes travel agents, copy shop) and recreation/entertainment services. The majority of these uses have also been inventoried. Service stations and automotive dealerships have not been included in our inventory.
For each retail and service commercial unit inventoried in 2011 we have identified the business name, commercial type (by NAICS code), street address, planning area and estimated size (measured in terms of square feet/square metres gross leasable area (GLA)). Our 2003 inventory utilized the Standard Industrial Classification (SIC) and therefore has been re-coded to correspond to the NAICS.
The current inventory allows us to determine what the current commercial situation is today, including a determination of how close development has come to achieving the expectations in the 2005 Commercial Policy Review.

Clarington Commercial Market Analysis Update
21
3.1.2 FLOOR SPACE SUMMARY BY LOCATION AND TYPE
Since 2003, there has been a significant amount of new retail and service floor space development in Clarington. Not only has development occurred in the Bowmanville West Town Centre, but Clarington’s Downtown areas continue to be strengthened and renewed with new development and/or renovation of historic buildings.
As summarized in Figures 3-1 and 3-2, there is currently 238,107 square metres (2.5 million square feet) of retail and service commercial floor space in Clarington. This represents an increase of about 81,032 square metres (872,200 square feet) since 2003.
In order to evaluate the thresholds in the Official Plan and distribution of space, our inventory has been classified into the following areas and commercial nodes by to generally correspond with designations in the existing Official Plan/Secondary Plans:
• Bowmanville Urban Area: B-1. Bowmanville East Town Centre - Downtown B-2. Bowmanville East Town Centre – East Business District B-3. Bowmanville West Town Centre – i (Clarington Centre) B-4. Bowmanville West Town Centre – ii (vacant Canadian Tire) B-5. Bowmanville West Town Centre – iii (Cineplex) B-6. Bowmanville West Town Centre – iv (West Bowmanville Shopping Centre) B-7. Bowmanville West Town Centre – v (SmartCentre) B-8. Bowmanville - Neighbourhood Centres B-9. Bowmanville – Other (includes Port Darlington, Highway Commercial and
employment areas) • Courtice Urban Area:
C-1. Courtice Town Centre C-2. Courtice West Shopping District C-3. Courtice - Neighbourhood Centres C-4. Courtice - Other
• Newcastle Village Urban Area: N-1. Newcastle Village Centre N-2. Newcastle Village – Other (includes Port of Newcastle and employment areas)
• Orono Village Urban Area: O-1. Orono Village – Centre O-2. Orono Village - Neighbourhood Centre O-3. Orono Village – Other (including Highway Commercial)
• Other Clarington The following summarizes the distribution of space by area and store type, as well as changes that have occurred since 2003, as detailed in Figures 3-1 to 3-3.
• NFSR floor space, which currently comprises about 41% of the total retail and service space in Clarington, has seen the most significant increase since 2003 with the addition of some 36,921 square metres (397,400 square feet). The majority of new NFSR space has been added in the Bowmanville West Town Centre, including Walmart, Canadian Tire (relocation/expansion), Winners and Home Depot. NFSR floor space in Clarington currently amounts to some 96,726

Clarington Commercial Market Analysis Update
22
square metres (1.0 million square feet). About 78% of all NFSR space in Clarington is located in the Bowmanville Urban Area, with the Bowmanville West Town Centre comprising the majority of that floor space.
• FSR floor space currently comprises some 25,271 square metres (272,100 square feet). There have been no significant changes in total FSR floor space since 2003, although one supermarket in the Bowmanville East Town Centre closed (A&P at King and Liberty) with a corresponding expansion of another (Metro in Bowmanville Mall). There are currently six supermarkets in Clarington, three of which are located in Bowmanville. The new Walmart Supercentre, although classified as a General Merchandise store, also has a significant food component equivalent to a supermarket. Currently, about 56% of all FSR space is located in Bowmanville, with Courtice comprising about 19%, Newcastle Village some 14%, Orono about 5%, and the rest of Clarington about 7%.
• Other Retail (Liquor/Beer/Wine) comprises 2,488 square metres (26,800 square feet). Since 2003 a new Beer store has opened in the Bowmanville East Town Centre, which replaced a smaller one in the same area. In Clarington, there is one The Beer Store, three LCBO stores, and two winery stores. Courtice has no liquor/beer/wine stores.
• Selected service floor space currently comprises some 35,982 square metres (387,400 square feet). There has been an increase since 2003 of about 6,000 square metres, with increases in bank space, personal care and food services. Compared to 2003, there has been a decline in the consumer goods rental category floor space due to the closure of a number of video rental outlets, which have now become obsolete.
• Other service floor space is currently estimated at 44,566 square metres (479,800 square feet). This space has increased by almost 10,000 square metres, with health care services showing the greatest space increase.
• The current inventory includes 33,074 square metres (356,100 square feet) of vacant floor space, of which almost 45% is comprised of the RONA and Canadian Tire in Bowmanville. As a result the current vacancy rate in Clarington is considered high at 13.9%, compared to only 3.5% in 2003. However, when the Canadian Tire and RONA are removed from the calculation the vacancy rates drops to about 8%. Of the Urban Areas, Courtice has the highest vacancy rate at close to 16%, with some of this vacant space in the newly constructed Prestonvale Plaza.
Retail and service floor space in Clarington is concentrated in the Urban Areas (see Figure 3-3), with the majority in the Bowmanville Urban Area (67.3%), the largest of the Urban Areas. In 2003, the Bowmanville Urban Area comprised about 61.3% of the total floor space in Clarington. In 2003, the Bowmanville East Town Centre comprised the greatest proportion of retail and service commercial floor space in Clarington. As of December 2011, the Bowmanville West Town Centre has now surpassed the Bowmanville East Town Centre in space.

Clarington Commercial Market Analysis Update
23
FIGURE 3-1: CLARINGTON INVENTORY BY AREA, 2003 AND 2011 (SQUARE METRES)
Note: Based on the availability of site plans and Clarington’s interactive mapping, certain store sizes have been modified in the 2003 inventory. Some stores included in the 2003 inventory have been removed as they are classified in NAICS as agricultural (e.g. greenhouse operations) or wholesale. In some cases store in 2003 were converted to an industrial use, which have not been included in 2011.
INVENTORY YEAR 2003
Sum of Square Metres Type VACANCYArea FSR NFSR Other Retail Selected Services Other Services Vacant Grand Total RATEBowmanville Urban Area 13,699 42,341 1,086 15,491 21,324 2,295 96,236 2.4%
B-1 Bowmanville Downtown 947 9,298 - 6,081 6,946 1,188 24,460 4.9%B-2 Bowmanville East Main Street 6,994 9,566 399 4,317 4,848 828 26,952 3.1%B-3 Bowmanville West Town Centre - i 4,896 10,890 687 1,730 278 - 18,481 0.0%B-4 Bowmanville West Town Centre - ii - 7,469 - - - - 7,469 0.0%B-5 Bowmanville West Town Centre - iii - - - 650 2,796 - 3,446 0.0%B-6 Bowmanville West Town Centre - iv - - - 520 - - 520 0.0%B-8 Bowmanville Urban Area - Neighbourhood Centre 343 464 - 390 502 - 1,699 0.0%B-9 Port Darlington - - - 223 167 - 390 0.0%B-9 Bowmanville Urban Area (Other) 519 4,654 - 1,580 5,787 279 12,819 2.2%
Courtice Urban Area 4,282 9,401 - 8,069 7,626 2,026 31,404 6.5%C-1 Courtice Urban Area - Town Centre - - - 93 186 93 372 25.0%C-2 Courtice West Shopping District 3,298 6,207 - 5,283 5,510 1,691 21,989 7.7%C-3 Courtice Urban Area - Neighbourhood Centre 613 891 - 2,098 974 242 4,818 5.0%C-4 Courtice Urban Area (other) 371 2,303 - 595 956 - 4,225 0.0%
Newcastle Village Urban Area 3,093 2,127 297 2,496 2,331 102 10,446 1.0%N-1 Newcastle Village Centre 3,093 2,127 297 2,180 1,606 102 9,405 1.1%N-2 Newcastle Village (Other) - - - 316 725 - 1,041 0.0%
Orono Urban Area 1,216 2,974 325 947 576 130 6,168 2.1%O-1 Orono Urban Area - Village Centre 426 1,237 - 947 576 130 3,316 3.9%O-2 Orono Urban Area - Neighbourhood Centre 790 - 325 - - - 1,115 0.0%O-3 Orono Urban Area - Other - 1,737 - - - - 1,737 0.0%
Other Clarington 2,803 2,962 269 2,972 2,803 1,012 12,821 7.9%Clarke Township (former) 1,244 734 - 2,248 1,198 789 6,213 12.7%Darlington Township (former) 1,559 2,228 269 724 1,605 223 6,608 3.4%
Grand Total 25,093 59,805 1,977 29,975 34,660 5,565 157,075 3.5%
SOURCE: urbanMetrics inc.Based on 2003 inventory conducted by PricewaterHouseCoopers, with modifications.
INVENTORY YEAR 2011
Sum of Square Metres Type VACANCYArea FSR NFSR Other Retail Selected Services Other Services Vacant Grand Total RATEBowmanville Urban Area 14,100 75,404 1,495 19,216 27,996 21,922 160,133 13.7%
B -1 Bowmanville Downtown 399 8,721 - 5,563 6,707 3,419 24,809 13.8%B-2 Bowmanville East Main Street 7,181 8,713 808 3,500 10,543 1,179 31,924 3.7%B-3 Bowmanville West Town Centre - i 4,896 11,039 687 1,991 269 232 19,114 1.2%B-4 Bowmanville West Town Centre - ii - - - - - 7,469 7,469 100.0%B-5 Bowmanville West Town Centre - iii - - - 650 2,796 - 3,446 0.0%B-6 Bowmanville West Town Centre - iv 149 9,773 - 1,114 - - 11,036 0.0%B-7 Bowmanville West Town Centre - v - 28,502 - 985 - - 29,487 0.0%B-8 Bowmanville Urban Area - Neighbourhood Centre 882 2,043 - 3,452 1,578 1,419 9,374 15.1%B-9 Port Darlington - - - 223 - 167 390 42.8%B-9 Bowmanville Urban Area (Other) 593 6,613 - 1,738 6,103 8,037 23,084 34.8%
Courtice Urban Area 4,857 7,292 - 8,442 9,837 5,748 36,176 15.9%C-1 Courtice Urban Area - Town Centre - 93 - - 186 - 279 0.0%C-2 Courtice West Shopping District 3,632 3,633 - 5,397 6,522 3,287 22,471 14.6%C-3 Courtice Urban Area - Neighbourhood Centre 854 779 - 2,060 1,503 2,405 7,601 31.6%C-4 Courtice Urban Area (other) 371 2,787 - 985 1,626 56 5,825 1.0%
Newcastle Village Urban Area 3,400 4,971 399 4,079 4,030 1,894 18,773 10.1%N-1 Newcastle Village Centre 3,400 3,893 399 3,763 3,696 1,012 16,163 6.3%N-2 Newcastle Village (Other) - 1,078 - 316 334 882 2,610 33.8%
Orono Urban Area 1,254 4,489 325 697 1,366 660 8,791 7.5%O-1 Orono Urban Area - Village Centre 464 2,120 - 697 427 660 4,368 15.1%O-2 Orono Urban Area - Neighbourhood Centre 790 - 325 - - - 1,115 0.0%O-3 Orono Urban Area - Other - 2,369 - - 939 - 3,308 0.0%
Other Clarington 1,660 4,570 269 3,548 1,337 2,850 14,234 20.0%Wilmot Creek - - - 465 - - 465 0.0%Clarke Township (former) 389 826 - 2,080 251 2,211 5,757 38.4%Darlington Township (former) 1,271 3,744 269 1,003 1,086 639 8,012 8.0%
Grand Total 25,271 96,726 2,488 35,982 44,566 33,074 238,107 13.9%Note: Other Services excludes government offices (except for Post Office) and Service Ontario in Downtown Bowmanville.
SOURCE: urbanMetrics inc. (December 2011)

Clarington Commercial Market Analysis Update
24
FIGURE 3-2: SUMMARY – SERVICE LEVELS BY AREA AND MAJOR STORE TYPE
INVENTORY YEAR 2003
% of Total olumn Labels
Row Labels FSR NFSR Other RetailOther
ServicesSelected Services Vacant Grand Total
Bowmanville Urban Area 54.6% 70.8% 54.9% 61.5% 51.7% 41.2% 61.3%Bowmanville East Town Centre 31.6% 31.5% 20.2% 34.0% 34.7% 36.2% 32.7%Bowmanville West Town Centre 19.5% 30.7% 34.7% 8.9% 9.7% 0.0% 19.0%Bowmanville - Neighbourhood Centres 1.4% 0.8% 0.0% 1.4% 1.3% 0.0% 1.1%Bowmanville - Other 2.1% 7.8% 0.0% 17.2% 6.0% 5.0% 8.4%
Courtice Urban Area 17.1% 15.7% 0.0% 22.0% 26.9% 36.4% 20.0%Courtice Town Centre 0.0% 0.0% 0.0% 0.5% 0.3% 1.7% 0.2%Courtice West Shopping District 13.1% 10.4% 0.0% 15.9% 17.6% 30.4% 14.0%Courtice - Neighbourhood Centres 2.4% 1.5% 0.0% 2.8% 7.0% 4.3% 3.1%Courtice - Other 1.5% 3.9% 0.0% 2.8% 2.0% 0.0% 2.7%
Newcastle Village Urban Area 12.3% 3.6% 15.0% 6.7% 8.3% 1.8% 6.7%Newcastle Village Centre 12.3% 3.6% 15.0% 4.6% 7.3% 1.8% 6.0%Newcastle Village Other 0.0% 0.0% 0.0% 2.1% 1.1% 0.0% 0.7%
Orono Urban Area 4.8% 5.0% 16.4% 1.7% 3.2% 2.3% 3.9%Orono Village Centre 1.7% 2.1% 0.0% 1.7% 3.2% 2.3% 2.1%Orono Neighbourhood Centre 3.1% 0.0% 16.4% 0.0% 0.0% 0.0% 0.7%Orono - Other 0.0% 2.9% 0.0% 0.0% 0.0% 0.0% 1.1%
Other Clarington 11.2% 5.0% 13.6% 8.1% 9.9% 18.2% 8.2%Other Clarington 11.2% 5.0% 13.6% 8.1% 9.9% 18.2% 8.2%
Grand Total 100.0% 100.0% 100.0% 100.0% 100.0% 100.0% 100.0%
INVENTORY YEAR 2011
% of Total Column Labels
Row Labels FSR NFSR Other RetailOther Services
Selected Services Vacant Grand Total
Bowmanville Urban Area 55.8% 78.0% 60.1% 62.8% 53.4% 66.3% 67.3%Bowmanville East Town Centre 30.0% 18.0% 32.5% 38.7% 25.2% 13.9% 23.8%Bowmanville West Town Centre 20.0% 51.0% 27.6% 6.9% 13.2% 23.3% 29.6%Bowmanville - Neighbourhood Centres 3.5% 2.1% 0.0% 3.5% 9.6% 4.3% 3.9%Bowmanville - Other 2.3% 6.8% 0.0% 13.7% 5.4% 24.8% 9.9%
Courtice Urban Area 19.2% 7.5% 0.0% 22.1% 23.5% 17.4% 15.2%Courtice Town Centre 0.0% 0.1% 0.0% 0.4% 0.0% 0.0% 0.1%Courtice West Shopping District 14.4% 3.8% 0.0% 14.6% 15.0% 9.9% 9.4%Courtice - Neighbourhood Centres 3.4% 0.8% 0.0% 3.4% 5.7% 7.3% 3.2%Courtice - Other 1.5% 2.9% 0.0% 3.6% 2.7% 0.2% 2.4%
Newcastle Village Urban Area 13.5% 5.1% 16.0% 9.0% 11.3% 5.7% 7.9%Newcastle Village Centre 13.5% 4.0% 16.0% 8.3% 10.5% 3.1% 6.8%Newcastle Village Other 0.0% 1.1% 0.0% 0.7% 0.9% 2.7% 1.1%
Orono Urban Area 5.0% 4.6% 13.1% 3.1% 1.9% 2.0% 3.7%Orono Village Centre 1.8% 2.2% 0.0% 1.0% 1.9% 2.0% 1.8%Orono Neighbourhood Centre 3.1% 0.0% 13.1% 0.0% 0.0% 0.0% 0.5%Orono - Other 0.0% 2.4% 0.0% 2.1% 0.0% 0.0% 1.4%
Other Clarington 6.6% 4.7% 10.8% 3.0% 9.9% 8.6% 6.0%Other Clarington 6.6% 4.7% 10.8% 3.0% 9.9% 8.6% 6.0%
Grand Total 100.0% 100.0% 100.0% 100.0% 100.0% 100.0% 100.0%
SOURCE: urbanMetrics inc.

Clarington Commercial Market Analysis Update
25
FIGURE 3-3: TOTAL RETAIL AND SERVICE FLOOR SPACE BY AREA (SQUARE METRES), 2003 AND 2011
The following provides an overview of each of the retail and service commercial areas in Clarington by Urban Area.
3.1.3 BOWMANVILLE URBAN AREA
3.1.3.1 BOWMANVILLE EAST TOWN CENTRE (B-1 AND B-2)
The Bowmanville East Town Centre (“BETC”) includes the historic Downtown area in the centre of Bowmanville, and a stretch of King Street extending east to the Bowmanville Mall referred to as the “East Business District” (see Figure 3-6). The Downtown sub-area (B-1) includes primarily street-front retail and service floor space in historic buildings located between Scucog Street and George Street along King Street. There is an active Business Improvement Area in the Downtown with a mandate to promote and enhance the Downtown.
The Downtown (B-1) is differentiated from other retail nodes in Bowmanville and Clarington with its selection of unique specialty shops and services. Unlike the
Bowmanville West Town Centre, Bowmanville’s Downtown is more tourist-based and also functions as the main service and administrative centre for Clarington. Although the Downtown has a large number of retail stores, the majority of the commercial space in the Downtown is service oriented, and includes restaurants, medical offices, professional services, and banks. Specialty Retailer (Antiques) – King Street,
Downtown Bowmanville
Bowmanville Urban Area
Courtice Urban Area
Newcastle Village Urban
Area
Orono Urban Area
Other Clarington
2003 96,236 31,404 10,446 6,168 12,821 2011 160,133 36,176 18,773 8,791 14,234
-20,000 40,000 60,000 80,000
100,000 120,000 140,000 160,000 180,000
Squa
re M
etre
s
Clarington, Retail and Service Floor Space by Area, 2003 and 2011 (m2)
2003
2011
Photo Credit urbanMetrics

Clarington Commercial Market Analysis Update
26
In the Downtown, on-street parking is generally accommodated along King Street and the side streets, including Silver Street, Temperance Street and Division Street, with parking also in municipal lots along Church Street. There are some in-fill lots available along King Street for commercial development in the Downtown, however, these are limited. Opportunities for new retail and service floor space are also available in existing vacant units throughout the downtown. In total, the Downtown currently has approximately 24,809 square metres (267,100 square feet) of retail and service floor space. Based on our inventory comparison, there has been a decline in occupied retail and service floor space in the Downtown since 2003, with a corresponding increase in vacant floor space. Vacant floor space is currently estimated at some 3,419 square metres (36,800 square feet). Other than the renovation of 54 King Street (Balmoral Place) for retail and service floor space, there has been no new floor space added in the Downtown since 2003. Some renovations to existing buildings as a result of a fire in 2008 have occurred. A restaurant at the corner of King Street West and Scucog Road also burned down recently but has yet to be replaced. A number of the ground floor vacant units in the Downtown are located on the side-streets (e.g. Silver and Division Street) in what can be considered less desirable floor space (i.e. compared to floor space fronting King Street) with limited exposure to passing traffic. There are limited vacant units in the main part of the Downtown along King Street between Division and Scucog. East of Division Street, there are more vacant units, including a number of ground floor units in the renovated Balmoral Place (former hotel) and Veltri Complex. The effects of the recent recession, closure of the Bowmanville Senior Public School on Queen Street in 2007 and the addition of new retail and service floor space elsewhere in Bowmanville have likely
Division Street, vacancies (former Game Power and Hair Razors)
57-59 King Street East – Vacant units (former Happy King). RBC Bank to relocate.
Downtown, King Street (south side)
Photo Credit urbanMetrics
Photo Credit urbanMetrics
Photo Credit urbanMetrics

Clarington Commercial Market Analysis Update
27
contributed to the increase in vacancy rates in the Downtown (currently estimated at 13.8%, compared to 4.9% in 2003) (see Figure 3-4)
FIGURE 3-4: DOWNTOWN BOWMANVILLE VACANCY RATE AND BUSINESSES – 2003 AND 2011
Downtown Bowmanville (B-1) 2003 2011 Vacancy Rate 4.9% 13.8% Downtown Bowmanville (B-1)
2003 2011 2003 Business Still in Operation in 2011
Turnover Rate
No. of Businesses (Occupied)
154 128 73 53%
Note: Some office units in 2011 were consolidated Based on our inventory, of the 128 occupied commercial units currently in the Downtown, about 73 of the tenants remained unchanged from 2003. The BETC East Business District sub-area (B-2), located west of George Street and the Downtown, includes strip malls, automotive uses and a significant number of service oriented businesses, such as restaurants, professional offices and medical buildings. Included in the East Business District is Bowmanville Mall. This enclosed centre, the only one of its kind in Clarington, is anchored by a Metro supermarket, Dollarama and Shoppers Drug Mart. This centre has been renovated in recent years, which has included the expansion of the Metro. In recent years, a former A&P closed on the south-east corner of Liberty Street and King Street East in the East Business District and was replaced by a Staples and The Beer Store. Other building activity has occurred in the area including the 222 King Street East medical centre expansion. Overall, the retail and selected service floor space in the BETC East Business District, including vacant floor space, has increased over the past several years. In 2003 there was a total of 26,952 square metres (290,200 square feet) of floor space, including vacant floor space of 828 square metres (8,900 square feet), compared to 31,924 square metres (343,700 square feet) in 2011 and 1,179 square metres (12,700 square feet) of vacant floor space. There are vacant commercial sites available for in-fill development (e.g. 122 and 181 King Street East) and vacant units scattered throughout the East Business District in newer plazas and historic converted residential buildings. There are also opportunities for redevelopment of existing retail centres due to non-heritage built forms. Figure 3-5 illustrates the vacancy rate and businesses in the East Business District for the years 2003 and 2011.
FIGURE 3-5: EAST DISTRICT VACANCY RATE AND BUSINESSES – 2003 AND 2011
East District (B-2) 2003 2011 Vacancy Rate 3.1% 3.7% East District (B-2) 2003 2011 2003 Business Still in
Operation in 2011 Turnover Rate
No. of Businesses (Occupied)
88 95 47 47%

Clarington Commercial Market Analysis Update
28
Above Photo Credits – urbanMetrics inc.
Bowmanville Plaza, 134-136 King Street East, East Business District
Examples of Commercial Space Opportunities – East Business District

Clarington Commercial Market Analysis Update
29
FIGURE 3-6: BOWMANVILLE EAST AND WEST TOWN CENTRES (B-1 TO B-7)
Source: urbanMetrics inc. utilizing MapInfo/Bing
3.1.3.2 BOWMANVILLE WEST TOWN CENTRE (AREAS B-3 TO B-7)
The Bowmanville West Town Centre (“BWTC”) is located west of the Bowmanville East Town Centre (see Figure 3-6 above) and is the main focus for regional serving retail commercial floor space in Clarington. This area has experienced the greatest volume of development in Clarington in recent years. Additional floor space is planned. The BWTC includes the Clarington Centre (B-3), a strip plaza anchored by Zellers and Loblaws. The Zellers in this plaza is expected to close in 2012 and be replaced with a Target department store. There is currently one vacant unit in this centre. To the east of Clarington Boulevard and the Clarington Centre is a vacant Canadian Tire store (B-4), which is expected to be redeveloped to accommodate a number of medium format retailers. East of Clarington Boulevard and north of
B-1 B-2
B-3 B-4B-6B-7 B-5
Bowmanville East and West Town Centres
BOWMANVILLE WEST TOWN CENTRE
BOWMANVILLE EAST TOWN CENTRE
Clarington Centre

Clarington Commercial Market Analysis Update
30
Highway 2 is Clarington Place (B-5) , which includes a Cineplex movie theatre and two restaurants (East Side Marios and Burger King). To the west of Clarington Place is the West Bowmanville Centre (B-6), anchored by a Home Depot. The centre also includes a Scotia Bank, Boston Pizza and a pad site with a number of smaller retail tenants (e.g. M&M and Sleep Country). An expansion of the West Bowmanville Centre is underway. A new and larger Canadian Tire store, with a Marks Work Wearhouse, opened in 2011 across the street from Clarington Place in the SmartCentres development (B-7). The Walmart Supercentre, which has a food component, opened in the SmartCentres development in 2010. Other tenants in the SmartCentres project include a Winners family apparel store (opened in 2011), a Swiss Chalet restaurant, and a number of smaller retail and service tenants on a pad site close to Highway 2. An LCBO is expected to be developed on a pad site in this project, as well as a number of small pads along the Highway 2 frontage. As of December 2011, the BWTC comprises a total of 70,552 square metres (759,440 square feet) of retail and service floor space, with the majority of the floor space classified as NFSR. This floor space includes the vacant Canadian Tire. In 2003, the total floor space in the BWTC was estimated at 29,916 square metres (322,000 square feet). This represents a floor space increase of 40,636 square metres (437,400 square feet) over the past 8 years. Figure 3-7 illustrates the vacancy rate and businesses in the Bowmanville West Town Centre for the years 2003 and 2011.
New Large Format Development - Bowmanville West Town Centre
SmartCentres Bowmanville
Global Pet FoodsSallyMarble SlabGreat ClipsExtremem PitaMucho burrito
Photo Credit urbanMetrics

Clarington Commercial Market Analysis Update
31
FIGURE 3-7 BOWMANVILLE WEST TOWN CENTRE - VACANCY RATE AND BUSINESSES – 2003 AND 2011
Bowmanville West Town Centres (B3-B7)
2003 2011
Vacancy Rate 0.0% 10.9% Bowmanville West Town Centre (B-3 to B-7)
2003 2011 2003 Business Still in Operation in 2011
Turnover Rate
No. of Businesses (Occupied)
31 45 25 19%
3.1.3.3 BOWMANVILLE - NEIGHBOURHOOD CENTRES (B-8)
There are a number of existing Neighbourhood Centres in Bowmanville (see Figure 3-9) that are convenience type plazas that serve primarily the needs of local area residents. Comprising a total of 9,374 square metres (101,000 square feet) of retail and service floor space, these include:
(a) Longworth Avenue/Liberty Street North (includes Shoppers Drug Mart) (b) Mearns Avenue/Concession Street East (c) Waverly Road/Quinn Drive – Waverly Centre (d) Regional Road 57/Hartwell Avenue
Of these centres, a), b) and d) were open after the completion of the 2005 Commercial Policy Review. As a result, floor space in Neighbourhood Centres has increased by 7,675 square metres since 2003. The Waverly Centre is the oldest of the four existing Neighbourhood Centres and has second storey office floor space. It currently has a number of ground floor vacant commercial units for lease. A dated façade, poor exposure to high traffic volumes, the recent recession, as well as the addition of the Martin Road plaza (d) nearby have all likely contributed to the vacancy levels in this centre. A new supermarket anchored centre (e) is currently under construction at Longworth Avenue and Scucog Road. Sites (f) and (g), located in north Bowmanville are currently undeveloped. Figure 3-8 illustrates the vacancy rate and businesses in the Neighbourhood Centres (a-d) Centre for the years 2003 and 2011. FIGURE 3-8: BOWMANVILLE NEIGHBOURHOOD CENTRES - VACANCY RATE AND BUSINESSES – 2003 AND 2011
Neighbourhood Centres (B-8) (a) to (d)
2003 2011
Vacancy Rate 0.0% 15.1% Neighbourhood Centres (B-8) (a) to (d)
2003 2011 2003 Business Still in Operation in 2011
Turnover Rate
No. of Businesses (Occupied)
9 31 3 67%

Clarington Commercial Market Analysis Update
32
FIGURE 3-9: BOWMANVILLE NEIGHBOURHOOD CENTRES (B-8)
Source: urbanMetrics inc. / Photo Credits urbanMetrics inc.
3.1.3.4 BOWMANVILLE – OTHER (B-9)
Any retail or service floor space that is classified in this node is located in Bowmanville but not within any of the aforementioned nodes. Most of this space is located on a Highway Commercial designated site, with a limited number of retail and service outlets located within Bowmanville’s industrial areas, as well as in Port Darlington. As of December 2011, in “other” Bowmanville there is some 23,474 square metres (257,200 square feet) of retail and service floor space, with the majority of this space located in the designated Highway Commercial Districts at Baseline Road/Regional Road 57, and Baseline Road/Liberty Street. Since 2003, some 10,265 square metres have been added in “other” Bowmanville, with the majority of this space intended for a 7,182 square metres (77,200 square feet) RONA home improvement store located on Baseline Road, just east of Regional Road 57 at Spry Avenue. The RONA was never occupied and is currently for lease. Other retail development is planned in this area, including a hotel.
(a)
(b)
(c)
(d)
(f)(g)
Under Construction(e)
Bowmanville Designated Neighbourhood Centres – Built, Under Construction, Future

Clarington Commercial Market Analysis Update
33
3.1.3.5 SUMMARY – BOWMANVILLE URBAN AREA
Figure 3-10 provides a comparison of the total retail and service commercial floor space in Bowmanville for the years 2003 and 2011.
FIGURE 3-10: BOWMANVILLE URBAN AREA, FLOOR SPACE SUMMARY, 2003 AND 2011
TOTAL FLOOR SPACE (Square Metres) Occupied
Floor Space 2011 (m2)
2003 2011
Sq. Metres % of Total Sq. Metres % of Total Bowmanville Urban Area B-1/B-2 - Bowmanville East Town Centre
51,412 53.4% 56,733 35.4% 52,135
B-3 – B-7 - Bowmanville West Town Centre
29,916 31.1% 70,552 44.1% 62,851
B-8 - Bowmanville - Neighbourhood Centres
1,699 1.8% 9,374 5.9% 7,955
B-9 Bowmanville - Other 13,209 13.7% 23,474 14.7% 15,270
Grand Total 96,236 100.0% 160,133 100.0% 138,211
3.1.4 COURTICE URBAN AREA
3.1.4.1 COURTICE TOWN CENTRE (C-1)
This node, located on the south-east corner of Trulls Road and Highway 2, is planned for future commercial development as part of a mixed-use Town Centre (see location on Figure 3-13). Except for a small mixed-use commercial plaza on Trulls Road south of Highway 2, the land is currently vacant. A Secondary Plan is currently being developed for the Town Centre. Although the Courtice Town Centre has a threshold or maximum floor space allocation of some 30,000 square metres for retail and service uses, based on discussions with Clarington, it is likely the Town Centre will develop with no more than 20,000 square metres (215,300 square feet) given their preliminary assessment of environmental constraints and land area.
3.1.4.2 COURTICE WEST SHOPPING DISTRICT (C-2)
Townline Centre, Courtice – Anchored by a FreshCo supermarket (Photo Credit urbanMetrics inc.)

Clarington Commercial Market Analysis Update
34
Stretching between Townline Road to just east of Darlington Road, the Courtice West Shopping District includes the Townline Centre, comprised of some 8,360 square metres (90,000 square feet) of floor space and anchored by a FreshCo supermarket. The remainder of the District consists of a number of strip centres and freestanding commercial facilities. There has been limited new development in this node since 2003. A new Shoppers Drug Mart, with second floor office space, is currently under construction in this node (resulted in the demolition of a home furnishing store).
In total, as of December 2011, the Courtice West Shopping District includes an estimated 22,471 square metres (241,900 square feet) of retail and service floor space. In 2003, there was 21,989 square metres (236,700 square feet). Vacant space has increased from 1,691 square metres (18,200 square feet) in 2003 to 3,287 square metres (35,400 square feet) in 2011.
Figure 3-11 illustrates the vacancy rate and businesses in the Courtice West Shopping District for the years 2003 and 2011.
FIGURE 3-11: COURTICE WEST - VACANCY RATE AND BUSINESSES – 2003 AND 2011
Courtice West Shopping District (C-2) 2003 2011 Vacancy Rate 7.7% 14.6%
Courtice West Shopping District (C-2)
2003 2011 2003 Business Still in Operation in 2011
Turnover Rate
No. of Businesses (Occupied)
72 69 38 47%
To the west of the Courtice West Shopping District in Oshawa is a plaza anchored by a Zellers and a No Frills supermarket, located on the north-west corner of Townline Road and Highway 2. This Zellers store will be converted to a Walmart
COURTICE NEIGHBOURHOOD CENTRES (C-3)
There are seven designated Neighbourhood Centres in Courtice, some of which have second floor space. Except for site (g) all have been developed with (e) recently constructed. The Neighbourhood Centres, the locations of which have been indicated in Figure 3-13, include the following:
(a) 1500 Highway 2 @ Centrefield Drive
(b) 1656 Nash Road @ Trulls Road
(c) Highway 2 @ Prestonvale.
(d) Highway 2 @ Courtice Road
(e) Prestonvale Plaza (Bloor Street/Rosswell Drive) – A new convenience plaza with residential above
(f) Glenabbey Drive @ Townline Road South
(g) Courtice Road – north of Nash Road

Clarington Commercial Market Analysis Update
35
As of December 2011, the Neighbourhood Centres in Courtice comprise some 7,601 square metres 81,900 square feet, including vacant floor space of 2,405 square metres (25,900 square feet). This can be compared to total floor space of 4,818 square metres (51,900 square feet) in 2003, which included vacant floor space of 242 square metres (2,600 square feet). Most of the vacant space is located in Prestonvale Plaza (site (e)), which is a recently constructed plaza.
Figure 3-12 illustrates the vacancy rate and businesses in the Courtice West Shopping District for the years 2003 and 2011.
FIGURE 3-12: COURTICE NEIGHBOURHOOD CENTRES - VACANCY RATE AND BUSINESSES – 2003 AND 2011
Neighbourhood Centres (C-3) 2003 2011 Vacancy Rate 5.0% 31.6%
Neighbourhood Centres (C-3)
2003 2011 2003 Business Still in Operation in 2011
Turnover Rate
No. of Businesses (Occupied)
33 37 13 61%
3.1.4.3 COURTICE - OTHER (C-4)
There are a limited number of retail and service commercial uses located elsewhere in Clarington, including the employment areas and locations along Highway 2. This floor space has been estimated at 5,825 square metres (62,700 square feet) in 2011; an increase of about 1,600 square metres from 2003.

Clarington Commercial Market Analysis Update
36
FIGURE 3-13: COURTICE RETAIL NODES (C-1 TO C-4)
Source: urbanMetrics inc. (Photo Credits – urbanMetrics inc. and Google Streetview)
3.1.5 SUMMARY – COURTICE URBAN AREA
Figure 3-14 provides a comparison of the total retail and service commercial floor space in Courtice for the years 2003 and 2011.
FIGURE 3-14: COURTICE URBAN AREA, FLOOR SPACE SUMMARY, 2003 AND 2011
TOTAL FLOOR SPACE (square metres) Occupied
Floor Space 2011 (m2)
2003 2011 Area Sq. Metres % of Total Sq. Metres % of Total
Courtice Urban Area C-1 Courtice Town Centre 372 1.2% 279 0.8% 279
C-2 Courtice West Shopping District 21,989 70.0% 22,471 62.1% 19,184
C-3 Neighbourhood Centres 4,818 15.3% 7,601 21.0% 5,196
C-4 Other 4,225 13.5% 5,825 16.1% 5,769
Grand Total 31,404 100.0% 36,176 100.0% 30,428
(a) (b)
(c)
(d)
(e)
(f)
(g)
C-1C-2
(C-3)
(C-1 and C-2)
C-4

Clarington Commercial Market Analysis Update
37
3.1.6 NEWCASTLE URBAN AREA
3.1.6.1 NEWCASTLE VILLAGE CENTRE (N-1)
Located just east of Highway 35/115 and north of Highway 401, the Newcastle Village Centre (see Figure 3-15) includes a relatively compact area of predominantly commercial uses. It functions as a downtown shopping district serving both the local “village” residents, and residents of the wider rural area. With its location on Highway 2 and proximity to Highway 35/115, the Village Centre also serves pass-by regional traffic. The Village Centre includes an historic core area and a number of retail plazas.
FIGURE 3-15: NEWCASTLE VILLAGE CENTRE (N-1)
Source: urbanMetrics inc. utilizing Microsoft Bing (Photo Credits – urbanMetrics inc.)
Major retailers in the Town Centre include Home Hardware, Shoppers Drug Mart and Foodland supermarket. There has been some new development in the Village Centre in recent years since the completion of the 2005 Commercial Policy Review. This has included a convenience retail centre on the south-east corner of Brookhouse Drive and King Avenue (The Gate of Newcastle Village Plaza), a new Shoppers Drug Mart at the corner of Mill Street and King Avenue, and the conversion of the Massey building for ground floor retail floor space. Façade improvements have also been made in the downtown. Additional retail
Proposed No Frills
Massey Building
Proposed Gas Station and Convenience Plaza
N-1
Newcastle, New Shoppers Drug Mart, King Avenue/Mill St.
Photo Credit urbanMetrics

Clarington Commercial Market Analysis Update
38
development is planned, including a No Frills supermarket and another convenience-type plaza on the south-west corner of Brookhouse and King Avenue East.
In total, the Newcastle Village Centre currently comprises 16,163 square metres (174,000 square feet) of retail and service floor space, including vacant floor space estimated at 1,012 square metres (10,900 square feet) or 6.3% of total floor space. Since 2003, the total floor space has increased by 72% or 6,728 square metres.
Figure 3-16 illustrates the vacancy rate and businesses in the Courtice West Shopping District for the years 2003 and 2011.
FIGURE 3-16: NEWCASTLE VILLAGE - VACANCY RATE AND BUSINESSES – 2003 AND 2011
Newcastle Village Centre (N-1) 2003 2011 Vacancy Rate 1.1% 6.3%
Newcastle Village Centre (N-1)
2003 2011 2003 Business Still in Operation in 2011
Turnover Rate
No. of Businesses (Occupied)
46 72 23 50%
3.1.6.2 NEWCASTLE URBAN AREA – OTHER (N-2)
Outside of the Village Centre there are a limited number of retail and service floor space facilities. The RONA relocated from the Village Centre to an industrial site on Toronto Street, south of Highway 401. Total retail and service floor space outside the Village Centre in Newcastle has been estimated at 2,610 square metres (28,100 square feet), with vacant floor space estimated at 882 square metres (9,500 square feet)3
3.1.6.3 SUMMARY – NEWCASTLE URBAN AREA
. This can be compared to 1,040 square metres in 2003, with no vacant floor space recorded.
Figure 3-17 provides a comparison of the total retail and service commercial floor space in Newcastle for the years 2003 and 2011.
FIGURE 3-17: NEWCASTLE URBAN AREA, FLOOR SPACE SUMMARY, 2003 AND 2011
TOTAL FLOOR SPACE (Square Metres) Occupied Floor
Space, 2011 (m2
2003 2011 Area Sq. Metres % of
Total Sq. Metres % of
Total Newcastle Village Urban Area
N-1 - Newcastle Village Centre 9,405 90.0% 16,163 86.1% 15,151 N-2 - Newcastle Village Other 1,041 10.0% 2,610 13.9% 1,728
Grand Total 10,446 100.0% 18,773 100.0% 16,879
3 Includes vacant office/commercial space in building on Robert Street, a multi-level commercial building.

Clarington Commercial Market Analysis Update
39
3.1.7 ORONO URBAN AREA
3.1.7.1 ORONO VILLAGE CENTRE (O-1)
Stretching along Main Street, the Orono Village Centre (see Figure 3-18 for location) is a picturesque downtown with a number of street-front retail and service uses, including antique shops, restaurants, a bakery, and pharmacy. The Orono Village Centre is the focus of commercial space in Orono, serving primarily Orono and the surrounding rural community. With its unique specialty shops, it also draws in tourists.
FIGURE 3-18: ORONO URBAN AREA
Source: urbanMetrics inc. based on Microsoft Bing (Photo Credit urbanMetrics inc.)
O-1
O-2
O-3

Clarington Commercial Market Analysis Update
40
The total floor space in the Village Centre comprises 4,368 square metres (47,000 square feet) with some increase in floor space since 2003 primarily as a result of conversion of other uses.. Vacant floor space is estimated at 660 square metres (7,100 square feet), which has increased from 2003.
Figure 3-19 provides a comparison of the total retail and service commercial floor space in Orono Village Centre for the years 2003 and 2011.
FIGURE 3-19: ORONO - VACANCY RATE AND BUSINESSES – 2003 AND 2011
Orono Village Centre (O-1) 2003 2011 Vacancy Rate 3.9% 15.1%
Orono Village Centre (O-1
2003 2011 2003 Business Still in Operation in 2011
Turnover Rate
No. of Businesses (Occupied)
25 21 10 60%
3.1.7.2 ORONO NEIGHBOURHOOD CENTRE (O-2)
Located to the north of the Village Centre (see Figure 3-18), with visibility from Highway 115/35 but limited visibility from Mill Street, are a small Foodland supermarket and LCBO. Additional land is available on this site for an expansion of the centre. Total floor space comprises 1,115 square metres (12,000 square feet) and has remained unchanged in tenancy since 2003.
3.1.7.3 ORONO – OTHER (O-3)
There are a number of other retail and service uses elsewhere in the community. These include the Co-op 4
3.1.7.4 ORONO URBAN AREA – SUMMARY
located on a Highway Commercial site at the north end of Orono.
Figure 3-20 provides a comparison of the total retail and service commercial floor space in Orono for the years 2003 and 2011.
4 This store was not included in the original 2003 inventory. Considering that the store existed in 2003, it has been included in this update.
Orono Village Centre
Photo Credit urbanMetrics

Clarington Commercial Market Analysis Update
41
FIGURE 3-20: ORONO URBAN AREA, FLOOR SPACE SUMMARY, 2003 AND 2011
TOTAL FLOOR SPACE (square metres) Occupied Floor
Space, 2011 (m2
2003 2011 Area Sq. Metres % of
Total Sq. Metres % of
Total Orono Urban Area O-1 - Orono Village Centre 3,316 53.8% 4,368 49.7% 3,708 O-2 - Orono Neighbourhood Centre 1,115 18.1% 1,115 12.7% 1,115 O-3 Orono - Other 1,737 28.2% 3,308 37.6% 3,308
Grand Total 6,168 100.0% 8,791 100.0% 8,131
3.1.8 OTHER CLARINGTON
Outside the Urban Areas there are a number of commercial businesses (see below) that can be found in many of the small hamlets throughout Clarington, adjacent to the regional road network, as well as along the Highway 115/35 corridor. A large number are service based businesses, including restaurants, and are located along Highway 115/35. In total, this floor space has been estimated at 14,234 square metres (153,300 square feet) in 2011, with some increase from 20035
.
Photo Credits – Google Street View
5 Greenhouse operations and nurseries classified as “agricultural” businesses in NAICS and wholesale businesses have been excluded from the previous 2003 inventory and from the 2011 inventory.
Paddy’s Market, 2212 Taunton Road, (east of Holt Road), Hampton (Appliances)
Country Perks, 1648 Taunton Road/Enfield Road (Trulls) – NW Corner, Coffee Shop, Gifts/Novelty
Enniskillen General Store at 7851 Old Scugog Rd, Hampton
Country Market Garden Centre, 2535 Taunton Road East (east of Regional Road 57) –(Open year round – includes food, gifts, home furnishings, garden supplies)
Convenience Plaza, Old Scucog Road and Taunton Road
Taunton Tire, NE Corner, Townline Road and Taunton Road

Clarington Commercial Market Analysis Update
42
3.2 SPACE PER CAPITA
As indicated in Figure 3-21, on a floor space per capita basis, Clarington has increased from 2.08 square metres (22.4 square feet) per capita in 2003 to 2.65 square metres (28.5 square feet) per capita in 2011. Based on our knowledge of floor space levels in other communities, the floor space per capita in Clarington is considered low, particularly for NFSR floor space at 1.08 square metres (11.6 square feet) per capita in 2011. For example, Oshawa has 1.95 square metres (21 square feet) per capita of NFSR floor space and Peterborough about 2.60 square metres (28 square feet) per capita.
Clarington is located in close proximity to higher order centres (i.e. Oshawa and Whitby), which have a greater variety of retail offerings. As a result, a large portion of Clarington residents’ NFSR expenditures, and particularly for comparison goods (e.g. GAFO expenditures such as Costco, apparel, home furnishings), are being made outside of Clarington. With additional regional serving development planned in Oshawa and other Durham Region communities further west, where population thresholds already support this type of development, there will likely be a continued outflow of sales from Clarington.
FIGURE 3-21: FLOOR SPACE PER CAPITA
SUMMARY - RETAIL AND SERVICE SPACE IN CLARINGTON, 2003 and 2011Pop'n 75,500
Pop'n 89,900
Sq.Ft.2003 2011 2003 2011 2003 2011
Type Sq. Ft. Sq. Metres Sq. Ft. Sq. MetresFSR 270,200 25,093 272,100 25,271 3.6 3.0 0.33 0.28
FSR - Supermarket & Grocery 176,400 16,386 180,100 16,731 2.3 2.0 0.22 0.19 FSR: Other Food 93,800 8,707 92,000 8,540 1.2 1.0 0.12 0.09
NFSR 643,300 59,805 1,041,200 96,726 8.5 11.6 0.79 1.08 NFSR - Department Store (GAFO) 90,000 8,361 250,800 23,301 1.2 2.8 0.11 0.26 NFSR - Other General Merchandise (GAFO) 130,200 12,094 163,100 15,151 1.7 1.8 0.16 0.17 NFSR: Apparel and Accessories (GAFO) 71,300 6,624 67,300 6,252 0.9 0.7 0.09 0.07 NFSR: Home Furnishings (GAFO) 77,400 7,192 83,900 7,793 1.0 0.9 0.10 0.09 NFSR - Miscellaneous (GAFO) 113,900 10,623 151,100 14,035 1.5 1.7 0.14 0.16 NFSR - Selected Automotive (GAFO) 8,600 799 21,100 1,961 0.1 0.2 0.01 0.02 NFSR - Pharmacy & Personal Care 42,900 3,984 97,500 9,057 0.6 1.1 0.05 0.10 NFSR: Building and Outdoor Home Supply 109,000 10,128 206,400 19,176 1.4 2.3 0.13 0.21
Other Retail 21,300 1,977 26,800 2,488 0.3 0.3 0.03 0.03 Other Retail - Liquor/Beer/Wine 21,300 1,977 26,800 2,488 0.3 0.3 0.03 0.03
Selected Services 322,800 29,975 387,400 35,982 4.3 4.3 0.40 0.40 Service - Consumer Goods Rental 30,200 2,805 8,800 817 0.4 0.1 0.04 0.01 Service - Financial 34,300 3,184 53,900 5,006 0.5 0.6 0.04 0.06 Service - Personal Care 63,300 5,871 75,100 6,973 0.8 0.8 0.08 0.08 Services: Food Services & Drinking Places 195,000 18,115 249,600 23,186 2.6 2.8 0.24 0.26
Other Services 373,200 34,660 479,800 44,566 4.9 5.3 0.46 0.50 Service - Cultural, Entertainment & Recreation 63,200 5,870 86,900 8,073 0.8 1.0 0.08 0.09 Service - Health Care 126,900 11,786 173,600 16,123 1.7 1.9 0.16 0.18 Service - Insurance & Real Estate 32,200 2,992 40,400 3,754 0.4 0.4 0.04 0.04 Service - Office Administrative 10,600 984 19,000 1,764 0.1 0.2 0.01 0.02 Service - Other Financial 1,400 130 22,100 2,051 0.0 0.2 0.00 0.02 Service - Personal & Household Goods Repair 71,300 6,621 46,700 4,339 0.9 0.5 0.09 0.05 Service - Postal 2,900 270 2,800 261 0.0 0.0 0.00 0.00 Service - Professional, Scientific & Technical 48,100 4,465 53,200 4,941 0.6 0.6 0.06 0.05 Service - Social Services 2,300 214 5,500 511 0.0 0.1 0.00 0.01 Service: Selected Educational Services 14,300 1,328 29,600 2,749 0.2 0.3 0.02 0.03
Vacant 59,900 5,565 356,100 33,074 0.8 4.0 0.07 0.37 Vacant 59,900 5,565 356,100 33,074 0.8 4.0 0.07 0.37
Grand Total 1,690,700 157,075 2,563,400 238,107 22.4 28.5 2.08 2.65 VACANCY RATE 3.5% 13.9%
SOURCE: urbanMetrics inc.1) Based on the NAICS.
Sq. Ft. Per Capita Sq. Metres Per Capita

Clarington Commercial Market Analysis Update
43
3.3 OFFICIAL PLAN FLOOR SPACE TARGETS AND BUILT/PROPOSED SPACE
As a result of the 2005 Commercial Policy Review, the existing Clarington Official Plan includes floor space targets or maximum floor space allocations for Town Centres and Village Centres. It should be noted that the commercial floor space figures for the Town Centres and Village Centres found in the Official Plan (Section 10.4.3) and Secondary Plans are targets only and do not necessarily imply that there is sufficient lands to reach these targets. The capacity of existing designated lands for additional retail and service commercial uses is a function of lot size, lot coverage, densities, and other restrictions (e.g. environmental).
In Figure 3-22, the existing inventory has been compared to the Official Plan floor space targets by area, where applicable. There are proposals for additional floor space in Clarington which will further reduce the floor space allocation available (see Section 5 for details of future supply and proposed space). Except for the Clarington Centre, which based on our inventory is slightly above the Official Plan its target, the thresholds in the Official Plan have not been exceeded.
In the Bowmanville West Town Centre (BWTC), with proposed space accounted for, it is considered at capacity or close to capacity based on lot coverage and densities. Although there is a target in the Official Plan for 100,000 square metres in the BWTC, any increase in floor area beyond the 80,959 square metres (existing and proposed) will likely have to be achieved through the re-designation of additional commercial land or an intensification of floor space on existing sites. It should be noted the BWTC Secondary Plan places caps on retail and “selected” service floor space until a population of 91,000 has been reached. For retail space, the maximum floor space is 73,000 square metres and selected service space at 7,000 square metres. Currently, there are some 55,046 square metres of retail space and 4,740 square metres of selected services floor space. Excluded from these space calculations are 7,701 square metres of vacant space and 3,065 square metres of other services space (includes the Cineplex).
In the Bowmanville East Town Centre (BETC), there are limited sites available for new retail and service floor space. As such, it is highly unlikely that the target of 80,000 square metres would be reached with only 57,637 square metres of existing/proposed retail and service space (some of which includes multiple storey space). . In the Secondary Plan for the BETC, the total floor space threshold is divided into 35,000 square metres for the Downtown and 45,000 square metres for the East District. Currently, the Downtown has an estimated 24,809 square metres of retail and service floor space (including vacant space) with the East District comprising an estimated 31,924 square metres.
In summary, based on the Official Plan space targets, there is additional floor space capacity in the Town and Village Centres. The Courtice Town Centre remains undeveloped. Recognizing that many sites are already built-out (based on existing and proposed space) and given limited vacant land availability, a thorough review of each Town Centre and Village Centre will be required to determine how much vacant land or opportunity for intensification there is to not only accommodate additional floor space but also to evaluate the necessity of floor space targets in the Official Plan.

Clarington Commercial Market Analysis Update
44
3.4 NEIGHBOURING RETAIL COMPETITION (OUTSIDE CLARINGTON)
Based on consumer research conducted by urbanMetrics in the past, there is a significant outflow of retail expenditures from Clarington, and particularly to other Durham Region communities such as Oshawa and Whitby.
The neighbouring City of Oshawa captures a large portion of Clarington residents’ expenditures, and particularly for comparison goods, such as fashion items. The City of Oshawa currently has 13 supermarkets, including three east of Harmony Road: Real Canadian Superstore at Taunton Road and Harmony Road; No Frills at King Street and Townline; and a Foodland on Grandview at Bloor.
Major non-food store retail nodes in Oshawa include the Oshawa Centre, an 1.1 million square foot enclosed regional shopping centre (anchored by Sears, The Bay, Zellers) with some 157 stores/services; Taunton/Harmony, which includes Walmart and a number of large format retailers,
SUMMARY BY MAJOR STORE TYPE AND COMPARISON TO SPACE TARGETS IN OFFICIAL PLAN
EXISTING FLOOR SPACE (as of December 2011): (Square Metres)
Nodes Areas/NodesTargets -
Existing OP Total Retail
Total Selected Services Vacant Sub-Total
Total Other Services
TOTAL EXISTING
FLOOR SPACE (m2)
PLUS: Proposed
Space (m2) (as of Dec.
2011)
TOTAL, WITH
PROPOSED SPACE
OP TARGET LESS TOTAL
EXISTING AND
PROPOSED (m2)
OP TARGET LESS TOTAL
EXISTING AND PROPOSED
(Sq.ft.)Sq. Metres
BOWMANVILLE URBAN AREAB-1 Bowmanville East Town Centre - Downtown 35,000 9,120 5,563 3,419 18,102 6,707 24,809 0 24,809 10,191 109,700B-2 Bowmanville East Town Centre - East 45,000 16,702 3,500 1,179 21,381 10,543 31,924 904 32,828 12,172 131,000
Total BETC 80,000 25,822 9,063 4,598 39,483 17,250 56,733 904 57,637 22,363 240,700B-3 Bowmanville West Town Centre - i 18,600 16,622 1,991 232 18,845 269 19,114 (1 0 19,114 -514 -5,500B-4 Bowmanville West Town Centre - ii 8,000 0 0 7,469 7,469 0 7,469 (1 0 7,469 531 5,700B-5 Bowmanville West Town Centre - iii 4,000 0 650 0 650 2,796 3,446 (1 0 3,446 554 6,000B-6 Bowmanville West Town Centre - iv 18,000 9,922 1,114 0 11,036 0 11,036 (1 6,879 17,915 85 900B-7 Bowmanville West Town Centre - v 34,500 28,502 985 0 29,487 0 29,487 (1 3,528 33,015 1,485 16,000
Other BWTC (remaining O.P. Target) 16,900 0 0 0 0 0 0 0 0 16,900 181,900Total BWTC 100,000 55,046 4,740 7,701 67,487 3,065 70,552 10,407 80,959 19,041 205,000
B-8Bowmanville - Neighbourhood Centres (2 sites remaining) na 2,925 3,452 1,419 7,796 1,578 9,374 3,887 13,261 na na
B-9 Bowmanville - Other 0 Brookhill na 0 0 0 0 0 0 0 0 na na Port Darlington 1,500 0 223 167 390 0 390 0 390 1,110 11,900 Other (2 na 7,206 1,738 8,037 16,981 6,103 23,084 10,765 33,849 na naTotal Other Bowmanville 1,500 7,206 1,961 8,204 17,371 6,103 23,474 10,765 34,239 1,110 11,900TOTAL BOWMANVILLE 181,500 90,999 19,216 21,922 132,137 27,996 160,133 25,963 186,096 42,514 457,600COURTICE URBAN AREA
C-1Courtice Town Centre (13,900 sq.m.until Sec. Plan in place) (3 20,000 93 0 0 93 186 279 17,280 17,559 2,441 26,300
C-2 Courtice West Shopping District (4 30,000 7,265 5,397 3,287 15,949 6,522 22,471 2,646 25,117 4,883 52,600C-3 Courtice - Neighbourhood Centres na 1,633 2,060 2,405 6,098 1,503 7,601 0 7,601 na naC-4 Courtice - Other na 3,158 985 56 4,199 1,626 5,825 0 5,825 na na
TOTAL COURTICE 50,000 12,149 8,442 5,748 26,339 9,837 36,176 19,926 56,102 7,324 78,900NEWCASTLE VILLAGE URBAN AREA
N-1 Newcastle Village Centre 20,000 7,692 3,763 1,012 12,467 3,696 16,163 3,154 19,317 683 7,400N-2 Newcastle Village - Other na 1,078 316 882 2,276 334 2,610 0 2,610 na na
TOTAL NEWCASTLE 20,000 8,770 4,079 1,894 14,743 4,030 18,773 3,154 21,927 683 7,400ORONO VILLAGE URBAN AREA
O-1 Orono Village - Centre 7,500 2,584 697 660 3,941 427 4,368 0 4,368 3,132 33,700O-2 Orono Village - Neighbourhood Centre na 1,115 0 0 1,115 0 1,115 0 1,115 na naO-3 Orono Village - Other na 2,369 0 0 2,369 939 3,308 0 3,308 na na
TOTAL ORONO 7,500 6,068 697 660 7,425 1,366 8,791 0 8,791 3,132 33,700 Other Clarington na 6,499 3,548 2,850 12,897 1,337 14,234 0 14,234 na na
TOTAL FLOOR SPACE 259,000 124,485 35,982 33,074 193,541 44,566 238,107 49,043 287,150 53,653 577,600
SOURCE: urbanMetrics inc. 1) In the Secondary Plan, Section 4.3b) excludes "other services". In Section 4.3 c), other services are included.2) Excludes Spicer Square proposed office building. For Hartwell Drive, the total space has been included (3 storey project).3) No application has been made for proposed space, however, owner is marketing site. Assumed reduced target of 20,000 sq.metres (OP is 30,000 sq.metres).4) Includes the second floor office space in the Shoppers Drug Mart project.
FIGURE 3-22: OFFICIAL PLAN TARGETS AND BUILT SPACE/PROPOSED COMPARISON

Clarington Commercial Market Analysis Update
45
some of which have recently opened in the SmartCentres Oshawa North II project; the Oshawa Downtown/Main Central Area; the SmartCentres Stevenson Road/Highway 401 power centre node (includes a Walmart Supercentre and Lowes); and Taunton/Ritson Road area (includes a Zellers). There are eight department stores in the City of Oshawa, with a Zellers in the Kingsway Centre bordering Clarington at the corner of Townline Road and King Street. In total, there is about 297,000 square metres (3.2 million square feet)6
Additional retail floor space is proposed in Oshawa, with some expansion potential available in some existing centres including Oshawa Centre, the SmartCentres Oshawa North I and II centres at Taunton/Harmony Roads, and the SmartCentres Oshawa South centre at Stevenson/Highway 401. Other projects proposed in Oshawa include a large format retail project being developed by Rice Commercial site at the southwest corner of Adelaide Avenue East and Ritson Road North in central Oshawa. The proposed development includes a Costco Wholesale (“Costco”) warehouse membership club and a number of other smaller retail and service commercial tenants..
of non-food store retail in Oshawa with close to one-third of this floor space occupied by department store floor space.
Other major proposed retail developments in Oshawa include the Windfields Farms project. As a first phase, Riocan is proposing a 120,000 square metre (1.3 million square feet) retail centre located in the vicinity of Winchester Road and Simcoe Street in north Oshawa. The site is designated as a “Planned Commercial Centre within a Main Central Area” and permits a maximum of 200,000 square metres (2,153,000 square feet) of commercial floor space.
3.5 OFFICE FLOOR SPACE
Clarington has a number of office buildings that accommodate generally “population-related” employment and primarily health care services. In addition to office building space, office type uses are also located in converted historic homes, the historic downtowns (upper and ground floor space), and a number of retail plazas in ground floor or upper storey units.
“Major Office” employment is defined in the Hemson Development Charges Background Study as employment in free-standing office buildings that are 20,000 square feet or greater. Based on our inventory, we have identified two “major” office buildings in Clarington that comprise at total of about 7,835 square metres (84,337 square feet). Both of these buildings are medical building and are included in our retail and service space inventory:
• Courtice Health Centre at 1450 King Street East in Courtice (Courtice West Shopping District) - Located at Varcoe Rd and King Street East (Highway 2), this building opened in 1999. It is home to some 22 family physicians and an associated Urgent Care Clinic. It also provides a wide range of services including laboratory, pharmacy, diagnostic imaging, dental clinic, rehab services and a hearing centre. The total gross square footage of the building is 39,900 square feet with approximately 30,000 square feet of medical offices and 10,000 square feet of ground floor retail floor space. Excluding the common areas, there is some 33,104 square feet of leasable floor area.
6 Based on urbanMetrics in-house data and an inventory conducted in Oshawa in 2011.

Clarington Commercial Market Analysis Update
46
Courtice Health Centre (Photo Credit – Google Street View)
• Bowmanville Health Centre at 222 King St. East., Bowmanville (Bowmanville East Town Centre) - This building is located on the north-east corner of St. George Street and King Street East and comprises some 44,237 square feet, which includes an addition of some 22,763 square feet completed in 2004.
Bowmanville Health Centre (Photo Credit – Google Street View)
None of these buildings are located on sites designed “Office Commercial”. Both are located on sites designated “Mixed-Use” in the Secondary Plan.
“Office Commercial” designated sites are located in the Bowmanville West Town Centre (east and west of Regional Road 57 at Highway 2) and in the Courtice West Shopping District. The sites in the Bowmanville West Town Centre are vacant. In Courtice, the “Office Commercial” designated site is located on the northeast corner of Townline and Highway 2 and is occupied by a service station and animal hospital. The Courtice West Shopping District Secondary Plan envisions a high rise office building at this location in the future.
There is also the Bowmanville Factory, located at 182 and 185 Wellington Street just north of Downtown Bowmanville. The building is a conversion of a former factory and advertises over 20,000 square feet of floor space available for office uses. However, according to the municipality, the site is designated “Urban Residential” (also located in Special Policy Area E, a potential future redevelopment area) and zoned “General Industrial Exception” (M2-8 and M2-7 respectively) and therefore does not permit exclusive office uses.

Clarington Commercial Market Analysis Update
47
Office Space in Clarington – Accommodated in a Variety of Building Types
(Photo Credits – urbanMetrics inc. and Google Street View)
20 Robert Street, Newcastle
King Street, Courtice
200 King Street East, Bowmanville
234 King Street East, Bowmanville
King Street East @ George, Bowmanville
1 Division Street, Bowmanville
Massey Building, Newcastle (Mixed-Use ) Street-Front – Downtown Bowmanville
60 Liberty Street, Bowmanville (Medical Building)
Church Street, Bowmanville

Clarington Commercial Market Analysis Update
48
Figure 3-23, following, provides a summary of occupied office floor space in Clarington by location and type. Including health care, insurance, real estate, other financial (i.e. excluding banks), and professional/scientific/technical businesses, Clarington has an estimated 26,869 square metres (289,100 square feet) of occupied office type floor space.
As indicated in Figure 3-23, the majority of this space (59%) is in Bowmanville, with the Bowmanville East Town Centre (including the Downtown and East Business District) comprising 47.5% of the total office type floor space in Clarington. Health care space is accommodated primarily in the medical office buildings in Courtice and Bowmanville (King Street in the BETC and 60 Liberty Street).

Clarington Commercial Market Analysis Update
49
Source: urbanMetrics inc.
Area/Type Sq. Metres % of TotalBowmanville Urban Area 15,899 59.2%
Bowmanville Downtown 4,764 17.7%Service - Health Care 1,179 4.4%Service - Insurance & Real Estate 1,412 5.3%Service - Other Financial 696 2.6%Service - Professional, Scientific & Technical 1,477 5.5%
Bowmanville East District 8,007 29.8%Service - Health Care 6,595 24.5%Service - Insurance & Real Estate 223 0.8%Service - Other Financial 529 2.0%Service - Professional, Scientific & Technical 660 2.5%
Bowmanville Urban Area - Neighbourhood Centre 1,021 3.8%Service - Health Care 910 3.4%Service - Professional, Scientific & Technical 111 0.4%
Bowmanville Urban Area (Other) 1,940 7.2%Service - Health Care 1,374 5.1%Service - Insurance & Real Estate 93 0.3%Service - Professional, Scientific & Technical 473 1.8%
Bowmanville West Town Centre - i 167 0.6%Service - Health Care 167 0.6%
Courtice Urban Area 6,447 24.0%Courtice Urban Area - Neighbourhood Centre 844 3.1%
Service - Health Care 102 0.4%Service - Insurance & Real Estate 195 0.7%Service - Other Financial 204 0.8%Service - Professional, Scientific & Technical 343 1.3%
Courtice Urban Area (other) 530 2.0%Service - Health Care 288 1.1%Service - Insurance & Real Estate 242 0.9%
Courtice West Shopping District 5,073 18.9%Service - Health Care 3,744 13.9%Service - Insurance & Real Estate 967 3.6%Service - Other Financial 232 0.9%Service - Professional, Scientific & Technical 130 0.5%
Newcastle Village Urban Area 3,325 12.4%Newcastle Village Centre 3,325 12.4%
Service - Health Care 1,764 6.6%Service - Insurance & Real Estate 530 2.0%Service - Other Financial 390 1.5%Service - Professional, Scientific & Technical 641 2.4%
Orono Urban Area 985 3.7%Orono Urban Area - Other 939 3.5%
Service - Professional, Scientific & Technical 939 3.5%Orono Urban Area - Village Centre 46 0.2%
Service - Insurance & Real Estate 46 0.2%Other Clarington 213 0.8%
Darlington Township (former) 213 0.8%Service - Insurance & Real Estate 46 0.2%Service - Professional, Scientific & Technical 167 0.6%
Grand Total 26,869 100.0%
FIGURE 3-23: OFFICE FLOOR SPACE IN CLARINGTON, 2011

Clarington Commercial Market Analysis Update
50
3.6 SUMMARY
What is the current commercial situation today?
• Clarington currently (as of December 2011) has some 238,107 square metres of retail and service floor space. This represents an increase of 81,032 square metres since 2003.
• Vacant space has increased since 2003 in Clarington, with a large portion of this vacant space attributed to the vacant RONA and Canadian Tire in Bowmanville. With these two stores excluded, the average vacancy rate in Clarington is 8%, which is considered in the range typically considered normal.
• The majority (67.3%) of retail and service space is currently located in the Bowmanville Urban Area (see Figure 3-24). A significant amount of retail and service space has been added in recent years in Bowmanville, and particularly in the Bowmanville West Town Centre. This new space has included a Walmart Supercentre, Winners, Home Depot and Canadian Tire.
FIGURE 3-24: TOTAL BUILT RETAIL AND SERVICE SPACE - SERVICES LEVELS – 2003 AND 2011
• As summarized in Figure 3-25, non-food store retail (NFSR) space comprises about 41% of the retail and service space in Clarington. Bowmanville has the majority of regional serving retail space with two department stores. Food store retail represents (FSR) about 10% of the total space, with supermarkets located in all the urban areas. Service space comprises an additional 34%.
• On a commercial floor space per capita basis, Clarington is currently at 2.65 square metres (28.5 square feet) per capita. With close proximity to higher order centres, such as Oshawa, Clarington has not developed with a full range of retail and service facilities, and particularly comparison NFSR goods (e.g. apparel and home furnishings). Space per capita for FSR, at 0.28 square metres (3.0 square feet) per capita is also considered below typical ratios. However, with two new supermarkets currently planned (a FreshCo in Bowmanville and a No Frills in Newcastle), service levels will increase in the future in this category.
• Office space that has developed in Clarington can generally be categorized as “population related”. Office uses are primarily accommodated in medical office buildings (e.g. Bowmanville Health Centre and the Courtice Health Centre), retail plazas, and converted residential units.
2003 2011Sq. Metres % of Total Sq. Metres % of Total
Bowmanville Urban Area 96,236 61.3% 160,133 67.3%Courtice Urban Area 31,404 20.0% 36,176 15.2%Newcastle Village Urban Area 10,446 6.7% 18,773 7.9%Orono Urban Area 6,168 3.9% 8,791 3.7%Other Clarington 12,821 8.2% 14,234 6.0%TOTAL CLARINGTON (sq.metres) 157,075 100.0% 238,107 100.0%
SOURCE: urbanMetrics inc.

Clarington Commercial Market Analysis Update
51
FIGURE 3-25: SERVICE LEVELS BY STORE TYPE AND LOCATION, 2003 AND 2011
How close has development come to achieving the projections/expectations established in the 2005 Commercial Policy Review?
• The 2005 Commercial Policy Review resulted in the addition of various floor space targets in the Official Plan and Secondary Plans for the Town Centres and Village Centres. The majority of proposed space accounted for in the 2005 Commercial Policy Review has now been developed, except for the Torgan site in Bowmanville and the Courtice Town Centre. The Loblaws never
Column Labels2003 2011
Type Sq.Metres % of Total Sq.Metres % of TotalFSR 25,093 16.0% 25,271 10.6%
Bowmanville Urban Area 13,699 8.7% 14,100 5.9%Courtice Urban Area 4,282 2.7% 4,857 2.0%Newcastle Village Urban Area 3,093 2.0% 3,400 1.4%Orono Urban Area 1,216 0.8% 1,254 0.5%Other Clarington 2,803 1.8% 1,660 0.7%
NFSR 59,805 38.1% 96,726 40.6%Bowmanville Urban Area 42,341 27.0% 75,404 31.7%Courtice Urban Area 9,401 6.0% 7,292 3.1%Newcastle Village Urban Area 2,127 1.4% 4,971 2.1%Orono Urban Area 2,974 1.9% 4,489 1.9%Other Clarington 2,962 1.9% 4,570 1.9%
Other Retail 1,977 1.3% 2,488 1.0%Bowmanville Urban Area 1,086 0.7% 1,495 0.6%Newcastle Village Urban Area 297 0.2% 399 0.2%Orono Urban Area 325 0.2% 325 0.1%Other Clarington 269 0.2% 269 0.1%
Other Services 34,660 22.1% 44,566 18.7%Bowmanville Urban Area 21,324 13.6% 27,996 11.8%Courtice Urban Area 7,626 4.9% 9,837 4.1%Newcastle Village Urban Area 2,331 1.5% 4,030 1.7%Orono Urban Area 576 0.4% 1,366 0.6%Other Clarington 2,803 1.8% 1,337 0.6%
Selected Services 29,975 19.1% 35,982 15.1%Bowmanville Urban Area 15,491 9.9% 19,216 8.1%Courtice Urban Area 8,069 5.1% 8,442 3.5%Newcastle Village Urban Area 2,496 1.6% 4,079 1.7%Orono Urban Area 947 0.6% 697 0.3%Other Clarington 2,972 1.9% 3,548 1.5%
Vacant 5,565 3.5% 33,074 13.9%Bowmanville Urban Area 2,295 1.5% 21,922 9.2%Courtice Urban Area 2,026 1.3% 5,748 2.4%Newcastle Village Urban Area 102 0.1% 1,894 0.8%Orono Urban Area 130 0.1% 660 0.3%Other Clarington 1,012 0.6% 2,850 1.2%
Grand Total 157,075 100.0% 238,107 100.0%
FSR - Food Store Retail; NFSR - Non-Food Store Retail
Other Retail - Liquor/Beer/Wine stores

Clarington Commercial Market Analysis Update
52
relocated beside the Walmart, with Canadian Tire instead moving across the street to a larger store. The 2005 Commercial Policy Review was based on the assumption that some 660,000 square feet of non-food store retail floor space would be developed in Clarington by 2010. This space included the Walmart, two home improvement centres, and other “department store type merchandise” or other non-food store retail floor space. In comparison, since 2003, about 400,000 square feet or 36,921 square metres of non-food store retail floor space has been added in Clarington, plus the RONA on the Torgan site (which is now vacant).
• For the Bowmanville West Town Centre, the floor space allocations in Section 4.3c) of the Secondary Plan have approached or are approaching target for each of the five sub-areas (i) to (v). Some additional space is planned, which will result in almost a total build out of this area. The Courtice Town Centre remains undeveloped. Including existing and proposed space, Newcastle Village is approaching the floor space target of 20,000 square metres, and has seen some development in recent years. Neither the Orono Village Centre nor Bowmanville East Town Centre have reached the floor space targets in the Official Plan.
• Based on the Official Plan space targets, there is additional floor space capacity on designated commercial sites in all of the Urban Areas for new retail and service floor space. However, recognizing that many sites are already built-out (based on existing and proposed space), a thorough review of each Town Centre, Village Centre and Neighbourhood Centre will be required to determine how much vacant land or opportunity for intensification there is to not only accommodate additional floor space but also to evaluate the necessity of floor space targets in the Official Plan.

Clarington Commercial Market Analysis Update
53
4 WHAT TRENDS SHOULD WE ANTICIPATE?
How we plan, structure and regulate retail trade … has large effects not only on economic efficiency and consumer satisfaction but on the quality of life and the maintenance of a vital public sphere.7
The retail industry and retail development in North America is continually evolving, adapting and finding new ways to attract and excite the customer. There is an “out with the old” movement to create better settings (i.e. image and style) for people activity by creating mixed-use nodes that embrace community connections, street life and provide integrated activity.
Although big box retailers continue to dominate commercial development in Canada, they are evolving to meet the needs of consumers and emerging planning and urban design policies. A cycle can also be observed in which formats that are filling a market niche thrive, reach the peak of their popularity and success and then lose their position and are superseded and replaced by others. Outlet centres and a wave of retailers looking to set up shop in Canada are hot topics in the retail industry today.
Power centres, the new format trend that emerged in the early 1990’s in Canada, continue to enhance their tenant selections and design standards, while traditional enclosed malls are being challenged to remain relevant by expanding, re-tenanting and repositioning their properties to maintain their competitiveness. With the arrival of more retailers from the US and abroad, as well as new centre formats, including outlet centres, the evolution continues. Developers are also starting to build more innovative retail and mixed use projects that provide for better pedestrian and transit connectivity and improved design standards that have been missing in the first generation of power centres.
In this section we discuss some of the more prevalent trends in the retail industry and built form, including:
Power Centres and Large Format Retailers
The Broadening of Shopping Centre Merchandising
Lifestyle Centres and Hybrid Mixed-Use Centres
New Urbanism
Outlet Centres
Influx of U.S. Retailers to Canada
Blurring of the Retail Hierarchy
Non-store shopping
7 Graeme Davison, From the Market to the Mall, 2006, p.1

Clarington Commercial Market Analysis Update
54
4.1 POWER CENTRES AND LARGE FORMAT RETAILERS
Some of the most sweeping changes over the past two decades have been the transition of the shopping centre industry with the evolution of the “power centre” and the addition of new format retailers. Clarington has not been immune to this trend with the recent addition of Walmart Supercentre and Home Depot in Bowmanville.
New format retailers and power centres have accounted for the greatest portion of new retail floor space since the early 1990s. They have not only absorbed most new market growth, but in some communities they are cutting into the markets of existing traditional regional centres, particularly with the inclusion of more fashion retailers, as well as downtowns . In some markets, they are also fulfilling the role of a traditional regional centre where none exist.
Large format retailers have typically followed three locational models:
• Low cost locations on industrial designated lands or commercial designated greenfield sites that provide for expansive parking areas and regional accessibility;
• Brownfield industrial land conversions, whereby older industrial sites are transformed into retail power centres, hybrids and mixed-use developments; and
• Clustering around existing shopping centres and/or existing power centres, which is typically accomplished through both redevelopment and greenfield development and results in regional or super regional retail clusters (e.g. Bowmanville West Town Centre).
Traditionally, “big box” stores fell largely into two categories: 1) those focused on using their sizes to achieve cost savings to the consumer (e.g. Costco); and 2) those that used their scale to provide the maximum assortment of styles, brands and merchandise within a single category (e.g. Golf Town, Indigo/Chapters, Home Depot, PetSmart, Staples). Over the past decade, due to competitive pressures, a greater variety of retailers have developed ‘big box’ or larger retail formats. Supermarkets and drug stores, for example, are seeking the same locations as power centres. Now these stores are becoming significantly larger, relying on a broader population base. Some retailers are now changing from a strategy of multiple outlets serving local neighbourhoods to much fewer regional serving operations. In some communities, this has had an impact on small and mid-sized community shopping centres.
As some retailers look to “up size”, there is also a recent downsizing trend by many large format retailers, and particularly in the U.S. The “bigger is better” philosophy is being re-evaluated by many national chains due to changing customer expectations, online shopping, and an operational trend to “lean retail”. Smaller stores allow retailers to go into locations that they previously could not consider. These locations often can provide increased accessibility to the customer, reduced building costs and a more focused product offering with a more efficient use of floor space. In the U.S., Walmart, whose Supercentres typically encompass over 185,000 square feet, has announced plans to build a number of 30,000 to 60,000 square foot stores. Target is also planning smaller format stores in the US that will be 60,000 to 100,000 square feet, compared with 135,000 square feet in a traditional Target. US electronics retailer Best Buy has also announced that it will be reducing its standard store footprint by 20% in the US.

Clarington Commercial Market Analysis Update
55
4.2 THE BROADENING OF SHOPPING CENTRE MERCHANDISING
The wave of power centre development is having a profound impact on the shopping centre industry, both indirectly and directly. Indirectly, the arrival in Canada of Walmart (in 1994) and the big box specialty sector have been rapidly eroding the market shares once attributable to the traditional department store sector. The newly introduced Walmart Supercentre, with its large food component, is also having an impact on supermarket retailers. The Target department store chain, which is set to arrive in Canada by 2013, taking over the majority of Zellers leases (including the one in Clarington)/ Target initially will only have a small food component (i.e. pantry).
With the increasing movement of apparel retailers to power centres and the attraction of big box tenants to traditional shopping centres, there is a growing competitive overlap between these two retail forms, not only for new shoppers but also for the same tenants.
4.3 NEW DEVELOPMENT FORMATS
As an alternative to the power centre, which has been criticized for not adapting to non-automobile trips and lacking the aesthetic form and appeal required to attract the more upscale market segment, some development companies are turning to so-called “lifestyle centres”, and mixed-use hybrids, including “main-street” retailing, to create community places. Open-air and enclosed outlet type centres are also emerging and planned in Canada, marketed as destination locations for value seeking customers.
4.3.1 LIFESTYLE AND HYBRID CENTRES
“Lifestyle centres” have been operating in the United States for about three decades, however, what constitutes a lifestyle centre is often considered a difficult question to answer as more are built and the format evolves to fit different market needs. Not only has the size of “lifestyle centres” changed over the years, but also their design and tenant mix. The term “lifestyle centre” is now being referred to as a “catch all term” for a number of diverse mixed-use projects across North America.
The International Council of Shopping Centers (ICSC) defines a lifestyle centre as follows:
Most often located near affluent residential neighborhoods, this centre type caters to the retail needs and “lifestyle” pursuits of consumers in its trading area. It has an open air configuration and typically includes at least 50,000 square feet of retail space (GLA) occupied by chain specialty stores. (The whole centre may range from 150,000 to 500,000 square feet.) Other elements differentiate the lifestyle centre role as a multi-purpose leisure-time destination, including restaurants, specialty food stores, entertainment, and design ambience and amenities such as fountains and street furniture that are conducive to casual browsing. It may be anchored by a large-format specialty store, a smaller version of a “big box” store and/or entertainment venues such as cinemas. The primary trade area is ten to twenty kilometers.
Lifestyle centres are aiming to strike a balance between the mall shopping experience and the need for big box specialty tenants to create a regional draw. To differentiate lifestyle centres from typical power centres, developers have used theming, internal pedestrian connections, high quality design,

Clarington Commercial Market Analysis Update
56
and entertainment. Often, the lifestyle centre tries to mimic a “Main Street” to create a “street culture” and the provision of public space.
Industry experts have often questioned why the lifestyle centre concept has been slow to emerge in Canada. As indicated in a publication by the Centre for the Study of Commercial Activity (CSCA)8
The cold climate through the long-winter means shoppers will not want to walk around a lifestyle streetscape with an open-air configuration;
lifestyle developments in Canada have been minimal due to a few significant differences between the Canadian and American marketplace, including:
The lack of upscale suburban neighbourhoods, and therefore the lack of interest on the part of upscale retailers to enter or expand within the Canadian marketplace; and,
The comparative conservatism of Canadian retail development compared to south of the border, which has created reluctance to enter into a perceived higher risk development.
The CSCA indicates, however, that open-air centres in the form of power centres have been successful in Canada based on their widespread growth, indicating that Canadians are more “hardy” when it comes to dealing with cold temperatures. In the U.S., the cold climate has not had an impact as there are numerous open-air lifestyle centres that have been developed in the northern snowbelt region with design and technology to offer shelter from the elements. In response to the issue of the lack of “upscale” neighbourhoods in Canada, the CSCA indicates that, “unlike the US, Canada has not witnessed the same degree of suburbanization of affluence; instead Canadian suburbs are immersed in the “middle-ground”, making it harder to identify markets for lifestyle type developments.
Despite the fact that lifestyle type centres have been slow to emerge in Canada, there is increased impetus to develop new alternative types of retail space or new formats, including shopping centre hybrids that combine predominant elements from two or more distinct traditional and/or specialty shopping centre types, e.g. power centre, regional mall and lifestyle centres. The CSCA indicates that the traditional power centre has entered the mature stage of its lifecycle and that consumers are fatigued with the concept.
In Canada, mixed-use hybrid forms of retail development with so-called “lifestyle” components include Quartier DIX30, one of the largest “lifestyle” centres in Canada located in Brossard, Québec. At full build-out, the project is expected to include 2.4 million square feet and attract 21.7 million visitors annually. Other examples of lifestyle centres include The Shops at Morgan Crossing in Surrey, British Columbia.
8 T. Hernandez, Lifestyle Centres in Canada, 2007, CSCA (Ryerson)

Clarington Commercial Market Analysis Update
57
Lifestyle Centre - The Shops at Morgan Crossing, Surrey, BC (Photo Credit – Morgan Crossing)
In addition to new centres, existing shopping centres are re-inventing themselves with the addition of new “lifestyle-focused” floor space. As indicated by the CSCA, in some cases, the new format centres can be considered as “more sophisticated power centres with design features to soften the function and form of the centres”.
4.3.2 NEW URBANISM
The Province’s smart growth and Places to Grow initiatives are encouraging the replacement of the traditional suburban model of separation of land uses by one that provides for complete communities. This has been inspired by the concept of “new urbanism”, which emerged during the 1980s in the U.S., in a counter-reaction to urban sprawl. In Canada, the smart growth and the new urbanist movement have inspired suburban development since the 1990s. This approach in community planning, with a focus on the interface with the public domain, is envisioned for Bowmanville’s future Brookhill community.
The new urbanism approach has resulted in a renewed focus on town centre and pedestrian focused “main street” retailing in new community developments. The concept of a “complete community” is the vision for new urbanism projects. The town centre is usually seen as the focal point for residential and employment development creating an environment where people can live, work and shop. In some new communities, town centres are developed in an open air, pedestrian friendly format, combining commercial, entertainment, institutional and civic uses. Sidewalk cafes, live-work units, public squares and recreation trails are incorporated to introduce humanizing elements into the suburban landscape.

Clarington Commercial Market Analysis Update
58
Examples of new urbanism developments in Ontario include Cornell, located in Markham, and Oak Park in north Oakville. Both of these areas continue to evolve. Although new urbanism creates the look of a community, there are critics that argue that it does not build the real thing as residents are still chained to their cars for shopping and employment. Furthermore, the retail and employment ambitions envisioned in the planning of the new urbanism communities are not always realized in practice. Many shops on main-street locations in new urbanism projects cannot survive on the population within walking distance and therefore, it is important that street-front retail and service space have exposure to pass-by traffic and be on a major corridor. In Cornell, there is a “Town Centre” that has evolved to include primarily health services given its close proximity to Markham Stouffville Hospital. Further east of the Town Centre, a commercial spine has evolved along Bur Oak Drive with street-front, live-work units that include a range of primarily local serving retail and service uses.
4.3.3 OUTLET CENTRES
The U.S. style outlet centre is set to launch in Canada. Outlet centres are considered “a specialized type of retail development having tenant, consumer, and market area characteristics that differ from conventional shopping centres”9
This specific purpose-built centre type consists of separate manufacturers’ and retailers’ outlet stores selling their brand-name goods at discounted prices, typically selling surplus stock, prior-season or slow selling merchandise and especially designer merchandise. These centres are generally not anchored, although certain brand-name stores may serve as “magnet” tenants. Outlet centres can be either open-air or enclosed and are between 50,000 to 400,000 square feet (GLA) in most cases. The primary trade area is twenty to fifty kilometres.
. The International Council of Shopping Centres (ICSC) defines a Canadian outlet centre as follows:
Value Retail News, a publication produced by ICSC, further refines the standard ICSC definition of an outlet centre as one in which at least 50% of the tenants are outlet retailers.
9 International Council of Shopping Centres – Canadian Shopping Centre Definitions
Bur Oak Live-Work – Cornell, Markham (Photo Credit – Google Street View)

Clarington Commercial Market Analysis Update
59
Historically, outlet centres in the US generally developed adjacent to major highways, often removed from major cities in rural areas to avoid direct competition with the retailers who carry the manufacturer’s products. With the US development boom in the 1990’s, outlet centre development moved closer to major metropolitan areas encroaching on traditional regional malls and the department store and fashion retailer trade areas. Others have located in high-traffic tourist destinations. In all cases, these outlet centres are considered destinations for the value-seeking consumer.
Tanger, who has been developing outlet centres for some 30 years in the US, has a set of guidelines they follow in evaluating opportunities for the development of new outlet centres (typically 90 stores with about 350,000 square feet). These guidelines, as indicated in Tanger’s 2010 Form 10-K report, typically include seeking locations within markets that have at least 1 million people residing within a 50 to 60 kilometre radius with an average household income of at least $65,000 per year, frontage on a major interstate or roadway that has excellent visibility, and a traffic count of at least 55,000 cars per day. Leading tourist, vacation and resort markets that may not have the local population base and that receive at least 5 million visitors annually are also closely evaluated.
In Ontario, small outlet centres (i.e. less than 250,000 square feet) have developed primarily in high-traffic tourist destinations (e.g. St. Jacobs, Niagara Falls) or in locations with good highway access on a well travelled route (e.g. Cookstown). In Ontario, the first outlet centre in St. Jacobs opened in 1994. Only one new outlet centre has been developed over the past 10 years. In total, there are currently seven outlet centres, including Dixie Outlet Mall which includes a mix of outlet retailers, off-price retailers, and large format stores.
In Canada, unlike in the US, the outlet centre concept has been slow to emerge and has focused on the Ontario and Quebec markets. In Ontario, a number of new outlet centres are planned, including the expansion of existing outlet centres (e.g. Cookstown Outlet Mall). Most of the existing new retail development formats in Canada, such as power centres, have been modeled after the US experience. The new outlet centres planned in Canada are expected to follow US trends and be similar in format to the new open-air US centres. The majority of the tenants in the new Canadian outlet centres are also expected to be U.S. based tenants new to the Canadian market.
In 2011, RioCan Real Estate Investment Trust ("RioCan") and Tanger Factory Outlet Centers, Inc. ("Tanger"), through their exclusive joint venture, are planning on building a number of Tanger Outlet Centres in Canada and the GTA. According to ICSC information, the tenant mix for the Tanger centres will be focused on leading designer and brand-name manufacturers. American brands will make up about 80% of the tenants at the centre, and the balance will be Canadian. Simon’s Property Group and Calloway Real Estate Investment Trust have also teamed up to develop a number of Premium Outlet Centres in Canada. Other outlet centres planned include a 700,000 square foot centre in Niagara-on-the-Lake to be developed by Ivanhoe Cambridge.
The concept, design and merchandising of both the Tanger and Premium Ontario outlet centres will be similar to those developed in the United States. The centres are expected to include about 350,000 square feet of branded factory outlet retailers from the United States and Canada offering consumers a unique opportunity to purchase merchandise directly from leading designer and brand name manufacturers at a substantial savings.

Clarington Commercial Market Analysis Update
60
4.4 FOREIGN RETAILERS – THE US INVASION
The American retail invasion continues. Canada is in the midst of a large wave of U.S. retailers looking to set up shop here, joining recent arrivals such as Crate & Barrel, Marshalls, J. Crew and Victoria Secret. With the recent announcement of Target’s arrival in Canada, set to open 135 stores by 2013 through the acquisition of Zellers leases, the trend is expected to accelerate. Target will be taking over the Zellers lease in Clarington Centre. Target has also acquired the lease for the Kingsway Village Zellers, located in Oshawa on the border of Clarington, although it is not known if this location will become a Target. It is expected that the Zellers stores will close for 6 to 9 months for renovations. Of the first 24 stores recently announced as opening in 2013, two are located in Durham Region (Whitby - Taunton Road Power Centre, and Ajax – Durham Centre).
With their own economy stagnant, several other US retailers are also evaluating opportunities in Canada. Analysts are predicting that a number of U.S. retailers, including Dick’s Sporting Goods, Macy’s, Nordstrom, Kohl’s and JC Penny, are also on their way. For U.S. retailers, Canada is considered the perfect test market and represents a logical next move now that the economic conditions in Canadian are favourable. Canada’s mainly English–speaking population, its close proximity to existing supply chains, and the fact that consumers already know U.S brands, have lured U.S. interests. Some U.S. retailers are looking for opportunities to enter the Canadian market quickly and easily through acquisition (as has been the case with Target, Walmart) rather than a store-by-store expansion. Although most U.S. retailers entering Canada have been successful (e.g. Costco, Home Depot), the most notable casualty was Sam’s Club, which had a five year run in Canada but could not compete with Costco who ramped up their expansion plans and were already established in the Canadian market.
The arrival of U.S. retailers will result in more choices for Canadian consumers and for shopping centre developers, however, the increased competition could impact some Canadian retailers who no doubt will need to re-examine their business strategies to survive and thrive. Canadian retailers are already preparing for the arrival of Target. Canadian Tire is ramping up their marketing campaign with their “Bring it On” slogan and like other retailers, including Walmart, are investing in new locations and renovating existing stores to establish market position.
It should also be noted that in addition to the influx of US and other foreign retailers to Canada, there are a number of major Canadian owned stores that also have expansion plans that will increase competition. Examples include:
• La Maison Simons, a major Quebec-based fashion retailer is planning on opening 12 stores in English Canada in the future, including locations in the Toronto market in the 100,000 square foot +/- range.
• SAIL, another Quebec-based outdoors superstore with stores in the 70,000 square foot range (recently opened 2 stores in Ontario, including one in Oshawa).

Clarington Commercial Market Analysis Update
61
4.5 BLURRING OF THE RETAIL HIERARCHY
The traditional retail hierarchy evolved from Walter Christaller’s “central place theory” in 1930 which relied on the concepts of threshold and range. The result was a system of centres of various sizes that emerged with each centre supplying particular types of goods forming levels of a hierarchy. This hierarchy is evident in Durham Region and Clarington. In municipalities across Canada, however, there is a blurring of the traditional retail hierarchy. The retail hierarchy is being undermined by a number of factors, including changes in consumer wants/needs, and the fact that people are less constrained to shop near their home. The gradual progression of changes in retail formats has also altered the role and function of existing and planned commercial areas and the retail hierarchy.
Although distance travelled is still an important factor in a person’s decision of where to shop, people will travel further to shop at a centre which fulfils their needs and entertains them. Consumers do not necessarily have an unbridled loyalty to a local centre or specific store when they shop. In today’s mobile society, people can and will drive to more distant locations if they perceive that they will benefit from lower prices, better product selection and a great choice of merchandise. This results in a breakdown of the traditional retail hierarchy where people would go to their nearest store. The fact that shopping is also increasingly more of a leisure activity and not a necessity also undermines the retail hierarchy. Shopping centres, particularly in the middle ranges of the hierarchy (i.e. community and neighbourhood scale shopping areas) are also finding it increasingly difficult to compete with power centres and big box retailers.
4.6 NON-STORE RETAILING
With the birth of the Internet in 1993 came E-commerce or on-line shopping from the comfort of your home. For Canadian consumers, the value of internet shopping comprised $15 billion in 2009, compared to almost $8 billion in 2005. Although E-commerce continues to grow, it still represents only a small portion of total retail trade ($415 million in 2009 in Canada). It is expected that as younger, Internet-savvy customers mature and Internet-usage becomes more widespread over time among consumers of all ages, E-commerce will become increasingly relevant. However, it will not replace shopping in stores – people will continue to see shopping in stores as an enjoyable social event. According to a Statistics Canada survey, the most common types of online purchases continue to be in travel services; entertainment products such as concert tickets; books and magazines; and clothing, jewellery and accessories.
CBD
Regional/Super-Regional Shopping Centres and Power
Centres
Secondary/Community Centres
Neighbourhood Centres
Corner Shops/Convenience Centres
Higher order (comparison goods, specialty shops
Lower Order –Convenience goods
Middle Order–Comparison and Convenience goods
ShoppingCentreHierarchy
FIGURE 4-1: SHOPPING CENTRE HIERARCHY

Clarington Commercial Market Analysis Update
62
Statistics Canada indicates that the Internet has become a supplement to traditional retail shopping more than a substitute for many Canadians. Many “brick and mortar” stores also now provide on-line shopping.
In 2009, Statistics Canada data indicates that 52% of Canadians went online to "window shop," that is, to research or browse products, up from 43% in 2007. Among all window shoppers in 2009, 69% reported subsequently making a purchase directly from a store, up from 64% in 2007. The Internet complements traditional retail for certain categories such as consumer electronics (cameras and DVD players), appliances and furniture, as well as clothing, jewellery and accessories. The “window” shoppers are typically those that also refrain from buying online due to security and privacy concerns or the inability to touch and feel products.
In addition to Internet shopping, home shopping through catalogues continues to expand. There are hundreds of companies, many of which are USA based, which provide catalogues for telephone or on-line shopping (e.g. LL Bean, Lands End, Avon, Sears). Canada Post is promoting “Borderfree” for barrier-free and hassle free shopping by partnering with international companies in an effort to simplify shipping procedures. Most of these companies have catalogues.
Furthermore, it is likely that increased access to digital television will lead to more purchases being made through interactive systems.
4.7 SUMMARY
The retail industry and its built form are dynamic – evolving and changing to consumer preferences, lifestyles and new innovations. Based on our research, the retail landscape is expected to continue to evolve with the addition of outlet centres and the integration of power centres, malls and lifestyle centres into hybrid mixed-use developments that will be differentiated from each other to some extent through style, architecture and the needs of the community.
The principles of new urbanism, sustainability and the focus on public spaces will also continue to influence retail development in the future, while better accommodating changing market conditions. The architecture and design of retail floor space will no doubt continue to evolve with the creation of more meaningful and memorable spaces that have a feeling of community or sense of place.
Although the potential for widespread development of the more traditional lifestyle centres found in the US is unlikely to occur in Canada, there will be more developments which incorporate lifestyle components, including redevelopment of existing shopping centres/power centres, the addition of more design elements, including “main-street” and town centre initiatives, and the combination of mixed-uses (i.e. retail, office, residential) recognizing trends for new urbanism and smart growth initiatives. Larger outlet centres, for the value seeking consumer, are also expected to emerge in Canada, including the Toronto area.
The shifting age cohorts are expected to fuel future changes in the retail landscape. As the large “Baby Boom” generation ages, it is expected that opportunities for more niche lifestyle developments will emerge. As indicated by the CSCA, the mass middle-ground consumer may start to expect more from their traditional power centre shopping experience, which is already evident in the increased addition of fashion and restaurant tenants in power centres and hybrid lifestyle centres.

Clarington Commercial Market Analysis Update
63
The demand for developers to create unique formats and to satisfy the needs of consumers with unique tenants is having a positive impact on the retail landscape. Retailers are introducing additional concepts in order to remain competitive in the marketplace. With a wave of U.S. retailers expected to launch in Canada, the retail landscape will continue to evolve.
Whether it is mixed-use lifestyle or town centre developments with walkable environments, reintegrating retail floor space into downtowns (i.e. the evolution from suburban to urban), or redeveloping obsolete projects as more innovative ones emerge, densification and mixed-use development is definitely the next wave of retail development that supports the smart growth/complete community model underlying community planning today.
The Growth Plan for the Greater Golden Horseshoe, which includes Clarington, embraces the need for mixed-use development and strengthening core areas. The Growth Plan aims to, among other things, revitalize downtowns into vibrant and convenient centres, and to create complete communities that offer more options for living, working, shopping and playing.
Given the trends and provincial Growth Plan policies, there is the potential or future opportunity for commercial centres/nodes in Clarington to combine retail with office, residential, and community uses to the benefit of the neighbourhood and community. Neighbourhood retailing, in particular, is considered important for providing everyday goods and services to residents as well as for providing a sense of place and contributing to complete communities.
The traditional suburban model, which has occurred in suburban areas, separated where people live from where they work and shop (see Figure 4-2). This pattern of growth, often referred to as “urban sprawl”, is seen as resulting in an increased need for automobile travel and contributes to higher energy consumption, declining air quality, and negative impacts on human health.10
As such, it will be important for Clarington to provide appropriate strategies to accommodate both new multi-purpose retail centres and the redevelopment of existing commercial centres and districts into mixed-use nodes. These nodes should be created with the pedestrian in mind and include the creation of public gathering places, the integration of housing and employment uses where appropriate, and the creation of more complete communities in order to achieve a more balanced approach to growth.
Source: urbanMetrics inc.
10 Environmental Health Committee, Ontario College of Family Physicians, Report on Public Health and Urban Sprawl in Ontario, January 2005.
LIVE WORK
SHOP
LIVE WORK
SHOP
Traditional Suburban Model
Smart Growth/Complete Community Model
FIGURE 4-2: THE MOVE TOWARDS INTEGRATED COMPLETE
COMMUNITIES

This page intentionally left blank

Clarington Commercial Market Analysis Update
64
5 WHERE ARE WE HEADED? – MARKET PARAMETERS
In order to estimate future commercial floor space needs, it is necessary to also have an understanding of various market parameters. In this section, the following information has been obtained and reviewed:
o Population and the geographical distribution of the population growth o Per Capita Income levels based on the 2006 Census o Place of Work/Commuting flows o Employment projections for Clarington/Urban Areas o Economic growth opportunities o Future supply, including proposed floor space and vacant commercial land supply
5.1 POPULATION
Population growth represents a major factor that can significantly influence the level of future commercial floor space warranted in a market. Population growth is influenced by economic conditions and the availability of land for development, as well as other factors, such as quality of life amenities.
To determine future commercial floor space needs in Clarington, an estimate of the future resident population is required. Our analysis relies on the Hemson, Clarington Community Forecast, Population and Employment Projections (March 10, 2010). The Hemson population forecast is referred to as a “base case” Scenario 1 estimate that considers how growth would have occurred in the absence of the Growth Plan for the Greater Golden Horseshoe. It is a growth forecast reflecting Durham Region and local Municipal policies seeking development of a more urban character and greater levels of intensification.
For the purpose of our analysis, the year 2011 is used as the base year which coincides with the date of the inventory of retail and service floor space. The population includes an estimate of net undercoverage in the census.11
In the base year 2011, it is estimated that the Clarington population approximates 89,800 persons. As detailed in Figure 5-1, the major concentrations of population are in the Urban Areas, with the Bowmanville and Courtice Urban Areas comprising the majority. Bowmanville’s share of Clarington’s population, currently estimated at 41%, is expected to increase in the future with a corresponding decline in the share of the population found in the Courtice Urban Area and other areas of Clarington (see Figure 5-2). An increase in the Newcastle share is expected.
Based on the Hemson forecasts, Clarington is expected to increase to 140,400 persons by 2031. This represents a growth of 50,600 persons over the next 20 years, with the Bowmanville Urban Area share of this growth estimated at 29,700 or 59%.
11 Note: the 2011 Census was not available at the time this report was prepared.

Clarington Commercial Market Analysis Update
65
FIGURE 5-1: CLARINGTON POPULATION - HEMSON FORECASTS
FIGURE 5-2: DISTRIBUTION OF POPULATION BY AREA
MUNICIPALITY OF CLARINGTON, POPULATION - 2006 to 2031
2006 2011 2016 2021 2026 2031Bowmanville Population 31,600 36,700 42,900 50,400 58,300 66,400 Period Growth 5,100 6,200 7,500 7,900 8,100 Average Annual 1,020 1,240 1,500 1,580 1,620
CourticePopulation 23,200 24,500 26,700 29,300 32,200 35,000 Period Growth 1,300 2,200 2,600 2,900 2,800 Average Annual 260 440 520 580 560
NewcastlePopulation 8,900 11,100 13,600 16,500 19,100 20,900 Period Growth 2,200 2,500 2,900 2,600 1,800 Average Annual 440 500 580 520 360
Rural (including Orono)Population 17,200 17,500 17,600 17,800 18,000 18,100 Period Growth 300 100 200 200 100 Average Annual 60 20 40 40 20
TOTAL, ClaringtonPopulation 80,900 89,800 100,800 114,000 127,600 140,400 Period Growth 8,900 11,000 13,200 13,600 12,800 Average Annual 1,780 2,200 2,640 2,720 2,560
SOURCE: urbanMetrics inc.,1) Hemson Consulting Ltd., Clarington Community Forecast, Population and Employment Projections, March 10, 2010(Table 6). Includes net undercoverage adjustment in Census.
41% 43% 44% 46% 47%
27% 26% 26% 25% 25%
12% 13% 14% 15% 15%19% 17% 16% 14% 13%
0%
10%
20%
30%
40%
50%
60%
70%
80%
90%
100%
2011 2016 2021 2026 2031
Clarington - Forecast Distribution of Population (Hemson)
Bowmanville Courtice Newcastle Rural

Clarington Commercial Market Analysis Update
66
It should be noted that the Hemson forecasts for 2011 and 2016, as utilized in Figure 5-1, are somewhat higher than the short-term forecasts prepared by Durham Region (Report 2011-P-65), which have been detailed in Figure 5-3. For 2011, the difference between the Hemson forecast and the Region’s is 3,035 persons, with the gap increasing to 5,500 more in 2016. For the purposes of our market analysis, the Hemson forecasts have been utilized as these are the forecasts being utilized in the Official Plan Review. Considering that our market analysis is based on population growth, our estimates of future warranted retail and service floor space calculations could therefore be considered conservative over the long term.
FIGURE 5-3: DURHAM REGION SHORT TERM POPULATION ESTIMATES
5.1.1 PER CAPITA INCOME
In addition to population growth, local income levels can influence future commercial floor space potential. Based on the results of the 2006 Census, the average per capita income level for Clarington is about 2% above the provincial level. In 2001, Clarington’s per capita income level was below the provincial level by about 0.5%.
5.1.2 PLACE OF WORK/COMMUTING FLOWS
Commuting patterns can impact where shopping for retail goods and services is undertaken and the extent of market support for retail and service commercial facilities in a community.
Clarington is the most easterly municipality in Durham Region and the Greater Toronto Area. It is a significant exporter of labour and can be considered a “bedroom community” with fewer jobs available then the resident labour force. As indicated in Figure 5-4, only 24% of Clarington’s labour force (fixed place of work only) work in Clarington. Other communities in Durham Region capture about 50%, with Oshawa at 28%.
DURHAM REGION POPULATION ESTIMATES - CLARINGTON AND DURHAM REGION
Year Clarington Growth DURHAM REGION Growth
Clarington Share of Durham Population
2006 (May) 80,990 584,360 13.9%2011 (May) 86,765 5,775 622,860 38,500 13.9%2012 (May) 88,300 1,535 630,000 7,140 14.0%2013 (May) 90,000 1,700 637,500 7,500 14.1%2014 (May) 91,700 1,700 646,100 8,600 14.2%2015 (May) 93,500 1,800 655,300 9,200 14.3%2016 (May) 95,300 1,800 664,700 9,400 14.3%
(includes net undercoverage in Census)Source: Region of Durham, Planning Report 2011-P-65, Monitoring of Growth Trends (September 6, 2011)

Clarington Commercial Market Analysis Update
67
FIGURE 5-4: PLACE OF WORK – CLARINGTON RESIDENTS
Source: urbanMetrics inc.
As detailed in Figure 5-5, about 48% of Clarington employees (i.e. those working in Clarington) are residents of Clarington, with the remainder (52%) residing in other communities.
The “in-commuters” to Clarington provide additional sales volume for Clarington retail stores and services. For Clarington residents working outside the community, with the greater choice of retail facilities, and particular for comparison goods, located in places like Oshawa, this no doubt influences retail spending patterns and the outflow of dollars from Clarington.
Oshawa10,320 28%
Clarington8,925 24%
Toronto4,365 12%
Whitby4,290 12%
Other Durham Region
3,595 10%
Other Locations (<1% each)
4,930 14%
Place of Work of Clarington Residents (2006 Census)
(Total Fixed Place of Work Jobs = 36,425)

Clarington Commercial Market Analysis Update
68
FIGURE 5-5: PLACE OF RESIDENCE – CLARINGTON EMPLOYEES
Source: urbanMetrics inc.
5.1.3 EMPLOYMENT PROJECTIONS
Employment forecasts have been prepared for the Municipality of Clarington by Hemson and have been documented in the Clarington Community Forecast report. These forecasts use the Region of Durham’s allocation of the Growth Plan forecast to Clarington. As detailed in Figure 5-6, employment in Clarington is forecast to increase from 23,700 jobs in 2011 to 38,400 jobs by 2031; a growth of 14,700 jobs (includes no fixed place of work). It should be noted that the Hemson forecasts and allocations are being used by Clarington in the Official Plan Review rather from those provided in Durham Region’s Growing Durham report.
Hemon has also provided estimates of employment and employment growth by community as summarized in Figure 5-7. As indicated, Bowmanville’s role as the economic centre for Clarington is forecast to increase with jobs more than doubling between 2006 and 2031.
Clarington8,925 48%
Oshawa2,355 13%
Other Durham Region1,615
9%
Other Locations
(<1% each)5,520 30%
Place of Residence - Clarington Employees (2006 Census)
(Total Employment (Fixed Place of Work Jobs)= 18,415

Clarington Commercial Market Analysis Update
69
FIGURE 5-6: CLARINGTON EMPLOYMENT GROWTH FORECAST, 2006 TO 2031
Source: urbanMetrics inc. based on Hemson
FIGURE 5-7: EMPLOYMENT FORECASTS BY COMMUNITY, 2006 AND 2031
Source: urbanMetrics inc. based on Hemson
-
5,000
10,000
15,000
20,000
25,000
30,000
35,000
40,000
20062011
20162021
20262031
20,900 23,700
27,100
31,300
35,000
38,400
Jobs
(Fix
ed a
nd n
o fix
ed p
lace
of w
ork)
Clarington Employment Growth Forecast
8,00
0
5,30
0
1,11
0 3,38
0
3,15
0
16,5
90
10,1
70
2,84
0
3,98
0
4,85
0
-2,000 4,000 6,000 8,000
10,000 12,000 14,000 16,000 18,000
Clarington - Employment by Community 2006-2031
(includes fixed and non-fixed place of work)
20062031

Clarington Commercial Market Analysis Update
70
Figure 5-8 details the historic employment by selected NAICS category in Clarington based on Statistics Canada data for the years 2001 and 2006. The jobs have been further subdivided by urbanMetrics into two categories: retail and those service jobs that would typically be found in retail floor space; and jobs that would typically occupy office floor space (excluding public sector). This information is useful in estimating future office floor space needs and evaluating floor space per employee ratios utilized in the Hemson Development Charge report.
FIGURE 5-8: EMPLOYMENT BY NAICS CATEGORY – 2001 AND 2006 (BASED ON CENSUS)
In Figure 5-9, three categories of employment have been detailed: Employment Land; Population-Related (retail, service and institutional); and Major Office. Hemson applies a floor space per employee factor to estimate future floor space needs. For Population-Related employment, some 3 million additional square feet have been estimated between 2011 and 2031. If we assume that the commercial/retail component of Population-Related employment comprises approximately 65%
JOBS AT FIXED PLACES OF EMPLOYMENT - CLARINGTON
NAICS Category 2001 2006Growth in Jobs
2001-2006Retail Trade (44-45) 2,065 2,060 Rental and Leasing Services (532) 70 40 Food Services & Drinking Places (722) 1,550 1,565
265 330
170 230 Other Services - Repair & Maintenance (811) 250 445 Other Services - Personal and Laundry Services (812) 200 250 RETAIL AND SELECTED SERVICE JOBS 4,570 4,920 7.7%
Publishing & Information Services (511) 135 120 Data Processing Services (514) 10 10 Finance & Insurance (52, Excluding 522) 135 150 Real Estate (531) 210 245 Professional, Scientific & Technical Services 630 805 Administration & Support (561) 185 495 Ambulatory Health Care Services (621) 390 560 Social Assistance (624) (excluding child day-care) 80 90
85 140
55 80 OFFICE SPACE TYPE JOBS 1,915 2,695 40.7%(COULD ALSO INCLUDES JOBS FOUND IN RETAIL LOCATIONS)
OTHER JOBS (1 9,690 10,800 11.5%All Industries 16,175 18,415 13.8%
SOURCE: Based on EDP Consulting, Economic Base and Employment Lands Discussion Paper (Appendix B)1) Could include some jobs found in retail locations and office buildings.
Other Services - Religous, grant-making, professional & similar organizations (8132 - 8139)
Arts, Entertainment & Recreation (71)Finance - Credit intermediation and related activities (i.e. Banks) (522)
Educational services (other schools & instruction, educational support) (6116, 6117)

Clarington Commercial Market Analysis Update
71
(based on our review of historic employment by type and the Growing Durham forecasts (include forecasts for commercial/retail and institutional separately), the Hemson employment forecast would yield the need for some 2 million square feet of commercial floor space (excluding major office employment). The requirement for Major Office floor space, defined by Hemson as buildings 20,000 square feet or greater, has been estimated by Hemson at an additional 212,000 square feet between 2011 and 2031.
FIGURE 5-9: HEMSON CONSULTING – EMPLOYMENT FORECAST BY TYPE
5.1.4 ECONOMIC GROWTH OPPORTUNITIES
In addition to demographic factors, local economic conditions can influence the amount of commercial floor space in a market, business volumes, employment, as well as market demand for retail and service floor space.
Based on employment concentrations (location quotient), Clarington’s economy is focused on three key sectors: Utilities (mainly electric power generation), Agriculture and Construction. As identified in the Economic Base and Employment Lands Discussion Paper (July 2, 2010), prepared by EDP Consulting on behalf of the Municipality of Clarington, the key drivers for new economic growth in Clarington are identified as follows:
• Darlington New Nuclear Build project;
MUNICIPALITY OF CLARINGTON - EMPLOYMENT AND NON-RESIDENTIAL SPACE FORECAST - DEVELOPMENT CHARGES STUDY
TOTALEmployment Space (m2) Employment Space (m2) Employment Space (m2) Employment
@ 65 m2 per employee
@ 40 m2 per employee
@ 27 m2 per employee
2006 10,530 684,450 10,060 402,400 350 9,450 20,900 2009 11,511 748,215 10,689 427,560 368 9,936 22,568 2011 12,216 794,040 10,909 436,360 373 10,071 23,498 2016 13,988 909,220 12,586 503,440 561 15,147 27,135 2021 16,125 1,048,125 14,344 573,760 805 21,735 31,274 2026 17,880 1,162,200 16,144 645,760 944 25,488 34,968 2031 19,437 1,263,405 17,880 715,200 1,103 29,781 38,420 2011-2031 7,221 469,365 6,971 278,840 730 19,710 14,922
Space (square feet) - 700 sq.ft. Per Employee
Space (square feet) - 430 sq.ft. Per Employee
Space (square feet) - 290 sq.ft. Per Employee
2006 7,367,358 4,331,398 101,719 2009 8,053,719 4,602,218 106,950 2011 8,546,975 4,696,940 108,403 2016 9,786,763 5,418,983 163,041 2021 11,281,924 6,175,901 233,954 2026 12,509,817 6,950,903 274,351 2031 13,599,178 7,698,349 320,560 2011-2031 5,052,203 3,001,409 212,157
Employment land employment is employment in business parks and designated employment areas.Population related employment includes retail, services, institutional establishments, including those that work from home.Major office is defined as employment in free-standing office builidngs of 20,000 square feet or greater.Excludes temporary large project construction employment.
Employment Land Population Related Major Office
SOURCE: Based on Hemson Consulting Ltd., Municipality of Clarington 2010 Development Charges Study (Table B-4) and Clarington Community Forecast (Table 8).

Clarington Commercial Market Analysis Update
72
• Energy Business Park in Courtice; • Technology Business Park in Bowmanville; • Highway 407 expansion through Clarington; and • GO Transit extension to Clarington (commuter rail services) (not expected before 2021)
The EDP Consulting report indicates that Clarington has significant opportunities for attracting new economic development in the future once planned transportation and infrastructure improvements are made and employment lands serviced. The report also indicates that certain policy issues will need to be addressed to maximize economic development potential. The diminishing employment land supply elsewhere in the GTA, land availability, land costs, and housing opportunities are expected to also drive economic growth in Clarington.
Based on Hemson’s Clarington Community Forecast, Clarington has a sufficient supply of employment land to meet employment land jobs forecast to 2031. Hemson estimates that only about 59% of the supply of employment lands in Clarington will be needed to accommodate the number of employment land jobs forecast for Clarington to 2031, with Bowmanville at 77% capacity, Newcastle at 74% and Courtice at 40%. As such, there may be opportunity for some conversion of employment land for major retail uses in strategic locations, such as along major regional roads.
5.1.5 COMMERCIAL LAND SUPPLY
The following section summarizes proposed commercial developments and vacant commercial designated sites in Clarington. These sites represent opportunities where a portion of the future demand for retail and service floor space, as well as office floor space, could be accommodated.
Based on information provided by the Clarington Planning Department in December 2011, the following summarizes the existing applications for retail and service commercial floor space in the Municipality.
5.1.5.1 PROPOSED FLOOR SPACE - BOWMANVILLE URBAN AREA
• Bowmanville East Town Centre – • First Capital - 195 King Street East @ Lambert Street (Node B-2) –
An RBC bank is planned in front of the Beer Store. Once completed, this bank will relocate from King Street and Division Street in the downtown. The new bank will be 489 square metres (5,263 square feet).
• Aldergrove Estates, 258 King Street East @ Galbraith Court (Node B-2)– A mixed-use residential/commercial building is under construction across the street from the Bowmanville Mall. Ground floor commercial floor space would comprise 415 square metres (4,467 square feet). A dentist office is expected to occupy 200 square metres of the ground floor space.
• Bowmanville West Town Centre –
• 1955, 1965, 1975, 1985 and 1995 Green Road, 2378 Highway 2 ( Node B-6 (iv))- West Bowmanville Shopping Centre – Site Plan approval has been granted for the construction of a 4,997 square metre (53,788 square feet) retail commercial building (“B”) (Phase 1 = 896 square metres) and a 600
Clarington Commercial Market Analysis Update
73
square metre (6,462 square feet) retail/service commercial building (“E”) . Building B will be located west of Home Depot and Building E will be located between Boston Pizza and Sleep Country. The first tenant for Building B -Phase 1 will be Dollarama. Construction for this store is underway. In total, the site is planned for an additional 6,879 square metres (74,048 square feet), including the floor space which has site plan approvals.
• Vacant Canadian Tire site– 2401 Highway 2/Clarington Boulevard ((Node B-4 (ii)) – Based on the Secondary Plan, this site has a threshold for up to 8,000 square metres (86,111 square feet) of retail and service floor space. The former Canadian Tire store, estimated at 7,469 square metres (80,400 square feet) is expected to be subdivided for a number of medium format tenants.
• SmartCentres 2328 & 2344 Highway 2 (Node B-7 (v))-
A 910 square metre (9,800 square feet) LCBO is proposed (which we assume would be a relocation from the Clarington Centre). The store would require a site plan amendment application. Other retail/service floor space planned comprises 2,618 square metres (28,195 square feet) in four buildings fronting Highway 2. In total, the SmartCentres development would add some 3,528 square metres and at build-out would comprise 33,414 square metres (359,661 square feet).
• Clarington Centre (Node B-3 (i))–
The BWTC Secondary Plan indicates a retail and selected service floor space target of 18,600 square metres (200,208 square feet) for this centre. According to site plan records, the centre currently is at target.12
There is the potential that the Loblaws could expand; however, no application has been submitted. In addition, the Zellers is planned to be converted to a Target department store, which will include a food component.
• Kaitlin Group – South-west corner of Regional Road 57 and Highway 2 - Office Commercial There is a proposal for an office complex (West Bowmanville Corporate Centre) on a designated Office Commercial site, however, no application has been made at this time. The project is being marketed to include two office buildings, each four storeys high. The timing of this office commercial project will be dependent on pre-leasing of the project. According to the Clarington Board of Trade office, the timing of this project is likely long term.
• Bowmanville Neighbourhood Centres – 680 Longworth Avenue (Node B-8 (e))–
Site plan approval has been granted to permit the development of a one-storey 2,919 square metre (31,430 square feet) FreshCo grocery store, a one-storey 783 square metre (8,400 square feet) multi-tenanted building and a one-storey 185 square metre (2,000 square feet) building for retail and service commercial uses. The project, totaling 3,887 square metres (41,830 square feet) is currently under construction.
12 Site plan records indicate 19,013 square metres (204,654 square feet). Our inventory indicates 205,700 square feet.

Clarington Commercial Market Analysis Update
74
• Other Bowmanville • 1 Hartwell Drive @ Regional Road 57 – Aspen Springs Professional Centre –
A 3-storey professional/medical building is under construction (zoned C2-9). The 1,642 square metres (17,675 square feet) building is expected to have a pharmacy and medical offices.
• Aspen Springs Drive @ Regional Road 57 –
A 2.4 acre site has site plan approval for a Tim Hortons and gas station. This site is located adjacent to a future GO Transit station. The vacant property is currently for sale.
• 2445 Baseline Road @ Martin Road –
A zoning by-law amendment has been approved to expand the existing plaza from 517 square metres (5,565 square feet) to 1,039 square metres (11,184 square feet) and to allow additional permitted uses (medical dental and professional offices on the ground floor).
• Baseline Road @ Spry Avenue – Some 8,591 square metres (92,354 square feet) of primarily large format retail floor space is planned on this designated Highway Commercial site which has exposure to Highway 401. In addition, a hotel/motel is also planned. A vacant home improvement centre (about 7,250 square metres or 78,000 square feet) is also on the site (RONA built the store but never occupied it) and is currently for lease.
• 6 Spicer Square (near 401/Regional Road 57) – Proposed 2 storey office building of 20,000 square feet (marketing since 2008) has site plan approval. Timing is unknown and will depend on pre-leasing. We have assumed that no retail floor space would be included in the project.
(Built – Vacant)
Torgan (Bowmanville Creek Developments Inc.) – Baseline Road West/Regional Road 57 (site plan dated August 2009) – Includes hotel site

Clarington Commercial Market Analysis Update
75
5.1.5.2 COURTICE URBAN AREA
• Courtice West Shopping District – • 1428 Highway 2, Courtice (Node C-2) -
Site plan approval has been granted for the construction of a 2,646 square metre (28,481 square foot) commercial development, including a Shoppers Drug Mart and 2nd floor medical office floor space. Located at the northwest corner of Highway 2 and Varcoe Road, the Shoppers Drug Mart will occupy 1,698 square metres (18,277 square feet) retail commercial floor space and a 948 square metre (10,204 square feet) of second storey medical offices. Construction for this building is underway with completion expected in early 2012.
• Courtice Town Centre – • Southeast corner of Trulls Road and Highway 2 –
A shopping centre of up to 17,280 square metres (186,000 square feet) is being marketed on a 16 acre site; however no application has been made at this time. Timing is unknown and will depend on the ability of this site to obtain tenant interest. Based on the existing Official Plan, the entire Courtice Town Centre has a target of 30,000 square metres of retail and service space, however, it is likely that the site could only accommodate up to 20,000 square metres (based on discussions with Clarington).
5.1.5.3 NEWCASTLE VILLAGE URBAN AREA
• Newcastle Village Centre – • Southwest corner – King Avenue East at Brookhouse Drive (Node N-1) -
A 122 square metre (1,300 square feet) gas bar and store are proposed, as well as a 650 square metre (7,000 square feet) five tenant commercial building on the south portion of the site along Harmer Drive.
• 37 & 45 North Street and 80, 92 & 100 King Avenue (Node N-1) – A No Frills supermarket is proposed on King Avenue in the Village Centre. An Official Plan Amendment and Zoning By-Law have been approved. A No Frills supermarket of 2,504 square metres (26,951 square feet) is proposed, including a mezzanine level of 161.8 square metres (1,742 square feet).
• Other Newcastle – • 275 and 305 Toronto Street – An application has been submitted for a site plan
amendment to permit the addition of a lumber storage building and vestibule to the existing RONA home improvement centre.
5.1.5.4 SUMMARY – PROPOSED RETAIL AND SERVICE FLOOR SPACE
• Proposed Floor Space - Excluding the Kaitlin and Imperial Build Design proposed “major” office projects, some 49,045 square metres (527,800 square feet) of retail and service floor space has been proposed/approved as of December 2011. Some of the floor space is currently under construction. The majority of the sites proposed are located in Bowmanville. There is also a significant amount of vacant commercial floor space that will likely be absorbed in the future, including the vacant Canadian Tire and RONA sites in Bowmanville.

Clarington Commercial Market Analysis Update
76
• Other Vacant Commercial Lands - In addition to those vacant commercial lands which currently
have a proposal, are approved or under construction for commercial development, there are other vacant private sector commercial designated sites which could accommodate future commercial development in Clarington as detailed in Figure 5-11. Based on vacant site information provided by the Clarington Planning Department and our review of each site, we have estimated that 13,815 square metres (148,160 square feet) of retail and service commercial floor space could be accommodated on these vacant lands assuming a standard industry lot coverage factor of 25%13
to calculate floor space (see Figure 5-10) As indicated in Figure 5-11, certain sites have been excluded as they are likely to develop with uses not evaluated in our analysis (e.g. automobile dealerships, accommodation, service stations) or are considered not to have development potential due to site location or other limiting factors.
FIGURE 5-10: VACANT COMMERCIAL LAND WITH NO APPLICATIONS
VACANT COMMERCIAL
LAND – NO APPLICATIONS
Sq.Metres - TOTAL FLOOR SPACE POTENTIAL 13,815
Bowmanville Urban Area 5,170 Courtice Urban Area 3,085
Newcastle Urban Area 600 Other 4,960
Hectares TOTAL LAND AREA (assuming 25% coverage)
6
Bowmanville Urban Area 2 Courtice Urban Area 1
Newcastle Urban Area 0 Other 2
SOURCE; urbanMetrics inc. based on information from Clarington
• Total Supply - Including proposed space, vacant sites with no application, and Official Plan designated sites, Figure 5-12 summarizes the available supply of commercial floor space. An uptake of a portion of vacant floor space has also been included for each area based on the existing vacant space and vacancy levels. A reduction in vacancy levels to 5% has been assumed, except for the vacant Canadian Tire and RONA floor areas, which have been included in total. Furthermore, three “Neighbourhood Centres” designated in the Official Plan (two in Bowmanville and one in Courtice) have also been included with a maximum floor area of 5,000 square metres (53,820
13 Standard lot coverage factor as used in the development industry to provide for required surface parking and landscaping.

Clarington Commercial Market Analysis Update
77
square feet) for each. The build-out of the Courtice Town Centre has also been assumed at a maximum of 20,000 square metres of floor area, based on discussions with the municipality.
The total supply is further distributed by store type based on site size, location and existing applications. In total, the existing supply identified on Figure 5-12 could accommodate some 105,115 square metres (1.1 million square feet) of retail and service floor space.
Excluded in our calculations of future supply are opportunities for intensification/redevelopment in the Town Centres and Village Centres, and potentially some Neighbourhood Centres and Highway Commercial sites. There may also be limited opportunities in the employment areas based on existing permissions.

Clarington Commercial Market Analysis Update
78
VACANT COMMERCIAL SITES (WITHOUT PROPOSALS/APPLICATION)
Property Owner Property Address / Location
Community Area Roll_Number Area (m 2 ) Sq. Metres @25%
coverage (nearest 5
m 2 )
NOTES Potential Opportunity (sq.metres) Excluding Sites with
Application
Potential Opportunity
Excluding Sites with
Application (sq.ft.)
1557366 ONTARIO INC 0 MARTIN RD Bowmanville Bowmanville - Other (Highway Commercial)
181701002007202 7,583 1,895 Internal site - limited exposure from Baseline
0 0
HALTON RESTAURANT EQUIPMENT
1 SPICER SQ Bowmanville Bowmanville - Other (Highway Commercial)
181702012021290 4,582 1,145 Frontage on Baseline - potential site for restaurant
1,145 12,300
2143619 ONTARIO INC 5 SPICER SQ Bowmanville Bowmanville - Other (Highway Commercial)
181702012021280 4,600 1,150 Internal site - In Auto park 0 0
2154513 ONTARIO INC 6 SPICER SQ Bowmanville Bowmanville - Other (Highway Commercial)
181702012021210 3,878 970 Internal site - In Auto park - Proposed for Office building (20,000 sq.ft.)
0 0
ILO INVESTMENTS INC 11 SPICER SQ Bowmanville Bowmanville - Other (Highway Commercial)
181702012021260 11,365 2,840 Auto park use 0 0
J K C ESTATES LIMITED 23 SPICER SQ Bowmanville Bowmanville - Other (Highway Commercial)
181702012021240 8,197 2,050 Auto park use 0 0
2144732 ONTARIO INC 33 SPICER SQ Bowmanville Bowmanville - Other (Highway Commercial)
181702012021221 8,547 2,135 Storm Water Pond 0 0
2010785 ONTARIO LIMITED 109 KING ST W Bowmanville Bowmanville East Town Centre - Downtown
181702004010500 6,776 1,695 SE Corner Scucog/King - Restaurant <4,000 sq.ft. burned down
1,695 18,200
MORRIS FUNERAL CHAPEL LTD 116 QUEEN ST Bowmanville Bowmanville East Town Centre - Downtown
181702009017600 765 190 Parking Lot 0 0
1638338 ONTARIO INC 42 SCUGOG ST Bowmanville Bowmanville East Town Centre - Downtown
181702001000710 3,428 855 Beside Railway - potential for consolidation of other properties to the south
855 9,200
HANC BARBARA ELIZABETH 181 KING ST E Bowmanville Bowmanville East Town Centre - East District
181702009012900 1,980 495 Located just west of Liberty Street - potential for service uses most likely with 2nd flr residential
495 5,300
SCHWARZ MARION 122 KING ST E Bowmanville Bowmanville East Town Centre - East District
181702008005900 447 110 Vacant Commercial Corner Building Lot In Downtown Bowmanville. Zoning Allows 3 Level Building To Be Built - Retail/Professional Offices/Residential Apartment/Condo - Chip Truck on site (assume 1,203 grd flr)
110 1,200
HALLOWAY HOLDINGS LIMITED CLARINGTON BLVD E/S
Bowmanville Bowmanville West Town Centre
181701002017352 5,447 1,360 Currently a parking lot beside park 0 0
MICHALEJKO WALTER 2021 GREEN RD & STEVEN
Bowmanville Bowmanville West Town Centre
181701003001720 3,481 870 Site is zoned "A" - Located across from Canadian Tire and beside the high school and group home.
870 9,400
TOTAL BOWMANVILLE 71,077 17,760 5,170 55,600171 GEORGE REYNOLDS DRIVE INC
171 GEORGE REYNOLDS DR
Courtice Courtice - Other 181701010003815 2,061 515 Potential convenience plaza 515 5,500
2117412 ONTARIO LIMITED 1463 HIGHWAY 2 Courtice Courtice West Shopping District
181701007006400 10,283 2,570 Located east of Darlington Blvd. and across street from seniors' home and medical centre. Sign was posted for retail/office complex. Could have multiple floors. Zoned C1-30 - Must have minimum of 230 sq.metres of office space (2,475 sq.ft.)
2,570 27,700
LDB HOLDINGS LTD 2640 TRULLS RD Courtice Courtice - Other 181701006005105 1,997 500 Across from Town Centre site, south of Hwy 2 - residential to north and west - better suited for residential or mixed-use
0 0
TOTAL COURTICE 14,340 3,585 3,085 33,2001615472 ONTARIO LIMITED 266 KING AVE E Newcastle Newcastle Village Centre 181703013012100 2,393 600 Good exposure on King Avenue 600 6,400
TOTAL NEWCASTLE 2,393 600 600 6,400PSJEGAN INC 5360 MAIN ST Orono 181703010014500 1,625 405 Contaminated - Abandoned site 0 0
397243 ONTARIO LIMITED 3243 HIGHWAY 115/35
Clarke Clarington - Other 181703003021200 3,480 870 Limited access 0
665640 ONTARIO LIMITED 6113 HIGHWAY 115/35
Clarke Clarington - Other 181703005025901 17,835 4,460 Near Orono with access from Conc. 6 (Taunton Road), beside service station and across from Jungle Cat World.
4,460 48,000
BEAVER FUELS MANAGEMENT 3454 HIGHWAY 115/35
Clarke Clarington - Other 181703003022300 4,646 1,160 Former gas station site 0 0
PETRO-CANADA 3099 HIGHWAY 115/35
Clarke Clarington - Other 181703003020700 18,624 4,655 On Ramp beside Gas station 0 0
THE NORFINCH GROUP INC 8235 HIGHWAY 115/35
Clarke Clarington - Other 181703007006600 1,348 335 East side of Highway, north of Conc. 8 0 0
HOWARD PATRICIA M 1402 TAUNTON RD E
Darlington Clarington - Other 181701016006900 652 165 @ Townline Road on corner - potential service station location beside Taunton Tire
0 0
SUNOCO INC 2665 TAUNTON RD E
Darlington Clarington - Other 181701008010000 3,616 905 Sunoco Gas Station 0 0
OSSO CLORINDA 2109 MAPLE GROVE RD
Maple Grove Clarington - Other 181701003010802 1,993 500 Highway 2 exposure - Highway Commercial use potential
500 5,400
PETRO-CANADA 2154 HIGHWAY 2 Maple Grove Clarington - Other 181701003015800 2,778 695 Located on ne corner of Holt Road and Highway 2 across from auto use - Petro Canada owns. Potential future gas station?
0 0
TOTAL OTHER 56,597 14,150 4,960 53,400
TOTAL CLARINGTON 144,406 36,095 13,815 148,600SOURCE: urbanMetrics inc.1) Based on Assessment data provided by Clarington and our review of individual sites.
FIGURE 5-11: OTHER VACANT COMMERCIAL SITES – NO APPLICATION

Clarington Commercial Market Analysis Update
79
FIGURE 5-12: PROPOSED/UNDER CONSTRUCTION AND VACANT LAND ASSUMPTIONS – ESTIMATED DISTRIBUTION BY STORE TYPE
SUMMARY - PROPOSED/UNDER CONSTRUCTION & VACANT LAND - ESTIMATED DISTRIBUTION OF SPACE BY STORE TYPE
LEGEND: FSR - Food store retail; NFSR - Non-Food Store Retail; GAFO - General Merchandise, Apparel, Furnishings, Other department store type merchandise; PPC - Pharmacy and Personal Care Stores; BOHS - Building and Outdoor Home Supply Stores; Other Retail - Liquor/Beer/WineSelected Services - Consumer Goods rental, banks, restaurants, personal services; Other Services - All other services
Nodes AreasFloor Area - Vacant Sites
- No application
(1
Other Vacant
Floor Area Based on
OP (2
Proposed/ Under
Construction Floor Area
(3
Uptake - Vacant Existing
Floor Space (4
TOTAL (Sq. Metres) TOTAL FSR
TOTAL NFSR GAFO PPC BOHS
TOTAL OTHER RETAIL/
SERVICESBOWMANVILLE URBAN AREA
Total BETC 3,155 0 905 2,180 6,240 200 1,180 1,180 0 0 4,860B-1 Bowmanville East Town Centre - Downtown 2,550 0 0 2,180 4,730 200 1,180 1,180 0 0 3,350
42 Scucog Street 855 0 0 0 855 0 0 0 0 0 855109 King St. W @ Scucog 1,695 0 0 0 1,695 0 0 0 0 0 1,695
Uptake - Portion of Vacant Floor Space 0 0 0 2,180 2,180 200 1,180 1,180 0 0 800B-2 Bowmanville East Town Centre - East 605 0 905 0 1,510 0 0 0 0 0 1,510
181 King Street East 495 0 0 0 495 0 0 0 0 0 495122 King Street East 110 0 0 0 110 0 0 0 0 0 110
195 King Street - RBC Bank 0 0 490 0 490 0 0 0 0 0 490258 King Street (Aldergrove Estates) 0 0 415 0 415 0 0 0 0 0 415
Uptake - Portion of Vacant Floor Space 0 0 0 0 0 0 0 0 0 0 0Total BWTC 870 0 10,410 7,470 18,750 0 13,980 13,980 0 0 4,770
B-3 Bowmanville West Town Centre - i - Clarington Centre 0 0 0 0 0 0 0 0 0 0 0B-4 Bowmanville West Town Centre - ii (uptake of vacant Canadian Tire) 0 0 0 7,470 7,470 0 7,470 7,470 0 0 0B-6 Bowmanville West Town Centre - iii (Clarington Place) 0 0 0 0 0 0 0 0 0 0 0B-7 Bowmanville West Town Centre - iv - West Bowmanville Centre 0 0 6,880 0 6,880 0 5,580 5,580 0 0 1,300B-8 Bowmanville West Town Centre - v - SmartCentres 0 0 3,530 0 3,530 0 930 930 0 0 2,600
Bowmanville West Town Centre - Other 870 0 0 0 870 0 0 0 0 0 870B-9 Bowmanville - Neighbourhood Centre 0 10,000 5,530 950 16,480 7,330 2,815 1,745 1,070 0 6,335
Longwood/Scucog Centre (under construction) 0 0 3,890 0 3,890 2,920 130 130 0 0 8401 Hartwell - Aspen Spring Professional Centre 0 0 1,640 0 1,640 0 140 0 140 0 1,500
Uptake - Portion of Vacant Floor Space 0 0 0 950 950 225 225 225 0 0 5002 Designated Neighbourhood sites (no zoning) - max 5,000 m2 each 0 10,000 0 0 10,000 4,185 2,320 1,390 930 0 3,495
B-10 Bowmanville - Other (includes uptake of vacant RONA) 1,145 0 9,110 7,250 17,505 0 13,515 5,800 465 7,250 3,9901 Spicer Square 1,145 0 0 0 1,145 0 0 0 0 0 1,145
2445 Baseline 0 0 520 0 520 0 0 0 0 0 520Vacant RONA, Baseline @ Spry Avenue 0 0 0 7,250 7,250 0 7,250 0 0 7,250 0
Bowmanville West (Baseline @ Spry Avenue) 0 0 8,590 0 8,590 0 6,265 5,800 465 0 2,325TOTAL BOWMANVILLE 5,170 10,000 25,955 17,850 58,975 7,530 31,490 22,705 1,535 7,250 19,955
COURTICE URBAN AREA
C-1 Courtice Town Centre 0 2,715 17,285 0 20,000 3,715 12,270 10,260 1,395 615 4,015Courtice Town Centre 0 0 17,285 0 17,285 3,715 11,155 9,760 1,395 0 2,415
Remaining Capacity (assume 20,000 sq.metres maximum for site) (6 0 2,715 0 0 2,715 1,115 500 0 615 1,600C-2 Courtice West Shopping District 2,570 0 2,645 2,160 7,375 610 3,580 1,700 1,880 0 3,185
1428 Hwy 2 (includes Shoppers Drug Mart) 0 0 2,645 0 2,645 0 1,700 0 1,700 0 9451463 Highway 2 2,570 0 0 0 2,570 160 920 920 0 0 1,490
Uptake - Portion of Vacant Floor Space 0 0 0 2,160 2,160 450 960 780 180 0 750C-3 Courtice - Neighbourhood Centres 0 5,000 0 2,000 7,000 3,085 1,630 700 930 0 2,285
Uptake - Portion of Vacant Floor Space 0 0 0 2,000 2,000 300 500 500 0 0 1,200Designated Neighbourhood Centre ( 5,000 sq. Metres maximum) 0 5,000 0 0 5,000 2,785 1,130 200 930 0 1,085
C-4 Courtice - Other - 171 George Reynolds 515 0 0 0 515 185 0 0 0 0 330TOTAL COURTICE 3,085 7,715 19,930 4,160 34,890 7,595 17,480 12,660 4,205 615 9,815
NEWCASTLE VILLAGE URBAN AREA N-1 Newcastle Village Centre (excluding service station) 600 0 3,150 0 3,750 2,685 140 140 0 0 925
Newcastle (King) Developments, King Ave. (No Frills) 0 0 2,500 0 2,500 2,500 0 0 0 0 0266 King Ave. E 600 0 0 0 600 0 0 0 0 0 600
King Avenue @ Brookhouse 0 0 650 0 650 185 140 140 0 0 325N-2 Newcastle Village - Other 0 0 0 0 0 0 0 0 0 0 0
TOTAL NEWCASTLE 600 0 3,150 0 3,750 2,685 140 140 0 0 925
ORONO VILLAGE URBAN AREA O-1 Uptake - Portion of Vacant Floor Space 0 0 0 440 440 0 240 240 0 0 200O-2 Neighbourhood Centre 0 0 0 0 0 0 0 0 0 0 0O-3 Orono Village - Other 0 0 0 0 0 0 0 0 0 0 0
TOTAL ORONO 0 0 0 440 440 0 240 240 0 0 2002109 Maple Grove 500 0 0 0 500 0 500 500 0 0 0
6113 Highway 35/115 (7 4,460 0 0 0 4,460 0 4,460 4,460 0 0 0Uptake - Portion of Vacant Floor Space 0 0 0 2,100 2,100 0 500 500 0 0 1,600
TOTAL OTHER CLARINGTON 4,960 0 0 2,100 7,060 0 5,460 5,460 0 0 1,600TOTAL CLARINGTON - SQUARE METRES 13,815 17,715 49,035 24,550 105,115 17,810 54,810 41,205 5,740 7,865 32,495TOTAL CLARINGTON - SQUARE FEET 148,700 190,700 527,800 264,300 1,131,400 191,700 590,000 443,500 61,800 84,700 349,800
SOURCE: urbanMetrics inc. 1) Based on vacant land information provided by the Clarington Planning Department and urbanMetrics estimates of floor space. 2) Based on targets and maximum space permissions in the Official Plan. 3) Based on information provided by the Clarington Planning Department (as of December 2011).4) Uptake amount by area assumes a 5% vacancy rate.5) urbanMetrics estimates.6) Maximum target in Official Plan is for 30,000 square metres, however, the capacity has been reduced to 20,000 square metres based on discussions with the municipality.7) Site has permissions for uses such as a home furnishing store.
Square Metres (to nearest 5 m2) Estimate of Floor Area by Store Type (Sq. Metres) (5

Clarington Commercial Market Analysis Update
80
5.2 SUMMARY
• Clarington’s population is expected to increase from 89,800 persons in 2011 to 140,400 persons by 2031 (see Figure 5-13). This represents a growth of 50,600 persons over the next 20 years. Almost 60% of this growth is expected to occur in the Bowmanville Urban Area.
• Clarington’s average per capita income levels are increasing in relation to the province. Based on the 2001 and 2006 Census, average income levels have increased from 0.5% below the province to about 2% above the province respectively.
• Clarington can be considered a
“bedroom community”, with only 24% of Clarington’s labour force working in Clarington based on the 2006 Census. Some 52% of persons working in Clarington live outside of Clarington.
• Employment in Clarington is expected to increase by some 14,700 jobs over the next 20 years.
• Bowmanville’s role as the economic centre for Clarington is forecast to increase with jobs more
than doubling between 2006 and 2031 (8,590 additional jobs). Courtice is also expected to accommodate a significant portion of additional jobs in Clarington (4870 new jobs between 2006 and 2031).
• Based on the 2001 and 2006 Census, retail and service type jobs that would typically be found in
ground floor retail commercial space (i.e. in shopping centres or street-front retail locations), have increased by 7.7% over this period. For non-government service jobs that would typically occupy office locations, these jobs have increased by 40.7% over the 2001 to 2006 period. Service sector jobs, and particularly those in health care, administration and professional services, have contributed to the greatest increase in Clarington jobs between 2001 and 2006.
• Clarington has opportunities to attract new economic development in the future. According to
Hemson’s Clarington Community Forecast, the municipality has a significant amount of vacant employment land. Hemson estimates that about 59% of that supply is expected to be required to accommodate employment land jobs in Clarington to 2031. As such, there may be the opportunity for conversion of some of these lands to accommodate future retail and service commercial jobs.
• The total existing supply of commercial land to meet future retail and service floor space needs has
been estimated to accommodate some 105,115 square metres (1,131,400 square feet) of floor space.
-
20,000
40,000
60,000
80,000
100,000
120,000
140,000
160,000
2006 2011 2016 2021 2026 2031Clarington 80,900 89,800 100,800 114,000 127,600 140,400
Popu
latio
n
Clarington Population(Source: Hemson Consulting)
FIGURE 5-13: CLARINGTON POPULATION BASED ON HEMSON CONSULTING FORECAST

This page intentionally left blank

Clarington Commercial Market Analysis Update
81
6 WHERE ARE WE HEADED? – RETAIL AND SERVICE FLOOR SPACE NEEDS ANALYSIS
In this section, the future needs or market demand for additional retail and service floor space in Clarington has been estimated to the year 2031 in 5 year intervals, recognizing market trends and conditions.
In a market analysis (see methodology, Figure 6-1), demand is the amount of goods or services required to fulfill the needs of customers living in a defined area. The spending potential of residents typically determines demand; however, the influence of competition outside the market area (i.e. capture rates) also needs to be considered. Although our market analysis focuses on the residents of Clarington, the community also depends on non-local demand (i.e. inflow) to support local businesses. Inflow can include tourists and visitors, as well as “in-commuters” (those who travel regularly into Clarington to work). A comparison of supply and demand by major store type can help identify gaps where demand clearly exceeds supply or where there is a potential oversupply of floor space.
Our market analysis has been informed based on survey research conducted recently by urbanMetrics in Clarington and Durham Region for private sector clients and previous research conducted on behalf of Clarington for the 2005 Commercial Policy Review; the inventory of retail floor space completed in December 2011; and our market knowledge.
Future demand can be modeled using various quantitative measures. There are generally two basic approaches that have been utilized to estimate future commercial needs: the expenditure analysis approach, and the per capita space ratio or population threshold technique. The selection of an approach is typically a function of several factors including the type of data available and the specific type of uses to be evaluated.
• The expenditure analysis approach evaluates consumer shopping habits and expenditure potential for a range of retail store types within a community or study area. Based on estimates of local shares (i.e. expenditures made within a study area), the residual or net additional expenditure potential available in a study area over a future time period is determined. Inflow sales opportunities are added to the residual potential and by applying typical average sales performance levels, the future additional space needs in a study area can be estimated.
Demand Considerations-Population
-Income Levels-Consumer shopping
patterns(outflow)
-Non-local demand (inflow)
Supply Considerations-Existing inventory of
retail and service space-Vacancy levels
-Distribution of space by type
-Vacant Commercial land-Proposed competition
-Competition in neighbouring municipalities
Conclusions: Warranted Additional Retail and Service Space in Clarington
Expenditure Approach Space Per Capita Approach
Recommendations: Distribution by Urban Area (Bowmanville, Courtice, Newcastle, Orono)
Market Analysis
FIGURE 6-1: MARKET ANALYSIS METHODOLOGY/APPROACH

Clarington Commercial Market Analysis Update
82
• The per capita space ratio approach can be utilized for all retail and service store types, but is
typically utilized for services store types, as in this study. This approach is more simplistic than the expenditure technique. The approach utilizes space ratios for a variety of store categories applied to the population to estimate the space that can be supported locally by study area residents. The ratios are determined through existing service levels in a study area and observations made over time in a variety of major market areas displaying a diverse range of commercial activity. Estimates of outflow and inflow are included to derive the total net additional local demand.
6.1.1 RETAIL EXPENDITURES
In order to determine the total volume of retail expenditures available within Clarington, it is necessary to estimate the expenditures that are made in various types of retail stores by residents.
Based on Statistics Canada Retail Trade data, we have estimated the per capita expenditures in Clarington for the following retail store types which are based on the North American Industry Classification System (NAICS) (see Appendix A for details):
• Food Store Retail (FSR) – this category includes supermarkets, grocery stores, convenience stores and specialty food stores.
• Non-Food Store Retail (NFSR) – this category includes: • “GAFO” Stores (General merchandise, Apparel, Furnishings and Other stores that sell
merchandise normally sold in department stores) • Pharmacies and Personal Care (“PPC”)Stores including drug stores, optical stores,
nutrition and cosmetic stores; • Building and Outdoor Home Supply (“BOHS”) Stores including home improvement centres,
hardware stores, paint and wallpaper stores, nursery/garden centres, and a wide range of building material stores.
6.1.1.1 FOOD STORE RETAIL (FSR) PER CAPITA EXPENDITURES
Based on Statistics Canada Retail Trade data, the average FSR expenditure per capita in Ontario has been estimated at $2,190 in 2011. The 2011 average per capita food store expenditure for Clarington has been calculated based on the income relationship between the Province and the Municipality, and an expenditure based regression equation which calculates an expenditure index based on income level. As a result, the FSR expenditure per capita for Clarington has been estimated at $2,197.
For Clarington residents, the 2011 average per capita FSR expenditure is expected to increase at a rate of 0.25% per year on an uninflated basis between 2011 and 2031.14
In total, as detailed in Figure 6-2, Clarington’s food store retail expenditure potential is expected to increase by $126.6 million over the next 20 year period.
As discussed in the underlying assumptions, future changes in expenditure patterns solely due to inflation have not been recognized. Therefore, future expenditure levels reflect the 2011 value of the Canadian dollar.
14 Based on long term historic real growth trends in FSR per capita expenditures in Ontario.

Clarington Commercial Market Analysis Update
83
FIGURE 6-2: FOOD STORE RETAIL EXPENDITURE POTENTIAL
6.1.1.2 NON-FOOD STORE RETAIL (NFSR) PER CAPITA EXPENDITURES
Based on Statistics Canada Retail Trade data, the average per capita expenditure NFSR in Ontario has been estimated at $5,585 in 2011. For Clarington residents, the 2011 average per capita NFSR expenditure has been estimated utilizing a regression equation which yields $5,652 per capita.
For residents of Clarington, average per capita NFSR expenditures are expected to increase from their 2011 level at a rate of 1.5%15
per year (not compounded) on an un-inflated basis during the study period. Again, future changes in expenditure patterns solely due to inflation have not been recognized in this analysis. In total, as detailed in Figure 6-3, NFSR expenditures are forecast to increase by $524.1 million over the next 20 year period. The NFSR expenditures have been subdivided into three major stores types: GAFO, Pharmacy and Personal Care (PPC) and Building and Outdoor Home Supply Stores (BOHS). The allocation by store type has been based on the provincial distribution.
15 Based on long term historic real growth trends in Ontario.
FOOD STORE RETAIL EXPENDITURE POTENTIAL
2011 Dollars 2011Province of OntarioPer Capita FSR Expenditure $ 2,190 (1
2011 Dollars 2011 2016 2021 2026 2031
ClaringtonIncome Index to Province 102.00 FSR Expenditure Index to Province 100.30 Per Capita FSR Expenditure (2 $ 2,197 $ 2,224 $ 2,252 $ 2,279 $ 2,307Population - Clarington Residents 89,800 100,800 114,000 127,600 140,400 TOTAL FSR POTENTIAL ($Millions) $ 197.3 $ 224.2 $ 256.7 $ 290.8 $ 323.9
Cumulative Growth in FSR Potential ($Millions) $26.9 $59.4 $93.5 $126.6
SOURCE: urbanMetrics inc.1) Estimated based on Statistics Canada, Retail Trade (Publication 63-005) and Monthly Retail Trade data.2) Based on the income relationship between the Province and Clarington residents using the FSR regression equation of y
= 87 + 0.13(x) where x is the income index. Forecast to increase in real terms at a rate of 0.25% per year (not compounded)

Clarington Commercial Market Analysis Update
84
FIGURE 6-3: NON-FOOD STORE RETAIL EXPENDITURE POTENTIAL
6.1.2 WARRANTED RETAIL FLOOR SPACE
Our market analysis includes estimates of warranted retail floor space in Clarington for the following major store types:
1. FSR - Food store retail (including supermarkets and other food stores) 2. NFSR – GAFO (department store type merchandise stores) 3. NFSR – Pharmacies and Personal Care 4. NFSR – Building and Outdoor Home Supply
Our estimates of warranted floor space for FSR and NFSR have been based on a residual analysis methodology, which includes estimating the quantum of retail expenditures available in Clarington and the allocation of these expenditures by selected store type. Our analysis estimates how existing expenditure patterns are expected to change with future market growth and the introduction of new
NFSR EXPENDITURE POTENTIAL
2011 Dollars 2011
Province of OntarioPer Capita NFSR Expenditure $ 5,585 (1
Per Capita GAFO $3,889 70%Per Capita Pharmacies & Personal Care (PPC) $959 17%Per Capita Building & Outdoor Home Supply (BOHS) $737 13%
2011 Dollars 2011 2016 2021 2026 2031
ClaringtonIncome Index to Province 102.00 NFSR Expenditure Index to Province 101.20 Per Capita NFSR Expenditure (2 $ 5,652 $ 6,076 $ 6,500 $ 6,924 $ 7,348Population - Clarington Residents 89,800 100,800 114,000 127,600 140,400 TOTAL NFSR POTENTIAL ($Millions) $ 507.5 $ 612.5 $ 741.0 $ 883.5 $ 1,031.7
NFSR: GAFO (3 70.0% 70.0% 70.0% 70.0% 70.0%NFSR: Pharmacies and Personal Care (PPC) (3 17.0% 17.0% 17.0% 17.0% 17.0%
NFSR: Building and Outdoor Home Supplies Stores (BOHS) (3 13.0% 13.0% 13.0% 13.0% 13.0%
100.0% 100.0% 100.0% 100.0% 100.0%
NFSR: GAFO (3 $ 355.3 $ 428.8 $ 518.7 $ 618.5 $ 722.2NFSR: Pharmacies and Personal Care (PPC) (3 $ 86.3 $ 104.1 $ 126.0 $ 150.2 $ 175.4NFSR: Building and Outdoor Home Supplies Stores $ 66.0 $ 79.6 $ 96.3 $ 114.9 $ 134.1Total ($Millions) $ 507.6 $ 612.5 $ 741.0 $ 883.6 $ 1,031.7Cumulative Growth $ 104.9 $ 233.4 $ 376.0 $ 524.1
SOURCE: urbanMetrics inc.1) Estimated based on Statistics Canada, Retail Trade (Publication 63-005) and Monthly Retail Trade data.2)
3) Distribution by store type estimated based the provincial distribution.
Based on the income relationship between the Province and Clarington residents using the NFSR regression equation of y = 41 + 0.59(x) where x is the income index. Forecast to increase in real terms at a rate of 1.5% per year (not compounded)

Clarington Commercial Market Analysis Update
85
retail facilities in Clarington. Shifts or changes in the Clarington expenditure potential are compared to the existing levels in Clarington, with the difference being the “residual” demand. This residual represents the sales potential available from Clarington residents to support both existing and new stores in the Municipality.
This residual analysis approach is considered appropriate for long term land use planning as it does not encroach on the sales of existing stores in Clarington in order to support additional floor space. It should be recognized, however, that additional floor space could be accommodated beyond that identified in the residual analysis by transferring sales from existing stores to new stores. However, it is beyond the scope of our analysis to evaluate sales transfers on an application by application or individual site basis, especially considering that for the most part, timing of development, tenant mix and specific store sizes by type are not known. Therefore, the warranted floor space figures estimates are intended as general guidelines based on future expectations with respect to market growth, recapture and inflow. Additional floor space based on sales transfers should only be justified at the time of application based on an acceptable impact analysis, if required.
The following discussion briefly describes our methodology used to calculate warranted floor space for each store type:
1. The existing Clarington Share
(i.e. expenditures made in Clarington) of Clarington residents has been estimated. Our estimates have been informed based on recent consumer survey research conducted by urbanMetrics for other market studies in Durham Region, our inventory, as well as the consumer survey conducted for the 2005 Clarington Commercial Policy Review.
2. Future Clarington shares
have been forecast over the study period (5 year intervals to 2031) based on an estimate of the opportunity for recapture of expenditures currently leaving the community and our knowledge of existing applications both within Clarington and elsewhere.
3. By applying the Clarington shares to the available expenditure potential, the Clarington sales potential
available from Clarington residents has been calculated.
4. The residual potential
available from Clarington residents (i.e. the net additional expenditure growth available in Clarington over the study area period) has been calculated.
5. Inflow
sales have been added to the residual potential to calculate the total additional sales volume available to new Clarington retail facilities. Inflow has been estimated based on licence plate survey research conducted by urbanMetrics for the 2005 Commercial Policy Review, competitive influences and recognition that additional floor space has been added in Clarington in recent years.
6. The warranted floor space
It should be noted our analysis excludes any adjustments in the existing percentage distribution of expenditures by store type (which have been based on the provincial distribution), the addition of sales transfers from existing stores in Clarington, or adjustments on a store category basis for sales transfers that may occur from one major store category to another given the merchandise overlaps
in each category has then been calculated based on expected sales performance levels applied to the total sales volume available.

Clarington Commercial Market Analysis Update
86
between categories (e.g. NFSR to FSR). With the aging population and aging housing stock, there could be shifts in the distribution of spending (e.g. more in health care stores and home improvement stores), however, it is beyond the scope of this study to predict these changes.
The following summarizes the results of our warranted floor space analysis, which should be considered as a general guideline in determining future floor space needs.
6.1.2.1 FOOD STORE RETAIL (FSR)
As detailed in Figure 6-4, Clarington residents are currently spending some $197.3 million in FSR facilities, of which an estimated $128.2 million (65%) is spent in Clarington FSR stores. Therefore, based on the existing inventory, the Clarington FSR category is currently achieving average sales per square foot levels of about $5,966 per square metre ($554 per square foot) (assuming an average inflow factor of 15%), which is considered within typical industry norms.
We have assumed that with additional food store space added in Clarington in future years, there would be an increase in the Clarington share to 75% by 2031. Based on our estimates of the future Clarington share, the total residual expenditure potential available from Clarington residents for new and existing food stores in Clarington has been estimated at $28.7 million in 2016, increasing to $114.7 million by 2031.
Based on the residual expenditures available from Clarington residents and estimated inflow sales, some 23,680 square metres (254,900 square feet) of new FSR floor space would be warranted in Clarington by 2031 at sales of $5,380 per square metre ($500 per square foot). This warranted floor space excludes any sales transfer opportunities from existing FSR stores in Clarington or other non-FSR stores which sell food and grocery merchandise (e.g. department stores and drug stores).
We have estimated that as of December, 2011, there is 5,418 square metres (58,300 square feet) of major food store floor space proposed in Clarington, which would meet most of future needs over the next five years:
• Bowmanville (Neighbourhood Centre) - Longwood/Scucog - 2,919 square metre (31,400 square foot) FreshCo (under construction, opening in 2012)
• Newcastle Village Centre – King Avenue – 2,504 square metre (26,900 square foot) No Frills
Other FSR floor space is likely to develop in the Courtice Town Centre and in Bowmanville (Neighbourhood Centre sites and in the Brookhill community). Subject to approvals, there is also the opportunity for the expansion of the Loblaws in the Clarington Centre and the Foodland in Newcastle.

Clarington Commercial Market Analysis Update
87
FIGURE 6-4: WARRANTED FSR FLOOR SPACE IN CLARINGTON
CLARINGTON FOOD STORE RETAIL (FSR) ANALYSIS
2011 Dollars 2011 2016 2021 2026 2031
ClaringtonFood Store Retail Expenditures ($Millions) $ 197.3 $ 224.2 $ 256.7 $ 290.8 $ 323.9
Estimated CLARINGTON Share of Total Potential %(1 65.0% 70.0% 72.5% 75.0% 75.0%Estimated CLARINGTONShare ($ Millions) $ 128.2 $ 156.9 $ 186.1 $ 218.1 $ 242.9
$ 28.7 $ 57.9 $ 89.9 $ 114.7
$ 554
$ 5,968
WARRANTED ADDITIONAL SPACE - CLARINGTON (including inflow, excluding sales transfers)Residual Potential Available from Clarington residents $ 28.7 $ 57.9 $ 89.9 $ 114.7
% Inflow from Outside Clarington (3 10.0% 10.0% 10.0% 10.0%Inflow $ 3.2 $ 6.4 $ 10.0 $ 12.7
TOTAL ADDITIONAL SALES POTENTIAL AVAILABLE $ 31.9 $ 64.3 $ 99.9 $ 127.4 WARRANTED ADDITIONAL FSR SPACE, EXCLUDING SALES TRANSFERS FROM EXISTING CLARINGTON FSR STORES (4
@ $425 per sq. ft. 75,000 151,400 235,000 299,900 @ $450 per sq. ft. 70,900 143,000 222,000 283,200 @ $475 per sq. ft. 67,100 135,400 210,300 268,300 @ $500 per sq. ft. 63,800 128,700 199,800 254,900
WARRANTED ADDITIONAL FSR SPACE, EXCLUDING SALES TRANSFERS FROM EXISTING CLARINGTON FSR STORES (5
@ $4575 per sq. metre 6,970 14,065 21,830 27,860 @ $4845 per sq. metre 6,585 13,285 20,625 26,310 @ $5115 per sq. metre 6,235 12,580 19,540 24,925 @ $5380 per sq. metre 5,925 11,955 18,560 23,680
SOURCE: urbanMetrics inc.
4) Rounded to the nearest 100 square feet.5) Rounded to the nearest 5 square metres.
2) urbanMetrics inc. estimate based on historic licence plate survey research conducted in Clarington for the 2005 Commercial Policy Review.
Residual Potential for Existing/New FSR Stores in Clarington from Clarington Residents
Existing Clarington FSR Stores (272,100 sq.ft.) Sales/Sq.Ft. Levels (Including average Inflow of 15%(2):
Existing Clarington FSR Stores (25,271 m2) Sales/Sq.Metre Levels (Including average Inflow of 15%):
1) The 2011 share has been estimated based on telephone survey research conducted by urbanMetrics for private sector clients in Durham Region in 2011, our review of the survey conducted for the 2005 Commercial Policy Review, and inventory of space.
Square Feet
Square Metres
3) urbanMetrics inc. estimate.

Clarington Commercial Market Analysis Update
88
6.1.2.2 NON-FOOD STORE RETAIL (NFSR)
NFSR categories evaluated include: 1) GAFO, 2) Pharmacies and Personal Care, and 3) Building and Outdoor Home Supply. The following summarizes the warranted floor space analysis by category.
GAFO stores include:
1) GAFO STORES
• General Merchandise stores, including department stores, Costco, Canadian Tire, dollar stores
• Apparel stores, including Clothing, Shoes & Accessories • Furniture, Home Furnishings & Electronics • Other GAFO - Miscellaneous Retailers (e.g. sporting goods, gift, hobby, toy etc.)
As indicated in Figure 6-5, Clarington residents are currently spending $355.3 million in GAFO stores, which is expected to increase to $722.2 million by 2031; a growth of $366.9 million.
Currently, an estimated $142.1 million (40%) is spent in Clarington GAFO stores. This share is influenced by the proximity of retail floor space in neighbouring Durham Region communities and the mobile work force. As of December 2011, there is 68,493 square metres (737,300 square feet) of GAFO floor space in Clarington with an average sales performance level of $2,964 per square metre ($275 per square foot) (assuming average inflow of 30%), which is considered within typical industry norms.
We have assumed that with additional GAFO floor space added in Clarington in future years, there would be an increase in the Clarington share to 52.5% by 2031. This recognizes that retail facilities located outside of Clarington (e.g. the Oshawa Centre and other existing/future retail developments in Oshawa) will continue to capture a portion of Clarington residents’ expenditures but to a lesser extent as new facilities are built in Clarington.
Based on our estimates of increases in the future Clarington share, which will continue to be influenced by existing and future development planned elsewhere in Durham Region, and particularly in Oshawa, the total residual expenditure potential available from Clarington residents has been estimated at $50.9 million in 2016, increasing to $237.1 million by 2031.
Based on the residual expenditures available from Clarington residents and estimated average inflow sales, some 73,420 square metres (790,300 square feet) of new GAFO floor space would be warranted by 2031 at an average sales performance level of $4305 per square metre ($400 per square foot) (see Figure 6-4). In the short term, by 2016, some 19,400 square metres (208,800 square feet) of GAFO floor space are warranted. It should be noted that the warranted floor space estimates in Figure 6-4 do not factor in any sales transfer opportunities from existing GAFO stores in Clarington.
As detailed in Section 5, Figure 5-12, of the floor space proposed/under construction in Clarington, this space is likely to comprise an estimated 12,440 square metres of GAFO space. This space, in addition to the vacant Canadian Tire property, will likely meet GAFO space needs over the next 5 year period. Over the long term, there will be a shortfall of available commercial lands to accommodate future GAFO needs. In total, we have estimated that vacant sites (including those with an application and without), could accommodate an estimated 41,205 square metres of GAFO floor space. Other opportunities could be available through intensification and/or redevelopment of existing properties.

Clarington Commercial Market Analysis Update
89
FIGURE 6-5: WARRANTED GAFO FLOOR SPACE IN CLARINGTON
CLARINGTON - NFSR: GAFO ANALYSIS
2011 Dollars 2011 2016 2021 2026 2031
ClaringtonGAFO Expenditure Potential ($Millions) $ 355.3 $ 428.8 $ 518.7 $ 618.5 $ 722.2
Cumulative Growth in Expenditure Potential $ 73.5 $ 163.4 $ 263.2 $ 366.9Estimated CLARINGTON Share of Total Potential %(1 40.0% 45.0% 47.5% 50.0% 52.5%Estimated CLARINGTON Share ($ Millions) $ 142.1 $ 193.0 $ 246.4 $ 309.3 $ 379.2Residual Potential for Existing/New GAFO Stores in Clarington $ 50.9 $ 104.3 $ 167.2 $ 237.1
$ 275
$ 2,964
A. WARRANTED ADDITIONAL GAFO FLOOR SPACE - CLARINGTON (including inflow, excluding sales transfers)Residual Potential Available from Clarington Residents ($Millions) $ 50.9 $ 104.3 $ 167.2 $ 237.1
% Inflow (2 25.0% 25.0% 25.0% 25.0%Inflow ($Millions) $ 17.0 $ 34.8 $ 55.7 $ 79.0
TOTAL ADDITIONAL SALES POTENTIAL AVAILABLE $ 67.9 $ 139.1 $ 222.9 $ 316.1 WARRANTED ADDITIONAL GAFO FLOOR SPACE - SQUARE FEET (3 Square Feet
@ $325 per sq. ft. 208,800 427,900 685,900 972,700 @ $350 per sq. ft. 193,900 397,300 637,000 903,200 @ $375 per sq. ft. 181,000 370,800 594,500 843,000 @ $400 per sq. ft. 169,700 347,700 557,300 790,300
WARRANTED ADDITIONAL GAFO FLOOR SPACE - SQUARE METRES (4 Square Metres@ $3500 per sq. metre 19,400 39,755 63,720 90,365 @ $3765 per sq. metre 18,015 36,910 59,180 83,910 @ $4035 per sq. metre 16,815 34,450 55,230 78,315 @ $4305 per sq. metre 15,765 32,300 51,775 73,420
SOURCE: urbanMetrics inc.
3) Rounded to the nearest 100 square feet.4) Rounded to the nearest 5 square metres.
2) urbanMetrics inc. estimate based on historic licence plate survey research conducted in Clarington for the 2005 Commercial Policy Review and urbanMetrics estimates.
1) The 2011 share has been estimated based on telephone survey research conducted by urbanMetrics for private sector clients in Durham Region in 2011, our review of the survey conducted for the 2005 Commercial Policy Review, and inventory.
Existing Clarington GAFO Stores (68,493 m2) Sales/Sq.Metre Levels (Including average Inflow of 30%):
Existing Clarington GAFO Stores(737,300 sq.ft.) Sales/Sq.Ft. Levels (Including estimated average Inflow of 30%) (2:

Clarington Commercial Market Analysis Update
90
As indicated in Figure 6-6, Clarington residents are currently spending some $86.3 million in pharmacies and personal care (PPC) stores which is expected to increase to $175.4 million by 2031(expressed in 2011 dollars); a growth of $89.1 million.
2) PHARMACIES AND PERSONAL CARE (PPC) STORES
Currently, about $69.0 million (80%) is spent in Clarington PPC stores. Therefore, based on the existing inventory, Clarington pharmacies and personal care stores are currently achieving average sales per square foot levels of about $8,962 per square metres ($833 per square foot) (assuming a 15% inflow factor). Currently (as of December 2011) there is an estimated 9,057 square metres (97,500 square feet ) of PPC store floor space in Clarington, with the majority of this space located in Bowmanville (65%). This includes drug stores, pharmacies, optical stores, nutrition stores and other health care stores.
Assuming an increase in the Clarington share in the future to 85% by 2031, the total residual expenditure potential available from Clarington residents for existing and new PPC stores in Clarington has been estimated at $16.9 million in 2016, increasing to $80.1 million by 2031 (see Figure 6-5).
Based on the residual expenditures available from Clarington residents and estimated inflow sales, approximately 10,340 square metres (111,300 square feet ) of new PPC store floor space is warranted in Clarington by 2031 at an average sales performance level of $8,615 per square metre ($800 per square foot). In the short term, an estimated 2,405 square metres are warranted. It should be noted that the space estimates in Figure 6-6 exclude any sales transfer opportunities from existing Clarington PPC stores or non-PPC stores selling health and personal care goods (e.g. supermarkets and department stores).
There are two existing projects under construction that will include pharmacy and personal care floor space: the Shoppers Drug Mart on Highway 2 in Courtice and the Hartwell Avenue professional centre in Bowmanville. These two projects would include an estimated 1,840 square metres of PPC floor space, which would meet short term needs. Future neighbourhood centres and the Courtice Town Centre are likely to accommodate a large portion of longer term PPC space needs, with likely some shortfall of available sites in the long term. In Bowmanville, the planned Brookhill neighbourhood could also accommodate a portion of future needs, with opportunities also in existing retail centres through intensification/redevelopment.

Clarington Commercial Market Analysis Update
91
FIGURE 6-6: WARRANTED PHARMACIES AND PERSONAL CARE STORE FLOOR SPACE
CLARINGTON - NFSR: PHARMACIES AND PERSONAL CARE (PPC) STORE ANALYSIS
2011 Dollars 2011 2016 2021 2026 2031
ClaringtonPharmacies and Personal Care Expenditure Potential ($Millions) $ 86.3 $ 104.1 $ 126.0 $ 150.2 $ 175.4
Cumulative Growth in Expenditure Potential $ 17.8 $ 39.7 $ 63.9 $ 89.1Estimated CLARINGTON Share of Total Potential %(1 80.0% 82.5% 85.0% 85.0% 85.0%Estimated CLARINGTON Share ($ Millions) $ 69.0 $ 85.9 $ 107.1 $ 127.7 $ 149.1
$ 16.9 $ 38.1 $ 58.7 $ 80.1
$ 833
$ 8,962
A. WARRANTED ADDITIONAL PPC FLOOR SPACE IN CLARINGTON (Including Inflow and Excluding Sales Transfers)Residual Potential Available from Clarington Residents ($Millions) $ 16.9 $ 38.1 $ 58.7 $ 80.1
Inflow (%) 10.0% 10.0% 10.0% 10.0%Inflow ($Millions) $ 1.9 $ 4.2 $ 6.5 $ 8.9
TOTAL ADDITIONAL SALES POTENTIAL AVAILABLE $ 18.8 $ 42.3 $ 65.2 $ 89.0
WARRANTED ADDITIONAL PPC STORE FLOOR SPACE - SQUARE FEET (3 Square Feet@ $725 per sq. ft. 25,900 58,400 90,000 122,800 @ $750 per sq. ft. 25,000 56,400 87,000 118,700 @ $775 per sq. ft. 24,200 54,600 84,200 114,800 @ $800 per sq. ft. 23,500 52,900 81,500 111,300
WARRANTED ADDITIONAL PPC STORE FLOOR SPACE - SQUARE METRES (4 Square Metres@ $7810 per sq. metre 2,405 5,425 8,360 11,410 @ $8075 per sq. metre 2,325 5,240 8,085 11,030 @ $8345 per sq. metre 2,250 5,075 7,820 10,665 @ $8595 per sq. metre 2,185 4,915 7,570 10,340
SOURCE: urbanMetrics inc.
3) Rounded to the nearest 100 square feet.4) Rounded to the nearest 5 square metres.
2) urbanMetrics inc. estimate based on historic licence plate survey research conducted in Clarington for the 2005 Commercial Policy Review and urbanmetrics estimates.
1) The 2011 share has been estimated based on telephone survey research conducted by urbanMetrics for private sector clients in Durham Region in 2011, our review of the survey conducted for the 2005 Commercial Policy Review, and inventory.
Existing Clarington Pharmacies and Personal Care Stores (9050 m2) Sales/Sq.Metre Levels (Including average Inflow of 15%):
Existing Clarington Pharmacies and Personal Care Stores (97,500 sq.ft.) Sales/Sq.Ft. Levels (Including average Inflow of 15%(2):
Residual Potential for Existing/New PPC Stores in Clarington

Clarington Commercial Market Analysis Update
92
As indicated in Figure 6-7, Clarington residents are currently spending some $66.0 million in building and outdoor home supply stores. This is expected to increase to $134.1 million by 2031, which yields a growth of some $68.1 million over the next 20 years.
3) BUILDING AND OUTDOOR HOME SUPPLY (BOHS) STORES
Currently, an estimated 50% of Clarington residents BOHS dollars ($33.0 million) are spent in Clarington BOHS stores, which includes stores such as Home Depot, Home Hardware, RONA, paint stores and garden centres16
Currently there is 19,175 square metres (206,400 square feet) of building and outdoor home supply store floor space in Clarington. In addition to public sales, BOHS stores typically have a large percentage of their sales from the trades, including landscapers and contractors. Although Statistics Canada Retail Trade would include sales made in BOHS stores by contractors and trades, our analysis is based on household expenditures. Therefore, average sales per square foot levels for Clarington BOHS stores indicated could be higher than indicated.
. Therefore, based on the existing inventory, Clarington building and outdoor home supply stores are currently achieving average sales levels of about $2,648 per square metre ($246 per square foot) (assuming a 35% inflow factor).
With increases in the Clarington share to 65% by 2031, the total residual expenditure potential available from Clarington residents for BOHS stores has been estimated at $10.8 million in 2016, increasing to $47.5 million by 2031. Based on the residual expenditures available from Clarington residents and estimated average inflow sales of 30%, 16,815 square metres (181,000 square feet) of new building and outdoor home supply store floor space is warranted in Clarington by 2031 at an average sales performance level of $4,040 per square metre ($375 per square foot). The warranted space estimates exclude sales transfers from existing BOHS stores in Clarington or other stores selling BOHS type merchandise (e.g. department stores).
Currently, there are no building and outdoor home supply stores proposed in Clarington. There is, however, a vacant RONA on Baseline Road in Bowmanville of some 7,246 square metres (78,000 square feet).
16 Nurseries/garden centres, with a greenhouse operation, have been excluded from the inventory as they are not classified as “Retail” in NAICS.

Clarington Commercial Market Analysis Update
93
FIGURE 6-7: WARRANTED BOHS FLOOR SPACE IN CLARINGTON
CLARINGTON - NFSR: BUILDING AND OUTDOOR HOME SUPPLY (BOHS) ANALYSIS
2011 Dollars 2011 2016 2021 2026 2031
ClaringtonBOHS Expenditure Potential ($Millions) $ 66.0 $ 79.6 $ 96.3 $ 114.9 $ 134.1
Cumulative Growth in Expenditure Potential $ 13.6 $ 30.3 $ 48.9 $ 68.1Estimated CLARINGTON Share of Total Potential %(1 50.0% 52.5% 55.0% 57.5% 60.0%Estimated CLARINGTON Share ($ Millions) $ 33.0 $ 41.8 $ 53.0 $ 66.1 $ 80.5
$ 8.8 $ 20.0 $ 33.1 $ 47.5
$ 246
$ 2,648
A. WARRANTED ADDITIONAL BOHS FLOOR SPACE IN CLARINGTON (including inflow, excluding sales transfers)Residual Potential Available from Clarington Residents $ 8.8 $ 20.0 $ 33.1 $ 47.5
Inflow (%) 30.0% 30.0% 30.0% 30.0%Inflow ($Millions) $ 3.8 $ 8.6 $ 14.2 $ 20.4
TOTAL ADDITIONAL SALES POTENTIAL AVAILABLE $ 12.6 $ 28.6 $ 47.3 $ 67.9
WARRANTED ADDITIONAL BOHS FLOOR SPACE (SQUARE FEET) (3@ $300 per sq. ft. 41,900 95,200 157,600 226,200 @ $325 per sq. ft. 38,700 87,900 145,500 208,800 @ $350 per sq. ft. 35,900 81,600 135,100 193,900 @ $375 per sq. ft. 33,500 76,200 126,100 181,000
WARRANTED ADDITIONAL BOHS FLOOR SPACE (SQUARE METRES) (4 Square Metres@ $3230 per sq. metre 3,895 8,845 14,640 21,015 @ $3495 per sq. metre 3,595 8,165 13,515 19,400 @ $3770 per sq. metre 3,335 7,580 12,550 18,015 @ $4040 per sq. metre 3,110 7,080 11,715 16,815
SOURCE: urbanMetrics inc.
3) Rounded to the nearest 100 square feet.4) Rounded to the nearest 5 square metres.
(excludes contractor trade)
2) urbanMetrics inc. estimate based on historic licence plate survey research conducted in Clarington for the 2005 Commercial Policy Review and urbanmetrics estimates.
1) The 2011 share has been estimated based on telephone survey research conducted by urbanMetrics for private sector clients in Durham Region in 2011, our review of the survey conducted for the 2005 Commercial Policy Review, and inventory.
Existing Clarington BOHS Stores (206,400 sq.ft.) Sales/Sq.Ft. Levels (Including average Inflow of 35%(2):
Square Feet
Existing Clarington BOHS Stores (19,176 m2) Sales/Sq.Metre Levels (Including average Inflow of 35%):
Residual potential for Existing/New BOHS stores in Clarington
(excludes contractor trade)

Clarington Commercial Market Analysis Update
94
6.1.3 WARRANTED OTHER RETAIL/SERVICE FLOOR SPACE
The following section examines the future demand for other retail (i.e. liquor/beer/wine) and service orientated floor space in Clarington based on a per capita floor space ratio approach.
It must be recognized that this approach imposes a somewhat generic or “typical” set of market demand conditions on the current and future population of Clarington. These conditions are based on existing service levels in Clarington and observations made in a variety of other market areas and, as such, cannot directly reflect special circumstances or characteristics such as level of income and regional or local preferences. For the purposes of our analysis, we have assumed that outflow (i.e. expenditures of Clarington residents made outside Clarington) would equate to inflow (i.e. from non-residents).
The following retail and service floor space facilities are included in this analysis:
• Other Retail - Beer, Liquor, and Wine;
Selected Services (typically found in shopping centres and ground floor locations):
• Consumer Goods Rental; • Food Services including restaurants and fast food; • Financial Services including banks, trust companies and credit unions; • Personal Care services including hair salons, dry cleaners;
Other Services:
• Entertainment services including theatres, arcades, bowling alleys, and similar establishments; • Repair and Maintenance; • Health Care services including medical and dental; • Other local serving offices including real estate agencies, travel agencies, accounting and legal
offices, financial advisors, other professional offices and similar establishments.
It should be noted that our inventory includes office space located in multiple stories, which typically includes the following uses:
• Health care services, and • Local serving offices, including real estate agencies, travel agencies, accounting and legal
offices, financial advisors, other professional offices and similar establishments.
Because of the unique locational and market-driven factors that influence their supply, these two service categories are often located in professional office buildings or non-ground floor units.
For the purpose of this analysis, space ratios have been expressed on a square foot basis, with warranted space expressed as both square feet and square metres. As indicated in Figure 6-8, the floor space per capita amount of selected other retail/service floor space in Clarington is currently at 9.9 square feet, which is lower than the levels observed in other similar sized municipalities and communities. Therefore, continued increases in the floor space per capita ratios are assumed for

Clarington Commercial Market Analysis Update
95
Clarington in the future. Notwithstanding that some service space categories (e.g. financial services17
With a forecast increase in per capita Other Retail/Service levels in the future to almost 12.0 square feet by 2031, an additional 72,780 square metres (783,300 square feet) of Other Retail/Service floor space would be warranted in Clarington (assuming that inflow is equal to outflow).
) could be considered below ratios observed in other similar-sized communities, we have assumed a conservative 1% per year growth in space per capita ratios in forecasting overall future needs for “Other Retail/Service floor space.” This growth rate has been based on our review of the historic growth rate since 2003 in Clarington. The floor space forecast by category should be considered a general guideline only as every market has different circumstances that could result in varying service levels. Business decisions, competition, location, extent of area served, tourism, population, employment, commuting patterns and other factors can all influence the number of service facilities required in a community and service levels.
17 In evaluating a site specific application in 2008 for Kaitlin Group’s proposed mixed-use commercial development in the BWTC, urbanMetrics utilized a forecast space ratio for banks of 1.0 square feet per capita which can be considered a “standard” ratio. Considering that Clarington’s bank space per capita has not changed significantly in recent years, the use of the 1% annual growth rate is assumed as reasonable for the purpose of forecasting service needs overall in the municipality. Site specific applications, however, would need to be evaluated in terms of bank requirements, location and other considerations.

Clarington Commercial Market Analysis Update
96
FIGURE 6-8: FLOOR SPACE PER CAPITA ANALYSIS – OTHER RETAIL/SERVICES
CLARINGTON - PER CAPITA SPACE ANALYSISADDITIONAL WARRANTED OTHER RETAIL/SERVICE SPACE (assume INFLOW = OUTFLOW)
2016 Population: 100,800 (32011 Square
Metres2011 Square
Feet
Square Feet/ Capita
Existing 2011
Future Target Ratio Sq.ft./
Capita (12016 Warranted
Space (Sq.Ft.)
2016 Net Additional Space Warranted
(sq.ft.) (2
2016 Additional Space Warranted
(sq.metres) (2
Other Retail - Liquor/Beer/Wine 2,488 26,800 0.3 0.3 31,600 4,800 445Service - Consumer Goods Rental 817 8,800 0.1 0.1 10,400 1,600 150Service - Financial 5,006 53,900 0.6 0.6 63,500 9,600 890Service - Personal Care 6,973 75,100 0.8 0.9 88,500 13,400 1,245Services: Food Services & Drinking Places 23,186 249,600 2.8 2.9 294,200 44,600 4,145Service - Health Care 16,123 173,600 1.9 2.0 204,600 31,000 2,880Service - Insurance & Real Estate 3,754 40,400 0.4 0.5 47,600 7,200 670Service - Other Financial 2,051 22,100 0.2 0.3 26,000 3,900 360Service - Professional, Scientific & Technical 4,941 53,200 0.6 0.6 62,700 9,500 885Service - Cultural, Entertainment & Recreation 8,073 86,900 1.0 1.0 102,400 15,500 1,440Service - Other 9,624 103,600 1.2 1.2 122,100 18,500 1,720
Sub Total - Services 80,548 867,200 9.7 10.1 1,022,000 154,800 14,385Total 83,036 894,000 10.0 10.5 1,053,600 159,600 14,830
2021 Population: 114,0002011 Square
Metres2011 Square
Feet
Square Feet/ Capita
Existing 2011
Future Target Ratio Sq.ft./
Capita (12021 Warranted
Space (Sq.ft)2021 Additional Space Warranted (sq.ft.) (2
2021 Additional Space Warranted
(sq.metres) (2
Other Retail - Liquor/Beer/Wine 2,488 26,800 0.3 0.3 37,400 10,600 985Service - Consumer Goods Rental 817 8,800 0.1 0.1 12,300 3,500 325Service - Financial 5,006 53,900 0.6 0.7 75,300 21,400 1,990Service - Personal Care 6,973 75,100 0.8 0.9 104,900 29,800 2,770Services: Food Services & Drinking Places 23,186 249,600 2.8 3.1 348,600 99,000 9,200Service - Health Care 16,123 173,600 1.9 2.1 242,400 68,800 6,390Service - Insurance & Real Estate 3,754 40,400 0.4 0.5 56,400 16,000 1,485Service - Other Financial 2,051 22,100 0.2 0.3 30,900 8,800 820Service - Professional, Scientific & Technical 4,941 53,200 0.6 0.7 74,300 21,100 1,960Service - Cultural, Entertainment & Recreation 8,073 86,900 1.0 1.1 121,400 34,500 3,205Service - Other 9,624 103,600 1.2 1.3 144,700 41,100 3,820Sub Total - Services 80,548 867,200 9.7 10.4 1,211,200 344,000 31,960Total 83,036 894,000 10.0 10.8 1,248,600 354,600 32,945
2026 Population: 127,6002011 Square
Feet
Square Feet/ Capita
Existing 2011
Future Target Ratio Sq.ft./
Capita (12026 Warranted
Space (sq.ft)2026 Additional Space Warranted (sq.ft.) (2
2026 Additional Space Warranted
(sq.metres) (2
Other Retail - Liquor/Beer/Wine 2,488 26,800 0.3 0.3 43,800 17,000 1,580Service - Consumer Goods Rental 817 8,800 0.1 0.1 14,400 5,600 520Service - Financial 5,006 53,900 0.6 0.7 88,100 34,200 3,180Service - Personal Care 6,973 75,100 0.8 1.0 122,700 47,600 4,425Services: Food Services & Drinking Places 23,186 249,600 2.8 3.2 407,900 158,300 14,710Service - Health Care 16,123 173,600 1.9 2.2 283,700 110,100 10,230Service - Insurance & Real Estate 3,754 40,400 0.4 0.5 66,000 25,600 2,380Service - Other Financial 2,051 22,100 0.2 0.3 36,100 14,000 1,300Service - Professional, Scientific & Technical 4,941 53,200 0.6 0.7 86,900 33,700 3,130Service - Cultural, Entertainment & Recreation 8,073 86,900 1.0 1.1 142,000 55,100 5,120Service - Other 9,624 103,600 1.2 1.3 169,300 65,700 6,105Sub Total - Services 80,548 867,200 9.7 11.1 1,417,100 549,900 51,090Total 83,036 894,000 10.0 11.4 1,460,900 566,900 52,670
2031 Population: 140,4002011 Square
Feet
Square Feet/ Capita
Existing 2011
Future Target Ratio Sq.ft./
Capita (12031 Warranted
Space (sq.ft.)2031 Additional Space
Warranted (sq.ft) (2
2031 Additional Space Warranted
(sq.metres) (2
Other Retail - Liquor/Beer/Wine 2,488 26,800 0.3 0.4 50,300 23,500 2,185Service - Consumer Goods Rental 817 8,800 0.1 0.1 16,500 7,700 715Service - Financial 5,006 53,900 0.6 0.7 101,100 47,200 4,385Service - Personal Care 6,973 75,100 0.8 1.0 140,900 65,800 6,115Services: Food Services & Drinking Places 23,186 249,600 2.8 3.3 468,300 218,700 20,320Service - Health Care 16,123 173,600 1.9 2.3 325,700 152,100 14,130Service - Insurance & Real Estate 3,754 40,400 0.4 0.5 75,800 35,400 3,290Service - Other Financial 2,051 22,100 0.2 0.3 41,500 19,400 1,800Service - Professional, Scientific & Technical 4,941 53,200 0.6 0.7 99,800 46,600 4,330Service - Cultural, Entertainment & Recreation 8,073 86,900 1.0 1.2 163,000 76,100 7,070Service - Other 9,624 103,600 1.2 1.4 194,400 90,800 8,435Sub Total - Services 80,548 867,200 9.7 11.6 1,627,000 759,800 70,595Total 83,036 894,000 10.0 11.9 1,677,300 783,300 72,780Source: urbanMetrics inc1) Future Target Ratios based on urbanMetrics estimates of 1% per year growth based on historic trends (1% average annual between 2003 and 2011).2) Assuming Inflow = Outflow. Total warranted space less existing space.3) Population for all years based on resident population.4) Includes a range of other services,selected office administrative services (e.g. travel agencies) , consumer goods repair, and others.

Clarington Commercial Market Analysis Update
97
6.2 SUMMARY - SUPPLY AND DEMAND RECONCILIATION
An evaluation of demand (i.e. the amount of warranted additional FSR, NFSR, Other Retail and Service floor space) and available supply of land/floor space to meet future needs in Clarington over the 2011 to 2031 period, has been detailed in Figure 6-10 (see Appendix B for calculations by store type and location for 2031). As previously indicated, excluded from our floor space estimates are certain arterial commercial uses which have not been evaluated, such as automobile dealerships, gas stations and accommodation uses. It should be noted that our analysis of warranted floor space is considered a guideline only and must be evaluated in the context of the assumptions utilized, including recapture opportunities, average sales per square foot levels, per capita ratios and inflow.
• DEMAND - In total, by 2031, 197,035 square metres (2,120,800 square feet) of additional retail and service floor space is warranted in Clarington (assuming the higher sales performance level range utilized for FSR and NFSR by 2031). As indicated in Figure 6-9, about 12% of this floor space warranted is for FSR space, with 51% for NFSR and 37% for Other Retail/Services.
The warranted additional floor space has been allocated by area based on our review of proposed space, vacant commercial land, and service levels. For Bowmanville, we have allocated some 133,045 square metres (1.4 million square feet) of new floor space by 2031 or about 68% of the total additional floor space warranted in Clarington. Courtice and Newcastle Village have been allocated 21% and 8% respectively. Other Clarington has been allocated just under 4%. It should be noted that location preferences of retailers, accessibility, competition in neighbouring municipalities, and other factors could result in some variation of the allocation by area. As such, these allocations can only be considered as general guidelines.
• FUTURE SUPPLY - The future supply (as summarized in Figure 6-11) has been estimated at 105,115 square metres (1,131,400 square feet) of floor space, with the majority of space (56%) in the Bowmanville urban area. In Courtice, a large portion of the future supply is in the Courtice Town Centre (up to 20,000 square metres of floor space assumed). In Newcastle, the majority of the future space is comprised of the proposed No Frills site in the Village Centre.
NFSR, 100,575 , 51%
FSR, 23,680 , 12%
SERVICES, 72,780 , 37%
CLARINGTON -Additional Floor Space Needs - 2031
(Square Metres)
FIGURE 6-9: RETAIL AND SERVICE SPACE NEEDS, 2031

Clarington Commercial Market Analysis Update
98
FIGURE 6-10: FUTURE SUPPLY (SQUARE METRES) : WARRANTED FLOOR SPACE AND ADDITIONAL LAND AREA REQUIREMENTS
WARRANTED ADDITIONAL RETAIL AND SERVICE FLOOR SPACE IN CLARINGTON
2016 2021 2026 2031 2016 2021 2026 2031ADDITIONAL FLOOR SPACE REQUIRED:Non-Food Store Retail (NFSR) - GAFO, Pharmacy & Personal Care, Building and Outdoor Home Supply
298,700 628,000 1,008,200 1,427,700 27,750 58,340 93,660 132,640 276,600 541,600 813,800 1,082,600 25,700 50,315 75,600 100,575
Food Store Retail (FSR) - Supermarkets and other food stores79,700 160,800 249,700 318,600 7,405 14,940 23,200 29,600 75,000 143,000 210,300 254,900 6,970 13,285 19,540 23,680
TOTAL NFSR AND FSR RETAIL SPACE378,400 788,800 1,257,900 1,746,300 35,155 73,280 116,865 162,235
351,600 684,600 1,024,100 1,337,500 32,670 63,600 95,140 124,255 SELECTED OTHER RETAIL/SERVICE SPACE
159,600 354,600 566,900 783,300 14,830 32,945 52,670 72,780 TOTAL ADDITIONAL FLOOR SPACE REQUIRED
511,200 1,039,200 1,591,000 2,120,800 47,500 96,545 147,810 197,035 Estimated Allocation by Area: (1Bowmanville 345,180 701,705 1,074,299 1,432,039 32,074 65,191 99,807 133,045 Courtice 105,958 215,398 329,771 439,584 9,845 20,011 30,637 40,840 Newcastle 40,603 82,541 126,369 168,450 3,773 7,668 11,740 15,650 Other (2 19,458 39,556 60,560 80,727 1,808 3,675 5,626 7,500
5.1 9.1 12.5 15.1 0.5 0.8 1.2 1.4
TOTAL FLOOR SPACE SUPPLY (PROPOSED AND VACANT COMMERCIAL LAND)1,131,440 1,131,440 1,131,440 1,131,440 105,115 105,115 105,115 105,115
Estimated Floor Space Supply by Area (3Bowmanville 634,800 634,800 634,800 634,800 58,975 58,975 58,975 58,975 Courtice 375,550 375,550 375,550 375,550 34,890 34,890 34,890 34,890 Newcastle 40,360 40,360 40,360 40,360 3,750 3,750 3,750 3,750 Other (2 80,730 80,730 80,730 80,730 7,500 7,500 7,500 7,500
SURPLUS (+)/SHORTFALL (-)620,240 92,240 -459,560 -989,360 57,615 8,570 -42,695 -91,920
Estimated Surplus/Shortfall by AreaBowmanville 289,620 -66,905 -439,499 -797,239 26,901 -6,216 -40,832 -74,070 Courtice 269,592 160,152 45,779 -64,034 25,045 14,879 4,253 -5,950 Newcastle -243 -42,181 -86,009 -128,090 -23 -3,918 -7,990 -11,900 Other (2 61,272 41,174 20,170 3 5,692 3,825 1,874 0
ADDITIONAL LAND AREA REQUIRED
0.0 0.0 42.2 90.9 0.0 0.0 17.1 36.8
Bowmanville 0.0 6.1 40.4 73.2 0.0 2.5 16.3 29.6Courtice 0.0 0.0 0.0 5.9 0.0 0.0 0.0 2.4Newcastle 0.0 3.9 7.9 11.8 0.0 1.6 3.2 4.8Other (2 0.0 0.0 0.0 0.0 0.0 0.0 0.0 0.0
SOURCE: urbanMetrics inc.1) urbanMetrics estimates based on our review of proposals, vacant sites and existing service levels.
3) urbanMetrics estimates based on our review of vacant lands and proposed space.4) Standard coverage factor used in the development industry.
Hectares
Additional Floor Space Per Capita
Additional Land Area Required @ 25% coverage (4
Acres
Square Metres (nearest 5)Square Feet (nearest 100)
2) Includes Orono, rural settlement areas, and the Highway 35/115 corridor (vacant sites available but likelihood of development could be limited).

Clarington Commercial Market Analysis Update
99
FIGURE 6-11: FUTURE SUPPLY OF COMMERCIAL SPACE
• SURPLUS/SHORTFALL – Overall, there are sufficient lands available to accommodate future
needs to at least 2021. On an area basis, there will be a shortfall in Bowmanville and Newcastle likely by 2021, although this shortfall is not significant. By 2026, the shortfall in Bowmanville increases to about 40,832 square metres, with some 7,990 square metres in Newcastle. Courtice has sufficient lands designated to at least 2031.
• LAND NEED - Assuming 25% coverage18
18 Lot Coverage is the size of the footprint of a building and/or structure on a lot divided by the size of the parcel, expressed as a percentage or decimal number. The lot coverage is used in calculating the intensity of use of a parcel for development project. For example, a footprint of 1000 square metres on a lot of 4,000 square metres (0.4 hectares) results in lot coverage of .25 or 25%. A coverage of 25% is typical for a retail development as it includes sufficient space for parking and landscaping.
, based on the available supply and future demand, by 2031, Clarington would require an additional 37 hectares (91 acres) of commercial land (see Figures 6-10 and 6-12). Of this total, we have estimated that Bowmanville would need an additional 30 hectares; Courtice some 2 hectares; and Newcastle about 5 hectares. Some of these land needs could be accommodated through intensification and redevelopment of existing commercial sites.
Bowmanville Courtice Newcastle Orono OtherFloor Area - Vacant Sites - No application 5,170 3,085 600 0 4,960Other Vacant Floor Area Based on OP 10,000 7,715 0 0 0Proposed/ Under Construction Floor Area 25,955 19,930 3,150 0 0Uptake - Vacant Existing Floor Space 17,850 4,160 0 440 2,100
0
5,000
10,000
15,000
20,000
25,000
30,000
Squa
re M
etre
s
Estimated Future Supply of Commercial Floor Space (Square Metres)

Clarington Commercial Market Analysis Update
100
FIGURE 6-12: SURPLUS/SHORTFALL OF SPACE AND LAND NEED
Demand –197,035 square metres of additional retail and service floor space by
2031
Vacant Supply – Can accommodate an
estimated 105,115 square metres of floor space
Conclusions: Up to 37 hectares of additional lands would be required to accommodate future needs with up to 30
hectares in Bowmanville
SHORTFALL – 91,920 square metres of floor space to be accommodated through designation of additional commercial land
and intensification/redevelopment of underutilized properties
Market Analysis
2016 2021 2026 2031Bowmanville 0.0 2.5 16.3 29.6 Courtice 0.0 0.0 0.0 2.4 Newcastle 0.0 1.6 3.2 4.8 Other 0.0 0.0 0.0 0.0
0.0
5.0
10.0
15.0
20.0
25.0
30.0
35.0
Additional Land Area Required to Accommodate Additional
Commercial Floor Space (hectares)

Clarington Commercial Market Analysis Update
101
Based on our estimates of land need, the following provides our recommendations as to where lands should be designated in each of the major Urban Areas to accommodate the shortfall in floor space needs (see Figure 6-10 for details):
• Bowmanville – up to 30 additional hectares required by 2031- It should be noted that our analysis of vacant supply assumes that two additional “Neighbourhood Centres”, as designated in the Official Plan, would be developed by 2031 to a maximum of 5,000 square metres. One of the sites is located on Regional Road 57 and could potentially accommodate a supermarket anchored centre. The other site, also in north Bowmanville, is likely more suitable for a smaller convenience type plaza. In terms of where the shortfall could be accommodated, some allocation should be provided for the future Brookhill community. The Brookhill Neighbourhood Secondary Plan designates the “Village Corridor”, which is planned to comprise a mix of uses including retail and office. To accommodate regional serving uses (i.e. GAFO store types), additional lands within the Bowmanville West Town Centre (BWTC) should be re-designated (e.g. from “office commercial”) or the area expanded to the west which would require a boundary adjustment. This would strengthen this regional node. There may be opportunities for intensification of some of the existing sites in the BWTC such as the Clarington Centre or vacant Canadian Tire site. Within Bowmanville’s East Town Centre (BETC) there are likely opportunities for intensification and redevelopment, including the consolidation of small lots with expanding this area. Some future opportunity may also exist further to the east of the BETC along Highway 2 to designated land for retail uses.
• Courtice – up to 2 additional hectares are required by 2031 - With the Courtice Town Centre yet to be developed and other vacant commercial sites available in the community, no additional lands are required to be designated in Courtice. We assume that any shortfall would be accommodated through intensification on existing sites and future redevelopment along the Highway 2 corridor.
• Newcastle Village - up to 5 additional hectares are required by 2031 – Newcastle
Village is forecast to increase by almost 10,000 persons over the next 20 year period. Currently, there are limited opportunities to accommodate additional space needs in the community. Additional commercial land should be designated in close proximity to the Village Centre to minimize any potential impacts.

This page intentionally left blank

Clarington Commercial Market Analysis Update
102
7 WHERE ARE WE HEADED? OFFICE FLOOR SPACE NEEDS
The demand for office space is generally considered a derived demand. Firms typically rent office space as an input to the production of services or goods they provide to businesses and households. These businesses and households can be local, regional, or even on a national level. In general, the major tenants of office buildings are firms providing finance, insurance, real estate, and other services, including primarily professional, business, and government services. If market demand for such services increases, demand for office space will also increase. In Clarington, office space uses are generally considered “population-related”, including medical/dental and a range of professional and business services (e.g. accounting, legal, real estate).
Demand for office building space in a community is typically driven by a number of factors, including the composition of the local economy, the availability of a skilled labour force, as well as changes occurring in the economic base. In Clarington, the increased role of Bowmanville as the major urban centre in the Municipality with the continued expansion in the retail sector, new housing development and anticipated major economic growth drivers, including the energy sector and Technology Business Park, are expected to result in an increased demand for office space type uses in the future. On the Other hand, certain factors, such as the continued out-migration of workers and economic conditions, could limit future growth in office employment.
As previously discussed, Clarington has two “major office” buildings (i.e. 20,000 square feet or greater): one in Courtice in the Courtice West Shopping District and the other in the Bowmanville East Town Centre. Comprising a total of 84,337 square feet (7,835 square metres), both accommodate primarily health care services and “population-related” employment.
Clarington has a number of well-located office commercial sites that could accommodate future “major-office” buildings; however, the accommodation of office uses that has been occurring in recent years is either part of a mixed-use project or located in commercial buildings less than 1,860 square metres (20,000 square feet). For example, the Shopper’s Drug Mart, currently under construction in the Courtice West Shopping District, will have a second floor with some 948 square metres (10,204 square feet) of medical office space. The Hartwell Avenue Professional Centre in Bowmanville, also under construction in a designated “Neighbourhood Centre” node, will have 1,642 square metres (17,675 square feet) of floor space for office uses as well as a pharmacy.
The type of existing office employment in Clarington can be considered primarily “population-related” -- e.g. real estate offices, lawyers, insurance agents, accountants, financial services, and health care services (e.g. doctors, dentists, other health professionals). The Hartwell Avenue Professional Centre and the Shopper’s Drug Mart project in Courtice will both accommodate additional “population-related” jobs. Although two “major office” projects have been proposed in Bowmanville for some time, it is likely that the development of these projects would be long term. Sites exist for other office projects or mixed-use projects with office components in other locations (e.g. Courtice Town Centre, Courtice West Business District).

Clarington Commercial Market Analysis Update
103
7.1 “MAJOR OFFICE” SPACE NEEDS
As previously discussed, Hemson has forecast total future employment for Clarington which has largely been based on the activity rate method (defined as the number of jobs in Clarington divided by the resident population). Based on employment estimated, Hemson has estimated the share attributed to “major office” employment. This is a standard method for forecasting employment. Major office employment is currently estimated by Hemson at 373 employees19
In Figure 7-1, the Hemson floor space estimates have been compared to another methodology which forecasts growth in “major office” space based on assumed increases in space per capita (inherently recognizes increases in the activity rates). This would yield about 5,310 square metres (57,200 square feet) less floor space than the Hemson forecast for 2031 but still assumes that the community would be successful in attracting more than just “population-related” type “major-office” employment.
, with the growth in major office employment forecast by Hemson at 730 additional “major office” jobs over the next 20 years. This job growth forecast assumes an increase in the activity rate. The jobs translate into office floor space needs over the 20 year period of 19,770 square metres (212,200 square feet) at a floor space requirement of 27 square metres (290 square feet) per job.
Given Clarington’s location at the outer edge of the Greater Toronto Area, Clarington’s ability to attract non-population related office users to occupy some 14,400 to 19,710 square metres (155,000 to 212,200 square feet) of “major-office” floor space, could be considered unrealistic at this time. Population-related office space needs, however, are expected to increase. Some of these floor space needs could be met in existing vacant space, as well as new developments currently under construction (e.g. Hartwell Avenue).
FIGURE 7-1: “MAJOR OFFICE” FLOOR SPACE DEMAND ANALYSIS
19 Current existing Major Office space of 84,337 square feet divided by 290 square feet per employee (27 square metres per employee) equates to 291 jobs.
"MAJOR OFFICE" FLOOR SPACE DEMAND
2011 2016 2021 2026 2031Population 89,800 100,800 114,000 127,600 140,400 A. urbanMetrics - Floor Space Per Capita MethodSq.Ft. "Major Office" Buildings 84,300 114,300 149,300 189,300 239,300
Square Feet Per Capita 0.9 1.1 1.3 1.5 1.7Growth in Major Office Floor Space (sq.ft.) 30,000 65,000 105,000 155,000
Sq.Metres "Major Office" Buildings 7,830 10,620 13,870 17,590 22,230 Square Metres Per Capita 0.1 0.1 0.1 0.1 0.2Growth in Major Office Floor Space (m2) 2,790 6,040 9,760 14,400
B. Based on Hemson Development Charges Forecast of Office EmploymentSq.Ft. "Major Office" Buildings 108,400 163,000 234,000 274,400 320,600 Square Feet Per Capita 1.2 1.6 2.1 2.2 2.3Growth in Major Office Floor Space (sq.ft.) 54,600 125,600 166,000 212,200
Sq.Metres "Major Office" Buildings 10,070 15,140 21,740 25,490 29,780 Square Feet Per Capita 0.1 0.2 0.2 0.2 0.2Growth in Major Office Floor Space (m2) 5,070 11,670 15,420 19,710
SOURCE: urbanMetrics inc.

Clarington Commercial Market Analysis Update
104
7.2 OTHER OFFICE SPACE NEEDS
In Clarington, we have estimated that there is currently some 26,869 square metres of “population related” office space (see Section 3, Figure 3-23). Some of the space is accommodated in shopping centres, converted residential dwellings and in the Town/Village centres.
Based on our service space analysis in Section 6 of this report, which utilizes a space per capita approach, Figure 7-3 provides a summary of the future warranted population related office space and future service levels by area.
As indicated in Figure 7-2, an estimated 23,550 square metres of additional population-related office space would be required by 2031. Of this total space, we have estimated that 70% would be required in Bowmanville (16,580 square metres). Some of this space could be accommodated in “major office” buildings, if developed.
FIGURE 7-2: POPULATION RELATED OFFICE SPACE – ESTIMATED FUTURE NEED BY AREA
POPULATION RELATED OFFICE SPACE - ESTIMATE OF FUTURE NEED
2011 2016 2021 2026 2031ADDITIONAL POPULATION RELATED SERVICE SPACE WARRANTED (Square Metres) (1Bowmanville 3,376 7,502 11,997 16,580 Courtice 778 1,730 2,766 3,823 Newcastle 522 1,160 1,855 2,564 Other 119 264 421 582 TOTAL (Figure 6-7) 4,795 10,655 17,040 23,550TOTAL POPULATION RELATED SERVICE SPACE (Square Metres)Bowmanville 15,899 19,275 23,401 27,896 32,479 Courtice 6,447 7,225 8,177 9,213 10,270 Newcastle 3,325 3,847 4,485 5,180 5,889 Other 1,198 1,317 1,462 1,619 1,780 TOTAL 26,869 31,664 37,524 43,909 50,419 SERVICE LEVELBowmanville 59% 61% 62% 64% 64%Courtice 24% 23% 22% 21% 20%Newcastle 12% 12% 12% 12% 12%Other 4% 4% 4% 4% 4%TOTAL 100% 100% 100% 100% 100%
SOURCE: urbanMetrics inc.1) Distribution estimated by urbanMetrics.

Clarington Commercial Market Analysis Update
105
7.3 SUMMARY
The future market need for non-population related “major office” building space is considered limited in Clarington over the next 20 years. The demand for this type of space will be influenced primarily by economic growth in Clarington (including the Darlington Refurbishment and Darlington New Build), population growth, tenant interest, and the availability of other office sites elsewhere in Durham Region.
It should be noted that the service sector, which includes most of the office-space-using firms, has been growing faster than any other sector for decades because of the ongoing transition of the economy from a manufacturing one to a service one. In Clarington, office type jobs in the service sector increased by over 40% between 2001 and 2006 (see Section 4, Figure 5-8).
A significant amount of “population-related” office space will be required in Clarington in future years, some of which could be accommodated in office buildings, retail centres and mixed-used centres. We have estimated that “population-related” office floor space needs will increase by some 23,550 square metres over the next 20 year period, based primarily on future population growth.
With permissions for retail uses limited for “Office Commercial” designated sites, and the long term warranted retail floor space needs exceeding available land, the municipality may need to consider providing for a mix of uses on office-commercial sites, and particularly in the Bowmanville West Town Centre.

Clarington Commercial Market Analysis Update
106
8 CONCLUSIONS AND RECOMMENDATIONS
In the planning for the development of commercial facilities it is important to recognize that retail and service commercial uses are a private sector activity. When decisions are made to open, expand or close a commercial business, they are essentially business decisions made in the context of a competitive market place. The market forces which determine the location, type and quantity of commercial activity are dynamic and subject to change. Factors such as existing market size; future population growth; changes in the age structure and income levels; new retail formats and built forms; competition; market location; and changing demands for goods and services can influence business decisions and commercial activity.
The planning process, including provincial policies relating to intensification (i.e. Growth Plan), has the ability to influence commercial activity by providing an appropriate allocation and distribution of commercial designated sites in accordance with the public interest. Determining the appropriate balance of commercial land supply must consider what locations are the most strategic in terms of meeting the needs of the population and businesses, while protecting the public interest by minimizing any impacts on the downtowns. The current retail planning emphasis in Ontario is not only to provide for the growth of efficient and compact urban forms, but also to maintain and where possible, enhance the vitality of downtowns and mainstreets.
The distribution of retail and service commercial facilities in Clarington can largely be categorized depending upon the market served. There is an existing hierarchy of centres or nodes in Clarington ranging from local serving convenience/neighbourhood centres to regional Town Centres. Facilities within each centre/node not only differ in terms of physical size and tenant mix, but also have different locational requirements (i.e. accessibility and visibility). In general, the convenience/ neighbourhood centres include retail and service uses that service the day-to-day needs of local residents (e.g. food stores, drug stores, banks, restaurants, and personal services). These centres are typically located on arterial or local roads. The sub-regional or regional centres, which in Clarington includes the Town Centres, include a greater quantify of non-food store retailers (NFSR), such as general merchandise stores, apparel stores, home furnishing stores and other miscellaneous retail stores. These centres require locations with exposure to major regional roads/highways.
Over the next 20 year period, our market analysis indicates that based on the existing vacant supply (including vacant buildings) there will be an undersupply or shortfall of designated commercial lands, and particularly in Bowmanville.20
The following summarizes the results of our market analysis and provides general recommendations for potential policy changes.
A large portion of the shortfall will be required to accommodate NFSR space, and particularly GAFO space (i.e. general merchandise, apparel, furnishings, and other durable/semi durable department store type merchandise stores). Of importance in planning new retail nodes or designating additional commercial land is recognizing the existing functional distribution of commercial activity and the future market need for retail and services uses by type.
20 Development specific market impact studies may show that additional new retail and service space is warranted based on sales transfers, which have not been included in our analysis.

Clarington Commercial Market Analysis Update
107
8.1 CONCLUSIONS
1. How close has development in Clarington come to achieving the projections/ expectations established in the original 2005 Commercial Policy Review?
What is the commercial situation today?
The 2005 Commercial Policy Review resulted in the addition of various floor space targets in the Official Plan and Secondary Plans for the Town Centres and Village Centres. These targets were intended to protect the downtowns. The majority of proposed space accounted for in the 2005 Commercial Policy Review has now been developed, except for part of the Torgan site on a Highway Commercial site in Bowmanville (Baseline Road and Spry Avenue) and the Courtice Town Centre. A RONA home improvement centre was built on the Torgan site but was never occupied. In the Bowmanville West Town Centre, the Loblaws did not relocate to a larger store beside the Walmart Supercentre, however, Canadian Tire moved to this site instead, leaving their store vacant (located east of the Clarington Centre). The 2005 Commercial Policy Review was based on the assumption that about 660,000 square feet of non-food store retail floor space would be developed in Clarington by 2010. This space included the Walmart, two home improvement centres, and other “department store type merchandise” or other non-food store retail floor space. Based on our inventory, there has been an increase of about 400,000 square feet or 36,921 square metres of non-food store retail space between 2003 and 2011, plus the RONA (which is now vacant). For food space, the supermarket in the Bowmanville Mall expanded; however, no new supermarkets have been developed since the 2005 Commercial Policy Review was completed. The Walmart Supercentre, which has a food component, however, was added in recent years. Two new supermarkets are planned (one in Bowmanville (under construction) and the other in Newcastle), which were not included in the 2005 Commercial Policy Review. The following summarizes the existing space in the Town Centres, Village Centres and Courtice West Shopping District in comparison to the various targets or thresholds in the Official Plan/Secondary Plans for these areas:
• BWTC - For the Bowmanville West Town Centre (BWTC), the floor space allocations in Section 4.3c) of the Secondary Plan have approached or are approaching target for each of the five sub-areas (i) to (v). Some additional space is planned (10,410 square metres), which will result in almost a total build out of this area. Although Section 10.4.3 of the Official Plan sets a target of 100,000 square metres, it is unlikely that an additional 19,000+/- square metres of floor area could be accommodated unless other lands are redesignated in this node for commercial uses or the node is expanded. It should be noted the BWTC Secondary Plan places caps on retail and “selected” service floor space until a population of 91,000 has been reach. For retail space, the maximum floor space is 73,000 square metres and selected service space at 7,000 square metres. Currently, there are some 55,046 square metres of retail space and 4,740 square

Clarington Commercial Market Analysis Update
108
metres of selected services floor space. Excluded from these space calculations are 7,701 square metres of vacant space and 3,065 square metres of other services space (includes the Cineplex).
• BETC – The Bowmanville East Town Centre, which includes the Downtown, has a target threshold of 80,000 square metres. Although there has been some development in recent years, with some 56,733 square metres of existing retail and service floor space, this area is not likely to reach the target in the Official Plan based on vacant land availability and intensification. In the Secondary Plan for the BETC, the total floor space threshold is divided into 35,000 square metres for the Downtown and 45,000 square metres for the East District. Currently, the Downtown has an estimated 24,809 square metres of retail and service floor space (including vacant space) with the East District comprising an estimated 31,924 square metres.
• Courtice Town Centre - This Town Centre remains undeveloped and although it has a target of some 30,000 square metres of floor space, the site could likely be developed to include up to 20,000 square metres of retail and service floor space based on expected development constraints.
• Courtice West Shopping District - This District include some 22,471 square metres of
retail and service space. In the Secondary Plan, there is a threshold of some 30,000 square metres. With the Shoppers Drug Mart project and development potential on vacant commercial lands accounted for, the floor space will be close to the maximum.
• Newcastle Village Centre - The Newcastle Village Centre has seen a significant increase
in floor space since 2003 (6,758 square metres). In total, the Village Centre currently has an estimated 16,163 square metres of retail and service floor space, and with the proposed No Frills and convenience plaza at Brookhouse, it would approach the 20,000 square metre floor space target in the Official Plan and exceed the threshold in the Secondary Plan of 15,000 square metres.
• Orono Village Centre - Orono Village has an Official Plan target of 7,000 square metres
of retail and service floor space. Currently, there is some 4,368 square metres of floor space. There is the opportunity through redevelopment/conversion of residential units to add additional floor space.
Based on the Official Plan space targets, there is additional floor space capacity on designated commercial sites in all of the Urban Areas for new retail and service floor space. However, recognizing that many sites are already built-out (based on existing and proposed space), a thorough review of each Town Centre, Village Centre, Neighbourhood Centre and District will be required to determine how much vacant land or opportunity for intensification/ redevelopment there is to not only accommodate additional floor space but also to evaluate the necessity of having floor space targets in the Official Plan.

Clarington Commercial Market Analysis Update
109
2. Are there any gaps today
In Clarington there is a disproportionate distribution of commercial floor space by major Urban Area based on the population and our inventory of retail and service floor space. As indicated in
in market demand for retail, service and/or office floor space and the current supply of commercial land – Broadly, for Clarington as a whole, as well as specifically for each major urban/trade area (Bowmanville, Courtice, and Newcastle)?
Figure 8-1, the Bowmanville Urban Area has floor space levels that are about 3 times higher than the other Urban Areas, reflecting its regional service role and size. For Courtice, the close proximity of Oshawa with retail facilities such as the Kingsway Plaza on Townline Road, satisfy some of the retail and service needs for this Urban Area.
FIGURE 8-1: CLARINGTON - EXISTING SERVICE LEVELS
The existing average retail and service space per capita ratio in Clarington at 28.5 square feet per capita (2.7 square metres) is considered below typical averages for communities the size of Clarington. A large portion of existing demand for certain retail goods, and particularly higher order or comparison goods (e.g. apparel and home furnishings) is currently being met outside of Clarington. As Clarington’s population increases, it is expected that certain population thresholds will be reached requiring the provision of a greater selection of retail facilities.
With Bowmanville’s share of Clarington’s population expected to continue to increase in the future (from 41% in 2011 to 47% by 2031), as summarized in Figure 8-2 , it can be expected that Bowmanville would continue to increase its service levels. Both Courtice and Newcastle Village are also expected to increase in population, which will require additional retail and service facilities in these communities.
CLARINGTON - EXISTING SERVICE LEVELS IN RELATION TO POPULATION
Commercial Floor Space - Square
Metres % Population 2011 %Commercial Sq. Metre Floor Space Per Capita
Bowmanville Urban Area 160,133 67% 36,700 41% 4.4 Courtice Urban Area 36,176 15% 24,500 27% 1.5 Newcastle Urban Area 18,773 8% 11,100 12% 1.7 Other Clarington 23,025 10% 17,500 19% 1.3 TOTAL 238,107 100% 89,800 100% 2.7
Commercial Floor Space - Square
FeetCommercial Sq. Ft.
Floor Space Per CapitaBowmanville Urban Area 1,723,900 36,700 47.0 Courtice Urban Area 389,500 24,500 15.9 Newcastle Urban Area 202,100 11,100 18.2 Other Clarington 247,900 17,500 14.2 TOTAL 2,563,400 89,800 28.5
SOURCE: urbanMetrics inc.

Clarington Commercial Market Analysis Update
110
FIGURE 8-2: POPULATION DISTRIBUTION – 2011 TO 2031
3. What are the shifts or changes that are taking place in commercial development today that will impact how we will need to plan for commercial development in the near, mid and long term?
What trends should we anticipate?
The retail industry and retail development is continually evolving, adapting and finding new ways to attract and excite the customer. There has been an “out with the old” movement. Although the development of power centres continues to dominate retail development in Ontario, there is a recent downsizing trend by many large format retailers that has started to gain momentum (particularly in the US). This trend will allow retailers to go into smaller communities, such as Bowmanville. Other trends include mixed-use centres, including lifestyle centres and hybrids; “main-street” type retail projects (i.e. new urbanism); outlet centres; and the invasion of US/international retailers to Canada.
In general, the principles of new urbanism, sustainability and the focus on public spaces is influencing retail development, with the creation of more meaningful and memorable retail environments that have a feel of community or sense of place and that incorporate a mix of uses (i.e. retail/office/residential). The policies of the province’s Growth Plan and Durham Region’s Official Plan Amendment 128 embrace the revitalization of downtowns, compact growth, and the creation of “complete communities” that offer more options for living, working, learning, shopping and playing. These policies will influence built form and the location of new retail space being provided in communities. Mixed-use centres are being developed with design objectives that include a strong urban street façade and architecture that places more of a priority on the pedestrian shopping environment.
4. Supply versus Future Demand – For Clarington as a whole, and specifically for each major urban area (Courtice, Bowmanville and Newcastle), based on the available supply and forecast of market demand for retail, service and population related office space, what will the land needs be in the future?
Where are we headed?
POPULATION DISTRIBUTION
2011 2016 2021 2026 2031Bowmanville 41% 43% 44% 46% 47%Courtice 27% 26% 26% 25% 25%Newcastle 12% 13% 14% 15% 15%Rural 19% 17% 16% 14% 13%TOTAL 100% 100% 100% 100% 100%
SOURCE: Based on Hemson Consulting forecasts.

Clarington Commercial Market Analysis Update
111
DEMAND (Figure 8-3 and 8-4) - In Clarington, we have estimated that an additional
197,035 square metres of retail and service floor space (including population-related office space) is warranted by 2031. This space includes 100,057 square metres of NFSR space, 23,680 square metres of FSR space, and some 72,780 square metres of service space (including population related office space). At present, there are a number of approved proposals and other opportunities, including existing vacant floor space and vacant commercial lands, where a portion of the future warranted floor space in Clarington could be accommodated. We have allocated the majority of new retail and service space (133,045 square metres by 2031) to Bowmanville.
2016 2021 2026 2031Non-Food Store Retail (NFSR) -
GAFO, Pharmacy & Personal Care, Building and Outdoor Home Supply
25,700 50,315 75,600 100,575
Food Store Retail (FSR) -Supermarkets and other food stores 6,970 13,285 19,540 23,680
SELECTED OTHER RETAIL/SERVICE SPACE 14,830 32,945 52,670 72,780
-
20,000
40,000
60,000
80,000
100,000
120,000
Additional Retail and Service Floor Space Warranted in Clarington (sq.metres)
FIGURE 8-3: WARRANTED ADDITIONAL FLOOR SPACE BY TYPE

Clarington Commercial Market Analysis Update
112
FIGURE 8-4: ALLOCATION OF WARRANTED ADDITIONAL FLOOR SPACE BY AREA
2016 2021 2026 2031Bowmanville 32,074 65,191 99,807 133,045 Courtice 9,845 20,011 30,637 40,840 Newcastle 3,773 7,668 11,740 15,650 Other 1,808 3,675 5,626 7,500
-
20,000
40,000
60,000
80,000
100,000
120,000
140,000
Additional Retail and Service Floor Space Required - Allocation by Area
(sq. metres)
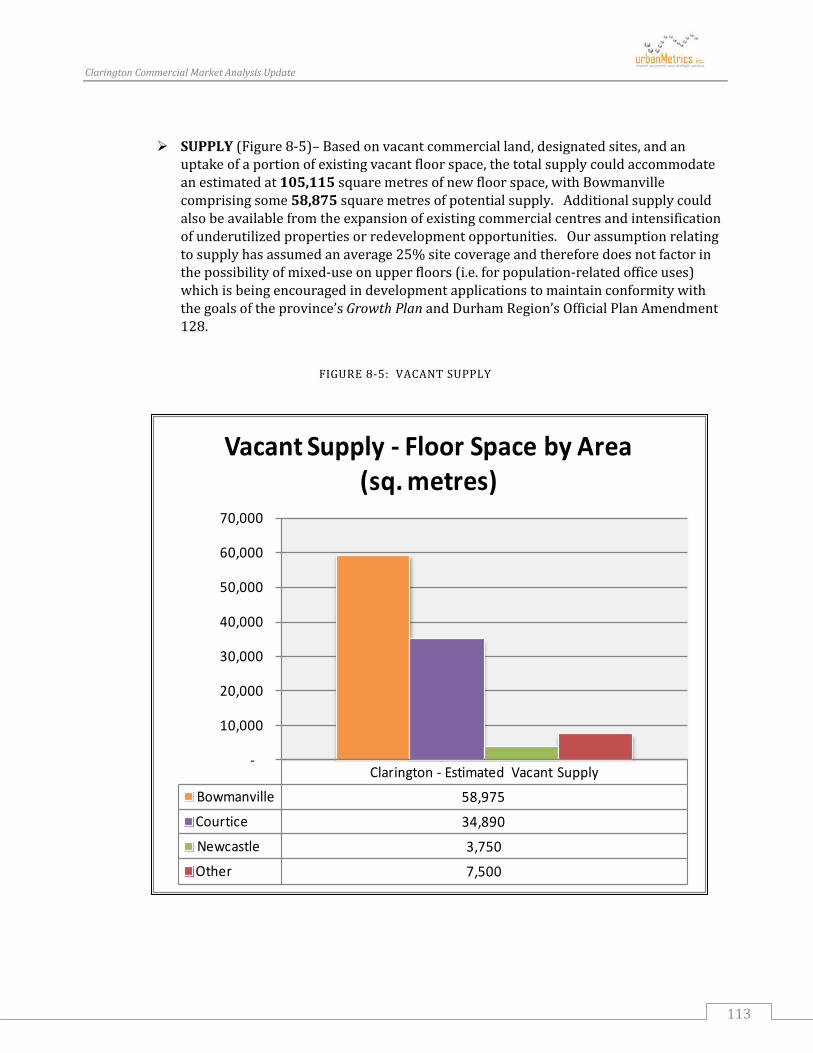
Clarington Commercial Market Analysis Update
113
SUPPLY (Figure 8-5)– Based on vacant commercial land, designated sites, and an
uptake of a portion of existing vacant floor space, the total supply could accommodate an estimated at 105,115 square metres of new floor space, with Bowmanville comprising some 58,875 square metres of potential supply. Additional supply could also be available from the expansion of existing commercial centres and intensification of underutilized properties or redevelopment opportunities. Our assumption relating to supply has assumed an average 25% site coverage and therefore does not factor in the possibility of mixed-use on upper floors (i.e. for population-related office uses) which is being encouraged in development applications to maintain conformity with the goals of the province’s Growth Plan and Durham Region’s Official Plan Amendment 128.
FIGURE 8-5: VACANT SUPPLY
Clarington - Estimated Vacant SupplyBowmanville 58,975 Courtice 34,890 Newcastle 3,750 Other 7,500
-
10,000
20,000
30,000
40,000
50,000
60,000
70,000
Vacant Supply - Floor Space by Area (sq. metres)

Clarington Commercial Market Analysis Update
114
SHORTFALL (Figure 8-6) - Based on our estimates of future additional floor space needs and vacant supply, there is a shortfall of designated land to accommodate future needs. This has been estimated at 91,920 square metres by 2031, with Bowmanville having a shortfall of some 74,070 square metres.
FIGURE 8-6: SURPLUS/SHORTFALL
2016 2021 2026 2031Bowmanville 26,901 -6,216 -40,832 -74,070 Courtice 25,045 14,879 4,253 -5,950 Newcastle -23 -3,918 -7,990 -11,900 Other (2 5,692 3,825 1,874 0
-80,000
-60,000
-40,000
-20,000
0
20,000
40,000
Surplus(+)/Shortfall(-) of Floor Area Supply (sq.metres)

Clarington Commercial Market Analysis Update
115
LAND NEEDS (Figure 8-7) - Up to 37 hectares of land will need to be designated commercial to accommodate future needs, with up to 30 hectares in Bowmanville.
FIGURE 8-7: ADDITIONAL LAND AREA REQUIRED
Some of these future land needs could potentially be accommodated through intensification/ expansion of existing retail centres, with a small percentage locating in non-Commercial designations (e.g. industrial and residential). It must be recognized that a large share of the warranted floor space is in the services category, which can be accommodated with much greater flexibility than retail floor space. For example, services categories, such as medical floor space, insurance and real estate brokers, etc. could be accommodated in office buildings, conversion of residential buildings or upper floor space. Many business/technical/ administrative services, and a limited number of retail and other service facilities that serve an employment area could be situated in lands with industrial designations. FUTURE SERVICE LEVELS - Figure 8-8 details the existing and forecast service levels
by area. The forecast levels recognize vacant land and development proposals. Some of the vacant land, such as the Courtice Town Centre, may not develop to their full potential due to location, retailer preferences, and other issues. This may alter service levels in the future. Intensification and redevelopment in some communities may also influence service levels. For the purposes of our analysis, no adjustments have been made to account for these variances.
2016 2021 2026 2031Bowmanville 0 2 16 30 Courtice 0 0 0 2 Newcastle 0 2 3 5 Other 0 0 0 0
0
5
10
15
20
25
30
35
Additional Land Area Required to Accommodate Additional
Commercial Floor Space (hectares)

Clarington Commercial Market Analysis Update
116
FIGURE 8-8: SERVICE LEVELS – EXISTING AND FUTURE
2011 2031
Bowmanville 67% 68%
Courtice 15% 18%
Newcastle 8% 9%
Other Clarington (Hamlets, Rural Areas, Orono)
10% 6%
TOTAL 100% 100%
Details of our supply and demand analysis by specific store type and location for the year 2031 have been provided in Appendix B.
5. For Orono, based on the inventory of retail and service floor space in this community, is there any opportunity for a limited expansion of floor space?
With limited population growth expected in Orono and existing vacant floor space, there is considered limited opportunity for expansion. The designated Neighbourhood Centre (with Foodland and LCBO) has additional land available for expansion with potential opportunity for the expansion of the Foodland in the long term and the addition of other retail facilities. Although this centre has good exposure from Highway 35/115, it has limited exposure from Mill Street, except for signage.
8.2 RECOMMENDATIONS
Based on our market analysis, we would suggest the following changes to the Official Plan:
• Remove all threshold figures in the Official Plan for the Town Centres and Villages as our inventory evaluation would suggest that except for the Courtice Town Centre, the areas are either reaching capacity, have no lands available or the thresholds have no relevance going forward. Maintaining the requirement for a market impact study for individual applications would ensure that any new developments are warranted and would not impact the downtowns, in particular.
• Designate additional lands for commercial in Bowmanville and elsewhere in Clarington equivalent to the projected needs. If additional lands are designated for commercial, some consideration will need to be given to ensure the build-out of existing designated commercial lands first. The build-out of existing designated commercial sites should, however, consider any limitations with these sites that may make other future designated sites more desirable for development, both from a public service point of view and business perspective. Furthermore, some consideration will also need to be given to consider intensification, under-utilized

Clarington Commercial Market Analysis Update
117
properties, conversion of historic homes, and or redevelopment opportunities for existing commercial sites. This could also include the consolidation of small lots to create larger development parcels.
Based on our estimates of warranted retail and service commercial floor space by type and land need shortfall, the following provides our recommendations as to where lands should be designated in each of the major Urban Areas to accommodate this shortfall:
o Bowmanville – up to 30 additional hectares required - It should be noted that our analysis of vacant supply assumes that two additional “Neighbourhood Centres”, as designated in the Official Plan, would be developed by 2031 (up to a maximum of 5,000 square metres). One of the sites is located on Regional Road 57 and could potentially accommodate a supermarket anchored centre. The other site, also in north Bowmanville, is likely more suitable for a smaller convenience type plaza. In terms of where the shortfall could be accommodated, some allocation should be provided for the future Brookhill community. The Brookhill Neighbourhood Secondary Plan designates the “Village Corridor”, which is planned to comprise a mix of uses including retail and office. To accommodate regional serving uses (i.e. GAFO store types), additional lands within the Bowmanville West Town Centre (BWTC) should be re-designated (e.g. from “office commercial”) or the area expanded to the west which would require a boundary adjustment. This would strengthen this regional node. Considering that it is beneficial for most retailers to locate where there are existing retailers to create the opportunity for cross-shopping and for the convenience of consumers, the “office commercial” designated lands in the BWTC should be designated to “mixed-use” to permit additional retail uses with the requirement to include a certain amount of office floor space. In east Bowmanville, the “Mixed-Use” designation along Highway 2 in the Technology Business Park could be a potential location for future retail uses as well.
There may be opportunities for intensification of some of the existing sites in the BWTC , such as the Clarington Centre or vacant Canadian Tire site. Within Bowmanville’s East Town Centre (BETC) there are likely opportunities for intensification and redevelopment, including the consolidation of small lots with expanding this area. Some future opportunity may also exist further to the east of the BETC along Highway 2 to designate mixed-use site that could include retail uses.
• Courtice – up to 2 additional hectares are required - With the Courtice Town Centre yet to be developed and other vacant commercial sites available in the community, no additional lands are required to be designated in Courtice. We assume that any shortfall would be accommodated through intensification on existing sites and future redevelopment along the Highway 2 corridor.
• Newcastle Village - up to 5 additional hectares are required – Newcastle Village is
forecast to increase by almost 10,000 persons over the next 20 year period. Currently, there are limited opportunities to accommodate additional space needs in the community. Additional commercial land should be designated in close proximity to the Village Centre to minimize any potential impacts.

Clarington Commercial Market Analysis Update
118
APPENDIX A: DEFINITION OF TERMS AND BACKGROUND DATA
Gross Leasable Area (GLA)
Gross leasable area (GLA) is the total retail floor area designed for tenant occupancy and exclusive use, including basements, upper floors and mezzanines. It is expressed in square feet, and measured from the centre line of joint partitions and from outside wall faces. GLA is the area on which tenants pay rent, and which produces income for a tenant. Since it lends itself readily to measurement and comparison, GLA has been adopted by the shopping centre industry as its standard for statistical comparison.
Per Capita Income
Per capita income represents average total personal income before tax, as defined by Statistics Canada. The Trade Area zone income indices are based on the results of the 2006 Census of Canada. Per capita income is calculated utilizing PCensus as follows:
((Males 15+ X Average Males 15+ Income) + (Females 15+ X Average Females 15+ Income))/Unsuppressed 2006 Population
Population and Net Undercoverage
The 2006 population has been calculated based on Statistics Canada, Census of Canada data utilizing PCensus software, adjusted for net undercoverage. As indicated by Statistics Canada, population undercoverage refers to the error of excluding someone who should have been enumerated. Population overcoverage refers to the error of either enumerating someone more than once or including someone who should not have been enumerated. Undercoverage is more common than overcoverage. The net impact of undercoverage and overcoverage on the size of a population of interest is population net undercoverage. Net undercoverage is calculated as the number of persons excluded who should have been enumerated (undercoverage) less the number of excess enumerations of persons enumerated more than once (overcoverage).
Per Capita Expenditures
Figure A-1 details our calculations for 2011 per capita retail sales for the Province of Ontario based on Statistics Canada, Retail Trade data available as of January 2012.
Trade Area Zone Per Capita Expenditures
Per Capita expenditures in this report for Clarington residents have been calculated based on regression equations, as follows. Expenditure potential is the total annual expenditures made by Clarington residents. This includes purchases made both inside and outside of Clarington. It is calculated by multiplying the average per capita expenditure in each store category by the total population of Clarington.
Regression equations utilized based on the 2010 Statistics Canada Household Survey (Ontario):
NFSR: Y = 0.59(x) + 41, where x is the income index to province

Clarington Commercial Market Analysis Update
119
FSR: Y=0.13(x) + 87, where x is the income index to province
Real Growth
Real growth refers to the amount that sales volumes or expenditures would increase in future years with inflation eliminated. Therefore, references to the Canadian dollar, dealing with both the present and future period, reflect its 2011 value in this report. For the purposes of our study, a real growth of 1.5% has been utilized for NFSR and 0.25% for FSR. These have been based on long term historic trends in real growth.
Retail/Service Floor space Classification
Figure A-2 details our retail and service floor space classification according to the North American Industry Classification System (NAICS) as utilized by Statistics Canada.

Clarington Commercial Market Analysis Update
120
FIGURE A-1: ONTARIO – RETAIL TRADE 2011
ON
TARI
O -
RETA
IL T
RAD
E (P
UBL
ICAT
ION
63-
005)
- P
ER C
APIT
A($
Mill
ions
)M
ON
TH1
23
45
67
89
ANN
UAL
IZED
Per
YEAR
2011
2011
2011
2011
2011
2011
2011
2011
2011
TOTA
L**
Capi
taM
otor
veh
icle
and
par
ts d
eale
rs[4
41]
1,96
9.5
2,00
8.7
2,91
6.1
2,99
2.0
3,14
3.0
3,37
6.8
2,81
8.9
2,99
3.5
2,77
0.7
$32,
455.
1$2
,427
New
car
dea
lers
[441
11]
1,64
8.0
1,67
8.2
2,47
8.5
2,47
7.9
2,55
7.0
2,79
2.5
2,29
8.7
2,46
5.1
2,30
2.1
$26,
927.
8$2
,014
Use
d ca
r dea
lers
[441
12]
165.
1
181.
9
223.
0
206.
7
222.
6
246.
4
215.
4
228.
0
221.
2
$2,5
00.0
$187
Oth
er m
otor
veh
icle
dea
lers
[441
2]-
71.1
92.4
162.
4
218.
3
199.
7
181.
0
173.
9
117.
8
$1,4
98.8
$112
Auto
mot
ive
part
s, a
cces
sorie
s and
tire
stor
es[4
413]
90.1
77.5
122.
2
144.
9
145.
1
138.
2
123.
8
126.
5
129.
7
$1,5
28.4
$114
Furn
iture
and
hom
e fu
rnis
hing
s sto
res [
442]
424.
9
378.
4
429.
0
443.
3
448.
1
458.
8
459.
1
500.
9
484.
9
$5,5
88.7
$418
Furn
iture
stor
es [4
421]
267.
1
248.
4
267.
6
273.
2
278.
7
286.
9
293.
7
308.
7
308.
8
$3,4
74.1
$260
Hom
e fu
rnis
hing
s sto
res [
4422
]15
7.8
13
0.0
16
1.4
17
0.1
16
9.5
17
1.8
16
5.4
19
2.3
17
6.1
$2
,114
.7$1
58El
ectr
onic
s and
app
lianc
e st
ores
[443
]37
3.0
34
7.6
41
8.9
37
5.8
38
9.2
40
5.3
41
3.0
45
8.6
46
3.5
$5
,445
.8$4
07Bu
ildin
g m
ater
ial a
nd g
arde
n eq
uipm
ent a
nd su
pplie
s dea
lers
[444
]67
5.2
52
6.2
68
3.9
76
5.9
1,
026.
0
1,
027.
6
95
0.0
93
7.8
87
2.0
$9
,854
.7$7
37Fo
od a
nd b
ever
age
stor
es [4
45]
2,84
9.6
2,63
0.5
2,86
9.1
3,08
8.9
2,98
2.4
3,11
0.9
3,34
0.9
3,05
6.2
3,09
6.2
$36,
578.
0$2
,735
Gro
cery
stor
es [4
451]
(in
clud
es 4
4511
& 4
4512
)2,
230.
6
2,
040.
0
2,
210.
5
2,
349.
8
2,
245.
1
2,
324.
1
2,
402.
2
2,
248.
4
2,
302.
9
$2
7,38
6.1
$2,0
48
Supe
rmar
kets
and
oth
er g
roce
ry (e
xcep
t con
veni
ence
) sto
res
[445
11]
2,08
3.8
1,91
0.4
2,06
8.1
2,19
7.8
2,08
6.0
2,16
2.7
2,23
8.2
2,08
6.5
2,15
0.7
$25,
566.
2$1
,912
Conv
enie
nce
stor
es [4
4512
]14
6.8
12
9.6
14
2.4
15
2.0
15
9.1
16
1.4
16
4.0
16
1.9
15
2.2
$1
,819
.9$1
36Sp
ecia
lty fo
od st
ores
[445
2]13
1.9
12
8.3
13
8.7
16
4.1
15
5.4
16
6.2
16
2.5
16
0.6
15
8.0
$1
,886
.2$1
41Be
er, w
ine
and
liquo
r sto
res [
4453
]45
9.2
46
2.2
51
9.8
57
4.9
58
1.9
62
0.7
77
6.2
64
7.3
63
5.4
$7
,305
.7$5
46He
alth
and
per
sona
l car
e st
ores
[446
]1,
000.
6
96
3.6
1,
063.
6
1,
052.
0
1,
083.
3
1,
065.
5
1,
031.
6
1,
065.
0
1,
042.
9
$1
2,82
8.2
$959
Gas
olin
e St
atio
ns [4
47]
1,37
2.2
1,32
0.2
1,49
8.0
1,54
9.6
1,66
7.3
1,60
0.5
1,63
2.6
1,60
6.1
1,52
4.6
$18,
329.
4$1
,371
Clot
hing
and
clo
thin
g ac
cess
orie
s sto
res [
448]
607.
5
582.
4
705.
1
786.
9
849.
7
870.
7
801.
9
823.
3
920.
3
$10,
304.
4$7
71Cl
othi
ng st
ores
[448
1]47
0.4
43
9.5
55
7.4
62
0.4
66
0.4
67
9.4
61
7.0
63
2.8
71
9.1
$7
,994
.7$5
98Sh
oe st
ores
[448
2]73
.3
59
.9
77
.8
90
.5
10
1.7
10
5.2
98
.0
10
3.6
11
5.0
$1
,177
.3$8
8Je
wel
lery
, lug
gage
and
leat
her g
oods
stor
es [4
483]
63.8
83.1
70.0
76.0
87.6
86.1
86.9
86.9
86.2
$1,1
32.3
$85
Spor
ting
good
s, h
obby
, boo
k an
d m
usic
stor
es [4
51]
318.
2
258.
9
300.
9
286.
9
289.
1
311.
8
294.
9
331.
6
397.
5
$4,1
15.1
$308
Gen
eral
mer
chan
dise
stor
es [4
52]
1,44
5.3
1,30
1.1
1,54
7.2
1,69
4.2
1,86
0.9
1,87
5.1
1,82
0.9
1,73
5.6
1,77
2.6
$21,
758.
6$1
,627
Depa
rtm
ent s
tore
s [45
21]
730.
7
667.
4
763.
1
865.
7
899.
2
928.
4
896.
1
875.
6
920.
7
Oth
er g
ener
al m
erch
andi
se st
ores
[452
9]71
4.6
63
3.7
78
4.1
82
8.5
96
1.7
94
6.8
92
4.8
86
0.0
85
1.9
M
isce
llane
ous s
tore
reta
ilers
[453
]27
3.7
25
9.7
28
2.1
27
2.7
29
7.7
29
5.9
27
3.9
30
1.4
34
1.7
$3
,622
.1$2
44
TOTA
L RE
TAIL
TRA
DE
11,3
09.7
10,5
77.3
12,7
13.9
13,3
08.2
14,0
36.7
14,3
98.9
13,8
37.7
13,8
10.0
13,6
86.9
0.0
0.0
0.0
160,
880.
1 TO
TAL
ESTI
MAT
ED F
SR S
ALES
, ON
TARI
O [
NAI
CS -
4451
, 445
2](p
artia
l yea
rs c
alcu
late
d by
add
ing
4451
and
445
2)$2
9,27
2.3
POPU
LATI
ON
(Jul
y 1s
t Est
imat
e)Ca
talo
gue
no. 9
1-00
2-X,
vol
. 25,
no.
2 (
Sept
28
2011
rele
ase)
13,3
72,9
96PE
R CA
PITA
FSR
SAL
ES$2
,189
TOTA
L N
FSR
STO
RE S
ALES
, ON
TARI
O [N
AICS
- 44
13, 4
42, 4
43, 4
44, 4
46, 4
48, 4
51, 4
52, 4
53 @
90%
] -
INCL
UDE
S AU
TOM
OTI
VE T
IRES
/BAT
TERI
ES/A
UTO
ACC
ESSO
RIES
$75,
046.
0Le
ss M
isce
llane
ous S
tore
Ret
aile
rs -
Non
- NFS
R Po
rtio
n @
***
10%
$362
.0AD
JUST
ED T
OTA
L N
FSR
SALE
S, O
NTA
RIO
$74,
684.
0PO
PULA
TIO
N (J
uly
1st E
stim
ate)
Cata
logu
e no
. 91-
002-
X, v
ol. 2
5, n
o. 2
(Se
pt 2
8 20
11 re
leas
e)13
,372
,996
PER
CAPI
TA N
FSR
STO
RE S
ALES
$5,5
85
PER
CAPI
TA G
AFO
(in
clud
ing
NAI
CS 4
413,
442,
443,
448,
451,
452,
453
@90
%)
- EXC
LUDE
S AU
TOM
OTI
VE T
IRES
/BAT
TERI
ES/A
UTO
ACC
ESSO
RIES
@ $
114
PER
CAPI
TA$3
,774
SOU
RCE:
urb
anM
etric
s inc
.*
A
djus
ted
for e
stim
ated
Non
-NFS
R po
rtio
n.**
Fo
r par
t yea
r dat
a, a
nnua
lized
tota
ls ca
lcul
ated
by
appl
ying
ave
rage
indi
ces o
f qua
rter
s for
the
past
six
year
s as a
% o
f tot
al, t
o cu
rren
t yea
r par
tial s
ales
.**
* ur
banM
etric
s est
imat
e. E
xclu
ded
stor
es in
clud
e: M
obile
Hom
e De
aler
s and
Tom
b St
one
Deal
ers.

Clarington Commercial Market Analysis Update
121
FIGURE A-2: NAICS CLASSIFICATION
urbanMetrics inc.
RETAIL/SERVICE STORE CLASSIFICATION (BASED ON NORTH AMERICAN INDUSTRY CLASSIFICATION (NAICS)
Group NAICS Description
90 Supermarkets
44511 Supermarkets and Other Grocery (except Convenience) Stores
100 Convenience and Specialty Food Stores
44512 Convenience Stores44521 Meat Markets44522 Fish and Seafood Markets44523 Fruit and Vegetable Markets44529 Other Specialty Food Stores, including Baked Goods Stores, & Confectionary & Nut
110 Beer, Wine and Liquor Stores
44531 Beer, Wine and Liquor Stores
20 Used and Recreational Motor Vehicle and Parks Dealers (Tires, Batteries, Automotive Accessories component)44131 Automotive Parts and Accessories Stores
44132 Tire Dealers
30 Furniture Stores44211 Furniture Stores
40 Home Furnishings Stores44221 Floor Covering Stores (excludes retailers or only ceramic or only hardwood flooring which are in Building Supply)44229 Other Home Furnishings Stores (e.g. window treatments, fireplace/accessories, kitchen and tableware, bedding and linens, brooms and brushes, lamps
and shades, and prints and picture frames).
50 Computer and Software Stores44312 Computer and Software Stores (includes retailing new computers, computer peripherals, pre-packaged software, game software and related products)
60 Home Electronics and Appliance Stores44311 Appliance, Television and other Electronics Stores
44313 Camera and Photographic Supplies Stores
70 Home Centres and Hardware Stores44411 Home Centres
44413 Hardware Stores (includes tool stores)
80 Specialized Building Materials and Garden Stores44412 Paint and Wallpaper Stores
44419 Other Building Material Dealers (excluding manufacturing and construction firms) (includes doors, windows, itchen cabinets, electircal, glass, plumbing, 44421 Outdoor Power Equipment Stores (lawn mowers, tractors, hedge trimmers, snow blowers)
44422 Nursery Stores and Garden Centres
120 Pharmacies and Personal Care Stores44611 Pharmacies and Drug Stores
44612 Cosmetics, Beauty Supplies and Perfume Stores
44613 Optical Goods Stores
44619 Other Health and Personal Care Stores (includes stores retailing health and personal care items, such as vitamin supplements, hearing aids, and medical
140 Clothing Stores44811 Men's Clothing Stores
44812 Women's Clothing Stores
44813 Children's and Infant's Clothing Stores
44814 Family Clothing Stores
44819 Other Clothing Stores
150 Shoe, Clothing Accessories and Jewellery Stores44815 Clothing Accessories Stores
44821 Shoe Stores (includes athletic shoe retailers)44831 Jewellery Stores
44832 Luggage and Leather Goods Stores
Automotive
Pharmacies and Personal Care Stores
Clothing and Accessories Stores
FOOD
Furniture, Home Furnishings and Electronics Stores
Building and Outdoor Home Supplies Stores
OTHER RETAIL - BEVERAGE STORES
NON-FOOD STORE RETAIL (NFSR)

Clarington Commercial Market Analysis Update
122
urbanMetrics inc.RETAIL/SERVICE STORE CLASSIFICATION (BASED ON NORTH AMERICAN INDUSTRY CLASSIFICATION (NAICS)
170 Department Stores45211 Department Stores
175 45211 Department Stores with a Large food component (i.e. Walmart Supercentres)180 Other General Merchandise Stores
45291 Warehouse Clubs and Superstores45299 All Other General Merchandise Stores:
Home & Auto (i.e. Canadian Tire)Other General Merchandise Stores (e.g. general stores, variety stores, "dollar" stores)
160 Sporting Goods, Hobby, Music and Book Stores45111 Sporting Goods Stores (excludes athletic shoe retailers)45112 Hobby, Toy and Game Stores (excludes computer games and software)45113 Sewing, Needlework and Piece Goods Stores45114 Musical Instrument and Supplies Stores45121 Book Stores and News Dealers45122 Pre-Recorded Tape, Compact Disc and Record Stores
190 Miscellaneous Store 45311 Florists45321 Office Supplies and Stationery Stores45322 Gift, Novelty and Souvenir Stores45331 Used Merchandise Stores 45391 Pet and Pet Supplies Stores45392 Art Dealers (excludes art galleries)45399 All Other Miscellaneous Store Retailers (e.g. tobacco supplies, artist supplies, collectors items, beer & wine making, swimming pool/spas/accessories,
Miscellaneous Retailers
NON-FOOD STORE RETAIL (NFSR) (Continued)
General Merchandise Stores

Clarington Commercial Market Analysis Update
123
urbanMetrics inc.RETAIL/SERVICE STORE CLASSIFICATION (BASED ON NORTH AMERICAN INDUSTRY CLASSIFICATION (NAICS)
200 Consumer Goods Rental53221 Consumer Electronics and Appliance (Appliance rental and leasing, rental of consumer audio-visual equipment (including rent-to-own), Television
53222 Formal Wear and Costume Rental53223 Video Tape and Disc Rental53229 Other Rental (sporting goods, garden equipment, home health, fitness etc.)53231 General Rental Centres (including contractors' and builders' tools and equipment, home repair tools, lawn and garden equipment, moving equipment
210 Finance
52211 Banks52213 Credit Unions
215 52239 Other Financial (including cheque cashing, mortgage brokers, other financial services (e.g. Edward Jones))
220 Insurance and Real Estate52421 Insurance Agencies and Brokerages 53121 Offices of Real Estate Agents and Brokers 53132 Office of Real Estate Appraisers
230 Professional, Scientific & Technical Services54111 Offices of Lawyers54119 Other Legal Services (eg. Paralegal, Title search, immigration consultation, notaries)54121 Offices of Accountants, Tax Preparation Services, Bookings, Payroll54131 Architectural Services54132 Landscape Architecture (includes urban planners, industrial development planning, landscape architects)54134 Drafting Services54137 Survey and Mapping Services54138 Testing Labs (exlcuding medical, auto, veterinary)54141 Interior Design Services54143 Graphic Design Services (includes art studios)54149 Other Specialized Design Services (e.g. clothing, jewellery, fashion)54151 Computer Systems Design and Related Services (e.g. computer consulting and programming)54161 Management Consulting Services 54162 Environmental Consulting Services54169 Other Scientific and Technical Consulting (e.g. economic, hydrology, safety )54171 Research & Development in the Physical, Engineering and Life Sciences (includes medical research labs)54172 Research & Development in the Social Sciences and Humanities (eg. deomographic, education, phsychology research)54181 Advertising Agencies54182 Public Relations Services (e.g. lobbyists, political consultants)54191 Marketing Research & Public opinion polling54192 Photographic Services (e.g. passport photography, photo studios portrait photography studies)54193 Translation and Interpretation Services 54194 Veterinary Services (excludes pet care (81291))54199 All Other Professional, Scientific and Technical Services (includes consumer credit counselling)
240 Selected Office Administrative Services
56131 Employment Services (includes placements, executive search, casting agencies etc.)56141 Document Preparation Services (proofreading, word processing, desktop publishing etc.)56142 Telephone Call Centres56143 Business Service Centres (eg. printing, copying, mail centres) (excludes commercial printing)56144 Collection Agencies 56145 Credit Bureaus
241 56151 Travel Agencies
56159 Other Travel Arrangement & Reservation Services (eg. ticket sales agency, tourist info, bus ticket offices, etc.)
56162Security Systems (includes security system sales, installation and monitoring; locksmiths (excluding key duplication - 81149))
245 Selected Educational Services61161 Fine Arts Schools (e.g. dance, drame, music, art, handicrafts)
61162 Athletic Instruction (e.g. aerobic dance, gymnastics, juo, karate, martial arts, scuba, swimming) (excludes athletic instruction in sport and recreation
61163 Language Schools
61169 All Other Schools and Instruction (e.g. driving instruction, public speaking, Kumon, Oxford)
250 Health Care
63111 Offices of Physicians 62121 Offices of Dentists 62131 Offices of Chiropractors62132 Offices of Optometrists (excludes eyeglass stores - 44613)62133 Offices of Mental Healh Practioners (psychologists, psychiatric social workers)62134 Offices of Physical, Occupational, Speech Therapists and Audiologists62135 Offices of Other Health Practitioners (eg. acupunturists, dental hygienists, dieticians, naturopath, podiatrists)62141 Family Planning Centres 62142 Outpatient Mental Health and Substance Abuse Centres62149 Other Outpatient Care Centres (e.g. public health clinics, hearing testing, dialysis)62151 Medical and Diagnostic Laboratories (e.g. medical, x-ray, dental lab (excluding making of dentures, ortho appliances, teeth))
SERVICES

Clarington Commercial Market Analysis Update
124
urbanMetrics inc.RETAIL/SERVICE STORE CLASSIFICATION (BASED ON NORTH AMERICAN INDUSTRY CLASSIFICATION (NAICS)
255 Social Services62411 Child and Youth Social Services (e.g. Children's aid, youth centres, adoption)62149 Other Individual and Family Services (eg. AA, marriage counselling, outreach)62441 Child Day Care
260 Cultural, Entertainment and Recreation261 71312 Amusement Arcades (e.g. indoor play areas, pinball arcades, video game arcades)
262 71394Fitness & Recreational Sports Centres (includes athletic clubs, spas (w/o accommodation), aerobic dance centres, health clubs)
263 71395 Bowling Centres
264 71399 All other Amusement and Recreation Industries (includes billards parlours)
265 51213 Motion Picture and Video Exhibition (includes cinemas)
270 Food Services and Drinking Places
271 72211 Full-Service Restaurants
272 72221 Limited-Service Eating Places
273 72232 Caterers (includes banquet halls)
274 72241 Drinking Places (Alcoholic Beverages) -( includes night clubs, bars (including those with gaming), pubs, taverns
280 Personal and Household Goods Repair and Maintenance
28181111 Automotive Mechanical & Electrical Repair & Maintenance (includes engine repair, exhausts, transmission, electrical system repair)
281 81112 Automotive Body, Paint, Interior and Glass Repair (includes collision repair, auto upholstery, paint & body shops)
28181119 Other Automotive Repair & Maintenance (includes auto detail, washing, diagnostic centres, lub, rustproofing, undercoating, emissions testing)
282 81121 Electronic and Precision Equipment Repair and Maintenance (includes ink jet cartridges (cleaning and refilling), tv repair)
81141 Home and Garden Equipment and Appliance Repair & Maintenance (e.g. small engine repair)
81142 Reupholstery and Furniture Repair
81143 Footwear and Leather Goods Repair (e.g. shoe repair)
28281149 Other Personal and Household Goods Repair and Maintenance (includes key cutting, china firing/decorating, jewellery repair, sharpening of knives,
skate sharpening, watch repair etc.)
290 Personal Care Services81211 Hair care and Esthetic Services (includes barber, beatuy, hair salons)
81219 Other Personal Care services (includes day spa, diet centres, hair removal, massage parlours, tanning alons, tattoo parlours, weight reduction centres)
81231 Coin-operated Laundries and dry cleaners (self service)
81232 Dry Cleaning and Laundry services (except coin operated)
81233 Linen and Uniform Supply (includes work clothing supply services - industrial)
81291 Pet Care (except veterinary)
81292 Photofinishing Services
81299 All other Personal Services (e.g. fortune tellers, dating services, psychic services, shoeshine)
295 Civic and Social Organizations81341 Civic and Social Organizations (includes clubs)81391 Business Associations (includes board of trade, real estate boards etc.)
Transportation296 49111 Postal Service (post office)
300 VACANT VACANT RETAIL/SERVICE SPACE
SERVICES

This page intentionally left blank

Clarington Commercial Market Analysis Update
125
APPENDIX B: SUPPLY AND DEMAND – 2031 – BY STORE TYPE AND LOCATION

This page intentionally left blank

Clarington Commercial Market Analysis Update
126
SUPPLY AND DEMAND ANALYSIS - ADDITIONAL LAND REQUIREMENT AND SERVICE LEVELS, 2031
FSR: Food store retailNon-Food Store Retail -
GAFO: General merchandise, apparel, furnishings, other PPC: Pharmacy & Personal Care StoresBOHS: Building and Outdoor Home Supply Stores
Other Retail - Liquor/Beer/WineServices in Consumer Goods Rental, Personal Care, Banks, Restaurants, and all other.
FSR GAFO PPC BOHS
Other Retail / Services TOTAL
Vacant (not included in
Uptake) (Sq.Metres)
NET TOTAL (sq. Metres)
NET TOTAL (Sq.Ft.)
A. DEMANDFloor Space Warranted, 2031 (Sq. Metres) 23,680 73,420 10,340 16,815 72,780 197,035 197,035 2,120,800
B. FLOOR AREA SUPPLY - ESTIMATED ALLOCATION BY AREA (includes portion of existing vacant space) Bowmanville Urban Area 7,530 22,705 1,535 7,250 19,955 58,975 58,975 634,800 Courtice Urban Area 7,595 12,660 4,205 615 9,815 34,890 34,890 375,550 Newcastle Urban Area 2,685 140 0 0 925 3,750 3,750 40,360 Other Clarington (including Orono) 0 5,700 0 0 1,800 7,500 7,500 80,730 TOTAL SUPPLY 17,810 41,205 5,740 7,865 32,495 105,115 105,115 1,131,440 C. SURPLUS (+)/SHORTFALL (-) (sq. metres) B. less A. -5,870 -32,215 -4,600 -8,950 -40,285 -91,920 -91,920 -989,360 D. ESTIMATED FLOOR AREA ALLOCATION OF SHORTFALL (SQ.METRES) Bowmanville Urban Area 4,670 30,015 3,600 4,500 31,285 74,070 74,070 797,270 Courtice Urban Area - 1,000 - 2,950 2,000 5,950 5,950 64,000 Newcastle Urban Area 1,200 1,200 1,000 1,500 7,000 11,900 11,900 128,090 Other Clarington (including Orono) - - - - - - - - TOTAL SQUARE METRES 5,870 32,215 4,600 8,950 40,285 91,920 91,920 989,360 E. ADDITIONAL LAND AREA REQUIRED @25% COVERAGE (Hectares)
Hectares Hectares Hectares Hectares Hectares Hectares Hectares AcresBowmanville Urban Area 1.9 12.0 1.4 1.8 12.5 29.6 29.6 73.2 Courtice Urban Area - 0.4 - 1.2 0.8 2.4 2.4 5.9 Newcastle Urban Area 0.5 0.5 0.4 0.6 2.8 4.8 4.8 11.8 Other Clarington (including Orono) - - - - - - - - TOTAL LAND AREA 2.3 12.9 1.8 3.6 16.1 36.8 36.8 90.9
F. TOTAL ADDITIONAL OCCUPIED FLOOR SPACE - ESTIMATED ALLOCATION (Square Metres) (B. plus D.= A.) Bowmanville Urban Area 12,200 52,720 5,135 11,750 51,240 133,045 133,045 1,432,070 Courtice Urban Area 7,595 13,660 4,205 3,565 11,815 40,840 40,840 439,550 Newcastle Urban Area 3,885 1,340 1,000 1,500 7,925 15,650 15,650 168,450 Other Clarington (including Orono) - 5,700 - - 1,800 7,500 7,500 80,730 TOTAL (Square Metres) 23,680 73,420 10,340 16,815 72,780 197,035 197,035 2,120,800
G. EXISTING FLOOR SPACE (DECEMBER 2011)Bowmanville Urban Area 14,100 54,782 6,074 14,548 48,707 138,211 4,072 142,283 1,487,690 Courtice Urban Area 4,857 5,350 660 1,282 18,279 30,428 1,588 32,016 327,520 Newcastle Urban Area 3,400 1,245 1,849 1,877 8,508 16,879 1,894 18,773 181,680 Other Clarington (including Orono) 2,914 1,469 474 1,469 7,542 13,868 970 14,838 149,270 TOTAL (Square Metres) 25,271 62,846 9,057 19,176 83,036 199,386 8,524 207,910 2,146,160
H. DISTRIBUTION - EXISTING FLOOR SPACE (G.)Bowmanville Urban Area 56% 87% 67% 76% 59% 69% 68%Courtice Urban Area 19% 9% 7% 7% 22% 15% 15%Newcastle Urban Area 13% 2% 20% 10% 10% 8% 9%Other Clarington (including Orono) 12% 2% 5% 8% 9% 7% 7%TOTAL 100% 100% 100% 100% 100% 100% 100%
I. TOTAL FLOOR SPACE - 2031 (EXISTING AND FUTURE) (F. plus G.)Bowmanville Urban Area 26,300 107,502 11,209 26,298 99,947 271,256 4,072 275,328 2,919,800 Courtice Urban Area 12,452 19,010 4,865 4,847 30,094 71,268 1,588 72,856 767,120 Newcastle Urban Area 7,285 2,585 2,849 3,377 16,433 32,529 1,894 34,423 350,140 Other Clarington (including Orono) 2,914 7,169 474 1,469 9,342 21,368 970 22,338 230,000 TOTAL 48,951 136,266 19,397 35,991 155,816 396,421 8,524 404,945 4,267,060
J. 2031 SERVICE LEVELS - WITH ADDITIONS (based on I.)Bowmanville Urban Area 54% 79% 58% 73% 64% 68% 68%Courtice Urban Area 25% 14% 25% 13% 19% 18% 18%Newcastle Urban Area 15% 2% 15% 9% 11% 8% 9%Other Clarington (including Orono) 6% 5% 2% 4% 6% 5% 6%TOTAL 100% 100% 100% 100% 100% 100% 100%

Clarington Commercial Market Analysis Update
127
SUPPLY AND DEMAND ANALYSIS - ADDITIONAL LAND REQUIREMENT AND SERVICE LEVELS, 2031
FSR: Food store retailNon-Food Store Retail -
GAFO: General merchandise, apparel, furnishings, other PPC: Pharmacy & Personal Care StoresBOHS: Building and Outdoor Home Supply Stores
Other Retail - Liquor/Beer/WineServices in Consumer Goods Rental, Personal Care, Banks, Restaurants, and all other.
FSR GAFO PPC BOHSOther Retail /
Services TOTAL
K. SPACE PER CAPITA, 2031 m2/capita m2/capita m2/capita m2/capita m2/capitaAllocated m2/capita
Bowmanville Urban Area 0.40 1.62 0.17 0.40 1.51 4.09 Courtice Urban Area 0.36 0.54 0.14 0.14 0.86 2.04 Newcastle Urban Area 0.35 0.12 0.14 0.16 0.79 1.56 Other Clarington (including Orono) 0.16 0.40 0.03 0.08 0.52 1.18 AVERAGE 0.35 0.97 0.14 0.26 1.11 8.86
K. SPACE PER CAPITA, 2031 ft2/capita ft2/capita ft2/capita ft2/capita ft2/capita
2031 Occupied -
ft2/capitaBowmanville Urban Area 4.3 17.4 1.8 4.3 16.2 44.0 Courtice Urban Area 3.8 5.8 1.5 1.5 9.3 21.9 Newcastle Urban Area 3.8 1.3 1.5 1.7 8.5 16.8 Other Clarington (including Orono) 1.7 4.3 0.3 0.9 5.6 12.7 AVERAGE 3.8 10.4 1.5 2.8 11.9 30.4
SPACE PER CAPITA, 2011 ft2/capita ft2/capita ft2/capita ft2/capita ft2/capita
2011 Occupied -
ft2/capitaBowmanville Urban Area 4.1 16.1 1.8 4.3 14.3 40.5 Courtice Urban Area 2.1 2.4 0.3 0.6 8.0 13.4 Newcastle Urban Area 3.3 1.2 1.8 1.8 8.3 16.4 Newcastle Urban Area 1.8 0.9 0.3 0.9 4.6 8.5 AVERAGE 3.0 7.5 1.1 2.3 10.0 23.9
SOURCE: urbanMetrics inc.