Embed Size (px)
Citation preview

Commercial LinePrice Monitoring
CAS In Focus Seminar:The Underwriting Cycle Oct 5th, 6th 2009

9/28/2009 @ 2009 The Hanover Insurance Group 2
Commercial Lines Price Monitoring
AgendaPricing Levers Monitoring
Must HavesChallengesResolution
Price Change through the CycleConclusions

9/28/2009 @ 2009 The Hanover Insurance Group 3
Commercial Lines Price Monitoring
Typical Pricing LeversCompany / Underwriting Tier
Multiple Underwriting CompaniesMultiple Underwriting Tiers within a CompanyMay have bothProprietary Rate Structure
Base Rate varies by Company based upon a uniform Company Deviation FactorUnderwriting Tier Factor within Company
ISO Loss CostsLCM by CompanyTier Factor within Company
Discretionary Credit/DebitIndividual Risk Premium ModificationSchedule Credit

9/28/2009 @ 2009 The Hanover Insurance Group 4
Commercial Lines Price Monitoring
Price Monitoring: Company Utilization

9/28/2009 @ 2009 The Hanover Insurance Group 5
Commercial Lines Price Monitoring
Price Monitoring: IRPM / Schedule Credit

9/28/2009 @ 2009 The Hanover Insurance Group 6
Commercial Lines Price Monitoring
Average IRPM / Schedule CreditCalculation
Collected
August, 2009
Written Premium
August, 2008 Total Business
August, 2009
Renewal Business
% change August, 2008 Total Business
August, 2009 Renewal Business
% Change
Branch 1 $100,000 -18.6% -0.2% 22.6 $122,850 $100,200 22.6Branch 2 $100,000 0.0% 1.4% 1.4 $100,000 $98,619 1.4Branch 3 $100,000 0.0% 0.0% 0.0 $100,000 $100,000 0.0Branch 4 $100,000 -3.7% -7.6% -4.1 $103,842 $108,256 -4.1Region A $400,000 -6.3% -1.7% 0.0 $426,692 $407,076 4.8
Premium excluding IRPM
Re-state the premium to a “manual” level by dividing out the Average IRPM or Company Deviation
Premium excluding IRPM for Branch 1: $122,850 = $100,000 / ( 1 + (-0.186) )% Change = $122,850 / $100,200 – 1 = 0.226Change in IRPM is Old / New because IRPM is in the denominator.
Do this policy by policy, Sum of Collected Premium / Sum of Manual Premium = Average

9/28/2009 @ 2009 The Hanover Insurance Group 7
Commercial Lines Price Monitoring
Price Monitoring: New Versus Renewal

9/28/2009 @ 2009 The Hanover Insurance Group 8
Commercial Lines Price Monitoring
Price Monitoring: Rate Changes

9/28/2009 @ 2009 The Hanover Insurance Group 9
Commercial Lines Price Monitoring
Leaves Gaps
Bare Minimum not EnoughMonitor average Company DeviationMonitor average Discretionary Price ChangeMonitor expected average Base Rate ChangeEstimate expected average Inflationary Exposure Change
Total did not explain overall movement in average premiumIdentify Gaps
Error in the Base Rate Change EstimateActual versus Expected Exposure ChangeHidden Pricing Levers

9/28/2009 @ 2009 The Hanover Insurance Group 10
Commercial Lines Price Monitoring
Hidden Pricing LeversITV procedures: Building ValuesAudit procedures: GL Exposures; WC ExposuresRate Modification Factor Components
Expense Credit Experience Modification“Other” CreditSize of Premium Credit
Lack of System Edits (Can processor over-ride rating factors in the processing system?)Manually Rated Coverage
Non-Filed Inland Marine ClassesA-Rated ClassesBroadening EndorsementsCOP (Commercial Output Policy)Subcontracting Loss Cost

9/28/2009 @ 2009 The Hanover Insurance Group 11
Commercial Lines Price Monitoring
Solution: “New Money”
Compares renewing written premium to expiring written premium
Looks only at those policies that have renewed
Expressed as a percentage and as a dollar amountFormula:
New Money Amount = Renewing Premium – Expiring PremiumNew Money Percent = New Money Amount / Expiring Premium(or, Renewing Premium / Expiring Premium – 1)
Example;A policy expires at $1,000 and renews for $1,100New Money amount = $100New Money percent = $100 / $1,000 = +10%
9/28/2009 @ 2009 The Hanover Insurance Group 12
Commercial Lines Price Monitoring
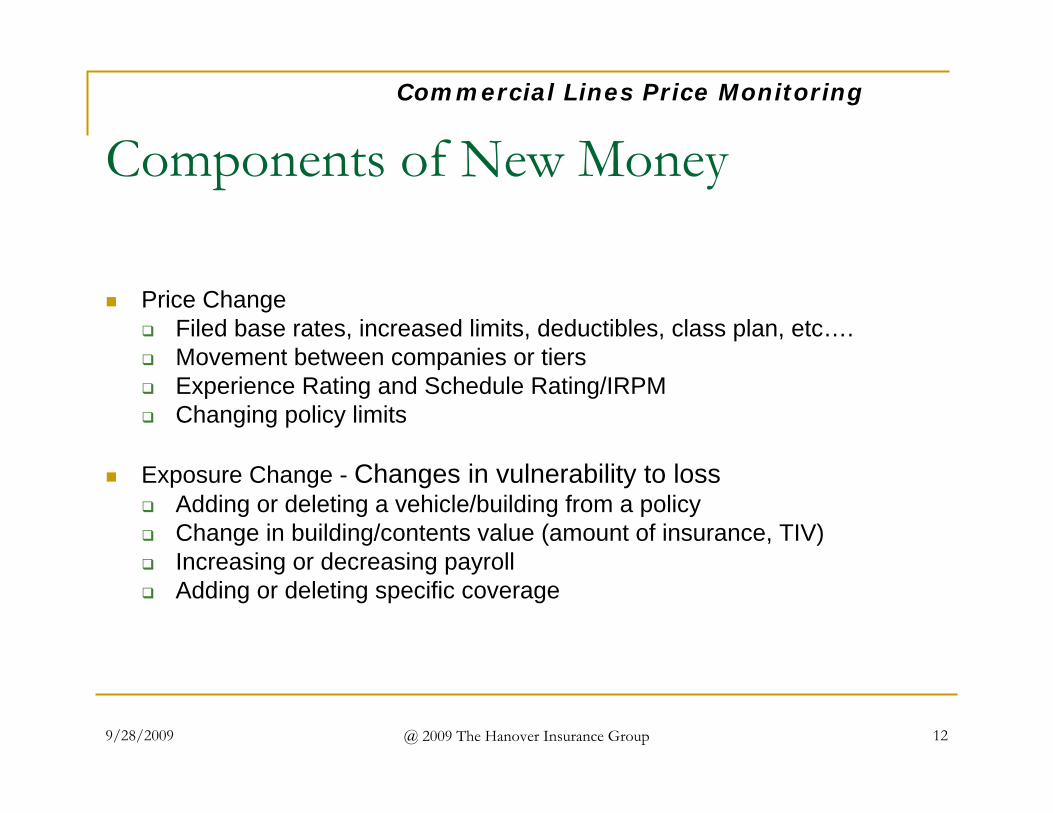
Components of New Money
Price ChangeFiled base rates, increased limits, deductibles, class plan, etc….Movement between companies or tiersExperience Rating and Schedule Rating/IRPMChanging policy limits
Exposure Change - Changes in vulnerability to lossAdding or deleting a vehicle/building from a policyChange in building/contents value (amount of insurance, TIV)Increasing or decreasing payrollAdding or deleting specific coverage

9/28/2009 @ 2009 The Hanover Insurance Group 13
Commercial Lines Price Monitoring
Split New Money into Rate and ExposurePrice Change Analysis
Start with expiring and renewing written premium & written exposure
Sort by Coverage; by Exposure BaseCommercial Auto and Workers Compensation fairly straight forward exposure basesCPP and BOP much more complex
Property Exposure is Total Insured ValueGeneral Liability Exposure varies by Class Code
50 Different Exposure Bases … # of Farm AnimalsSales, Payroll, Square Footage are most common
Determine the % change in exposure at each level of detailUse exposure % change to calculate an implied rate change; “new rate”

9/28/2009 @ 2009 The Hanover Insurance Group 14
Commercial Lines Price Monitoring
Price Change Analysis ExampleRate Change Only

9/28/2009 @ 2009 The Hanover Insurance Group 15
Commercial Lines Price Monitoring
Price Change Analysis ExampleRate Change with Exposure Change

9/28/2009 @ 2009 The Hanover Insurance Group 16
Commercial Lines Price Monitoring
Price Change Analysis: Report

9/28/2009 @ 2009 The Hanover Insurance Group 17
Commercial Lines Price Monitoring
Ongoing Challenges
Short Term PoliciesChange in Mix by Class / Exposure BaseDeductible / Coinsurance %Change in Liability Limit
Rate or Exposure?Current Calculation puts with Rate
Direct Basis OnlyPremium AuditPolicies that are canceled and rewritten to same effective date

9/28/2009 @ 2009 The Hanover Insurance Group 18
Commercial Lines Price Monitoring
Price Change through the UW CyclePrice Change Analysis
Line of Business 1
-2.0%
-1.0%
0.0%
1.0%
2.0%
3.0%
4.0%
5.0%
2008Q1 2008Q2 2008Q3 2008Q4 2009Q1 2009Q2 2009Q3
Price Change Exposure Change New Money

9/28/2009 @ 2009 The Hanover Insurance Group 19
Commercial Lines Price Monitoring
Conclusions
Commercial Line Pricing is not easy to MonitorStart by monitoring the known Pricing LeversInstitute Pricing StandardsAudit Pricing PracticesAutomate / Edit as many pricing options as possibleMonitor the final result: Renewal Price ChangeEstablish goals and accountabilityBuild tools that enable understanding