Embed Size (px)
Citation preview

1
Commercial and Industrial Floor Space Utilization Survey
Introduction This information note presents the major results of the Commercial and Industrial Floor Space Utilization Survey (CIFSUS) conducted by the Planning Department during November 2004 to March 2005. About the Survey Purpose In government strategic land use planning, forecasts of geographical distribution of employment are compiled for assessment of the impacts of the changes in spatial distribution of job places that would be brought about by future supply of commercial and industrial floor space of different types under alternative development strategies. A number of statistical parameters are employed in the compilation of the employment distribution forecasts, namely –
(a) Take-up Rate, which is the proportion of floor area of a given planned usage type being utilized for economic activities;
(b) Usage Ratio, which measures the distribution of utilized
floor area of a given planned usage type by type of user establishments according to economic activities; and
(c) Worker Density, which is expressed in terms of average
number of workers employed by the user establishments per unit of utilized floor area.
CIFSUS was conducted to collect data for updating these parameters.

2
Methodology CIFSUS covered all non-residential rateable units completed in or before December 2003 belonging to the following planned usage types:
∗ Grade A Offices ∗ Non-Grade A Offices ∗ Flatted Factories ∗ Specialized Factories ∗ Industrial/Office (I/O) Buildings ∗ Private Commercials (excluding shops)
Definitions of these planned usage types are given at Appendix 1. Stratified sampling method was adopted. The rateable units were stratified by planned usage type and PVS zone. The latter is a geographical unit for strategic landuse/transport planning and there are a total of 338 PVS zones. There were a total of 181 979 such rateable units in the survey population1. A stratified random sample of 19 330 rateable units were selected for the survey. Of the sampled rateable units, 913 of them were found to be invalid cases, such as demolished or used for residential purpose, etc and 2 419 were not occupied. Thus, only 15 998 units were eligible for enumeration and 12 678 were successfully enumerated, giving the overall response rate of 79.2%. Survey data were collected through face-to-face interview with the responsible persons of the establishments occupying the sampled units. Vacant units were confirmed with the management offices of the building blocks concerned or occupants of the neighbouring units and the floor area information was derived from R&VD records. The economic activities undertaken by the occupants of the rateable units are classified into 12 industry groups, namely –
(i) Manufacturing (ii) Storage
1 For cost effectiveness consideration, rateable units in areas where there were very few units
of the same planned usage type were excluded.
3
(iii) Transport (iv) Communications (v) Wholesale Trade (vi) Retail Trade (vii) Import/Export Trade (viii) Financial, Insurance, Real Estate & Business Services (ix) Construction (x) Restaurants (xi) Hotels and Boarding Houses (xii) Community, Social & Personal Services2
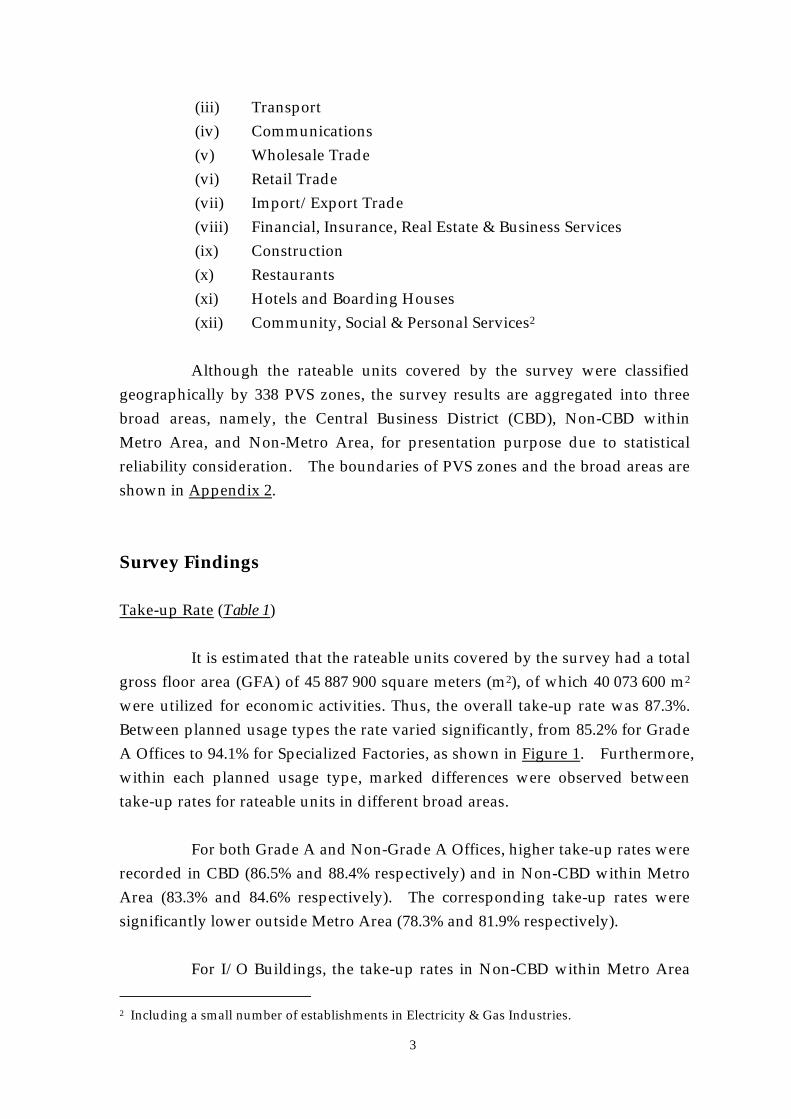
Although the rateable units covered by the survey were classified geographically by 338 PVS zones, the survey results are aggregated into three broad areas, namely, the Central Business District (CBD), Non-CBD within Metro Area, and Non-Metro Area, for presentation purpose due to statistical reliability consideration. The boundaries of PVS zones and the broad areas are shown in Appendix 2. Survey Findings Take-up Rate (Table 1) It is estimated that the rateable units covered by the survey had a total gross floor area (GFA) of 45 887 900 square meters (m2), of which 40 073 600 m2 were utilized for economic activities. Thus, the overall take-up rate was 87.3%. Between planned usage types the rate varied significantly, from 85.2% for Grade A Offices to 94.1% for Specialized Factories, as shown in Figure 1. Furthermore, within each planned usage type, marked differences were observed between take-up rates for rateable units in different broad areas. For both Grade A and Non-Grade A Offices, higher take-up rates were recorded in CBD (86.5% and 88.4% respectively) and in Non-CBD within Metro Area (83.3% and 84.6% respectively). The corresponding take-up rates were significantly lower outside Metro Area (78.3% and 81.9% respectively). For I/O Buildings, the take-up rates in Non-CBD within Metro Area 2 Including a small number of establishments in Electricity & Gas Industries.
4
(90.4%) and Non-Metro Area (92.8%) were quite similar. There were no I/O Buildings in CBD.
Figure 1: Take-up Rates by Planned Usage Type
85.2
86.886.2
94.1
90.6 91
80
82
84
86
88
90
92
94
96
Grade A Offices Non Grade AOffices
FlattedFactories
SpecializedFactories
I/O Buildings PrivateCommercials
(excludingshops)
Perc
enta
ge
Take-up rate of Flatted Factories was higher in Non-CBD within Metro Area (87.4%) than in Non-Metro Area (81.6%). On the contrary, take-up rate of Specialized Factories was lower in Non-CBD within Metro-Area (89.2%) than Non-Metro Area (96.4%). There were no Flatted Factories or Specialized Factories in CBD. As for Private Commercials, it is interesting to note that the take-up rate was highest outside Metro Area (94.9%), while lower take-up rates were recorded in CBD (91.1%) and Non-CBD within Metro Area (90.1%) respectively. Usage Ratios
Usage ratios are given by the proportions of GFA of a given planned usage type utilized by different economic activities and hence represent the utilization pattern of the floor space concerned by different economic activities. Marked variations were observed in the usage ratios between different planned usage types and between board areas for given planned usage types, as discussed below.
5
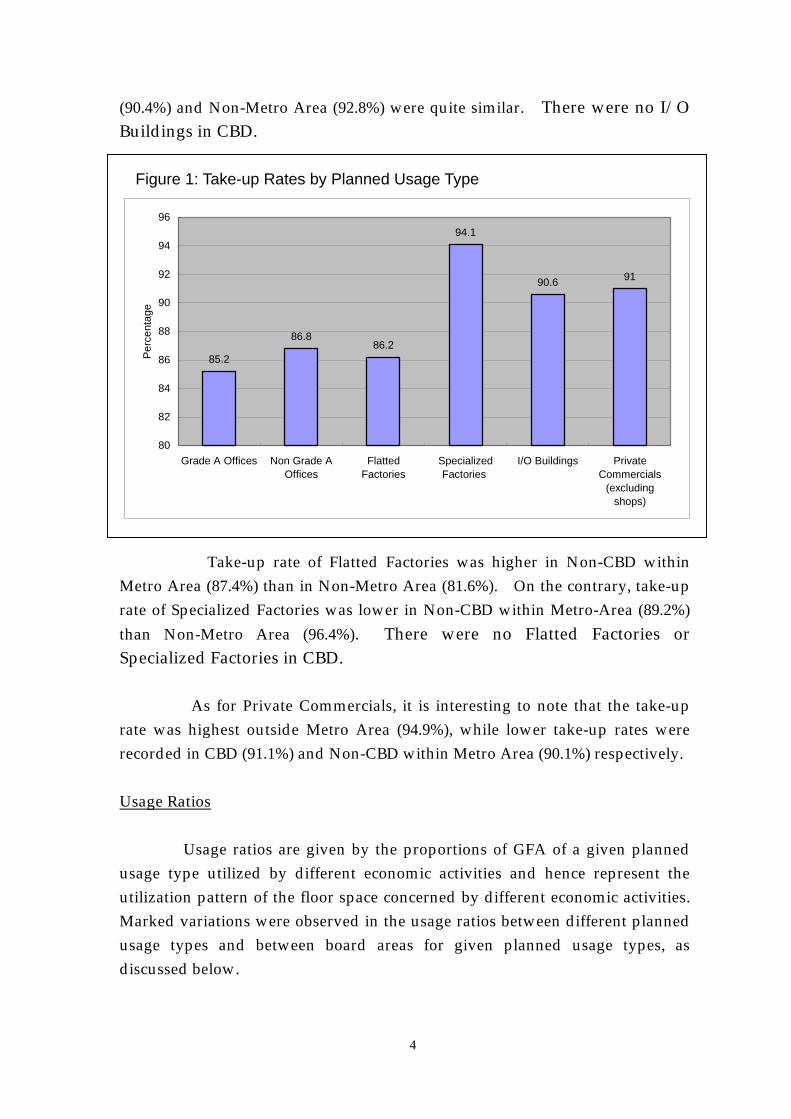
Grade A Offices (Table 2) Import/Export Trade and Financial, Insurance, Real Estate & Business Services were the major user industry groups of Grade A Offices floor space. The proportions of GFA of Grade A Offices utilized by these two industry groups (usage ratios) were 38.6% and 35.6% respectively. Community, Social & Personal Services was the other major user industry group, utilizing 7.3% of the GFA. The GFA utilization patterns in CBD and Non-CBD within Metro Area were quite similar, with Import/Export Trade and Financial, Insurance, Real Estate & Business Services being the top two user industry groups of Grade A Offices in both broad areas. However, the usage ratio of Financial, Insurance, Real Estate & Business Services was much lower in Non-CBD, at only 24.6%, as compared to the corresponding figure of 42.1% in CBD. (Figure 2)
Figure 2: Usage Ratios of Grade A Offices by Broad Area
42.1
24.6
35.4
44.9
36.7
6.7
3.3
4.4
6.5
7.7
22.5
3.1
6.2
6.9
2.6
3.5
2.8
4.4
3.0
3.511.0
11.9
0%
10%
20%
30%
40%
50%
60%
70%
80%
90%
100%
CBD Non-CBDwithin Metro
Area
Non-MetroArea
Restaurants
Communications
Hotels and BoardingHouses
Manufacturing
Construction
Retail Trade
Wholesale Trade
Community, Social &Personal Services
Transport
Import/Export Trade
Financial, Insurance, RealEstate & BusinessServices

6
Outside the Metro Area, the Financial, Insurance, Real Estate & Business Services establishments became an even less important group of users of Grade A Offices, taking up only 11.9% of the GFA. Import/Export establishments utilized the largest proportion (36.7%) of Grade A Offices GFA there while Community, Social & Personal Services establishments utilized as much as 22.5%. Non-Grade A Offices (Table 3) As in the case of Non-Grade A Offices, Import/Export Trade, Financial, Insurance, Real Estate & Business Services, and Community, Social & Personal Services were the major users, with usage ratios of 32%, 25.9% and 17.9% respectively. The variations in utilization patterns across broad areas were also quite similar to those of Grade A Offices. In particular, the greater importance of the Community, Social & Personal Services in Non-Metro Area was more marked, with usage ratio of this sector rising from 16.7% in CBD and 18.3% in Non-CBD in Metro Area to 50.1% in Non-Metro Area. (Figure 3)
Figure 3: Usage Ratios of Non-Grade A Offices by Broad Area
31.9
16.4
28.1
39.4
9.5
16.718.3
50.1
7.95.1
4.34.8
4.9
4.83.36.3
3.3 4.93.0
24.4
0%
20%
40%
60%
80%
100%
CBD Non-CBD withinMetro Area
Non-Metro Area
Storage
Hotels and Boarding Houses
Communications
Restaurants
Manufacturing
Construction
Wholesale Trade
Retail Trade
Transport
Community, Social & PersonalServices
Import/Export Trade
Financial, Insurance, RealEstate & Business Services

7
Flatted Factories (Table 4) Import/Export Trade was the single most important user industry group of Flatted Factories floor space, taking up 43.8% of the total utilized GFA. Manufacturing industries only took up 22.6%, while Wholesale Trade utilized another 9.2%. There had been little variations in the utilization patterns between Non-CBD in Metro Area and Non-Metro Area. There were no Flatted Factories in CBD. (Figure 4)
Figure 4: Usage Ratios of Flatted Factories
Retail Trade4.9%
Community, Social &Personal Services
3.7%Transport
3.8% Communications0.4%
Restaurants0.8%
Storage0.8%
Import/Export Trade43.8%
Manufacturing22.6%
Wholesale Trade9.2%
Financial, Insurance,Real Estate &
Business Services5.5%
Construction4.6%

8
Specialized Factories (Table 5) Although most of the Specialized Factory buildings were originally for manufacturing industries with special accommodation needs, many of their tenants nowadays are engaged non-manufacturing activities. The survey found that manufacturers only took up 58.4% of the total utilized GFA of Specialized Factories. Import/Export firms took up 13% and Community, Social & Personal Services establishments utilized another 6.6%. The presence of non-manufacturing activities in Specialized Factories was more significant in Non-CBD within Metro Area than Non-Metro Area. In the former, the usage ratios for the Manufacturing was only 42.9% while those for Import/Export Trade and Community, Social & Personal Services were 22.2% and 15.6% respectively. The usage ratio for Manufacturing in Non-Metro Area was much higher, at 65%. There were no Specialized Factories in CBD. (Figure 5)

9
Figure 5: Usage Ratios of Specialized Factories by Broad Area

10
I/O Buildings (Table 6)
Import/Export firms predominated the utilization of I/O Buildings, taking up 66.1% of the total utilized GFA. Financial, Insurance, Real Estate & Business Services establishments, the second largest group of users, took up only 11.6%. (Figure 6) The floor space utilization patterns were basically the same in both Non-CBD within Metro Area and Non-Metro Area, except that higher ratio was recorded for Financial, Insurance, Real Estate & Business Services in Non-Metro Area (21%) than Non-CBD within Metro Area (10.7%). There were no I/O Buildings in CBD.
Figure 6: Usage Ratios of I/O Buildings
Wholesale Trade4.4%
Manufacturing4.8%
Financial, Insurance,Real Estate &
Business Services11.6%
Import/Export Trade66.1%
Transport2.5%
Communications2.4%
Construction2.9%
Retail Trade3.2%
Community, Social& Personal Services
1.8%
Restaurants0.3%

11
Private Commercials (excluding shops) (Table 7)
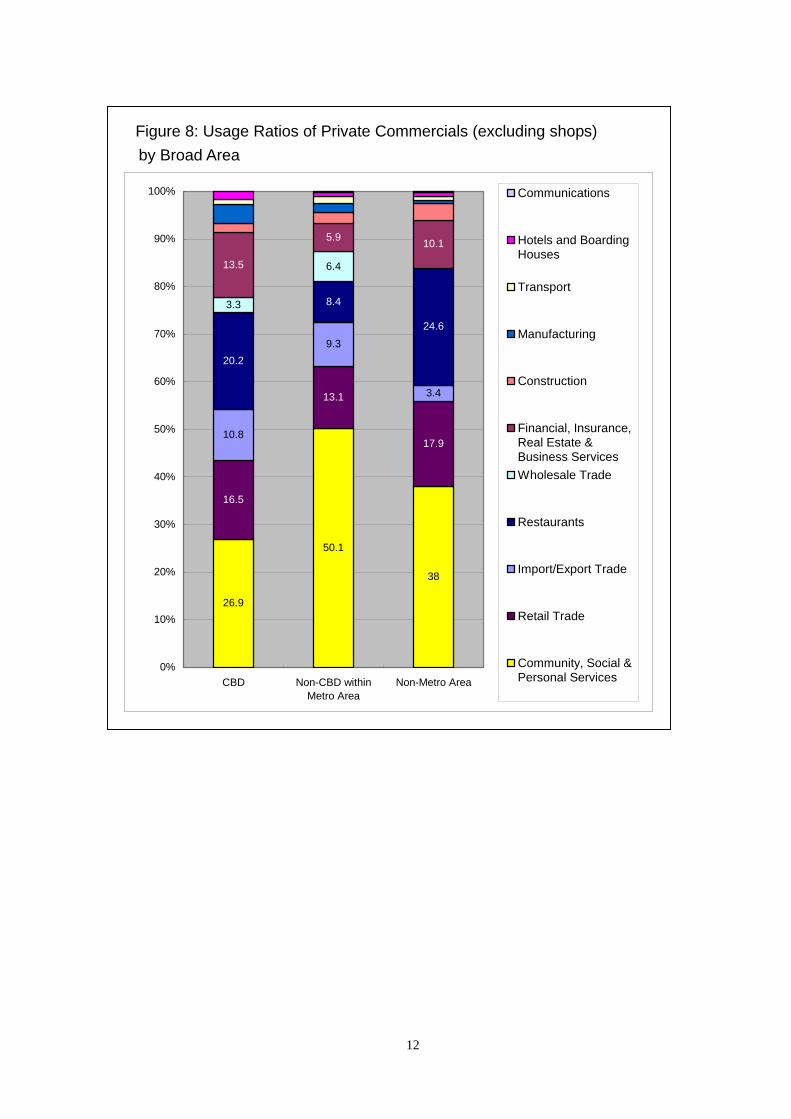
The largest proportion of Private Commercials GFA was utilized by Community, Social & Personal Services establishments (42.2%), followed by Retailers (14.7%), Restaurants (13.8%), Import/Export firms (8.9%) and Financial, Real Estate & Business Services establishments (8.6%). (Figure 7)
Figure 7: Usage Ratios of Private Commercials (excluding shops)
Hotels and BoardingHouses
1.1%
Communications0.2%
Manufacturing2.4%
Wholesale Trade4.7%
Transport1.2%
Financial, Insurance,Real Estate &
Business Services8.6%
Construction2.3%
Community, Social &Personal Services
42.2%
Retail Trade14.7%
Restaurants13.8%
Import/Export Trade8.9%
Between broad areas, there were notable variations in the utilization pattern. In CBD, the Private Commercials floor space was shared rather evenly between four industry groups, namely, Community, Social & Personal Services (26.9%), Restaurants (20.2%), Retail Trade (16.5%) and Financial, Insurance, Real Estate & Business Services (13.5%). In Non-CBD within Metro Area, Community, Social & Personal Services was the single dominating user industry group, utilizing more than half of the floor space (50.1%). In Non-Metro Area, the utilization pattern was quite similar to CBD, with usage ratios of 38% for Community, Social & Personal Services, 24.6% for Restaurants, and 17.9% for Retail Trade. (Figure 8)
12
Figure 8: Usage Ratios of Private Commercials (excluding shops) by Broad Area
26.9
50.1
38
16.5
13.1
17.910.8
9.3
3.4
20.2
8.4
24.6
3.3
6.413.5
5.9 10.1
0%
10%
20%
30%
40%
50%
60%
70%
80%
90%
100%
CBD Non-CBD withinMetro Area
Non-Metro Area
Communications
Hotels and BoardingHouses
Transport
Manufacturing
Construction
Financial, Insurance,Real Estate &Business ServicesWholesale Trade
Restaurants
Import/Export Trade
Retail Trade
Community, Social &Personal Services
13
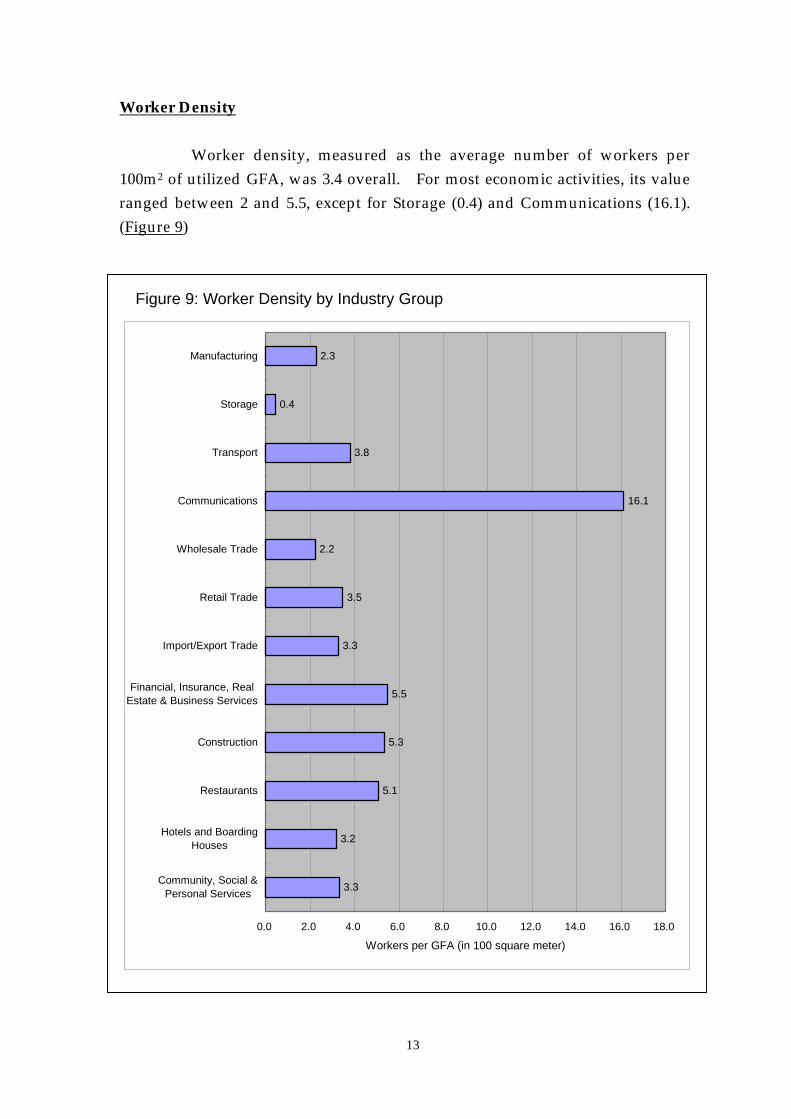
Worker Density Worker density, measured as the average number of workers per 100m2 of utilized GFA, was 3.4 overall. For most economic activities, its value ranged between 2 and 5.5, except for Storage (0.4) and Communications (16.1). (Figure 9)
Figure 9: Worker Density by Industry Group
3.3
3.2
5.1
5.3
5.5
3.3
3.5
2.2
16.1
3.8
0.4
2.3
0.0 2.0 4.0 6.0 8.0 10.0 12.0 14.0 16.0 18.0
Community, Social &Personal Services
Hotels and BoardingHouses
Restaurants
Construction
Financial, Insurance, RealEstate & Business Services
Import/Export Trade
Retail Trade
Wholesale Trade
Communications
Transport
Storage
Manufacturing
Workers per GFA (in 100 square meter)

14
Worker density also varied between the planned usage types to which the floor area belonged. Non-Grade A Offices had the highest worker density, averaging 5.9 workers per 100 m2 while Specialized Factories had the lowest worker density, averaging only 1.1 workers per 100 m2. (Figure 10)
Figure 10: Worker Density by Planned Usage Type
5.2
5.9
2.8
1.1
4.3
3.2
0.0
1.0
2.0
3.0
4.0
5.0
6.0
7.0
Grade AOffices
Non-Grade AOffices
FlattedFactories
SpecializedFactories
I/O Buildings PrivateCommercials
(excludingshops)
Wor
kers
per
GFA
(in
100
squa
re m
eter
)
As such, worker density depends both on the planned usage types as well as the types of economic activities that were using the floor space. Thus, significant variations were observed for floor space of the same planned usage type but utilized by different industry groups as discussed below. (Table 8)

15
Grade A Offices Amongst industry groups occupying Grade A Offices, higher values of worker density were recorded for Hotels and Boarding Houses (7.1), Communications (6.6) and Retail Trade (6.6), while lower values were recorded for Community, Social & Personal Services (2.9) and Transport (3.9). (Figure 11)
Figure 11: Worker Density in Grade A Offices by Industry Group
2.9
7.1
4.5
6.4
6.0
4.9
6.6
5.6
6.6
3.9
5.3
0.0 1.0 2.0 3.0 4.0 5.0 6.0 7.0 8.0
Community, Social &Personal Services
Hotels and BoardingHouses
Restaurants
Construction
Financial, Insurance, RealEstate & Business Services
Import/Export Trade
Retail Trade
Wholesale Trade
Communications
Transport
Manufacturing
Workers per GFA (in 100 square meter)

16
Non-Grade A Offices For Non-Grade A Offices, industry groups with higher worker density included Communications (11.9), Transport (8.0) and Construction (7.8). (Figure 12)
Figure 12: Worker Density in Non-Grade A Offices by Industry Group
6.1
6.0
6.0
7.8
6.5
4.6
4.7
5.2
11.9
8.0
5.9
0.0 2.0 4.0 6.0 8.0 10.0 12.0 14.0
Community, Social &Personal Services
Hotels and BoardingHouses
Restaurants
Construction
Financial, Insurance, RealEstate & Business Services
Import/Export Trade
Retail Trade
Wholesale Trade
Communications
Transport
Manufacturing
Workers per GFA (in 100 square meter)

17
Flatted Factories Variations of worker density in Flatted Factories were large between user industry groups. The value ranged from 0.6 for Storage to 29.4 for Communications, although for most industry groups it lay between 2 to 5. (Figure 13)
Figure 13: Worker Density in Flatted Factories by Industry Group
2.3
3.9
5.2
3.4
2.8
3.9
1.9
29.4
2.4
0.6
2.5
0.0 5.0 10.0 15.0 20.0 25.0 30.0 35.0
Community, Social &Personal Services
Restaurants
Construction
Financial, Insurance, RealEstate & Business Services
Import/Export Trade
Retail Trade
Wholesale Trade
Communications
Transport
Storage
Manufacturing
Workers per GFA (in 100 square meter)

18
Specialized Factories
Economic activities in Specialized Factories generally had low worker density, ranging from 0.3 for Construction to 1.3 for Community, Social & Personal Services. The higher value of 2.1 observed for Restaurants was based on very small number of samples and hence was considered not representative. (Figure 14)
Figure 14: Worker Density in Specialized Factories by Industry Group
1.3
0.3
0.5
1.2
1.0
0.4
0.7
1.2
2.1*
0.1*
1.1*
0.0 0.5 1.0 1.5 2.0 2.5
Community, Social &Personal Services
Restaurants
Construction
Financial, Insurance, RealEstate & Business Services
Import/Export Trade
Retail Trade
Wholesale Trade
Communications
Transport
Storage
Manufacturing
Workers per GFA (in 100 square meter)
* Based on 10 or less sampled establishments.

19
I/O Buildings
The variations in worker density between different economic activities utilizing I/O Buildings were relatively small. While Manufacturing had the lowest value of 3.3, Community, Social & Personal Services had the highest value of 6.1. (Figure 15)
Figure 15: Worker Density in I/O Buildings by Industry Group
6.1
4.3
4.4
4.1
4.1
4.5
5.5
5.7
3.3
6.0*
0.0 1.0 2.0 3.0 4.0 5.0 6.0 7.0
Community, Social &Personal Services
Restaurants
Construction
Financial, Insurance, RealEstate & Business Services
Import/Export Trade
Retail Trade
Wholesale Trade
Communications
Transport
Manufacturing
Workers per GFA (in 100 square meter)
* Based on 10 or less sampled establishments.

20
Private Commercials (excluding shops)
In Private Commercials (excluding shops), the highest worker density was found amongst Transport establishments (13.3), which was more than six times of the worker density for Retail Industries (2.1) and more than nine times higher than Hotels and Boarding Houses (1.4). (Figure 16)
Figure16: Worker Density in Private Commercials (excluding shops) by Industry Group
2.3
1.4
5.1
7.1
5.0
2.8
2.1
2.5
4.1
13.3
5.0
0.0 2.0 4.0 6.0 8.0 10.0 12.0 14.0
Community, Social &Personal Services
Hotels and BoardingHouses
Restaurants
Construction
Financial, Insurance, RealEstate & Business Services
Import/Export Trade
Retail Trade
Wholesale Trade
Communications
Transport
Manufacturing
Workers per GFA (in 100 square meter)

21
Conclusion The results of CIFSUS have provided updated data on statistical parameters used in the compilation of forecasts of geographical distribution of employment required for strategic land use planning. The parameters are the Take-up Rate, Usage Ratio, and Worker Density, as defined in paragraph 2 above. While these parameters are not static but will change over time, the survey results provide a base for formulating scenarios which specify how these parameters will change in the future in response to various factors (such as technological advances and management innovations) as well as planning vision.

22
Table 1: Take-Up Rate by Planned Usage Type and Broad Area
Planned Usage Types
Broad Areas All Types Grade A Offices
Non-Grade A
Offices Flatted Factories
Specialized
Factories I/O Buildings
Private
Commercials
(excluding shops)
CBD
87.9% 86.5% 88.4% - - - 91.1%
Non-CBD within
Metro Area
87.2% 83.3% 84.6% 87.4% 89.2% 90.4% 90.1%
Non-Metro Area
87.1% 78.3% 81.9% 81.6% 96.4% 92.8% 94.9%
Whole Territory
87.3% 85.2% 86.8% 86.2% 94.1% 90.6% 91.0%

23
Table 2: Usage Ratio of Grade A Offices by Economic Activity and Broad Area
Broad Areas
Economic Activities All Areas CBD Non-CBD within Metro Area Non-Metro Area
Manufacturing 2.2% 1.3% 3.5% 11.0%
Storage - - - -
Transport 5.5% 6.7% 3.3% 4.4%
Communications 0.6% 0.4% 1.1% 0.1%
Wholesale Trade 4.2% 3.1% 6.2% 6.9%
Retail Trade 2.9% 2.6% 3.5% 2.8%
Import/Export Trade 38.6% 35.4% 44.9% 36.7%
Financial, Insurance, Real Estate &
Business Services 35.6% 42.1% 24.6% 11.9%
Construction 2.5% 1.5% 4.4% 3.0%
Restaurants 0.3% 0.1% 0.8% 0.7%
Hotels and Boarding Houses 0.3% 0.4% - -
Community, Social & Personal Services 7.3% 6.5% 7.7% 22.5%
Total Utilized GFA (m2) 4 915 000 3 180 300 1 609 400 125 300

24
Table 3: Usage Ratio for the GFA of Non-Grade A Offices by Economic Activity and Broad Area
Broad Areas
Economic Activities All Areas CBD Non-CBD within Metro Area Non-Metro Area
Manufacturing 2.2% 1.7% 3.0% 1.3%
Storage 0.0% 0.0% - -
Transport 6.8% 7.9% 5.1% 4.3%
Communications 0.6% 0.4% 1.0% 0.3%
Wholesale Trade 4.4% 3.3% 6.3% 1.0%
Retail Trade 4.8% 4.8% 4.9% 4.8%
Import/Export Trade 32.0% 28.1% 39.4% 9.5%
Financial, Insurance, Real Estate &
Business Services 25.9% 31.9% 16.4% 24.4%
Construction 3.9% 3.3% 4.9% 3.0%
Restaurants 1.2% 1.5% 0.6% 1.4%
Hotels and Boarding Houses 0.2% 0.3% 0.0% -
Community, Social & Personal Services 17.9% 16.7% 18.3% 50.1%
Total Utilized GFA (m2) 6 785 000 4 111 900 2 560 900 112 200

25
Table 4: Usage Ratio for the GFA of Flatted Factories by Economic Activity and Broad Area
Broad Areas Economic Activities All Areas
CBD Non-CBD within Metro Area Non-Metro Area
Manufacturing 22.6% - 22.5% 22.8%
Storage 0.8% - 0.8% 1.0%
Transport 3.8% - 3.6% 4.7%
Communications 0.4% - 0.5% 0.2%
Wholesale Trade 9.2% - 9.1% 9.6%
Retail Trade 4.9% - 4.8% 5.1%
Import/Export Trade 43.8% - 45.2% 37.7%
Financial, Insurance, Real Estate &
Business Services 5.5% - 5.5% 5.4%
Construction 4.6% - 4.1% 6.4%
Restaurants 0.8% - 0.5% 2.1%
Hotels and Boarding Houses - - - -
Community, Social & Personal Services 3.7% - 3.3% 5.1%
Total Utilized GFA (m2) 20 405 100 - 16 531 800 3 873 300

26
Table 5: Usage Ratio for the GFA of Specialized Factories by Economic Activity and Broad Area
Broad Areas Economic Activities All Areas
CBD Non-CBD within Metro Area Non-Metro Area
Manufacturing 58.4% - 42.9% 65.0%
Storage 1.8% - 1.4% 2.0%
Transport 4.7% - 7.2% 3.6%
Communications 0.3% - 0.1% 0.4%
Wholesale Trade 5.0% - 4.7% 5.1%
Retail Trade 3.0% - 2.7% 3.1%
Import/Export Trade 13.0% - 22.2% 9.1%
Financial, Insurance, Real Estate &
Business Services 2.2% - 2.2% 2.2%
Construction 4.9% - 0.6% 6.8%
Restaurants 0.2% - 0.3% 0.1%
Hotels and Boarding Houses - - - -
Community, Social & Personal Services 6.6% - 15.6% 2.8%
Total Utilized GFA (m2) 3 462 200 - 1 034 500 2 427 600

27
Table 6: Usage Ratio for the GFA of I/O Buildings by Economic Activity and Broad Area
Broad Areas Economic Activities All Areas
CBD Non-CBD within Metro Area Non-Metro Area
Manufacturing 4.8% - 5.2% -
Storage - - - -
Transport 2.5% - 2.4% 3.3%
Communications 2.4% - 2.6% -
Wholesale Trade 4.4% - 4.3% 5.8%
Retail Trade 3.2% - 3.2% 2.1%
Import/Export Trade 66.1% - 66.8% 59.4%
Financial, Insurance, Real Estate &
Business Services 11.6% - 10.7% 21.0%
Construction 2.9% - 2.6% 6.8%
Restaurants 0.3% - 0.4% 0.2%
Hotels and Boarding Houses - - - -
Community, Social & Personal Services 1.8% - 1.8% 1.4%
Total Utilized GFA (m2) 815 800 - 748 300 67 500

28
Table 7: Usage Ratio for the GFA of Private Commercials (excluding shops) by Economic Activity and Broad Area
Broad Areas Economic Activities All Areas
CBD Non-CBD within Metro Area Non-Metro Area
Manufacturing 2.4% 4.0% 2.0% 0.8%
Storage - - - -
Transport 1.2% 1.0% 1.4% 0.8%
Communications 0.2% - 0.3% 0.2%
Wholesale Trade 4.7% 3.3% 6.4% -
Retail Trade 14.7% 16.5% 13.1% 17.9%
Import/Export Trade 8.9% 10.8% 9.3% 3.4%
Financial, Insurance, Real Estate &
Business Services 8.6% 13.5% 5.9% 10.1%
Construction 2.3% 2.0% 2.2% 3.4%
Restaurants 13.8% 20.2% 8.4% 24.6%
Hotels and Boarding Houses 1.1% 1.7% 0.8% 0.8%
Community, Social & Personal Services 42.2% 26.9% 50.1% 38.0%
Total Utilized GFA (m2) 3 690 600 993 200 2 186 600 510 800

29
Table 8: Worker Density by Economic Activity and Planned Usage Type (workers per GFA (in 100 m2))
Planned Usage Types
Economic Activities All Types Grade A Offices
Non-Grade A
Offices
Flatted
Factories
Specialized
Factories I/O Buildings
Private
Commercials
Manufacturing 2.3 5.3 5.9 2.5 1.2 3.3 5.0
Storage 0.4 - - 0.6 0.1* - -
Transport 3.8 3.9 8.0 2.4 0.7 5.7 13.3
Communications 16.1 6.6 11.9 29.4 1.1* 5.5 4.1
Wholesale Trade 2.2 5.6 5.2 1.9 0.4 4.5 2.5
Retail Trade 3.5 6.6 4.7 3.9 1.0 4.1 2.1
Import/Export Trade 3.3 4.9 4.6 2.8 1.2 4.1 2.8
Financial, Insurance, Real Estate &
Business Services 5.5 6.0 6.5 3.4 0.5 4.4 5.0
Construction 5.3 6.4 7.8 5.2 0.3 4.3 7.1
Restaurants 5.1 4.5 6.0 3.9 2.1* 6.0* 5.1
Hotels and Boarding Houses 3.2 7.1 6.0 - - - 1.4
Community, Social & Personal Services 3.3 2.9 6.1 2.3 1.3 6.1 2.3
All Economic Activities 3.4 5.2 5.9 2.8 1.1 4.3 3.2
* Based on 10 or less establishments

30
Appendix 1 Definition of Planned Usage Types Private office premises situated in buildings designed for
commercial/business purposes. Excluded are non-domestic floors in composite buildings. Offices are graded as follows: Grade A Offices Modern with high quality finishes; flexible layout; large floor plates; spacious, well decorated lobbies and circulation areas; effective central air-conditioning; good lift services zoned for passengers and goods deliveries; professional management; parking facilities normally available. Non-Grade A Offices Grades other than Grade A Offices.
Note: Location is not a feature of grade. Offices owned by the Government of the Hong Kong Special Administrative Region and managed by the Government Property Agency are excluded.
Flatted Factories Premises designed for general manufacturing processes and uses, including offices, directly related to such processes, and normally intended for sale or letting by the developers. Specialized factories are excluded. Similar premises built by the Housing Authority are not included.
Specialized Factories All other factory premises, primarily purpose-built for specialized manufacturing processes, usually for occupation by a single operator.
Industrial/Office (I/O) Buildings
Floor space designed or certified for industrial/office use.

31
Private Commercials (excluding shops)
Retail premises and other premises designed or adapted for commercial use, with the exception of purpose-built offices. Carparking space and shops are excluded. Commercial premises built by the Housing Authority and Housing Society are excluded.


35
Conversion Table between the Broad Areas and PVS-338 Zones
Broad Area PVS-338 Zone
CBD 5, 7-11, 15-19, 54-58, 235, 237-238, 275, 292-302 and 325-326
Non-CBD within Metro Area 1-4, 6, 12-14, 20-53, 59-156, 228, 230, 233-234, 236, 253-257, 260, 271-274, 276-278, 291, 303-311 and 335-337
Non-Metro Area 157-227, 229, 231-232, 239-247, 251, 258-259, 261-267, 280-284, 312-324, 327-334 and 338