Embed Size (px)
Citation preview

1
Commercial & Industrial
Large Water Meters

2
Water Distribution System

3
Large Meter Family

4
Large Meter Family
5
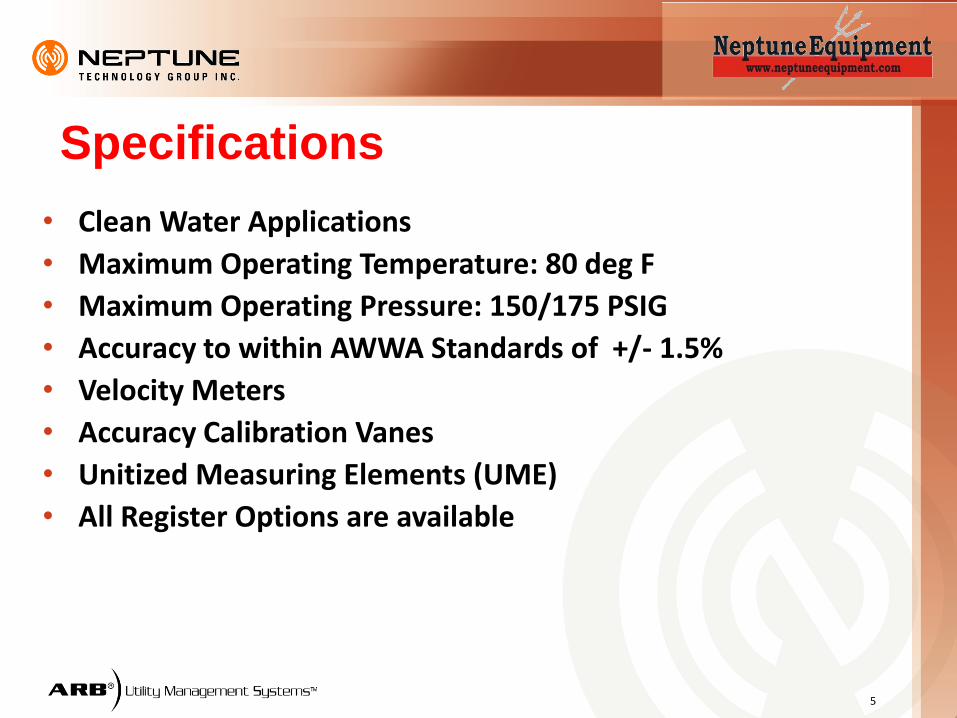
Specifications
• Clean Water Applications
• Maximum Operating Temperature: 80 deg F
• Maximum Operating Pressure: 150/175 PSIG
• Accuracy to within AWWA Standards of +/- 1.5%
• Velocity Meters
• Accuracy Calibration Vanes
• Unitized Measuring Elements (UME)
• All Register Options are available

6
Correct vs. Irregular flows
For best performance, a turbine meter expects a uniform
velocity profile.
No swirl is allowed.
Generally speaking, 8-10 diameters of straight pipe
upstream will correct velocity profile, but not always.
This extra length promotes mixing, and helps to eliminate
flow irregularities.

7
Correct vs. Irregular flows
• But what causes irregular flows?
Generally, any
abrupt change in
the plumbing is a
potential source of
flow irregularities.

9
• Clean Water Applications
• Cold water Measurement
• Velocity Meter
• Velocity is proportional to the water flow rate
• Turbine rotor is used to measure the velocity
• Turbine rotor is magnetically coupled to the register
Turbines

10
Turbine Meters - How Do They Work?

11
In-Line Magmeters • Faraday’s Law:When a conductive fluid
passes through a magnetic field, a voltage proportional to flow is induced

12
Compound Meters - How Do They Work? • Two meters in one maincase
– PD meter for low flow rates
– Turbine for moderate to high flows
• Hydraulic valve
– to transition flows from PD meter to turbine and vice-versa
• Two registers
– register for the PD meter and a register for the turbine meter
• Automatic Throttling Valve
– to protect the PD meter from pre-mature wear
• Test Ports
– facilitates testing

13
One Register vs. Two Registers
• One Register Benefits
– Ease of reading
– Billing System
• Two Register Benefits
– Quickly identify problem with disc side
– No coordinator to connect high & low side together
– No oil required
– Easier to calibrate
– Facilitates a true UME design

14
Disc (Low Side) Register
Turbine (High Side) Register
T-10 Chamber
Throttle Tube
Throttle Tube Door
Valve Piston Main Valve Assembly
Turbine Measuring Element
Calibration Vane Cover
Main Case
TRU/FLO Compound

15
Compound Meters
Cold Water Measurement
No Lead Alloy
NSF 61 certified
2” - 10” Sizes
Flow Range: 1/8-2000 gpm
Low to High Flow Rates
High & Low Side Register
Patented Hydraulic Valve
Narrow Crossover Range
Automatic Throttling Valve
UME / Calibration Vane
Test Ports

16
At low flow, the main valve prevents water from flowing
through the Turbine element.
All water is diverted through the cover, into the T-10
chamber and out the throttle tube.
Low Flow

17
As the flow rate increases, the increased pressure differential causes the valve piston to move rearward, closing the throttle tube door, reducing the flow through the T-10 chamber.
Crossover Imminent

18
The actuation of the valve piston and the subsequent reduction of
flow through the T-10 chamber “shunts” a large volume of water
through the turbine measuring element forcing the main valve
open. Both the turbine and the T-10 are operating.
Crossover

19
At intermediate and high flow rates, the main valve is fully open and the majority of the water flows through the turbine. Water continues to flow through the T-10 at a greatly reduced rate. This helps “flush” the the T-10 while simultaneously insuring that it does not “over-speed”
Intermediate and High Flow

20
Fire Service Turbines
• Fire Service Applications
• Cold Water Measurement
• Moderate to High Flow Rates
• Uses Standard HP Turbine (NL)
• UL/FM Listed Basket Strainer
• Lightweight, easy to handle
• Corrects flow profile and
• Stops debris.
21
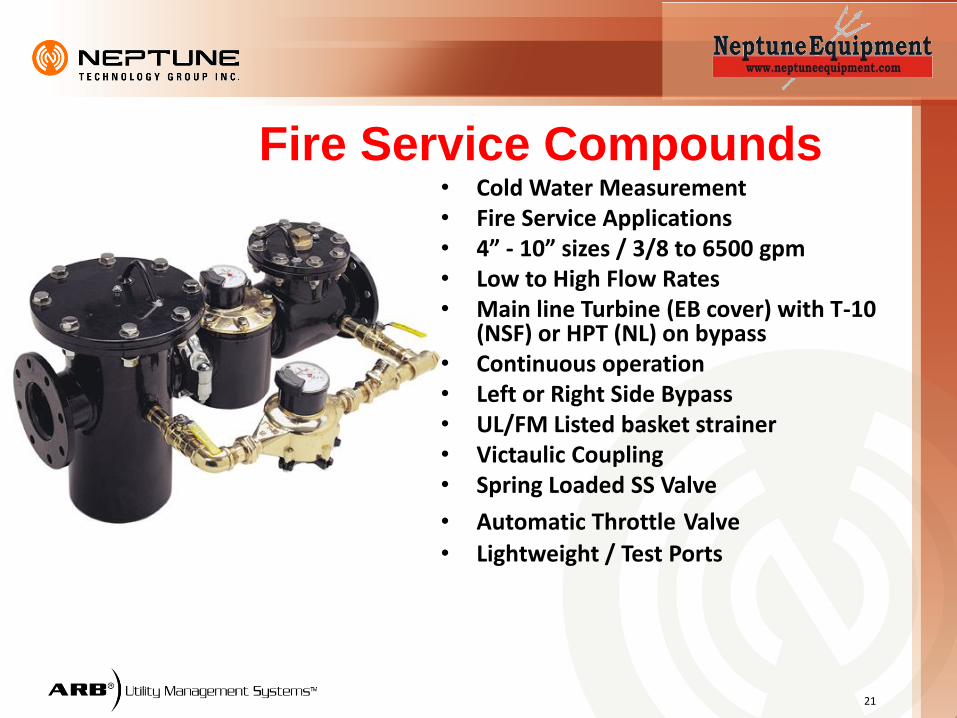
Fire Service Compounds • Cold Water Measurement • Fire Service Applications • 4” - 10” sizes / 3/8 to 6500 gpm • Low to High Flow Rates • Main line Turbine (EB cover) with T-10
(NSF) or HPT (NL) on bypass • Continuous operation • Left or Right Side Bypass • UL/FM Listed basket strainer • Victaulic Coupling • Spring Loaded SS Valve
• Automatic Throttle Valve
• Lightweight / Test Ports
22
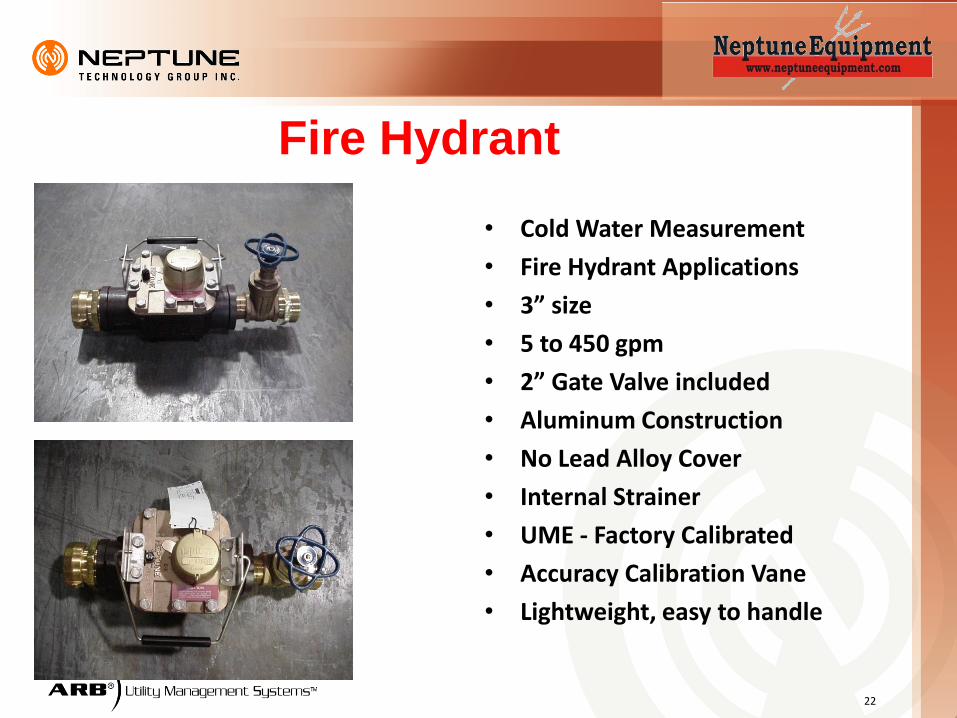
Fire Hydrant
• Cold Water Measurement
• Fire Hydrant Applications
• 3” size
• 5 to 450 gpm
• 2” Gate Valve included
• Aluminum Construction
• No Lead Alloy Cover
• Internal Strainer
• UME - Factory Calibrated
• Accuracy Calibration Vane
• Lightweight, easy to handle

23
Fire Hydrant

24
Large Meter Sizing

25
Need for Correct Sizing
Historical “Rule of Thumb”:
• Old sizing conventions - 3” meter for 3” pipe
Actual Realization:
• Flow capacity not always dictated by pipe size
• More and more customers use low flow devices - e.g. ULF Toilets = less
consumption
• Often consultants recommend larger meter due to future growth which
never occurs
• Buildings/facilities no longer used for original intentions - e.g. processing
plant used converted to office space

26
Sizing Guide Background
• Developed in the late 1980’s
• Dedicated 1 person in utility to collect data full time
• Used data logger
• Collected 5 years worth of data
• Corrected sizing in many cases - e.g. 2” PD on 6” pipe
• Findings - correct sizing contributed in 2 major ways:
• Increased annual revenue
• Decreased annual capital expenditures

27
Sizing Meters • ALWAYS based on flow requirements
• Not based on pipe size
• AWWA M22 New Edition “Sizing Water Service Lines and Meters”
• Based on peak demand
– Pressures
– Type customer
– Fixture values
– Continuous use demand
• Requirements can change over time

28
Sizing Water Service Lines and Meters (M22), Second Edition
This operations manual will guide engineers, architects, designers, and technicians in accurately sizing customer water service lines and water meters. Coverage includes estimating consumer water flows, peak water demands, demand profiling, metering equipment, and procedures for calculating service lines and meters for optimum water revenue and lowest service cost. Numerous tables and sample calculations included.

29
Large Meter Applications

30
• Processing Plants
Manufacturing Facilities
Irrigation Lines
Lawn Sprinkler Systems
Wells
Effluent Water in Treatment Plants
Booster (Pump) Stations
Large Batching Operations
Inter-system sales or transfer
Office Buildings
Public Transportation Centers
WHERE PEOPLE WORK!!
Moderate To High Continuous Flow Rates

31
• Apartment Buildings
Motels and hotels
Condominiums
Mobile Home Parks
Hospitals and Schools
Restaurants
Dormitories
Department Stores
Shopping Malls
Public Transportation Centers
WHERE PEOPLE LIVE!!
Low To High Continuous Flow Rates

32
Must be UL/FM Approved
Designated Fire Protection Lines
Any of the HP Turbine or TRU/FLO meter
applications that utilize the same service line to
provide fire protection
WHERE PEOPLE WORK AND LIVE!!
Fire Service Applications

33
Large Meter Installation
• Use of strainer strongly recommended!
• Corrects velocity profile
• Protects turbine from debris
• No strainer installed
• Risk turbine damage
• Need 6-10 (Estimated Pipe
• Diameters) E.P.D. upstream of
meter
• Test Tee at least 2 E.P.D.
downstream of meter on turbines.

34
0%
20%
40%
60%
80%
100%
Meters Income
Large
Small
Meters vs. Revenue

35
Is your utility
getting all
the revenue
it’s entitled to?

36
The Reality
REVENUE LOSS 100% -
50% -
0 -
24 months 48 months
100%
90%
80%
In most water systems, the reality is that their large meters are
operating at 80% to 90% accuracy.

37
WHY SHOULD YOU BE
CONCERNED ABOUT
WATER AND REVENUE
LOSSES?

38
METER
CHANGEOUT
Increased Operating Costs
Rising Water
Demands
Increasing
Problem Of
Unaccounted
For Water Commitment To
Increasing Meter
Reading
Efficiencies
The Market Drivers
Increased Focus On
Revenue Recovery
Declining
Government
Funds
Meter Replacement
Less Expensive
Than Repair
Decaying Facilities
(Infrastructure)

39
How Is This Revenue Lost?
• Meter Failures
• Meter Inaccuracies
• Misapplication
• Sizing
• Undetected Leaks
• Theft

40
Large Meter Revenue
• Large meters = Large
Revenue
• You can’t afford to have
them running inaccurately

41
Solution
• Inaccuracies
• Annual tests
• Proper meter for the application
• Leaks and Low Flow loss
• Profile meter flow rate
• Proper meter sizing
• Failure
• Specify strainers
• Theft and Un-metered
• Fire service meters
• Distribution meters

42
Maintenance Programs
Options
• UME Replacement Program
• Utility does all testing and repairs
• Replace entire meter
• Hire outside company

43
Easily maximizes revenue at large meter sites
• Cost Effective
• Meter repaired quickly – little down time for customer
•“New” UME’s have new moving parts
• No-Lead Alloy material
• ANSI NSF 61
• Tested to new meter standards of + / - 1.5%
• Shipped with test tag
• Install the “New” UME and keep the old or
defective UME for rebuilding.
• Available on HP Turbines, TRU/FLO Compounds,
HP Fire Service, and HP Protectus III meters
UME Replacement Program

44
Water Meters Lose Accuracy Over Time
Results:
lost revenue for the utility
OR
higher rates to recover losses

45
But, which meters are losing money?

46
“Biggest Bang for the Buck”
Focus on the Commercial
and Industrial Meters
Often, less than 5% of a
utility’s meters generate
more than 40% of the
revenue
C&I Accounts C&I % Sales
Hartford, CT 6% 54%
Springfield, MA 8% 57%

47
Innovative Way to Maximize Cash-flow
SEER Software
• Based on over 10,000 large meter tests
• Multiple linear regression
• Developed and patented by Neptune

48
SEER Inputs
Meter Data
Replacement Costs
Results

49
Inputs
Age
Size
Type
Manufacturer
Usage Volume
Maintenance History
Annual Revenue
Replacement Cost
SEER Logic
Outputs
Reg
ress
ion
Mo
del
Meter Accuracy
Revenue Gain
Payback

50
Inputs
25 yrs
4”
Compound
Hersey
Average
Average
$15,000.00 / yr
$3,435.00
SEER Logic
Outputs
Reg
ressio
n M
od
el
76.56%
$4,592.48
0.75 yrs

51
SEER Report

52
SEER Pinpoints Revenue Loss
SEER Software
Identifies which meters
need attention
Establishes priorities
based on revenue gain
and payback
Allows utilities to
implement targeted
revenue enhancement
programs

53
Large Meter Testing

54
Factors to Consider:
• AWWA recommends on-site testing of large
meters on a regular basis
• Cost to remove and transport
• Flow conditions are different
• Liability if meter is contested
• Benefit to cost ratio is easily determined
55
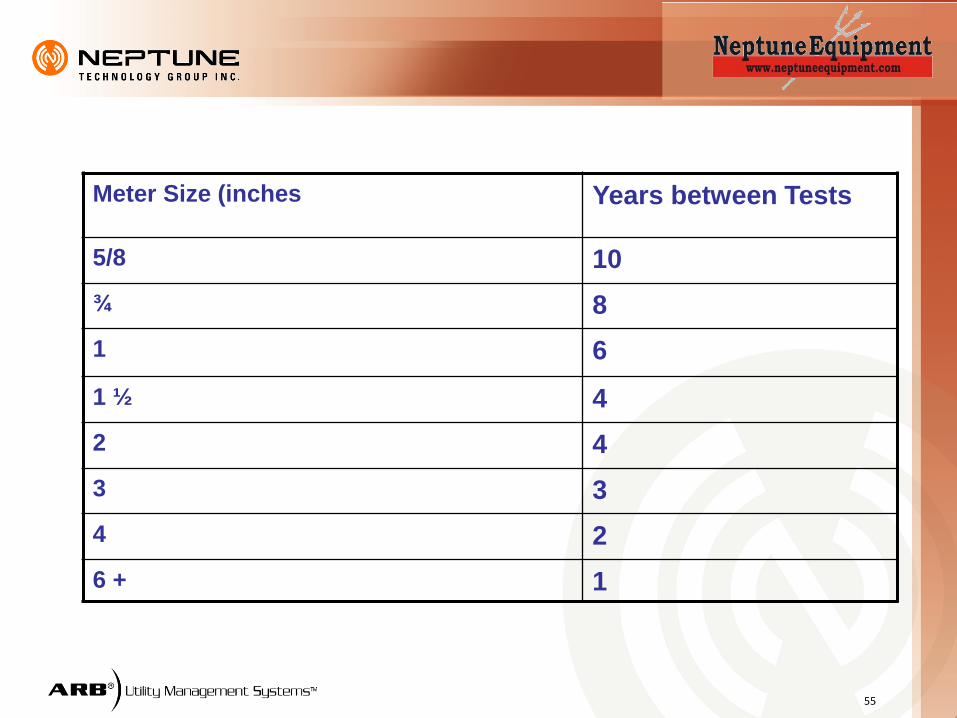
Meter Size (inches Years between Tests
5/8 10
¾ 8
1 6
1 ½ 4
2 4
3 3
4 2
6 + 1

56
Testing Methods
• Accuracy is determined using a point of reference:
• Common points of reference:
• Volumetric
• calibrated tank
• Gravimetric
• weight scale
• Master Meter(s)
•Most Common for large meters
• known good meter(s)

57
Testing Methods • Meter Testers
• Master Meter (volume to volume)
• Typical meter tester sizes 3” and 4”
• Things to Remember
• Meter testers cannot test the full range of a meter
• Provides a snap shot only
• Start at low flows, then medium, and high flow rates
• If a test fails, repeat it to verify result.
• Ensure and verify meter can be isolated
• Cavitation (maintain 20-30 psi at tester)
• Meter Tester is not 100% accurate at all flow rates.
• Calibration certificate

58
Testing Methods • Meter Characteristics - PD
• PD meters typically register 100% +/-1.5% or they fail
• Exception is if the PD meter average flow rate exceeds
• 50% of its rated flow.
• Problem: Leak – seal rings (all), valve (compound and
• FS compound)
• Premature wear
• Meter Characteristics – Turbine
• Turbines wear on low flow – noticeable through
• crossover
• Turbines accuracy improve with increase in flow rate

59
Testing - Error and Uncertainty
• Any accuracy test is subject to error.
• The goal is to minimize the error and estimate its value.
•Error: the difference between the true value and the measured value.
• Uncertainty is an estimate of the error value.
• Eg: Accuracy = 100.5% +/- 0.25% (95% confidence)
• Sources of Error on test:
• Reading resolution of meter
• Reading resolution of tank/test unit
• Human error
• Poor flow profile 2
4
2
3
2
2
2
1EEEEERRORTOTAL

60
Portable Field Testing Equipment
• Conduct Field testing with Test meter in location where it is being used
• Accuracy Testing - Site meter with a known test meter
• Water runs through the site meter and then through the test meter

61
Meter Site Survey
• Document Site Survey information along with Meter Test data
• Establish a meter history book to provide more accurate information on most valuable meters
• Analysis if the existing meter Flow characteristics matches to Commercial Business User characteristics

62
Maintenance/Testing
• Testing should be based more on meters consumption history
• Perform at least 3 flows per meter. Start at the low flow
• A minimum of one sweep hand • A poor test result should be repeatable • In field calibration can be performed on some meters +/- 3% to 5% • Spare Measuring Elements will allow for
minimal customer disruption. • Verify isolation valve closure • Use calibration certificate of tester • Clean Strainer
63
Thank you


![[Www.manuallib.com]_IDEAL 61-760 Series Commercial-Industrial TightSight&Reg; Clamp Meters Instructions](https://img.dokumen.tips/doc/110x75/55cf98c7550346d033999cd1/wwwmanuallibcomideal-61-760-series-commercial-industrial-tightsight.jpg)