Embed Size (px)
Citation preview

COMMERCE SPECTRUM MANAGEMENT ADVISORY COMMITTEE (CSMAC)
Working Group 4: 1755-1850 MHz Point-to-Point Microwave
Tactical Radio Relay (TRR) Joint Tactical Radio System / Software Defined Radio (JTRS/SDR)
FINAL REPORT July 24, 2013
CSMAC WG-4 Final Report 2 July24, 2013
Table of Contents
Executive Summary .......................................................................................... 3
1 Introduction ................................................................................................ 5
2 Background ................................................................................................. 7
3 Scope of Work, Analysis and Results ...................................................... 10
4 Recommendations ..................................................................................... 11
List of Appendices .......................................................................................... 19
Appendix 1: Working Group 4 Participants .............................................. 20
Appendix 2: Description of Federal Systems ............................................. 24
Appendix 3: Commercial Systems .............................................................. 55
Appendix 4: Sharing Analyses and Results ................................................ 69

CSMAC WG-4 Final Report 3 July24, 2013
Executive Summary
This report has been produced as part of the Commerce Spectrum Management Advisory Committee’s (CSMAC) ongoing analysis of ways to facilitate the implementation of commercial wireless broadband in the 1755-1850 MHz band. The systems that Working Group (WG) 4 was responsible for assessing were Fixed Point-to-Point, Microwave, Tactical Radio Relay (TRR), and ground-based Joint Tactical Radio Systems (JTRS).
The WG decided quickly that the recommendation for Fixed Microwave would be relocation per the conditions outlined in the National Telecommunications and Information Administration (NTIA) 1755-1850 MHz Assessment Report. This decision was prompted by the outcomes of the 1755-1850 MHz evaluation that fixed microwave systems are considered to be relatively easy to relocate due to the ready availability of commercial technology to re-establish these systems in other frequency bands and the low estimated cost associated with relocating these systems, assuming favorable site conditions.
With regard to TRR and JTRS, the WG conducted initial analysis using agreed methodology and approaches for four representative sites each based on analysis of interference into both Department of Defense (DoD) systems and commercial systems. The results of the sharing analyses conducted thus far indicated that separation distances on the order of hundreds of kilometers would be necessary to ensure that federal and commercial Long Term Evolution (LTE) systems would not cause harmful interference to each another. Based upon the results of these analyses, the WG makes the following recommendations:
• Relocate Fixed Point-to-Point Microwave Systems.
• Vacate TRR systems from the 1755-1780 MHz band into the 1780-1850 MHz band and into alternate spectrum.
• Transition Plans for TRR systems should be developed with consideration of the list of Economic Areas (EAs) ordered according to industry geographic implementation priorities, noting the exact order in which DoD would be able to relocate or compress would be based on operational requirements that may vary from the order of commercial priorities.
• Study Protection Zone analysis methodologies for TRR and JTRS with a goal of improving the assumptions and approach used in the analysis.
• Apply any changes in the analysis methodology to all locations identified as requiring Protection Zones for TRR and JTRS.
• Impacted federal agencies will develop Transition Plans for their respective TRR systems that address relocation of assignments, compression above 1780 MHz and comparable spectrum.
• Develop a sharing approach to permit commercial wireless broadband deployment in Protection Zones for both TRR and JTRS.
• Allow TRR systems to remain in the 1755-1850 MHz band in regions where there is little or no commercial deployment.

CSMAC WG-4 Final Report 4 July24, 2013
• Develop a sharing approach to permit the deployment of TRR systems in the 1755-1850 MHz band in regions where there is no current or forecasted commercial deployment.
• Develop a sharing approach to address point or local area TRR assignments that are replacements for statewide assignments. A sharing approach is only necessary if relocation compression is not feasible.
• Develop a method, including a testing program, to demonstrate the viability and effectiveness of interference protection/mitigation methods proposed by licensees before commencing deployments of base stations in any Protection Zones. This effort should include industry, impacted federal agencies and regulators.
The WG notes that while there was general agreement on most recommendations, there were two areas where DoD and Industry did not fully agree. With respect to the fourth bullet above (Study Protection Zone analysis methodologies for TRR and JTRS with a goal of improving the assumptions and approach used in the analysis), there is disagreement on the study of interference protection criteria (IPC). Industry believes that the study of interference criteria would be beneficial, while DoD believes that the current interference criteria are appropriate for all the systems that are operating in the band. With respect to the seventh bullet above (Develop a sharing approach to permit commercial wireless broadband deployment in Protection Zones for both TRR and JTRS), there is disagreement regarding commercial licensee operations within Protection Zones, specifically regarding interference into commercial licensees. DoD requires commercial licensees to demonstrate technology or techniques that ensure LTE operations/networks can accept interference from operations within the Protection Zones, all prior to deployment of base stations. However, industry insists that long-standing practices for agreeing to accept interference in such situations is sufficient. The WG also notes that several of the above recommendations suggest additional work and study.
CSMAC WG-4 Final Report 5 July24, 2013
1 Introduction On March 27, 2012, NTIA released a report, developed in collaboration with those incumbent federal agencies, on the viability of accommodating commercial wireless broadband in the 1755-1850 MHz band.1 The report concluded that the entire 95 MHz of this band could be repurposed for wireless broadband; however, in light of several critical challenges related to the estimated timelines, costs, and complexities of completely clearing all of the federal users currently in the band, methods employed in the past for freeing up federal spectrum for commercial wireless by relocating federal users to other bands is, in this case, problematic. As a consequence, NTIA proposed a new path forward that relies on a combination of relocating federal users and sharing spectrum between federal agencies and commercial users while ensuring no loss to federal critical capabilities.
It was in this spirit that in May 2012, the NTIA formed five working groups (WGs) under the CSMAC as a means for federal agency representatives to interface with industry experts to address the aforementioned challenges and to develop clear relocation, transition, and sharing plans for the 1695-1710 MHz band and the 1755-1850 MHz band. The working groups, each tasked with addressing a specific set of federal operations within these two bands, are as follows:
• Working Group 1 – 1695-1710 MHz Meteorological-Satellite2; • Working Group 2 – 1755-1850 MHz Law Enforcement Video, Explosive Ordnance
Disposal, and other short distance links; • Working Group 3 – 1755-1850 MHz Satellite Control and Electronic Warfare; • Working Group 4 – 1755-1850 MHz Tactical Radio Relay, Fixed Microwave, and
ground-based software defined radios; and • Working Group 5 – 1755-1850 MHz Airborne Operations (Air Combat Training
Systems, Unmanned Aerial Vehicles, Precision Guided Munitions, airborne software defined radios, and Aeronautical Telemetry)
NTIA provided a set of instructions to the WGs for working within CSMAC including:3
• The WGs should first emphasize approaches to sharing, whether as a permanent solution (Do the agencies actually have to move?) or as the means to facilitate access during relocation transition.
• Noting both the 1755-1850 MHz report findings and the industry priority to get access to the 1755-1780 MHz band, approaches should be considered that make that lower band available first, but approaches that consider providing 1755-1780 MHz access without also dealing with the rest of band up to 1850 MHz will not meet agency concerns.
1 NTIA, “An Assessment of the Viability of Accommodating Wireless Broadband in the 1755 – 1850 MHz Band”, March 2012 (NTIA Report) 2 Due to the fact that WG had a deadline much sooner than the other groups, it also developed an agreed set of technical parameters for the commercial LTE systems, that was subsequently used by all work groups. 3 NTIA “Instructions to the CSMAC Working Groups”, June 28, 2012
CSMAC WG-4 Final Report 6 July24, 2013
• The WGs should explore, where appropriate, whether commercial network solutions can support agency needs via a shared technology approach.
• WGs should seek to determine, via analysis or testing as appropriate: o what the potential real impact is from or to the government operations, o whether that impact is acceptable, and o what restrictions have to be placed on the commercial operations.
• Where the commercial providers determine that the potential impact is acceptable, based on current federal operational parameters, the WG should develop a regulatory concept that ensures that operators do not raise future issues regarding such interference.
• If, in any case, the WGs conclude that sharing is not possible, then they need to discuss transition approaches and critical information to support transition. Furthermore, NTIA will need to begin efforts to conclude on alternative spectrum. This may require additional FCC rulemakings which may further delay entry into the band. Therefore, WGs should explore all possible sharing solutions before reporting that sharing is not possible.
On March 20, 2013, the FCC notified the NTIA that it planned to commence the auction of licenses in the 1695-1710 MHz band and the 1755-1780 MHz band as early as September 2014.4 The noticed recognized that:
“CSMAC's recommendations, if adopted by NTIA, will inform service rules for both the 1695-1710 MHz and 1755-1780 MHz bands, including terms of sharing and required protections. Accordingly, we expect that an auction of these bands would follow successful completion of the CSMAC process the acceptance of the recommendations by NTIA, completion of the CSEA technical review process, and completion of the Commission's rulemaking process with respect to these bands.”
In response to this letter, the NTIA informed the FCC that:
“…while we recognize that pairing and auctioning the 25 megahertz of spectrum in the 2155-2180 MHz band with the same amount in the 1755-1780 MHz band will be a primary option for the FCC and the commercial mobile wireless industry, we appreciate your recognition of the potential need to address rules to accommodate the phased reallocation of the entire 95 MHz of the 1755-1850 MHz band. Most federal functions in the band require and operate throughout the entire 1755-1850 MHz band to meet their missions.5 Given the focus on the lower 25 megahertz, whether as part of a relocation or a sharing arrangement, the FCC will need to consider the potential for a phased transition to facilitate commercial access to the 1755-1780 MHz band in a shorter timeframe while preserving longer-term repurposing and transition opportunities for the entire 1755-1850
4 See FCC letter to The Honorable Lawrence E. Strickling, March 20, 2013, DOC-319708A1.pdf 5 See Letter from Assistant Secretary Strickling to FCC Chairman Genachowski on the planned auction of licenses in the 1695-1710 MHz Band and the 1755-1780 MHz Band; April 19th; http://www.ntia.doc.gov/files/ntia/publications/ntia_letter_to_fcc_chair_re_1695_and_1755_auction_20130419.pdf

CSMAC WG-4 Final Report 7 July24, 2013
MHz band. If an FCC auction of the 1755-1780 MHz band results in the relocation of or sharing with federal systems that currently have access to the entire 1755-1850 MHz band, agency Transition Plans for the lower 25 megahertz will need to account for those systems, even if the FCC holds multiple auctions over time.”
Accordingly the main focus of WG-4 has been on investigating sharing, with a view to early access of the 1755-1780 MHz band, but always in the context of a solution for the entire 1755-1850 MHz band.
This report presents the results of WG-4’s investigation of the prospects for sharing between incumbent Tactical Radio Relay and ground-based software defined radio operations (JTRS) with broadband wireless entities in the 1755-1850 MHz band.
2 Background The systems identified in the NTIA Report for review and analysis by the WG included: Fixed Point-to-Point Microwave, Military Tactical Radio Relay (TRR) and Software Defined Radio (SDR) / Joint Tactical Radio Systems (JTRS). These systems are described briefly below and in more detail in Appendix 2.
2.1 Fixed Point-to-Point Microwave Fixed point-to-point microwave systems are used for the transmission of voice, data, and/or video in support of law enforcement, military command and control, emergency preparedness and response, the national air space system, energy grid control, and resource management activities. These systems also support the distribution of meteorological data to a variety of users including the public. These microwave systems provide service where commercial options are either unavailable, too expensive, or do not provide the level of reliability required by federal users.
2.2 Military Tactical Radio Relay (TRR) The DoD operates tactical communications systems that provide mid- to high-capacity digital information to battlefield commanders. The locations of all TRR operations are provided in Appendix 2, Table 6. There are several types of systems that include Army High-Capacity Line-of-Sight (HCLOS) systems and multiple types within the Navy and Marine Corps Digital Wideband Transmission System (DWTS). These are outlined below and described in more detail in Appendix 2.
2.2.1 Army High-Capacity Line-of-Sight (HCLOS) Army TRR systems provide wide area communications for Army tactical deployments at the battalion, brigade, and division levels. These systems, typically deployed up to 30-50 kilometers apart, provide high-throughput data communications from command and control traffic to intelligence imagery, logistics, medical, and morale and welfare support. The HCLOS system currently tunes to the 225-400 MHz and 1350-2690 MHz bands and provides a digital microwave backbone to link battlefield commanders. These systems operate like high-capacity cellular telephone systems with highly transportable base stations. The ability to set up, to establish a link to higher headquarters and subordinate

CSMAC WG-4 Final Report 8 July24, 2013
units, and then to take the link down and to move it is key to the survivability of the headquarters units and supports the concept of maneuver warfare. Frequent field training is required to ensure that soldiers can quickly establish a network of tactical microwave links. The AN/GRC-245 is the Army’s primary TRR system that will replace its legacy TRR systems (AN/GRC-226 and AN/VRC-99B).
2.2.2 Navy and Marine Corps Digital Wideband Transmission System (DWTS) The DWTS provides a backbone digital communications capability supporting amphibious and ground combat operations. The DWTS supports command, control, and data transfer from the Marine Expeditionary Force and supports training and operations at a number of locations throughout the United States. The Marine Corps version of this system provides digital backbone services (voice, video, and data) for shore-to-shore and/or ship-to-shore communications links. This radio system is the only transmission media available to the Marine Corps with sufficient bandwidth to carry large quantities of critical data, such as maps, overlays, intelligence pictures, and other data to battlefield commanders. The Marine Corps currently employs three variants of the DWTS. The Navy shipboard DWTS system tuning range is limited to 1350-1850 MHz. Two variants are limited to the tuning range between 1350 and 1850 MHz. The third tunes between 1350-2690 MHz, but is not compatible with the other two variants. The Navy has a ship-to-shore version of DWTS.
2.2.3 Relocation of TRR systems and updated information While the relocation details of the TRR systems were provided in the March NTIA report6, DoD provided the following updates on May 21, 20137, based on further operational impact assessment conducted concurrent with the WG4 analysis effort, which determine:
• The following highest priority training DoD installations/locations would require Protection Zones indefinitely:
Continuing Army TRR Locations Continuing USN/USMC TRR Locations Fort Irwin, CA Bogue Field, NC Fort Polk, LA Panama City, FL Fort Bliss; TX and WSMR MCAS Yuma, AZ Fort Hood, TX Twenty-Nine Palms, CA Fort Bragg, NC (Includes Camp MacKall) MCB Camp Pendleton, CA Yuma Proving Ground , AZ MCB Hawaii (Kaneohe Bay), HI Apra Harbor, Guam
• The remaining TRR locations would either compress into 1780-1850 MHz if
feasible to fit TRR assignments in the 1755-1780 MHz band into the upper 70
6 NTIA Report at Table 4-3, p 28. 7 This information was provided as edits to this WG-4 report.
CSMAC WG-4 Final Report 9 July24, 2013
MHz8 or relocate out of the 1755-1850 MHz band to identified comparable spectrum (consistent with the NTIA Report).
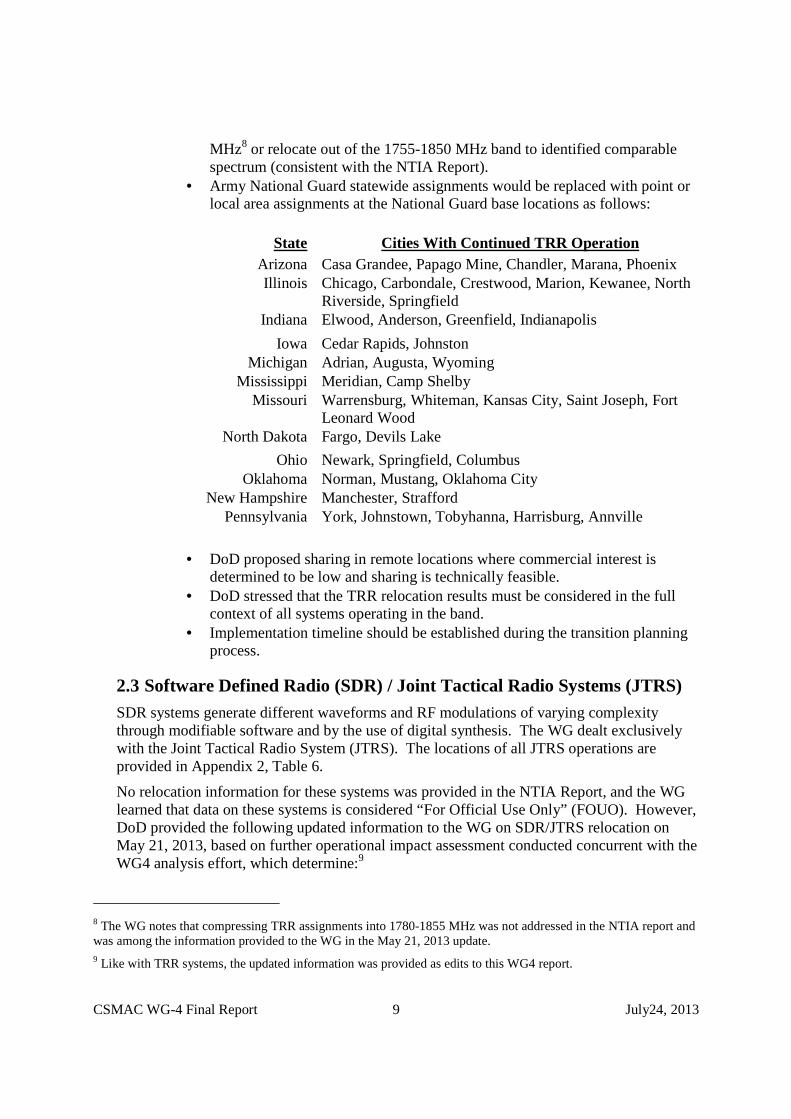
• Army National Guard statewide assignments would be replaced with point or local area assignments at the National Guard base locations as follows:
State Cities With Continued TRR Operation
Arizona Casa Grandee, Papago Mine, Chandler, Marana, Phoenix Illinois Chicago, Carbondale, Crestwood, Marion, Kewanee, North
Riverside, Springfield Indiana Elwood, Anderson, Greenfield, Indianapolis
Iowa Cedar Rapids, Johnston Michigan Adrian, Augusta, Wyoming
Mississippi Meridian, Camp Shelby Missouri Warrensburg, Whiteman, Kansas City, Saint Joseph, Fort
Leonard Wood North Dakota Fargo, Devils Lake
Ohio Newark, Springfield, Columbus Oklahoma Norman, Mustang, Oklahoma City
New Hampshire Manchester, Strafford Pennsylvania York, Johnstown, Tobyhanna, Harrisburg, Annville
• DoD proposed sharing in remote locations where commercial interest is
determined to be low and sharing is technically feasible. • DoD stressed that the TRR relocation results must be considered in the full
context of all systems operating in the band. • Implementation timeline should be established during the transition planning
process.
2.3 Software Defined Radio (SDR) / Joint Tactical Radio Systems (JTRS) SDR systems generate different waveforms and RF modulations of varying complexity through modifiable software and by the use of digital synthesis. The WG dealt exclusively with the Joint Tactical Radio System (JTRS). The locations of all JTRS operations are provided in Appendix 2, Table 6.
No relocation information for these systems was provided in the NTIA Report, and the WG learned that data on these systems is considered “For Official Use Only” (FOUO). However, DoD provided the following updated information to the WG on SDR/JTRS relocation on May 21, 2013, based on further operational impact assessment conducted concurrent with the WG4 analysis effort, which determine:9
8 The WG notes that compressing TRR assignments into 1780-1855 MHz was not addressed in the NTIA report and was among the information provided to the WG in the May 21, 2013 update. 9 Like with TRR systems, the updated information was provided as edits to this WG4 report.

CSMAC WG-4 Final Report 10 July24, 2013
• The following highest priority training DoD installations/locations would require
Protection Zones indefinitely to minimize impacts to operational training requirements:
Continuing JTRS Locations Fort Irwin, CA Fort Polk, LA (JRTC) Fort Bliss; TX and WSMR Fort Hood, TX Fort Bragg, NC (Includes Camp MacKall) Yuma Proving Ground , AZ
• The remaining JTRS locations can compress above 1780 MHz without requiring
new spectrum assignments to replace the ones in the 1755-1780 MHz band. • DoD proposed sharing the entire 1755-1850 MHz band in remote locations where
commercial interest is determined to be low and sharing is technically feasible. • DoD stressed that the JTRS results must be considered in the full context of all
systems operating in the band. • DoD suggested that an implementation timeline should be established during the
transition planning process.
2.4 Commercial Systems Commercial LTE systems were described in detail by a subcommittee of WG-1 and are presented in Appendix 3 of this report.10 This description was used by all Working Groups in their analyses.
3 Scope of Work, Analysis and Results The key elements of WG-4’s work plan include determining system descriptions and characteristics, performing technical analysis, and determining sharing methodologies and recommendations.
3.1 System descriptions and characteristics. DoD provided information that was publicly releasable. This information is shown in Appendix 2. Briefing slides and word documents were used to depict:
(1) Summary of system descriptions including name and nomenclature as well as high-level information on functionality.
(2) Architecture diagrams were presented illustrating TRR notional deployment.
(3) System characteristics for TRR were organized into the tabular format.
10 See “Commerce Spectrum Management Advisory Committee Final Report Working Group 1 – 1695-1710 MHz Meteorological-Satellite”, January 22, 2013.
CSMAC WG-4 Final Report 11 July24, 2013
(4) Quantity of TRR frequency assignments in the 1755-1850 MHz range for each location.
3.2 Technical analysis The analysis methodology and associated assumptions were agreed upon by the WG. Since the list of locations was lengthy, it was realized that there was insufficient time and resources to analyze every installation. The WG decided to study three Army locations and one Navy/Marine Corps location based on proximity to major market areas. The LTE characteristics were derived from the parameters used by CSMAC WG-1. The analysis results were presented to WG-4 in presentation format which contained tables and protection zone diagrams. These are provided in Appendix 4.
3.3 Sharing methodologies Experience gained from AWS-1 coordination was used as a starting point for discussion. The membership provided other input related to their experiences establishing coordination processes. Disaster relief scenarios were addressed and resolved through input from frequency assignment experts at NTIA.
3.4 Functioning of WG-4 The work methods of the WG focused on mostly on telephone conferences and online correspondence. The WG generally held meetings on a bi-weekly basis. The majority of the meetings were conducted via conference call. However, there were four face-to-face meetings to accelerate the maturation of information presented at CSMAC meetings and to move the writing of the final output report forward. In order to streamline completion of the WG report, an editorial sub-committee was established and meet bi-weekly via conference call on weeks when the full WG did not meet. The list of WG-4 participants is provided in Appendix 1, Table 1.
4 Recommendations The recommendations of the Working Group focus on future work that would lead to development of viable sharing scenarios. Alternative analysis approaches were explored that could potentially result in a reduction in the size of protection zones which were generated under WG 4 purview.
Based upon the work performed by the WG, we make the following recommendations:
4.1 Fixed Point-to-Point Microwave The NTIA Report determined that fixed microwave systems are considered to be relatively easy to relocate due to the availability of commercially available technology to re-establish these systems in other frequency bands and the low estimated cost associated with relocating these systems, assuming favorable site conditions.11 In addition, there is considerable
11 See NTIA Report, p. vii.

CSMAC WG-4 Final Report 12 July24, 2013
experience with long-term and transitional sharing with microwave systems in the 1710-1755 MHz band and AWS-1 commercial systems.
4.1.1 Relocate Fixed Point-to-Point Microwave Systems.
The Working Group recommends that Fixed Point-to-Point Microwave Systems be relocated. In addition, the WG recommends that NTIA provide guidance to the federal agencies to incorporate consideration of commercial industry market area priorities in the development of their required Transition Plans and in the establishment of a relocation schedule for fixed point-to-point systems. The NTIA guidance should request that agencies concentrate on the 1755-1780 MHz band initially, and also consider the list of Economic Areas (EAs) ordered according to industry's geographic implementation priorities, noting that the exact order in which agencies will be able to relocate will be based on their operational requirements and may vary from the commercial deployment priority. 12
The WG also recommends that the NTIA, in consultation with FCC and impacted federal agencies, establish transitional sharing methodologies similar to the AWS-1 band (1710-1755 MHz) entry coordination process to allow access to the band in areas where microwave systems are not able to be relocated before commercial access is required. The WG recommends using TSB-10F interference analysis methodologies and objectives13 and coordination procedures developed for AWS-1.14 The WG suggests that this process must address the sharing of data on fixed microwave systems (e.g., assignments, operational characteristics, technical parameters, etc.) with commercial operators or their designees. The WG notes that this issue applies across all WGs.
4.2 Tactical Radio Relay Systems The WG makes the following recommendations for TRR systems:
4.2.1 Relocate or compress TRR systems as indicated in NTIA Report.
The WG recommends that DoD vacate its TRR systems from the 1755-1780 MHz band into the 1780-1850 MHz band and to alternate spectrum as described above in Section 3 and in the NTIA Report.15
The WG notes that there are a total of 13 high-priority training areas where relocation is not feasible (See Section 2.2. above). This will require the establishment of Protection Zones for the entire 1755-1850 MHz band at these locations to minimize impacts to operational training requirements. See Recommendation 4.2.2 below.
12 See WG 2 Final Report, Table A (reproduced herein as Table 5) 13 TIA/EIA Telecommunications Systems Bulletin, “Interference Criteria for Microwave Systems”,TSB-10F, June 1994. 14 See, 47CFR § 27.1134 Protection of Federal Government operations and FCC 06-50, April 20, 2006. 15 NTIA Report at . 26 – 28.

CSMAC WG-4 Final Report 13 July24, 2013
4.2.2 Establish a relocation schedule in the transition planning process in concert with the carrier community.
For those TRR systems that can relocate, the WG recommends that NTIA provide guidance to the federal agencies to incorporate consideration of commercial industry market area priorities in the development of their required Transition Plans and in the establishment of a relocation schedule for these TRR systems. The NTIA guidance should request that agencies concentrate on the 1755-1780 MHz band initially, and also consider the list of EAs ordered according to industry's geographic implementation priorities, noting that the exact order in which agencies will be able to relocate will be based on their operational requirements and may vary from the commercial deployment priority.
4.2.3 Proposed Study Topics to potentially improving the current analysis
The WG identified proposed study items with a goal to improve the analysis that was conducted based on the WG-4 agreed assumptions These include the impact of clutter, the use of antenna effects (i.e., off-axis and polarization discrimination, the effects of operational tempo, and interference protection criteria.
Regarding interference protection criteria (IPC), the WG notes that current WG-4 analyses use long-standing interference criteria established by the ITU. The wireless industry believes that the study of interference relative to a desired carrier taking into account actual system operations would be beneficial to understand how government and LTE systems would interact in a shared environment with close coordination between users, and believe that could significantly reduce required separation distances. DoD believes that the current interference criteria are appropriate for all the systems that are operating in the band. Further, DoD believes that any consideration of changes in IPC on a system-by-system basis is risky and inappropriate. This is because IPCs are developed over a long period of time to ensure that protection criteria are based on underlying physical phenomena rather than on short-term technological specifications of individual systems. As a result, these long standing IPCs successfully form the basis for many national and international spectrum use agreements, including allocation and reallocation decisions, despite the often rapid evolution and improvement of new and incumbent systems.
4.2.4 Any changes in analysis methodology should be applied to all Protection Zone analyses.
The WG recommends Protection Zone analyses should be performed, taking into account any agreed upon approach and assumption changes (as mentioned above), for all locations that cannot relocate or compress.
Protection Zone analyses will first be performed starting at the 13 areas where relocation is not feasible. The remaining Protection Zone analyses should be prioritized considering the list of EAs ordered according to industry's geographic implementation priorities, noting that the exact order in which agencies will be able to relocate will be based on their operational requirements and may vary from the commercial deployment priority.
CSMAC WG-4 Final Report 14 July24, 2013
4.2.5 Develop Transition Plans that address relocation of assignments, compression into 1780-1850 MHz, and comparable spectrum
The WG recommends that DoD and NTIA consider relocation and compression time frames in addition to comparable spectrum for relocation as they develop Transition Plans.
4.2.6 Develop a sharing approach to permit deployment in Protection Zones
The WG recommends that NTIA, in consultation with impacted federal agencies, work with all stakeholders to develop an approach that allows access to the 1755-1780 MHz band in areas where TRR systems will remain indefinitely or where they cannot relocate or compress before commercial access is required within a given Protection Zone. This will require the development of interference analysis methodologies and objectives sufficient to perform interference analyses between specific carrier sites and TRR systems. The WG suggests that TSB-10F mentioned above for fixed microwave systems represents a good framework for this effort.
The WG also recommends that NTIA and FCC, in coordination with the affected federal agencies and commercial wireless carriers, develop coordination procedures similar to AWS-1. These procedures should accommodate the following:
• Sharing data on TRR systems (e.g., assignments, operational characteristics, technical parameters, etc.) with commercial operators or their designees, to the extent information protection mandates are adhered to. The WG notes that this issue applies across all WGs.
• Commercial licensees must be required to coordinate any operations that could permit mobile, fixed, and portable stations to operate in the specified Protection Zones.
• Commercial licensee operations within Protection Zones will be permitted following a successful coordination process concluding that such commercial operations will not cause any loss of capability due to harmful interfere at the federal site plus certain other conditions. DoD believes that sharing between ubiquitously deployed licensed cellular mobile broadband systems and federal operations at the same location is unprecedented. In that regard, DoD requires commercial licensees to demonstrate technology or techniques that ensure LTE operations/networks can accept interference from TRR operations within the Protection Zones, all prior to deployment of base stations. However, commercial licensees note that the ability of licensees to have flexibility in deploying their networks, including what levels of interference they can accept, is fundamental to efficient spectrum management. Accordingly they insist that long-standing practices for agreeing to accept interference in such situations is sufficient, and that the requested demonstration of technology or techniques is unprecedented, untenable and would represent a new, undefined burden on operators.
• Protection of TRR facilities must continue until such time as these systems are relocated to other spectrum or compressed into 1780-1850 MHz.
• A process must be established to ensure that in the event of interference that can be sourced to commercial wireless operations, wireless operators modify

CSMAC WG-4 Final Report 15 July24, 2013
operations in the band to mitigate interference until sources are identified and resolved. Commercial operators will need to provide and maintain 24/7 point of contact should interference occur. Federal incumbents will also need to provide a list of authorized personnel who can provide bona fide requests for the modification of commercial operations in identified protection zones.
4.2.7 Develop a testing program to demonstrate the viability and effectiveness of interference protection/mitigation methods before commercial licensees commence deployments in Protection Zones.
The WG suggests that it is important to verify the methodologies and objectives mentioned above through a mutually-agreed testing program involving all stakeholders. The testing program must:
• Validate co-channel and adjacent channel sharing assumptions model and interference mitigation methods prior to the adoption of technical rules.
• Validate the effectiveness of proposed interference mitigation methods upon completion of the auction and prior to coordinated operation within Protection Zones.
• Establish mutual agreement and successful demonstration of proposed validation and verification methods.
• Clearly assign responsibility for verification test plans and schedules. • Be adaptable for future or potentially changing TRR and commercial
configurations.
4.2.8 Allow TRR systems to remain in the 1755-1850 MHz band in regions where there is little or no commercial interest.
The WG recommends that in areas where it is determined that there is little or no commercial interest for network deployment, TRR systems may be allowed to remain in the band. However, the WG suggests that further study is required to define and agree upon what is meant by “little or no commercial interest”, as well as rules of engagement that would govern such possible arrangements.
4.2.9 Develop a process to address point or local area assignments
The WG did not consider statewide and local area assignments that remain for National Guard operations that cannot relocate. The WG recommends that additional study may be required to address issues such as LTE deployment specifics, outstanding sharing methods identified in this report (particularly as they are related to these types of operations) and coordination.
4.3 Joint Tactical Radio Systems
The WG makes the following recommendations for JTRS:
4.3.1 Proposed Study Topics to potentially improve the current analyses
The WG identified proposed study items with a goal to improve the analysis that was conducted based on the WG-4 agreed assumptions These include the impact of clutter, the use of antenna effects (i.e., off-axis and polarization discrimination, the effects of operational tempo, and interference protection criteria.
CSMAC WG-4 Final Report 16 July24, 2013
Regarding interference protection criteria (IPC), the WG notes that current WG-4 analyses use long-standing interference criteria established by the ITU. The wireless industry believes that the study of interference relative to a desired carrier taking into account actual system operations would be beneficial to understand how government and LTE systems would interact in a shared environment with close coordination between users, and believe that could significantly reduce required separation distances. DoD believes that the current interference criteria are appropriate for all the systems that are operating in the band. Further, DoD believes that any consideration of changes in IPC on a system-by-system basis is risky and inappropriate. This is because IPCs are developed over a long period of time to ensure that protection criteria are based on underlying physical phenomena rather than on short-term technological specifications of individual systems. As a result, these long standing IPCs successfully form the basis for many national and international spectrum use agreements, including allocation and reallocation decisions, despite the often rapid evolution and improvement of new and incumbent systems.
4.3.2 Any changes in analysis methodology should be applied to all Protection Zone analyses.
The WG recommends Protection Zones should be established at six JTRS locations, taking into account any agreed upon approach and assumption changes, for the highest priority DoD training installations/locations identified in Section 2.3 to minimize impacts to operational training requirements.
4.3.3 For remaining locations, compress systems into 1780-1850 MHz.
The WG recommends that for the remaining locations, JTRS compress above 1780 MHz. Time frames to compress should be established based on the timelines in federal agencies’ Transition Plans, taking into account commercial deployment time frames where feasible. Actual system tuning into 1780-1850 MHz could also be occasioned upon request from a commercial licensee to access area within Protection Zone. The WG recommends that a process can be established similar to the one described above for TRR.
4.3.4 Develop a transitional sharing approach to permit deployment in Protection Zones at six high-priority training locations.
The WG recommends that NTIA, in consultation with impacted federal agencies, develop an approach to allow access to the 1755-1780 MHz band in areas where JTRS cannot compress before commercial access is required within a given Protection Zone. This will require the development of interference analysis methodologies and objectives sufficient to perform interference analyses between specific carrier sites and TRR systems. The WG suggests that TSB-10F mentioned above for fixed microwave systems represents a good framework for this effort.
The WG also recommends that NTIA and FCC, in coordination with the affected federal agencies and commercial wireless carriers, develop coordination procedures similar to AWS-1. These procedures should accommodate the following:
• Sharing data on JTRS systems (e.g., assignments, operational characteristics, technical parameters, etc.) with commercial operators or their designees, to the

CSMAC WG-4 Final Report 17 July24, 2013
extent information protection mandates are adhered to. The WG notes that this issue applies across all WGs and may be accomplished through the Trusted Agent.16
• Commercial licensees must be required to coordinate any operations that could permit mobile, fixed, and portable stations to operate in the specified Protection Zones.
• Commercial licensee operations within Protection Zones will be permitted following a successful coordination process concluding that such commercial operations will not cause any loss of capability due to harmful interfere at the federal site plus certain other conditions. DoD believes that sharing between ubiquitously deployed licensed cellular mobile broadband systems and federal operations at the same location is unprecedented. In that regard, DoD requires commercial licensees to demonstrate technology or techniques that ensure LTE operations/networks can accept interference from JTRS operations within the Protection Zones, all prior to deployment of base stations. However, commercial licensees note that the ability of licensees to have flexibility in deploying their networks, including what levels of interference they can accept, is fundamental to efficient spectrum management. Accordingly they insist that long-standing practices for agreeing to accept interference in such situations is sufficient, and that the requested demonstration of technology or techniques is unprecedented, untenable and would represent a new, undefined burden on operators.
• Protection of JTRS facilities must continue until such time as these systems are relocated to other spectrum or compressed into 1780-1850 MHz.
• A process must be established to ensure that in the event of interference that can be sourced to commercial wireless operations, wireless operators modify operations in the band to mitigate interference until sources are identified and resolved. Commercial operators will need to provide and maintain 24/7 point of contact should interference occur. Federal incumbents will also need to provide a list of authorized personnel who can provide bona fide requests for the modification of commercial operations in identified protection zones.
4.3.5 Develop a testing program to demonstrate the viability and effectiveness of interference protection/mitigation methods before commercial licensees commence deployments in Protection Zones.
The WG suggests that it is important to verify the methodologies and objectives mentioned above through a mutually-agreed testing program involving all stakeholders. The testing program must:
• Validate co-channel and adjacent channel sharing assumptions model and interference mitigation methods prior to the adoption of technical rules.
16 The WG notes that the Trusted Agent concept is still under discussion and development among stakeholders.
CSMAC WG-4 Final Report 18 July24, 2013
• Validate the effectiveness of proposed interference mitigation methods upon completion of the auction and prior to coordinated operation within Protection Zones.
• Establish mutual agreement and successful demonstration of proposed validation and verification methods.
• Clearly assign responsibility for verification test plans and schedules. • Be adaptable for future or potentially changing JTRS and commercial
configurations.
CSMAC WG-4 Final Report 19 July24, 2013
Appendices
Appendix 1: Working Group 4 Participants
Appendix 2: Description of Federal Systems
Appendix 3: Commercial Systems
Appendix 4: Sharing Analyses and Results
CSMAC WG-4 Final Report 20 July24, 2013
Appendix 1: Working Group 4 Participants Below is a list of participants in the WG. The leadership team included:
Dave Pierce ASMO Co-Chair Mike Chartier Intel Co-Chair Mark Gibson Comsearch CSMAC Liaison Gary Patrick NTIA NTIA Representative Steve Buenzow FCC FCC Representative
Note: the Editorial Sub-Committee consisted of the above leadership team plus those members listed below denoted by an *.
Table 1: List of WG-4 Participants
First Name Last Name Representing
Colin Alberts Federal (DoD)
Tom Banger Federal (PMW/A 170)
Eric Batteiger Federal (Navy)
Brent Bedford Federal (NTIA/ITS )
Jeffrey Boksiner Federal (CERDEC)
Mark Brushwood
Milind Buddhikot Industry (Bell-Labs)
Stephen Buenzow Federal (FCC)
Duane Calloway Federal (ATEC)
David Campbell Federal (DHS)
Jason Chabot Federal (USAF)
Bryan Chapman Federal (ASMO)
Mike Chartier Industry (Intel)
Jay Chauhan Federal (DSO)
Chrysanthos Chrysanthou Federal (CERDEC)
Tim Clancy Federal (Army)
William Copeland Federal (Navy)
John Cornicelli Federal (Homeland Security)
Joseph Cramer Industry (Boeing)
Arthur DeLeon Federal (USMC)
Richard Desalvo Federal (ASMO)
* Thomas Dombrowsky, Jr. Industry (CTIA)
David Duncan Federal (Army)
Thomas Fagan Industry (Raytheon)
Gregory Formosa Federal (Army)

CSMAC WG-4 Final Report 21 July24, 2013
Jason Fortenberry Federal
Paul Frew Industry (Research in Motion)
David Garrabrant Federal (Army)
Alexander Gerdenitsch Industry (Motorola)
Mark Gibson Industry (Comsearch)
David Greenberg Federal (ASMO)
David Gurney Industry (Motorola)
* Eric Hagerson Industry (T-Mobile)
Muhammad Hasan Federal (PEO C3T)
Robert Higgonbotham Federal (DSO)
* George Hirvela Industry (AT&T)
David Hughes Industry (Plateautel)
John Hunter Federal (NTIA)
Saiful Islam Federal (CERDEC)
Arthur Jackson Industry (T-Mobile)
David Johnson Federal (Navy)
Cal Jordan Federal (Army)
Stevan Jovancevic Federal (Army)
Gitangli Khushlani Constratus
Thomas Kidd Federal (Navy)
Rob Kubik Industry (Samsung)
Michael Landry Federal(Homeland Security)
Robert Lara Federal (JTRS)
Eric Leisure
Willie Loper Federal (ATEC)
David Manzi Industry (Raytheon)
Jeffrey Marks alcatel-lucent
Bob Martin Federal (Army)
Tim Fitz Maurice Federal (WIN-T)
Andy McGregor Industry (Ericsson)
* Mark McHenry Industry (Shared Spectrum )
Dan Mieszala Industry (Alltel Wireless)
Pierre Missud Federal (DOI)
Fred Moorefield Federal (Air Force)
Prakash Moorut Industry (NSN)
Vincent Morgan Federal (DSO)

CSMAC WG-4 Final Report 22 July24, 2013
James Norton Industry (General Dynamics)
Janice Obuchowski Industry (Freedom Technologies)
LTC Troy Orwan Federal
Mark Paolicelli Federal (USMC)
Gary Patrick Federal (NTIA)
Randy Peterson
Dave Pierce Federal (Army)
Samuel Pirrone Federal
Chuck Powers Industry (Motorola)
Mark Racek Industry (Ericsson)
Donald Reese Federal (Air Force)
Nancy Savage Federal (ATEC)
Gary Scheer Federal (FBI)
Steve Schwartz Federal (Army)
Thomas Shanholtz Federal (DSO)
Steve Sharkey T-Mobile
Capt. Bradley Smith Federal (Air Force)
Alden Smith Federal (DSO)
Edward Smith Federal (DHS)
Mike Smith Industry (Harris)
Jim Snider Industry (iSolon)
Peter Staxen Industry (Ericsson)
John Suhy Federal (Army)
Shawn Sweeney Federal
David Tenney Industry (Booze-Allen)
Eric Thomas Federal (Army)
John Allen Thompson Federal (Army)
Ralph Walborn WSMR DOD AFC
Randolph Wardle Federal (Army)
Jennifer Warren Industry (Lockheed-Martin)
Gary Williams
Maurice Winn Federal (Army)
LTC Lori Winn Federal (Joint Staff)
Bryan Wright Federal (DOI)
Richard Wyman Federal (Army)
Joe Yavorsky Federal (Army)
CSMAC WG-4 Final Report 23 July24, 2013
Stephen Zak Federal (FCC)
* Ken Zdunek Industry (Roberson &
Lily Zeleki Federal (DoD CIO)

CSMAC WG-4 Final Report 24 July24, 2013
Appendix 2: Description of Federal Systems
A.2.1 Fixed Point-to-Point Microwave Systems
Federal agencies use fixed point-to-point microwave systems for the transmission of voice, data, and/or video in support of law enforcement, military command and control, emergency preparedness and response, the national air space system, energy grid control, and resource management activities. These systems also support the distribution of meteorological data to a variety of users including the public. Fixed point-to-point microwave systems provide service where commercial options are either unavailable, too expensive, or do not provide the level of reliability required by federal users. Relocation time frames for Fixed systems are shown below in Table 2.17
Table 2: Relocation Time Frames for Fixed Systems
Agencies/Services Relocation Time Frame
1755-1780 MHz 1755-1850 MHz
Army 5 Years 10 Years
Air Force 5 Years
Navy - -
USMC - -
DOE 5 Years 5 - 10 Years
DHS 5 Years
DOI 5 Years 10 Years
DOC 5 Years
FAA 2 Years
A.2.2 Tactical Radio Relay (TRR)18,19
DoD requires efficient methods of exchanging large quantities of digital data throughout the battlefield and are expected increase exponentially in support of command and control, intelligence, logistics, etc. The DoD operates various Tactical Radio Relay
17 NTIA Report, Tables 4-1 and 4-2, pp 25 and 26 respectively. 18
Department of Defense Investigation of the Feasibility of Accommodating the International Mobile Telecommunications (IMT) 2000 Within the 1755-1850 MHz Band (9 Feb 2001).
19 NTIA Report

CSMAC WG-4 Final Report 25 July24, 2013
(TRR) capabilities across the 1755-1850 MHz band. TRR link various subordinate, lateral and strategic headquarters, functional and component nodes, into an integrated area-wide network. TRR are transportable, fixed, point-to-point microwave communications systems which provide mid-to-high capacity digital information to battlefield commanders for command and control for forces. TRR provides highly transportable lightweight, survivable systems and antenna that can be quickly set-up and taken down to establish robust communications links that support the concept of maneuver warfare. TRR usage within the United States and Possessions (US&P) is primarily for training. However, TRR systems may be operationally deployed for DoD support to state and local governments in the event of national emergencies, natural disasters or humanitarian relief missions. There are two major TRR capabilities currently fielded by DoD; the Army’s High Capacity Line-of-Site (HCLOS) system and the Navy and Marine Corps Digital Wideband Transmission System (DWTS). TRR operating locations are shown below in Table 4. Relocation time frames for TRR systems are shown below in Table 3.20
Table 3: Relocation Time Frames for TRR Systems
Agencies/Services Relocation Time Frame
1755-1780 MHz 1755-1850 MHz
Army (HCLOS) 5 Years 8 - 10 Years
Navy USMC (DWTS) 8 - 10 Years
The following system descriptions are provided:
A.2.2.1 High Capacity Line-of-Site (HCLOS)
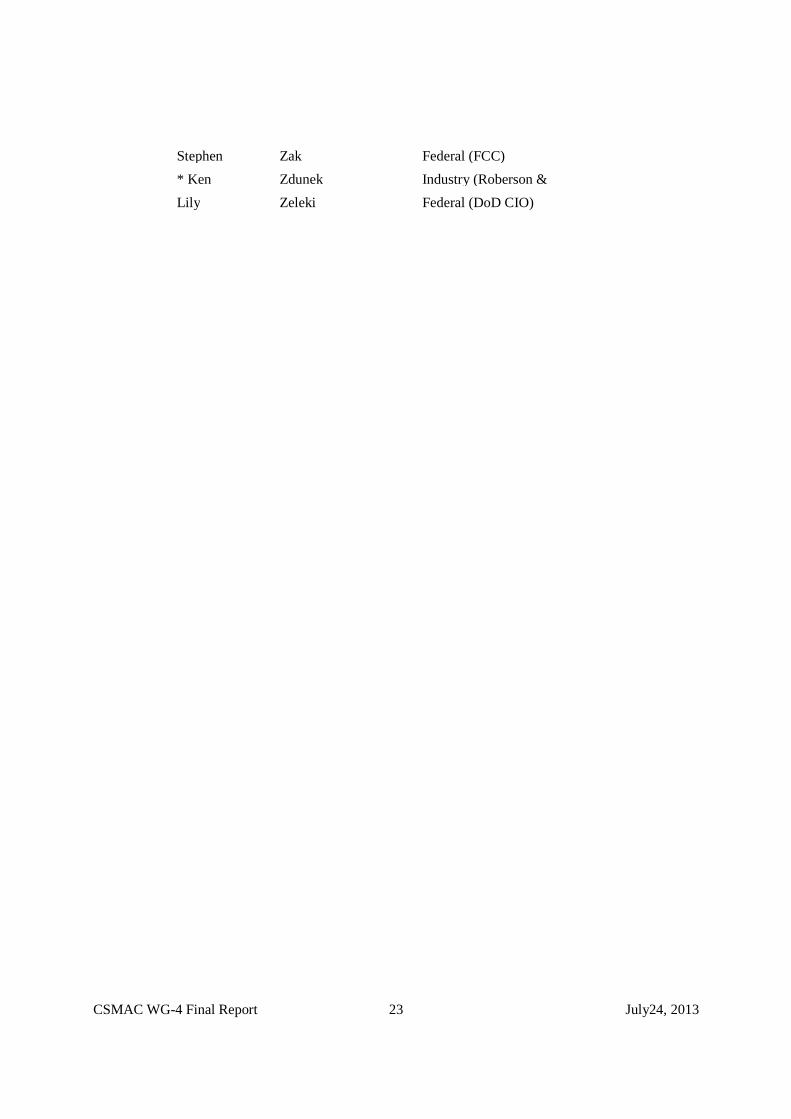
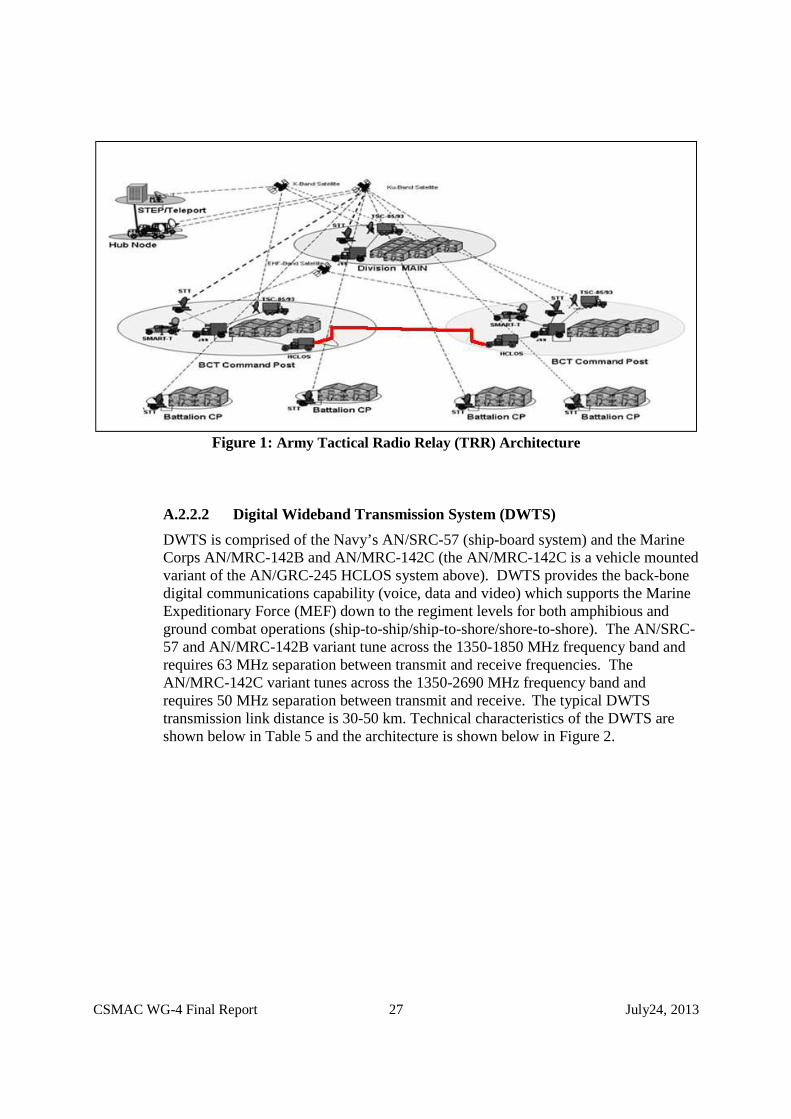
Army HCLOS is comprised of the AN/GRC-245 HCLOS system. HCLOS is a multi-band, multi-mode, radio providing high data throughput communications for command and control, intelligence, imagery, logistics, medical and morale and welfare support. HCLOS comprises a major functional component of the Army’s Warfighter Information Network – Tactical (WIN-T) capability. HCLOS provides the Army with wide-area communications for tactical operations at the battalion brigade and division levels. The AN/GRC-245 tunes across the 1350-2690 MHz frequency band, requires 50 MHz separation between the transmit and receive frequencies and has a typical transmission link distance from 30-50 km. Technical characteristics of the HCLOS system are shown below in Table 4 and the architecture is shown below in Figure 1.
20 NTIA Report at Table 4-3, p 28.
CSMAC WG-4 Final Report 26 July24, 2013
Table 4: Army Tactical Radio Relay (TRR) Analysis Characteristics
AN/GRC-245
Radio Function High Capacity LOS
Frequency Range 1350 – 2690 MHz
Transmit power 31 mW - 1.6 W
Emission Bandwidth* (MHz)
2.0 (-3dB), 2.9 (-20dB), 7.2 (-60dB)
Antenna Mainbeam Gain
23 dBi
Antenna Heights DoD Equipment – 15 meters
User Equipment – 1.5 meters (initial analysis), will be varied in follow-on analysis
Receiver Bandwidth, MHz
6.7 (-3dB), 8.1 (-20dB), 10.0 (-60dB)
Receiver Noise Figure 7 dB
Receiver Sensitivity -86 dBm @ 8192 Kb/s and BER = 10E-5
Receiver Noise Power -99 dBm
Interfering Signal Threshold
-105 dBm
Waveform 2M50W1D, 320-8256 kb/s, 32 TCM, rate 4/5 code
Analysis Locations (This type of radio is located at all Army
sites)
Ft Lewis, WA Ft Carson, CO
Camp Blanding, FL
Antenna Locations
DoD radios use directional antennas. For worst case scenario, the backlobe of the antenna will be analyzed against the borders at each of the locations. Additional runs will be made at each of the three bases with links running parallel to the border of the base for a side-lobe analysis.
DoD Link Distance 10 Km
User Equipment Characteristics
Baseline Characteristics Provided by LTE Working Group
CSMAC WG-4 Final Report 27 July24, 2013
Figure 1: Army Tactical Radio Relay (TRR) Architecture
A.2.2.2 Digital Wideband Transmission System (DWTS)
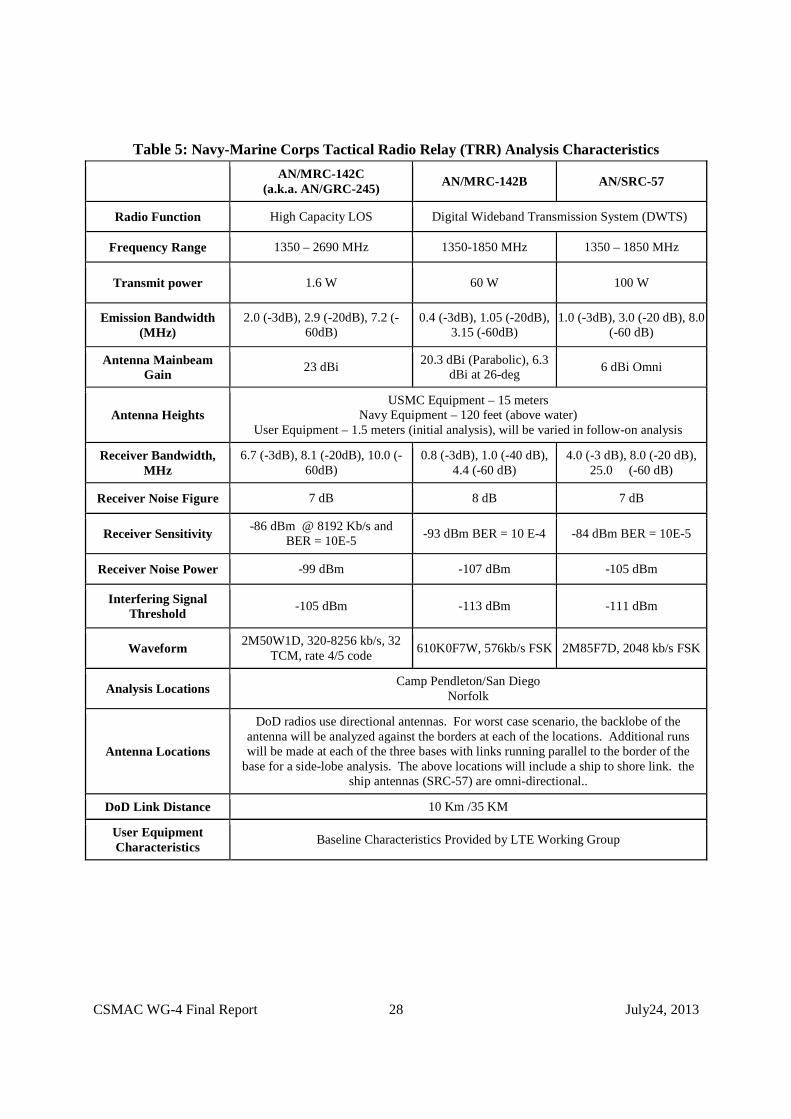
DWTS is comprised of the Navy’s AN/SRC-57 (ship-board system) and the Marine Corps AN/MRC-142B and AN/MRC-142C (the AN/MRC-142C is a vehicle mounted variant of the AN/GRC-245 HCLOS system above). DWTS provides the back-bone digital communications capability (voice, data and video) which supports the Marine Expeditionary Force (MEF) down to the regiment levels for both amphibious and ground combat operations (ship-to-ship/ship-to-shore/shore-to-shore). The AN/SRC-57 and AN/MRC-142B variant tune across the 1350-1850 MHz frequency band and requires 63 MHz separation between transmit and receive frequencies. The AN/MRC-142C variant tunes across the 1350-2690 MHz frequency band and requires 50 MHz separation between transmit and receive. The typical DWTS transmission link distance is 30-50 km. Technical characteristics of the DWTS are shown below in Table 5 and the architecture is shown below in Figure 2.
CSMAC WG-4 Final Report 28 July24, 2013
Table 5: Navy-Marine Corps Tactical Radio Relay (TRR) Analysis Characteristics
AN/MRC-142C
(a.k.a. AN/GRC-245) AN/MRC-142B AN/SRC-57
Radio Function High Capacity LOS Digital Wideband Transmission System (DWTS)
Frequency Range 1350 – 2690 MHz 1350-1850 MHz 1350 – 1850 MHz
Transmit power 1.6 W 60 W 100 W
Emission Bandwidth (MHz)
2.0 (-3dB), 2.9 (-20dB), 7.2 (-60dB)
0.4 (-3dB), 1.05 (-20dB), 3.15 (-60dB)
1.0 (-3dB), 3.0 (-20 dB), 8.0 (-60 dB)
Antenna Mainbeam Gain
23 dBi 20.3 dBi (Parabolic), 6.3 dBi at 26-deg
6 dBi Omni
Antenna Heights USMC Equipment – 15 meters
Navy Equipment – 120 feet (above water) User Equipment – 1.5 meters (initial analysis), will be varied in follow-on analysis
Receiver Bandwidth, MHz
6.7 (-3dB), 8.1 (-20dB), 10.0 (-60dB)
0.8 (-3dB), 1.0 (-40 dB), 4.4 (-60 dB)
4.0 (-3 dB), 8.0 (-20 dB), 25.0 (-60 dB)
Receiver Noise Figure 7 dB 8 dB 7 dB
Receiver Sensitivity -86 dBm @ 8192 Kb/s and
BER = 10E-5 -93 dBm BER = 10 E-4 -84 dBm BER = 10E-5
Receiver Noise Power -99 dBm -107 dBm -105 dBm
Interfering Signal Threshold
-105 dBm -113 dBm -111 dBm
Waveform 2M50W1D, 320-8256 kb/s, 32
TCM, rate 4/5 code 610K0F7W, 576kb/s FSK 2M85F7D, 2048 kb/s FSK
Analysis Locations Camp Pendleton/San Diego
Norfolk
Antenna Locations
DoD radios use directional antennas. For worst case scenario, the backlobe of the antenna will be analyzed against the borders at each of the locations. Additional runs will be made at each of the three bases with links running parallel to the border of the
base for a side-lobe analysis. The above locations will include a ship to shore link. the ship antennas (SRC-57) are omni-directional..
DoD Link Distance 10 Km /35 KM
User Equipment Characteristics
Baseline Characteristics Provided by LTE Working Group

CSMAC WG-4 Final Report
Figure 2: Navy-Marine Corps
A.2.3 Joint Tactical Radio System / Software Defined Radio (JTRS/SDR)
SDR systems are capable of generating different waveforms and Radio modulations of varying complexity through modifiable software and by the use of digital synthesis. Systems under various stages of development include the117G, the Joint Tactical Radio System (JTRS) (HMS) Manpack Radioand the Mid-Tier Networking Vehicular Radio (MNVR).
JTRS is not just about the radios or waveforms. The JTRS suite provides the capability to network combat units. Also, JTRsoftware enhancements.
JTRS represents a family of multidesigned to provide communications within the 2 MHz to 2 GHz frequency range. The NTIA Assessment of the1850 MHz Band released in March of 2012 identified comparable spectrum bands above 2 GHz. Since the software defined radios have design limitations that prevent tuning above 2 GHz, the JTRS radiJTRS locations will compress up to operate at in 1780 installations identified in Section 2.3 above; those sites will continue to operate throughout the 1755-18
29
Marine Corps Tactical Radio Relay (TRR) Architecture
Joint Tactical Radio System / Software Defined Radio (JTRS/SDR)
SDR systems are capable of generating different waveforms and Radio modulations of varying complexity through modifiable software and by the use of digital synthesis. Systems under various stages of development include the
Joint Tactical Radio System (JTRS) Handheld Manpack adio (AN/PRC-155), the handheld Rifleman Radio (AN/PRC
Tier Networking Vehicular Radio (MNVR).
JTRS is not just about the radios or waveforms. The JTRS suite provides the capability to network combat units. Also, JTRS allows DoD to deploy functionality through software enhancements.
JTRS represents a family of multi-band/multi-mode Software Defined Radios (SDRs), designed to provide communications within the 2 MHz to 2 GHz frequency range. The NTIA Assessment of the Viability of Accommodating Wireless Broadband in the 1755 1850 MHz Band released in March of 2012 identified comparable spectrum bands above 2 GHz. Since the software defined radios have design limitations that prevent tuning above 2 GHz, the JTRS radios will not relocate entirely out of the band. Specifically, JTRS locations will compress up to operate at in 1780 – 1850 MHz band except at the six installations identified in Section 2.3 above; those sites will continue to operate
1850 MH band.
July24, 2013
Architecture
Joint Tactical Radio System / Software Defined Radio (JTRS/SDR)
SDR systems are capable of generating different waveforms and Radio Frequency (RF) modulations of varying complexity through modifiable software and by the use of digital synthesis. Systems under various stages of development include the Harris AN/PRC-
Small Form-Fit 155), the handheld Rifleman Radio (AN/PRC-154)
JTRS is not just about the radios or waveforms. The JTRS suite provides the capability S allows DoD to deploy functionality through
mode Software Defined Radios (SDRs), designed to provide communications within the 2 MHz to 2 GHz frequency range. The
Viability of Accommodating Wireless Broadband in the 1755 – 1850 MHz Band released in March of 2012 identified comparable spectrum bands above 2 GHz. Since the software defined radios have design limitations that prevent tuning
entirely out of the band. Specifically, 1850 MHz band except at the six
installations identified in Section 2.3 above; those sites will continue to operate

CSMAC WG-4 Final Report 30 July24, 2013
JTRS operates with new advanced waveforms that have enhanced performance capabilities. The JTRS Wideband Networking Waveform (WNW) and the Soldier Radio Waveform (SRW) are capable of operating in the 225-400 MHz, 1350-1390 MHz, and 1755-1850 MHz frequency bands. The SRW is optimized for constrained bandwidth and is carried by a soldier (manpacked and handheld variants). The WNW allows greater bandwidth, optimizes network throughput and is platform mounted.
The Joint Enterprise Network Manager (JENM) software product enables control of these wideband networks. Many variants of JTRS will exist and be used by all three military departments. DoD projects JTRS operations to occur at all major testing, training, and Infantry Brigade Combat Team locations, most of which are shown in Table 6.
The WNW will be used with the JTRS MNVR, and the Airborne, Maritime, and Fixed Station (AMF) equipment (Small Airborne Networking Radio (SANR)). The SRW will be used on the JTRS Handheld, Man-Pack, Small-Form-Fit (HMS) variants, the MNVR, as well as the AMF SANR. The AN/PRC-154 (Rifleman Radio) is a single channel radio mainly used by dismounted soldiers. The AN/PRC-155 (HMS Manpack) is a 2-channel radio operated by dismounted soldiers as well as vehicular mounted.
In addition, a critical aspect to consider regarding SDR operations is that the terrestrial Intelligence, Surveillance, and Reconnaissance (ISR) and communications relay capabilities must be available for training, testing and system development.
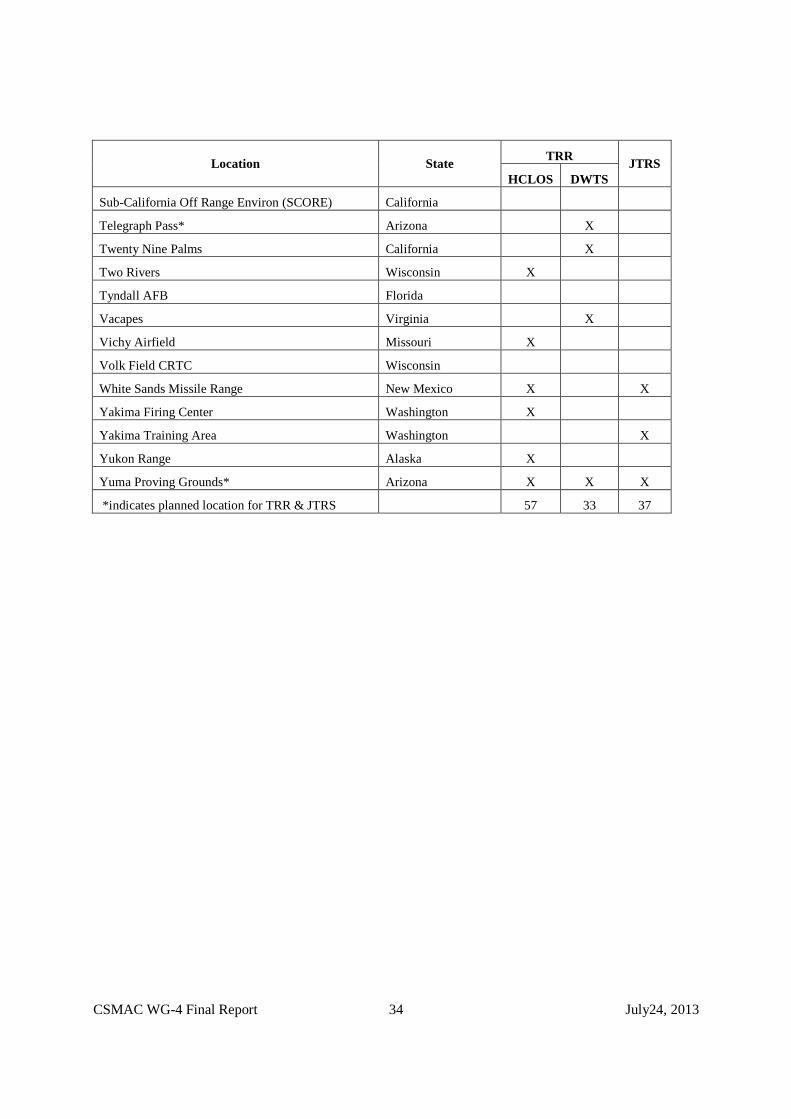
Table 6: Location of TRR & JTRS Operations
Location State TRR
JTRS HCLOS DWTS
Aberdeen Proving Ground* Maryland X X
Alpena CRTC Michigan
Apra Harbor Guam X
Barksdale AFB Louisiana
Bogue Field North Carolina X
Bridgeport California X
Brooklyn New York X
Camp Atterbury Indiana X X
Camp Blanding Florida X X
Camp Grayling Michigan X
Camp Guernsey Wyoming X
Camp Lejeune* North Carolina X
Camp Mabry Texas X
Camp Pendleton California X
Camp Ripley Minnesota X X
Camp Roberts* California X X

CSMAC WG-4 Final Report 31 July24, 2013
Location State TRR
JTRS HCLOS DWTS
Camp Shelby* Mississippi X X
Cincinnati Ohio X
Craney Island* Virginia X
Dugway Proving Ground* Utah X
Eglin AFB Florida
Eielson AFB Alaska
El Centro California
Elizabeth City* North Carolina X
Ellsworth AFB South Dakota
Elmendorf AFB North Carolina
England Industrial Park Louisiana X
Faribault Minnesota X
Fort A. P. Hill Virginia X
Fort Benning* Georgia X X
Fort Bliss* Texas X X
Fort Bragg North Carolina X X
Fort Bragg/Camp McKall North Carolina
Fort Campbell Kentucky X X
Fort Carson Colorado X X* X
Fort Drum New York X X
Fort Gordon Georgia X X
Fort Greely Alaska X
Fort Hood Texas X X
Fort Huachuca* Arizona X X
Fort Hunter Liggett California X
Fort Indiantown GAP Pennsylvania X X
Fort Jackson South Carolina X
Fort Leavenworth* Kansas X
Fort Lee* Virginia X
Fort Leonard Wood Missouri X
Fort McCoy Wisconsin X
Fort Pickett Virginia X
Fort Polk Louisiana X X

CSMAC WG-4 Final Report 32 July24, 2013
Location State TRR
JTRS HCLOS DWTS
Fort Riley Kansas X X
Fort Rucker* Alabama X X
Fort Sill Oklahoma X X
Fort Stewart Georgia X X
Fort Wainwright Alaska X
Fox Lake Illinois X
Fort Chaffee Arkansas X
Fort Knox* Kentucky X X
Great Falls ANGB Montana
Great Lakes Illinois X
Greensboro North Carolina X
Grissom Indiana X
Gulfport CRTC Mississippi
Hawthorne Nevada X
Hill AFB Utah
Holloman AFB New Mexico
Homestead ARB Florida
Huntington Beach* California X
Iowa Iowa X
Jacksonville ANGB Florida
Joint Base Charleston South Carolina X
Joint Base Elmendorf-Richardson Alaska X
Joint Base Langley-Eustis* Virginia X
Joint Base Lewis-McChord Washington X X
Joint Base Pearl Harbor-Hickam Hawaii X
JRTC (Fort Polk North) Louisiana X X
Kaneohe Hawaii X
Kauai Hawaii X
Langley AFB Virginia
Letterkenny Pennsylvania X
Luke AFB Arizona
MCAS Beaufort South Carolina
MCAS Cherry Point North Carolina

CSMAC WG-4 Final Report 33 July24, 2013
Location State TRR
JTRS HCLOS DWTS
McEntire JNGB South Carolina
McGregor New Mexico X
Midway Research Center* Virginia X
Miramar California X
Morehead City North Carolina X
Mt Home AFB Idaho
NAS Fallon Nevada
NAS Key West Florida
NAS Lemoore California
NAS New Orleans Louisiana
NAS Oceana Virginia
Nellis AFB Nevada
NTC/Fort Irwin California X X
Oahu Hawaii X
Ohio Ohio X
Orchard Park Idaho X
Panama City Florida X
Patuxent River NAS Maryland
Pinon Canyon Colorado X X* X
Pohakuloa Training Area (PTA) Hawaii X X
Point Mugu* California X
Portland ANGB Oregon
Portsmouth* Virginia X
Quantico Virginia X
Redstone Arsenal* Alabama X
Rosemount Minnesota X
Saint Joseph Missouri X
San Clemente Island* California X
Sand Ridge Illinois X
Savannah CRTC Georgia
Seymour Johnson AFB North Carolina
Shaw AFB South Carolina
St. Juliens Creek Virginia X
CSMAC WG-4 Final Report 34 July24, 2013
Location State TRR
JTRS HCLOS DWTS
Sub-California Off Range Environ (SCORE) California
Telegraph Pass* Arizona X
Twenty Nine Palms California X
Two Rivers Wisconsin X
Tyndall AFB Florida
Vacapes Virginia X
Vichy Airfield Missouri X
Volk Field CRTC Wisconsin
White Sands Missile Range New Mexico X X
Yakima Firing Center Washington X
Yakima Training Area Washington X
Yukon Range Alaska X
Yuma Proving Grounds* Arizona X X X
*indicates planned location for TRR & JTRS 57 33 37

CSMAC WG-4 Final Report 35 July24, 2013
Table 7: Military Bases Located in Economic Areas, Ranked by EA
Location EA #
Median Rank
EA Name MEA #
MEA Name REAG #
REAG Name
Aberdeen Proving Ground 10 1 (NYC-Long Is. NY-NJ-CT-PA-MA-VT)
2 (New York City) 1 (Northeast)
Fort Indiantown GAP 10 1 (NYC-Long Is. NY-NJ-CT-PA-MA-VT)
2 (New York City) 1 (Northeast)
Letterkenny 10 1 (NYC-Long Is. NY-NJ-CT-PA-MA-VT)
2 (New York City) 1 (Northeast)
Camp Pendleton 160 2 (LA-Riverside-Orange Cnty CA-AZ)
44 (Los Angeles-San Diego) 6 (West)
Camp Roberts 160 2 (LA-Riverside-Orange Cnty CA-AZ)
44 (Los Angeles-San Diego) 6 (West)
Fort Hunter Liggett 160 2 (LA-Riverside-Orange Cnty CA-AZ)
44 (Los Angeles-San Diego) 6 (West)
Huntington Beach 160 2 (LA-Riverside-Orange Cnty CA-AZ)
44 (Los Angeles-San Diego) 6 (West)
Miramar 160 2 (LA-Riverside-Orange Cnty CA-AZ)
44 (Los Angeles-San Diego) 6 (West)
NTC/Fort Irwin 160 2 (LA-Riverside-Orange Cnty CA-AZ)
44 (Los Angeles-San Diego) 6 (West)
Point Mugu 160 2 (LA-Riverside-Orange Cnty CA-AZ)
44 (Los Angeles-San Diego) 6 (West)
San Clemente Island 160 2 (LA-Riverside-Orange Cnty CA-AZ)
44 (Los Angeles-San Diego) 6 (West)
Telegraph Pass 160 2 (LA-Riverside-Orange Cnty CA-AZ)
44 (Los Angeles-San Diego) 6 (West)
Twenty Nine Palms 160 2 (LA-Riverside-Orange Cnty CA-AZ)
44 (Los Angeles-San Diego) 6 (West)
Yuma Proving Grounds 160 2 (LA-Riverside-Orange Cnty CA-AZ)
44 (Los Angeles-San Diego) 6 (West)
Fox Lake 64 3 (Chicago-Gary-Kenosha IL-IN-WI)
18 (Chicago) 3 (Great Lakes)
Great Lakes 64 3 (Chicago-Gary-Kenosha IL-IN-WI)
18 (Chicago) 3 (Great Lakes)
Grissom 64 3 (Chicago-Gary-Kenosha IL-IN-WI)
18 (Chicago) 3 (Great Lakes)
Camp Mabry 131 4 (Houston-Galveston-Brazoria TX)
31 (Houston) 5 (Central)
England Industrial Park 131 4 (Houston-Galveston-Brazoria TX)
31 (Houston) 5 (Central)
Fort Hood 131 4 (Houston-Galveston-Brazoria TX)
31 (Houston) 5 (Central)
Fort Polk 131 4 (Houston-Galveston-Brazoria TX)
31 (Houston) 5 (Central)
JRTC (Fort Polk North) 131 4 (Houston-Galveston-Brazoria TX)
31 (Houston) 5 (Central)

CSMAC WG-4 Final Report 36 July24, 2013
Location EA #
Median Rank
EA Name MEA #
MEA Name REAG #
REAG Name
Bridgeport 163 6 (San Fran.-Oakland-San Jose CA)
43 (San Francisco-Oakland-San Jose)
6 (West)
Camp Roberts 163 6 (San Fran.-Oakland-San Jose CA)
43 (San Francisco-Oakland-San Jose)
6 (West)
Fort Hunter Liggett 163 6 (San Fran.-Oakland-San Jose CA)
43 (San Francisco-Oakland-San Jose)
6 (West)
Hawthorne 163 6 (San Fran.-Oakland-San Jose CA)
43 (San Francisco-Oakland-San Jose)
6 (West)
Fort Bliss 158 7 (Phoenix-Mesa AZ-NM) 40 (Phoenix) 5 (Central)
Fort Huachuca 158 7 (Phoenix-Mesa AZ-NM) 40 (Phoenix) 5 (Central)
McGregor 158 7 (Phoenix-Mesa AZ-NM) 40 (Phoenix) 5 (Central)
Telegraph Pass 158 7 (Phoenix-Mesa AZ-NM) 40 (Phoenix) 5 (Central)
White Sands Missile Range 158 7 (Phoenix-Mesa AZ-NM) 40 (Phoenix) 5 (Central)
Yuma Proving Grounds 158 7 (Phoenix-Mesa AZ-NM) 40 (Phoenix) 5 (Central)
Camp Mabry 127 8 (Dallas-Fort Worth TX-AR-OK)
32 (Dallas-Fort Worth) 5 (Central)
Fort Hood 127 8 (Dallas-Fort Worth TX-AR-OK)
32 (Dallas-Fort Worth) 5 (Central)
Fort Polk 127 8 (Dallas-Fort Worth TX-AR-OK)
32 (Dallas-Fort Worth) 5 (Central)
Fort Sill 127 8 (Dallas-Fort Worth TX-AR-OK)
32 (Dallas-Fort Worth) 5 (Central)
Ft Chaffee 127 8 (Dallas-Fort Worth TX-AR-OK)
32 (Dallas-Fort Worth) 5 (Central)
JRTC (Fort Polk North) 127 8 (Dallas-Fort Worth TX-AR-OK)
32 (Dallas-Fort Worth) 5 (Central)
Aberdeen Proving Ground 12 9 (Phil.-Atl. City PA-NJ-DE-MD)
4 (Philadelphia) 1 (Northeast)
Fort Indiantown GAP 12 9 (Phil.-Atl. City PA-NJ-DE-MD)
4 (Philadelphia) 1 (Northeast)
Letterkenny 12 9 (Phil.-Atl. City PA-NJ-DE-MD)
4 (Philadelphia) 1 (Northeast)
Quantico 12 9 (Phil.-Atl. City PA-NJ-DE-MD)
4 (Philadelphia) 1 (Northeast)
Camp Pendleton 161 10 (San Diego CA) 44 (Los Angeles-San Diego) 6 (West)
Huntington Beach 161 10 (San Diego CA) 44 (Los Angeles-San Diego) 6 (West)
Miramar 161 10 (San Diego CA) 44 (Los Angeles-San Diego) 6 (West)
San Clemente Island 161 10 (San Diego CA) 44 (Los Angeles-San Diego) 6 (West)

CSMAC WG-4 Final Report 37 July24, 2013
Location EA #
Median Rank
EA Name MEA #
MEA Name REAG #
REAG Name
Twenty Nine Palms 161 10 (San Diego CA) 44 (Los Angeles-San Diego) 6 (West)
Camp Grayling 57 11 (Detroit-Ann Arbor-Flint MI) 16 (Detroit) 3 (Great Lakes)
Camp Blanding 30 14 (Orlando FL) 10 (Tampa-St. Petersburg-Orlando)
2 (Southeast)
Aberdeen Proving Ground 13 15 (Wash.-Balt. DC-MD-VA-WV-PA)
5 (Washington) 2 (Southeast)
Craney Island 13 15 (Wash.-Balt. DC-MD-VA-WV-PA)
5 (Washington) 2 (Southeast)
Fort A. P. Hill 13 15 (Wash.-Balt. DC-MD-VA-WV-PA)
5 (Washington) 2 (Southeast)
Fort Indiantown GAP 13 15 (Wash.-Balt. DC-MD-VA-WV-PA)
5 (Washington) 2 (Southeast)
Fort Lee 13 15 (Wash.-Balt. DC-MD-VA-WV-PA)
5 (Washington) 2 (Southeast)
Fort Pickett 13 15 (Wash.-Balt. DC-MD-VA-WV-PA)
5 (Washington) 2 (Southeast)
Joint Base Langley-Eustis 13 15 (Wash.-Balt. DC-MD-VA-WV-PA)
5 (Washington) 2 (Southeast)
Letterkenny 13 15 (Wash.-Balt. DC-MD-VA-WV-PA)
5 (Washington) 2 (Southeast)
Midway Research Center 13 15 (Wash.-Balt. DC-MD-VA-WV-PA)
5 (Washington) 2 (Southeast)
Portsmouth 13 15 (Wash.-Balt. DC-MD-VA-WV-PA)
5 (Washington) 2 (Southeast)
Quantico 13 15 (Wash.-Balt. DC-MD-VA-WV-PA)
5 (Washington) 2 (Southeast)
St. Juliens Creek 13 15 (Wash.-Balt. DC-MD-VA-WV-PA)
5 (Washington) 2 (Southeast)
Vacapes 13 15 (Wash.-Balt. DC-MD-VA-WV-PA)
5 (Washington) 2 (Southeast)
Joint Base Lewis-McChord 170 16 (Seattle-Tacoma-Bremerton WA)
46 (Seattle) 6 (West)
Yakima Firing Center 170 16 (Seattle-Tacoma-Bremerton WA)
46 (Seattle) 6 (West)
Yakima Training Area 170 16 (Seattle-Tacoma-Bremerton WA)
46 (Seattle) 6 (West)
Camp Blanding 34 17 (Tampa-St. Petersburg FL) 10 (Tampa-St. Petersburg-Orlando)
2 (Southeast)
Camp Atterbury 49 18 (Cincinnati-Hamilton OH-KY-IN)
13 (Cincinnati-Dayton) 3 (Great Lakes)
Cincinnati 49 18 (Cincinnati-Hamilton OH-KY-IN)
13 (Cincinnati-Dayton) 3 (Great Lakes)
Grissom 49 18 (Cincinnati-Hamilton OH-KY-IN)
13 (Cincinnati-Dayton) 3 (Great Lakes)
Fort Benning 40 19 (Atlanta GA-AL-NC) 8 (Atlanta) 2 (Southeast)

CSMAC WG-4 Final Report 38 July24, 2013
Location EA #
Median Rank
EA Name MEA #
MEA Name REAG #
REAG Name
Fort Gordon 40 19 (Atlanta GA-AL-NC) 8 (Atlanta) 2 (Southeast)
Fort Rucker 40 19 (Atlanta GA-AL-NC) 8 (Atlanta) 2 (Southeast)
Redstone Arsenal 40 19 (Atlanta GA-AL-NC) 8 (Atlanta) 2 (Southeast)
Letterkenny 53 20 (Pittsburgh PA-WV) 12 (Pittsburgh) 3 (Great Lakes)
Camp Mabry 134 21 (San Antonio TX) 38 (San Antonio) 5 (Central)
Fort Hood 134 21 (San Antonio TX) 38 (San Antonio) 5 (Central)
Fort Campbell 96 22 (St. Louis MO-IL) 30 (St. Louis) 4 (Mississippi Valley)
Fort Leonard Wood 96 22 (St. Louis MO-IL) 30 (St. Louis) 4 (Mississippi Valley)
Sand Ridge 96 22 (St. Louis MO-IL) 30 (St. Louis) 4 (Mississippi Valley)
Vichy Airfield 96 22 (St. Louis MO-IL) 30 (St. Louis) 4 (Mississippi Valley)
Camp Atterbury 67 23 (Indianapolis IN-IL) 19 (Indianapolis) 3 (Great Lakes)
Cincinnati 67 23 (Indianapolis IN-IL) 19 (Indianapolis) 3 (Great Lakes)
Grissom 67 23 (Indianapolis IN-IL) 19 (Indianapolis) 3 (Great Lakes)
Fort Bragg 23 24 (Charlotte-Gastonia NC-SC) 7 (Charlotte-Greensboro-Greenville-Raleigh)
2 (Southeast)
Fort Bragg/Camp McCall 23 24 (Charlotte-Gastonia NC-SC) 7 (Charlotte-Greensboro-Greenville-Raleigh)
2 (Southeast)
Fort Jackson 23 24 (Charlotte-Gastonia NC-SC) 7 (Charlotte-Greensboro-Greenville-Raleigh)
2 (Southeast)
Greensboro 23 24 (Charlotte-Gastonia NC-SC) 7 (Charlotte-Greensboro-Greenville-Raleigh)
2 (Southeast)
Fort McCoy 63 25 (Milwaukee-Racine WI) 17 (Milwaukee) 3 (Great Lakes)
Fox Lake 63 25 (Milwaukee-Racine WI) 17 (Milwaukee) 3 (Great Lakes)
Great Lakes 63 25 (Milwaukee-Racine WI) 17 (Milwaukee) 3 (Great Lakes)
Two Rivers 63 25 (Milwaukee-Racine WI) 17 (Milwaukee) 3 (Great Lakes)
Dugway Proving Ground 152 26 (Salt Lake City-Ogden UT-ID)
42 (Salt Lake City) 6 (West)
Camp Ripley 107 27 (Minneapolis-St. Paul MN-WI-IA)
20 (Minneapolis-St. Paul) 3 (Great Lakes)
Faribault 107 27 (Minneapolis-St. Paul MN-WI-IA)
20 (Minneapolis-St. Paul) 3 (Great Lakes)

CSMAC WG-4 Final Report 39 July24, 2013
Location EA #
Median Rank
EA Name MEA #
MEA Name REAG #
REAG Name
Fort McCoy 107 27 (Minneapolis-St. Paul MN-WI-IA)
20 (Minneapolis-St. Paul) 3 (Great Lakes)
Rosemount 107 27 (Minneapolis-St. Paul MN-WI-IA)
20 (Minneapolis-St. Paul) 3 (Great Lakes)
Camp Mabry 130 28 (Austin-San Marcos TX) 32 (Dallas-Fort Worth) 5 (Central)
Fort Hood 130 28 (Austin-San Marcos TX) 32 (Dallas-Fort Worth) 5 (Central)
Camp Shelby 83 29 (New Orleans LA-MS) 27 (New Orleans-Baton Rouge) 4 (Mississippi Valley)
Bogue Field 19 30 (Raleigh-Durham-Chapel Hill NC)
7 (Charlotte-Greensboro-Greenville-Raleigh)
2 (Southeast)
Camp Lejeune 19 30 (Raleigh-Durham-Chapel Hill NC)
7 (Charlotte-Greensboro-Greenville-Raleigh)
2 (Southeast)
Craney Island 19 30 (Raleigh-Durham-Chapel Hill NC)
7 (Charlotte-Greensboro-Greenville-Raleigh)
2 (Southeast)
Elizabeth City 19 30 (Raleigh-Durham-Chapel Hill NC)
7 (Charlotte-Greensboro-Greenville-Raleigh)
2 (Southeast)
Fort Bragg 19 30 (Raleigh-Durham-Chapel Hill NC)
7 (Charlotte-Greensboro-Greenville-Raleigh)
2 (Southeast)
Fort Bragg/Camp McCall 19 30 (Raleigh-Durham-Chapel Hill NC)
7 (Charlotte-Greensboro-Greenville-Raleigh)
2 (Southeast)
Fort Lee 19 30 (Raleigh-Durham-Chapel Hill NC)
7 (Charlotte-Greensboro-Greenville-Raleigh)
2 (Southeast)
Fort Pickett 19 30 (Raleigh-Durham-Chapel Hill NC)
7 (Charlotte-Greensboro-Greenville-Raleigh)
2 (Southeast)
Greensboro 19 30 (Raleigh-Durham-Chapel Hill NC)
7 (Charlotte-Greensboro-Greenville-Raleigh)
2 (Southeast)
Joint Base Langley-Eustis 19 30 (Raleigh-Durham-Chapel Hill NC)
7 (Charlotte-Greensboro-Greenville-Raleigh)
2 (Southeast)
Morehead City 19 30 (Raleigh-Durham-Chapel Hill NC)
7 (Charlotte-Greensboro-Greenville-Raleigh)
2 (Southeast)
Portsmouth 19 30 (Raleigh-Durham-Chapel Hill NC)
7 (Charlotte-Greensboro-Greenville-Raleigh)
2 (Southeast)
St. Juliens Creek 19 30 (Raleigh-Durham-Chapel Hill NC)
7 (Charlotte-Greensboro-Greenville-Raleigh)
2 (Southeast)
Vacapes 19 30 (Raleigh-Durham-Chapel Hill NC)
7 (Charlotte-Greensboro-Greenville-Raleigh)
2 (Southeast)
Camp Guernsey 141 31 (Denver-Boulder CO-KS-NE) 33 (Denver) 5 (Central)
Fort Carson 141 31 (Denver-Boulder CO-KS-NE) 33 (Denver) 5 (Central)
Pinon Canyon 141 31 (Denver-Boulder CO-KS-NE) 33 (Denver) 5 (Central)
Bridgeport 153 32 (Las Vegas NV-AZ-UT) 44 (Los Angeles-San Diego) 6 (West)
Hawthorne 153 32 (Las Vegas NV-AZ-UT) 44 (Los Angeles-San Diego) 6 (West)

CSMAC WG-4 Final Report 40 July24, 2013
Location EA #
Median Rank
EA Name MEA #
MEA Name REAG #
REAG Name
NTC/Fort Irwin 153 32 (Las Vegas NV-AZ-UT) 44 (Los Angeles-San Diego) 6 (West)
Telegraph Pass 153 32 (Las Vegas NV-AZ-UT) 44 (Los Angeles-San Diego) 6 (West)
Twenty Nine Palms 153 32 (Las Vegas NV-AZ-UT) 44 (Los Angeles-San Diego) 6 (West)
Yuma Proving Grounds 153 32 (Las Vegas NV-AZ-UT) 44 (Los Angeles-San Diego) 6 (West)
Cincinnati 51 33 (Columbus OH) 14 (Columbus) 3 (Great Lakes)
Camp Blanding 29 34 (Jacksonville FL-GA) 9 (Jacksonville) 2 (Southeast)
Fort Stewart 29 34 (Jacksonville FL-GA) 9 (Jacksonville) 2 (Southeast)
Bridgeport 162 35 (Fresno CA) 43 (San Francisco-Oakland-San Jose)
6 (West)
Camp Roberts 162 35 (Fresno CA) 43 (San Francisco-Oakland-San Jose)
6 (West)
Fort Hunter Liggett 162 35 (Fresno CA) 43 (San Francisco-Oakland-San Jose)
6 (West)
Hawthorne 162 35 (Fresno CA) 43 (San Francisco-Oakland-San Jose)
6 (West)
NTC/Fort Irwin 162 35 (Fresno CA) 43 (San Francisco-Oakland-San Jose)
6 (West)
Joint Base Pearl Harbor-Hickam
172 37 (Honolulu HI) 48 (Hawaii) 8 (Hawaii)
Kaneohe 172 37 (Honolulu HI) 48 (Hawaii) 8 (Hawaii)
Kauai 172 37 (Honolulu HI) 48 (Hawaii) 8 (Hawaii)
Oahu 172 37 (Honolulu HI) 48 (Hawaii) 8 (Hawaii)
Pohakuloa Training Area (PTA)
172 37 (Honolulu HI) 48 (Hawaii) 8 (Hawaii)
Bridgeport 164 38 (Sacramento-Yolo CA) 43 (San Francisco-Oakland-San Jose)
6 (West)
Hawthorne 164 38 (Sacramento-Yolo CA) 43 (San Francisco-Oakland-San Jose)
6 (West)
Fort Sill 125 39 (Oklahoma City OK) 37 (Oklahoma City) 5 (Central)
Fort Campbell 73 40 (Memphis TN-AR-MS-KY) 26 (Memphis-Jackson) 4 (Mississippi Valley)
Redstone Arsenal 73 40 (Memphis TN-AR-MS-KY) 26 (Memphis-Jackson) 4 (Mississippi Valley)
Sand Ridge 73 40 (Memphis TN-AR-MS-KY) 26 (Memphis-Jackson) 4 (Mississippi Valley)
Camp Atterbury 70 41 (Louisville KY-IN) 23 (Louisville-Lexington-Evansville)
4 (Mississippi Valley)
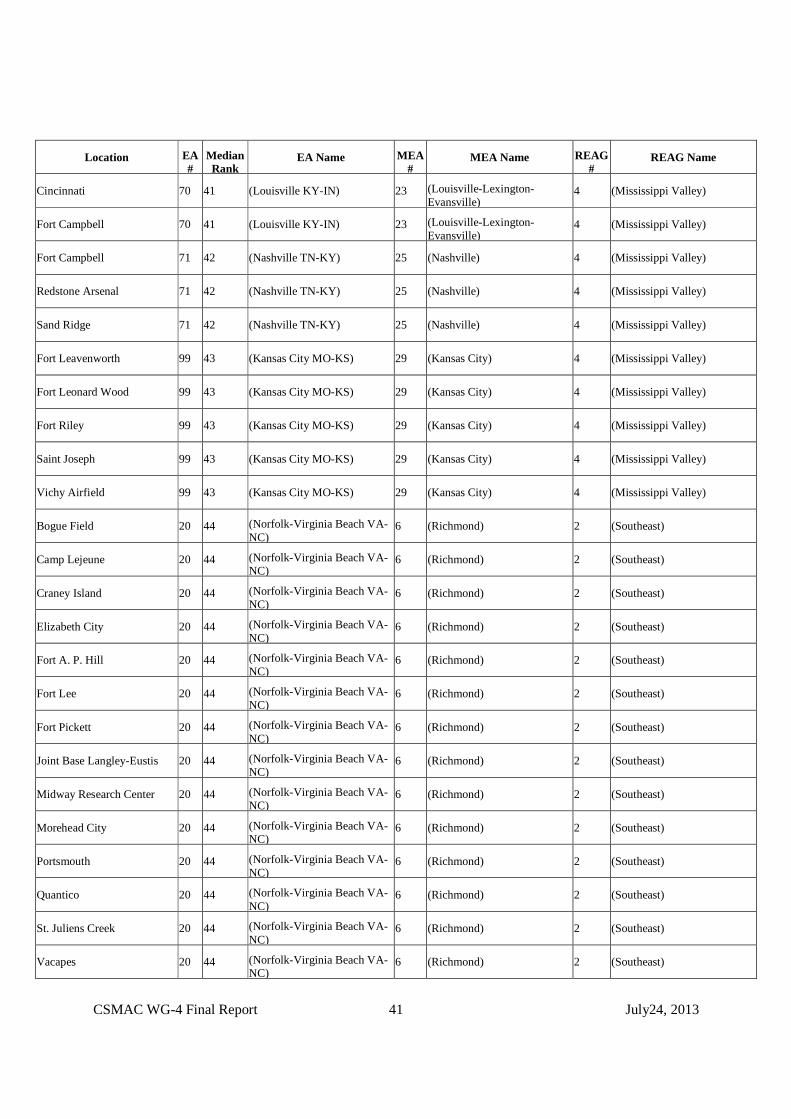
CSMAC WG-4 Final Report 41 July24, 2013
Location EA #
Median Rank
EA Name MEA #
MEA Name REAG #
REAG Name
Cincinnati 70 41 (Louisville KY-IN) 23 (Louisville-Lexington-Evansville)
4 (Mississippi Valley)
Fort Campbell 70 41 (Louisville KY-IN) 23 (Louisville-Lexington-Evansville)
4 (Mississippi Valley)
Fort Campbell 71 42 (Nashville TN-KY) 25 (Nashville) 4 (Mississippi Valley)
Redstone Arsenal 71 42 (Nashville TN-KY) 25 (Nashville) 4 (Mississippi Valley)
Sand Ridge 71 42 (Nashville TN-KY) 25 (Nashville) 4 (Mississippi Valley)
Fort Leavenworth 99 43 (Kansas City MO-KS) 29 (Kansas City) 4 (Mississippi Valley)
Fort Leonard Wood 99 43 (Kansas City MO-KS) 29 (Kansas City) 4 (Mississippi Valley)
Fort Riley 99 43 (Kansas City MO-KS) 29 (Kansas City) 4 (Mississippi Valley)
Saint Joseph 99 43 (Kansas City MO-KS) 29 (Kansas City) 4 (Mississippi Valley)
Vichy Airfield 99 43 (Kansas City MO-KS) 29 (Kansas City) 4 (Mississippi Valley)
Bogue Field 20 44 (Norfolk-Virginia Beach VA-NC)
6 (Richmond) 2 (Southeast)
Camp Lejeune 20 44 (Norfolk-Virginia Beach VA-NC)
6 (Richmond) 2 (Southeast)
Craney Island 20 44 (Norfolk-Virginia Beach VA-NC)
6 (Richmond) 2 (Southeast)
Elizabeth City 20 44 (Norfolk-Virginia Beach VA-NC)
6 (Richmond) 2 (Southeast)
Fort A. P. Hill 20 44 (Norfolk-Virginia Beach VA-NC)
6 (Richmond) 2 (Southeast)
Fort Lee 20 44 (Norfolk-Virginia Beach VA-NC)
6 (Richmond) 2 (Southeast)
Fort Pickett 20 44 (Norfolk-Virginia Beach VA-NC)
6 (Richmond) 2 (Southeast)
Joint Base Langley-Eustis 20 44 (Norfolk-Virginia Beach VA-NC)
6 (Richmond) 2 (Southeast)
Midway Research Center 20 44 (Norfolk-Virginia Beach VA-NC)
6 (Richmond) 2 (Southeast)
Morehead City 20 44 (Norfolk-Virginia Beach VA-NC)
6 (Richmond) 2 (Southeast)
Portsmouth 20 44 (Norfolk-Virginia Beach VA-NC)
6 (Richmond) 2 (Southeast)
Quantico 20 44 (Norfolk-Virginia Beach VA-NC)
6 (Richmond) 2 (Southeast)
St. Juliens Creek 20 44 (Norfolk-Virginia Beach VA-NC)
6 (Richmond) 2 (Southeast)
Vacapes 20 44 (Norfolk-Virginia Beach VA-NC)
6 (Richmond) 2 (Southeast)

CSMAC WG-4 Final Report 42 July24, 2013
Location EA #
Median Rank
EA Name MEA #
MEA Name REAG #
REAG Name
Joint Base Lewis-McChord 167 45 (Portland-Salem OR-WA) 45 (Portland) 6 (West)
Yakima Firing Center 167 45 (Portland-Salem OR-WA) 45 (Portland) 6 (West)
Yakima Training Area 167 45 (Portland-Salem OR-WA) 45 (Portland) 6 (West)
Fort Indiantown GAP 8 46 (Buffalo-Niagara Falls NY-PA)
3 (Buffalo) 1 (Northeast)
Fort Benning 78 47 (Birmingham AL) 24 (Birmingham) 4 (Mississippi Valley)
Redstone Arsenal 78 47 (Birmingham AL) 24 (Birmingham) 4 (Mississippi Valley)
Fort Bragg 18 49 (Greensboro-Winston-Salem NC-VA)
7 (Charlotte-Greensboro-Greenville-Raleigh)
2 (Southeast)
Fort Bragg/Camp McCall 18 49 (Greensboro-Winston-Salem NC-VA)
7 (Charlotte-Greensboro-Greenville-Raleigh)
2 (Southeast)
Fort Jackson 18 49 (Greensboro-Winston-Salem NC-VA)
7 (Charlotte-Greensboro-Greenville-Raleigh)
2 (Southeast)
Fort Pickett 18 49 (Greensboro-Winston-Salem NC-VA)
7 (Charlotte-Greensboro-Greenville-Raleigh)
2 (Southeast)
Greensboro 18 49 (Greensboro-Winston-Salem NC-VA)
7 (Charlotte-Greensboro-Greenville-Raleigh)
2 (Southeast)
Camp Atterbury 50 51 (Dayton-Springfield OH) 13 (Cincinnati-Dayton) 3 (Great Lakes)
Cincinnati 50 51 (Dayton-Springfield OH) 13 (Cincinnati-Dayton) 3 (Great Lakes)
Grissom 50 51 (Dayton-Springfield OH) 13 (Cincinnati-Dayton) 3 (Great Lakes)
Fort Huachuca 159 52 (Tucson AZ) 40 (Phoenix) 5 (Central)
Telegraph Pass 159 52 (Tucson AZ) 40 (Phoenix) 5 (Central)
Yuma Proving Grounds 159 52 (Tucson AZ) 40 (Phoenix) 5 (Central)
Fort Leavenworth 118 54 (Omaha NE-IA-MO) 34 (Omaha) 5 (Central)
Saint Joseph 118 54 (Omaha NE-IA-MO) 34 (Omaha) 5 (Central)
Camp Shelby 84 55 (Baton Rouge LA-MS) 27 (New Orleans-Baton Rouge) 4 (Mississippi Valley)
England Industrial Park 84 55 (Baton Rouge LA-MS) 27 (New Orleans-Baton Rouge) 4 (Mississippi Valley)
Fort Polk 84 55 (Baton Rouge LA-MS) 27 (New Orleans-Baton Rouge) 4 (Mississippi Valley)
JRTC (Fort Polk North) 84 55 (Baton Rouge LA-MS) 27 (New Orleans-Baton Rouge) 4 (Mississippi Valley)
Craney Island 15 56 (Richmond-Petersburg VA) 6 (Richmond) 2 (Southeast)

CSMAC WG-4 Final Report 43 July24, 2013
Location EA #
Median Rank
EA Name MEA #
MEA Name REAG #
REAG Name
Elizabeth City 15 56 (Richmond-Petersburg VA) 6 (Richmond) 2 (Southeast)
Fort A. P. Hill 15 56 (Richmond-Petersburg VA) 6 (Richmond) 2 (Southeast)
Fort Lee 15 56 (Richmond-Petersburg VA) 6 (Richmond) 2 (Southeast)
Fort Pickett 15 56 (Richmond-Petersburg VA) 6 (Richmond) 2 (Southeast)
Greensboro 15 56 (Richmond-Petersburg VA) 6 (Richmond) 2 (Southeast)
Joint Base Langley-Eustis 15 56 (Richmond-Petersburg VA) 6 (Richmond) 2 (Southeast)
Midway Research Center 15 56 (Richmond-Petersburg VA) 6 (Richmond) 2 (Southeast)
Portsmouth 15 56 (Richmond-Petersburg VA) 6 (Richmond) 2 (Southeast)
Quantico 15 56 (Richmond-Petersburg VA) 6 (Richmond) 2 (Southeast)
St. Juliens Creek 15 56 (Richmond-Petersburg VA) 6 (Richmond) 2 (Southeast)
Vacapes 15 56 (Richmond-Petersburg VA) 6 (Richmond) 2 (Southeast)
Fort Gordon 41 57 (Greenville-Spartanburg SC-NC)
7 (Charlotte-Greensboro-Greenville-Raleigh)
2 (Southeast)
Fort Jackson 41 57 (Greenville-Spartanburg SC-NC)
7 (Charlotte-Greensboro-Greenville-Raleigh)
2 (Southeast)
Fort Drum 7 58 (Rochester NY-PA) 2 (New York City) 1 (Northeast)
Fort Indiantown GAP 7 58 (Rochester NY-PA) 2 (New York City) 1 (Northeast)
Fort Bliss 157 59 (El Paso TX-NM) 39 (El Paso-Albuquerque) 5 (Central)
McGregor 157 59 (El Paso TX-NM) 39 (El Paso-Albuquerque) 5 (Central)
White Sands Missile Range 157 59 (El Paso TX-NM) 39 (El Paso-Albuquerque) 5 (Central)
Fort Leavenworth 124 60 (Tulsa OK-KS) 36 (Tulsa) 5 (Central)
Fort Riley 124 60 (Tulsa OK-KS) 36 (Tulsa) 5 (Central)
Ft Chaffee 124 60 (Tulsa OK-KS) 36 (Tulsa) 5 (Central)
Fort McCoy 104 61 (Madison WI-IL-IA) 17 (Milwaukee) 3 (Great Lakes)
Fox Lake 104 61 (Madison WI-IL-IA) 17 (Milwaukee) 3 (Great Lakes)
Great Lakes 104 61 (Madison WI-IL-IA) 17 (Milwaukee) 3 (Great Lakes)

CSMAC WG-4 Final Report 44 July24, 2013
Location EA #
Median Rank
EA Name MEA #
MEA Name REAG #
REAG Name
Two Rivers 104 61 (Madison WI-IL-IA) 17 (Milwaukee) 3 (Great Lakes)
Orchard Park 150 62 (Boise City ID-OR) 42 (Salt Lake City) 6 (West)
Fort Bragg 24 63 (Columbia SC) 7 (Charlotte-Greensboro-Greenville-Raleigh)
2 (Southeast)
Fort Bragg/Camp McCall 24 63 (Columbia SC) 7 (Charlotte-Greensboro-Greenville-Raleigh)
2 (Southeast)
Fort Gordon 24 63 (Columbia SC) 7 (Charlotte-Greensboro-Greenville-Raleigh)
2 (Southeast)
Fort Jackson 24 63 (Columbia SC) 7 (Charlotte-Greensboro-Greenville-Raleigh)
2 (Southeast)
Joint Base Charleston 24 63 (Columbia SC) 7 (Charlotte-Greensboro-Greenville-Raleigh)
2 (Southeast)
Fort Leonard Wood 90 64 (Little Rock AR) 28 (Little Rock) 4 (Mississippi Valley)
Ft Chaffee 90 64 (Little Rock AR) 28 (Little Rock) 4 (Mississippi Valley)
Fort Gordon 26 65 (Charleston-North Charleston SC)
7 (Charlotte-Greensboro-Greenville-Raleigh)
2 (Southeast)
Fort Jackson 26 65 (Charleston-North Charleston SC)
7 (Charlotte-Greensboro-Greenville-Raleigh)
2 (Southeast)
Fort Stewart 26 65 (Charleston-North Charleston SC)
7 (Charlotte-Greensboro-Greenville-Raleigh)
2 (Southeast)
Joint Base Charleston 26 65 (Charleston-North Charleston SC)
7 (Charlotte-Greensboro-Greenville-Raleigh)
2 (Southeast)
Fort Riley 122 67 (Wichita KS-OK) 35 (Wichita) 4 (Mississippi Valley)
Pinon Canyon 122 67 (Wichita KS-OK) 35 (Wichita) 4 (Mississippi Valley)
Fort Leavenworth 119 68 (Lincoln NE) 34 (Omaha) 5 (Central)
Fort Riley 119 68 (Lincoln NE) 34 (Omaha) 5 (Central)
Saint Joseph 119 68 (Lincoln NE) 34 (Omaha) 5 (Central)
Fort Bliss 156 69 (Albuquerque NM-AZ) 39 (El Paso-Albuquerque) 5 (Central)
McGregor 156 69 (Albuquerque NM-AZ) 39 (El Paso-Albuquerque) 5 (Central)
White Sands Missile Range 156 69 (Albuquerque NM-AZ) 39 (El Paso-Albuquerque) 5 (Central)
Fort Drum 6 70 (Syracuse NY-PA) 2 (New York City) 1 (Northeast)
Fort Indiantown GAP 6 70 (Syracuse NY-PA) 2 (New York City) 1 (Northeast)
Cincinnati 56 71 (Toledo OH) 16 (Detroit) 3 (Great Lakes)
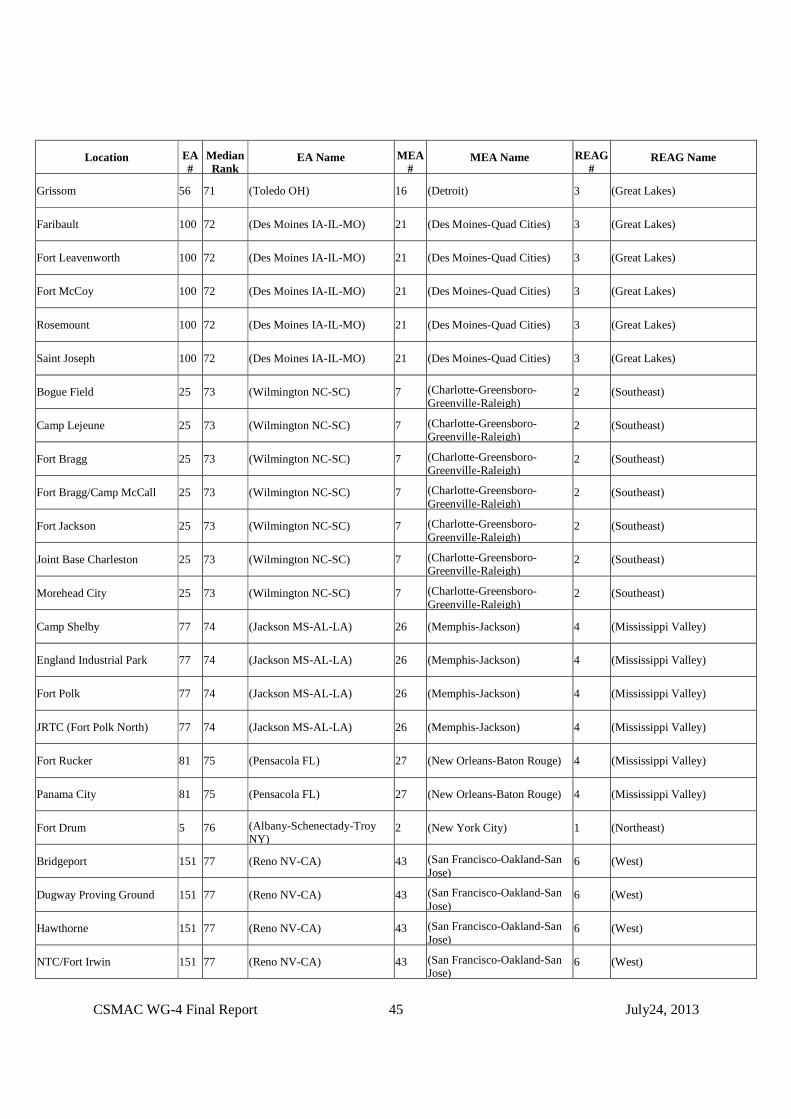
CSMAC WG-4 Final Report 45 July24, 2013
Location EA #
Median Rank
EA Name MEA #
MEA Name REAG #
REAG Name
Grissom 56 71 (Toledo OH) 16 (Detroit) 3 (Great Lakes)
Faribault 100 72 (Des Moines IA-IL-MO) 21 (Des Moines-Quad Cities) 3 (Great Lakes)
Fort Leavenworth 100 72 (Des Moines IA-IL-MO) 21 (Des Moines-Quad Cities) 3 (Great Lakes)
Fort McCoy 100 72 (Des Moines IA-IL-MO) 21 (Des Moines-Quad Cities) 3 (Great Lakes)
Rosemount 100 72 (Des Moines IA-IL-MO) 21 (Des Moines-Quad Cities) 3 (Great Lakes)
Saint Joseph 100 72 (Des Moines IA-IL-MO) 21 (Des Moines-Quad Cities) 3 (Great Lakes)
Bogue Field 25 73 (Wilmington NC-SC) 7 (Charlotte-Greensboro-Greenville-Raleigh)
2 (Southeast)
Camp Lejeune 25 73 (Wilmington NC-SC) 7 (Charlotte-Greensboro-Greenville-Raleigh)
2 (Southeast)
Fort Bragg 25 73 (Wilmington NC-SC) 7 (Charlotte-Greensboro-Greenville-Raleigh)
2 (Southeast)
Fort Bragg/Camp McCall 25 73 (Wilmington NC-SC) 7 (Charlotte-Greensboro-Greenville-Raleigh)
2 (Southeast)
Fort Jackson 25 73 (Wilmington NC-SC) 7 (Charlotte-Greensboro-Greenville-Raleigh)
2 (Southeast)
Joint Base Charleston 25 73 (Wilmington NC-SC) 7 (Charlotte-Greensboro-Greenville-Raleigh)
2 (Southeast)
Morehead City 25 73 (Wilmington NC-SC) 7 (Charlotte-Greensboro-Greenville-Raleigh)
2 (Southeast)
Camp Shelby 77 74 (Jackson MS-AL-LA) 26 (Memphis-Jackson) 4 (Mississippi Valley)
England Industrial Park 77 74 (Jackson MS-AL-LA) 26 (Memphis-Jackson) 4 (Mississippi Valley)
Fort Polk 77 74 (Jackson MS-AL-LA) 26 (Memphis-Jackson) 4 (Mississippi Valley)
JRTC (Fort Polk North) 77 74 (Jackson MS-AL-LA) 26 (Memphis-Jackson) 4 (Mississippi Valley)
Fort Rucker 81 75 (Pensacola FL) 27 (New Orleans-Baton Rouge) 4 (Mississippi Valley)
Panama City 81 75 (Pensacola FL) 27 (New Orleans-Baton Rouge) 4 (Mississippi Valley)
Fort Drum 5 76 (Albany-Schenectady-Troy NY)
2 (New York City) 1 (Northeast)
Bridgeport 151 77 (Reno NV-CA) 43 (San Francisco-Oakland-San Jose)
6 (West)
Dugway Proving Ground 151 77 (Reno NV-CA) 43 (San Francisco-Oakland-San Jose)
6 (West)
Hawthorne 151 77 (Reno NV-CA) 43 (San Francisco-Oakland-San Jose)
6 (West)
NTC/Fort Irwin 151 77 (Reno NV-CA) 43 (San Francisco-Oakland-San Jose)
6 (West)

CSMAC WG-4 Final Report 46 July24, 2013
Location EA #
Median Rank
EA Name MEA #
MEA Name REAG #
REAG Name
Twenty Nine Palms 151 77 (Reno NV-CA) 43 (San Francisco-Oakland-San Jose)
6 (West)
Fort McCoy 59 78 (Green Bay WI-MI) 17 (Milwaukee) 3 (Great Lakes)
Two Rivers 59 78 (Green Bay WI-MI) 17 (Milwaukee) 3 (Great Lakes)
Camp Grayling 62 79 (Grand Rapids-Muskegon MI) 16 (Detroit) 3 (Great Lakes)
Fox Lake 62 79 (Grand Rapids-Muskegon MI) 16 (Detroit) 3 (Great Lakes)
Great Lakes 62 79 (Grand Rapids-Muskegon MI) 16 (Detroit) 3 (Great Lakes)
Grissom 62 79 (Grand Rapids-Muskegon MI) 16 (Detroit) 3 (Great Lakes)
Two Rivers 62 79 (Grand Rapids-Muskegon MI) 16 (Detroit) 3 (Great Lakes)
England Industrial Park 85 80 (Lafayette LA) 27 (New Orleans-Baton Rouge) 4 (Mississippi Valley)
Fort Polk 85 80 (Lafayette LA) 27 (New Orleans-Baton Rouge) 4 (Mississippi Valley)
JRTC (Fort Polk North) 85 80 (Lafayette LA) 27 (New Orleans-Baton Rouge) 4 (Mississippi Valley)
Camp Shelby 80 81 (Mobile AL) 27 (New Orleans-Baton Rouge) 4 (Mississippi Valley)
Fort Rucker 80 81 (Mobile AL) 27 (New Orleans-Baton Rouge) 4 (Mississippi Valley)
Panama City 80 81 (Mobile AL) 27 (New Orleans-Baton Rouge) 4 (Mississippi Valley)
Sand Ridge 97 83 (Springfield IL-MO) 18 (Chicago) 3 (Great Lakes)
Vichy Airfield 97 83 (Springfield IL-MO) 18 (Chicago) 3 (Great Lakes)
Bogue Field 21 85 (Greenville NC) 7 (Charlotte-Greensboro-Greenville-Raleigh)
2 (Southeast)
Camp Lejeune 21 85 (Greenville NC) 7 (Charlotte-Greensboro-Greenville-Raleigh)
2 (Southeast)
Craney Island 21 85 (Greenville NC) 7 (Charlotte-Greensboro-Greenville-Raleigh)
2 (Southeast)
Elizabeth City 21 85 (Greenville NC) 7 (Charlotte-Greensboro-Greenville-Raleigh)
2 (Southeast)
Fort Bragg 21 85 (Greenville NC) 7 (Charlotte-Greensboro-Greenville-Raleigh)
2 (Southeast)
Fort Bragg/Camp McCall 21 85 (Greenville NC) 7 (Charlotte-Greensboro-Greenville-Raleigh)
2 (Southeast)
Fort Lee 21 85 (Greenville NC) 7 (Charlotte-Greensboro-Greenville-Raleigh)
2 (Southeast)
Fort Pickett 21 85 (Greenville NC) 7 (Charlotte-Greensboro-Greenville-Raleigh)
2 (Southeast)

CSMAC WG-4 Final Report 47 July24, 2013
Location EA #
Median Rank
EA Name MEA #
MEA Name REAG #
REAG Name
Joint Base Langley-Eustis 21 85 (Greenville NC) 7 (Charlotte-Greensboro-Greenville-Raleigh)
2 (Southeast)
Morehead City 21 85 (Greenville NC) 7 (Charlotte-Greensboro-Greenville-Raleigh)
2 (Southeast)
Portsmouth 21 85 (Greenville NC) 7 (Charlotte-Greensboro-Greenville-Raleigh)
2 (Southeast)
St. Juliens Creek 21 85 (Greenville NC) 7 (Charlotte-Greensboro-Greenville-Raleigh)
2 (Southeast)
Vacapes 21 85 (Greenville NC) 7 (Charlotte-Greensboro-Greenville-Raleigh)
2 (Southeast)
Camp Atterbury 68 86 (Champaign-Urbana IL) 18 (Chicago) 3 (Great Lakes)
Great Lakes 68 86 (Champaign-Urbana IL) 18 (Chicago) 3 (Great Lakes)
Grissom 68 86 (Champaign-Urbana IL) 18 (Chicago) 3 (Great Lakes)
Sand Ridge 68 86 (Champaign-Urbana IL) 18 (Chicago) 3 (Great Lakes)
Aberdeen Proving Ground 11 87 (Harrisburg-Lebanon-Carlisle PA)
4 (Philadelphia) 1 (Northeast)
Fort Indiantown GAP 11 87 (Harrisburg-Lebanon-Carlisle PA)
4 (Philadelphia) 1 (Northeast)
Letterkenny 11 87 (Harrisburg-Lebanon-Carlisle PA)
4 (Philadelphia) 1 (Northeast)
Midway Research Center 11 87 (Harrisburg-Lebanon-Carlisle PA)
4 (Philadelphia) 1 (Northeast)
Quantico 11 87 (Harrisburg-Lebanon-Carlisle PA)
4 (Philadelphia) 1 (Northeast)
Fort Leonard Wood 94 88 (Springfield MO) 30 (St. Louis) 4 (Mississippi Valley)
Ft Chaffee 94 88 (Springfield MO) 30 (St. Louis) 4 (Mississippi Valley)
Vichy Airfield 94 88 (Springfield MO) 30 (St. Louis) 4 (Mississippi Valley)
Camp Blanding 35 89 (Tallahassee FL-GA) 9 (Jacksonville) 2 (Southeast)
Fort Benning 35 89 (Tallahassee FL-GA) 9 (Jacksonville) 2 (Southeast)
Fort Rucker 35 89 (Tallahassee FL-GA) 9 (Jacksonville) 2 (Southeast)
Panama City 35 89 (Tallahassee FL-GA) 9 (Jacksonville) 2 (Southeast)
Ft Chaffee 92 90 (Fayetteville AR-MO-OK) 28 (Little Rock) 4 (Mississippi Valley)
Fort Gordon 28 91 (Savannah GA-SC) 8 (Atlanta) 2 (Southeast)
Fort Jackson 28 91 (Savannah GA-SC) 8 (Atlanta) 2 (Southeast)
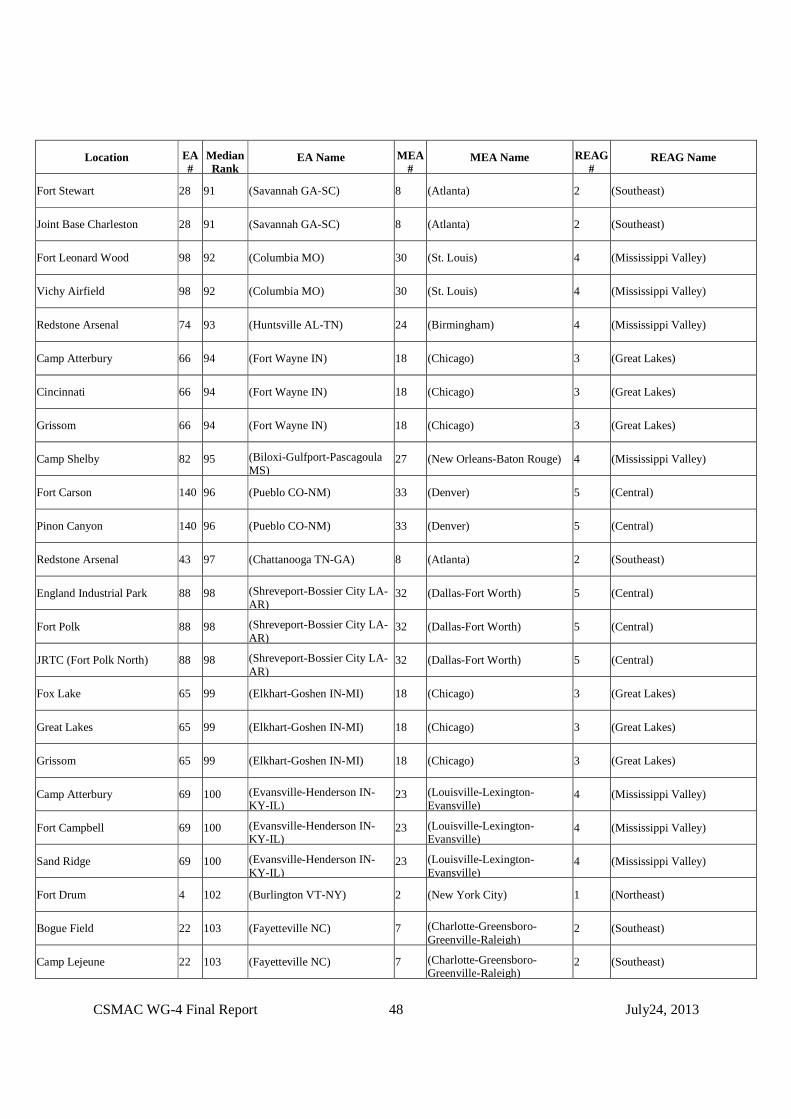
CSMAC WG-4 Final Report 48 July24, 2013
Location EA #
Median Rank
EA Name MEA #
MEA Name REAG #
REAG Name
Fort Stewart 28 91 (Savannah GA-SC) 8 (Atlanta) 2 (Southeast)
Joint Base Charleston 28 91 (Savannah GA-SC) 8 (Atlanta) 2 (Southeast)
Fort Leonard Wood 98 92 (Columbia MO) 30 (St. Louis) 4 (Mississippi Valley)
Vichy Airfield 98 92 (Columbia MO) 30 (St. Louis) 4 (Mississippi Valley)
Redstone Arsenal 74 93 (Huntsville AL-TN) 24 (Birmingham) 4 (Mississippi Valley)
Camp Atterbury 66 94 (Fort Wayne IN) 18 (Chicago) 3 (Great Lakes)
Cincinnati 66 94 (Fort Wayne IN) 18 (Chicago) 3 (Great Lakes)
Grissom 66 94 (Fort Wayne IN) 18 (Chicago) 3 (Great Lakes)
Camp Shelby 82 95 (Biloxi-Gulfport-Pascagoula MS)
27 (New Orleans-Baton Rouge) 4 (Mississippi Valley)
Fort Carson 140 96 (Pueblo CO-NM) 33 (Denver) 5 (Central)
Pinon Canyon 140 96 (Pueblo CO-NM) 33 (Denver) 5 (Central)
Redstone Arsenal 43 97 (Chattanooga TN-GA) 8 (Atlanta) 2 (Southeast)
England Industrial Park 88 98 (Shreveport-Bossier City LA-AR)
32 (Dallas-Fort Worth) 5 (Central)
Fort Polk 88 98 (Shreveport-Bossier City LA-AR)
32 (Dallas-Fort Worth) 5 (Central)
JRTC (Fort Polk North) 88 98 (Shreveport-Bossier City LA-AR)
32 (Dallas-Fort Worth) 5 (Central)
Fox Lake 65 99 (Elkhart-Goshen IN-MI) 18 (Chicago) 3 (Great Lakes)
Great Lakes 65 99 (Elkhart-Goshen IN-MI) 18 (Chicago) 3 (Great Lakes)
Grissom 65 99 (Elkhart-Goshen IN-MI) 18 (Chicago) 3 (Great Lakes)
Camp Atterbury 69 100 (Evansville-Henderson IN-KY-IL)
23 (Louisville-Lexington-Evansville)
4 (Mississippi Valley)
Fort Campbell 69 100 (Evansville-Henderson IN-KY-IL)
23 (Louisville-Lexington-Evansville)
4 (Mississippi Valley)
Sand Ridge 69 100 (Evansville-Henderson IN-KY-IL)
23 (Louisville-Lexington-Evansville)
4 (Mississippi Valley)
Fort Drum 4 102 (Burlington VT-NY) 2 (New York City) 1 (Northeast)
Bogue Field 22 103 (Fayetteville NC) 7 (Charlotte-Greensboro-Greenville-Raleigh)
2 (Southeast)
Camp Lejeune 22 103 (Fayetteville NC) 7 (Charlotte-Greensboro-Greenville-Raleigh)
2 (Southeast)

CSMAC WG-4 Final Report 49 July24, 2013
Location EA #
Median Rank
EA Name MEA #
MEA Name REAG #
REAG Name
Fort Bragg 22 103 (Fayetteville NC) 7 (Charlotte-Greensboro-Greenville-Raleigh)
2 (Southeast)
Fort Bragg/Camp McCall 22 103 (Fayetteville NC) 7 (Charlotte-Greensboro-Greenville-Raleigh)
2 (Southeast)
Fort Jackson 22 103 (Fayetteville NC) 7 (Charlotte-Greensboro-Greenville-Raleigh)
2 (Southeast)
Greensboro 22 103 (Fayetteville NC) 7 (Charlotte-Greensboro-Greenville-Raleigh)
2 (Southeast)
Morehead City 22 103 (Fayetteville NC) 7 (Charlotte-Greensboro-Greenville-Raleigh)
2 (Southeast)
England Industrial Park 87 104 (Beaumont-Port Arthur TX) 31 (Houston) 5 (Central)
Fort Polk 87 104 (Beaumont-Port Arthur TX) 31 (Houston) 5 (Central)
JRTC (Fort Polk North) 87 104 (Beaumont-Port Arthur TX) 31 (Houston) 5 (Central)
Fort McCoy 60 105 (Appleton-Oshkosh-Neenah WI)
17 (Milwaukee) 3 (Great Lakes)
Two Rivers 60 105 (Appleton-Oshkosh-Neenah WI)
17 (Milwaukee) 3 (Great Lakes)
Fort Benning 39 106 (Columbus GA-AL) 8 (Atlanta) 2 (Southeast)
Fort Rucker 39 106 (Columbus GA-AL) 8 (Atlanta) 2 (Southeast)
Redstone Arsenal 39 106 (Columbus GA-AL) 8 (Atlanta) 2 (Southeast)
Pinon Canyon 139 108 (Santa Fe NM) 39 (El Paso-Albuquerque) 5 (Central)
Yakima Firing Center 147 109 (Spokane WA-ID) 41 (Spokane-Billings) 6 (West)
Yakima Training Area 147 109 (Spokane WA-ID) 41 (Spokane-Billings) 6 (West)
England Industrial Park 89 111 (Monroe LA) 32 (Dallas-Fort Worth) 5 (Central)
Fort Polk 89 111 (Monroe LA) 32 (Dallas-Fort Worth) 5 (Central)
JRTC (Fort Polk North) 89 111 (Monroe LA) 32 (Dallas-Fort Worth) 5 (Central)
Fort Gordon 27 112 (Augusta-Aiken GA-SC) 8 (Atlanta) 2 (Southeast)
Fort Jackson 27 112 (Augusta-Aiken GA-SC) 8 (Atlanta) 2 (Southeast)
Fort Stewart 27 112 (Augusta-Aiken GA-SC) 8 (Atlanta) 2 (Southeast)
Joint Base Charleston 27 112 (Augusta-Aiken GA-SC) 8 (Atlanta) 2 (Southeast)
Fort Benning 79 114 (Montgomery AL) 24 (Birmingham) 4 (Mississippi Valley)

CSMAC WG-4 Final Report 50 July24, 2013
Location EA #
Median Rank
EA Name MEA #
MEA Name REAG #
REAG Name
Fort Rucker 79 114 (Montgomery AL) 24 (Birmingham) 4 (Mississippi Valley)
Camp Atterbury 47 116 (Lexington KY-TN-VA-WV) 23 (Louisville-Lexington-Evansville)
4 (Mississippi Valley)
Cincinnati 47 116 (Lexington KY-TN-VA-WV) 23 (Louisville-Lexington-Evansville)
4 (Mississippi Valley)
Greensboro 47 116 (Lexington KY-TN-VA-WV) 23 (Louisville-Lexington-Evansville)
4 (Mississippi Valley)
Fort Bragg/Camp McCall 46 117 (Hickory-Morganton NC-TN) 7 (Charlotte-Greensboro-Greenville-Raleigh)
4 (Mississippi Valley)
Greensboro 46 117 (Hickory-Morganton NC-TN) 7 (Charlotte-Greensboro-Greenville-Raleigh)
4 (Mississippi Valley)
Fort Bliss 136 118 (Hobbs NM-TX) 39 (El Paso-Albuquerque) 5 (Central)
McGregor 136 118 (Hobbs NM-TX) 39 (El Paso-Albuquerque) 5 (Central)
White Sands Missile Range 136 118 (Hobbs NM-TX) 39 (El Paso-Albuquerque) 5 (Central)
Telegraph Pass 154 119 (Flagstaff AZ-UT) 40 (Phoenix) 5 (Central)
Yuma Proving Grounds 154 119 (Flagstaff AZ-UT) 40 (Phoenix) 5 (Central)
Aberdeen Proving Ground 14 122 (Salisbury MD-DE-VA) 5 (Washington) 2 (Southeast)
Craney Island 14 122 (Salisbury MD-DE-VA) 5 (Washington) 2 (Southeast)
Elizabeth City 14 122 (Salisbury MD-DE-VA) 5 (Washington) 2 (Southeast)
Fort A. P. Hill 14 122 (Salisbury MD-DE-VA) 5 (Washington) 2 (Southeast)
Fort Lee 14 122 (Salisbury MD-DE-VA) 5 (Washington) 2 (Southeast)
Joint Base Langley-Eustis 14 122 (Salisbury MD-DE-VA) 5 (Washington) 2 (Southeast)
Midway Research Center 14 122 (Salisbury MD-DE-VA) 5 (Washington) 2 (Southeast)
Portsmouth 14 122 (Salisbury MD-DE-VA) 5 (Washington) 2 (Southeast)
Quantico 14 122 (Salisbury MD-DE-VA) 5 (Washington) 2 (Southeast)
St. Juliens Creek 14 122 (Salisbury MD-DE-VA) 5 (Washington) 2 (Southeast)
Vacapes 14 122 (Salisbury MD-DE-VA) 5 (Washington) 2 (Southeast)
Fort Benning 38 123 (Macon GA) 8 (Atlanta) 2 (Southeast)
Fort Gordon 38 123 (Macon GA) 8 (Atlanta) 2 (Southeast)

CSMAC WG-4 Final Report 51 July24, 2013
Location EA #
Median Rank
EA Name MEA #
MEA Name REAG #
REAG Name
Fort Rucker 38 123 (Macon GA) 8 (Atlanta) 2 (Southeast)
Fort Stewart 38 123 (Macon GA) 8 (Atlanta) 2 (Southeast)
England Industrial Park 86 124 (Lake Charles LA) 31 (Houston) 5 (Central)
Fort Polk 86 124 (Lake Charles LA) 31 (Houston) 5 (Central)
JRTC (Fort Polk North) 86 124 (Lake Charles LA) 31 (Houston) 5 (Central)
Camp Mabry 129 125 (San Angelo TX) 32 (Dallas-Fort Worth) 5 (Central)
Fort Hood 129 125 (San Angelo TX) 32 (Dallas-Fort Worth) 5 (Central)
Orchard Park 148 126 (Idaho Falls ID-WY) 42 (Salt Lake City) 6 (West)
Fort Leavenworth 123 128 (Topeka KS) 29 (Kansas City) 5 (Central)
Fort Riley 123 128 (Topeka KS) 29 (Kansas City) 5 (Central)
Saint Joseph 123 128 (Topeka KS) 29 (Kansas City) 5 (Central)
Faribault 106 130 (Rochester MN-IA-WI) 20 (Minneapolis-St. Paul) 3 (Great Lakes)
Fort McCoy 106 130 (Rochester MN-IA-WI) 20 (Minneapolis-St. Paul) 3 (Great Lakes)
Rosemount 106 130 (Rochester MN-IA-WI) 20 (Minneapolis-St. Paul) 3 (Great Lakes)
Faribault 105 131 (La Crosse WI-MN) 17 (Milwaukee) 3 (Great Lakes)
Fort McCoy 105 131 (La Crosse WI-MN) 17 (Milwaukee) 3 (Great Lakes)
Rosemount 105 131 (La Crosse WI-MN) 17 (Milwaukee) 3 (Great Lakes)
Fort Sill 138 132 (Amarillo TX-NM) 32 (Dallas-Fort Worth) 5 (Central)
Pinon Canyon 138 132 (Amarillo TX-NM) 32 (Dallas-Fort Worth) 5 (Central)
Greensboro 45 134 (Johnson City-Kingsport TN-VA)
22 (Knoxville) 4 (Mississippi Valley)
Fort Benning 36 135 (Dothan AL-FL-GA) 24 (Birmingham) 4 (Mississippi Valley)
Fort Rucker 36 135 (Dothan AL-FL-GA) 24 (Birmingham) 4 (Mississippi Valley)
Panama City 36 135 (Dothan AL-FL-GA) 24 (Birmingham) 4 (Mississippi Valley)
Fort Indiantown GAP 9 136 (State College PA) 12 (Pittsburgh) 3 (Great Lakes)
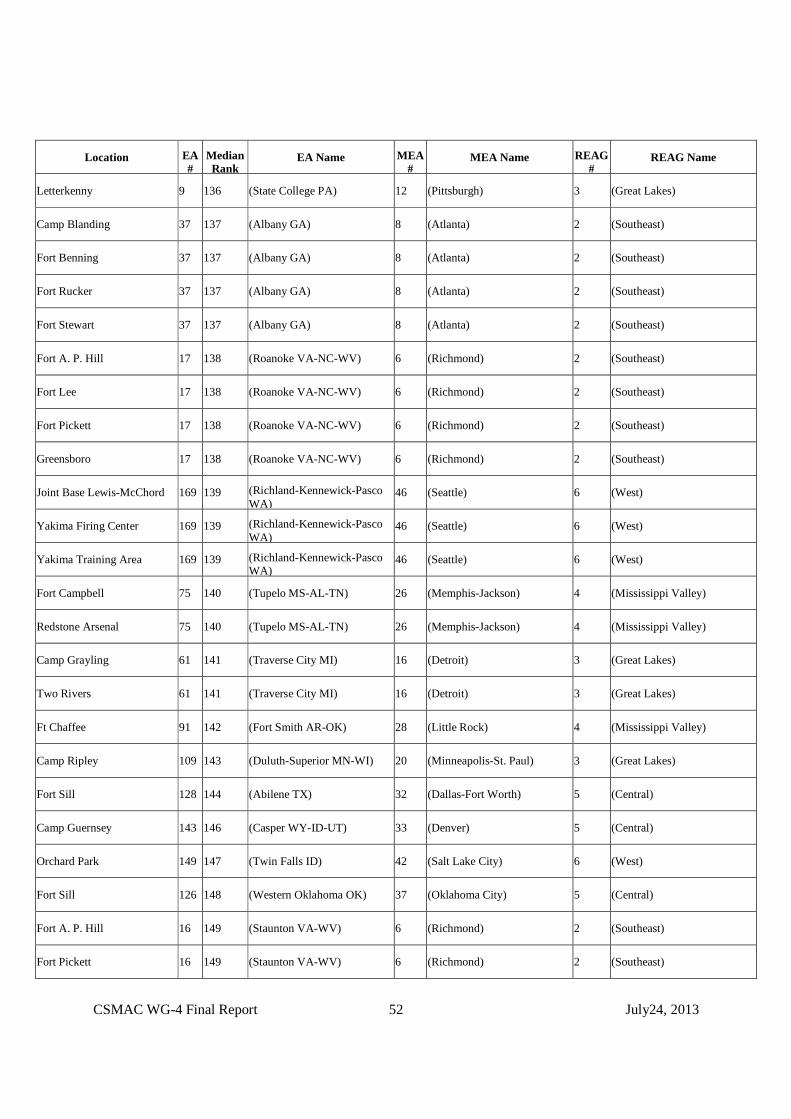
CSMAC WG-4 Final Report 52 July24, 2013
Location EA #
Median Rank
EA Name MEA #
MEA Name REAG #
REAG Name
Letterkenny 9 136 (State College PA) 12 (Pittsburgh) 3 (Great Lakes)
Camp Blanding 37 137 (Albany GA) 8 (Atlanta) 2 (Southeast)
Fort Benning 37 137 (Albany GA) 8 (Atlanta) 2 (Southeast)
Fort Rucker 37 137 (Albany GA) 8 (Atlanta) 2 (Southeast)
Fort Stewart 37 137 (Albany GA) 8 (Atlanta) 2 (Southeast)
Fort A. P. Hill 17 138 (Roanoke VA-NC-WV) 6 (Richmond) 2 (Southeast)
Fort Lee 17 138 (Roanoke VA-NC-WV) 6 (Richmond) 2 (Southeast)
Fort Pickett 17 138 (Roanoke VA-NC-WV) 6 (Richmond) 2 (Southeast)
Greensboro 17 138 (Roanoke VA-NC-WV) 6 (Richmond) 2 (Southeast)
Joint Base Lewis-McChord 169 139 (Richland-Kennewick-Pasco WA)
46 (Seattle) 6 (West)
Yakima Firing Center 169 139 (Richland-Kennewick-Pasco WA)
46 (Seattle) 6 (West)
Yakima Training Area 169 139 (Richland-Kennewick-Pasco WA)
46 (Seattle) 6 (West)
Fort Campbell 75 140 (Tupelo MS-AL-TN) 26 (Memphis-Jackson) 4 (Mississippi Valley)
Redstone Arsenal 75 140 (Tupelo MS-AL-TN) 26 (Memphis-Jackson) 4 (Mississippi Valley)
Camp Grayling 61 141 (Traverse City MI) 16 (Detroit) 3 (Great Lakes)
Two Rivers 61 141 (Traverse City MI) 16 (Detroit) 3 (Great Lakes)
Ft Chaffee 91 142 (Fort Smith AR-OK) 28 (Little Rock) 4 (Mississippi Valley)
Camp Ripley 109 143 (Duluth-Superior MN-WI) 20 (Minneapolis-St. Paul) 3 (Great Lakes)
Fort Sill 128 144 (Abilene TX) 32 (Dallas-Fort Worth) 5 (Central)
Camp Guernsey 143 146 (Casper WY-ID-UT) 33 (Denver) 5 (Central)
Orchard Park 149 147 (Twin Falls ID) 42 (Salt Lake City) 6 (West)
Fort Sill 126 148 (Western Oklahoma OK) 37 (Oklahoma City) 5 (Central)
Fort A. P. Hill 16 149 (Staunton VA-WV) 6 (Richmond) 2 (Southeast)
Fort Pickett 16 149 (Staunton VA-WV) 6 (Richmond) 2 (Southeast)

CSMAC WG-4 Final Report 53 July24, 2013
Location EA #
Median Rank
EA Name MEA #
MEA Name REAG #
REAG Name
Midway Research Center 16 149 (Staunton VA-WV) 6 (Richmond) 2 (Southeast)
Quantico 16 149 (Staunton VA-WV) 6 (Richmond) 2 (Southeast)
Cincinnati 48 150 (Charleston WV-KY-OH) 13 (Cincinnati-Dayton) 3 (Great Lakes)
Camp Ripley 116 151 (Sioux Falls SD-IA-MN-NE) 20 (Minneapolis-St. Paul) 3 (Great Lakes)
Camp Ripley 113 152 (Fargo-Moorhead ND-MN) 20 (Minneapolis-St. Paul) 3 (Great Lakes)
Fort Leonard Wood 95 153 (Jonesboro AR-MO) 28 (Little Rock) 4 (Mississippi Valley)
Sand Ridge 95 153 (Jonesboro AR-MO) 28 (Little Rock) 4 (Mississippi Valley)
Fort McCoy 108 154 (Wausau WI) 17 (Milwaukee) 3 (Great Lakes)
Two Rivers 108 154 (Wausau WI) 17 (Milwaukee) 3 (Great Lakes)
Fox Lake 102 155 (Davenport-Moline IA-IL) 21 (Des Moines-Quad Cities) 3 (Great Lakes)
Camp Guernsey 142 156 (Scottsbluff NE-WY) 33 (Denver) 5 (Central)
Orchard Park 168 159 (Pendleton OR-WA) 41 (Spokane-Billings) 6 (West)
Yakima Firing Center 168 159 (Pendleton OR-WA) 41 (Spokane-Billings) 6 (West)
Yakima Training Area 168 159 (Pendleton OR-WA) 41 (Spokane-Billings) 6 (West)
Camp Guernsey 115 160 (Rapid City SD-MT-NE-ND) 33 (Denver) 5 (Central)
Fort Campbell 72 165 (Paducah KY-IL) 23 (Louisville-Lexington-Evansville)
4 (Mississippi Valley)
Sand Ridge 72 165 (Paducah KY-IL) 23 (Louisville-Lexington-Evansville)
4 (Mississippi Valley)
Fort Greely 171 166 (Anchorage AK) 47 (Alaska) 7 (Alaska)
Fort Wainwright 171 166 (Anchorage AK) 47 (Alaska) 7 (Alaska)
Joint Base Elmendorf-Richardson
171 166 (Anchorage AK) 47 (Alaska) 7 (Alaska)
Yukon Range 171 166 (Anchorage AK) 47 (Alaska) 7 (Alaska)
Fort Riley 120 167 (Grand Island NE) 34 (Omaha) 5 (Central)
Camp Grayling 58 169 (Northern Michigan MI) 16 (Detroit) 3 (Great Lakes)
Apra Harbor 173 174 (Guam-Northern Mariana Islands)
49 (Guam-Northern Mariana Islands)
9 (Guam-Northern Mariana Isl.)

CSMAC WG-4 Final Report 54 July24, 2013
Location EA #
Median Rank
EA Name MEA #
MEA Name REAG #
REAG Name
Camp Shelby 176 176 (Gulf of Mexico) 52 (Gulf of Mexico) 12 (Gulf of Mexico)
Fort Rucker 176 176 (Gulf of Mexico) 52 (Gulf of Mexico) 12 (Gulf of Mexico)
Panama City 176 176 (Gulf of Mexico) 52 (Gulf of Mexico) 12 (Gulf of Mexico)
CSMAC WG-4 Final Report 55 July24, 2013
Appendix 3: Commercial Systems
Baseline LTE Uplink Characteristics 12 November 2012 - Rev.2
This document reflects the consensus of the LTE Technical Characteristics group of the CSMAC
Working Groups. Participants include:
WG-1 Co-Chairs
Ivan Navarro – DOC/NOAA
Steve Sharkey – T-Mobile
Industry Representatives Government Representatives
Maqbool Aliani – Lightsquared Lloyd Apirian – Alion Science
Kumar Balachandran – Ericsson Lawrence Crippen – Alion Science
Mike Chartier – Intel David Greenberg – Alion Science
Doug Duet – AT&T Jason M Greene – Alion Science
Tom Dombrowsky – Wiely Rien Robert Martin – Alion Science
Rick Engelman – Sprint Robert L. Higginbotham – CIV DISA DSO
Paul Frew – RIM Gerald Hurt – Consultant to Exelis, Inc.
John Graybeal – Cisco Daniel Jablonski – JHU Applied Physic Lab
Alexander Gerdenitsch – Motorola Mobility Peter G. Kim – Aerospace Corp
Arunabha Ghosh – AT&T Lawrence Lambert – Exelis, Inc.
Frank Jager – Verizon Paul McKenna – NTIA/ITS
Jorgen Karlsson – Ericsson Albert 'Buzz' Merrill - Aerospace
Rob Kubik – Samsung Pierre Missud – ATDI
Milap Majmundar – AT&T Eric Nelson – NTIA/ITS
Joe Marx – AT&T Emil Olbrich – NIST
Mark McHenry – Shared Spectrum Thomas Shanholtz – Exelis, Inc.
Prakash Moorut – Nokia Siemens Networks O. Alden Smith – CTR DISA DSO; Scitor Corp.
Mark Racek – Ericsson Martin Rais – ATDI
Sanyogita Shyamsunder – Verizon Brian Wright - DOI
Doug Smith – Lightsquared
David Steer – RIM
Neeti Tandon – AT&T
Nelson Ueng –T-Mobile
Patrick Welsh – Verizon
Christopher Wieczorek – T-Mobile
Stephen Wilkus – Alcatel-Lucent
Ken Zdunek – Roberson & Associates
CSMAC WG-4 Final Report 56 July24, 2013
NTIA Liaisons FCC Liaisons
Ed Drucella Navid Golshahi
John Hunter Michael Ha
Chris Helzer
Robert Pavlak
Robert Weller
Janet Young
Baseline LTE Uplink Characteristics
For use in Interference Analysis for Protection of Federal Operations in the
1695-1710 and 1755-1850 MHz Bands, including adjacent bands
Introduction
The information regarding LTE Uplink Characteristics is intended for use in general analysis of
the potential for interference between commercial LTE operations and Federal Government
operations in the 1755-1850 MHz band. The information represents a collaborative effort
between industry and government representative experts to agree on LTE parameters that are
closer to realistic operational parameters than have been used in past analysis. However,
because these parameters will be used in general analysis, it is not possible to fully capture the
parameters that will be observed in an actual deployment, which will vary by carrier
implementation and site specific geography. In order to provide a uniform set of information to
apply in a wide variety of analysis, a number of simplifying assumptions have been made that
may continue to result in analysis showing a greater level of interference that would actually
occur. These include, but are not limited to, the assumptions being based on 100% loading
rather than a more realistic loading level and use of propagation curves that may result in
higher calculated power. In addition, because the transmit power and interference potential of
a UE device is highly dependent on the UE distance to a base station, developing and applying
UE information that is uncorrelated to interfering path is likely to overestimate the amount of
interference. None-the-less, given the difficulty of developing and running a fully correlated
model, the Technical Group participants agreed that it is reasonable to proceed with
uncorrelated values in order to develop a general understanding of the interference potential
given limited time and resources. Analysis based on this information will serve as useful
guidance in understanding the potential for systems to coexist and the potential for
interference. However, site specific coordination will be necessary to maximize efficient use of
the spectrum.
User Equipment (UE) Transmit Characteristics
Cumulative Distribution Function (CDF) of Total EIRP per Scheduled User Equipment
• Assumptions for generation of CDF data:

CSMAC WG-4 Final Report
o LTE Frequency Division Duplex (FDD) system
o 10 MHz LTE Bandwidth
o 100% system loading at LTE Base Station (eNodeB)
� All Physical Resource Blocks (PRB) are occupied at all times
o 100% outdoor UE distribution
o P0 = -90 dBm and alpha = 0.8 for UL Power Control (urban/suburban/rural)
o Proportional fair algorithm for LTE Scheduler
o Full-buffer traffic model (i.e. All UEs have data in their Radio Link Control (RLC) layer
buffer at all times)
• Graphical CDF Data
57
LTE Frequency Division Duplex (FDD) system
10 MHz LTE Bandwidth
100% system loading at LTE Base Station (eNodeB)
All Physical Resource Blocks (PRB) are occupied at all times
% outdoor UE distribution
90 dBm and alpha = 0.8 for UL Power Control (urban/suburban/rural)
Proportional fair algorithm for LTE Scheduler
buffer traffic model (i.e. All UEs have data in their Radio Link Control (RLC) layer
July24, 2013
90 dBm and alpha = 0.8 for UL Power Control (urban/suburban/rural)
buffer traffic model (i.e. All UEs have data in their Radio Link Control (RLC) layer

CSMAC WG-4 Final Report 58 July24, 2013
• Tabulated CDF Data
Urban/Suburban (1.732 Km
ISD)
(6 UE scheduled/TTI/sector)
Rural (7 Km ISD)
(6 UE
scheduled/TTI/sector)
UE EiRP
(dBm) PDF CDF PDF CDF
-40 0.0000 0.0000 0.0000 0.0000
-37 0.0001 0.0001 0.0000 0.0000
-34 0.0002 0.0003 0.0000 0.0000
-31 0.0008 0.0011 0.0000 0.0000
-28 0.0020 0.0031 0.0000 0.0000
-25 0.0040 0.0071 0.0000 0.0000
-22 0.0083 0.0154 0.0002 0.0002
-19 0.0166 0.0320 0.0004 0.0006
-16 0.0327 0.0647 0.0007 0.0013
-13 0.0547 0.1194 0.0026 0.0039
-10 0.0839 0.2033 0.0060 0.0099
-7 0.1128 0.3160 0.0153 0.0252
-4 0.1370 0.4530 0.0325 0.0577
-1 0.1429 0.5959 0.0575 0.1152
2 0.1338 0.7297 0.0911 0.2062
5 0.1094 0.8390 0.1245 0.3307
8 0.0753 0.9143 0.1536 0.4843
11 0.0450 0.9594 0.1605 0.6448
14 0.0236 0.9830 0.1473 0.7920

CSMAC WG-4 Final Report 59 July24, 2013
Urban/Suburban (1.732 Km
ISD)
(6 UE scheduled/TTI/sector)
Rural (7 Km ISD)
(6 UE
scheduled/TTI/sector)
UE EiRP
(dBm) PDF CDF PDF CDF
17 0.0106 0.9936 0.1203 0.9123
20 0.0064 1.0000 0.0877 1.0000
Assumed Number of Scheduled (transmitting) UE per Sector
• Assume Physical Downlink Control Channel (PDCCH) = 6 is typical for a 10 MHz LTE Channel
o PDCCH contains Downlink Control Information (DCI) blocks, which provide downlink
and uplink resource allocations, and power control commands for UEs
o Use UEs per sector (i.e. the number of simultaneously transmitting UEs is 6 per sector
or 18 per eNodeB, for a 10 MHz Channel)
o 100 % of uplink resources (PRBs) are equally distributed among transmitting UEs in
each sector
• Randomly assign power in accordance with UE power CDF for each independent Monte-
Carlo analysis trial
• The PDCCH value and corresponding number of UE should be adjusted based on the LTE
channel bandwidth:
PDCCH Value / Channel Bandwidth
5 MHz 10 MHz 15 MHz 20 MHz
PDCCH = 3 PDCCH = 6 PDCCH = 9 PDCCH = 12
Assumed Inter-Site Distance (ISD) for Generic LTE eNodeB Deployment
• Use concentric circles centered around metropolitan area unless other site specific
assumptions are agreed upon.
• Urban/suburban area assumed to be 30 km radius with rural area covering outer circle up
to 100 km, unless other site specific assumptions are mutually agreed upon
• Surrounding rural deployment may be adjusted by mutual agreement if and when there is
more than one urban/suburban area within 100km of the site being analyzed

CSMAC WG-4 Final Report 60 July24, 2013
Deployment ISD eNodeB Antenna
Height UE Antenna Height
Urban/Suburban (r <= 30 km) 1.732 km 30 m 1.5 m
Rural (U/S Edge < r <= 100 km) 7 km 45 m 1.5 m
Requirements for Unwanted Emissions
LTE specification defines requirements for two separate kinds of unwanted emissions, with
those for spurious emissions being the more stringent. In addition to these minimum
requirements, additional spectrum emission requirements defined in the 3GPP standard must
be fulfilled for a specific deployment scenario such as intra-band contiguous Carrier
Aggregation, cell handover, UL-MIMO, etc.
1) Out-of-Band (OOB) Emissions
a) Spectrum Emissions Mask (SEM)
• OOB specification is defined with respect to the edge of the occupied bandwidth and
it is absolute value
• The 3GPP defines standard identifies two resolution measurement bandwidths (30
kHz and 1 MHz). For example, -15 dBm/30 kHz for ΔfOOB ± 0-1 in 5 MHz can be
converted to 1 MHz bandwidth resolution results in a limit of 0.23 dBm/1MHz
• For frequencies greater than (ΔfOOB) as specified in Table below for Band Class 4, the
spurious emissions requirements are applicable
Spectrum Emission Limit (dBm)/ Channel Bandwidth
ΔfOOB
(MHz)
1.4
MHz
3.0
MHz
5
MHz
10
MHz
15
MHz
20
MHz
Measuremen
t Bandwidth
± 0-1 -10
(5.23)
-13
(2.23)
-15
(0.23)
-18
(-2.77)
-20
(-4.77)
-21
(-5.77)
30 kHz
(1 MHz)
± 1-2.5 -13 -13 -13 -13 -13 -13 1 MHz
± 2.5-2.8 -25 -13 -13 -13 -13 -13 1 MHz
± 2.8-5 -13 -13 -13 -13 -13 1 MHz
± 5-6 -25 -13 -13 -13 -13 1 MHz
± 6-10 -25 -13 -13 -13 1 MHz
± 10-15 -25 -13 -13 1 MHz
± 15-20 -25 -13 1 MHz
± 20-25 -25 1 MHz
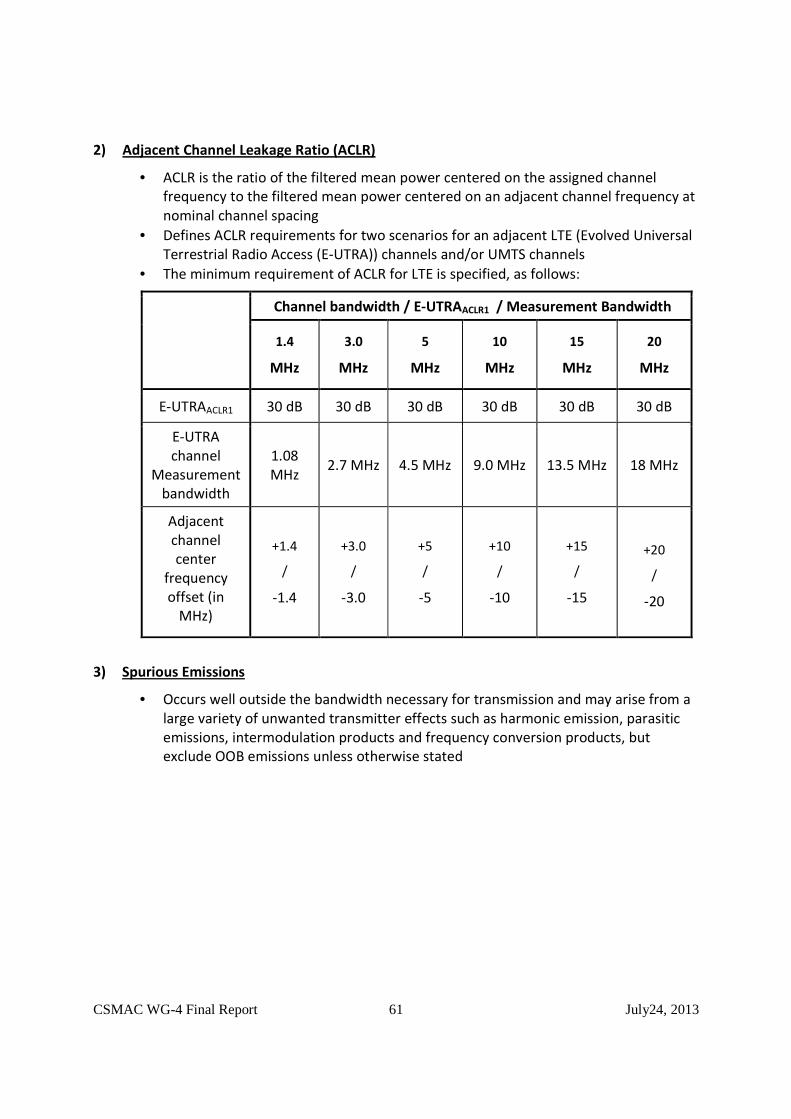
CSMAC WG-4 Final Report 61 July24, 2013
2) Adjacent Channel Leakage Ratio (ACLR)
• ACLR is the ratio of the filtered mean power centered on the assigned channel
frequency to the filtered mean power centered on an adjacent channel frequency at
nominal channel spacing
• Defines ACLR requirements for two scenarios for an adjacent LTE (Evolved Universal
Terrestrial Radio Access (E-UTRA)) channels and/or UMTS channels
• The minimum requirement of ACLR for LTE is specified, as follows:
Channel bandwidth / E-UTRAACLR1 / Measurement Bandwidth
1.4
MHz
3.0
MHz
5
MHz
10
MHz
15
MHz
20
MHz
E-UTRAACLR1 30 dB 30 dB 30 dB 30 dB 30 dB 30 dB
E-UTRA
channel
Measurement
bandwidth
1.08
MHz 2.7 MHz 4.5 MHz 9.0 MHz 13.5 MHz 18 MHz
Adjacent
channel
center
frequency
offset (in
MHz)
+1.4
/
-1.4
+3.0
/
-3.0
+5
/
-5
+10
/
-10
+15
/
-15
+20
/
-20
3) Spurious Emissions
• Occurs well outside the bandwidth necessary for transmission and may arise from a
large variety of unwanted transmitter effects such as harmonic emission, parasitic
emissions, intermodulation products and frequency conversion products, but
exclude OOB emissions unless otherwise stated
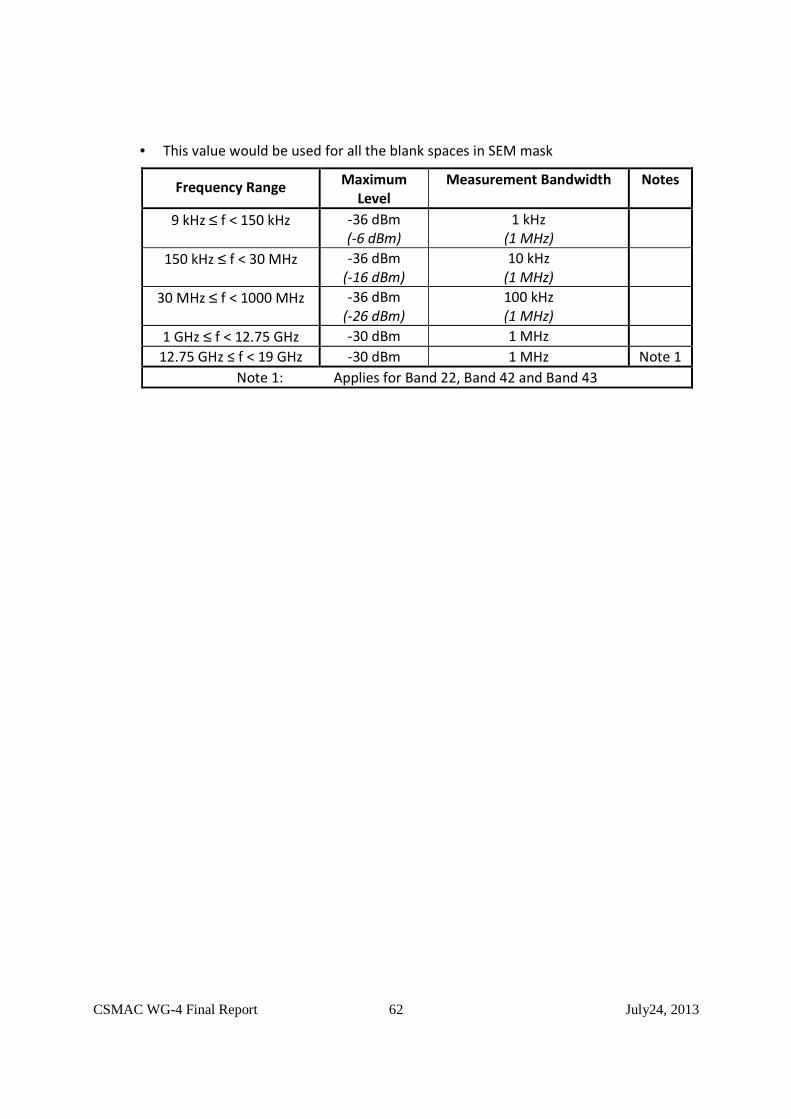
CSMAC WG-4 Final Report 62 July24, 2013
• This value would be used for all the blank spaces in SEM mask
Frequency Range Maximum
Level
Measurement Bandwidth Notes
9 kHz ≤ f < 150 kHz -36 dBm
(-6 dBm)
1 kHz
(1 MHz)
150 kHz ≤ f < 30 MHz -36 dBm
(-16 dBm)
10 kHz
(1 MHz)
30 MHz ≤ f < 1000 MHz -36 dBm
(-26 dBm)
100 kHz
(1 MHz)
1 GHz ≤ f < 12.75 GHz -30 dBm 1 MHz
12.75 GHz ≤ f < 19 GHz -30 dBm 1 MHz Note 1
Note 1: Applies for Band 22, Band 42 and Band 43
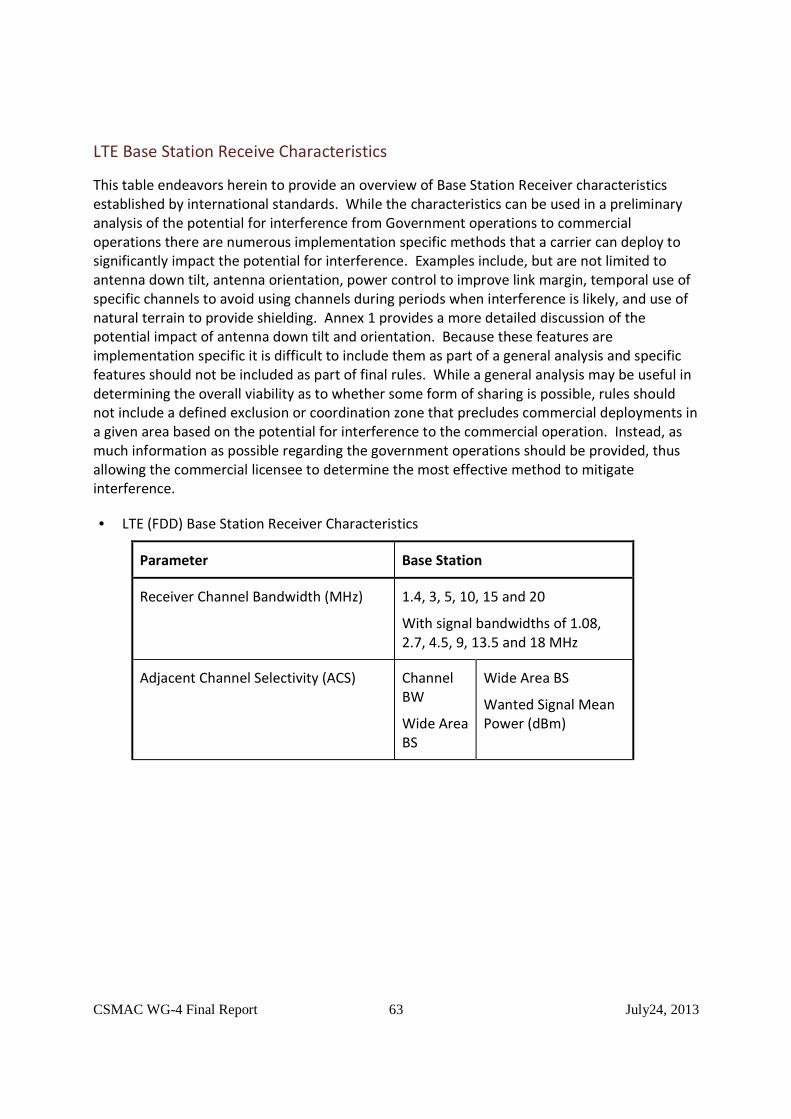
CSMAC WG-4 Final Report 63 July24, 2013
LTE Base Station Receive Characteristics
This table endeavors herein to provide an overview of Base Station Receiver characteristics
established by international standards. While the characteristics can be used in a preliminary
analysis of the potential for interference from Government operations to commercial
operations there are numerous implementation specific methods that a carrier can deploy to
significantly impact the potential for interference. Examples include, but are not limited to
antenna down tilt, antenna orientation, power control to improve link margin, temporal use of
specific channels to avoid using channels during periods when interference is likely, and use of
natural terrain to provide shielding. Annex 1 provides a more detailed discussion of the
potential impact of antenna down tilt and orientation. Because these features are
implementation specific it is difficult to include them as part of a general analysis and specific
features should not be included as part of final rules. While a general analysis may be useful in
determining the overall viability as to whether some form of sharing is possible, rules should
not include a defined exclusion or coordination zone that precludes commercial deployments in
a given area based on the potential for interference to the commercial operation. Instead, as
much information as possible regarding the government operations should be provided, thus
allowing the commercial licensee to determine the most effective method to mitigate
interference.
• LTE (FDD) Base Station Receiver Characteristics
Parameter Base Station
Receiver Channel Bandwidth (MHz) 1.4, 3, 5, 10, 15 and 20
With signal bandwidths of 1.08,
2.7, 4.5, 9, 13.5 and 18 MHz
Adjacent Channel Selectivity (ACS) Channel
BW
Wide Area
BS
Wide Area BS
Wanted Signal Mean
Power (dBm)

CSMAC WG-4 Final Report 64 July24, 2013
Parameter Base Station
1.4 MHz
3 MHz
5 MHz
10 MHz
15 MHz
20 MHz
Reference
TS 36.104
Table
7.5.1-3
-95.8 (PREFSENS + 11dB)
-95.0 (PREFSENS + 8dB)
-95.5 (PREFSENS + 6dB)
-95.5 (PREFSENS + 6dB)
-95.5 (PREFSENS + 6dB)
-95.5 PREFSENS + 6dB
Interfering signal
mean power: -
52 dBm i
Channel
BW
Local Area
BS
Local Area BS
Wanted Signal Mean
Power (dBm)
1.4 MHz
3 MHz
5 MHz
10 MHz
15 MHz
20 MHz
Reference
TS 36.104
Table
7.5.1-4
-87.8 (PREFSENS + 11dB)
-87.0 (PREFSENS + 8dB)
-87.5 (PREFSENS + 6dB)
-87.5 (PREFSENS + 6dB)
-87.5 (PREFSENS + 6dB)
-87.5 (PREFSENS + 6dB)
Interfering signal
mean power: -
44 dBm ii
Noise Figure (dB) 5

CSMAC WG-4 Final Report 65 July24, 2013
Parameter Base Station
Reference Sensitivity (dBm) PREFSENS for
Wide Area BS iii
1.4 MHz
3 MHz
5 MHz
10 MHz
15 MHz
20 MHz
-106.8
-103.0
-101.5
-101.5
-101.5
-101.5
Reference Sensitivity (dBm) PREFSENS for
Local Area BS
1.4 MHz
3 MHz
5 MHz
10 MHz
15 MHz
20 MHz
-98.8
-95.0
-93.5
-93.5
-93.5
-93.5
Antenna Gain (Mainbeam) (dBi) i, ii, iii
18
Azimuth Off-Axis Antenna Pattern
(dBi as a function of off-axis angle in
degrees)
ITU-R Recommendation F.1336-3
with an elevation 3 dB beamwidth
of 10 degrees, k=0.2 and the
equations in Section 3.2vi
Elevation Off-Axis Antenna Pattern
(dBi as a function of off-axis angle in
degrees)
ITU-R Recommendation F.1336-3
with an elevation 3 dB beamwidth
of 10 degrees, k=0.2 and the
equations in Section 3.2vi
Antenna Polarization Linear
Antenna Height (meters) 1
30 (Urban/Suburban)
15 to 60 (Rural)
Antenna Azimuth 3 dB Beamwidth
(degrees) 2
70
Antenna Down Tilt Angle (degrees) 3
Cable, Insertion, or Other Losses (dB) 2

CSMAC WG-4 Final Report 66 July24, 2013
Parameter Base Station
Interference Criterion 1dB desense. This translates into a
maximum interference = Noise
floor - 5.87 dB (I/N= ~ -6dB).
Note 1: For single entry analysis the maximum antenna height of 45 meters
for base stations will be used for rural. For aggregate analysis antenna
heights will be varied between the minimum and maximum values shown in
the table.
Note 2: A base station typically has three sectors each 120 degrees wide.

CSMAC WG-4 Final Report 67 July24, 2013
ANNEX
Example: Interference Mitigation via Antenna Downtilting and Antenna Azimuth Orientation
Commercial cellular deployments do regularly take into account interference considerations.
Even inter-cell interference within the same service provider network typically results in finite
antenna downtilt, particularly for systems with full spectral reuse (i.e., 3G, 4G). Also in the
commercial cellular world there exist numerous instances where adjacent band and other
interference scenarios have been successfully mitigated via proper RF design (e.g., between
service providers in adjacent spectrum, etc).
To illustrate the potentially significant impact of these antenna techniques on the interference
issues, we evaluate two representative commercial base station antennas from
CommScope/Andrew in the discussion below. Depending on the Federal Government systems
involved, different assumptions might be appropriate.
• Andrew HBX-6516DS-T0M: 18 dBi max gain (along the main beam or “bore sight”
direction), 65° horizontal beamwidth, 0° electrical downtilt, 7.1° vertical beamwidth.
• Andrew HBX-9016DS-T0M: 18.3 dBi max gain, 90° horizontal beamwidth, 0° electrical
downtilt, 4.8° vertical beamwidth.
Using these antennas, and orienting them with a 60° azimuthal offset from the Federal
Government system direction, the gain reductions for various reasonable antenna downtilts are
calculated (in the table, the gain reductions listed below are with respect to the max ~18dBi
gain of these antennas). The displayed gain reductions as a function of the downtilt angles are
for the case of an interferer at the horizon. Note that an interference source like JTRS may be
at an elevation (e.g., the WG-5 draft calculation assumed 10,000 feet), which would result in
higher gain reductions.
Antenna Gain
reduction
from 60°
azimuthal
orientation
Gain reduction
from 4° vertical
downtilt [Total
reduction from
azimuth + downtilt]
Gain reduction
from 6° vertical
downtilt [Total
reduction from
azimuth + downtilt]
Gain reduction
from 8° vertical
downtilt [Total
reduction from
azimuth + downtilt]
Andrew HBX-
6516DS-T0M
8.6 dB 2.8 dB
[11.4 dB]
7.4 dB
[16.0 dB]
16.3 db
[24.9 dB]
Andrew HBX-
9016DS-T0M
6.3 dB 8.7 dB
[15.0 dB]
26.9 dB
[33.2 dB]
24.1 dB
[30.4 dB]
As can be seen, total gain reductions (summing the reductions due to azimuthal orientation
plus those from vertical downtilt) can be very large, anywhere from 11.4 to 30.4 dB – assuming

CSMAC WG-4 Final Report 68 July24, 2013
the Federal Government interfering transmitter is at the horizon in our example.
Notes:
i This interfering signal mean power is for a wanted signal mean power at P_REFSENS + xdB (where x=6dB for 3-
20MHz channels and 11dB for 1.4MHz channel). One way to interpret this spec is that this is the maximum
interference level for xdB desense criterion. For instance, if 1dB desense is used in the coexistence studies, a
conversion can be done to adjust for the lower desense criterion. For example, if adjacent channel selectivity
is specified as -52dBm and wanted signal mean power is P_REFSENS + 6dB, the level can be adjusted by 11dB
for the smaller sensitivity degradation allowed giving -52-11= -63dBm:
• 1 dB desense: maximum interference = Noise floor - 5.87 dB
ii Same as in footnote i, interfering signal mean power can be adjusted for 1dB desense if this criterion is used in
the coexistence studies. For example, in the case of wanted signal mean power at P_REFSENS + 6dB, the level
can be adjusted by 11dB for the smaller sensitivity degradation allowed giving -44-11=-55dBm.
iii See 3GPP TS 36.104, §7.2. PREFSENS is the power level of a single instance of the reference measurement
channel. This requirement shall be met for each consecutive application of a single instance of FRC A1-3
mapped to disjoint frequency ranges with a width of 25 resource blocks each.
iv Base station antennas, both receive and transmit, typically have strongly angle-dependent gain characteristics
characterized by a horizontal and vertical beamwidth. The gain value listed here corresponds to the maximum
gain corresponding to the main lobe of the antenna.
v Assuming full bore-sight gain of the LTE BS receive antenna (18dBi) may not reflect interference mitigation
techniques as would be naturally deployed. Significant interference mitigation can be achieved via several
factors, which are standard in the industry: e.g., antenna downtilts (point below the horizon, achieved by
either mechanical and/or electrical means), antenna azimuth orientation (orient away from the interferer),
and use of available terrain (where it exists) for additional refraction loss, etc. This needs to be taken into
account when doing interference studies. The antenna techniques are further discussed in the Annex.
6 See Annex 8 of ITU-R Recommendation F.1336-3, which observes that the recommended equations for
antenna gains often do not accurately reflect the gains of actual antennas – particularly with regard to the side
lobes, as indicated in Figs 24 to 27 in Annex 8. This should be taken account when considering interference in
directions far from the main antenna lobe.
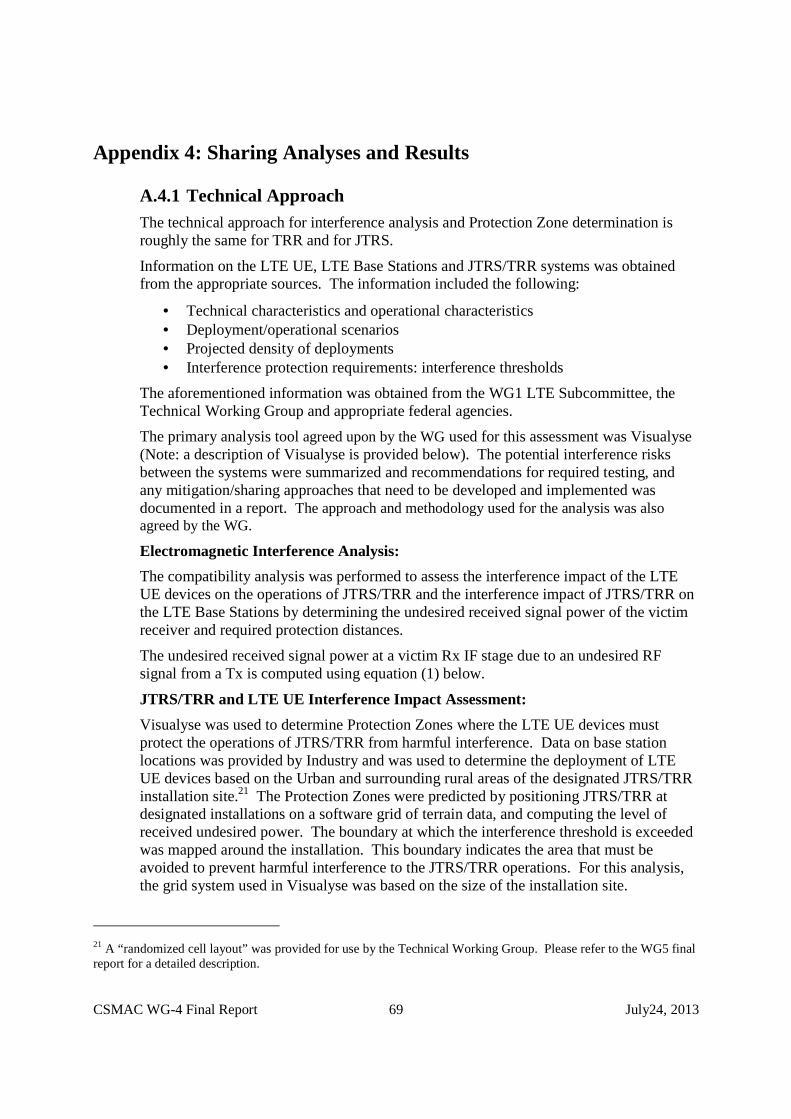
CSMAC WG-4 Final Report 69 July24, 2013
Appendix 4: Sharing Analyses and Results
A.4.1 Technical Approach The technical approach for interference analysis and Protection Zone determination is roughly the same for TRR and for JTRS.
Information on the LTE UE, LTE Base Stations and JTRS/TRR systems was obtained from the appropriate sources. The information included the following:
• Technical characteristics and operational characteristics • Deployment/operational scenarios • Projected density of deployments • Interference protection requirements: interference thresholds
The aforementioned information was obtained from the WG1 LTE Subcommittee, the Technical Working Group and appropriate federal agencies.
The primary analysis tool agreed upon by the WG used for this assessment was Visualyse (Note: a description of Visualyse is provided below). The potential interference risks between the systems were summarized and recommendations for required testing, and any mitigation/sharing approaches that need to be developed and implemented was documented in a report. The approach and methodology used for the analysis was also agreed by the WG.
Electromagnetic Interference Analysis:
The compatibility analysis was performed to assess the interference impact of the LTE UE devices on the operations of JTRS/TRR and the interference impact of JTRS/TRR on the LTE Base Stations by determining the undesired received signal power of the victim receiver and required protection distances.
The undesired received signal power at a victim Rx IF stage due to an undesired RF signal from a Tx is computed using equation (1) below.
JTRS/TRR and LTE UE Interference Impact Assessment:
Visualyse was used to determine Protection Zones where the LTE UE devices must protect the operations of JTRS/TRR from harmful interference. Data on base station locations was provided by Industry and was used to determine the deployment of LTE UE devices based on the Urban and surrounding rural areas of the designated JTRS/TRR installation site.21 The Protection Zones were predicted by positioning JTRS/TRR at designated installations on a software grid of terrain data, and computing the level of received undesired power. The boundary at which the interference threshold is exceeded was mapped around the installation. This boundary indicates the area that must be avoided to prevent harmful interference to the JTRS/TRR operations. For this analysis, the grid system used in Visualyse was based on the size of the installation site.
21 A “randomized cell layout” was provided for use by the Technical Working Group. Please refer to the WG5 final report for a detailed description.

CSMAC WG-4 Final Report 70 July24, 2013
JTRS/TRR and LTE Base Stations Interference Impact Assessment:
Visualyse was used to determine Protection Zones where the LTE Base Station might be subject to interference from JTRS/TRR operations. Industry data was used to determine the deployment, technical and operational characteristics of the LTE Base Stations. Protection Zones were predicted by positioning JTRS/TRR at designated installations on a software grid of terrain data, assuming that the base station is at every grid point (typically spaced at increments of 2 km) within an area surrounding the military base, and computing the level of received undesired power. Interference was assessed for on-azimuth, 60° off-axis, and 180° off-axis cases. The boundary at which the interference threshold is exceeded was mapped around the installation. This boundary indicates the area that must be avoided to prevent harmful interference to the LTE Base Stations. For this analysis, the grid system used in Visualyse was based on the size of the installation site.
Critical Assumptions:
A list of critical technical and operational assumptions was discussed within the WG based on the appropriate data. The current assumptions are as follows:
• I/N threshold value of - 6 dB was used. • NTIA’s Irregular Terrain Model (ITM) Version 1.2.2, Longley-Rice, was used for
the propagation loss. • The JTRS/TRR equipment was placed along the perimeter of the installation site
unless otherwise noted. • In cases where calculated Protection Zones are broken points, they were manually
interpolated.. • When the Protection Zone trace goes within the installation site, the installation
boundary was used as the exclusion zone. • Aggregation of interferors was used to assess the operational impact between the
LTE UE devices and JTRS and TRRs.
Reason for representative sample:
Due to the need to first determine the viability of the approach before performing analyses for over 70 discrete sites, a representative sample of three sites was selected. The criteria included such factors as proximity to population centers and physical geography. In regards to the former, bases located closer to population centers were preferred because it is in those areas that carriers likely will have the most interest in access to additional spectrum in the near term. For geography, it was desirous that each sample had different topographical features.
The following TRR systems locations were chosen:
• Ft. Lewis, WA (Army) • Ft. Carson, CO (Army) • Camp Blanding, FL (Army) • Camp Pendleton, CA (Navy/USMC)
Ft. Lewis was selected for its proximity to the Seattle metropolitan area and its topology that includes both mountains and bodies of water.

CSMAC WG-4 Final Report 71 July24, 2013
Ft. Carson was selected for its high altitude mountains and the proximity to Colorado Springs, Denver and the I-25 corridor.
Camp Blanding was selected for its central Florida location which is proximal to population centers and major transportation arteries, as well as the surrounding flat terrain and bodies of water.
Camp Pendleton was chosen for its geography including mountains, canyons and the Pacific Ocean. It is also located almost equally distant between Los Angeles and San Diego. Furthermore, the TRR architecture is unique in the sense that TRR operations at Camp Pendleton include a mobile ship-to-shore component.
Methodology:
JTRS and TRR characteristics were modeled in accordance with information provided in WG-4 and its associated J/F-12.
LTE Handset characteristics were modeled in accordance with information provided by LTE Technical Working Group associated with WG-1.
Geographic distribution of handsets was based on the randomized real network in baseline document and according the EA rankings provided by WG-2.
Interference power calculations were then performed based on the Worst Case Azimuth pointing angle of the JTRS and TRR systems.
Analysis for the JTRS and TRR backlobe/sidelobe antenna gain at the perimeter was performed, however the TRR located at the center of the installation with the mainbeam antenna gain resulted in the worst case scenario.
Interference Power Calculation
Interference power at victim receiver:
I = Pt + Gt + Gr – Lp – Lsys – OTR (1)
Where:
I = Interference power at victim Rx antenna output (dBm) Pt = Transmitter power of the interferor (dBm) Gt = Antenna gain of interferer in direction of victim (dBi) Gr = Antenna gain of victim receiver in direction of interferer (dBi) Lp = Propagation loss between victim and interferor (dB) Lsys = Additional receive system losses (dB) OTR On-tune rejection, dB LTE Systems (dB)
Notes to Interference Power Calculation:
• Interference power calculations were performed using Visualyse automated software tool
• When UE is source, Pt plus Gt not to exceed 20 dBm

CSMAC WG-4 Final Report 72 July24, 2013
• Propagation loss calculated using Longley-Rice and terrain data (30’ USGS data) used for ground/ground interactions, antenna heights above local terrain
• Additional receive system losses estimated ~ 4 dB • On-tune rejection taken as 10log(BWtx/BWrx) in dB • In this initial analysis, on-tune case considered only
Calculation of Aggregate Interference:
Total interference at JTRS and TRR receiver is taken as aggregate of on-tuned UE emissions
Aggregate calculated as:
Iagg = 10log{ ∑ ������ } + 30 (2)
Where,
Iagg = Aggregate interference at victim receiver (dBm) N = number of UEs I = Interference power at victim receiver from a single UE (Watts)
Application of Interference Power Calculation:
For interference to JTRS and TRR:
• Interference is calculated for positions of around operations area boundaries and locations of JTRS and TRR systems as appropriate.
• Visualyse used to determine distances beyond which UE operations not expected to exceed interference threshold.
Analysis Assumptions
For JTRS and TRR as interference victim:
• UE transmit power modeled using urban & rural CDFs • UEs modeled as being located a base of urban/rural base stations (three per UE
carrier frequency at each base station) • UE interference modeled as six handsets contiguous in frequency each modeled at
1.67 MHz UE emitter • UE antenna height of 1.5m • UE geographic distribution according to randomized real network • Clutter has not been taken into account, 0 dB • Rural grid extended beyond 100km radius • Assessed TRR at the center of the installation based on the antenna pattern.
� JTRS and TRR Directional Antenna, 23 dBi MB � TRR Link Distance of 10 km
For LTE Base Stations as interference victim:
• LTE Base Station Antenna heights – 30m urban, 60m rural • LTE Base Station Sector coverage – pattern as described in ITU-R F.1336-3

CSMAC WG-4 Final Report 73 July24, 2013
• LTE Base Station Downtilt – 3 degrees from the horizontal • LTE Base Station on-azimuth, 60° off-axis, and 180° off-axis
Visualyse:
Visualyse is a commercially available, time-based simulation and area analysis tool that was initially developed to address modeling of technical issues associated with International Telecommunication Union (ITU) activities. The capabilities and applications of Visualyse have broadened to many Radio Frequency (RF) scenarios while retaining the technical foundations and references of the ITU.
The Visualyse model allows the analyst to make an in-depth assessment of possible interference interactions using time-based simulations, detailed descriptions of technical parameters, and using different propagation models as appropriate. Of particular interest is the capability to construct and analyze aggregate environments and to assess the associated potential impact to a moving platform. The analyst can model emission parameters such as transmitter power, modulation type, emission bandwidth, cable losses, and transmit antenna patterns and scanning characteristics. Receiver parameters such as receiver bandwidths, noise figures, cable losses and receive antenna characteristics can also be modeled. Time-varying parameters of both the individual emitters in an aggregate environment and the movement and scanning antenna of a possible victim receiver can be modeled with Visualyse. The model can calculate such important performance criteria as predicted interference-to-noise levels at a victim receiver for each simulation step in an environment. An overall interference assessment can be made on the basis of predicted scenario values that can be compared to known interference thresholds.
The basic inputs to utilize Visualyse are as follows: • Basic Visualyse Transmitter Input • Frequency • Power • Emission Bandwidth • Antenna Height Above Terrain • Antenna Gain (or Pattern) • Basic Visualyse Receiver Inputs • Frequency • Power • Noise Figure • Receiver Bandwidth • Receiver Sensitivity • Antenna Height Above Terrain • Antenna Gain (or Pattern) • Protection criteria

CSMAC WG-4 Final Report 74 July24, 2013
A.4.2 TRR Analysis Results: Tables 8 and 9 provide a summary of the Protection Zone distances for interference to Army and Navy TRRs at the selected sites. Figures 3 through 8 depict the TRR Protection Zones for the selected cities.
Table 8: Summary of Protection Zone Distances for Army TRR
Interference to Army TRR from LTE Handsets
Selected TRR Sites
Propagation Model
I/N Threshold
(dB)
Clutter (dB)
Protection Distance
Radius (km)
Name Approx. Size
(width x length) (km)
Center Coordinates
TRR at Base Center
(Mainbeam)
Fort Lewis
21 x 19 47° 4'12.00"N, 122°34'12.00"W
ITM (50%) -6 0 115
Camp Blanding
15 x 28 29°56'31.00"N, 81°59'13.00"W
ITM (50%) -6 0 45
Fort Carson
22 x 39 38°34'48.00"N, 81°58'48.00"W
ITM (50%) -6 0 75
Table 9: Summary of Protection Zone Distances for Navy/USMC TRR
Interference to Navy/Marine TRR from LTE Handsets
TRR Site Approx. Size
(width x length) (km)
Victim System Name
Propagation Model
I/N Threshold
(dB)
Clutter (dB)
Worst-Case Protection Distance
Radius (km)
Camp Pendleton 35 x 40
MRC-142B ITM (50%) -6 0 130
MRC-142C ITM (50%) -6 0 150
SRC-57 ITM (50%) -6 0 120

CSMAC WG-4 Final Report 75 July24, 2013
Figure 3: Army TRR Protection Zone at Fort Lewis

CSMAC WG-4 Final Report 76 July24, 2013
Figure 4: Army TRR Protection Zone Distance at Camp Blanding

CSMAC WG-4 Final Report 77 July24, 2013
Figure 5: Army TRR Protection Zone Distance at Fort Carson
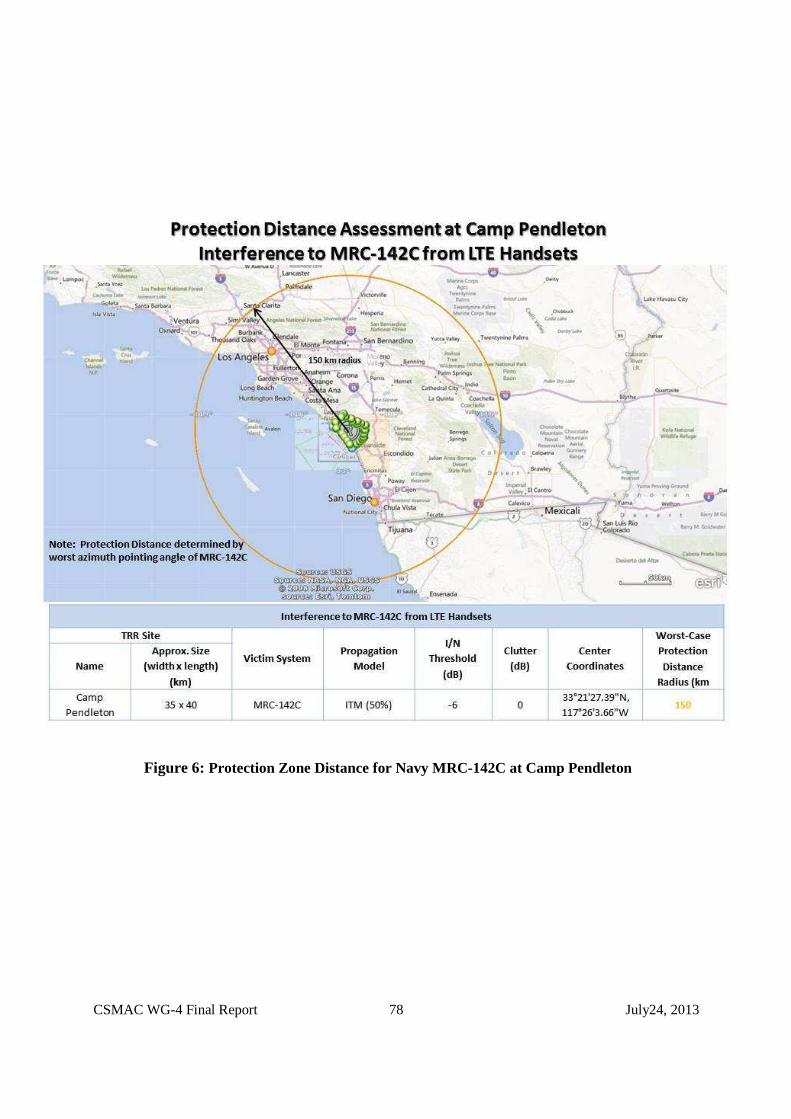
CSMAC WG-4 Final Report 78 July24, 2013
Figure 6: Protection Zone Distance for Navy MRC-142C at Camp Pendleton

CSMAC WG-4 Final Report 79 July24, 2013
Figure 7: Protection Zone Distance for Navy MRC-142B at Camp Pendleton

CSMAC WG-4 Final Report 80 July24, 2013
Figure 8: Protection Zone Distance for Navy SRC-57 at Camp Pendleton
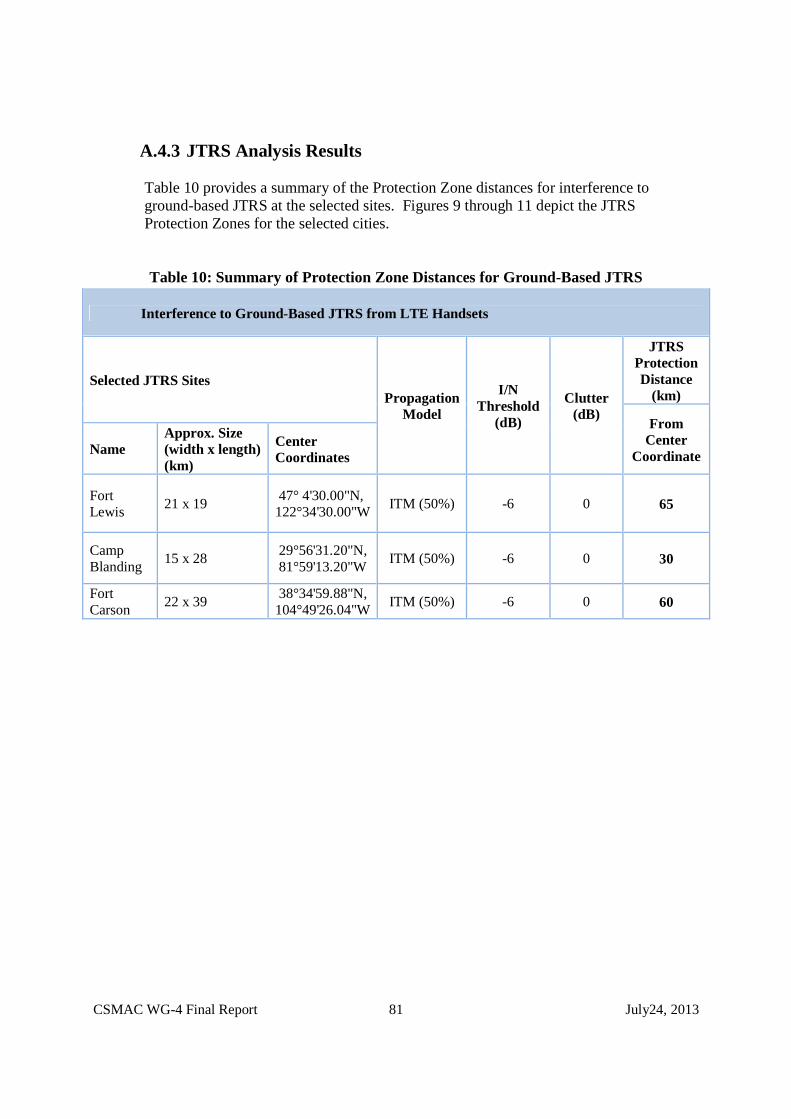
CSMAC WG-4 Final Report 81 July24, 2013
A.4.3 JTRS Analysis Results Table 10 provides a summary of the Protection Zone distances for interference to ground-based JTRS at the selected sites. Figures 9 through 11 depict the JTRS Protection Zones for the selected cities. Table 10: Summary of Protection Zone Distances for Ground-Based JTRS
Interference to Ground-Based JTRS from LTE Handsets
Selected JTRS Sites Propagation
Model
I/N Threshold
(dB)
Clutter (dB)
JTRS Protection Distance
(km)
From Center
Coordinate Name Approx. Size (width x length) (km)
Center Coordinates
Fort Lewis
21 x 19 47° 4'30.00"N, 122°34'30.00"W
ITM (50%) -6 0 65
Camp Blanding
15 x 28 29°56'31.20"N, 81°59'13.20"W
ITM (50%) -6 0 30
Fort Carson
22 x 39 38°34'59.88"N, 104°49'26.04"W
ITM (50%) -6 0 60
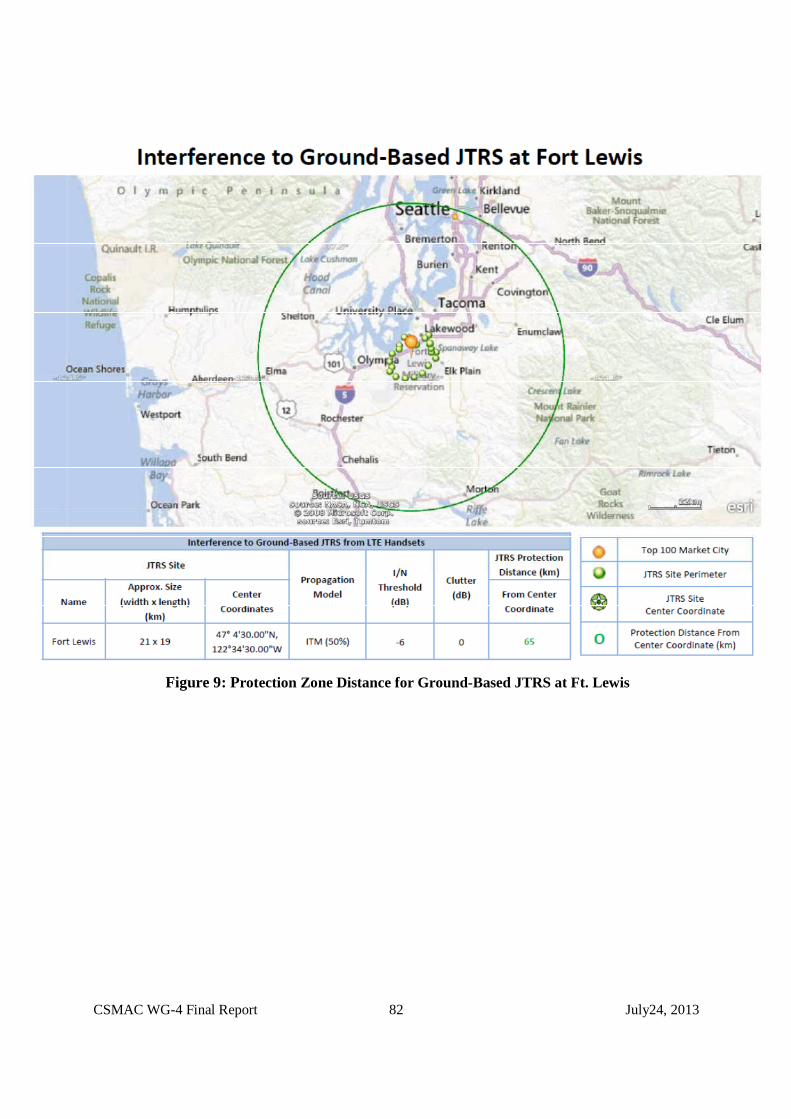
CSMAC WG-4 Final Report 82 July24, 2013
Figure 9: Protection Zone Distance for Ground-Based JTRS at Ft. Lewis

CSMAC WG-4 Final Report 83 July24, 2013
Figure 10: Protection Zone Distance for Ground-Based JTRS at Camp Blanding

CSMAC WG-4 Final Report 84 July24, 2013
Figure 11: Protection Zone Distance for Ground-Based JTRS at Ft. Carson