Embed Size (px)
Citation preview

Comments on
Old-Age Income Support in the 21st
Century: An International Perspective on Pension Systems and Reforms
by R. Holzmann and R. Hinzplus several colleagues
Guillermo Larrain RiosSuperintendent of Pension Funds Administrators, Chile
President of AIOS
Cartagena de Indias, May 20th, 2005

General View• Multipillar pension systems are new. Excluding Chile,
none has more than 12 year old (Peru).• It is one of the few socio-economic institutions created in
developing countries and being adopted by developed ones: Sweden, ¿US?
• Implication: no OECD country is an example in this, there are no international standards (ie, no public good of good governance: Basle Accords, IOSCO, etc…)
• We, developing countries, must take this challenge in our hands and proceed to reflect, to model and to make funded pension systems coherent with the principles of social security. We are not making the appropriate effort
We rely on the kind help from the… World Bank
Therefore, the
clarificatio
n of official
World Bank policies
concerning pension
reform is welcomed

This Policy Report• Not a research paper. The report describes well the
criteria used by the WB in pension reform issues. • It is not as easy to read as a paper, there are few data,
but it is relevant to understand how the Bank articulates its reflection and policy suggestions in this topic.
• The WB approach is much more complex and nuanced than what is often perceived from outside.
• There is no unilateral argument in favour of capitalization systems, that is:– the P2 may constitute per se the main component of the pension
system,– that P0 and/or P1 are residuals
• There is a sense that countries are different and deserve a unique combination within the multipillar approach. This is a serious approach.

This Policy Report
• It starts increasing the number of pillars originally included in “Averting the Old Age Crisis”, giving therefore reason to those who think that coverage issues are relevant and require a treatment outside Pillar 2.
• But then, it reflects on how to improve Pillar 2 from various perspectives, giving reason to those who think that the system can be improved significantly from its current situation.
• One particular aspect of this is that there is no policy criteria suggesting that P1 should be strengthen at the expense of P2.

Six disordered and contradictory questions for the WB and for you
1. WB has a general emphasis on poverty prevention. For the sake of pension systems, isn´t it too much?
2. Maybe the WB has devoted less resources to promote a better P1, but have we made all relevant progresses in improving P2?
3. As enjoying a pension is a question of spending the money, have we devoted enough resources to improve the disbursement phase? Where are the LICs?
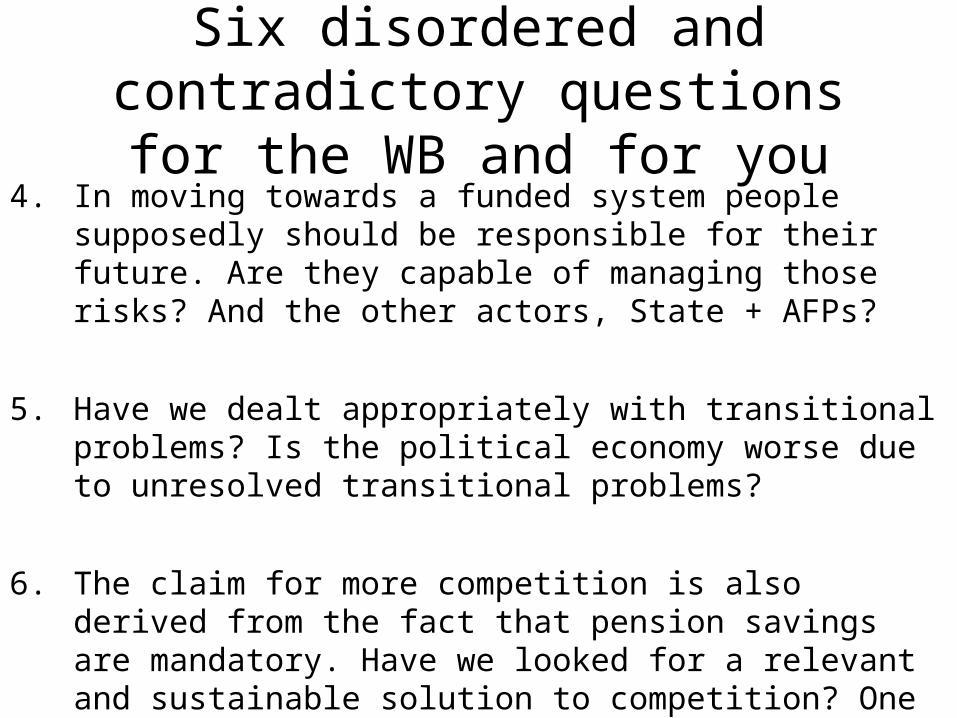
Six disordered and contradictory questions for the WB and for you
4. In moving towards a funded system people supposedly should be responsible for their future. Are they capable of managing those risks? And the other actors, State + AFPs?
5. Have we dealt appropriately with transitional problems? Is the political economy worse due to unresolved transitional problems?
6. The claim for more competition is also derived from the fact that pension savings are mandatory. Have we looked for a relevant and sustainable solution to competition? One implication: can we ask Parliaments for subsidies to strengthen P3, if we agree that there are IO problems in P2?

1) The discussion of pillar weight:
Too much emphasis in poverty prevention? – Poverty incidence at old-age– Myopia– Inertia

Relationship between different pillars.
• Incidence of Poverty is lower at old age.• Proposal for a universal pension looses ground in a
context where fiscal budget is limited
AgeExtremely
Poor Poor Not Poor Total0-10 7.7 19.9 72.4 10011-20 6.2 18.0 75.7 10021-30 3.8 12.0 84.3 10031-40 4.5 14.2 81.4 10041-50 3.8 11.4 84.8 10051-60 2.8 8.6 88.6 10061 or more 1.4 8.3 90.3 100Total 4.7 14.1 81.2 100Source: Mideplan, División Social. Casen 2003.
Situation of Poverty
There is a meaningful opportunity
cost of alleviating
poverty at old age: poverty when young

0%5%
10%15%20%25%30%35%40%45%
% d
e Re
spue
stas
menos de 50 entre los 51 y los60
entre los 61 y los70
entre los 71 y los80
más de 80
Espera vivir...
Expectativa de Vida de personas entre 15 y 35 años
0%5%
10%15%20%25%30%35%40%45%
% d
e Re
spue
stas
menos de 50 entre los 51 y los60
entre los 61 y los70
entre los 71 y los80
más de 80
Espera vivir...
Expectativa de Vida de personas entre 35 y 60 años
0%5%
10%15%20%25%30%35%40%45%
% d
e Re
spue
stas
menos de 50 entre los 51 y los60
entre los 61 y los70
entre los 71 y los80
más de 80
Espera vivir...
Expectativa de Vida para personas de más de 60 años
Expectativa de vida según tablas de 1985
Objectives of a Pension System: Old-Age Poverty Alleviation and Consumption Smoothing
• Strong evidence in favor of myopia.
• Too much focus on poverty alleviation may leave out policies directed to smooth consumption.
• People under-estimate their Life Expectancy and correct these estimation too late.
Question: At what age do you think you will die?
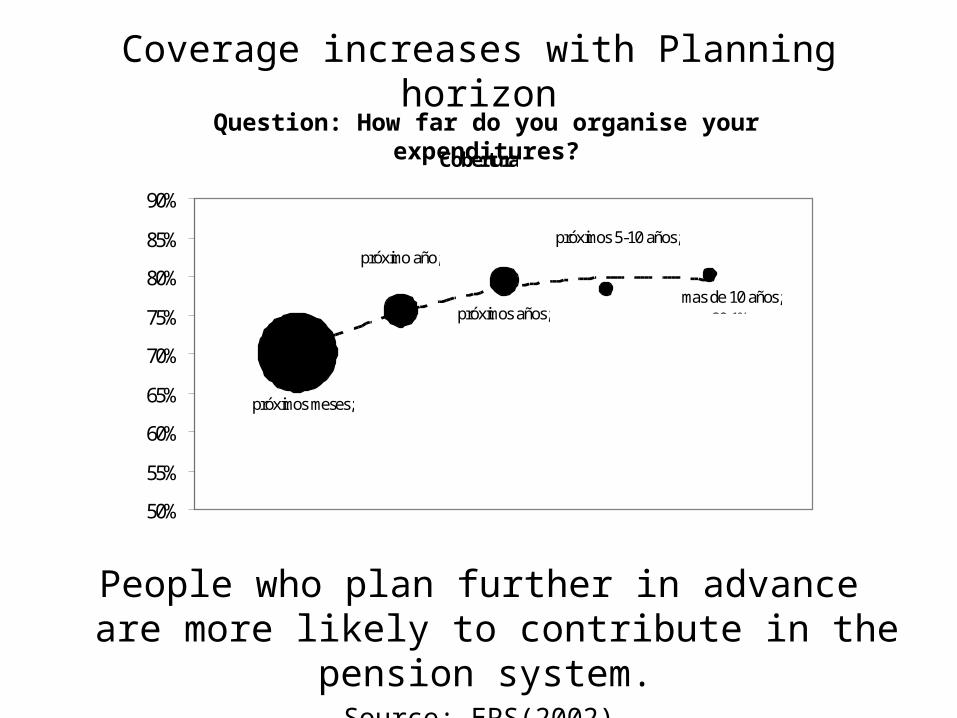
Coverage increases with Planning horizon
Cobertura
mas de 10 años; 80,1%
próximo año; 75,6%
próximos meses; 70,1%
próximos años; 79,4%
próximos 5-10 años; 78,3%
50%
55%
60%
65%
70%
75%
80%
85%
90%
People who plan further in advance are more likely to contribute in the pension system.
Source: EPS(2002)
Question: How far do you organise your expenditures?
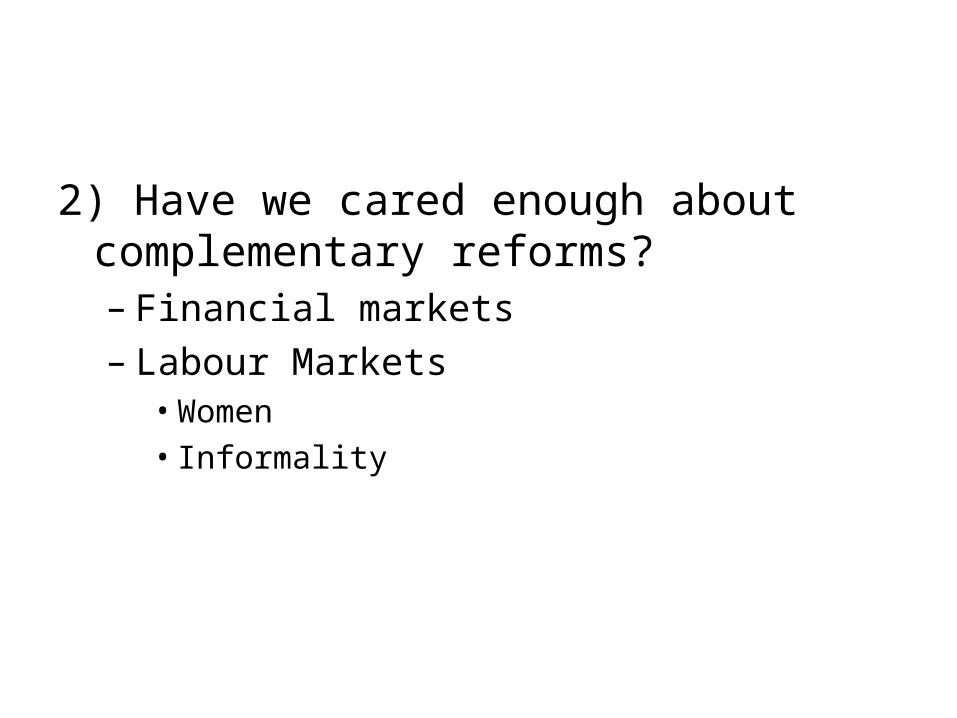
2) Have we cared enough about complementary reforms?– Financial markets– Labour Markets
• Women• Informality

In Financial Markets: why diversification is so poor?
Deudagubernamental
Institucionesfinancieras
Institucionesno
financieras
Acciones Fondos mutuos
y deinversión
Emisoresextranjeros
Otros
Argentina 16.222 68,1% 4,5% 2,1% 10,4% 2,9% 9,4% 2,5%Bolivia 1.617 64,9% 6,5% 18,2% 7,9% 1,6% 0,9%Chile 48.992 21,2% 28,3% 7,1% 13,3% 2,5% 27,5% 0,1%Costa Rica 378 74,1% 10,8% 9,4% 1,5% 4,2%El Salvador 1.819 84,2% 10,2% 5,3% 0,3%México 37.930 85,6% 4,3% 10,1%Perú 6.699 21,2% 16,2% 11,0% 36,9% 1,6% 9,5% 3,5%R. Dominicana * 245 24,4% 66,5% 2,4% 6,5% 0,2%Uruguay 1.323 55,5% 37,7% 5,4% 1,4%Total 115.224 51,2% 15,9% 7,7% 9,4% 1,6% 13,6% 0,7%Total S/Chile 66.232 73,4% 6,7% 8,1% 6,5% 0,9% 3,3% 1,1%Total S/Chile y Perú 59.533 79,3% 5,7% 7,8% 3,1% 0,9% 2,6% 0,9%
(porcentaje respecto al fondo total)
TOTAL(millonesde U$S)
País
Are you incompetent?

In Chile, the achievement of diversification has been progressive
Evolution of Asset Diversification in Chile
0%
10%
20%
30%
40%
50%
60%
70%
80%
90%
100%
Public Sector Financial Sector Private Sector Foreign Sector

Some institutional prerequisites for asset diversification
Fixed Income:Mortage
CreditCorporate
Bonds
Variable IncomeCorporate culture, accountability, transparencyCorporate governanceMinority shareholder´s rights
1. Macro stability (inflation, shocks,…)
2. Growth: investment opportunities
3. Contract´ stability
4. Quality of regulation
5. Elimination of tax distortions
6. Risk classification
7. Custodians … etc
The reform agenda besides
pension reform is large.
It needs effort,
persistence and
patience…
Because several interest groups
(within the financial sector as
well) will certainly try to block it

Labor Markets. Female Labor Force Participation is still low in Latin America
Country Year Male Female
Argentina 2002 72 46
Bolivia 2002 77 57
Brasil 2001 79 53
Chile 2003 73 45
Colombia 2002 79 57
Costa Rica 2002 77 46
Ecuador 2002 81 53
El Salvador 2002 73 51
Guatemala 2002 85 58
Honduras 2003 78 50
México 2002 79 45
Nicaragua 2001 83 52
Panamá 2002 79 54
Paraguay 2000 81 57
Perú 2001 74 54
Dominican Rep. 2003 80 51
Uruguay 2002 72 50
Venezuela 2003 83 56
Source: ECLAC based on National Household Surveys
Labor Force Participation by Gender
Latin America
What explains low female participation rates?
Some Chilean thoughts:
• Lack of appropriate labor contracts for women
• Child care
• … machismo
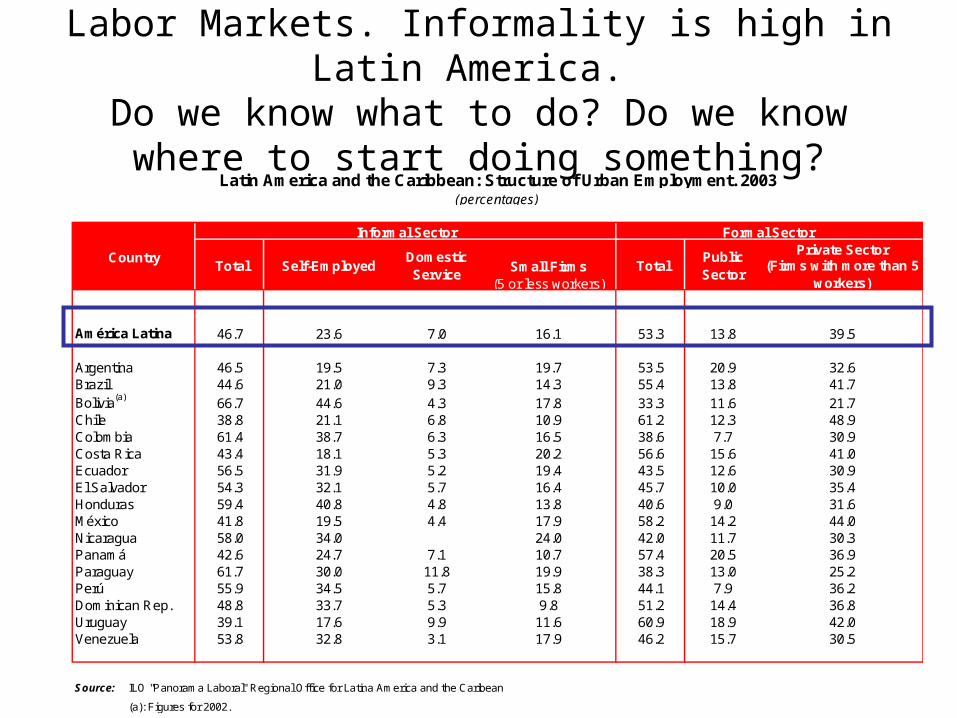
Labor Markets. Informality is high in Latin America.
Do we know what to do? Do we know where to start doing something?
Private Sector Small Firms
(5 or less workers)
América Latina 46.7 23.6 7.0 16.1 53.3 13.8 39.5
Argentina 46.5 19.5 7.3 19.7 53.5 20.9 32.6Brazil 44.6 21.0 9.3 14.3 55.4 13.8 41.7Bolivia(a) 66.7 44.6 4.3 17.8 33.3 11.6 21.7Chile 38.8 21.1 6.8 10.9 61.2 12.3 48.9Colombia 61.4 38.7 6.3 16.5 38.6 7.7 30.9Costa Rica 43.4 18.1 5.3 20.2 56.6 15.6 41.0Ecuador 56.5 31.9 5.2 19.4 43.5 12.6 30.9El Salvador 54.3 32.1 5.7 16.4 45.7 10.0 35.4Honduras 59.4 40.8 4.8 13.8 40.6 9.0 31.6México 41.8 19.5 4.4 17.9 58.2 14.2 44.0Nicaragua 58.0 34.0 24.0 42.0 11.7 30.3Panamá 42.6 24.7 7.1 10.7 57.4 20.5 36.9Paraguay 61.7 30.0 11.8 19.9 38.3 13.0 25.2Perú 55.9 34.5 5.7 15.8 44.1 7.9 36.2Dominican Rep. 48.8 33.7 5.3 9.8 51.2 14.4 36.8Uruguay 39.1 17.6 9.9 11.6 60.9 18.9 42.0Venezuela 53.8 32.8 3.1 17.9 46.2 15.7 30.5
Source:
(a): Figures for 2002.
TotalPublic Sector
ILO "Panorama Laboral" Regional Office for Latina America and the Caribean
(Firms with more than 5 workers)
Latin America and the Caribbean: Structure of Urban Employment. 2003(percentages)
Country
Informal Sector Formal Sector
Total Self-EmployedDomestic Service

Informality is important because it is stronger among poorer people…
Categoría Ocupacional por Decil de Ingreso
38%28% 25% 22% 18% 16% 13% 11% 9% 6%
25%
19%18% 19%
20% 21% 24% 24% 24%20%
0%
0%0% 1%
1% 2% 2% 4% 7% 19%
36%
53% 56% 58% 61% 61% 61% 61% 61%54%
0%
10%
20%
30%
40%
50%
60%
70%
80%
90%
100%
1 2 3 4 5 6 7 8 9 10
empleado sin contrato cuenta propia patrón o empleador empleado con contrato
Source: CASEN Survey 2003
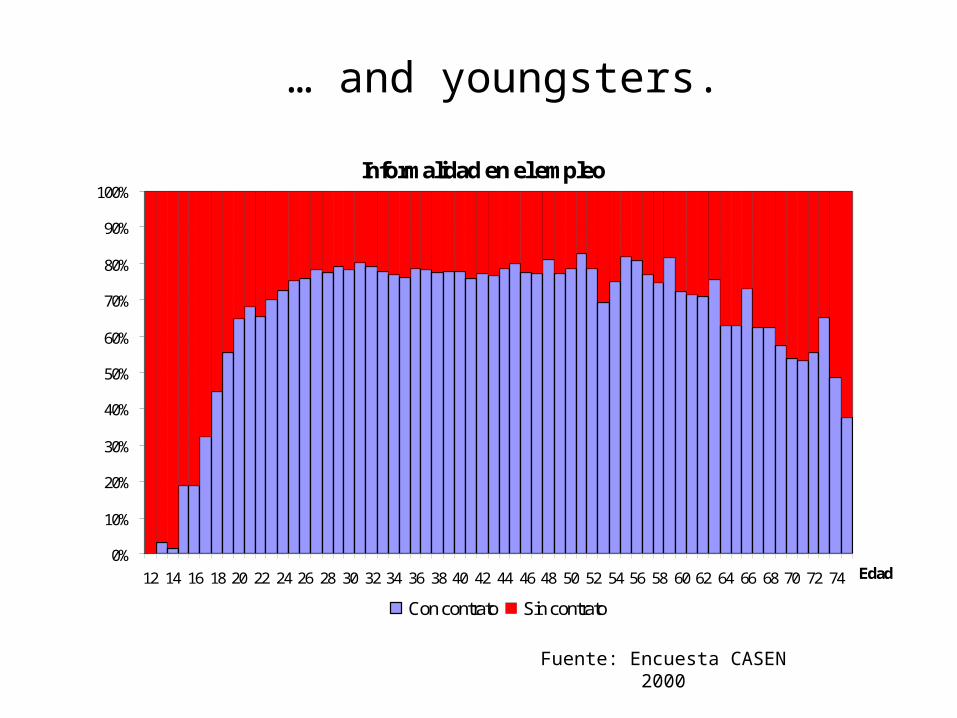
Fuente: Encuesta CASEN 2000
Informalidad en el empleo
0%
10%
20%
30%
40%
50%
60%
70%
80%
90%
100%
12 14 16 18 20 22 24 26 28 30 32 34 36 38 40 42 44 46 48 50 52 54 56 58 60 62 64 66 68 70 72 74 Edad
Con contrato Sin contrato
… and youngsters.

3) Pension reform is not only about savings accumulation, but also about spending the bucks!– Disbursement phase

Big Focus on Accumulation Phase, but what happens in Disbursement Phase?
• Effect of SCOMP on Annuities Fees
• New Mortality Tables, updated to take into account higher Life Expectancy levels
2,01 %
6%
0%
1%
2%
3%
4%
5%
6%
7%
Dic.90 Dic.91 Dic.92 Dic.93 Dic.94 Dic.95 Dic.96 Dic.97 Dic.98 Dic.99 Dic.00 Dic.01 Dic.02 Dic.03 Feb-05
Comisión Promedio
Life Expectancy at different ages, years
55 years 60 years 65 years
Female 32,43 27,88 23,54
Male 25,83 21,62 17,66

Average early retirement age: 56 (men) and 54 (women)
Men
0%
10%
20%
30%
40%
50%
60%
70%
80%
90 91 92 93 94 95 96 97 98 99 OO O1 O2 O3Year
% o
f to
tal r
eti
rem
en
ts
54
55
56
57
58
ag
e
% of early retirees average age of early retiress
Women
0%
5%
10%
15%
20%
25%
30%
35%
40%
90 91 92 93 94 95 96 97 98 99 OO O1 O2 O3Year
% o
f tot
al r
etir
emen
ts
53
54
55
56
age
% of early retirees average age of early retiress
Another challenge: Early retirement
4) Who bears which risks?– Individuals– Firms (AFP)– State
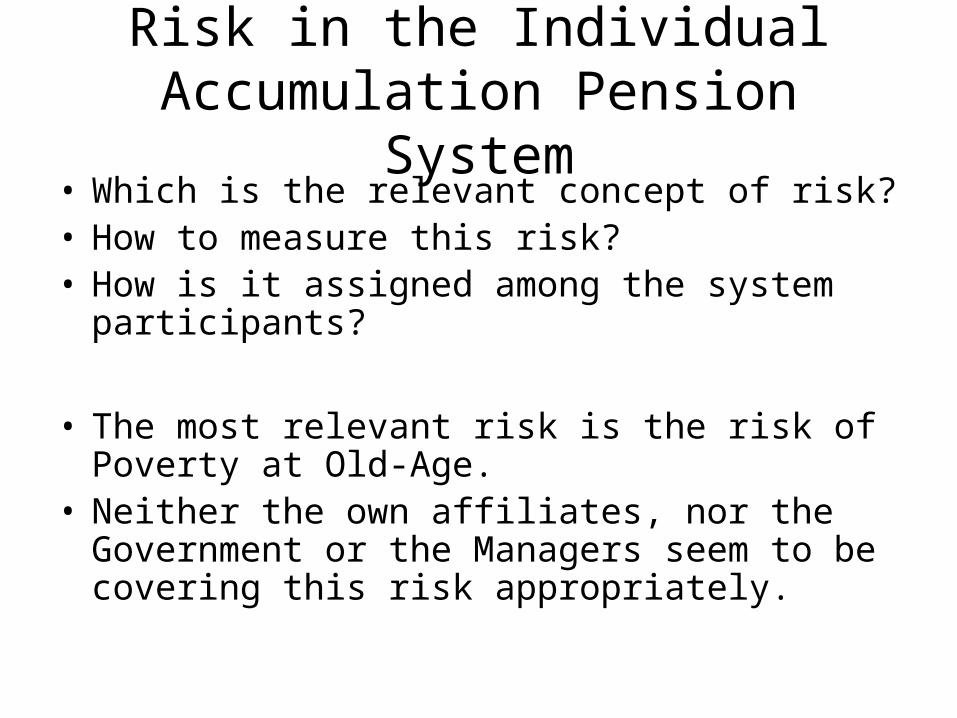
Risk in the Individual Accumulation Pension System
• Which is the relevant concept of risk?• How to measure this risk?• How is it assigned among the system
participants?
• The most relevant risk is the risk of Poverty at Old-Age.
• Neither the own affiliates, nor the Government or the Managers seem to be covering this risk appropriately.
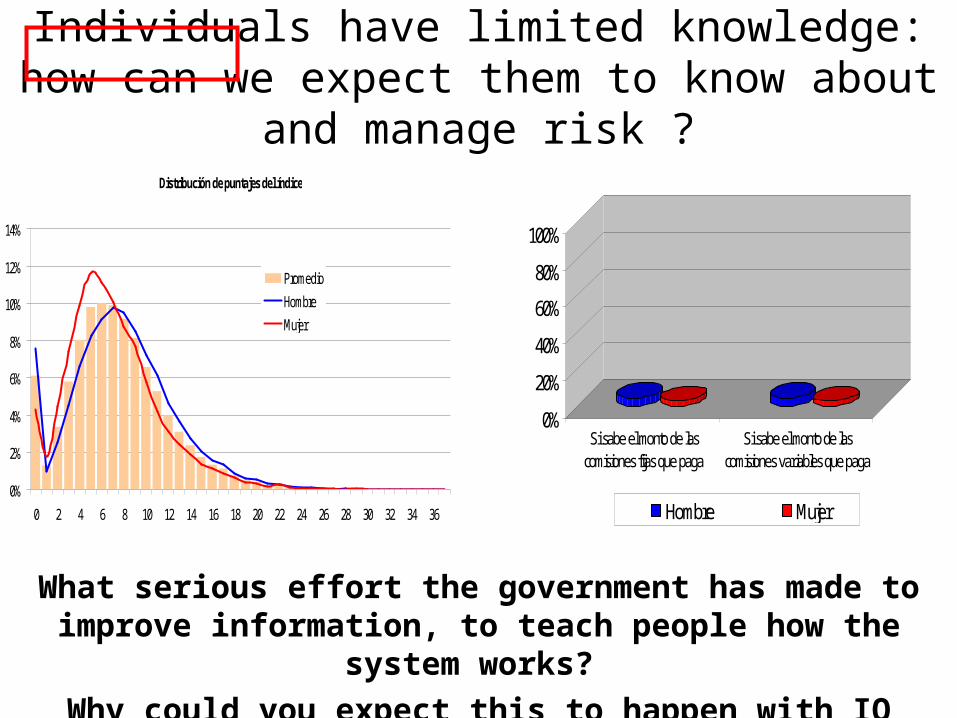
Individuals have limited knowledge: how can we expect them to know about and manage risk ?
Distribución de puntajes del índice
0%
2%
4%
6%
8%
10%
12%
14%
0 2 4 6 8 10 12 14 16 18 20 22 24 26 28 30 32 34 36
PromedioHombreMujer
What serious effort the government has made to improve information, to teach people how the system works?
Why could you expect this to happen with IO problems?
0%
20%
40%
60%
80%
100%
Si sabe el monto de lascomisiones fijas que paga
Si sabe el monto de lascomisiones variables que paga
Hombre Mujer

0%
10%
20%
30%
40%
50%
60%
70%
80%
90%
100%
2005 2007 2009 2011 2013 2015 2017 2019 2021 2023 2025 2027 2029 2031 2033 2035
Pensiones menores a PM sin GE Pensiones menores a PM con GE Pensiones mayores a PM
Base scenario
Minimum pension growth 2% Yield 5%
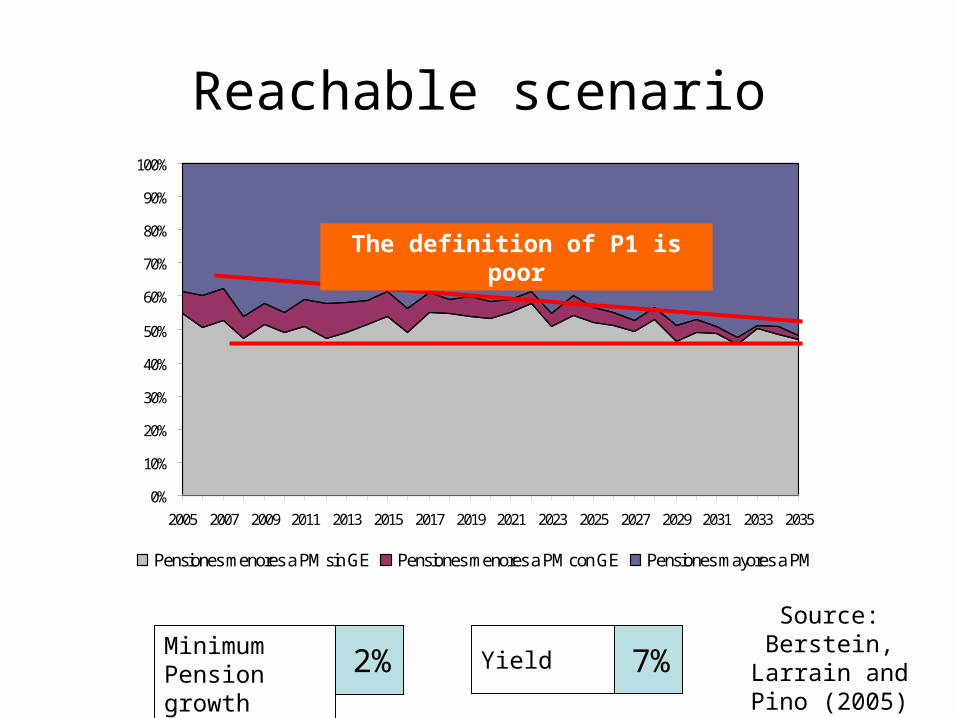
State: coverage of Minimum Pensions seem fairly low, should we strengthen P0 and P1?
Only 10% of retirees will receive minimum pension benefit while almost 50% of them will obtain self-financed pensions below the minimum pension level
Source: Berstein, Larrain and Pino
(2005)
0%
10%
20%
30%
40%
50%
60%
70%
80%
90%
100%
2005 2007 2009 2011 2013 2015 2017 2019 2021 2023 2025 2027 2029 2031 2033 2035
Pensiones menores a PM sin GE Pensiones menores a PM con GE Pensiones mayores a PM
Reachable scenario
Minimum Pension growth 2% Yield 7%
Source: Berstein, Larrain and Pino
(2005)
The definition of P1 is poor
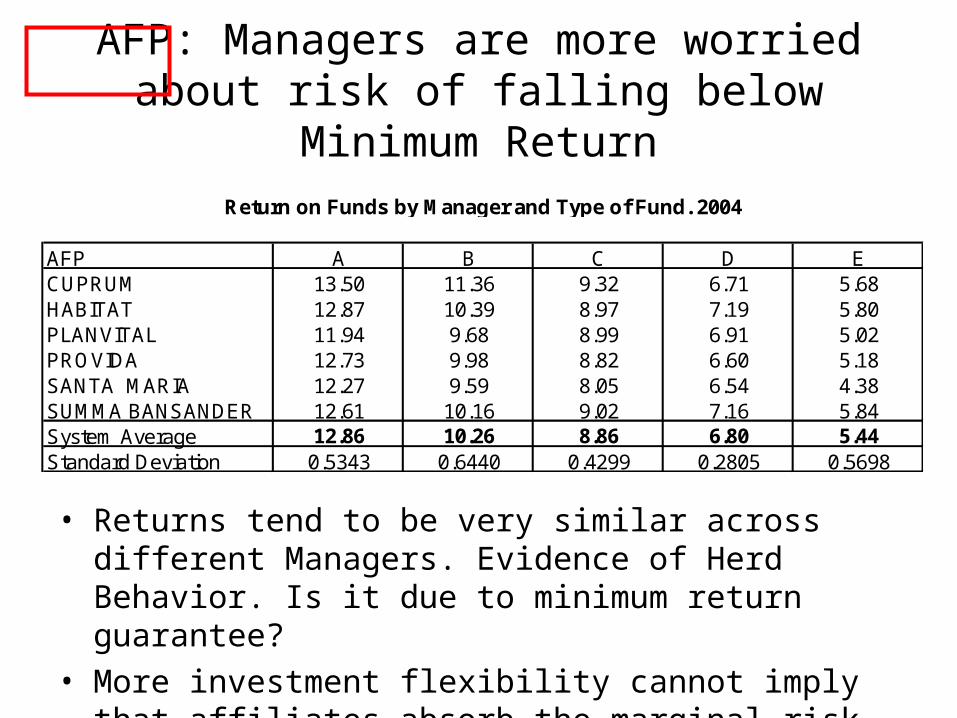
AFP: Managers are more worried about risk of falling below Minimum Return
AFP A B C D ECUPRUM 13.50 11.36 9.32 6.71 5.68HABITAT 12.87 10.39 8.97 7.19 5.80PLANVITAL 11.94 9.68 8.99 6.91 5.02PROVIDA 12.73 9.98 8.82 6.60 5.18SANTA MARIA 12.27 9.59 8.05 6.54 4.38SUMMA BANSANDER 12.61 10.16 9.02 7.16 5.84System Average 12.86 10.26 8.86 6.80 5.44Standard Deviation 0.5343 0.6440 0.4299 0.2805 0.5698
Return on Funds by Manager and Type of Fund. 2004
• Returns tend to be very similar across different Managers. Evidence of Herd Behavior. Is it due to minimum return guarantee?
• More investment flexibility cannot imply that affiliates absorb the marginal risk. Who and how deals with it?
6) Transitional issues– Recognition bonds– Past macroeconomic events– Fiscal adjustment

There are also Transition Issues
– Recognition Bonds: calculated over an inconvenient base because unemployment was too high between 1975 and 1979
– Previsional Damage– High Unemployment
in 80s y 00s
These unresolved issues bias political economy
against the reform
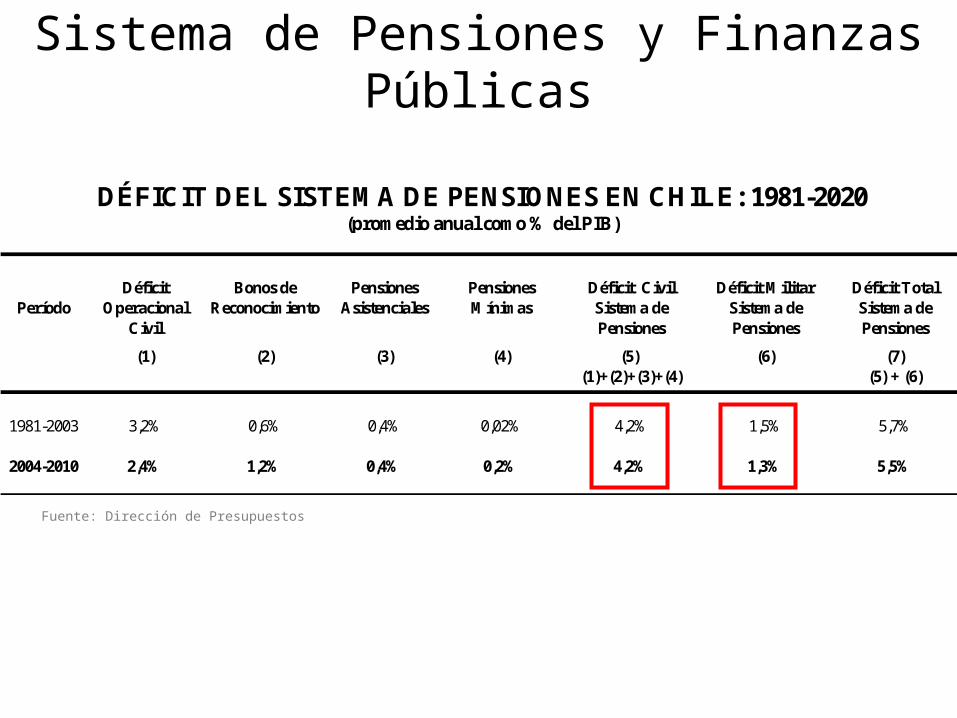
Déficit Bonos de Pensiones Pensiones Déficit Civil Déficit Militar Déficit TotalPeríodo Operacional Reconocimiento Asistenciales Mínimas Sistema de Sistema de Sistema de
Civil Pensiones Pensiones Pensiones
(1) (2) (3) (4) (5) (6) (7)(1)+(2)+(3)+(4) (5) + (6)
1981-2003 3,2% 0,6% 0,4% 0,02% 4,2% 1,5% 5,7%
2004-2010 2,4% 1,2% 0,4% 0,2% 4,2% 1,3% 5,5%
DÉFICIT DEL SISTEMA DE PENSIONES EN CHILE: 1981-2020(promedio anual como % del PIB)
Sistema de Pensiones y Finanzas Públicas
Fuente: Dirección de Presupuestos

7) Industrial Organization issues
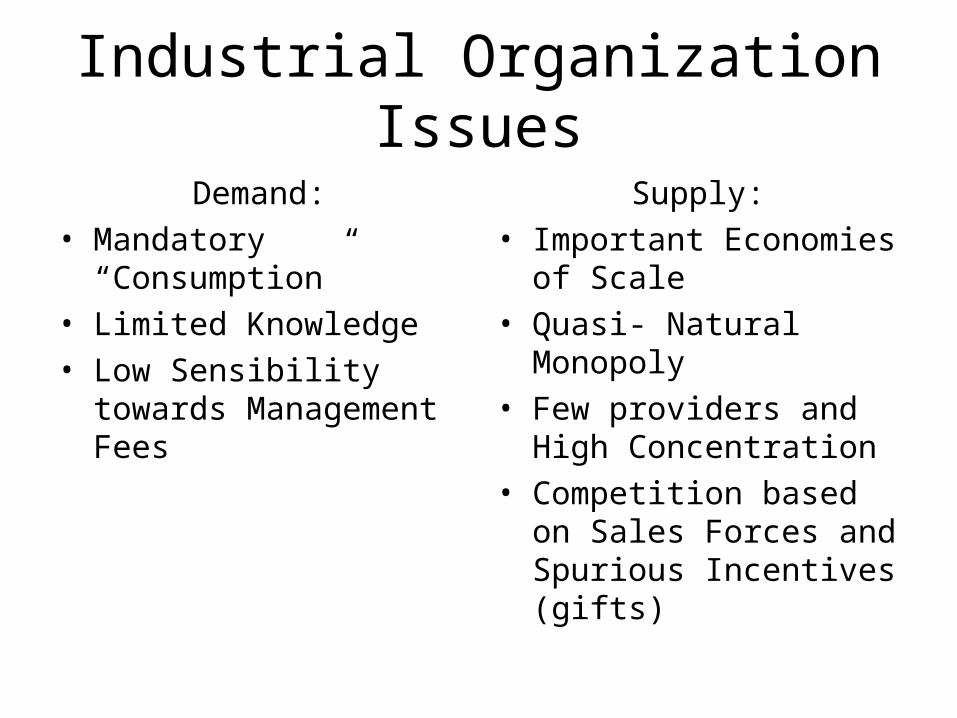
Industrial Organization Issues
Demand:• Mandatory
“Consumption”• Limited Knowledge• Low Sensibility towards
Management Fees
Supply:• Important Economies of
Scale• Quasi- Natural Monopoly • Few providers and High
Concentration• Competition based on
Sales Forces and Spurious Incentives (gifts)

Comments on
Old-Age Income Support in the 21st
Century: An International Perspective on Pension Systems and Reforms
by R. Holzmann and R. Hinzplus several colleagues
Guillermo Larrain RiosSuperintendent of Pension Funds Administrators, Chile
President of AIOS
Cartagena de Indias, May 20th, 2005