Embed Size (px)
Citation preview

Come Grow with Us!
Making a Difference for Children and Families
Through State Systems Improvement Planning
WV BIRTH TO THREE
LOCAL STAKEHOLDER WEBINAR
PART 2
Pamela Roush, Director, WV Birth to Three

Today’s Webinar
COME GROW WITH US ! WEST VIRGINIA’S COMMITMENT TO QUALITY SERVICES FOR CHILDREN AND FAMILIES IN OUR PART 1 WEBINAR WE REVIEWED: Data for all indicators of the State’s Annual Performance Plan (APR) The new federal requirement for a state systems improvement planning
process How data will be used by the U.S. Department of Education to evaluate
the effectiveness of states’ early intervention systems The critical role of local WVBTT system in supporting quality data and
evidence based practices
1

Come Grow with Us
IN THIS PART 2 WEBINAR WE WILL: Briefly review highlights from the Part 1 webinar Review requirements for the new State Systems
Improvement Plan (SSIP) Look at more in-depth data on the Child Outcome measure
for social emotional development Review West Virginia’s selected State Identified
Measureable Result (SIMR) Review the Theory of Action from the State Systems
Improvement Plan (SSIP) and major areas where improvement activities will be focusing
Identify opportunities for input from stakeholders
2

Come Grow with Us Part 1
COME GROW WITH US WEBINAR PART 1 - POSTED ON THE WVBTT WEBSITE - LINKED FROM THE BULLETIN BOARD Includes charts that reflect the increase in numbers of
children receiving services through WVBTT Includes data on all of the APR indicators (submitted to U.S.
Department of Education/Office of Special Education Programs in February 2015)
Performance on the APR indicators reflects the
commitment to children and families
3

Child Count
WV BIRTH TO THREE 12 MONTH AGGREGATE CHILD COUNTS (2008-2014)
4

WV Birth to Three Performance Data –FFY 2013 APR
INDICATOR FFY 2010 DATA FFY 2011 DATA FFY 2012 DATA FFY 2013 DATA
1. Timely provision of early intervention services 98.47% 98.1% 98% 99.02% *
2. Infants and Toddlers Served in Natural Environments 100% 100% 100% 99.97%
3. Early Childhood Outcomes Data See Attached
Table See Attached
Table See Attached
Table See attached
table
4. Percent of families participating in Part C who report that early intervention services have helped the family: A. Know their rights;
82.5% 79.1% 81.5% 97.16%
B. Effectively communicate their children’s needs; and 79.3% 76.6% 79.9% 96.14%
C. Help their children develop and learn. 90.2% 88.7% 87.7% 96.71%
5. Infants and toddlers served birth to one 2.02% 1.79% 1.98% 2.36%
6. Infants and toddlers served birth to three 3.95% 4.09% 4.42% 4.76%
7. 45-day timeline for evaluation and assessment and initial IFSP meeting
97%
97%
97%
99.01% *
8. A. IFSPs with transition steps and services 99% 98.97% 100% 100%
8. B. Notification to LEA and SEA, if child potentially eligible for Part B
100% 100% 98% 97.91%
8. C. Transition conference, if child potentially eligible for Part B
98% 99.26% *
5
*There was an error in OSEP’s APR template for calculating Indicators 1, 7 and 8c. The data in this table reflects corrections made in April 2015 after OSEP corrected the errors.

West Virginia’s Performance
WV BIRTH TO THREE DATA ON THE NATIONAL APR INDICATORS IS A POSITIVE REFLECTION ON ALL THE DEDICATION AND WORK OF EVERYONE IN THE WVBTT SYSTEM – ALONG WITH OUR COMMUNITY PARTNERS CONGRATULATIONS TO EVERYONE ! IT TAKES EVERYONE WORKING TOGETHER TO ACHIEVE THESE RESULTS!
6

Expanding the Focus
7
Annual Performance Report (APR) has expanded to include a State Systemic
Improvement Plan (SSIP) - moving beyond compliance to include
results.

Results Driven Accountability Annually OSEP issues a ‘determination rating ’ for each state’s Part C (WVBTT) and
Part B (WV Department of Education) systems Historically WVBTT has received ‘Meets requirements’ (highest rating given)
In past years OSEP relied primarily on the data for the compliance indicators in our
SPP/APR (Timely service, 45 day timeline, transition, correction of non compliance)
Beginning with states’ submission of APR in February 2015 and SSIP in April 2015, OSEP will make determinations based on both compliance and results indicators
Results focus will be mostly on Indicator 3 – Child Outcomes Are states completing measurements for all children? Are children making progress toward same age peers?
Is early intervention making a measurable difference?
8

Year 1 - FFY 2013 Due April 2015
Year 2 - FFY 2014 Report due April 2016
Years 3-6 FFY 2015-18 due February 2017- 2020
Phase I Analysis
Phase II Plan
Phase III Evaluation
• Data Analysis • Identification of the
Focus for Improvement (SIMR)
• Infrastructure to Support Improvement and Build Capacity
• Theory of Action
• Infrastructure Development
• Support for EIS Program/LEA in Implementing Evidence-Based Practices
• Evaluation Plan
• Results of Ongoing Evaluation
• Extent of Progress
• Revisions to the SPP
SSIP Is New Addition to the APR
9

SSIP – Come Grow with Us! SSIP COMPONENTS Analysis of various data sources – policies, mission statements, forms, child
outcome data Looking closer at Child Outcome data
How do we compare to national data on outcomes? Do we see differences in regions? Do we see differences by family or child characteristics?
Identify a Child Outcome area to target for more growth
State Identified Measureable Result - SIMR Identify evidence-based practices and other improvements that will continue to
grow quality and promote good outcomes What can the state do to support this growth? – Theory of Action
10
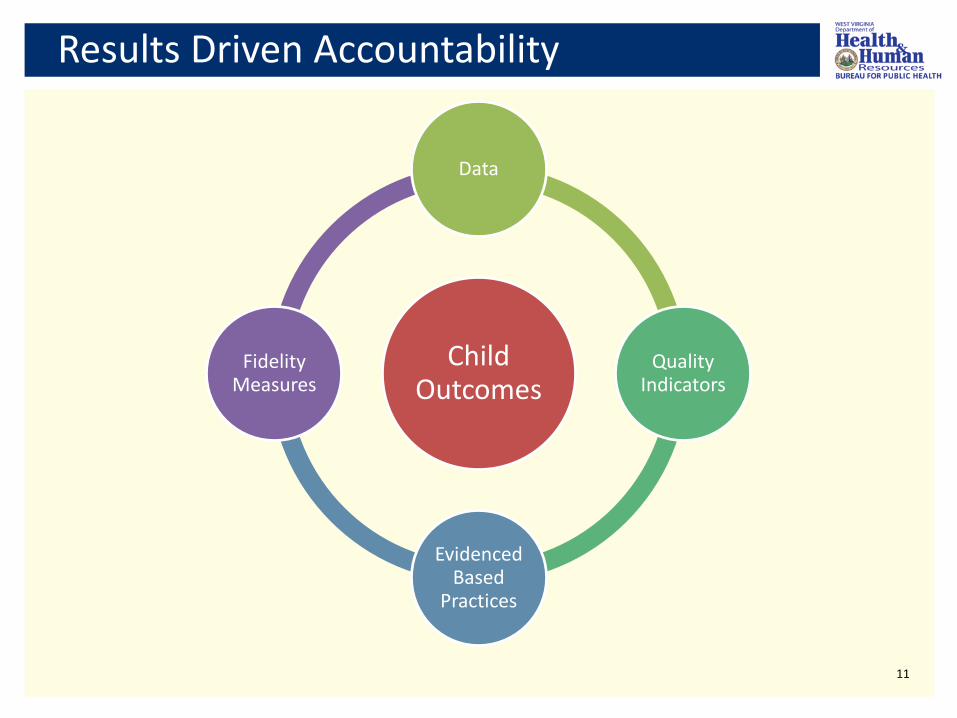
Results Driven Accountability
Child Outcomes
Data
Quality Indicators
Evidenced Based
Practices
Fidelity Measures
11

Why is the Child Outcome Process Important?
First and foremost, the COSF process allows teams, with families, to think beyond evaluation scores/data to how the child is doing in everyday activities. Teams can problem solve with families to identify IFSP outcomes and strategies that will help families to promote the child’s development and learning by participating in daily routines. Congress included child outcome measures in Part C of IDEA in order to show the functional progress that children make as a result of being in early intervention. And this is why OSEP will focus on child outcomes as a measure of state early intervention systems’ effectiveness.
12
Use of COSF Ratings Beyond IFSP
After the COSF rating discussion, and IFSP outcome work, the COSF rating is entered into a data system. The entry and exit rating for each child who exited during a given time period is input into a calculator that was developed by the National Early Childhood Outcome Center (ECO). This calculator measures the level of progress that each child made from entry to exit. Only children who received at least six months of service can included.
13
How OSEP Uses Child Outcome Data OSEP will compare our state child outcome data to that of
other states – both for ‘completeness’ and ‘results’.
OSEP will look at whether WV is showing improvement (increases) in child outcome ratings from year to year – are children making enough progress to move closer to their same age peers?
OSEP will look at what analyses we have done to identify ways to improve outcome results for children and families.
OSEP will look at what evidence based practices and other improvement strategies we have identified – are they likely to result in improved outcomes for children and families.
14

‘Completeness’ of Child Outcome Data
The ‘completeness’ of our Child Outcomes Data refers to the percent of exiting children for whom we have both entry and exit COSF data.
Total number of children who exited during FFY 2013 (July 1, 2013-June 30, 2014) – 2,769
OSEP expects states to have complete data for at least 70% of total exiters – 1,938
We had complete data for 1,271 children
We did better this year with ‘completeness’ – but need to keep improving.
15

# of Completed COSFs by Region
Region Number of Children with Complete Entry/Exit Reported
1 272
2 168
3 142
4 243
5 59
6 76
7 147
8 143
TOTAL 1,250*
16
*Excludes Children who Entered and Exited Under At-Risk Eligibility Only
Number of Completed COSF By Region as Reported in FFY 2013 SPP/APR COSF Data for Children who Exited July 1, 2013 - June 30,2014
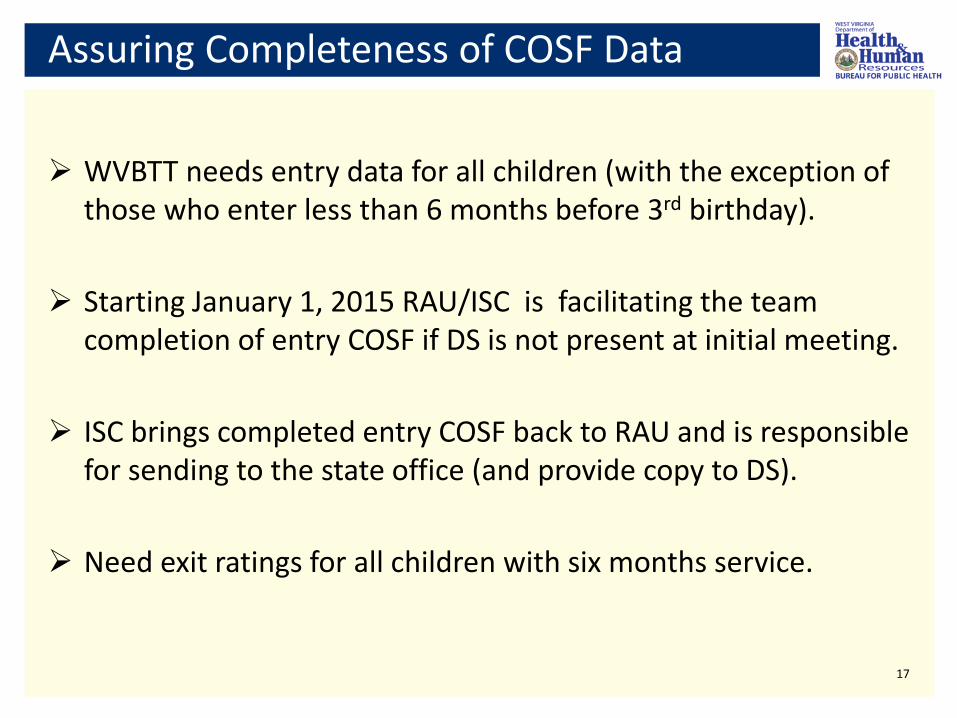
Assuring Completeness of COSF Data
WVBTT needs entry data for all children (with the exception of those who enter less than 6 months before 3rd birthday).
Starting January 1, 2015 RAU/ISC is facilitating the team completion of entry COSF if DS is not present at initial meeting.
ISC brings completed entry COSF back to RAU and is responsible for sending to the state office (and provide copy to DS).
Need exit ratings for all children with six months service.
17

Reporting Child Outcomes to OSEP THREE CHILD OUTCOMES CHILDREN WILL DEMONSTRATE IMPROVED:
1. Positive social emotional skills and social relationships; 2. Acquisition of knowledge and skills (including language and
communication); and 3. Use of appropriate behaviors to meet their needs;
5 CATEGORIES UNDER EACH OUTCOME: a. Children who did not improve functioning; b. Children who improved functioning but not enough to move closer to
same age peers; c. Children who improved functioning enough to move nearer to same age
peers but did not reach it; d. Children who improved functioning to reach same age peers; and e. Children who maintained functioning comparable to same age peers.
18

Trajectories for Categories a-e
0
10
20
30
40
50
60
70
1 6 11 16 21 26 31 36 41 46 51 56
Sco
re
Age in Months
Illustration of 5 Possible Paths
Maintained functioning comparable to age peersAchieved functioning comparable to age peersMoved nearer functioning comparable to age peersMade progress; no change in trajectoryDid not make progress
19
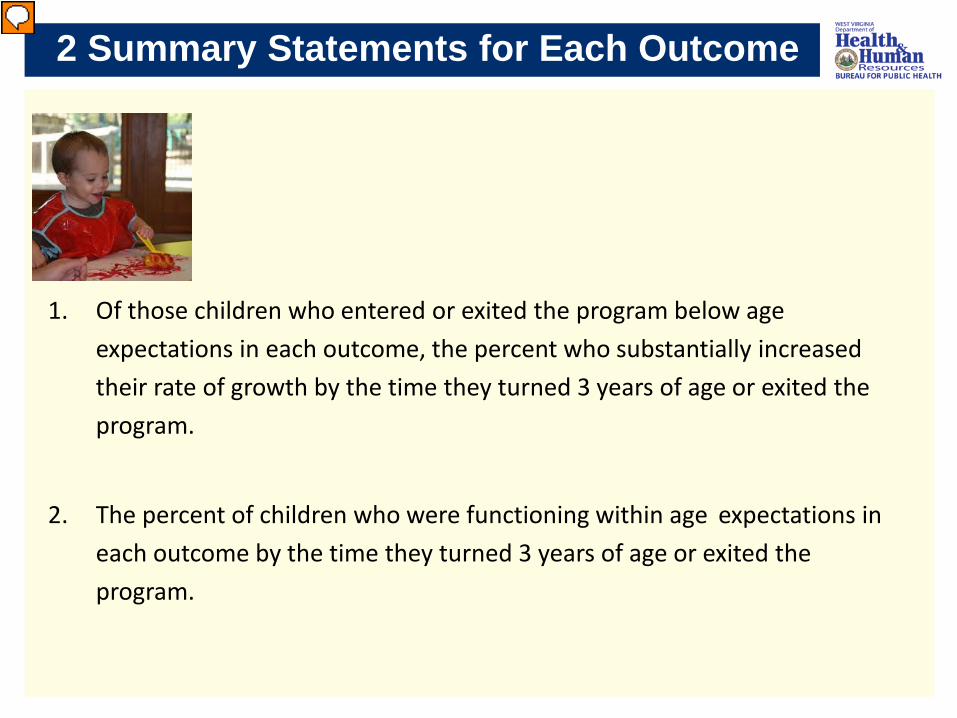
2 Summary Statements for Each Outcome
1. Of those children who entered or exited the program below age expectations in each outcome, the percent who substantially increased their rate of growth by the time they turned 3 years of age or exited the program.
2. The percent of children who were functioning within age expectations in each outcome by the time they turned 3 years of age or exited the program.
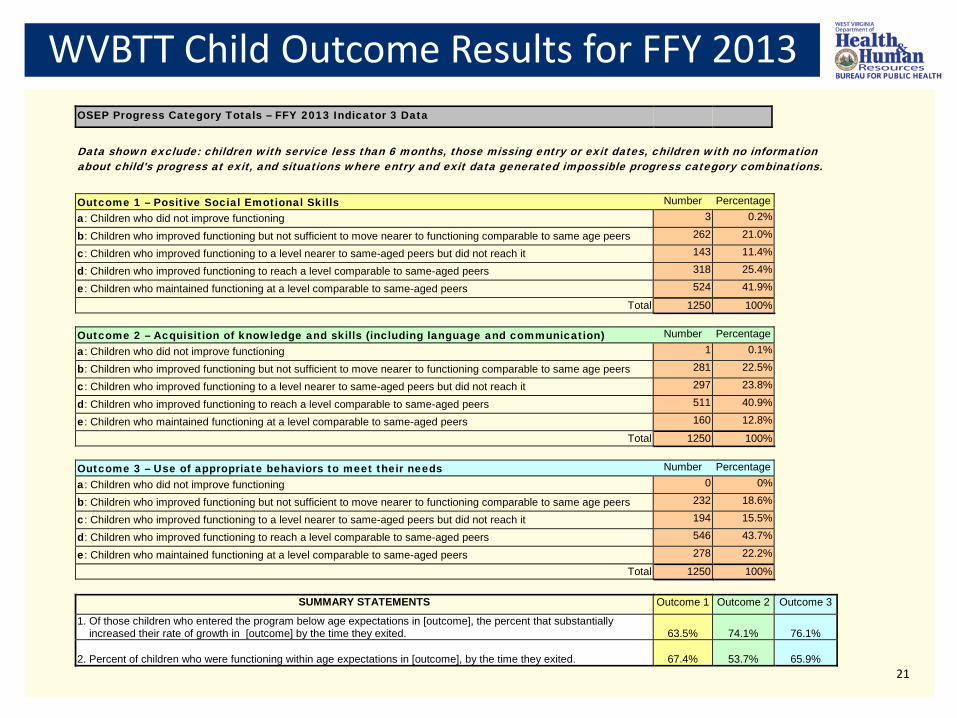
WVBTT Child Outcome Results for FFY 2013 OSEP Progress Category Totals – FFY 2013 Indicator 3 Data
Data shown exclude: children with service less than 6 months, those missing entry or exit dates, children with no information about child's progress at exit, and situations where entry and exit data generated impossible progress category combinations.
Outcome 1 – Positive Social Emotional Skills Number Percentage a: Children who did not improve functioning 3 0.2%
b: Children who improved functioning but not sufficient to move nearer to functioning comparable to same age peers 262 21.0%
c: Children who improved functioning to a level nearer to same-aged peers but did not reach it 143 11.4%
d: Children who improved functioning to reach a level comparable to same-aged peers 318 25.4%
e: Children who maintained functioning at a level comparable to same-aged peers 524 41.9%
Total 1250 100%
Outcome 2 – Acquisition of knowledge and skills (including language and communication) Number Percentage a: Children who did not improve functioning 1 0.1%
b: Children who improved functioning but not sufficient to move nearer to functioning comparable to same age peers 281 22.5%
c: Children who improved functioning to a level nearer to same-aged peers but did not reach it 297 23.8%
d: Children who improved functioning to reach a level comparable to same-aged peers 511 40.9%
e: Children who maintained functioning at a level comparable to same-aged peers 160 12.8%
Total 1250 100%
Outcome 3 – Use of appropriate behaviors to meet their needs Number Percentage a: Children who did not improve functioning 0 0%
b: Children who improved functioning but not sufficient to move nearer to functioning comparable to same age peers 232 18.6%
c: Children who improved functioning to a level nearer to same-aged peers but did not reach it 194 15.5%
d: Children who improved functioning to reach a level comparable to same-aged peers 546 43.7%
e: Children who maintained functioning at a level comparable to same-aged peers 278 22.2%
Total 1250 100%
SUMMARY STATEMENTS Outcome 1 Outcome 2 Outcome 3
1. Of those children who entered the program below age expectations in [outcome], the percent that substantially increased their rate of growth in [outcome] by the time they exited. 63.5% 74.1% 76.1%
2. Percent of children who were functioning within age expectations in [outcome], by the time they exited. 67.4% 53.7% 65.9% 21

Understanding Child Outcomes Data State Systems Improvement Plan (SSIP) identifies the analyses that
were completed to identify where to focus improvement activities in order to have more children making more progress.
Analysis included reviewing child outcomes data by geographic area, child demographics, length of service, age at initial IFSP, etc.
Children must receive at least six months of service in order to be counted in the ratings.
OSEP excludes children who were eligible under “At-Risk Only” –
there were 21 children in our data who were eligible under at-risk only at both entry and exit - They are not included in this data.
22
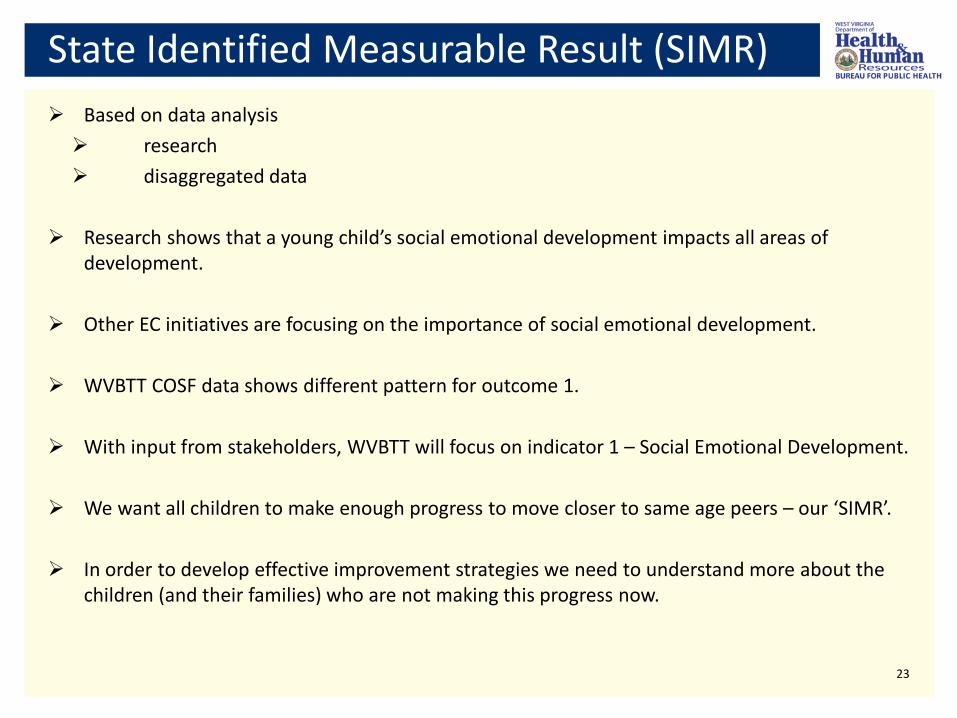
State Identified Measurable Result (SIMR) Based on data analysis research disaggregated data
Research shows that a young child’s social emotional development impacts all areas of
development.
Other EC initiatives are focusing on the importance of social emotional development.
WVBTT COSF data shows different pattern for outcome 1.
With input from stakeholders, WVBTT will focus on indicator 1 – Social Emotional Development.
We want all children to make enough progress to move closer to same age peers – our ‘SIMR’.
In order to develop effective improvement strategies we need to understand more about the children (and their families) who are not making this progress now.
23

WVBTT Child Outcome Results for FFY 2013 OSEP Progress Category Totals – FFY 2013 Indicator 3 Data
Data shown exclude: children with service less than 6 months, those missing entry or exit dates, children with no information about child's progress at exit, and situations where entry and exit data generated impossible progress category combinations.
Outcome 1 – Positive Social Emotional Skills Number Percentage a: Children who did not improve functioning 3 0.2%
b: Children who improved functioning but not sufficient to move nearer to functioning comparable to same age peers 262 21.0%
c: Children who improved functioning to a level nearer to same-aged peers but did not reach it 143 11.4%
d: Children who improved functioning to reach a level comparable to same-aged peers 318 25.4%
e: Children who maintained functioning at a level comparable to same-aged peers 524 41.9%
Total 1250 100%
Outcome 2 – Acquisition of knowledge and skills (including language and communication) Number Percentage a: Children who did not improve functioning 1 0.1%
b: Children who improved functioning but not sufficient to move nearer to functioning comparable to same age peers 281 22.5%
c: Children who improved functioning to a level nearer to same-aged peers but did not reach it 297 23.8%
d: Children who improved functioning to reach a level comparable to same-aged peers 511 40.9%
e: Children who maintained functioning at a level comparable to same-aged peers 160 12.8%
Total 1250 100%
Outcome 3 – Use of appropriate behaviors to meet their needs Number Percentage a: Children who did not improve functioning 0 0%
b: Children who improved functioning but not sufficient to move nearer to functioning comparable to same age peers 232 18.6%
c: Children who improved functioning to a level nearer to same-aged peers but did not reach it 194 15.5%
d: Children who improved functioning to reach a level comparable to same-aged peers 546 43.7%
e: Children who maintained functioning at a level comparable to same-aged peers 278 22.2%
Total 1250 100%
SUMMARY STATEMENTS Outcome 1 Outcome 2 Outcome 3 1. Of those children who entered the program below age expectations in [outcome], the percent that substantially increased their rate of growth in [outcome] by the time they exited. 63.5% 74.1% 76.1%
2. Percent of children who were functioning within age expectations in [outcome], by the time they exited. 67.4% 53.7% 65.9% 24

Outcome 1 – Categories a-e
25
Category Number of children Percent
Category a: Children who did not improve functioning 3 2%
Category b: Children who improved functioning but not sufficient to move nearer to functioning comparable to same age peers
262 21%
Category c: Children who improved functioning to a level nearer to same-aged peers but did not reach it 143 11.4%
Category d: Children who improved functioning to reach a level comparable to same-aged peers 318 25.4%
Category e: Children who maintained functioning at a level comparable to same-aged peers
524 41.9%

Outcome 1 Data - Category and Age at Initial IFSP
Age at Initial IFSP B C D E
0-3 Months 8% 13% 10% 11%
4-6 Months 12% 8% 8% 13%
7-9 Months 7% 6% 8% 9%
10-12 Months 8% 6% 7% 6%
13- 24 Months 38% 37% 37% 38%
25-27 Months 18% 18% 20% 13%
28 Months 3% 4% 6% 4%
29 Months 4% 6% 4% 4%
30 Months 2% 3% 2% 1%
26
B C D E Average Age at Initial IFSP (in months) 17 17 18 16
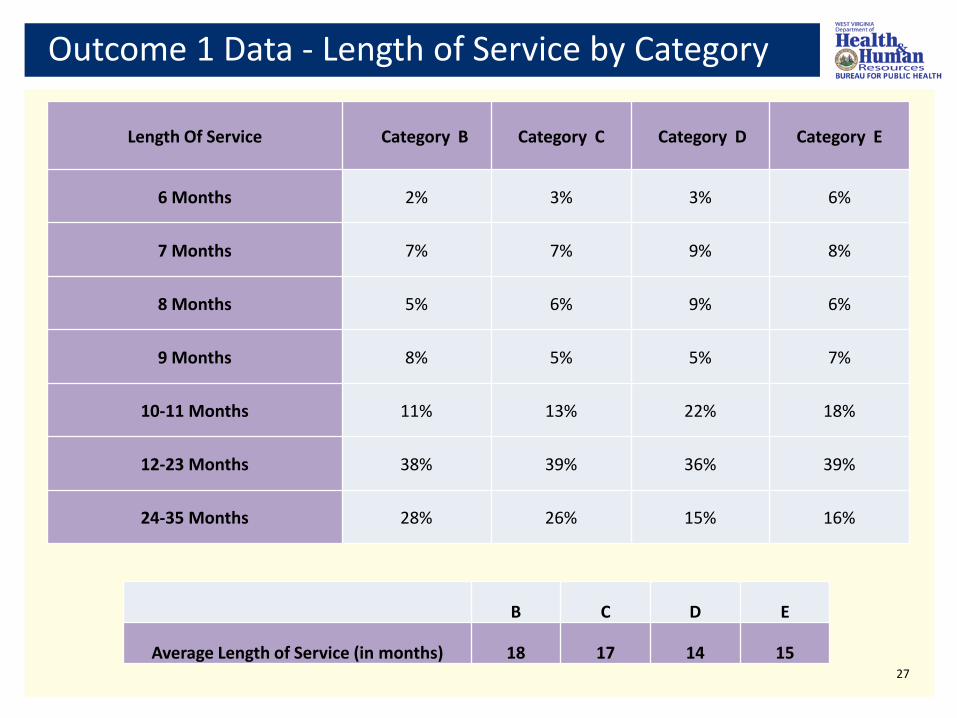
Outcome 1 Data - Length of Service by Category
Length Of Service Category B Category C Category D Category E
6 Months 2% 3% 3% 6%
7 Months 7% 7% 9% 8%
8 Months 5% 6% 9% 6%
9 Months 8% 5% 5% 7%
10-11 Months 11% 13% 22% 18%
12-23 Months 38% 39% 36% 39%
24-35 Months 28% 26% 15% 16%
27
B C D E
Average Length of Service (in months) 18 17 14 15

Looking Closer at Outcome 1 - Category b Who do we think these children are? What are their characteristics ? What do you think was their average age at initial IFSP? What do you think was their average length of service?
28
Category Number of Children
Percentage of Children
Category b: Children who improved functioning but not sufficient to move nearer to functioning comparable to same age peers
262 21%

Disaggregating by Primary Eligibility
29
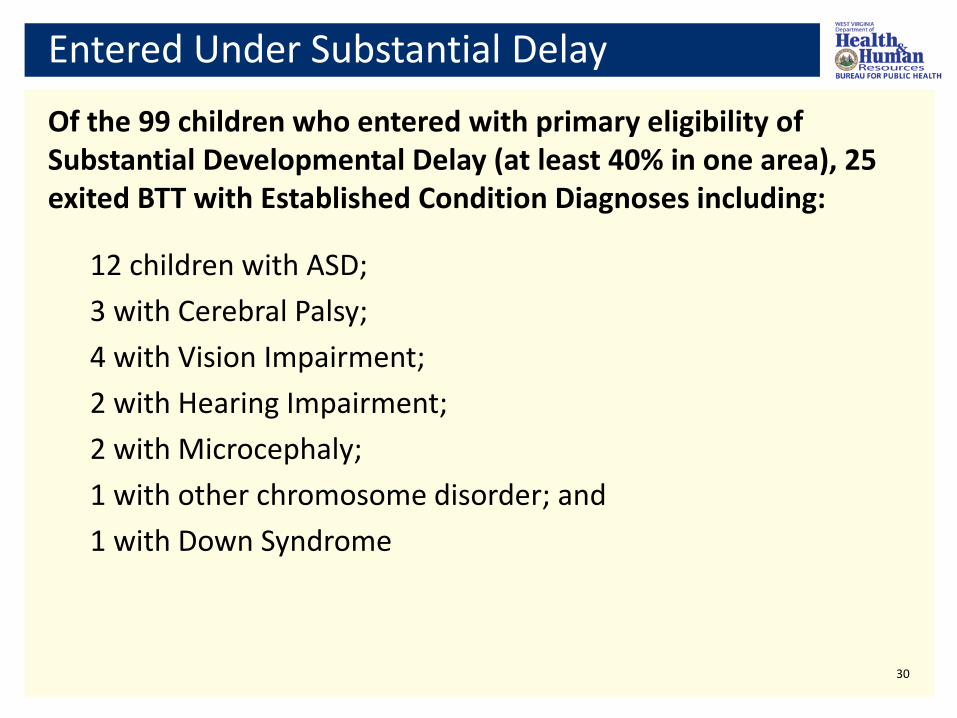
Entered Under Substantial Delay
Of the 99 children who entered with primary eligibility of Substantial Developmental Delay (at least 40% in one area), 25 exited BTT with Established Condition Diagnoses including:
12 children with ASD; 3 with Cerebral Palsy; 4 with Vision Impairment; 2 with Hearing Impairment; 2 with Microcephaly; 1 with other chromosome disorder; and 1 with Down Syndrome
30

Established Conditions at Entry and Exit
Of 21 children who entered and exited with established conditions: 3 had primary eligibility under Hearing impairment; 5 had primary eligibility under Vision Impairment; and Other primary eligibilities included Inborn Errors of Metabolism, Intraventricular Hemorrhage, and cerebral palsy. Only one child in this reporting period entered and exited with a diagnosis of Autism. This data will likely look different in future years as more children are being diagnosed at a younger age and prior to referral to WVBTT.
31

Exiting with Established Condition
Of 13 other children who entered under another category of Developmental Delay and exited with an Established Condition: 3 exited with primary eligibility of Autism; 6 exited with primary eligibility of Vision Impairment; 1 exited with primary eligibility of Cerebral Palsy; and 3 exited with other Nervous System diagnoses.
32

Social Emotional Dev of Children with HI, VI and ASD
SOME IMPROVEMENT PRACTICES ARE UNIVERSAL TO ALL CHILDREN Evaluation/assessment tools that are sensitive to measuring
social emotional development; Comfort level of practitioners in addressing social emotional
development; Understanding that social emotional development effects all
areas of development; Coaching families on use of strategies to promote social
emotional development; Comfort level with COSF ratings; and Outreach to parents through variety of channels to understand
importance of social emotional development.
33
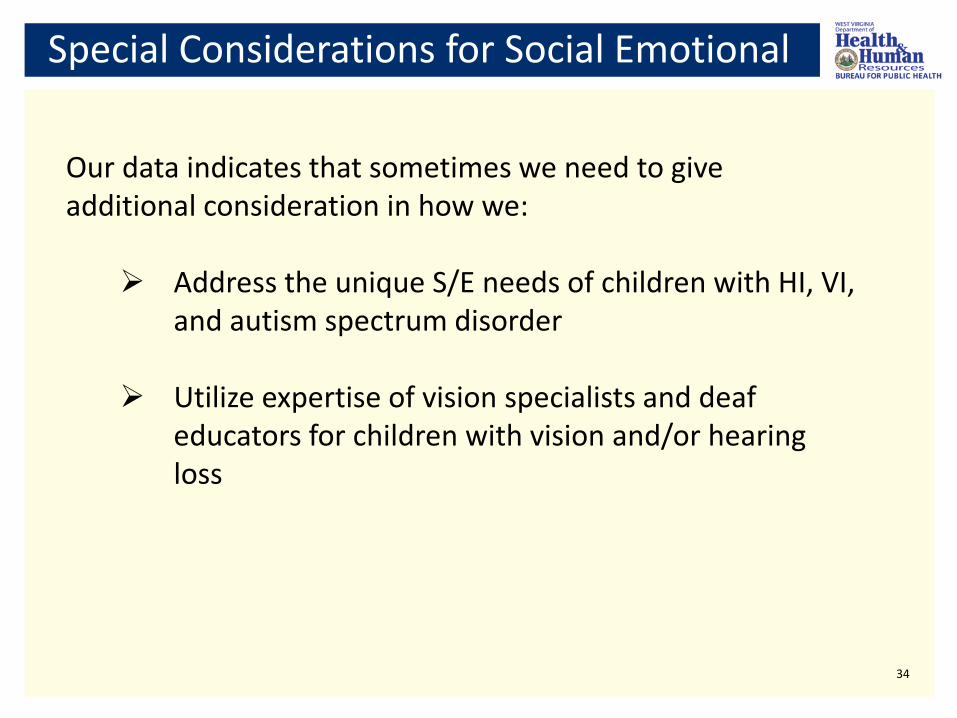
Special Considerations for Social Emotional
Our data indicates that sometimes we need to give additional consideration in how we:
Address the unique S/E needs of children with HI, VI, and autism spectrum disorder
Utilize expertise of vision specialists and deaf educators for children with vision and/or hearing loss
34

Developing the State Systems Improvement Plan
As we look at all the components of our SSIP, the ultimate change we are working toward (our ‘SIMR’) is that more children will make sufficient progress to move closer to their same age peers.
Since children are learning in the context of their everyday lives, our work really has to focus on the families and caregivers.
This means we have to understand how our engagement with families will benefit a child’s social emotional development.
OSEP asks states to identify in their SSIP, how their improvement strategies are likely to result in the chosen SIMR.
We have to select strategies that have an evidence based and related to the needs of children and families in WV.
35
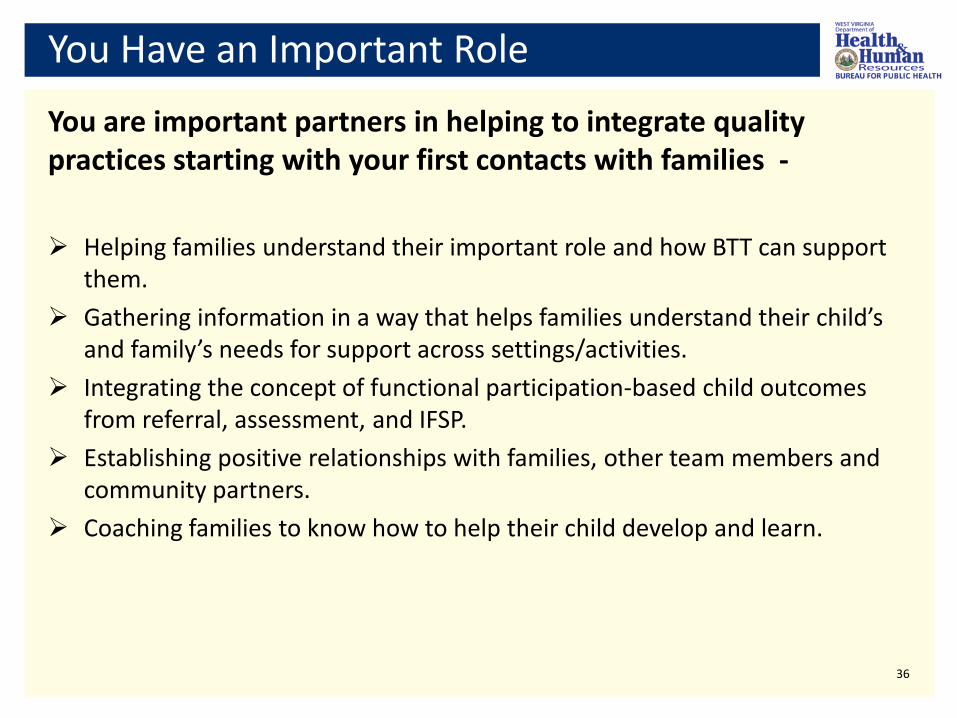
You Have an Important Role
You are important partners in helping to integrate quality practices starting with your first contacts with families - Helping families understand their important role and how BTT can support
them. Gathering information in a way that helps families understand their child’s
and family’s needs for support across settings/activities. Integrating the concept of functional participation-based child outcomes
from referral, assessment, and IFSP. Establishing positive relationships with families, other team members and
community partners. Coaching families to know how to help their child develop and learn.
36

WVBTT State Identified Measurable Result (SIMR)
WVBTT STATE IDENTIFIED MEASURABLE RESULT (SIMR)
“Of the children who enter WVBTT below age expectations in Outcome 1, a higher percentage will substantially increase their rate of growth by the time they exit the program.” WVBTT’s state system improvement plan will be posted soon on the website, through the Come Grow With Us link on the bulletin board. The ‘Theory of Action’ highlights the major steps the state will take to support improvements.
37

WVBTT, with input from stakeholders, will be developing action plans with more details for each of the major improvement areas. Actions plans will include tools to measure the quality of implementation. Today’s webinar will touch on two of the improvement areas: Integrating Strengthening Families Framework; and Enhancing the WVBTT Data System.
38
Theory of Action

39
Improvement Area A. If WVBTT … B. Then … C. Then … D. Then… E. Then…
1. Data System Enhances the statewide data system to
capture Child Outcomes data and assign a unique child identifier
Practitioners, SCs, and Lead Agency will be able to view real time data
to know that COSFs have been completed
More comprehensive data will be available for monitoring and
evaluating child outcomes and improvement efforts at local and
state level
Completed child outcome measures will be available for more children exiting
WVBTT
More infants and toddlers exiting
WVBTT will make enough
improvement in their social emotional
skills to move closer to their same age
peers
2. Communication
Implements a broad communication plan to routinely share detailed child
outcome results data and SSIP activities with stakeholders at all levels
RAUs, Practitioners, SCs and Community Partners will be more
informed and invested in improvement strategies
Practitioners’ interest and participation in trainings and
system evaluation related to SE development will increase
Practitioners will better understand evidence based
practices to support S/E development and how to evaluate implementation
3. Interagency Collaboration
Collaborates with EC and other partners to design and implement a
public awareness campaign emphasizing the importance of and
ways to support social emotional development
EC and Community partners will be more aware of the importance of supporting young children’s social
emotional development
EC and Community partners will incorporate information on social
emotional development in outreach activities to increase families’ access to resources and tools to promote
social emotional development
Families will have resources and better know how to support social emotional
development
4. Professional Development
Designs and implements a comprehensive training and technical assistance plan focused on increasing the knowledge and skills of ISCs, SC
and Practitioners on evidenced based practices for promoting social
emotional development including targeted strategies for children
with vision loss, hearing loss, and autism
ISCs, Practitioners, and SCs will understand: a) how/why social
emotional development impacts all areas of development; b)how to
evaluate social emotional development; and c) how to coach
families in effective strategies
Practitioners will use effective evaluation and assessment practices
and tools for evaluating social emotional development and rating of all children’s functional abilities
Practitioners will be better able to support and coach
families in the use of effective strategies to
promote social emotional development for all infants
and toddlers
5. Professional Development
Incorporates Strengthening Families framework into all aspects of the BTT
system including standard forms, policies, and professional
development activities
Strengthening Families framework strategies will be reflected in
statewide intake, assessment, and IFSP processes
ISCs, Practitioners and SCs will incorporate Strengthening Families Protective Factors strategies in their
work with families
Families will be linked to needed resources to support protective factors that allow
them to be better able to support their children’s
development
WVBTT SSIP THEORY OF ACTION

Data System Enhances the statewide data system to capture Child Outcomes data and assign a unique child identifier.
Communication Implements a broad communication plan to routinely share detailed child outcome results data and SSIP activities with stakeholders at all levels.
Interagency Collaboration
Collaborates with EC and other partners to design and implement a public awareness campaign emphasizing the importance of and ways to support social emotional development .
Professional Development
Designs and implements a comprehensive training and technical assistance plan focused on increasing the knowledge and skills of ISCs, SC and Practitioners on evidenced based practices for promoting social emotional development including targeted strategies for children with vision loss, hearing loss, and autism.
Strengthening Families
Incorporates Strengthening Families Framework into all aspects of the BTT system including standard forms, policies, and professional development activities.
40
Theory of Action – IF WVBTT…

Strengthening Families Framework
Protective factors are conditions in families and communities that when present, increase the health and well- being of children and families.
They are the attributes that serve as buffers, helping parents who might otherwise be at risk of abusing their children to find resources, supports, or coping strategies that allow then to parent effectively, even under stress. The Center for the Study of Social Policy WWW.STRENGTHENINGFAMILIES.NET
41

STRENGTHENING FAMILIES PROTECTIVE FACTORS
42
Stronger Families
Social and emotional competence of children
Concrete support in times of need
Knowledge of parenting & child development
Parental resilience
Social connections
Better Child Outcomes
(including less chance of abuse and
neglect)

Getting Completed Data for More Children
A large number of children exit WVBTT before receiving six months of service.
Age at initial IFSP for children who received less than 6 months
43
Age in Months RAU 1 RAU 2 RAU 3 RAU 4 RAU 5 RAU 6 RAU 7 RAU 8 Total
0-11 51 30 22 33 15 19 47 16 233
12-23 43 23 27 33 16 15 39 14 210
24-29 25 17 26 27 11 11 21 17 155
30-36 62 39 54 60 28 26 51 54 374
Total 181 109 129 153 70 71 158 101 972

Enhancements to WVBTT Data System
Moving to a secure Web-based platform; Will be known as ‘WVBTT Online’; Each child will have unique identifier that will stay with them throughout their
participation in BTT; Child outcome ratings will be in the child’s electronic record; Service Coordinators and Practitioners will have read only access to designated
pages of child records based on their active authorizations; Ability for ISC, SC and Practitioners to upload reports to child record; Each child’s record will have team communication page; Caseload and timeline reports; and State level real time access. 44
WVBTT Online
RAUs will begin using WVBTT Online in mid-September.
Available to OSCs and practitioners in late October.
Each individual must complete WVBTT online access application form in order to have access (availability of forms will be announced).
Application will include additional confidentiality statements.
45
Let’s Stay in Touch!
WE WANT TO KEEP YOU INFORMED! COME GROW WITH US
• POSTINGS ON BTT WEBSITE • COMMUNITIES OF PRACTICE
• SURVEY MONKEY • E-MAIL REMINDERS • TIPS OF THE WEEK
• WEBINARS • TA LIST SERVS
FOR QUESTIONS OR COMMENTS, EMAIL
46

Come Grow With Us!
47