Embed Size (px)
Citation preview
International Journal of Automotive and Mechanical Engineering (IJAME)
ISSN: 2229-8649 (Print); ISSN: 2180-1606 (Online); Volume 2, pp. 157-170, July-December 2010
©Universiti Malaysia Pahang
DOI: http://dx.doi.org/10.15282/ijame.2.2010.5.0013
157
COMBUSTION ANALYSIS OF A CNG DIRECT INJECTION SPARK
IGNITION ENGINE
A. Rashid A. Aziz, Firmansyah and Raja Shahzad
Center for Automotive Research (CAR)
Mechanical Engineering Department, Universiti Teknologi Petronas
Bandar Seri Iskandar, 31750 Tronoh, Perak, Malaysia
Phone: +605-3654069, Fax: +605-3654086
E-mail: [email protected]
ABSTRACT
An experimental study was carried out on a dedicated compressed natural gas direct
injection (CNG-DI) engine with a compression ratio (CR) of 14 and a central injection
system. Several injection timing parameters from early injection timing (300 BTDC) to
partial direct injection (180 BTDC) to full direct injection (120 BTDC) were
investigated. The 300 BTDC injection timing experiment was carried out to simulate
the performance of a port injection engine and the result is used as a benchmark for
engine performance. The full DI resulted in a 20% higher performance than the early
injection timing for low engine speeds up to 2750 rpm. 180 BTDC injection timing
shows the highest performance over an extensive range of engine speed because it has a
similar volumetric efficiency to full DI. However, the earlier injection timing allowed
for a better air–fuel mixing and gives superior performance for engine speeds above
4500 rpm. The engine performance could be explained by analysis of the heat release
rate that shows that at low and intermediate engine speeds of 2000 and 3000, the full DI
and partial DI resulted in the fastest heat release rate whereas at a high engine speed of
5000 rpm, the simulated port injection operation resulted in the fastest heat release rate.
Keywords: Compressed natural gas, direct injection, injection timing
INTRODUCTION
The use of natural gas in the transportation sector has been increasing over the years.
This is further supported by the increasing concern on environmental problems and
energy security. The development of natural gas as a fuel closely followed the growth of
vehicle conversion from both gasoline- and diesel-fuelled engines to natural gas fuelled
in many countries. Fueling systems are becoming critical parts in the vehicle conversion
process (Kato et al., 1999; Catania et al., 2000). In the spark ignition (SI) engine
category, fueling systems can be classified as carburetor, single/multi port injection, and
direct injection. For natural gas vehicles, the first generation fueling system is the mixer
system and this has progressed to the more sophisticated single- and multi-port injection
systems. However, with natural gas as the fuel, spark ignition engine performance drops
to 20% (Mello et al., 2006). It was also stated that the performance drop is due to lower
volumetric and thermal efficiencies.
Despite the performance drop, natural gas had better exhaust emissions. It has
less hydrocarbon and carbon monoxide compared to gasoline fuel. The lower CO
emission of natural gas fuel was also confirmed by Pourkhesalian et al. (2009). They

A. Rashid A. Aziz et al. / International Journal of Automotive and Mechanical Engineering 2 (2010) 157-170
158
also stated that the BSFC of methane as fuels is lower compared to gasoline fuel. These
potentials of natural gas as fuels need to be improved further. The highest obstacle of
natural gas to be implemented for a wide range of applications is the engine power
output. The gaseous phase of natural gas has the advantage of a faster mixing rate.
However, the gaseous phase is also the main cause of lower volumetric efficiency. In
order to reduce this effect, recent investigations in natural gas engines are looking at the
direct injection system as a possibility for the fourth generation fueling system to
increase the natural gas engines’ performance. A direct injection system is expected to
increase the volumetric efficiency of the natural gas engine and is able to operate in lean
conditions.
The feasibility of implementing direct injection systems in CNG engines has
been investigated by a few researchers. Huang et al. (2003a) discussed the possibility of
a direct injection system in a CNG engine using a rapid compression machine (RCM)
with a 10 CR and observed that the injection timing significantly affected the intensity
of fuel stratification before ignition which in turn affects the combustion behaviour of a
CNG-DI engine. Hayashida et al. (1999) proved that injection timing could increase
engine volumetric efficiency and brake power while the best fuel air mixing occur with
the injection events around inlet valve closing (IVC): later confirmed by Zeng et al.
(2006). Wang and Watson (2000) had shown that direct injection of CNG has lower
hydrocarbon emission compared to port injection. These previous investigations had led
to the notion that controlling the injection timing in a direct injection system could
further increase the CNG engine performance. However, these previous researchers
conducted their experiment on either a rapid compression machine or a converted
gasoline fuelled engine in which the compression ratio was maintained near the knock
limiting value of gasoline. In order to fully utilize the capability of CNG fuel, which has
a higher knock limit, the present research was conducted on a dedicated engine with a
compression ratio of 14. The objectives of this research are to investigate the effect of
injection timing on the performance, emissions and combustion behaviour of the CNG-
DI engine. The results of varying the injection timing on the performance of a CNG-DI
engine at wide-open throttle (WOT) and a wide range of engine speeds are presented.
MATERIALS AND METHODS
Experimental Procedure
This research was based on the experimental study conducted at the Centre for
Automotives Research (CAR) in Universiti Teknologi PETRONAS (UTP). The test
conducted follows the SAE standard on engine performance and emission testing. The
experimental set up is shown in Figure 1. Wide-open throttle is specified in this
experiment as representative of full load condition. The equivalence ratio was kept
constant at 1.0, and the ignition timing was adjusted via the engine control unit (ECU)
to obtain the best torque reading (MBT). The engine speed range was 2000–5000 rpm.
The injection timing was varied from a very early injection timing at 300 BTDC
(intake valve starting to open at 372 BTDC) to a late injection timing at 120 BTDC
(intake valve close at 132 BTDC). In Figure 2, the early injection timing with the start
of injection (SOI) at 300 BTDC is to simulate port injection fueling system. At an SOI
of 180 BTDC, a partial direct injection was achieved where the injection starts while
the intake valve is open and ends after the intake valve is closed. The full DI is achieved

Combustion analysis of a CNG direct injection spark ignition engine
159
for injection events after the intake valve closed. It should be noted that full DI is
limited by the ignition timing for safety reasons. Hence, in our investigation, all
injection events were completed before ignition occurred. All the experiments were
conducted with a stable operation with a 5% COV of IMEP.
415 VAC
POWER SUPPLY
Water Pump Oil Pump
DYNAMOMETER
DYNAMOMETER CONTROL PANEL HV
(POWER HANDLING)
POWER
SUPPLY
E
C
U
P-1
P-2
P-3
P-4
P-5 P-6 P-5
P-7 P-8
P-9
P-9
P-10
P-11
P-13
P-15
P-17Console
control
(LV)
E
R
I
SCXIP-18
P-19
P-21
P-22
P-23
Figure 1. Experimental set up
-450 -360 -270 -180 -90 0 90
Crank Angle (degree)
BDC TDCTDC
SOI=120 BTDC
SOI=180 BTDC
SOI=300 BTDC
IVCIVO
Injection Duration
I
g
n
i
t
i
o
n
T
i
m
i
n
g
Full Direct
Injection
Partial Direct
Injection
Simulate Port
Injection
Figure 2. Injection timing characterization
Equipment
The engine used in this experiment is a four-stroke spark ignition single cylinder
research engine. Table 1 elaborates the specification of the experimental engine. A fuel
pressure regulator was used to control the fuel rail pressure and stabilize the injector
pressure. Engine control parameters such as injection timing, ignition timing and air-
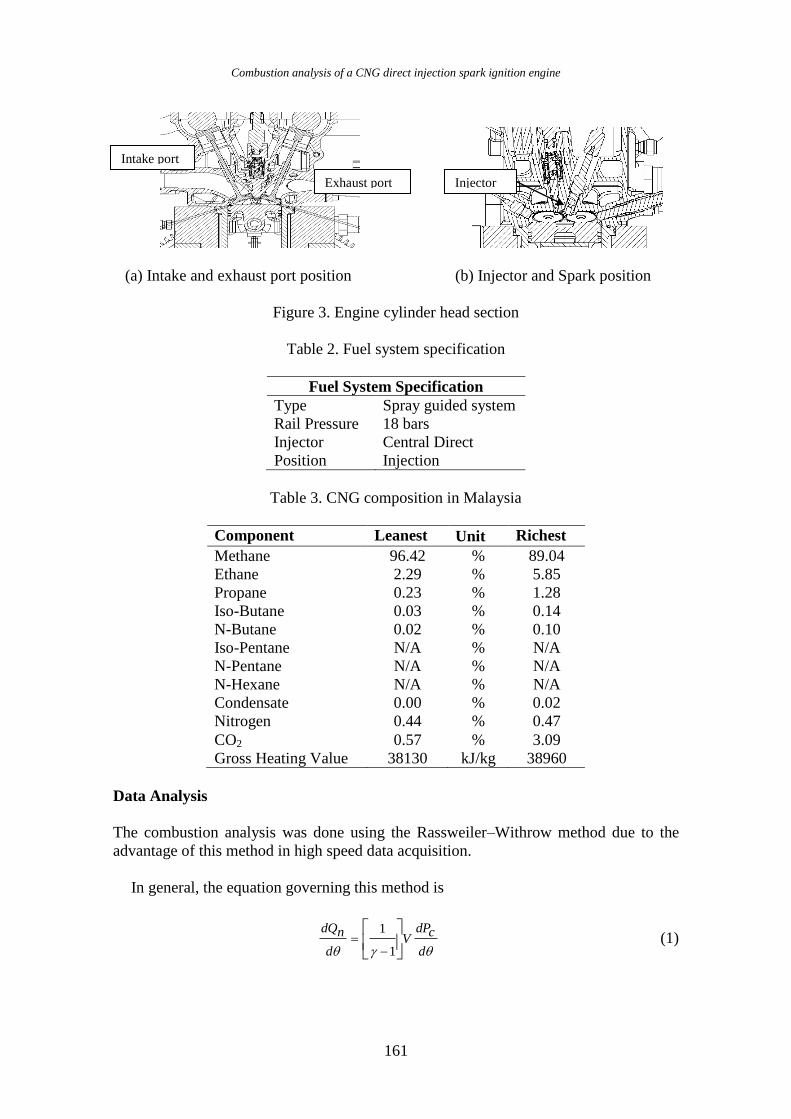
fuel ratio were controlled via the engine control unit (ECU). Figure 3(a) shows the
A. Rashid A. Aziz et al. / International Journal of Automotive and Mechanical Engineering 2 (2010) 157-170
160
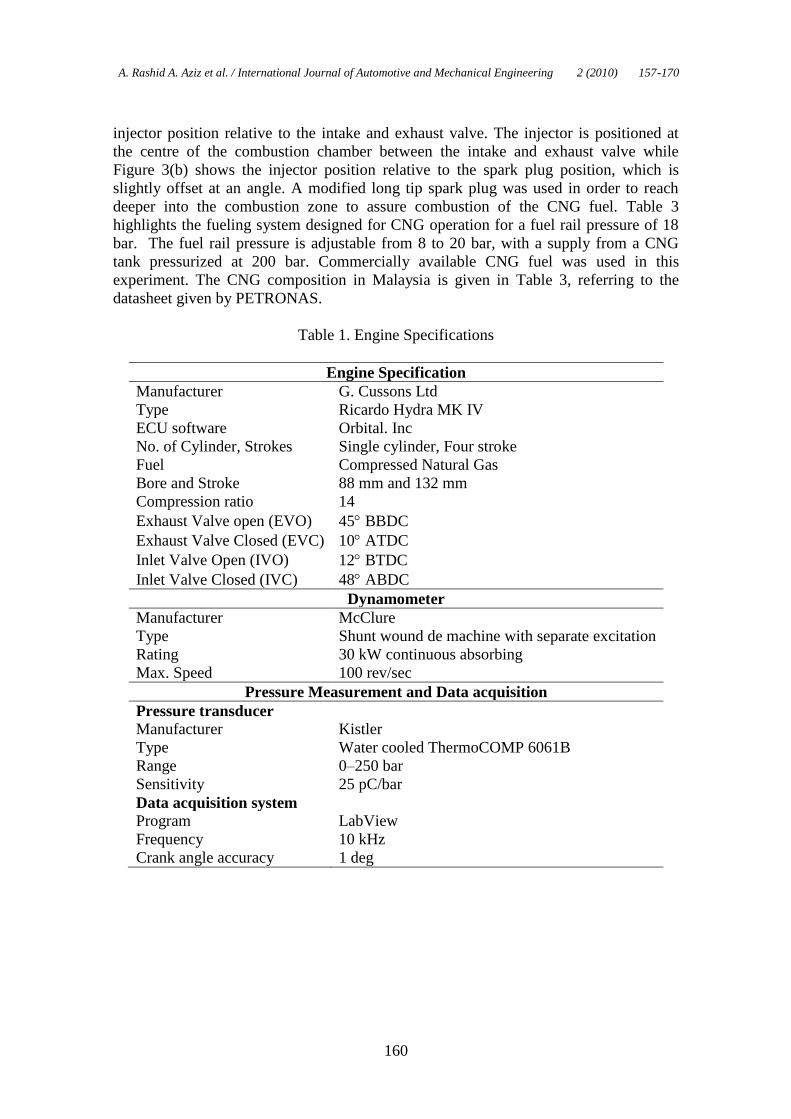
injector position relative to the intake and exhaust valve. The injector is positioned at
the centre of the combustion chamber between the intake and exhaust valve while
Figure 3(b) shows the injector position relative to the spark plug position, which is
slightly offset at an angle. A modified long tip spark plug was used in order to reach
deeper into the combustion zone to assure combustion of the CNG fuel. Table 3
highlights the fueling system designed for CNG operation for a fuel rail pressure of 18
bar. The fuel rail pressure is adjustable from 8 to 20 bar, with a supply from a CNG
tank pressurized at 200 bar. Commercially available CNG fuel was used in this
experiment. The CNG composition in Malaysia is given in Table 3, referring to the
datasheet given by PETRONAS.
Table 1. Engine Specifications
Engine Specification
Manufacturer G. Cussons Ltd
Type Ricardo Hydra MK IV
ECU software Orbital. Inc
No. of Cylinder, Strokes Single cylinder, Four stroke
Fuel Compressed Natural Gas
Bore and Stroke 88 mm and 132 mm
Compression ratio 14
Exhaust Valve open (EVO) 45 BBDC
Exhaust Valve Closed (EVC) 10 ATDC
Inlet Valve Open (IVO) 12 BTDC
Inlet Valve Closed (IVC) 48 ABDC
Dynamometer
Manufacturer McClure
Type Shunt wound de machine with separate excitation
Rating 30 kW continuous absorbing
Max. Speed 100 rev/sec
Pressure Measurement and Data acquisition
Pressure transducer Manufacturer Kistler
Type Water cooled ThermoCOMP 6061B
Range 0–250 bar
Sensitivity 25 pC/bar
Data acquisition system Program LabView
Frequency 10 kHz
Crank angle accuracy 1 deg
Combustion analysis of a CNG direct injection spark ignition engine
161
(a) Intake and exhaust port position (b) Injector and Spark position
Figure 3. Engine cylinder head section
Table 2. Fuel system specification
Fuel System Specification
Type Spray guided system
Rail Pressure 18 bars
Injector
Position
Central Direct
Injection
Table 3. CNG composition in Malaysia
Component Leanest Unit Richest
Methane 96.42 % 89.04
Ethane 2.29 % 5.85
Propane 0.23 % 1.28
Iso-Butane 0.03 % 0.14
N-Butane 0.02 % 0.10
Iso-Pentane N/A % N/A
N-Pentane N/A % N/A
N-Hexane N/A % N/A
Condensate 0.00 % 0.02
Nitrogen 0.44 % 0.47
CO2 0.57 % 3.09
Gross Heating Value 38130 kJ/kg 38960
Data Analysis
The combustion analysis was done using the Rassweiler–Withrow method due to the
advantage of this method in high speed data acquisition.
In general, the equation governing this method is
d
cdPV
d
ndQ
1
1 (1)
Intake port
Exhaust port Injector

A. Rashid A. Aziz et al. / International Journal of Automotive and Mechanical Engineering 2 (2010) 157-170
162
where: Qn = Net heat release
Pc = Pressure rise due to combustion (kPa)
V = Total cylinder volume (m3)
= Polytropic index
jV
jV
jPjPd
cdP 1
1 (2)
where: Pj = Pressure at j crank angle
Vj = Volume at j crank angle
From the results of heat released calculation, the total heat released by the
combustion process can be calculated as the sum of the instantaneous heat released
every crank angle. The combustion efficiency can be calculated by dividing the total
heat released by the total heat supplied by the fuel by the following equation:
HVqf
m
chQ
inQ
outQc
(3)
where chQ is the total heat released by the combustion process,
fm is the fuel mass,
and HVq is the specific heating value of fuel. The combustion stage is defined according
to difference between the first derivation of pressure (dP) on combustion and motoring
pressure to determine the beginning and the end point of combustion process.
mdP
mdPf
dP
mdP
cdP % (4)
where dPf is the pressure during the power stroke, dPc is the pressure due to combustion
and dPm is the pressure during motoring. Combustion begins if the difference between
pressure due to combustion and motoring is 0%–5% and ends with the difference >
99%.
RESULTS AND DISCUSSION
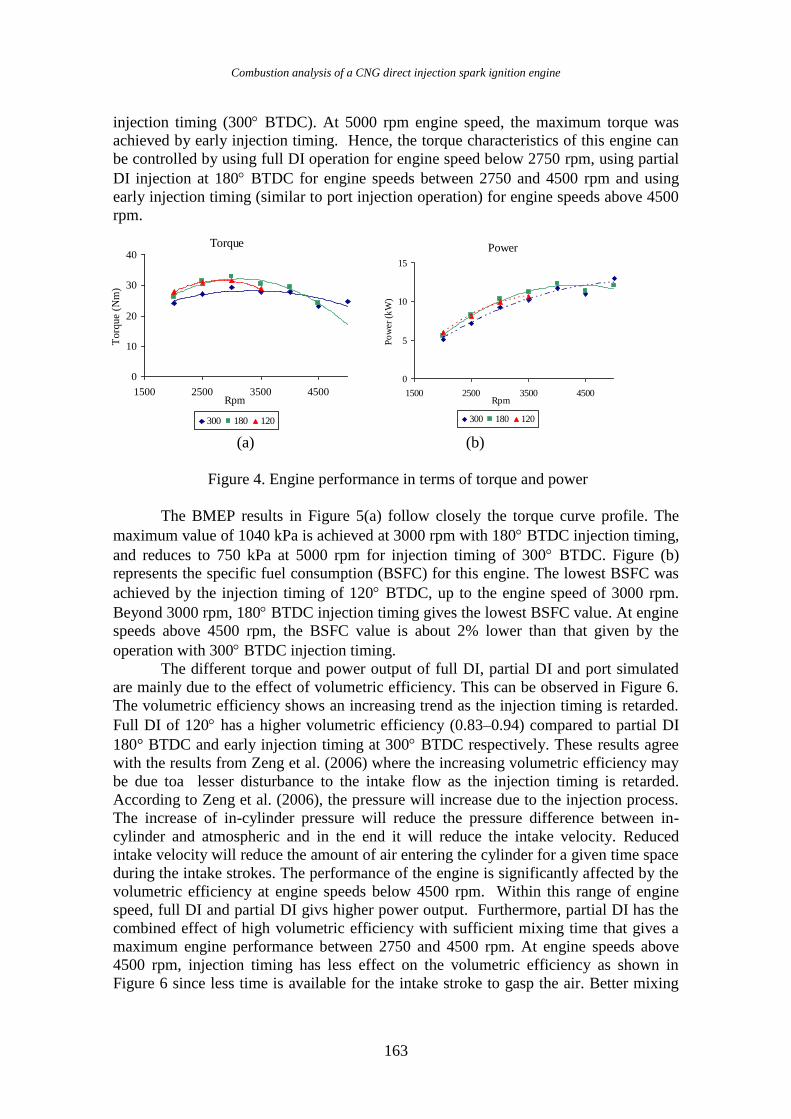
The effects of varying the injection timing on the CNG-DI engine are shown in Figure 4
and 5. The engine performance is presented in terms of torque, power, BMEP, and
BSFC to describe the engine output for various injection timing conditions. At lower
engine speed, the full DI resulted in 10%–20% higher torque compared to early
injection timing. The maximum torque was achieved by DI for engine speeds below
2750 rpm. However, early injection timing resulted in a better torque at engine speeds
above 4500 rpm. Partial DI and full DI resulted in 15% higher power compared to the
300 BTDC for speeds of less than 2750 rpm. As the engine speed increases to 3500
rpm, the performance of the engine with 120 BTDC injection timing drops below that
of 180 BTDC injection timing. Engine performance with 180 BTDC injection timing
dominates until the speed of 4500 rpm where the performance drops to 5% below early
Combustion analysis of a CNG direct injection spark ignition engine
163
injection timing (300 BTDC). At 5000 rpm engine speed, the maximum torque was
achieved by early injection timing. Hence, the torque characteristics of this engine can
be controlled by using full DI operation for engine speed below 2750 rpm, using partial
DI injection at 180 BTDC for engine speeds between 2750 and 4500 rpm and using
early injection timing (similar to port injection operation) for engine speeds above 4500
rpm.
Torque
0
10
20
30
40
1500 2500 3500 4500Rpm
Torq
ue
(Nm
)
300 180 120
Power
0
5
10
15
1500 2500 3500 4500Rpm
Po
wer
(kW
)
300 180 120
(a) (b)
Figure 4. Engine performance in terms of torque and power
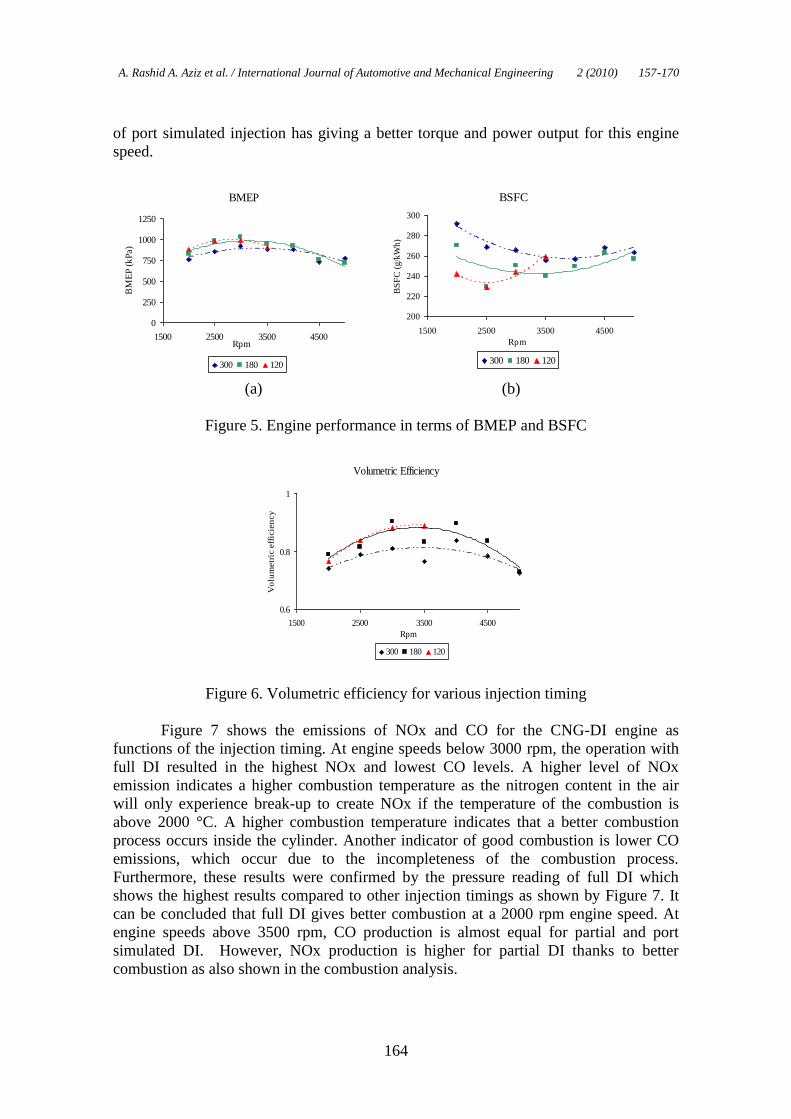
The BMEP results in Figure 5(a) follow closely the torque curve profile. The
maximum value of 1040 kPa is achieved at 3000 rpm with 180 BTDC injection timing,
and reduces to 750 kPa at 5000 rpm for injection timing of 300 BTDC. Figure (b)
represents the specific fuel consumption (BSFC) for this engine. The lowest BSFC was
achieved by the injection timing of 120 BTDC, up to the engine speed of 3000 rpm.
Beyond 3000 rpm, 180 BTDC injection timing gives the lowest BSFC value. At engine
speeds above 4500 rpm, the BSFC value is about 2% lower than that given by the
operation with 300 BTDC injection timing.
The different torque and power output of full DI, partial DI and port simulated
are mainly due to the effect of volumetric efficiency. This can be observed in Figure 6.
The volumetric efficiency shows an increasing trend as the injection timing is retarded.
Full DI of 120 has a higher volumetric efficiency (0.83–0.94) compared to partial DI
180° BTDC and early injection timing at 300 BTDC respectively. These results agree
with the results from Zeng et al. (2006) where the increasing volumetric efficiency may
be due toa lesser disturbance to the intake flow as the injection timing is retarded.
According to Zeng et al. (2006), the pressure will increase due to the injection process.
The increase of in-cylinder pressure will reduce the pressure difference between in-
cylinder and atmospheric and in the end it will reduce the intake velocity. Reduced
intake velocity will reduce the amount of air entering the cylinder for a given time space
during the intake strokes. The performance of the engine is significantly affected by the
volumetric efficiency at engine speeds below 4500 rpm. Within this range of engine
speed, full DI and partial DI givs higher power output. Furthermore, partial DI has the
combined effect of high volumetric efficiency with sufficient mixing time that gives a
maximum engine performance between 2750 and 4500 rpm. At engine speeds above
4500 rpm, injection timing has less effect on the volumetric efficiency as shown in
Figure 6 since less time is available for the intake stroke to gasp the air. Better mixing
A. Rashid A. Aziz et al. / International Journal of Automotive and Mechanical Engineering 2 (2010) 157-170
164
of port simulated injection has giving a better torque and power output for this engine
speed.
BMEP
0
250
500
750
1000
1250
1500 2500 3500 4500Rpm
BM
EP
(k
Pa)
300 180 120
BSFC
200
220
240
260
280
300
1500 2500 3500 4500
Rpm
BS
FC
(g
/kW
h)
300 180 120
(a) (b)
Figure 5. Engine performance in terms of BMEP and BSFC
Volumetric Efficiency
0.6
0.8
1
1500 2500 3500 4500
Rpm
Vo
lum
etr
ic e
ffic
ien
cy
300 180 120
Figure 6. Volumetric efficiency for various injection timing
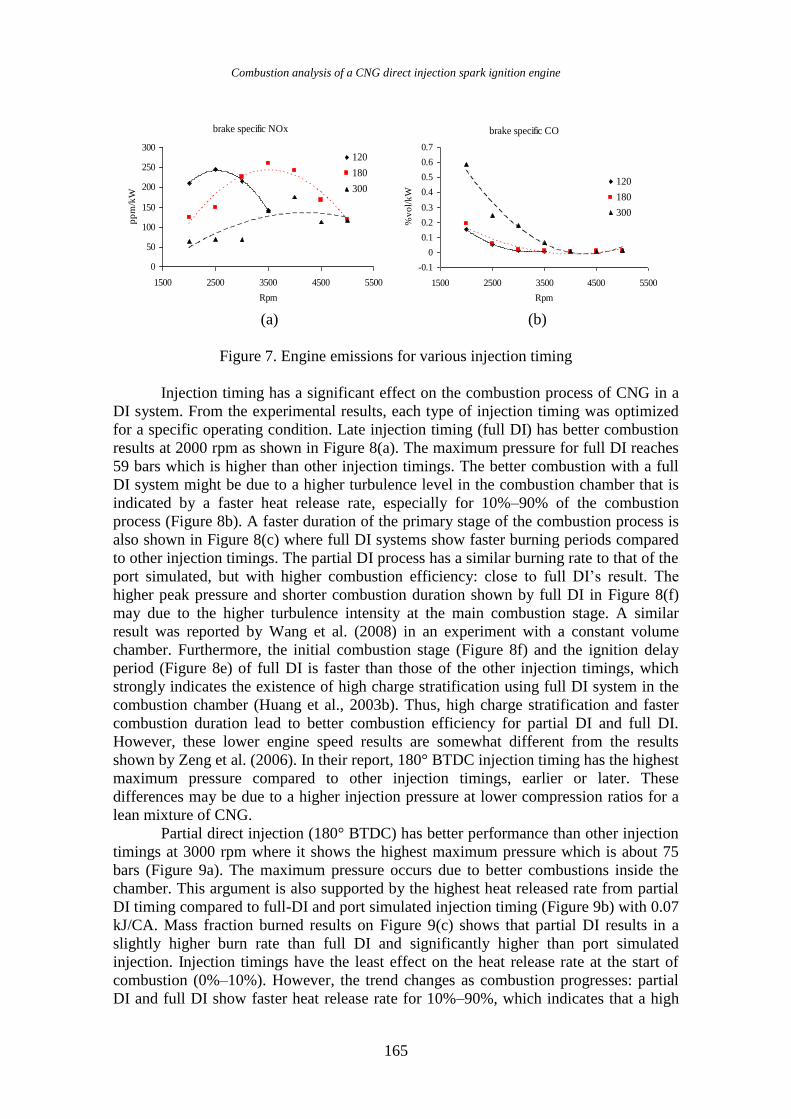
Figure 7 shows the emissions of NOx and CO for the CNG-DI engine as
functions of the injection timing. At engine speeds below 3000 rpm, the operation with
full DI resulted in the highest NOx and lowest CO levels. A higher level of NOx
emission indicates a higher combustion temperature as the nitrogen content in the air
will only experience break-up to create NOx if the temperature of the combustion is
above 2000 °C. A higher combustion temperature indicates that a better combustion
process occurs inside the cylinder. Another indicator of good combustion is lower CO
emissions, which occur due to the incompleteness of the combustion process.
Furthermore, these results were confirmed by the pressure reading of full DI which
shows the highest results compared to other injection timings as shown by Figure 7. It
can be concluded that full DI gives better combustion at a 2000 rpm engine speed. At
engine speeds above 3500 rpm, CO production is almost equal for partial and port
simulated DI. However, NOx production is higher for partial DI thanks to better
combustion as also shown in the combustion analysis.
Combustion analysis of a CNG direct injection spark ignition engine
165
brake specific NOx
0
50
100
150
200
250
300
1500 2500 3500 4500 5500
Rpm
pp
m/k
W
120
180
300
brake specific CO
-0.1
0
0.1
0.2
0.3
0.4
0.5
0.6
0.7
1500 2500 3500 4500 5500
Rpm
%v
ol/
kW
120
180
300
(a) (b)
Figure 7. Engine emissions for various injection timing
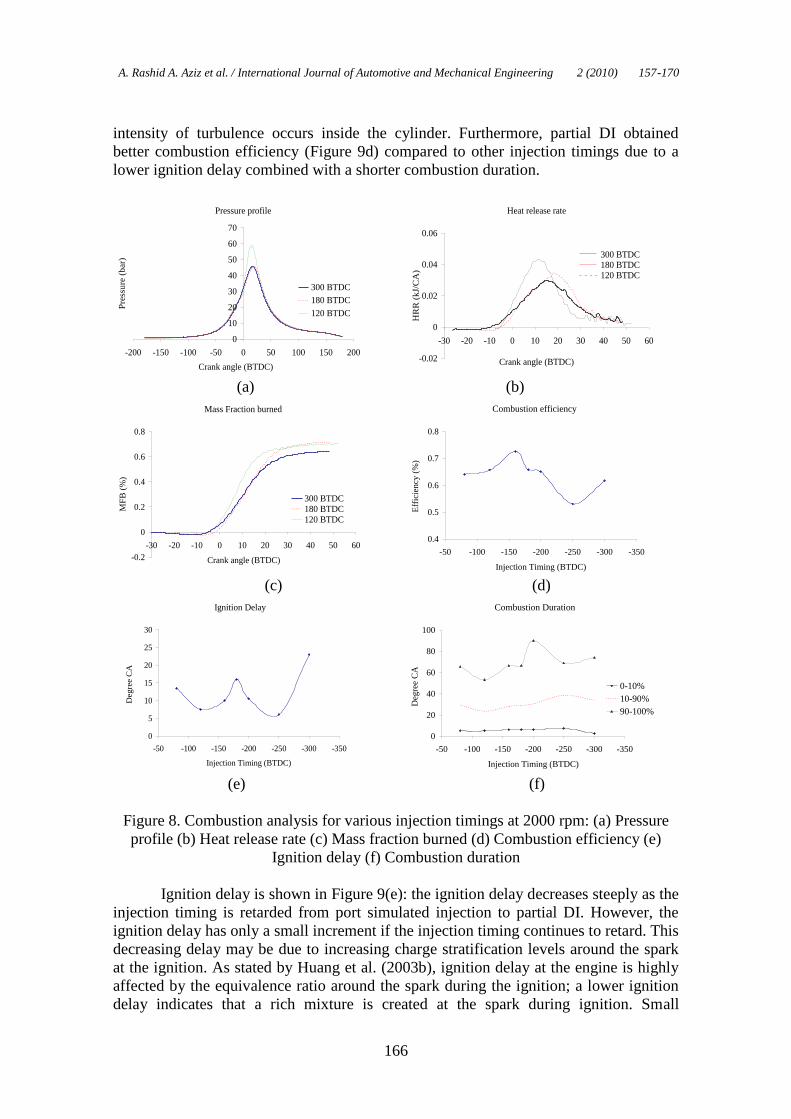
Injection timing has a significant effect on the combustion process of CNG in a
DI system. From the experimental results, each type of injection timing was optimized
for a specific operating condition. Late injection timing (full DI) has better combustion
results at 2000 rpm as shown in Figure 8(a). The maximum pressure for full DI reaches
59 bars which is higher than other injection timings. The better combustion with a full
DI system might be due to a higher turbulence level in the combustion chamber that is
indicated by a faster heat release rate, especially for 10%–90% of the combustion
process (Figure 8b). A faster duration of the primary stage of the combustion process is
also shown in Figure 8(c) where full DI systems show faster burning periods compared
to other injection timings. The partial DI process has a similar burning rate to that of the
port simulated, but with higher combustion efficiency: close to full DI’s result. The
higher peak pressure and shorter combustion duration shown by full DI in Figure 8(f)
may due to the higher turbulence intensity at the main combustion stage. A similar
result was reported by Wang et al. (2008) in an experiment with a constant volume
chamber. Furthermore, the initial combustion stage (Figure 8f) and the ignition delay
period (Figure 8e) of full DI is faster than those of the other injection timings, which
strongly indicates the existence of high charge stratification using full DI system in the
combustion chamber (Huang et al., 2003b). Thus, high charge stratification and faster
combustion duration lead to better combustion efficiency for partial DI and full DI.
However, these lower engine speed results are somewhat different from the results
shown by Zeng et al. (2006). In their report, 180° BTDC injection timing has the highest
maximum pressure compared to other injection timings, earlier or later. These
differences may be due to a higher injection pressure at lower compression ratios for a
lean mixture of CNG.
Partial direct injection (180° BTDC) has better performance than other injection
timings at 3000 rpm where it shows the highest maximum pressure which is about 75
bars (Figure 9a). The maximum pressure occurs due to better combustions inside the
chamber. This argument is also supported by the highest heat released rate from partial
DI timing compared to full-DI and port simulated injection timing (Figure 9b) with 0.07
kJ/CA. Mass fraction burned results on Figure 9(c) shows that partial DI results in a
slightly higher burn rate than full DI and significantly higher than port simulated
injection. Injection timings have the least effect on the heat release rate at the start of
combustion (0%–10%). However, the trend changes as combustion progresses: partial
DI and full DI show faster heat release rate for 10%–90%, which indicates that a high
A. Rashid A. Aziz et al. / International Journal of Automotive and Mechanical Engineering 2 (2010) 157-170
166
intensity of turbulence occurs inside the cylinder. Furthermore, partial DI obtained
better combustion efficiency (Figure 9d) compared to other injection timings due to a
lower ignition delay combined with a shorter combustion duration.
Pressure profile
0
10
20
30
40
50
60
70
-200 -150 -100 -50 0 50 100 150 200
Crank angle (BTDC)
Pre
ssu
re (
bar)
300 BTDC
180 BTDC
120 BTDC
Heat release rate
-0.02
0
0.02
0.04
0.06
-30 -20 -10 0 10 20 30 40 50 60
Crank angle (BTDC)
HR
R (
kJ/
CA
)
300 BTDC180 BTDC120 BTDC
(a) (b)
Mass Fraction burned
-0.2
0
0.2
0.4
0.6
0.8
-30 -20 -10 0 10 20 30 40 50 60
Crank angle (BTDC)
MF
B (
%)
300 BTDC
180 BTDC
120 BTDC
Combustion efficiency
0.4
0.5
0.6
0.7
0.8
-350-300-250-200-150-100-50
Injection Timing (BTDC)
Eff
icie
ncy
(%
)
(c) (d)
Ignition Delay
0
5
10
15
20
25
30
-350-300-250-200-150-100-50
Injection Timing (BTDC)
Degre
e C
A
Combustion Duration
0
20
40
60
80
100
-350-300-250-200-150-100-50
Injection Timing (BTDC)
Deg
ree
CA
0-10%
10-90%
90-100%
(e) (f)
Figure 8. Combustion analysis for various injection timings at 2000 rpm: (a) Pressure
profile (b) Heat release rate (c) Mass fraction burned (d) Combustion efficiency (e)
Ignition delay (f) Combustion duration
Ignition delay is shown in Figure 9(e): the ignition delay decreases steeply as the
injection timing is retarded from port simulated injection to partial DI. However, the
ignition delay has only a small increment if the injection timing continues to retard. This
decreasing delay may be due to increasing charge stratification levels around the spark
at the ignition. As stated by Huang et al. (2003b), ignition delay at the engine is highly
affected by the equivalence ratio around the spark during the ignition; a lower ignition
delay indicates that a rich mixture is created at the spark during ignition. Small
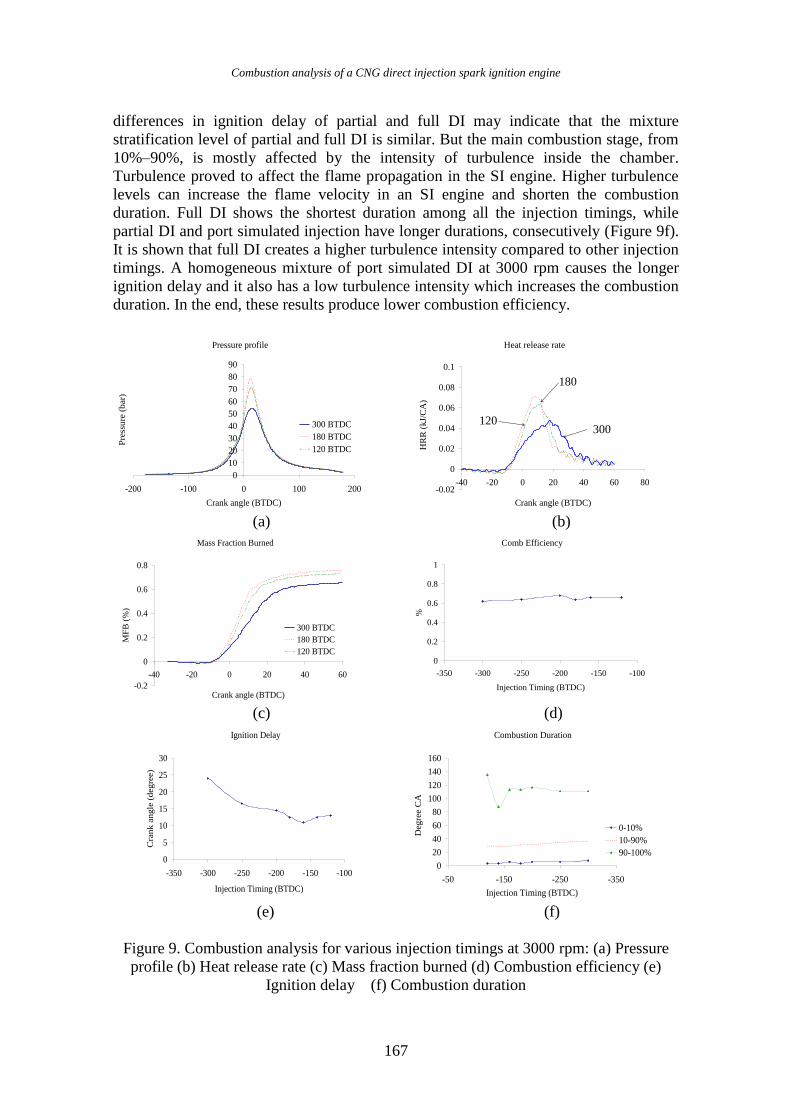
Combustion analysis of a CNG direct injection spark ignition engine
167
differences in ignition delay of partial and full DI may indicate that the mixture
stratification level of partial and full DI is similar. But the main combustion stage, from
10%–90%, is mostly affected by the intensity of turbulence inside the chamber.
Turbulence proved to affect the flame propagation in the SI engine. Higher turbulence
levels can increase the flame velocity in an SI engine and shorten the combustion
duration. Full DI shows the shortest duration among all the injection timings, while
partial DI and port simulated injection have longer durations, consecutively (Figure 9f).
It is shown that full DI creates a higher turbulence intensity compared to other injection
timings. A homogeneous mixture of port simulated DI at 3000 rpm causes the longer
ignition delay and it also has a low turbulence intensity which increases the combustion
duration. In the end, these results produce lower combustion efficiency.
Pressure profile
0
10
20
30
40
50
60
70
80
90
-200 -100 0 100 200
Crank angle (BTDC)
Pre
ssu
re (
bar)
300 BTDC
180 BTDC
120 BTDC
Heat release rate
-0.02
0
0.02
0.04
0.06
0.08
0.1
-40 -20 0 20 40 60 80
Crank angle (BTDC)
HR
R (
kJ/
CA
)300
120
180
(a) (b)
Mass Fraction Burned
-0.2
0
0.2
0.4
0.6
0.8
-40 -20 0 20 40 60
Crank angle (BTDC)
MF
B (
%)
300 BTDC
180 BTDC
120 BTDC
Comb Efficiency
0
0.2
0.4
0.6
0.8
1
-350 -300 -250 -200 -150 -100
Injection Timing (BTDC)
%
(c) (d)
Ignition Delay
0
5
10
15
20
25
30
-350 -300 -250 -200 -150 -100
Injection Timing (BTDC)
Cra
nk a
ngle
(degre
e)
Combustion Duration
0
20
40
60
80
100
120
140
160
-350-250-150-50
Injection Timing (BTDC)
Deg
ree C
A
0-10%
10-90%
90-100%
(e) (f)
Figure 9. Combustion analysis for various injection timings at 3000 rpm: (a) Pressure
profile (b) Heat release rate (c) Mass fraction burned (d) Combustion efficiency (e)
Ignition delay (f) Combustion duration

A. Rashid A. Aziz et al. / International Journal of Automotive and Mechanical Engineering 2 (2010) 157-170
168
(a) (b)
(c) (d)
(e) (f)
Figure 10. Combustion analysis for various injection timings at 5000 rpm: (a) Pressure
profile (b) Heat release rate (c) Mass fraction burned (d) Combustion efficiency (e)
Ignition delay (f) Combustion duration
Port simulated injection (injection at 300° BTDC) has better combustion at high
rpm (5000 rpm). The peak cylinder pressure is almost the same as that obtained from
partial DI timing, which is 57 bars as seen in Figure 10(a), while full DI gives a lower
pressure of 40 bars. At high engine speeds, the occurrence of a high degree of fuel
stratification, which also indicates incomplete mixing, as possessed by full DI, is not a
favourable condition for the combustion process as it causes incomplete mixing and
high cycle-to-cycle variation, as also shown by lower maximum pressure. Better
combustion with port simulated and partial DI timing can be seen in the heat release rate
graph (Figure 10b) where both injection timings have higher maximum heat released
(0.075 kJ/CA) compared to full DI (0.06 kJ/CA). Full DI shows a low maximum heat
Combustion analysis of a CNG direct injection spark ignition engine
169
released, indicating that the combustion process is inferior compared to other injection
timings. Figure10(b) also shows that full DI has drift in the maximum heat released
which is at 25° ATDC due to a slower duration of the end of the combustion stage
(90%–100%).
The delay is clearly seen in the mass fraction burned (Figure 10c), where full DI
starts to combust a few degrees before TDC, and has reduced combustion efficiency.
Further, combustion efficiency decreases as the injection timing is retarded, from 0.8%
to 0.68% (Figure 10d), while port simulated injection has a similar MFB as partial DI.
Figure 10(d) shows that combustion efficiency is decreasing as the injection timing is
retarded. A different trend has been shown by the effect of injection timing on
combustion efficiency compared to lower engine speeds. This shows that at high engine
speed, the mixing window is important. Bigger mixing window gives better combustion
at high speed. The combustion duration for all injection timings does not give much
difference for the 0%–90% combustion stage (Figure 10e). But it decreases as the
injection timing is advanced for the combustion stage 90%–100%. These ignition delay
results shows that the delay period is decreased as the injection timing is retarded from
port simulated to partial DI timing, but increases steeply when full DI is applied (Figure
10f). These results show that port simulated injection timing is the most suitable for
high engine rpm as compared to partial DI and full DI operations.
CONCLUSIONS
The following conclusions can be drawn on the effect of injection timing on the
performance and combustion of a CNG-DI engine:
Full DI (120 BTDC) increases the volumetric efficiency of the engine and gives
better performance at engine speeds below 2750 rpm. Moreover, full DI has a
higher heat release rate, better combustion efficiency and faster combustion
duration at 2000 rpm due to higher charge stratification.
Partial injection timing at 180 BTDC resulted in a good performance for engine
speeds between 2750–4500 rpm because of the slight difference on volumetric
efficiency compared to 120 BTDC injection timing. Higher homogeneity
compared to full DI with additional charge stratification due to injection after
IVC leads to the better combustion results of partial DI which is shown by its
higher heat release rate, faster combustion duration and higher combustion
efficiency at 3000 rpm.
At engine speeds above 4500 rpm, early injection timing at 300 BTDC resulted
in the highest engine performance due to complete mixing of the air and fuel, in
spite of the lower volumetric efficiency.
At engine speeds below 3000 rpm, NOx emission increased and CO emission
decreased with retarding of injection timing, indicating a higher combustion
temperature and a more complete combustion. This could be attributed to a
higher air volume per cycle and increased turbulence due to the DI operation.
At engine speeds above 3500 rpm, the level of CO production is almost invariant
with injection timing. However, NOx production is higher for the partial
injection timing of 180 BTDC compared to early injection at 300 BTDC,
indicating a higher combustion temperature. This could be due to the higher
volumetric efficiency that resulted in more air volume per cycle and a higher
effective compression ratio.

A. Rashid A. Aziz et al. / International Journal of Automotive and Mechanical Engineering 2 (2010) 157-170
170
At the intermediate engine speeds of 2000 and 3000 rpm, full DI and partial DI
operations result in the fastest rate of heat release while at the high engine speed
of 5000 rpm, port-injected equivalent operation results in the fastest rate of heat
release.
ACKNOWLEDGEMENTS
The author would like to acknowledge the funding support for the experimental
facilities from the Ministry of Science, Technology and Innovation (MOSTI) of
Malaysia (03-02-02-0057-PR0030/10-04) and Universiti Teknologi PETRONAS.
REFERENCES
Catania, A.E., Misul, D., Spessa, E. and Martorana, G. (2000) Conversion of a
Multivalve Gasoline Engine to run on CNG. SAE Technical Paper, No. 2000-
01-0673.
Huang, Z., Shiga, S., Ueda, T., Nakamura, H., Ishima, T., Obokata, T., Tsue, M. and
Kono, M. (2003b) Effect of Fuel Injection Timing Relative to Ignition Timing
on the Natural-gas Direct-Injection Combustion. Journal of Engineering for Gas
Turbines and Power ASME, 217: 53–61.
Huang, Z., Shiga, S., Ueda, T., Nakamura, H., Ishima, T., Obokata, T., Tsue, M. and
Kono, M. (2003a) Combustion Characteristics of Natural Gas Direct Injection
Combustion Under Various Fuel Injection Timings. Proceedings of the
Institution of Mechanical Engineers, Part D: Journal of Automobile
Engineering, 217: 935–941.
Hayashida, M., Yamato, T., Sekino, H. and Sugahara, K. (1999) Investigation of
Performance and Fuel Distribution of a Direct Injection Gas Engine Using LIF
Measurement. SAE Paper, No. 1999-01-3291.
Kato, K., Igarashi, K., Masuda, M., Otsubo, K., Yasuda, A., Takeda, K. and Sato, T.
(1999) Development of Engine for Natural Gas Vehicle. SAE Paper, No. 1999-
01-0574.
Mello, P., Pelliza, G., Cataluna, R. and Silva, D.R. 2006. Evaluation of the maximum
horse power of vehicles converted for use with natural gas fuel. Journal of Fuel,
85: 2180-2186.
Pourkhesalian, A.M, Samekhi, A.H. and Salimi, F. (2009) Alternative Fuel and
Gasoline in an SI Engine: A Comparative Study of Performance and Emissions
Characteristics. Journal of Fuel. 89(5): 105–1063.
Wang, D.E. and Watson, H.C. (2000) Direct Injection Compressed Natural Gas
Combustion and Visualization. SAE, 2000-01-1838.
Wang, J., Huang, Z., Miao, H., Wang, X. and Jiang, D. (2008) Characteristics of Direct
Injection Combustion Fuelled by Natural Gas-Hydrogen Mixtures Using a
Constant Volume Vessel. International journal of Hydrogen Energy, 33: 1947–
1956.
Zeng, K., Huang, Z., Liu, B., Liu, L., Jiang, D., Ren, Y. and Wang, J. (2006)
Combustion Characteristics of a Direct-Injection Natural Gas Engine Under
Various Fuel Injection Timings. Journal of Applied Thermal Engineering, 26:
806–813.