Embed Size (px)
Citation preview

Combined Use of Physical/Morphological, Chemical, and Microbial Parameters to
Assess Stream Health
Root River, Racine, WI
2009 AWRA Annual MeetingMarch 5-6, Stevens Point, WI
2004 Spatial Distribution
Study
80 samplesby wading or boat
Pre-rainfall, Rainfall, and Post-
rainfall samples
Look for elevated levels of E. coli
Definite plume from the Root River
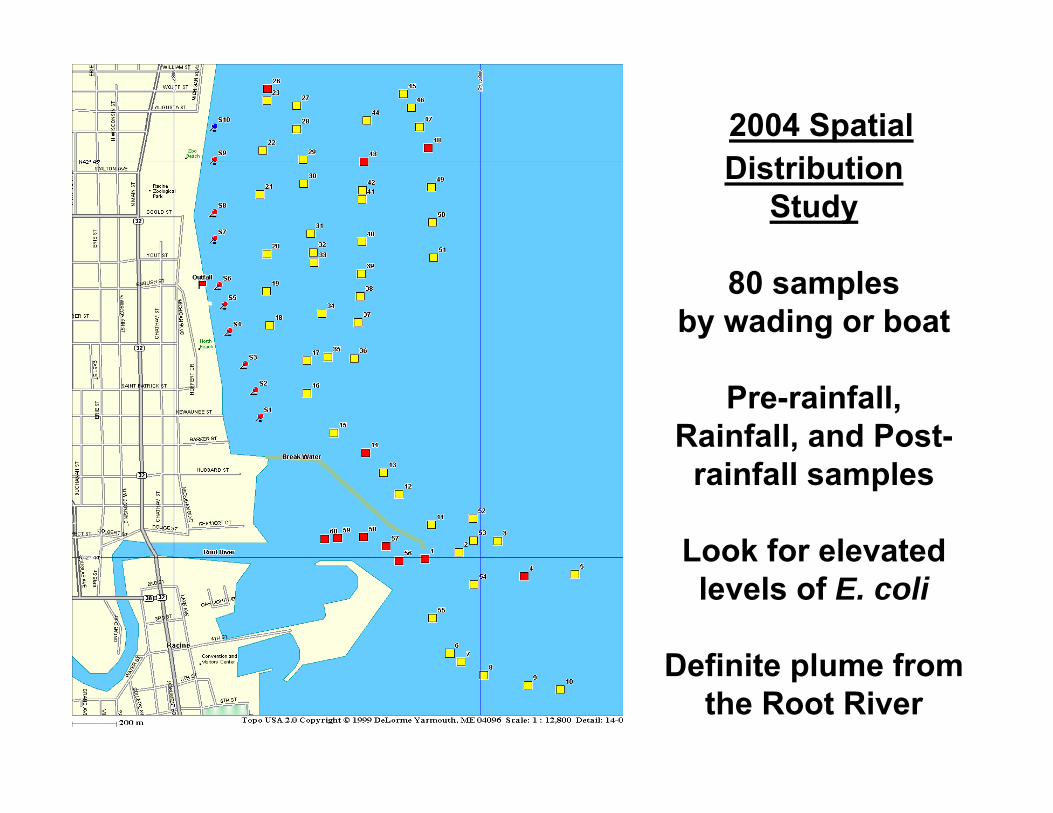
North Beach
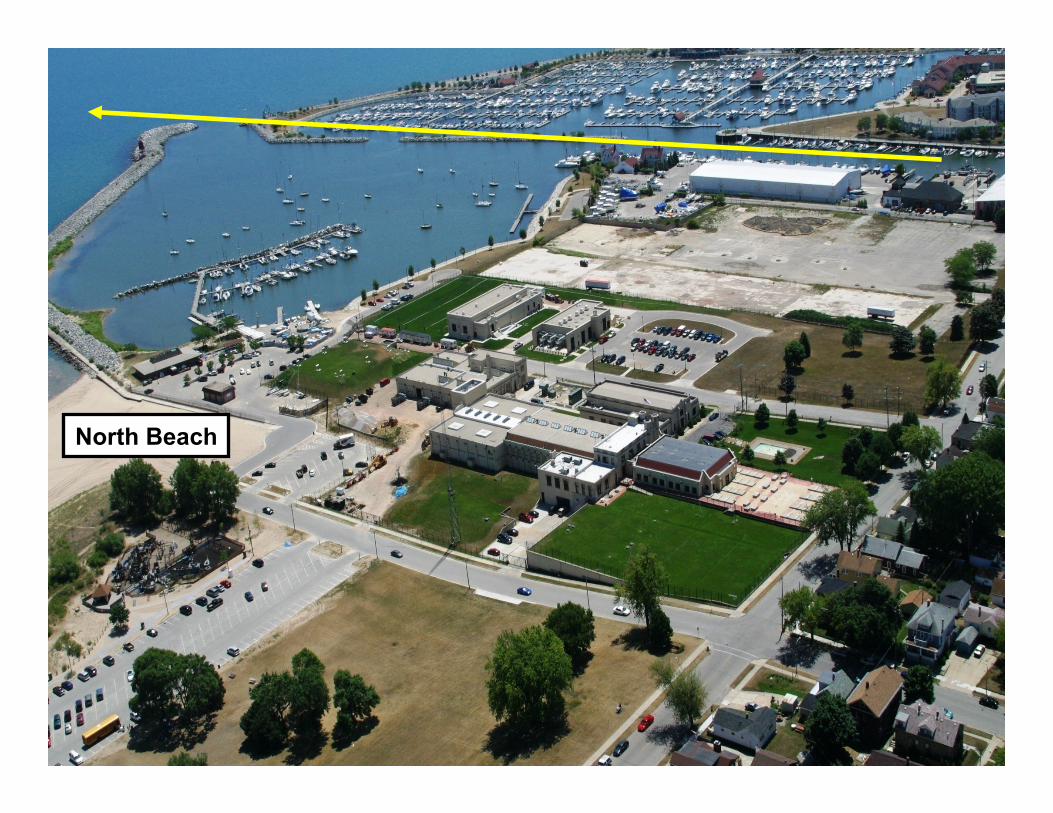
Racine had 7 monitoring stations

Root River E. coli Densities – 2004SITE MEAN E. coli
MPN/100 mlRANGE
Johnson Park (R1) 1518 10 – 14,136Horlick Dam (R2) 1431 10 – 12,997Cedar Bend (R3) 3705 0 – 12,997Washington Park Storm Outlet (R4)
38,856 0 – 198,628
Water Street Storm Outlet (R5)
18,020 100 – 173,287
State Street Bridge (R6) 1372 63 – 11,199Chartroom (R7) 1098 20 - 9804
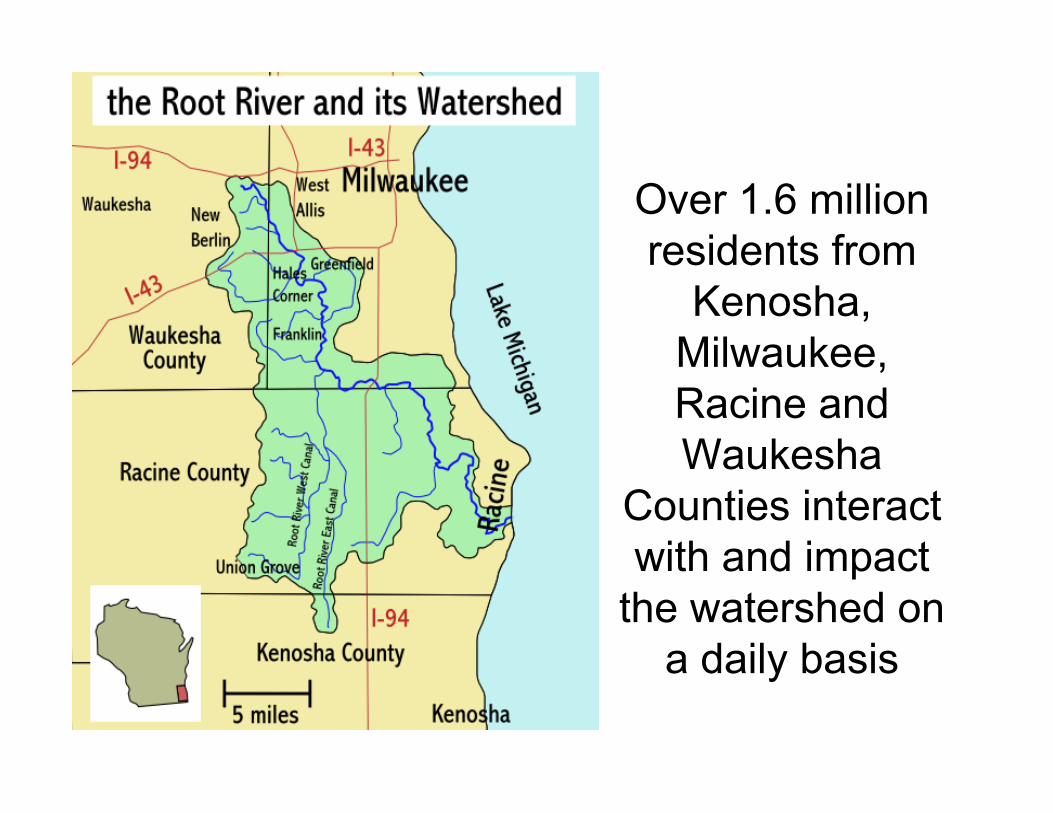
Over 1.6 million residents from
Kenosha, Milwaukee, Racine and Waukesha
Counties interact with and impact
the watershed on a daily basis
Root River Facts
• Origin, New Berlin (Waukesha County)
• Part of the Root‐Pike Watershed
• Approximately 35 miles long
–117 mi of combined tributaries/streams
• City of Racine reach
–Approximately 5 miles long
–Horlick Dam to mouth at Lake Michigan

History of the Root River
• Historic names: – Chippecotton, Chipperooton– KipiKawi
• French explorer’s first landed at the Root River in 1699
• Racine means “root” in French• Racine's harbor & the Root River were important to the shipping industry in the late 1800's
• Also used recreationally
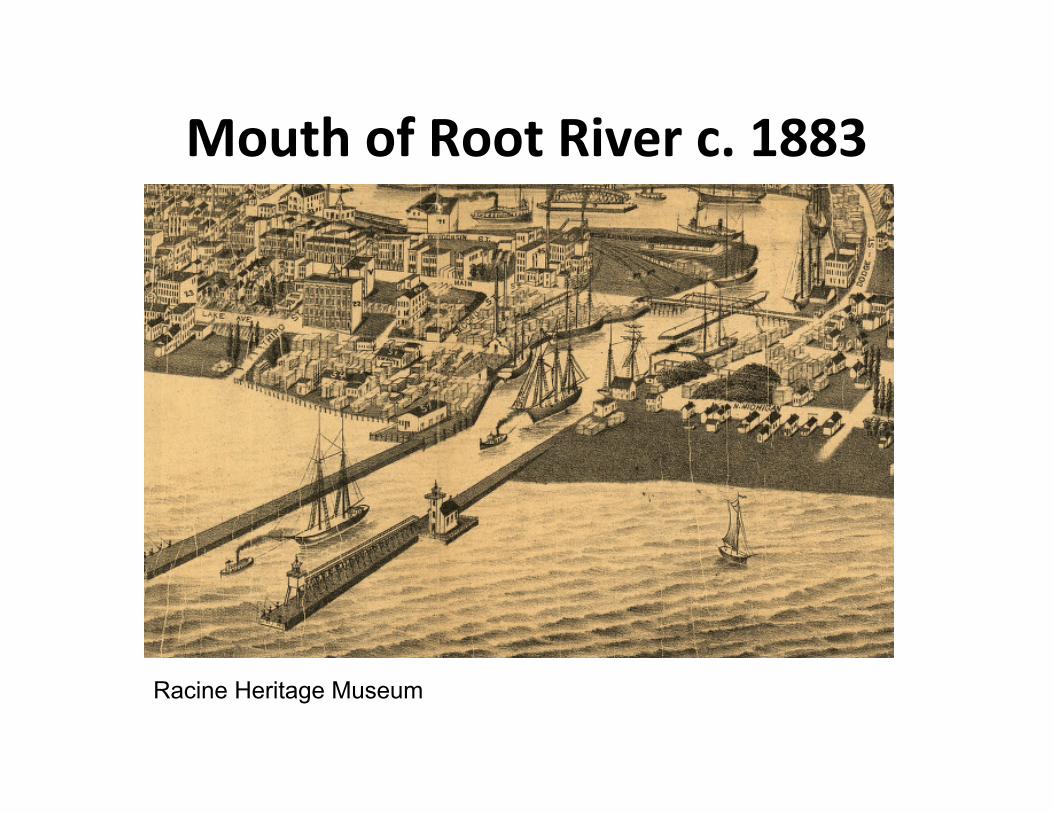
Mouth of Root River c. 1883
Racine Heritage Museum
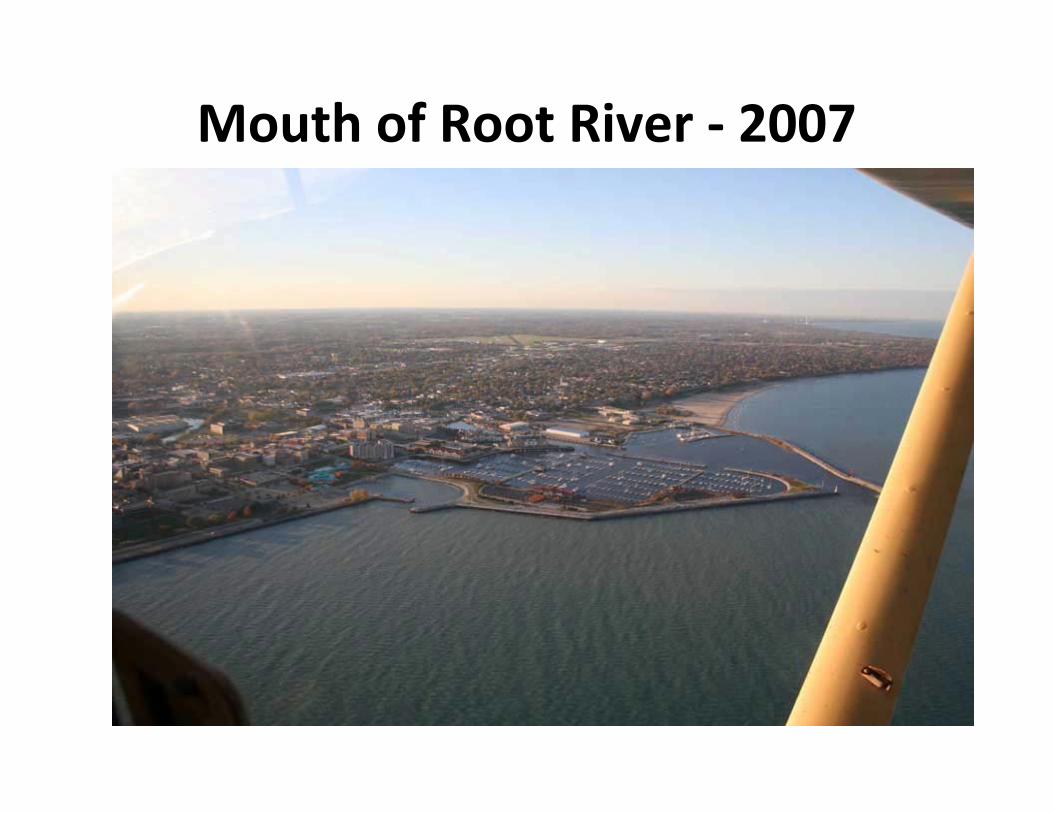
Mouth of Root River ‐ 2007

Is the Root River Impaired?• WI Lutheran College Study (Ortenblad et
al., 2003)– Biotic Integrity rating for fish species ranged
from very poor (Milwaukee/Racine Co. line) to good (Colonial Park)
– Family Biotic index of macro invertebrates ranged from good (upstream) to poor (downstream)
• WI DNR 303d list (2006)– Impaired for PCBs, low priority, no TMDL
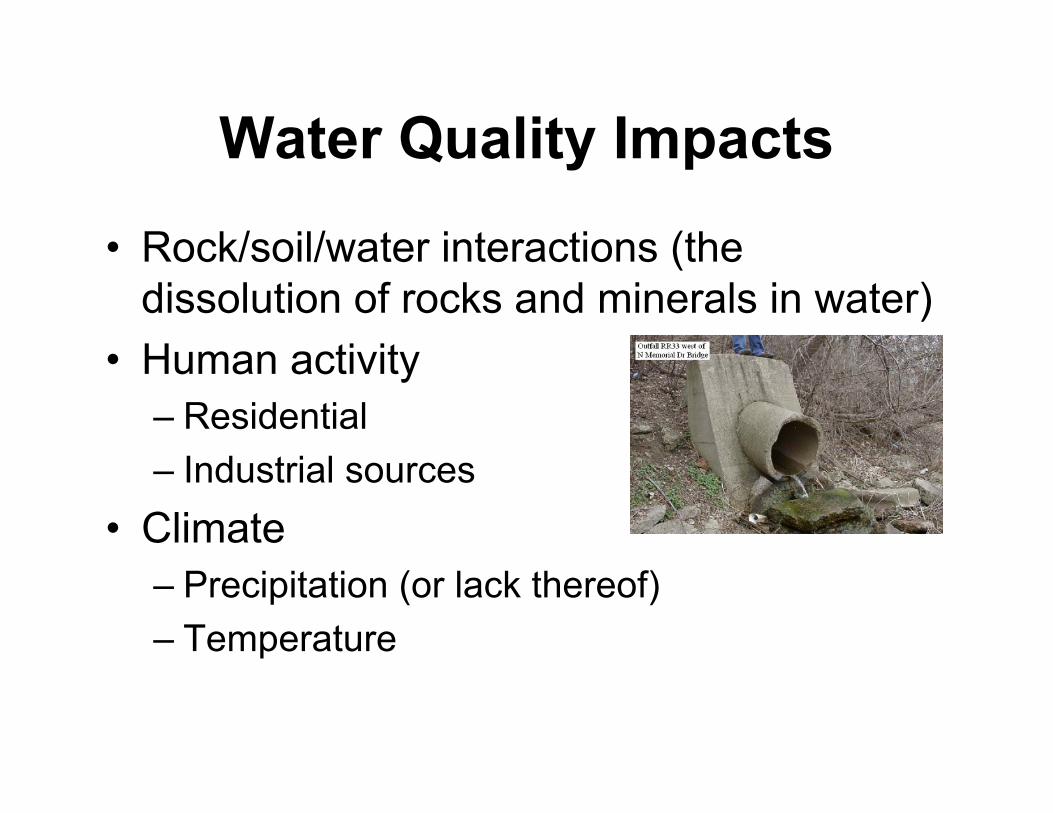
Water Quality Impacts
• Rock/soil/water interactions (the dissolution of rocks and minerals in water)
• Human activity– Residential– Industrial sources
• Climate– Precipitation (or lack thereof)– Temperature
Non-point Source Pollution• “polluted run-off”
– pesticides, bacteria, oil, and other chemicals • Impacts an estimated 40 percent of the WI
streams • Leading cause of water quality problems in
WI today • Can impact Great Lakes beaches, harbors
and coastal waters• Origins of NPS can be hard to identify

What Happens When it Rains?

Residential Average Impervious Area = 2,844 square feet (or 1 Equivalent
Residential/Runoff Unit (ERU))
Racine Storm Water Utility
Downtown Customer Example
Industrial Customer Example

Purpose of Current Study• Expand upon historic Root River
monitoring conducted by the Racine Health Department
• Assemble a comprehensive database of water quality data which could be used as a baseline from which to gauge improvements as redevelopment and revitalization of the Root River corridor occurs
• Provide science to target remediation

Mitigation• Watershed approach
– Use Natural boundaries not manmade ones • Base decisions on sound science
– Strong scientific data, tools and techniques will enhance the process and aid in targeted remediation
• Public Involvement and Partnerships – Involving concerned individuals, agencies and
organizations– Provide public education (kids & adults)– Communicate

Best Management Practices• Riparian buffers• Eliminate phosphorous fertilizers• No dumping (anything) into the storm
sewer system• Install a rain garden• Wash your car on the grass or at a car
wash• Direct your downspouts over the lawn• Discourage wildlife like geese
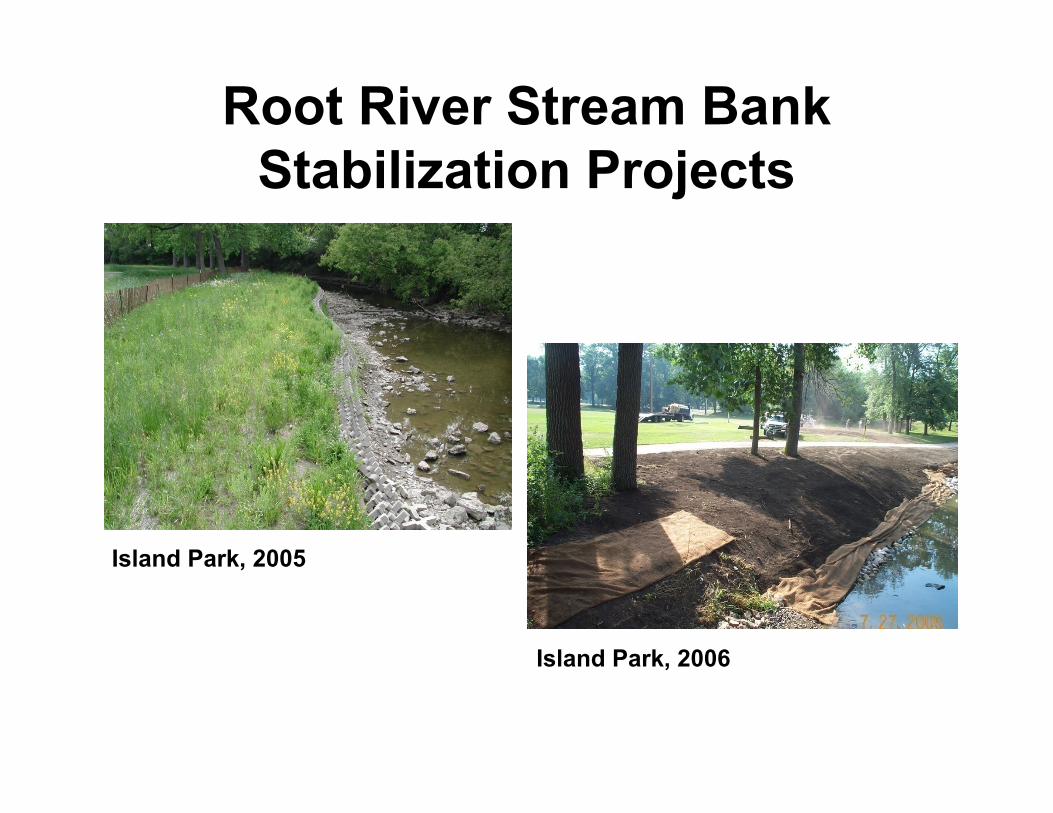
Root River Stream Bank Stabilization Projects
Island Park, 2005
Island Park, 2006
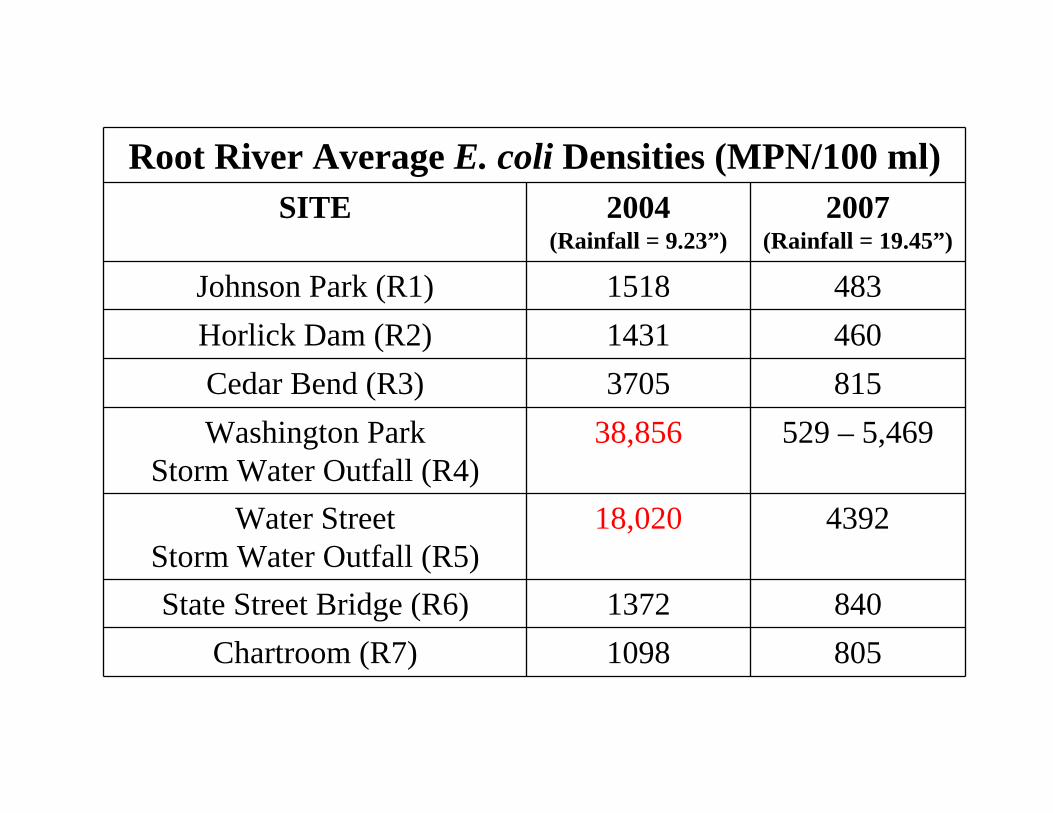
Root River Average E. coli Densities (MPN/100 ml)SITE 2004
(Rainfall = 9.23”)2007
(Rainfall = 19.45”)
Johnson Park (R1) 1518 483Horlick Dam (R2) 1431 460Cedar Bend (R3) 3705 815Washington Park
Storm Water Outfall (R4)38,856 529 – 5,469
Water Street Storm Water Outfall (R5)
18,020 4392
State Street Bridge (R6) 1372 840Chartroom (R7) 1098 805

Local Initiatives• Root-Pike WIN
– Rain garden initiative• Historic Sixth Street Association (HSSA)
– Have proposed comprehensive design plans• UW-Parkside
– Expand urban environmental education and recreation
• River Alliance of Wisconsin – Comprehensive Root River Plan – Uses best elements of existing plans to ensure,
among other key principles, that the water quality in the Root River is improved and the environment protected
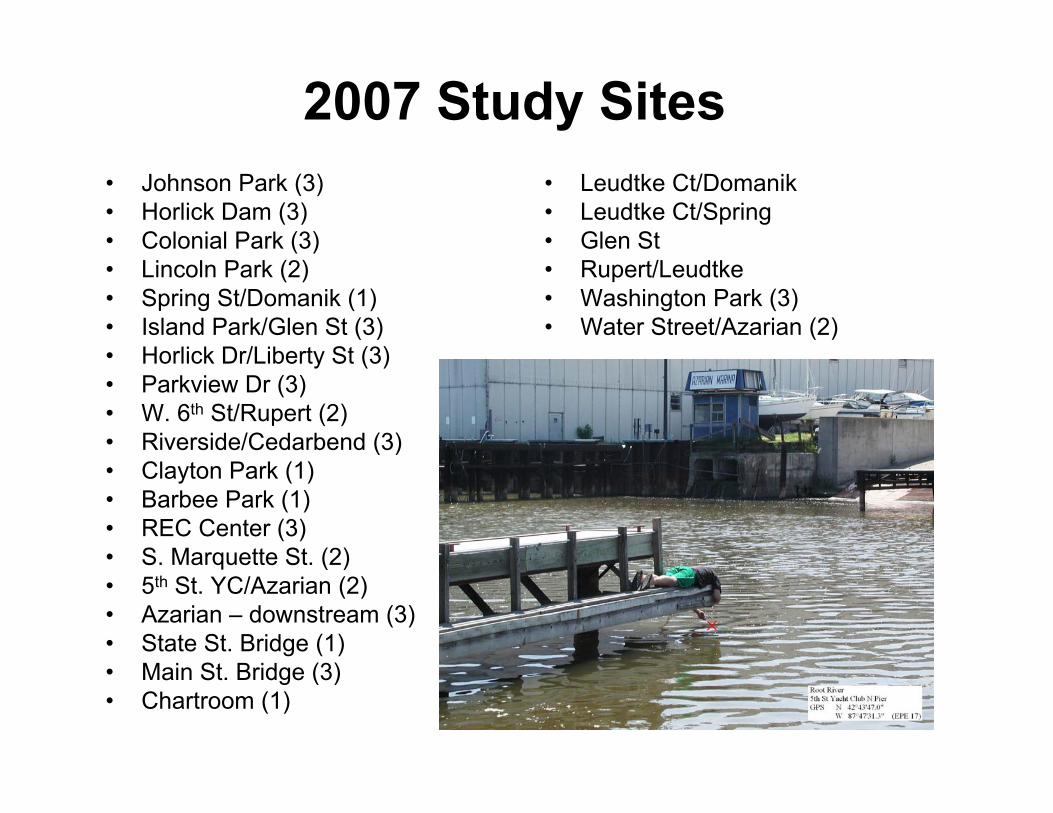
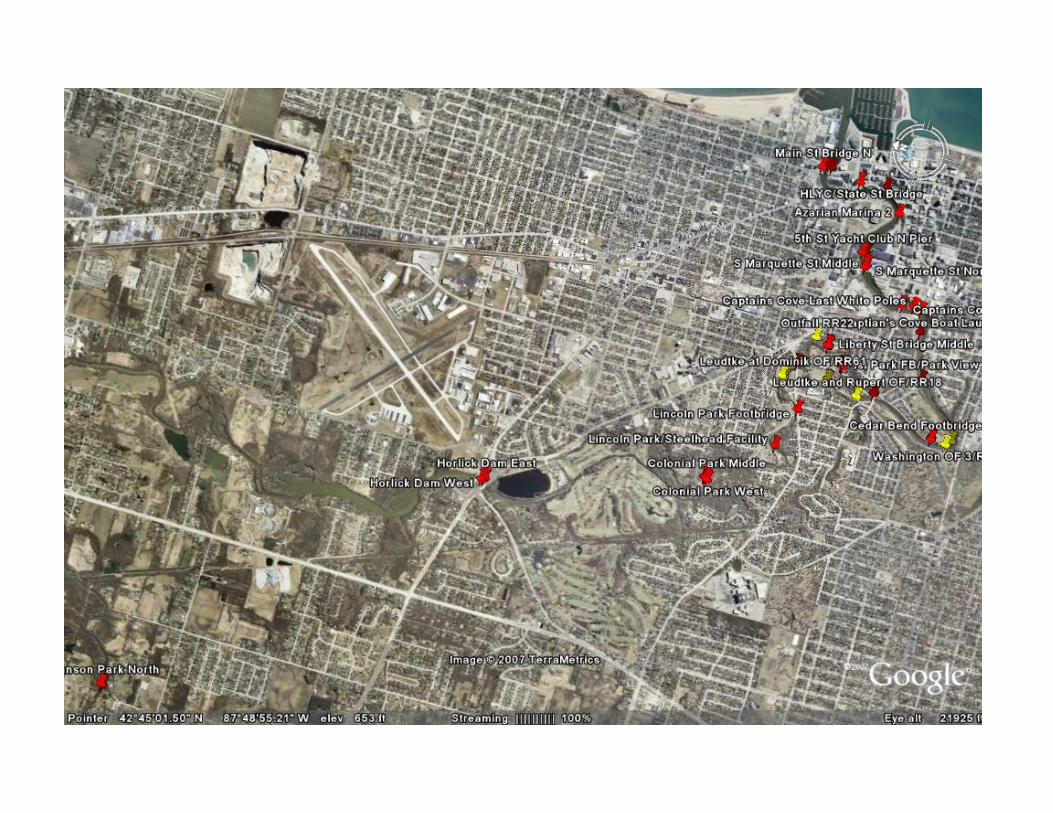
2007 Study Sites• Johnson Park (3)• Horlick Dam (3)• Colonial Park (3)• Lincoln Park (2)• Spring St/Domanik (1)• Island Park/Glen St (3)• Horlick Dr/Liberty St (3)• Parkview Dr (3)• W. 6th St/Rupert (2)• Riverside/Cedarbend (3)• Clayton Park (1)• Barbee Park (1)• REC Center (3)• S. Marquette St. (2)• 5th St. YC/Azarian (2)• Azarian – downstream (3)• State St. Bridge (1)• Main St. Bridge (3)• Chartroom (1)
• Leudtke Ct/Domanik• Leudtke Ct/Spring• Glen St• Rupert/Leudtke• Washington Park (3)• Water Street/Azarian (2)
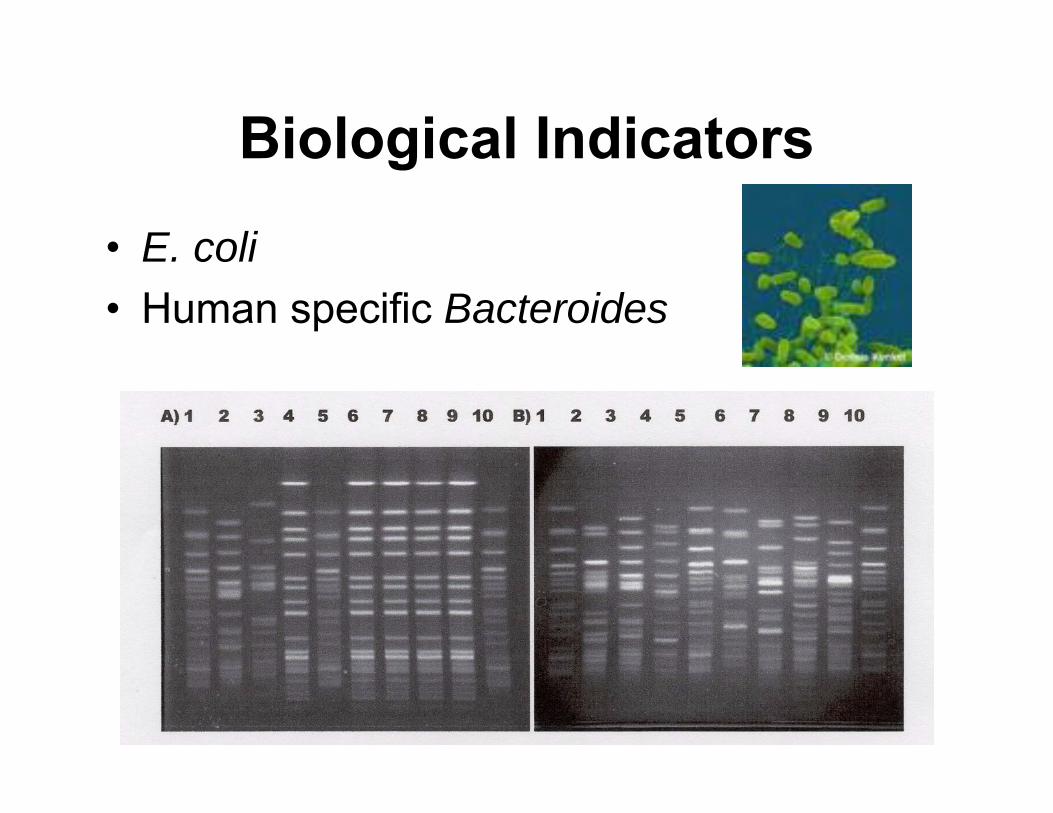
Biological Indicators
• E. coli• Human specific Bacteroides

Chemical Indicators• pH• Temperature• Turbidity• Conductivity• Detergents• Chlorine• Copper• Phenols
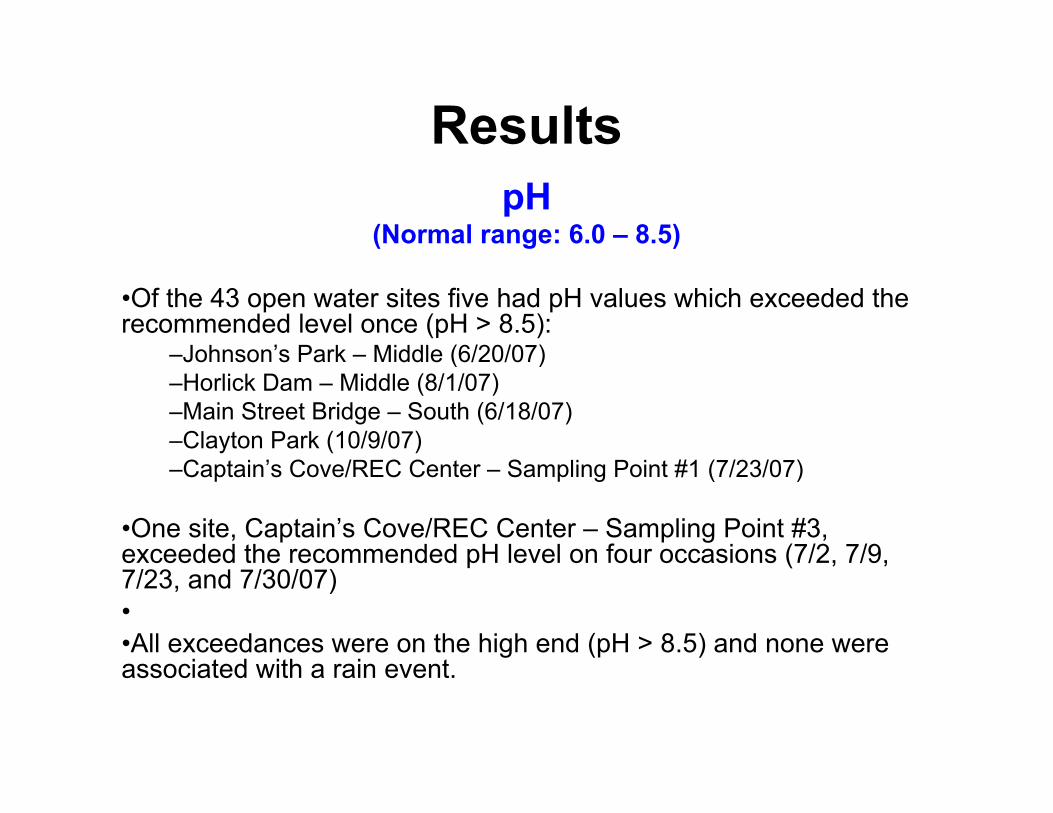
ResultspH
(Normal range: 6.0 – 8.5)
•Of the 43 open water sites five had pH values which exceeded therecommended level once (pH > 8.5):
–Johnson’s Park – Middle (6/20/07)–Horlick Dam – Middle (8/1/07)–Main Street Bridge – South (6/18/07)–Clayton Park (10/9/07)–Captain’s Cove/REC Center – Sampling Point #1 (7/23/07)
•One site, Captain’s Cove/REC Center – Sampling Point #3, exceeded the recommended pH level on four occasions (7/2, 7/9, 7/23, and 7/30/07)••All exceedances were on the high end (pH > 8.5) and none were associated with a rain event.

ResultsWater Temperature:
•The water temperature remained fairly stable at all sampling points
•Average deviation being ± 5.9 °F between the highest and lowest readings at each of the respective 43 sites (minimum ± 4.2 °F, maximum ± 7.2 °F)
•Mean water temperature overall was 71.0 °F
•Upstream segments generally had cooler water temperatures, by approximately one to two degrees
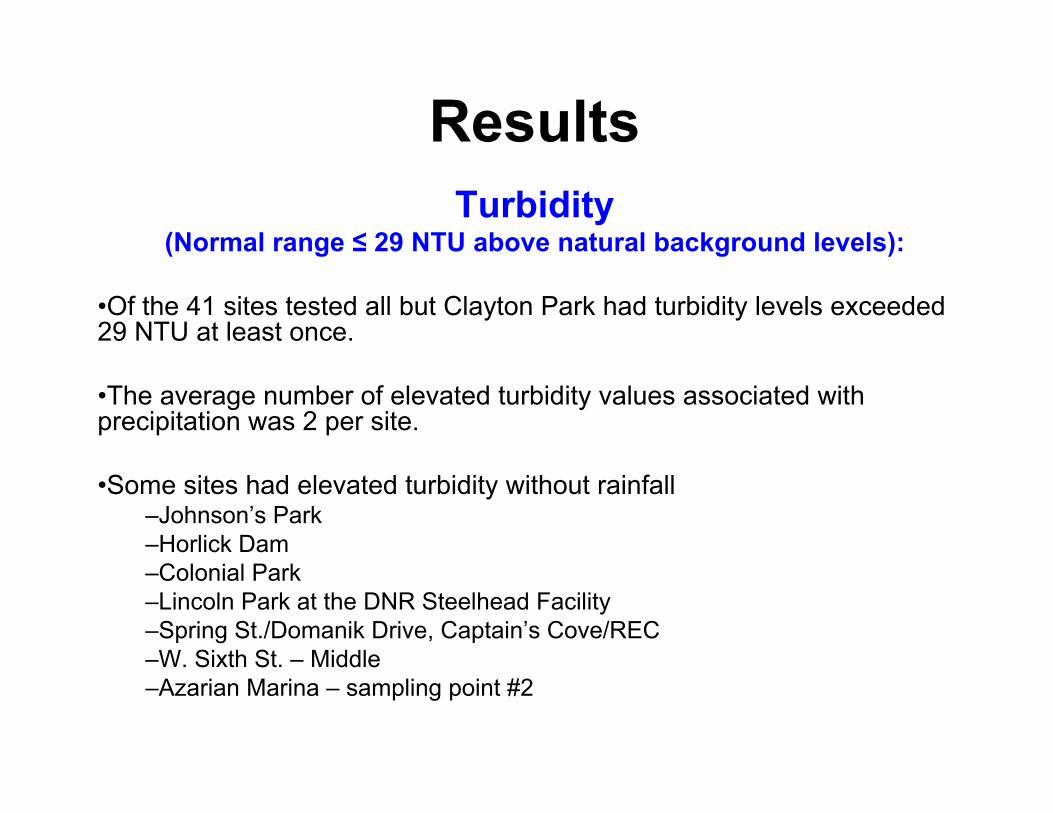
ResultsTurbidity
(Normal range ≤ 29 NTU above natural background levels):
•Of the 41 sites tested all but Clayton Park had turbidity levels exceeded 29 NTU at least once.
•The average number of elevated turbidity values associated with precipitation was 2 per site.
•Some sites had elevated turbidity without rainfall–Johnson’s Park–Horlick Dam–Colonial Park–Lincoln Park at the DNR Steelhead Facility–Spring St./Domanik Drive, Captain’s Cove/REC–W. Sixth St. – Middle–Azarian Marina – sampling point #2

Results
Conductivity (Normal range: 50 – 1500 μmhos/cm or 50% above baseline levels):
•The highest conductivity measurement recorded during this study was 5.82 μmhos/cm
•This value only reflects the summer months and may very well be higher during the winter and spring when road salt may be transported to the Root River
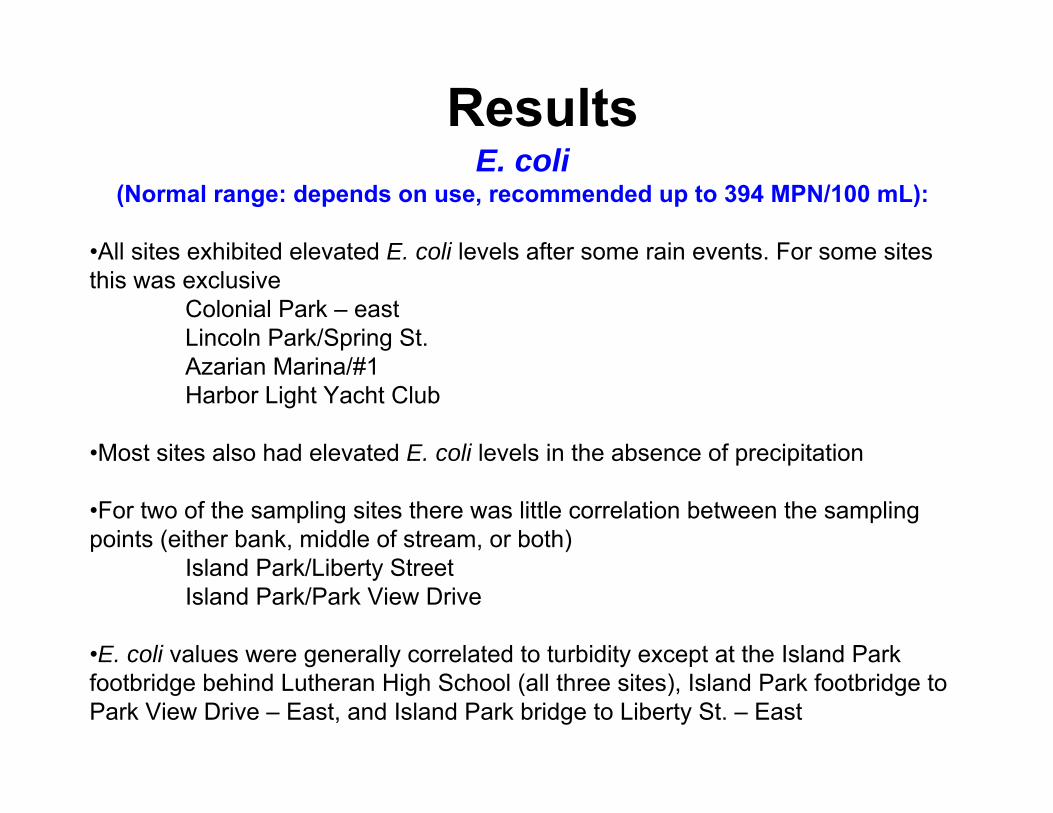
ResultsE. coli
(Normal range: depends on use, recommended up to 394 MPN/100 mL):
•All sites exhibited elevated E. coli levels after some rain events. For some sites this was exclusive
Colonial Park – eastLincoln Park/Spring St.Azarian Marina/#1Harbor Light Yacht Club
•Most sites also had elevated E. coli levels in the absence of precipitation
•For two of the sampling sites there was little correlation between the sampling points (either bank, middle of stream, or both)
Island Park/Liberty Street Island Park/Park View Drive
•E. coli values were generally correlated to turbidity except at the Island Park footbridge behind Lutheran High School (all three sites), Island Park footbridge to Park View Drive – East, and Island Park bridge to Liberty St. – East
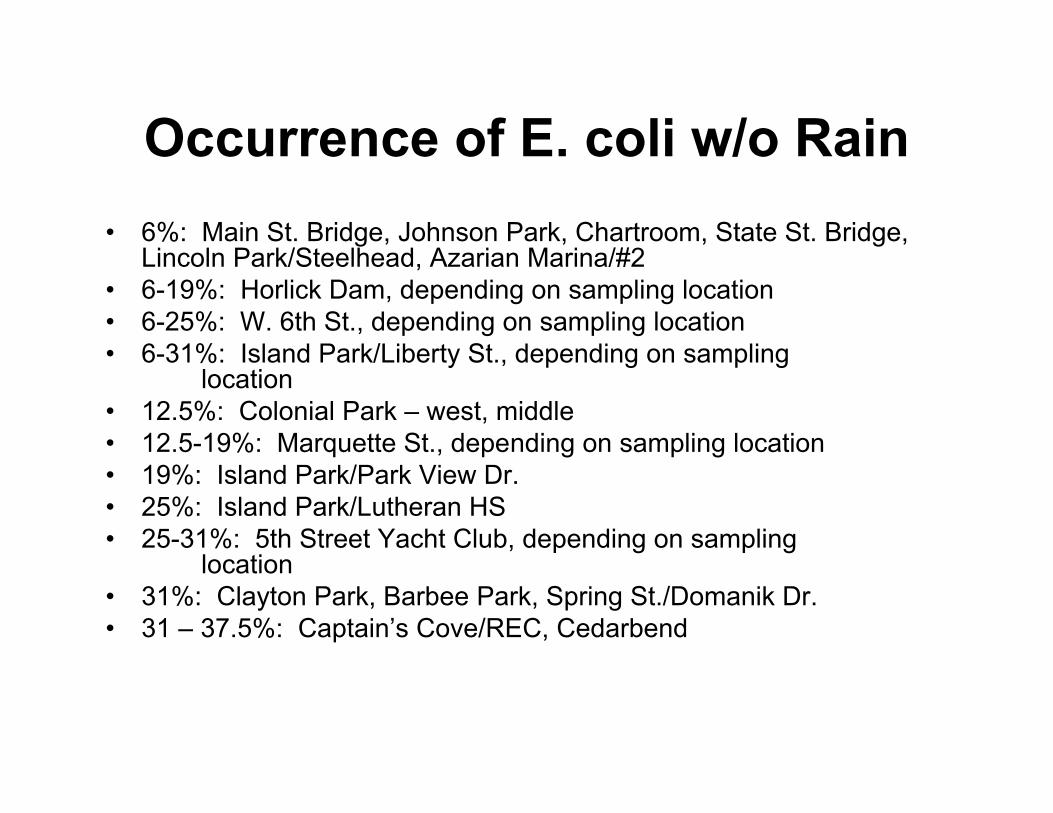
Occurrence of E. coli w/o Rain• 6%: Main St. Bridge, Johnson Park, Chartroom, State St. Bridge,
Lincoln Park/Steelhead, Azarian Marina/#2• 6-19%: Horlick Dam, depending on sampling location• 6-25%: W. 6th St., depending on sampling location• 6-31%: Island Park/Liberty St., depending on sampling
location• 12.5%: Colonial Park – west, middle• 12.5-19%: Marquette St., depending on sampling location• 19%: Island Park/Park View Dr.• 25%: Island Park/Lutheran HS• 25-31%: 5th Street Yacht Club, depending on sampling
location• 31%: Clayton Park, Barbee Park, Spring St./Domanik Dr.• 31 – 37.5%: Captain’s Cove/REC, Cedarbend

Other Chemical Parameters• Detergents (Normal range: ≤ 0.50 mg/L):
Detergents were detected frequently (80 – 100% of sampling events) except at Washington Park Outfall #3 (RR37-c, 31%)
• Total Residual Chlorine (Normal range: < 0.01 mg/L:Total residual chlorine was detected in the Water Street Outfall (#RR36-1W, #RR36-2E) 25% of the time. Values ranged from 0.1 – 0.15 mg/L.
• Copper (Normal range: ≤ 3.7 μg/L): None detected
• Total Phenols (Normal range: < 1.0 μg/L):Washington Park Outfall #2, #RR37-b, had detectable phenols once (0.15 μg/L) but they were within acceptable limits.
Missing Information
• Phosphorus levels• Current & depth measurements• Dissolved oxygen
– Fish community assessments• Seasonal variation in measured
parameters– Impacts of snow melt– Impacts of heavy spring rains, flooding
Next Steps
• Applied to WI Coastal Management Program for an additional year of funding
• Includes educational programming for general public and REC Center
• Continues collaborative effort with River Alliance, Root-Pike WIN
• Provides for citizen-based training opportunities

SEWRPC (2007) – Plan Update
• Update includes major plan elements addressing:1. Land Use
2. Surface Water Quality• Point source pollution abatement
• Non‐point source pollution abatement
3. Groundwater Management

Planning Objectives
• Water quality management objectives– Development of facilities, programs, and policies to serve the regional development pattern
– Development of policies and practices to meet water use objectives
– Enhancement of the quality of natural and man‐made environments
– Reduction of sedimentation, other water pollution, and eutrophication

Water Quality Management Plan

Land Use Plan Element
• Fundamental and basic
• Future land use will determine the character, magnitude, and distribution of NPS– Ultimately the quality of surface water in the watersheds
• Tributaries
• Lake Michigan
Urban NPS Abatement
• Control stormwater pollution from existing and planned development, redevelopment, and infill
• Implement coordinated programs to detect and eliminate illicit discharges– Enhance stormwater OF monitoring (wet/dry)– Molecular tests for human specific markers– Upstream dry weather screening of OF when human specific markers are present
Auxiliary Measures
• Long‐term trend lake monitoring programs• Maintain or expand current public health monitoring programs at public beaches
• Coastal zone management• Household hazardous waste and PCP collections
• Standardized agency water quality monitoring of surface water– Utilize citizen‐based water monitoring programs

History of the Root River
• Historic names: – Chippecotton, Chipperooton– KipiKawi
• French explorer’s first landed at the Root River in 1699
• Racine means “root” in French• Racine's harbor & the Root River were important to the shipping industry in the late 1800's
• Also used recreationally

Root River Facts
• Origin, New Berlin (Waukesha County)
• Part of the Root‐Pike Watershed
• Approximately 35 miles long
–117 mi of combined tributaries/streams
• City of Racine reach
–Approximately 5 miles long
–Horlick Dam to mouth at Lake Michigan
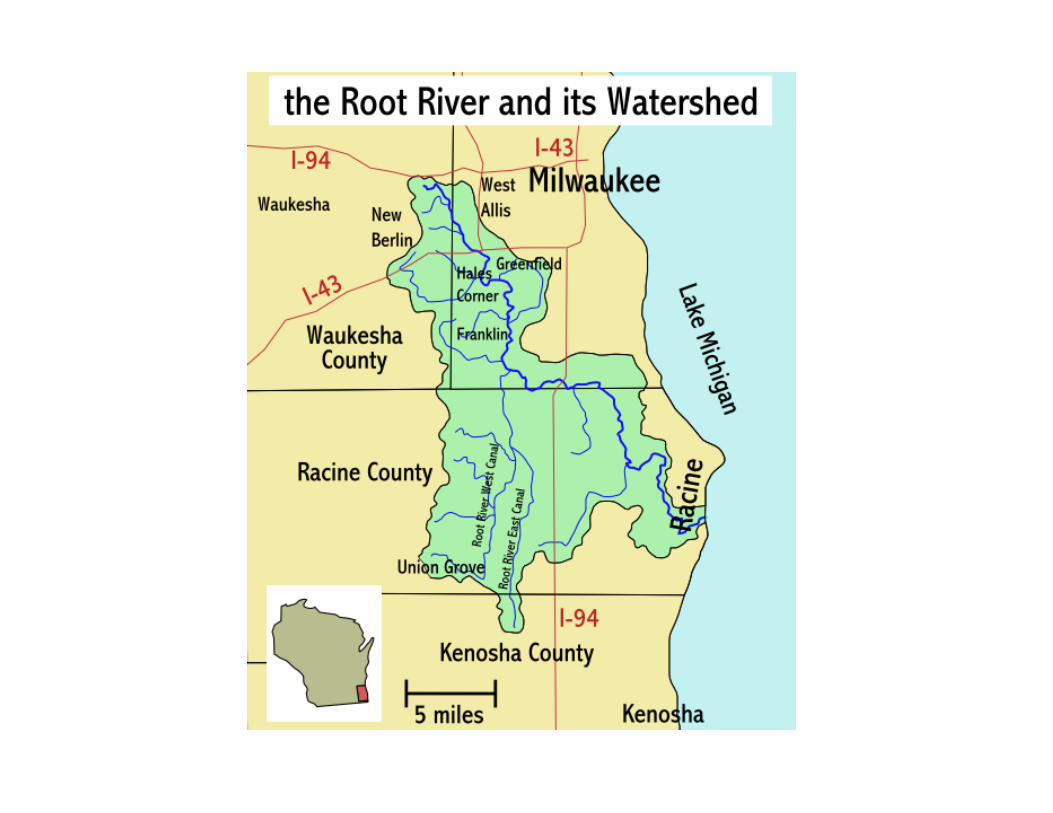
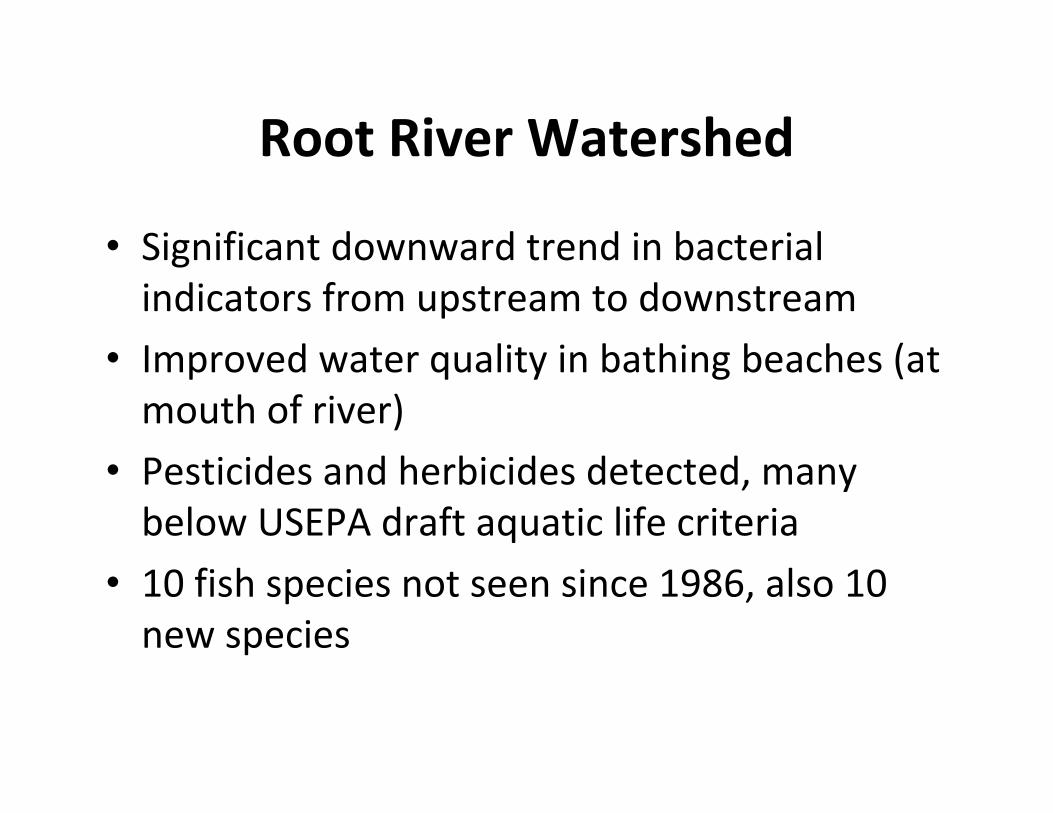
Root River Watershed
• Significant downward trend in bacterial indicators from upstream to downstream
• Improved water quality in bathing beaches (at mouth of river)
• Pesticides and herbicides detected, many below USEPA draft aquatic life criteria
• 10 fish species not seen since 1986, also 10 new species
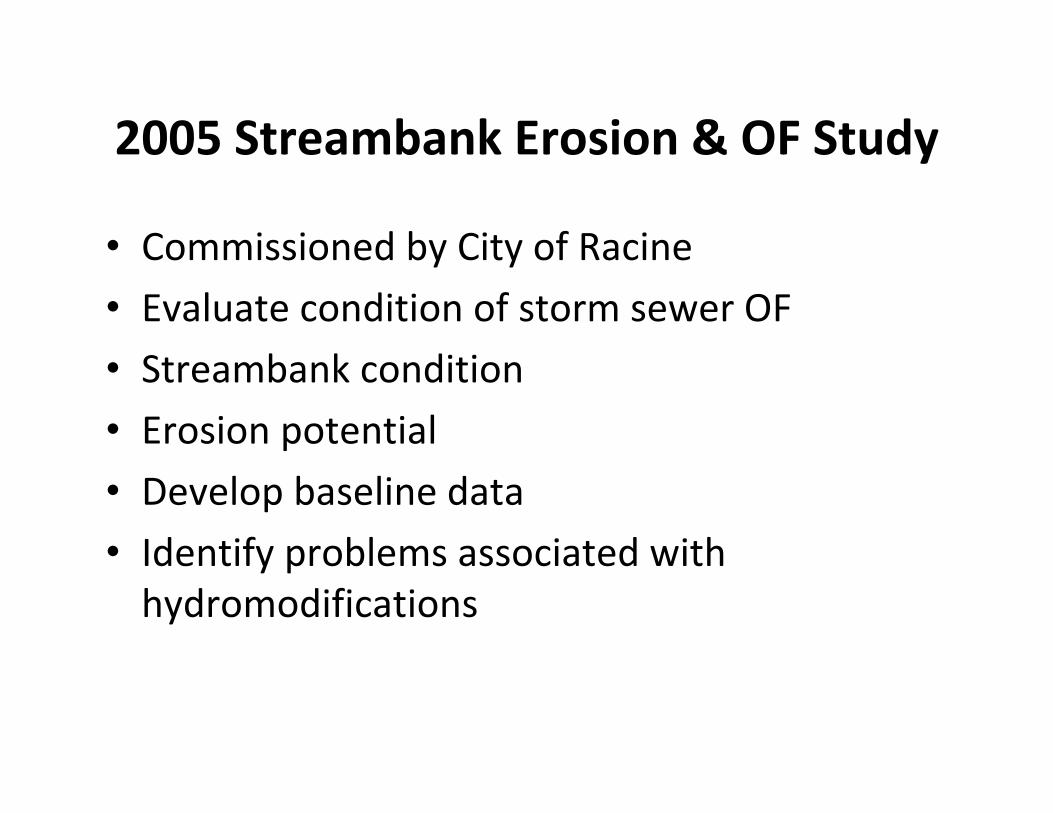
2005 Streambank Erosion & OF Study
• Commissioned by City of Racine
• Evaluate condition of storm sewer OF
• Streambank condition
• Erosion potential
• Develop baseline data
• Identify problems associated with hydromodifications

Additional Studies
• 2007 baseline assessment of Root River water quality
• 2008 expanded Root River study– Seasonal variation
– Educational component
– DO, phosphorous
• 2009 predictive modeling study– Combine land use & coastal models
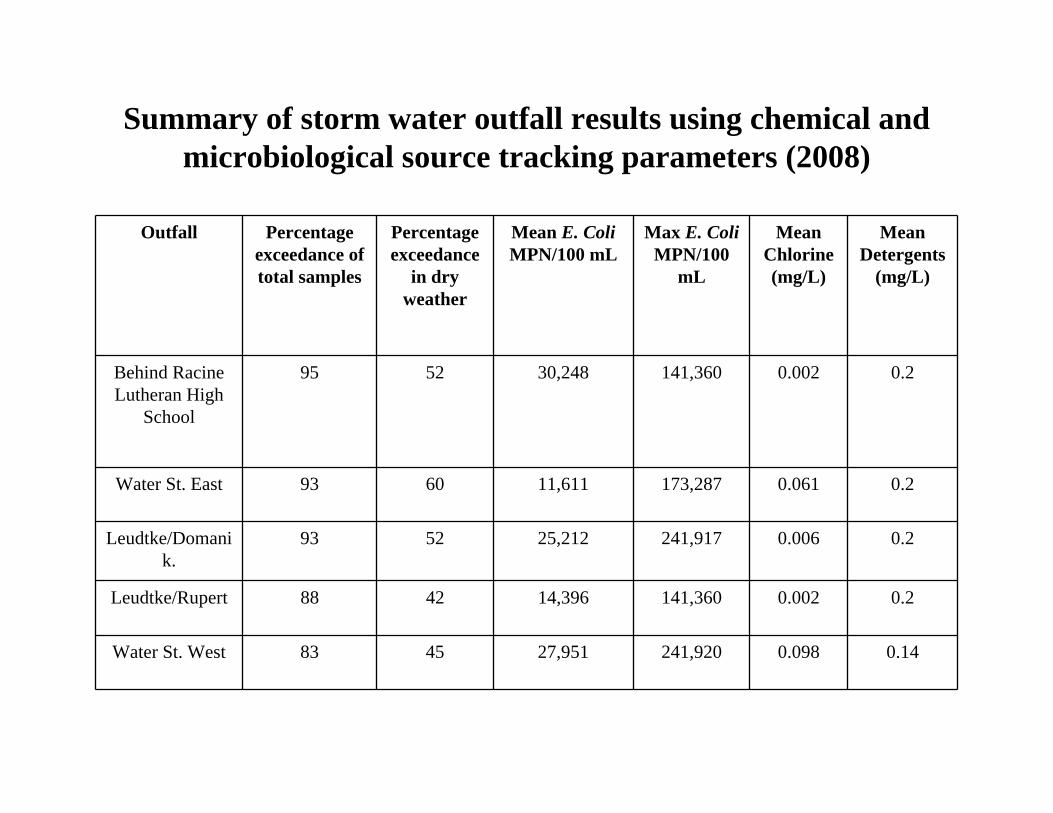
Summary of storm water outfall results using chemical and microbiological source tracking parameters (2008)
Outfall Percentage exceedance of total samples
Percentage exceedance
in dry weather
Mean E. ColiMPN/100 mL
Max E. ColiMPN/100
mL
Mean Chlorine (mg/L)
Mean Detergents
(mg/L)
Behind Racine Lutheran High
School
95 52 30,248 141,360 0.002 0.2
Water St. East 93 60 11,611 173,287 0.061 0.2
Leudtke/Domanik.
93 52 25,212 241,917 0.006 0.2
Leudtke/Rupert 88 42 14,396 141,360 0.002 0.2
Water St. West 83 45 27,951 241,920 0.098 0.14
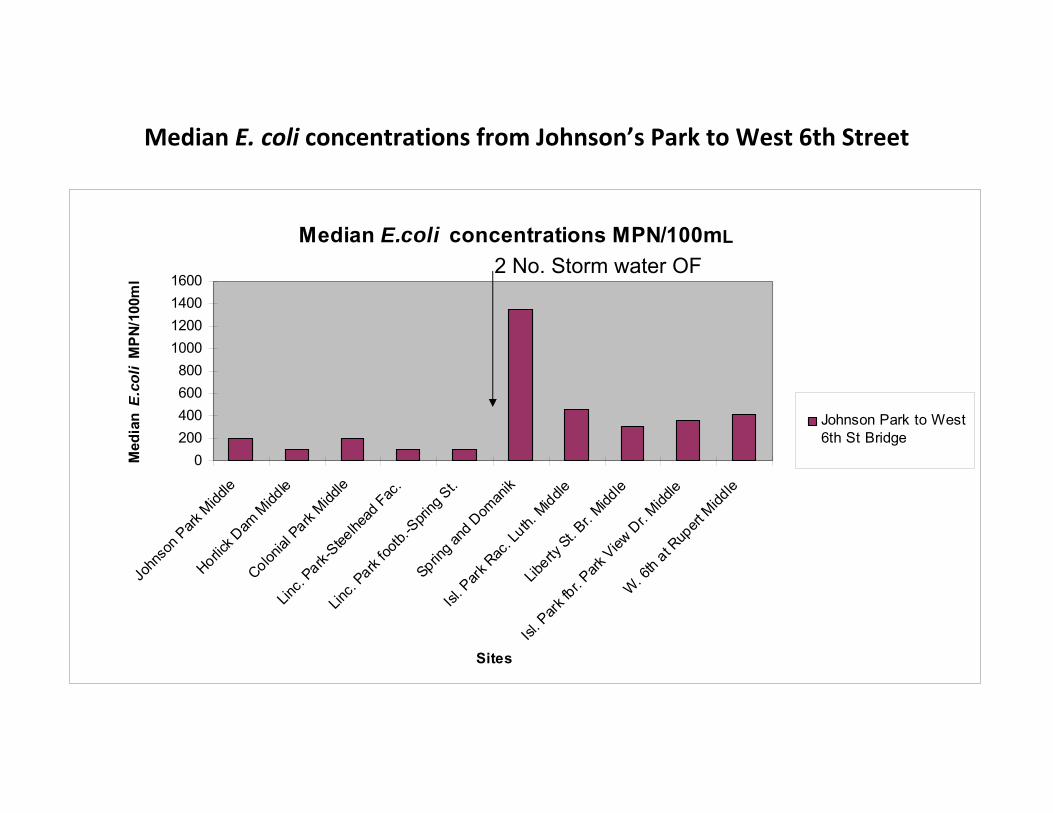
Median E. coli concentrations from Johnson’s Park to West 6th Street
Median E.coli concentrations MPN/100mL
0200400600800
1000120014001600
John
son P
ark M
iddle
Horlick D
am M
iddle
Colonial
Park Midd
le
Linc
. Park-
Steelhe
ad Fac
.
Linc
. Park
footb.
-Spri
ng St.
Spring a
nd D
oman
ik
Isl. P
ark R
ac. L
uth. M
iddle
Liberty
St. Br. M
iddle
Isl. P
ark fb
r. Park
View D
r. Midd
le
W. 6th at R
upert
Midd
le
Sites
Med
ian
E.c
oli
MP
N/10
0ml
Johnson Park to West6th St Bridge
2 No. Storm water OF

Median E. coli concentrations from Cedarbend Bridge to mouth of Root River
Median E.coli concentrations (MPN/100mL)
0
100
200
300
400
500
600
700
Rivers.
Dr.@
Ced. B
. fb. M
Iddle
Clayton P
arkBarb
ee Park
Captain's
Cov
e
Capt.'s
C. last
white pier
Capt.'s
C. Gos
pel L. B
r.
S. Marq
uette
St. Middle
5th St. Y
acht
Cl. Nort
h Pier
5th St. Y
acht
Cl. South
Pier
Azaria
n Mari
na 2
Azaria
n Mari
na 1
Har. Light
Yacht
Cl./Stat
e St. B
r.
Main S
t. Brid
ge M
iddleChart
room
Sites
Med
ian
E.c
oli
MPN
/100
ml
Cedar Bend Br toChartroom Restaurant(near river mouth)
2 No. Storm water OF3 No. Storm water OF


Low priorityLook at localised
areas of improvement
Medium priorityReduce runoff in
local area, consider stream
bank improvements
No Yes
No
E. coliexceedance > 40% in 24hr PPT?
Storm water outfalls nearby with DWF?
Major priority Monitor OF if not
already. Investigate source of DWF and
eliminate
Med – high priorityReduce storm water
runoff – rain gardens, buffer/filter strips as
appropriate
Impervious surfaces? Insufficient buffer strip?
High IC?
Close Proximity to OFs?
Eroded stream banks / lack of buffer strip?
Low to medium priorityReduce storm water runoff,
opportunities for infiltration systems, filter strips, rain gardens, etc.
YesNo
Low priorityLook at
localised areas of improvement
Low to medium priority
Consider stream bank improvements, e.g.
buffer strips
Yes
YesNo
E. coliexceedance>40% in dry weather? & >50% in 24hr PPT?
No Yes
Azarian Marina -Sampling Point #2,
upstream
Strong association between E. coli & 24hr
rainfall? (R2>0.60)
Strong association between E. coli and
48 hr PPT?(r2>0.5)
E. coliexceedance > 50% within 24hr PPT?
Medium priorityStorm water runoff
management, improve sites
upstream
Investigate source of DWF at Water Street OFsand eliminate
Consider converting grassy areas on south bank with a rain garden

Low priorityLook at localised
areas of improvement
Medium priorityReduce runoff in
local area, consider stream
bank improvements
No Yes
No
E. coliexceedance > 40% in 24hr PPT?
Storm water outfalls nearby with DWF?
Major priority Monitor OF if not
already. Investigate source of DWF and
eliminate
Med – high priorityReduce storm water
runoff – rain gardens, buffer/filter strips as
appropriate
Impervious surfaces? Insufficient buffer strip?
High IC?
Close Proximity to OFs?
Eroded stream banks / lack of buffer strip?
Low to medium priorityReduce storm water runoff,
opportunities for infiltration systems, filter strips, rain gardens, etc.
YesNo
Low priority Look at
localised areas of improvement
Low to medium priority
Consider stream bank improvements, e.g.
buffer strips
Yes
YesNo
E. coliexceedance>40% in dry weather? & >50% in 24hr PPT?
No Yes
Clayton Park
Strong association between E. coli & 24hr
rainfall? (R2>0.60)
Strong association between E. coli and
48 hr PPT?(r2>0.5)
E. coliexceedance > 50% within 24hr PPT?
Medium priority Storm water runoff
management, improve sites
upstream
Consider rain garden to intercept car park runoff
Eliminate DWFs from Washington Park OFs No. 1 and 2
Low priorityLook at localised
areas of improvement
Medium priorityReduce runoff in
local area, consider stream
bank improvements
No Yes
No
E. coliexceedance > 40% in 24hr PPT?
Storm water outfalls nearby with DWF?
Major priorityMonitor OF if not
already. Investigate source of DWF and
eliminate
Med – high priorityReduce storm water runoff, rain gardens, buffer/filter strips as
appropriate
Impervious surfaces? Insufficient buffer strip?
High IC?
Close Proximity to OFs?
Eroded stream banks / lack of buffer strip?
Low to medium priorityReduce storm water runoff, opportunities for infiltration
systems, filter strips, rain gardens etc.
YesNo
Low priority Look at localised
areas of improvement
Low to medium priorityConsider stream bank
improvements, e.g. buffer strips
Yes
YesNo
E. coliexceedance>40% in dry weather? & >50% in 24hr PPT?
No Yes
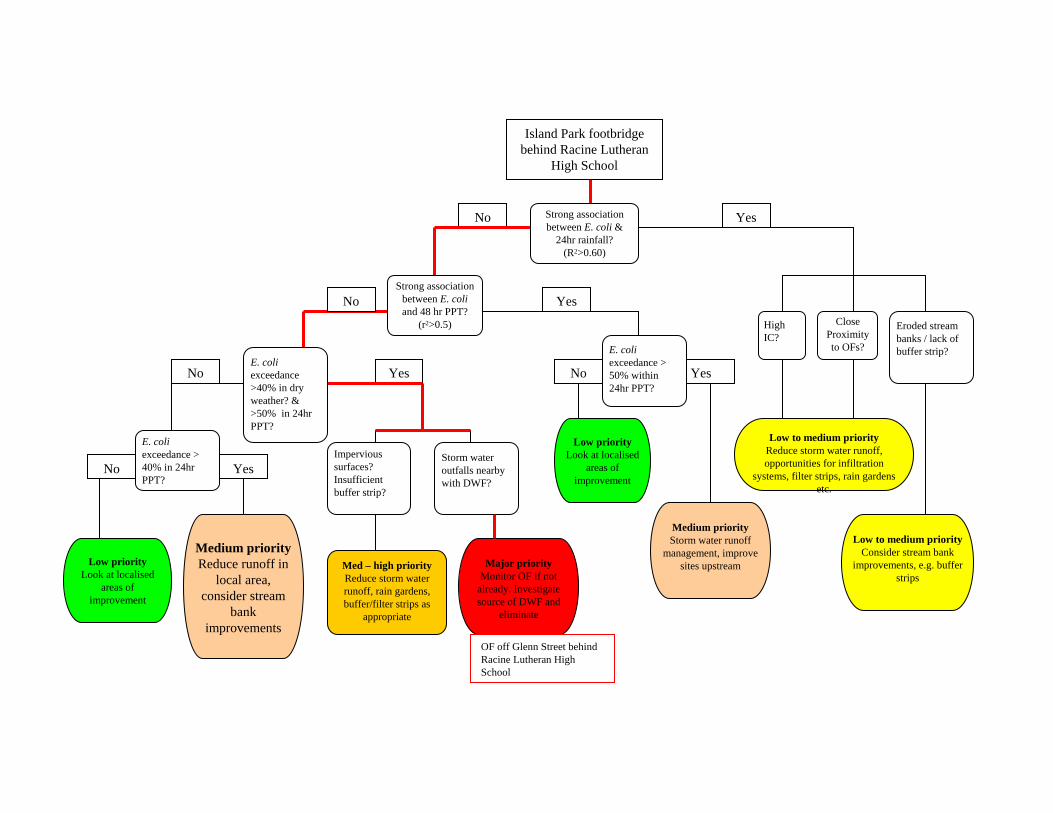
Island Park footbridge behind Racine Lutheran
High School
Strong association between E. coli &
24hr rainfall? (R2>0.60)
Strong association between E. coliand 48 hr PPT?
(r2>0.5)
E. coliexceedance > 50% within 24hr PPT?
Medium priority Storm water runoff
management, improve sites upstream
OF off Glenn Street behind Racine Lutheran High School
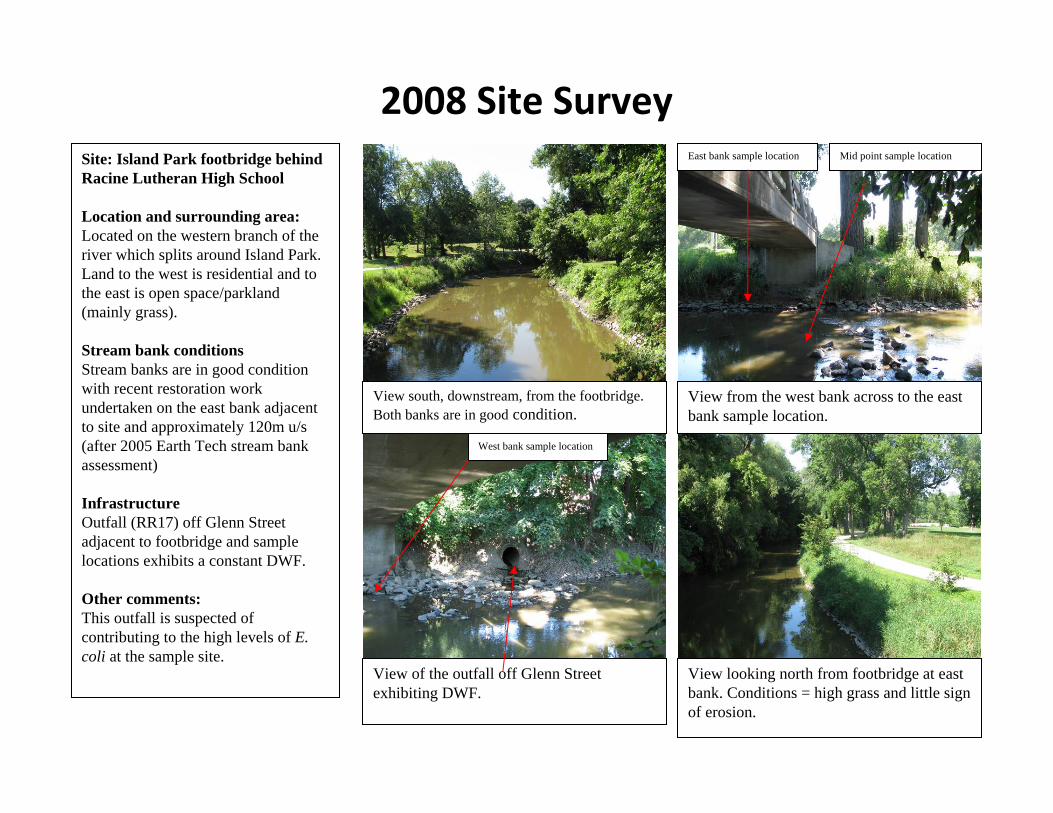
Site: Island Park footbridge behind Racine Lutheran High School
Location and surrounding area:Located on the western branch of the river which splits around Island Park. Land to the west is residential and to the east is open space/parkland (mainly grass).
Stream bank conditionsStream banks are in good condition with recent restoration work undertaken on the east bank adjacent to site and approximately 120m u/s(after 2005 Earth Tech stream bank assessment)
InfrastructureOutfall (RR17) off Glenn Street adjacent to footbridge and sample locations exhibits a constant DWF.
Other comments:This outfall is suspected of contributing to the high levels of E. coli at the sample site.
View south, downstream, from the footbridge. Both banks are in good condition.
View from the west bank across to the east bank sample location.
View of the outfall off Glenn Street exhibiting DWF.
View looking north from footbridge at east bank. Conditions = high grass and little sign of erosion.
East bank sample location Mid point sample location
West bank sample location
2008 Site Survey

Turbidity as a Function of Location, by Group, Johnson’s Park to the Mouth
p = 0.003p = 0.07
171.614156.184211.863163.553227.552186.532230.471191.581
Mean Rank (NTU)Group
Mean Rank (NTU)Group
20082007Between Group Turbidity – 2007 and 2008

Dry Weather E. coli
Median E.coli concentrations MPN/100mL in dry weather (2007 and 2008)
0.00
100.00
200.00
300.00
400.00
500.00
600.00
700.00
800.00
John
son P
arkHorlic
k Dam
Colonial
Park
DNR Steelhea
d fac
.
Linco
ln Pk.
Fb.
Spring
and D
omini
k
Is. Pk.
Luthe
ran H
S.
Is. Pk B
r. To Libert
y St.
Is. Pk.
Park View
Dr.
West 6th
bridge
Cedar B
end br
idge
Clayton P
k.Barb
ee Park
Captain
Cove#
1
Captain
Cove #
2
Captain
Cove #
3
South
Marq. S
t. br.
5th Stre
et YC S
outh
Azaria
n #2
Azaria
n #1
HLYCMain
St. B
r.
Chartroo
m Rs.
Sites
Med
ian
E. c
oli M
PN/1
00m
l
Johnson Park to Chartroom
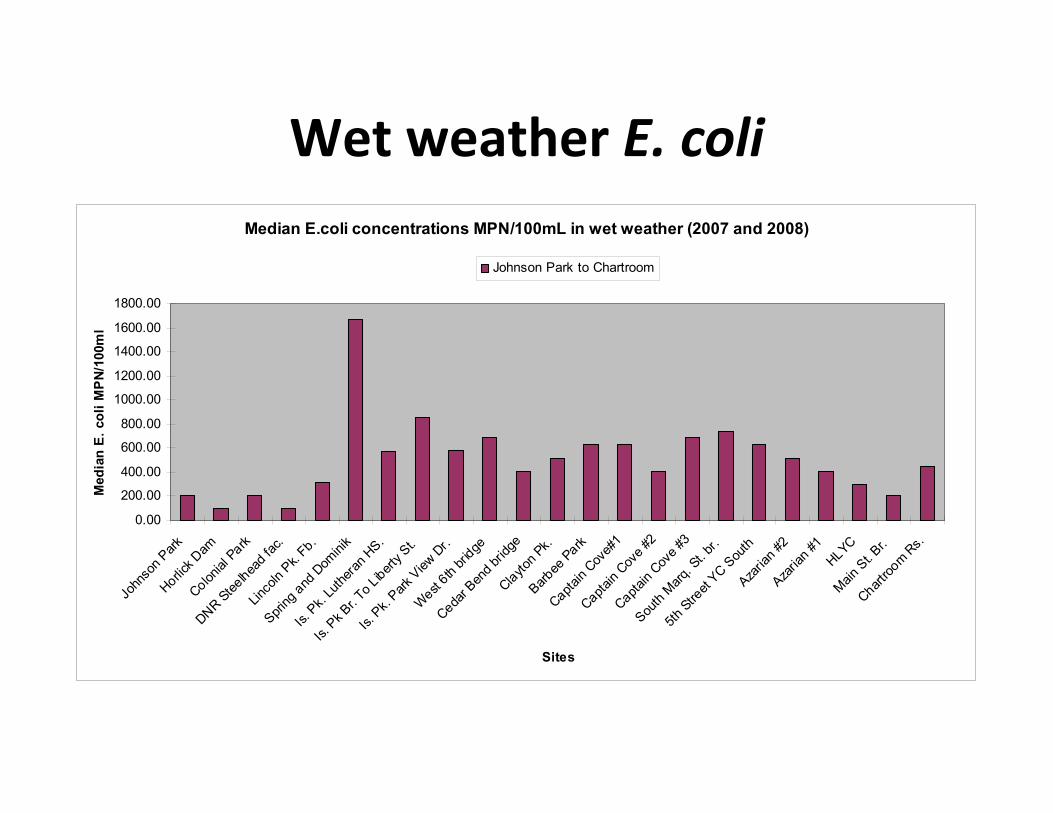
Wet weather E. coliMedian E.coli concentrations MPN/100mL in wet weather (2007 and 2008)
0.00
200.00
400.00
600.00
800.00
1000.00
1200.00
1400.00
1600.00
1800.00
John
son P
arkHorlic
k Dam
Colonial
Park
DNR Steelhea
d fac
.
Linco
ln Pk.
Fb.
Spring
and D
omini
k
Is. Pk.
Luthe
ran H
S.
Is. Pk B
r. To Libert
y St.
Is. Pk.
Park View
Dr.
West 6th
bridge
Cedar B
end br
idge
Clayton P
k.Barb
ee Park
Captain
Cove#
1
Captain
Cove #
2
Captain
Cove #
3
South
Marq. S
t. br.
5th Stre
et YC S
outh
Azaria
n #2
Azaria
n #1
HLYCMain
St. B
r.
Chartroo
m Rs.
Sites
Med
ian
E. c
oli M
PN/1
00m
l
Johnson Park to Chartroom
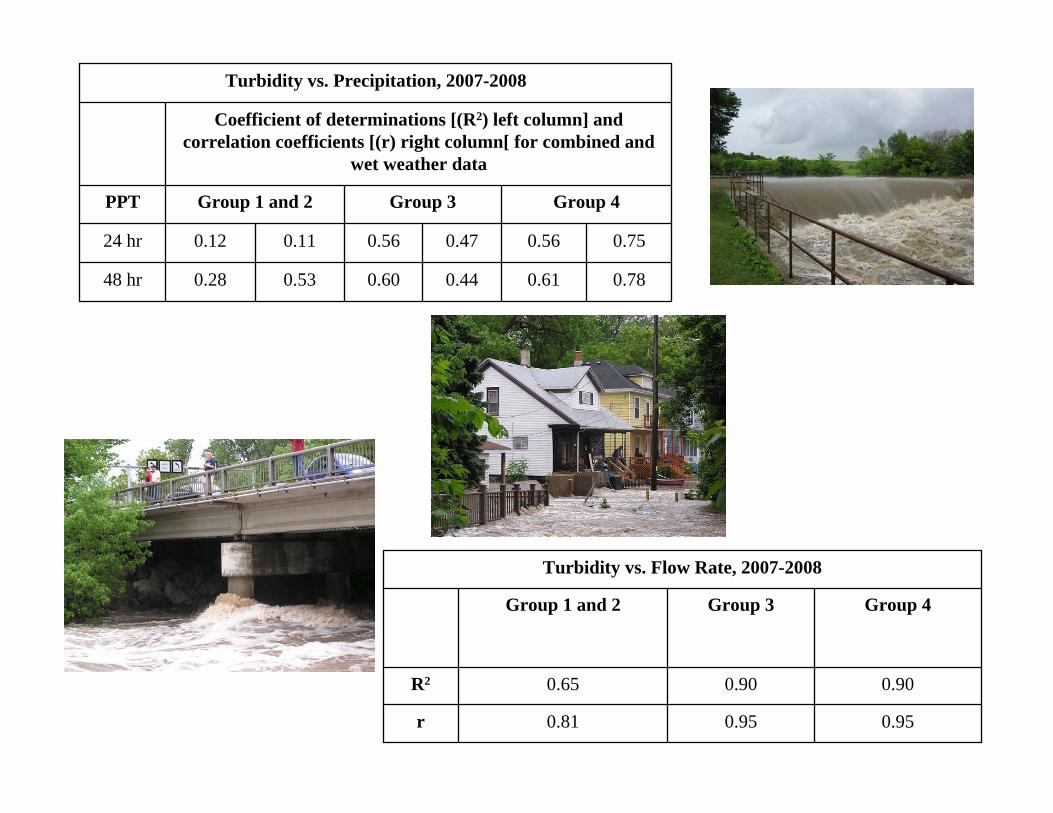
0.780.610.440.600.530.2848 hr
0.750.560.470.560.110.1224 hr
Group 4Group 3Group 1 and 2PPT
Coefficient of determinations [(R2) left column] and correlation coefficients [(r) right column[ for combined and
wet weather data
Turbidity vs. Precipitation, 2007-2008
0.950.950.81r
0.900.900.65R2
Group 4Group 3Group 1 and 2
Turbidity vs. Flow Rate, 2007-2008

Summary of recommended ranges/limits for chemical and
microbial parameters
385 MPN/100ml recommended threshold for primary contact limit (75% CI)
(USEPA, 2000)
No greater than 31.7 °C
(WI DNR, 2008)
Not less than 5 mg/l
(WI DNR, 2008)
6.0-8.5(USEPA,
2000)
No greater than 25 NTU (Mulla, D 2002)
Recommendedrange/limit
E. coliWaterTemperature
DOpHTurbidity
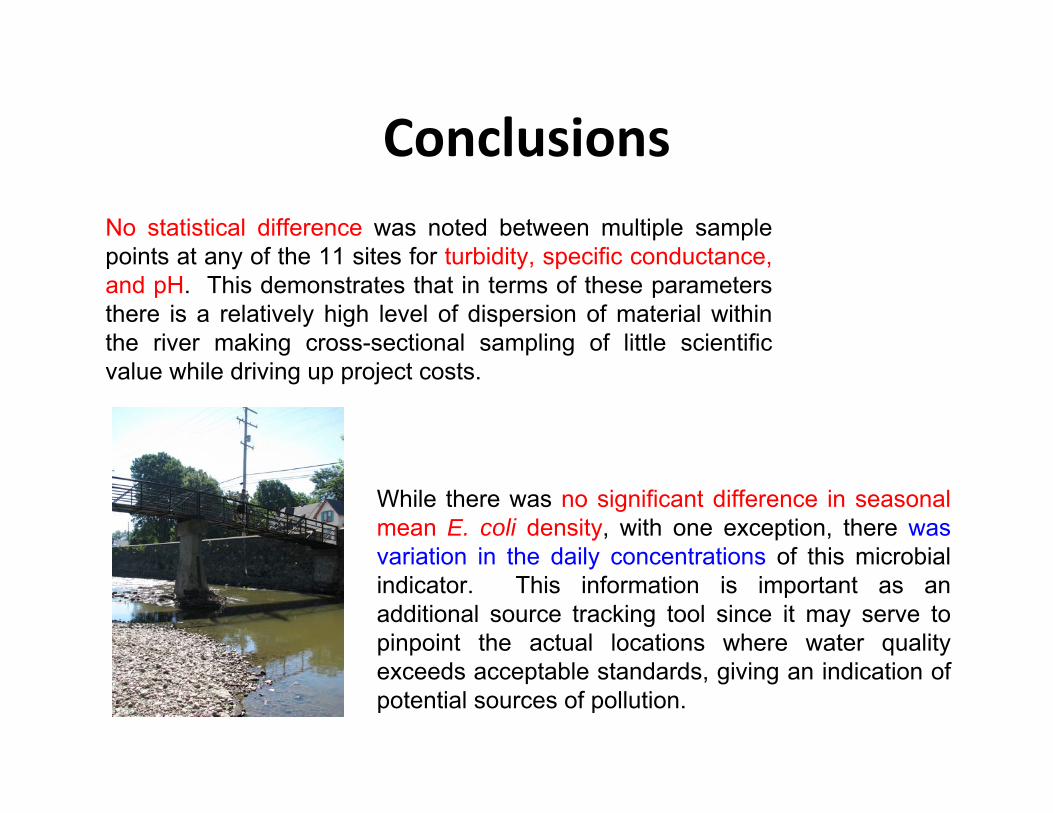
No statistical difference was noted between multiple sample points at any of the 11 sites for turbidity, specific conductance, and pH. This demonstrates that in terms of these parameters there is a relatively high level of dispersion of material within the river making cross-sectional sampling of little scientific value while driving up project costs.
While there was no significant difference in seasonal mean E. coli density, with one exception, there was variation in the daily concentrations of this microbial indicator. This information is important as an additional source tracking tool since it may serve to pinpoint the actual locations where water quality exceeds acceptable standards, giving an indication of potential sources of pollution.
Conclusions

ConclusionsA number of associations were identified between environmental conditions, assessed chemical and microbial parameters, and physical characteristics (morphology, stream bank erosion, and presence/quality of infrastructure) along the Root River. These associations were consequently used in order to determine sources of pollution to the river and to develop a means of prioritising effective mitigation at individual sites along the river
The strength of association between E. coli concentrations and precipitation at a monitored site may be explained by the physical characteristics of the site and surrounding area. These characteristics may determine how the site responds to rainfall, including what deters or enhances runoff. Sites which exhibit different strengths of association to one another may lead to the identification of common pollution sources, factors which impact the level of association, and what incurs the variability between sites. Differences in association between 24 and 48 hour rainfall events may also be explained by the same physical characteristics.