Embed Size (px)
Citation preview
BRAINA JOURNAL OF NEUROLOGY
Combined magnetic resonance imaging andpositron emission tomography brain imaging inbehavioural variant frontotemporal degeneration:refining the clinical phenotypeC. M. Kipps,1,2 J. R. Hodges,2,3 T. D. Fryer4 and P. J. Nestor2
1 Wessex Neurological Centre, Southampton University NHS Trust, Southampton, UK
2 Department of Clinical Neuroscience, University of Cambridge, Addenbrooke’s Hospital, Cambridge, UK
3 Prince of Wales Medical Research Institute, Randwick, NSW, 2031, Australia
4 Wolfson Brain Imaging Centre, University of Cambridge, Addenbrooke’s Hospital, Cambridge, UK
Correspondence to: Prof. J. R. Hodges,
Prince of Wales Medical Research Institute,
Randwick 2031, NSW,
Australia
E-mail: [email protected]
In patients with the behavioural variant of frontotemporal dementia, prognosis is often surprisingly good when there is normal
structural imaging at presentation. Imaging abnormalities are not, however, mandatory for diagnosis, which in the absence of
suitable biomarkers, remains entirely clinical. We aimed to test whether cases with normal structural imaging have hypome-
tabolism suggestive of underlying neurodegeneration, or whether it is likely that such patients are false positive diagnoses of
behavioural variant frontotemporal dementia. Patients with this disease (n = 24) and age-matched controls (n = 12) underwent
both magnetic resonance imaging (MRI) and quantitative fluorodeoxyglucose-positron emission tomography (FDG-PET)
scanning, together with clinical and behavioural assessments. Regions of interest were used to calculate metabolic rate in
frontotemporal and control regions. Using a semi-quantitative visual rating scale, patients were divided into MRI-abnormal
(n = 15) and MRI-normal groups (n = 9). There was definite frontotemporal hypometabolism in the MRI-abnormal group
(particularly in the mesial and orbitofrontal regions) even after accounting for brain volume loss, whereas the MRI-normal
group was similar to controls in all regions. In contrast, cognitive and behavioural indices did not separate the two behavioural
variant frontotemporal dementia patient groups. The results suggest that the clinical syndrome of the behavioural variant of
frontotemporal dementia may not be specific for a neurodegenerative disease, and we hypothesize the existence of a phenocopy.
A number of alternative neuropsychiatric and developmental explanations are discussed. We advise caution in diagnosing the
illness in patients without imaging abnormalities, and propose that imaging findings are included in criteria for diagnosis.
Keywords: frontotemporal dementia; FDG-PET; MRI; social cognition; Pick’s disease
Abbreviations: ACE = Addenbrooke’s Cognitive Examination; CBI = Cambridge Behavioural Inventory; CDR = Clinical DementiaRating; FDG-PET = fluorodeoxyglucose-positron emission tomography; MRI = magnetic resonance imaging; NPI = NeuropsychiatricInventory
doi:10.1093/brain/awp077 Brain 2009: 132; 2566–2578 | 2566
Received May 15, 2008. Revised January 12, 2009. Accepted February 18, 2009. Advance Access publication May 4, 2009
� The Author (2009). Published by Oxford University Press on behalf of the Guarantors of Brain. All rights reserved.
For Permissions, please email: [email protected]
Dow
nloaded from https://academ
ic.oup.com/brain/article/132/9/2566/353681 by guest on 12 D
ecember 2021

IntroductionWhile awareness of frontotemporal dementia as an important
cause of early onset dementia is improving, the specificity of
accepted clinical diagnostic criteria remains unclear (Brun et al.,
1994; Neary et al., 1998; McKhann et al., 2001). In particular,
the status of imaging investigations is uncertain; at present,
changes in frontotemporal regions are supportive, but not
mandatory for a diagnosis (Neary et al., 1998). In the absence
of a reliable biomarker of disease, these issues have important
implications for diagnostic accuracy and prognosis, particularly
early in the disease.
The clinical classification of patients with frontotemporal demen-
tia is divided into those presenting with insidious alterations in
personality and social conduct (behavioural variant frontotemporal
dementia) versus those with progressive decline in language
abilities: semantic dementia and progressive non-fluent aphasia
(Neary et al., 1998). A recent magnetic resonance imaging
(MRI) study highlighted the frequency of normal structural
imaging in clinically diagnosed behavioural variant frontotemporal
dementia, in contrast to patients with semantic dementia in whom
a scan was always abnormal at diagnosis (Kipps et al., 2007a).
Although the prognosis of frontotemporal dementia is very poor
overall, with a median survival of only 6 years (Hodges et al.,
2003), and patients with normal imaging have markedly better
survival than their imaging-abnormal counterparts (Davies et al.,
2006). The delineation of a group of patients with apparent
behavioural variant frontotemporal dementia on clinical grounds
but with normal structural imaging and a good prognosis raises
two possibilities: first that an indolent variant of behavioural
variant frontotemporal dementia might exist or, second, that
these subjects might represent a false-positive diagnosis.
(18F)-2-fluoro-deoxy-D-glucose positron emission tomography
(FDG-PET) is a sensitive marker of neuronal dysfunction, and
can detect regional brain dysfunction, even early in the course
of neurodegenerative disease (Nestor et al., 2004; Ciarmiello
et al., 2006). A number of studies have described the role of func-
tional imaging using both FDG-PET and single photon omission
computed tomography (SPECT) in the diagnosis of behavioural
variant frontotemporal dementia (Knopman et al., 2005; Foster
et al., 2007; McNeill et al., 2007). These studies were derived
retrospectively from autopsy-confirmed data, and demonstrate
the potential utility of functional imaging in diagnosing this disease
and distinguishing it from Alzheimer’s disease and other demen-
tias. They cannot, however, address the possibility of false-positive
diagnoses at first presentation because such subjects would be
excluded a priori. This problem was exemplified in a study of
progression of FDG-PET changes in behavioural variant frontotem-
poral dementia that excluded three clinically diagnosed patients on
the grounds of normal PET imaging at baseline (Diehl-Schmid
et al., 2007). Interestingly, one of these excluded patients came
to post-mortem and was not found to have any neuropathology.
Similarly, reports of a patient diagnosed with apparent behavioural
variant frontotemporal dementia, who showed no evidence of
deterioration over a decade and whose structural and metabolic
imaging remained normal throughout that time raises the alternate
possibility of a non-neurodegenerative ‘phenocopy’ of the
syndrome (Kipps et al., 2007b).
An alternate explanation of the structural data might be that the
rate of disease progression in frontotemporal dementia is hetero-
geneous, and that patients with abnormal MRI scans are at the
more aggressive end of the spectrum, whereas some with a
normal structural scan have more indolent disease. If so, perhaps
not all frontotemporal dementia pathologies produce regional
volume loss detectable by MRI, but abnormalities could be detect-
able using a sensitive imaging method such as FDG-PET.
To explore these possibilities we used both functional and struc-
tural imaging to assess a large group of patients with a clinical
diagnosis of behavioural variant frontotemporal dementia. We
compared patients with, and without, structural MRI abnormalities
and hypothesized that cases with normal MRI scans would
not show abnormalities suggestive of neurodegeneration on
FDG-PET, and that since the key diagnostic information in
behavioural variant frontotemporal dementia is obtained from an
informant, that subjective clinical features may give rise to false
positive diagnoses. In addition, we hypothesized that there would
be metabolic heterogeneity within the prefrontal cortex, with
marked impairments in the medial and orbitofrontal regions,
relative to dorsolateral prefrontal or parietal regions which would
be in keeping with the predicted regional spread of pathology
from post-mortem studies (Broe et al., 2003; Kril et al., 2005).
Methods
SubjectsPatients with behavioural variant frontotemporal dementia diagnosed
clinically according to accepted criteria (Brun et al., 1994; Neary et al.,
1998) (n = 24), and appropriate age-matched controls (n = 12) were
recruited from the Addenbrooke’s Hospital Memory Clinic,
Cambridge between 1999 and 2005. Each patient was assessed
by an experienced behavioural neurologist (J.R.H.), a psychiatrist, a
clinical psychologist and neuropsychiatrist. No clinical presentation
was felt to be due to psychiatric illness. In particular, the clinical
features did not reach criteria for major depression, schizophrenia,
alcohol, substance abuse or personality disorder. There was no history
of stroke or significant head injury. Detailed interviews were
conducted with spouses and all reported insidious changes over the
previous few years that represented a distinct change from earlier
functioning. As described below, all patients obtained high scores
on the Neuropsychiatric Inventory (NPI), with a profile typical of
behavioural variant frontotemporal dementia. While structural imaging
was often supportive of the diagnosis, absence of discernable brain
atrophy on magnetic resonance scans was not an exclusion criterion
for the diagnosis. We attempted to recruit all recently diagnosed and
newly presenting cases over a 6-year period. A total of 12 patients
were excluded because of either extreme behavioural disturbance,
co-existent medical disorders which precluded MRI (pacemakers) or
PET scanning (diabetes) or claustrophobia. No patient had significant
vascular lesion load on review of their clinical imaging. Controls were
either spouses or were recruited from local community groups. They
were screened by a neurologist to ensure that there was no evidence
of memory impairment, dementia or other neurological or major
psychiatric illness.
Frontotemporal dementia: refining the syndrome Brain 2009: 132; 2566–2578 | 2567
Dow
nloaded from https://academ
ic.oup.com/brain/article/132/9/2566/353681 by guest on 12 D
ecember 2021

Written informed consent was obtained from both subjects and their
carers after detailed explanation of the procedures involved. The study
was approved by the local regional ethics committee (LREC) and
the Administration of Radioactive Substances Advisory Committee
(ARSAC), UK.
ImagingAll subjects underwent MRI scanning and FDG-PET scanning.
PET scanningThe acquisition procedure has been described in detail elsewhere
(Nestor et al., 2003b). Briefly, fasting (minimum 8 h) FDG-PET
scans were performed on a General Electric Advance system in
three-dimensional mode, with voxel size 2.34�2.34� 4.25 mm and
a field of view of 30�30�15.3 cm. FDG (74 MBq) was administered
and arterial sampling used to calculate the input function. Images were
reconstructed using the PROMIS algorithm (Kinahan and Rogers,
1989), with corrections applied for attenuation, dead time, scatter
and random coincidences. Cerebral metabolic rate for glucose was
calculated from the image and blood data using the Huang autoradio-
graphic technique (Phelps et al., 1979). In the first instance, as there
is no validated reference region in frontotemporal dementia, raw
cerebral metabolic rate for glucose values (mmol/dl/min) were con-
trasted; a second analysis in which these values were normalized to
the cerebellum was subsequently undertaken to reduce the variance
due to normal inter-subject variability in brain metabolism (cerebellar
metabolic rate values were similar between the three groups).
MRI scanningVolumetric MRI scans were obtained with each PET scan and were
performed on either a 3-T Bruker system or a 1.5-T GE Signa MRI
scanner (GE Medical Systems, Milwaukee, WI). The scanning param-
eters were as follows: Bruker––a T1-weighted, three-dimensional,
spoiled gradient echo sequence volumetric MRI. The field of view
was 25.6�22.0�18.0 cm with a matrix size of 256�256� 256. GE
Signa––a three-dimensional, spoiled gradient echo sequence volumet-
ric MRI was acquired with matrix size of 256� 256�120. All MRI
scans were resliced using cubic spline interpolation to an isotropic
voxel size of 1 mm3 using Analyze software (Biomedical Imaging
Resource, Mayo Clinic, Rochester, MN). Before combining 1.5 T and
3 T data for the PET study, a preliminary analysis of 17 subjects
that had both 1.5 T and 3 T MRI (n = 8 patients, n = 9 controls) was
undertaken. This showed that the mean absolute percentage differ-
ence in cerebral metabolic rate for glucose values across all regions
was 4%, when the two MRI acquisitions were contrasted. There was
no systematic increase or decrease in the metabolic rate values when
co-registration and partial volume correction was changed from the
1.5 T to 3 T scans: the mean raw difference in values was 0.3%.
Nevertheless, an analysis using only 1.5 T data was also performed
to ensure that combining data from different MRI scanners did not
artefactually bias results. For the voxel-based morphometry analysis
described below, only the scans acquired on the same 1.5 T scanner
were used.
Image Analysis FDG-PET
The remaining stages of the image processing and statistical analysis
were performed as previously described (Nestor et al., 2003a) using
MATLAB (The Mathworks, Natick, MA, USA). Briefly, PET scans were
coregistered to each individual’s MRI and then spatially normalized to
the T1-MR template in SPM (based on the standard brain of the
Montreal Neurological Institute.
Calculation of cerebral metabolic ratefor glucose (mmol/min/dl) in regionsof interestRegions of interest were defined on a normalized T1-MRI template
for the three surfaces of the prefrontal cortex bilaterally (medial,
orbital and dorsolateral), together with the temporal poles and superior
parietal cortex (Fig. 1). The location of frontotemporal regions of
interest was based on previous FDG-PET studies in frontotemporal
dementia using statistical parametric mapping that have highlighted
these areas as being severely hypometabolic (Garraux et al., 1999;
Salmon et al., 2003; Diehl et al., 2004; Nestor et al., 2006). The
subjects’ PET scans were coregistered to their MRI and then spatially
normalized to the T1-template in statistical parametric mapping. The
3D region of interest object map was then overlaid, and the cerebral
metabolic rate for glucose calculated for each region of interest
using the autoradiographic method. As the aim of the region of inter-
est study was absolute metabolic rate quantification, a three compart-
ment partial volume correction was applied to each region to correct
for artefactual decline in metabolic rate values due to regional atrophy
(Meltzer et al., 1999). This method uses the spatially normalized grey
matter and white matter segments from the MRI, smoothed to the
resolution of the cerebral metabolic rate for glucose map. Within each
region it is assumed that the metabolic rate for grey and white matter
is homogeneous and the rate for other segments (cerebrospinal fluid,
skull and scalp) is zero. Mean regional metabolic rate values for grey
and white matter are determined from the voxel cerebral metabolic
rate for glucose values within the region plotted as a function of grey
matter/(grey matter + white matter). Within the confines of the
assumptions made, this method corrects for the variable artefactual
hypometabolism due to partial volume error from cerebrospinal fluid
and also determines partial volume corrected grey and white matter
metabolic values. The regional metabolic values quoted from now on
are the volume-weighted mean of the grey and white matter values.
From the 10 regional cerebral metabolic rate for glucose ratings,
two indices were calculated: a mean frontotemporal cerebral metabolic
rate for glucose, which was the average of the eight values from the
Figure 1 Representative axial images through three-dimen-
sional regions of interest (a) orbitofrontal cortex, (b) medial
prefrontal cortex, (c) dorsolateral prefrontal cortex and (d)
parietal cortex; anterior temporal lobe cortex region of interest
not shown.
2568 | Brain 2009: 132; 2566–2578 C. M. Kipps et al.
Dow
nloaded from https://academ
ic.oup.com/brain/article/132/9/2566/353681 by guest on 12 D
ecember 2021
frontal and temporal lobes, and a control parietal region calculated as
the average of the two parietal lobe values.
MRI Scan rating
Subjects with clinically diagnosed behavioural variant frontotemporal
dementia were divided into two groups based on structural imaging
features. MRI scans for both subjects and controls were rated for
frontal and anterior temporal atrophy using a recently validated
visual rating scale (Davies et al., 2006; Kipps et al., 2007a). A single
coronal slice, through the temporal pole immediately anterior to the
slice where the ‘temporal stem’ connects frontal and temporal lobes
is used and the scale ranges from 0 (normal) to 4 (severe atrophy).
In previous work, controls were uniformly rated as 0 or 1, and this was
taken to be the normal range (Kipps et al., 2007a). Ratings between
2 and 4 were regarded as abnormal.
All images for both subjects and controls were anonymized, placed
in random order, and rated three times by the same rater (CK), blind
to any identifying features or clinical history. Intra-rater agreement
was excellent (k= 0.94) for the first two ratings, and discrepancies
were resolved by the use of the third rating where necessary. This is
in keeping with previous work which showed inter-rater agreement
k= 0.62–0.71 and intra-rater k= 0.79–0.83 across a wider cohort of
frontotemporal dementia patients (Kipps et al., 2007a). The subject
group was divided into two: those in whom the MRI scan was
rated in the control range (all regional ratings 0–1; MRI-normal,
n = 9), those in whom the scan was rated abnormal (any regional
rating 2–4; MRI-abnormal, n = 15). In total, five patients from this
study (three MRI-abnormal and two MRI-normal) were part of
an earlier study where MRI, but not PET changes were reported
(Davies et al., 2006).
Clinical dataAt the time of scanning, all participants undertook the Addenbrooke’s
Cognitive Examination (ACE) (Mathuranath et al., 2000) and the
Mini-Mental Status Examination (MMSE) (Folstein et al., 1975);
most patients had these repeated annually from their first presentation.
Additionally, all FTD patients were assessed annually on the Clinical
Dementia Rating score (CDR) (Morris, 1997), and the Cambridge
Behavioural Inventory (CBI), an 81-item caregiver rating of neuropsy-
chiatric symptoms, well validated in dementia (Bozeat et al., 2000)
with good concurrent validity with the NPI (Cummings et al., 1994;
Nagahama et al., 2006).
Statistical AnalysisDemographic and clinical data were analysed with unpaired t-tests or
one-way ANOVA (CBI, CDR—sum of boxes, duration from symptom
onset to PET scanning) or chi-square tests (gender) as appropriate.
Where preliminary analysis suggested that the data were not normally
distributed, non-parametric tests were used (Mann––Whitney U:
MMSE, ACE and CDR).
The imaging data were first analysed in a repeated measures
ANOVA, three group (MRI-normal, MRI-abnormal and Controls) �2
regions (mean frontotemporal and parietal cerebral metabolic rates
for glucose). Main effects and the interaction were modelled with
subsequent planned post hoc univariate ANOVAs comparing groups.
A subsequent series of univariate ANOVAs modelled group differences
across the 10 individual regions of interest in the frontal, temporal and
parietal regions; pre-specified post hoc contrasts were corrected
using the ‘Bonferroni method’.
Voxel-based morphometry analysisTo check that the visual rating of individual MRI scans was not
insensitive to subtle abnormalities that might be evident in averaged
data, a voxel-based morphometry analysis was undertaken. Individual
MRI images (n = 14 MRI-abnormal, n = 8 MRI-normal and n = 8
controls) that had all been performed on the same 1.5 T MRI scanner
were further analysed using the technique of voxel-based morphome-
try in SPM5 (Wellcome Department of Cognitive Neurology, UK). The
pre-processed scans were modulated to allow grey matter volume
inferences and smoothed using an 8 mm FWHM smoothing kernel.
An ANCOVA design matrix was used to test for regions of grey
matter volume contraction between the three groups (MRI-normal,
MRI-abnormal and controls), with total grey matter included as
a covariate in the model. Voxel values in frontal, anterior temporal
and cerebellar vermis regions were extracted from the images using
MarsBaR (Brett et al., 2002) (marsbar.sourceforge.net) and exported
to SPSS (SPSS 14.0, SPSS Inc, Chicago, IL, USA). To assess the validity
of the visual rating scale, the extracted voxel values were correlated
(Spearman’s rho) with the MRI rating scale scores obtained using the
visual rating scale. Regional grey matter volume in the frontal, anterior
temporal and cerebellar regions was then compared between MRI
groups (MRI-normal versus MRI-abnormal).
Results
Demographic dataThere was no significant difference in age between patient and
control groups [F(2,33) = 0.79, P40.05], and importantly, the
duration of illness at final follow-up (both from symptom onset
and from presentation) was similar in the two frontotemporal
dementia subgroups, as was the duration of illness at the time
of PET scanning (all P40.05, see Table 1). All patients had
follow-up data available including post-mortem data in six (see
below) although for one MRI-abnormal patient, ACE was only
available at presentation. There was only one woman in the
MRI-normal group, but the gender ratio was not significantly
different from that of controls or the MRI-abnormal group
(�2 = 3.9, df = 2, P40.05). As none of these potential confounders
were significantly different between the two groups, they were
not included as covariates in subsequent analyses.
Imaging
Mean Regional Metabolic Rate (Frontotemporal versusParietal)
A repeated measures ANOVA showed a main effect of region,
[F(1,33) = 149.6, P50.0001], in that frontotemporal regions had a
significantly lower metabolic rate than parietal regions, but no main
effect of group [F(2,33) = 3.1, P = 0.06] (Fig. 2a). Importantly,
however, there was a region x group interaction [F(2,33) = 10.0,
P50.001]. Planned post hoc univariate ANOVAs showed the
source of this interaction was due to significantly lower frontotem-
poral, but not parietal, hypometabolism in the MRI-abnormal group
compared with controls (mean frontotemporal difference: P50.01)
Frontotemporal dementia: refining the syndrome Brain 2009: 132; 2566–2578 | 2569
Dow
nloaded from https://academ
ic.oup.com/brain/article/132/9/2566/353681 by guest on 12 D
ecember 2021

Figure 2 (A) Comparison of average metabolic rate in frontotemporal and parietal regions. (B) Metabolic rates across regions
MRI-normal, -abnormal and control groups. *Indicates MRI-abnormal group significantly lower cerebral metabolic rate for glucose
(mmol/min/dl) compared with MRI-normal group (P50.05), **indicates significantly lower cerebral metabolic rate for glucose
(mmol/min/dl) in MRI-abnormal group compared with both controls and MRI-normal group (P50.05). R, L (Right, Left) MF = medial
frontal, OFC = orbitofrontal, DL = dorsolateral, TP = temporal pole, Par = Parietal.
Table 1 Demographic characteristics
Clinical FTD(n = 24)
MRI-normal(n = 9)
MRI-abnormal(n = 15)
Controls(n = 12)
Age 59.8 (7.1) 59.9 (9.4) 59.8 (5.9) 58.9 (4.4)
Gender 16M:8F 8M:1F 8M:7F 6M:6F
Duration to final follow-up (years from stated onset) 6.4 (3.1) 6.0 (2.7) 6.6 (3.4) –
Duration to final follow-up (years from presentation) 4.0 (3.2) 4.3 (2.4) 3.8 (3.6) –
Duration at time of PET scan (years from presentation) 1.8 (2.9) 1.7 (1.8) 1.9 (3.5) –
MMSE 26.0 (2.9) 28.1 (1.1)† 24.7 (3.1)†,* 29.7 (0.5)
ACE at scan 74.2 (15.5) 87.2 (5.4)† 66.3 (14.3)†,* 96.3 (2.8)
ACE at presentation 78.5 (15.2) 89.9 (4.5)† 71.7 (15.3)†,* 96.3 (2.8)
ACE at last review 62.7 (27.1) 89.0 (6.7) 47.7 (22.3)†,* 93.8 (4.4)
CDR 0.9 (0.6) 1.1 (0.8) 0.9 (0.5) –
CDR—sum of boxes 5.4 (3.5) 6.3 (4.1) 5.2 (3.1) –
NPI 38.2 (20.7) 47.0 (18.2) 34.3 (21.7) –
CBI 91.0 (38.2) 104.8 (38.6) 86.3 (36.1) –
Values are given as Mean (SD).†Significantly worse than controls (P50.01).
*Significantly worse than MRI-normal group (P50.01).Clinical behavioural variant frontotemporal dementia category represents the combined group, diagnosed without reference to imaging. On NPI and CBI, higher scoresindicate greater endorsement of behavioural disturbance by carers. For NPI, three frontotemporal dementia patients not assessed. Ratings at presentation unlessotherwise stated. Duration measured to last contact or death.
2570 | Brain 2009: 132; 2566–2578 C. M. Kipps et al.
Dow
nloaded from https://academ
ic.oup.com/brain/article/132/9/2566/353681 by guest on 12 D
ecember 2021
and the MRI-normal group (mean frontotemporal difference:
P50.01).
In contrast, there were no significant differences between
controls and MRI-normal subjects in any region (all P40.05).
Correlation analysis showed that there was no relationship
between duration of symptoms at time of PET scanning and
frontotemporal cerebral metabolic rate for glucose values
(Pearson’s r = 0.05) in the clinical frontotemporal dementia
group as a whole.
Regional Metabolic Rates in Regions of Interest
Univariate ANOVAs comparing the metabolic rate between
groups were performed in each of the 10 ROIs (Fig. 2b). There
were significant differences between groups in the medial pre-
frontal, orbitofrontal and temporal polar, but not dorsolateral
prefrontal or parietal regions [medial prefrontal—(R): F(2,33) =
5.3, P50.05; (L): F(2,33) = 6.7, P50.01; orbitofrontal—(R):
F(2,33) = 9.3, P50.01; (L): F(2,33) = 9.3, P50.01; temporal
poles—(R): F(2,33) = 7.6, P50.01; (L): F(2,33) = 17.2, P50.001;
dorsolateral prefrontal—(R): F(2,33) = 0.7, P40.1; (L): F(2,33) =
1.3, P40.1; parietal—(R): F(2,33) = 0.69, P40.1; (L): F(2,33) =
0.6, P40.1]. Planned post hoc contrasts (all Bonferroni corrected)
showed that metabolic rates were not significantly different
between controls and the MRI-normal group in any of the three
frontal or two parietal regions. The MRI-abnormal group, by con-
trast, had significantly reduced metabolism compared to both
controls and the MRI-normal groups in the medial prefrontal,
orbitofrontal and temporal polar cortices (all P50.05), but not
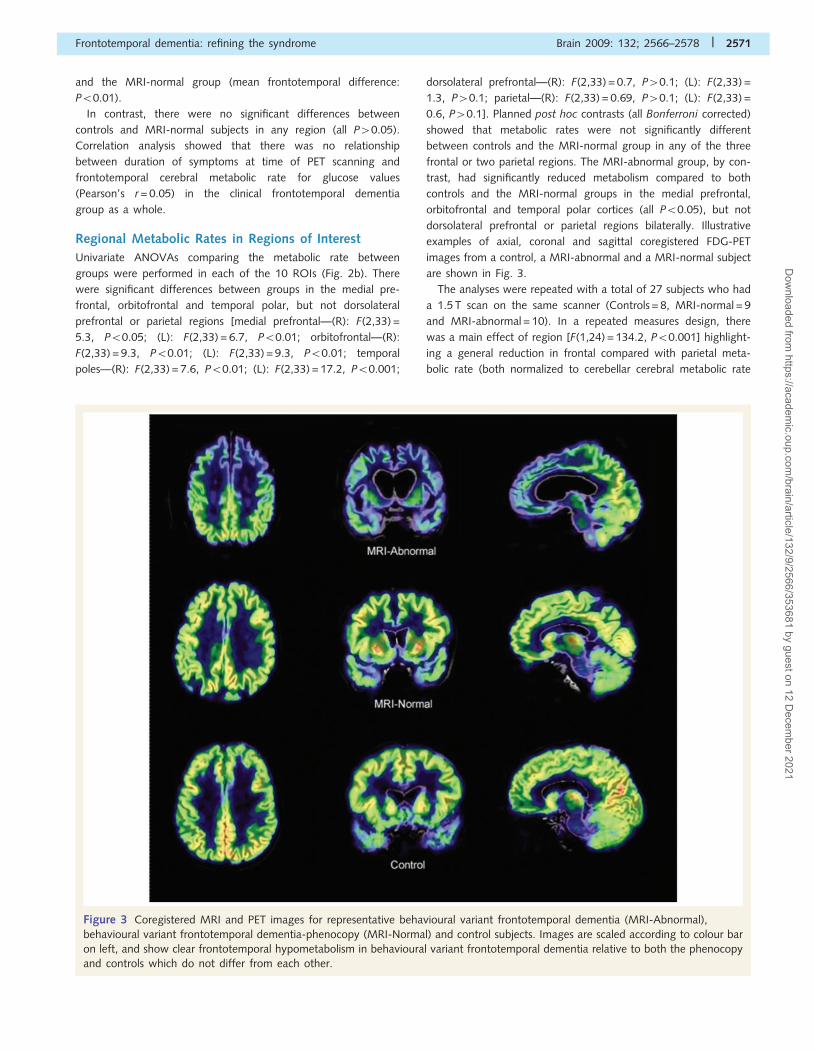
dorsolateral prefrontal or parietal regions bilaterally. Illustrative
examples of axial, coronal and sagittal coregistered FDG-PET
images from a control, a MRI-abnormal and a MRI-normal subject
are shown in Fig. 3.
The analyses were repeated with a total of 27 subjects who had
a 1.5 T scan on the same scanner (Controls = 8, MRI-normal = 9
and MRI-abnormal = 10). In a repeated measures design, there
was a main effect of region [F(1,24) = 134.2, P50.001] highlight-
ing a general reduction in frontal compared with parietal meta-
bolic rate (both normalized to cerebellar cerebral metabolic rate
Figure 3 Coregistered MRI and PET images for representative behavioural variant frontotemporal dementia (MRI-Abnormal),
behavioural variant frontotemporal dementia-phenocopy (MRI-Normal) and control subjects. Images are scaled according to colour bar
on left, and show clear frontotemporal hypometabolism in behavioural variant frontotemporal dementia relative to both the phenocopy
and controls which do not differ from each other.
Frontotemporal dementia: refining the syndrome Brain 2009: 132; 2566–2578 | 2571
Dow
nloaded from https://academ
ic.oup.com/brain/article/132/9/2566/353681 by guest on 12 D
ecember 2021

for glucose). There was also an effect of group [F(1,24) = 5.17,
P50.05]; controls had preserved metabolism as did the
MRI-normal group, however the MRI-abnormal group did not.
Importantly, there was a region�group interaction [F(2,24) =
6.66, P50.01]. Post hoc contrasts and examination of interaction
graphs showed that this was because the behavioural variant
frontotemporal dementia cases with an abnormal MRI had dispro-
portionate impairment of frontotemporal metabolism compared to
both controls (P50.01) and the behavioural variant frontotem-
poral dementia patients with a normal scan (P50.05), confirming
the earlier result with a mixture of 3 T and 1.5 T scans.
Structural image analysis and comparison with VisualRating Scale
There was marked frontotemporal volume loss in the MRI-
abnormal group relative to the MRI-normal subjects (see supple-
mentary information for exact coordinates). In particular, this
involved the medial prefrontal, orbitofrontal and insula regions
but largely spared the dorsolateral prefrontal cortex (Fig. 4).
There was also significant volume loss in the anterior temporal
lobes, but parietal, occipital and cerebellar regions were spared.
Most importantly, however, the frontotemporal dementia subjects
rated as having scans within the normal range on the analogue
scale (MRI-normal, ratings 0–1) had no volume loss relative to
control subjects even at substantially relaxed statistical thresholds.
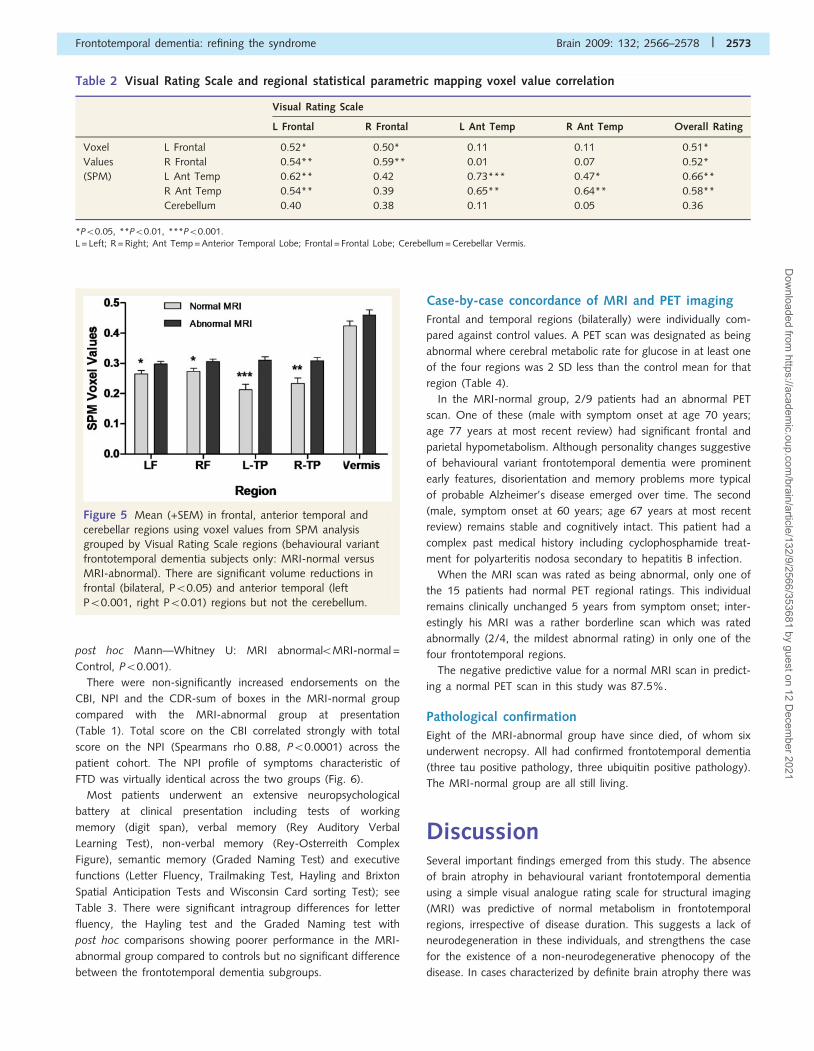
The scores on the visual rating scale were then rank correlated
(Spearman’s rho) with voxel values extracted from the frontal
lobe, anterior temporal region and cerebellar vermis. There was
a strong correlation between both frontal and temporal lobe
scores across the two methods (Table 2). The cerebellum
(vermis), included as a control region did not show a significant
correlation. An ANOVA comparing regional ratings across the
combined overall groups defined by the visual rating scale (MRI-
abnormal versus MRI-normal plus controls) showed significant
reductions in the volume of all frontotemporal regions but not
the cerebellum (Fig. 5).
Clinical and behavioural dataAt the time of presentation, the two patient groups differed
from each other and from controls on the ACE (Kruskal–
Wallis �2 = 21.64, df = 2, P50.001; post hoc Mann––Whitney U:
MRI-abnormal5MRI-normal5Controls, P50.01), but there was
significant overlap of individual ACE scores in the MRI-normal
and MRI-abnormal frontotemporal dementia subgroups (Fig. 6).
At the time of last follow-up, there remained a significant
overall difference between groups, but the MRI-normal group
performed at a level equivalent to controls, and better than the
MRI-abnormal group (Kruskal–Wallis �2 = 22.47, df = 2, P50.001;
Figure 4 Statistical parametric map of grey matter loss in MRI-Abnormal frontotemporal dementia relative to MRI-Normal subjects
(contrast �1 1) rendered on mean image of grey matter segment in controls (a–c at MNI co-ordinates x =�4, y =�2, z =�5), and
surface rendered on single subject brain (d). The image is thresholded at false discovery rate P50.05 (cluster threshold 410). The
colour bar to the right of the image shows the significance thresholds (t-scores). Note the marked frontotemporal grey matter volume
contraction, particularly medial prefrontal, orbital and insula, in the MRI-abnormal behavioural variant frontotemporal dementia patients
relative to the clinically similar MRI-normal cohort. There was relative sparing of the dorsolateral prefrontal cortex and minimal
involvement of parietal areas and the cerebellum. A very similar pattern of atrophy is seen in the MRI-abnormal group relative to
controls (not shown). In contrast, the MRI-normal group had no grey matter volume loss relative to controls even at relaxed statistical
thresholds.
2572 | Brain 2009: 132; 2566–2578 C. M. Kipps et al.
Dow
nloaded from https://academ
ic.oup.com/brain/article/132/9/2566/353681 by guest on 12 D
ecember 2021
post hoc Mann––Whitney U: MRI abnormal5MRI-normal =
Control, P50.001).
There were non-significantly increased endorsements on the
CBI, NPI and the CDR-sum of boxes in the MRI-normal group
compared with the MRI-abnormal group at presentation
(Table 1). Total score on the CBI correlated strongly with total
score on the NPI (Spearmans rho 0.88, P50.0001) across the
patient cohort. The NPI profile of symptoms characteristic of
FTD was virtually identical across the two groups (Fig. 6).
Most patients underwent an extensive neuropsychological
battery at clinical presentation including tests of working
memory (digit span), verbal memory (Rey Auditory Verbal
Learning Test), non-verbal memory (Rey-Osterreith Complex
Figure), semantic memory (Graded Naming Test) and executive
functions (Letter Fluency, Trailmaking Test, Hayling and Brixton
Spatial Anticipation Tests and Wisconsin Card sorting Test); see
Table 3. There were significant intragroup differences for letter
fluency, the Hayling test and the Graded Naming test with
post hoc comparisons showing poorer performance in the MRI-
abnormal group compared to controls but no significant difference
between the frontotemporal dementia subgroups.
Case-by-case concordance of MRI and PET imaging
Frontal and temporal regions (bilaterally) were individually com-
pared against control values. A PET scan was designated as being
abnormal where cerebral metabolic rate for glucose in at least one
of the four regions was 2 SD less than the control mean for that
region (Table 4).
In the MRI-normal group, 2/9 patients had an abnormal PET
scan. One of these (male with symptom onset at age 70 years;
age 77 years at most recent review) had significant frontal and
parietal hypometabolism. Although personality changes suggestive
of behavioural variant frontotemporal dementia were prominent
early features, disorientation and memory problems more typical
of probable Alzheimer’s disease emerged over time. The second
(male, symptom onset at 60 years; age 67 years at most recent
review) remains stable and cognitively intact. This patient had a
complex past medical history including cyclophosphamide treat-
ment for polyarteritis nodosa secondary to hepatitis B infection.
When the MRI scan was rated as being abnormal, only one of
the 15 patients had normal PET regional ratings. This individual
remains clinically unchanged 5 years from symptom onset; inter-
estingly his MRI was a rather borderline scan which was rated
abnormally (2/4, the mildest abnormal rating) in only one of the
four frontotemporal regions.
The negative predictive value for a normal MRI scan in predict-
ing a normal PET scan in this study was 87.5%.
Pathological confirmation
Eight of the MRI-abnormal group have since died, of whom six
underwent necropsy. All had confirmed frontotemporal dementia
(three tau positive pathology, three ubiquitin positive pathology).
The MRI-normal group are all still living.
DiscussionSeveral important findings emerged from this study. The absence
of brain atrophy in behavioural variant frontotemporal dementia
using a simple visual analogue rating scale for structural imaging
(MRI) was predictive of normal metabolism in frontotemporal
regions, irrespective of disease duration. This suggests a lack of
neurodegeneration in these individuals, and strengthens the case
for the existence of a non-neurodegenerative phenocopy of the
disease. In cases characterized by definite brain atrophy there was
Table 2 Visual Rating Scale and regional statistical parametric mapping voxel value correlation
Visual Rating Scale
L Frontal R Frontal L Ant Temp R Ant Temp Overall Rating
Voxel L Frontal �0.52* �0.50* �0.11 0.11 �0.51*
Values R Frontal �0.54** �0.59** 0.01 0.07 �0.52*
(SPM) L Ant Temp �0.62** �0.42 �0.73*** �0.47* �0.66**
R Ant Temp �0.54** �0.39 �0.65** �0.64** �0.58**
Cerebellum �0.40 �0.38 �0.11 0.05 �0.36
*P50.05, **P50.01, ***P50.001.L = Left; R = Right; Ant Temp = Anterior Temporal Lobe; Frontal = Frontal Lobe; Cerebellum = Cerebellar Vermis.
Figure 5 Mean (+SEM) in frontal, anterior temporal and
cerebellar regions using voxel values from SPM analysis
grouped by Visual Rating Scale regions (behavioural variant
frontotemporal dementia subjects only: MRI-normal versus
MRI-abnormal). There are significant volume reductions in
frontal (bilateral, P50.05) and anterior temporal (left
P50.001, right P50.01) regions but not the cerebellum.
Frontotemporal dementia: refining the syndrome Brain 2009: 132; 2566–2578 | 2573
Dow
nloaded from https://academ
ic.oup.com/brain/article/132/9/2566/353681 by guest on 12 D
ecember 2021

regional metabolic and structural heterogeneity, with temporal,
orbitofrontal and medial prefrontal regions most affected; this
may explain key aspects of the clinical presentation, and the
relative lack of ‘consistent’ impairment on commonly used cogni-
tive screening instruments. Patients with structural abnormalities
deteriorated cognitively relative to their imaging-normal counter-
parts, and of these, all who have died have been shown to have
pathology consistent with frontotemporal lobe degeneration.
We were also able to validate a semi-quantitative visual rating
scale of atrophy against an automated method (voxel-based mor-
phometry) and to confirm concordance between structural and
metabolic changes.
We were careful to quantify the metabolic rate in several brain
regions believed to be critical for the genesis of the behavioural
syndrome and in particular where previous studies suggest the
earliest pathology is to be found in behavioural variant frontotem-
poral dementia (Kril et al., 2005). Yet, despite this, the group with-
out MRI changes had normal metabolic rates in frontotemporal
regions. The duration of illness was similar in the two subgroups,
which argues strongly against the suggestion that imaging-normal
behavioural variant frontotemporal dementia patients are simply
at an earlier stage of disease, when atrophy is insufficiently estab-
lished. This is supported by the absence of a significant correlation
between symptom duration at the time of PET scanning, and
frontotemporal cerebral metabolic rate for glucose values in the
clinical frontotemporal dementia group as a whole.
FDG-PET is regarded as a highly sensitive marker of neuronal
dysfunction (Minoshima et al., 1997; Masdeu et al., 2005), and
many studies, including those with presymptomatic individuals
with neurodegenerative disease describe metabolic deficits using
this imaging modality (Nestor et al., 2004; Eckert et al., 2005;
Inagaki et al., 2005; Ciarmiello et al., 2006; Cortelli et al., 2006).
The absence of hypometabolism in our cases suggests that at least
some of these patients may not have a neurodegenerative
syndrome. Whilst it could be argued that the visual rating scale
we used is insensitive to subtle pathology, there was good correla-
tion between regional ratings on this scale and regional voxel values
extracted from the SPM analysis. Furthermore, there was no
Figure 6 Cognitive and behavioural profiles and relationship to metabolic rate. Cognitive (A–C): (A) Individual patient and scores
(controls—squares, MRI-normal bvftd subgroup—triangles, MRI-abnormal subgroup—circles, horizontal line represents median for
groups) on ACE from time of presentation (open symbols) to last available follow-up (closed symbols); (B) Relationship of ACE score
to frontotemporal metabolic rate across groups normalized to individual cerebellar values (nCMRglc). (C) Relationship of change in
ACE score to frontotemporal metabolism across groups. Mean frontotemporal metabolic rate indicated by dashed line; Behavioural
(D–F): (D) Individual scores on CBI and NPI for behavioural variant frontotemporal dementia subgroups (circles: MRI-abnormal;
triangles: MRI-normal group). Median scores indicated by horizontal line for each subgroup; (E) Relationship of NPI score to
frontotemporal metabolic rate across subgroups; (F) Profile of NPI domain subscores for MRI-abnormal (shaded) and MRI-normal
groups (stippled).
2574 | Brain 2009: 132; 2566–2578 C. M. Kipps et al.
Dow
nloaded from https://academ
ic.oup.com/brain/article/132/9/2566/353681 by guest on 12 D
ecember 2021

volume loss seen in the frontotemporal dementia MRI-normal
group relative to controls even at very relaxed statistical thresholds.
The marked frontotemporal atrophy in the MRI-abnormal group
relative to both controls and the frontotemporal dementia patients
with a normal MRI provides strong support for the validity of
the scale.
Cognitive function was not entirely normal in our imaging-
normal behavioural variant frontotemporal dementia group.
Their mean score on the ACE fell midway between the scores
for maximum sensitivity (82) and specificity (88) for neuro-
degenerative disease (Mathuranath et al., 2000), even though
group performance was not significantly worse than controls at
their last review. Importantly, all bar one remained stable over
time from a cognitive perspective. Interestingly, the only decliner
had significant frontal and parietal hypometabolism on PET and
has developed a cognitive syndrome typical of clinical Alzheimer’s
disease. As a group, behavioural variant frontotemporal dementia
patients with an abnormal MRI performed worse than both
other groups on the ACE, but almost a third had ACE scores
that overlapped with the range of the imaging-normal group.
This finding has recently been reported in detail elsewhere
(Kipps et al., 2008). Their neuropsychological test profiles were
Table 3 Neuropsychology test profile of FTD subgroups and controls
Test MRI-abnormal MRI-Normal Control Post hoc
n Mean (SD) n Mean (SD) n Mean (SD)
Digit span
Forwards 14 6.4 (1.0) 7 6.3 (1.4) – – NS
Backwards 14 4.2 (1.4) 7 4.4 (1.4) – – NS
RAVLT
A6 9 6.8 (2.9) 9 6.3 (2.6) 10 9.5 (3.2) NS
A30 10 5.5 (4.4) 9 5.4 (3.6) 10 10.2 (3.1) MRI-n = MRI-abn5Co, P50.05
Recognition 10 12.2 (2.7) 9 12.1 (2.8) 10 14.1 (1.1) NS
Rey-CF
Copy 18 32.9 (5.1) 9 33.9 (2.1) 10 34.2 (2.3) NS
Delayed 15 12.7 (8.0) 7 13.4 (6.7) 9 16.9 (4.0) NS
GNT
Words 15 12.9 (9.6) 9 20.8 (5.3) 10 22.6 (4.9) MRI-abn 5Co, P = 0.01
Letter fluency
FAS 14 22.6 (17.0) 7 32.4 (13.9) 10 38.2 (12.8) MRI-abn 5Co, P = 0.06
Trails
A 9 61.2 (33.8) 7 51.6 (17.3) 10 38.0 (8.3) NS
B 8 159.0 (145.6) 8 112.9 (37.2) 10 90.0 (28.4) NS
Hayling
Scaled score 12 2.2 (1.9) 6 4.2 (1.9) 10 5.3 (1.3) MRI-abn 5Co, P50.001;MRI-n = MRI-abn; MRI-n = Co
Brixton
Scaled score 8 5.6 (2.0) 9 4.7 (2.6) 10 5.7 (1.2) NS
WCST
Categories 12 4.6 (2.2) 8 4.1 (1.9) – – NS
RAVLT = Rey Auditory Verbal Learning Test; A6 = Word List Recall after interference list presented; A7 = Delayed Word List Recall at 30 min; GNT = Graded Naming Test;FAS = combined score for verbal letter fluency using letters f, a, s; Trails A and B = Trailmaking Test Parts A and B; WCST = Wisconsin Cardsorting Test; MRI-N = frontotemporal dementia subgroup with normal imaging; MRI-Abn = frontotemporal dementia subgroup with abnormal imaging; Co = controls; NS = no significantdifference between groups; n = number of subjects performing test.
Table 4 MRI and PET concordance
Normal PET Abnormal PET Total
Progressors Non-progressors Progressors Non-progressors
Normal MRI – 7 1 1 9
Abnormal MRI – 1 14 – 15
MRI was rated as abnormal if any of four frontotemporal regions (L, R—anterior temporal, frontal) was rated as two or above onthe visual rating scale. A PET scan was designated as being abnormal when cerebral metabolic rate for glucose in at least one of thefour regions was 2 SD less than the control mean for that region Progressors = patients who had clinical progression after presentation;Non-progressors = patients who appeared clinically stable after presentation despite a clear indication from carers that there had been adistinct change and deterioration in previous functioning from time of symptom onset to presentation. See text for details of cases where
MRI and PET were discordant.
Frontotemporal dementia: refining the syndrome Brain 2009: 132; 2566–2578 | 2575
Dow
nloaded from https://academ
ic.oup.com/brain/article/132/9/2566/353681 by guest on 12 D
ecember 2021
very similar at clinical presentation, but the MRI-abnormal group
showed clear deterioration over time. For both frontotemporal
dementia groups, behavioural scores remained abnormal, and
indistinguishable, throughout the period of clinical observation.
These findings pose a challenging problem for clinical diagnosis.
It was recently reported that two patients with ubiquitin-positive
pathological changes at post-mortem had minimal atrophy, but
these patients progressed to death over 4 and 11 years respec-
tively, unlike our patients (Josephs et al., 2006). In the absence of
pathology, we are unable to absolutely exclude a degenerative
process but this seems unlikely in view of the lack of progression
in such cases sometimes over a decade of follow-up. In support of
this supposition, Kertesz et al., 2005 reported a patient, within a
larger series with florid behavioural changes who died prematurely
and despite extensive neuropathological examination, no evidence
of a neurodegenerative disease was found. In addition, a patient
diagnosed strictly in accordance with frontotemporal dementia cri-
teria, but excluded from a longitudinal cohort imaged serially using
FDG-PET, was found to have no pathology at post-mortem when
he later died unexpectedly (Diehl-Schmid et al., 2007).
If these patients do not have neurodegeneration, what
alternative explanations are tenable? One possibility is that is we
have identified a group of patients with marked age-related
personality change. It remains controversial, however, as to
whether personality traits vary between early adulthood and old-
age (Ravenna et al., 2002; Jones et al., 2003; Terracciano et al.,
2006). In general, measures of adherence to social norms (self-
control, the desire to create a good impression, reduced flexibility)
show increases over time, in contrast to social vitality or extraver-
sion (social presence, empathy and self-acceptance), which has a
tendency to decline. Several longitudinal studies suggest that these
long-term group trends may mask significant individual variability
(Ravenna et al., 2002; Jones et al., 2003). The changes in our
patients are maladaptive, and indistinguishable from patients with
evidence of neurodegeneration. While it remains possible that the
behavioural changes we describe here are simply one extreme
of normal age-related personality evolution, this seems unlikely.
A number of psychiatric syndromes also warrant consideration.
Late onset schizophrenia, or paraphrenia, has a female predomi-
nance (unlike our cohort), with hallucinations and persecutory
delusions manifesting more commonly, and a lower propensity
to formal thought disorder or emotional blunting than in earlier
onset schizophrenic presentations (Howard et al., 2000; Sato
et al., 2004). Our patients do not, therefore, conform to current
concepts of paraphrenia. Hallucinations or delusions suggestive of
a psychotic disorder were absent. Depressive symptoms were
excluded by formal psychiatric interview in these patients, and
were not felt to be an adequate explanation for their symptoms.
Several patients had behaviours reminiscent of mania but the
clinical features were never sufficient for formal psychiatric
diagnosis. Moreover it did not appear to be cyclical and occurred
in the absence of a history of long-term mood disorders. There are
occasional references in the psychiatric literature to ‘chronic mania’
(Malhi et al., 2001; Mendhekar et al., 2004); seen more com-
monly in the pre-antipsychotic era (Kraeppelin, 1921), this entity
remains indistinct in current practice. A form fruste of low-grade
chronic late-onset mania cannot be entirely discounted as a diag-
nosis in at least some of the patients with normal brain imaging.
Finally, the clinical features of frontotemporal dementia are
remarkably similar to many of those seen in the autism-spectrum
disorders (ICD-10, 1992; DSM-IV-TR, 2000). Yet, the absence of
these features during earlier life, and the insistence by carers that
these patients have undergone a distinct change in personality,
make such an account implausible. To our knowledge there is
no literature that describes the emergence of autism-spectrum
disorders in middle age. It is also possible that rather minor
personality changes have been exaggerated by some caregivers
having received a possible diagnosis of frontotemporal dementia
early in their course. Since insight is frequently impaired in
behavioural variant frontotemporal dementia, a reliable informant
is crucial for the diagnosis. Several studies attest to the depend-
ability of spousal or close relative assessment (Siegler et al., 1994;
Strauss and Pasupathi, 1994). Whilst this may not always be an
entirely safe assumption, it is difficult, in practice, to know exactly
what level of corroboration is sufficient for diagnosis. Most of our
cohort was reviewed on a regular basis for several years, and
spousal reports of their behaviour remained consistent.
Importantly all carers insisted that the behavioural changes
represented a distinct change from previous functioning.
Our MRI-abnormal group demonstrated disproportionate
hypometabolism of the orbitofrontal and medial prefrontal
cortices, with involvement of the temporal poles; a similar finding
was seen in the statistical parametric mapping analysis of structural
images. A number of studies have reported on the metabolic
impairments of frontotemporal regions (Salmon et al., 2003;
Diehl et al., 2004; Grimmer et al., 2004; McMurtray et al.,
2006; Peters et al., 2006; Salmon et al., 2006), but none have
quantified the metabolic rate using simultaneous arterial sampling,
and few studies have studied differences in regional metabolism
within the frontal lobes (Jeong et al., 2005) in behavioural variant
frontotemporal dementia. These findings provide additional
evidence on the spread of pathology through the brain, and are
concordant with previously reported pathological series (Kril and
Halliday, 2004; Kril et al., 2005). Although there was marked
heterogeneity across subjects, no individual in the MRI-abnormal
group showed more hypometabolism of dorsolateral prefrontal
cortex than either the orbitofrontal or medial prefrontal region.
Similarly, the structural analysis showed relative sparing of the
dorsolateral prefrontal cortex. The results may also help explain
the relative insensitivity in behavioural variant frontotemporal
dementia of neuropsychological test batteries which access exec-
utive function performance, that are thought to preferentially
engage dorsolateral prefrontal region (Alvarez and Emory, 2006).
The most significant limitation in the present study is the lack
of neuropathology in the MRI-normal group. These patients,
overwhelmingly men in their 50s and 60s, are likely to live for a
considerable time unless they develop other inter-current illnesses.
The development of neurotransmitter or pathology-specific
ligands may shed light on the pathogenesis but longitudinal
follow-up to autopsy is clearly vital. The ratio of progressors
to non-progressors should not be taken to reflect their relative
prevalence in the community. Those without MRI-abnormalities
remain stable and in some cohorts may continue to attend
2576 | Brain 2009: 132; 2566–2578 C. M. Kipps et al.
Dow
nloaded from https://academ
ic.oup.com/brain/article/132/9/2566/353681 by guest on 12 D
ecember 2021

research-based clinics, whilst those with progressive disease
typically develop features of generalized dementia within a few
years and discontinue their involvement.
There are several important clinical implications of these
findings. The negative predictive value of a normal MRI scan for
behavioural variant frontotemporal dementia diagnosis in this
study is high (87.5%), assuming that a normal PET scan predicts
a lack of neurodegeneration. Thus it may be prudent to withhold
diagnosis in patients with ‘apparent behavioural variant fronto-
temporal dementia’ in whom there is normal imaging and no
apparent change on longitudinal follow-up. It also mandates
very careful clinical review and possibly additional corroboration
in such cases. Such patients are liable to significantly dilute the
power of trials of potential disease-modifying drugs in frontotem-
poral dementia in view of their lack of progression, and it would
be wise to exclude them until more is known about their ultimate
diagnosis (Kipps et al., 2008). These observations also raise
important questions about the current consensus criteria for fron-
totemporal dementia in general, and advocate a more prominent
role for imaging findings in clinical diagnosis. The results suggest
that the addition of imaging criteria (i.e. frontotemporal abnormal-
ity on either structural or functional imaging) for diagnosis of
frontotemporal dementia may improve specificity, particularly in
those with behavioural symptoms who constitute the largest
proportion of frontotemporal dementia cases; this is important in
early diagnosis where cognitive performance may still be normal in
this group. In contrast, those with normal imaging represent a
diagnostic conundrum at present. Clearly more work, including
most importantly, pathological analysis, is necessary.
FundingWellcome Trust (Grant No. 073580 to C.M.K.); MRC-UK
(to P.J.N.); Australian Research Council Federation Fellowship
(FF 0776229 to to J.R.H.).
ReferencesAlvarez JA, Emory E. Executive function and the frontal lobes: a
meta-analytic review. Neuropsychol Rev 2006; 16: 17–42.Bozeat S, Gregory CA, Lambon Ralph MA, Hodges JR. Which neurop-
sychiatric and behavioural features distinguish frontal and temporal
variants of frontotemporal dementia from Alzheimer’s disease?
J Neurol Neurosurg Psychiatry 2000; 69: 178–86.Brett M, Anton J, Valabregue R, Poline J. Region of interest analysis
using an SPM toolbox (abstract). Neuroimage 2002; 16: 2.
Broe M, Hodges JR, Schofield E, Shepherd CE, Kril JJ, Halliday GM.
Staging disease severity in pathologically confirmed cases of
frontotemporal dementia. Neurology 2003; 60: 1005–11.Brun A, Englund B, Gustafson L, Passant U, Mann D, Neary D, et al.
Clinical and neuropathological criteria for frontotemporal dementia.
The Lund and Manchester Groups. J Neurol Neurosurg Psychiatry
1994; 57: 416–8.Ciarmiello A, Cannella M, Lastoria S, Simonelli M, Frati L,
Rubinsztein DC, et al. Brain white-matter volume loss and glucose
hypometabolism precede the clinical symptoms of Huntington’s
disease. J Nucl Med 2006; 47: 215–22.
Cortelli P, Perani D, Montagna P, Gallassi R, Tinuper P, Federica P, et al.
Pre-symptomatic diagnosis in fatal familial insomnia: serial neuro-
physiological and 18FDG-PET studies. Brain 2006; 129: 668–75.
Cummings JL, Mega M, Gray K, Rosenberg-Thompson S, Carusi DA,
Gornbein J. The Neuropsychiatric Inventory: comprehensive
assessment of psychopathology in dementia. Neurology 1994; 44:
2308–14.Davies RR, Kipps CM, Mitchell J, Kril JJ, Halliday GM, Hodges JR.
Progression in frontotemporal dementia: identifying a benign
behavioral variant by magnetic resonance imaging. Arch Neurol
2006; 63: 1627–31.
Diehl J, Grimmer T, Drzezga A, Riemenschneider M, Forstl H, Kurz A.
Cerebral metabolic patterns at early stages of frontotemporal dementia
and semantic dementia. A PET study. Neurobiol Aging 2004; 25:
1051–6.
Diehl-Schmid J, Grimmer T, Drzezga A, Bornschein S,
Riemenschneider M, Forstl H, et al. Decline of cerebral glucose
metabolism in frontotemporal dementia: a longitudinal 18F-FDG-
PET-study. Neurobiol Aging 2007; 28: 42–50.
DSM-IV-TR. Diagnostic and statistical manual of mental disorders.
4th edn., Washington, DC: American Psychiatric Association; 2000.Eckert T, Barnes A, Dhawan V, Frucht S, Gordon MF, Feigin AS, et al.
FDG PET in the differential diagnosis of parkinsonian disorders.
Neuroimage 2005; 26: 912–21.
Folstein MF, Folstein SE, McHugh PR. ‘‘Mini-mental state’’. A practical
method for grading the cognitive state of patients for the clinician.
J Psychiatr Res 1975; 12: 189–98.
Foster NL, Heidebrink JL, Clark CM, Jagust WJ, Arnold SE, Barbas NR,
et al. FDG-PET improves accuracy in distinguishing frontotemporal
dementia and Alzheimer’s disease. Brain 2007; 130: 2616–35.
Garraux G, Salmon E, Degueldre C, Lemaire C, Laureys S, Franck G.
Comparison of impaired subcortico-frontal metabolic networks
in normal aging, subcortico-frontal dementia, and cortical frontal
dementia. Neuroimage 1999; 10: 149–62.Grimmer T, Diehl J, Drzezga A, Forstl H, Kurz A. Region-specific decline
of cerebral glucose metabolism in patients with frontotemporal
dementia: a prospective 18F-FDG-PET study. Dement Geriatr Cogn
Disord 2004; 18: 32–6.
Hodges JR, Davies R, Xuereb J, Kril J, Halliday G. Survival in fronto-
temporal dementia. Neurology 2003; 61: 349–54.
Howard R, Rabins PV, Seeman MV, Jeste DV. Late-onset schizophrenia
and very-late-onset schizophrenia-like psychosis: an international
consensus. The International Late-Onset Schizophrenia Group. Am J
Psychiatry 2000; 157: 172–8.
ICD-10. International classification of diseases and related health
problems (ICD-10). 10th edn., Geneva: World Health Organisation;
1992.Inagaki A, Iida A, Matsubara M, Inagaki H. Positron emission tomogra-
phy and magnetic resonance imaging in spinocerebellar ataxia type 2:
a study of symptomatic and asymptomatic individuals. Eur J Neurol
2005; 12: 725–8.
Jeong Y, Cho SS, Park JM, Kang SJ, Lee JS, Kang E, et al. 18F-FDG PET
findings in frontotemporal dementia: an SPM analysis of 29 patients.
J Nucl Med 2005; 46: 233–9.
Jones CJ, Livson N, Peskin H. Longitudinal hierarchical linear
modeling analyses of California Psychological Inventory data from
age 33 to 75: an examination of stability and change in adult
personality. J Pers Assess 2003; 80: 294–308.Josephs KA, Whitwell JL, Jack CR, Parisi JE, Dickson DW. Frontotemporal
lobar degeneration without lobar atrophy. Arch Neurol 2006; 63:
1632–8.
Kertesz A, McMonagle P, Blair M, Davidson W, Munoz DG. The
evolution and pathology of frontotemporal dementia. Brain 2005;
128: 1996–2005.
Kinahan PE Rogers JG. Analytic 3D image reconstruction using all
detected events. IEEE Trans Nucl Sci 1989; 36: 964–8.
Kipps CM, Davies RR, Mitchell J, Kril JJ, Halliday GM, Hodges JR. Clinical
significance of lobar atrophy in frontotemporal dementia: application
Frontotemporal dementia: refining the syndrome Brain 2009: 132; 2566–2578 | 2577
Dow
nloaded from https://academ
ic.oup.com/brain/article/132/9/2566/353681 by guest on 12 D
ecember 2021

of an MRI visual rating scale. Dement Geriatr Cogn Disord 2007a; 23:334–42.
Kipps CM, Nestor PJ, Dawson CE, Mitchell J, Hodges JR. Measuring
progression in frontotemporal dementia: implications for therapeutic
interventions. Neurology 2008; 70: 2046–52.Kipps CM, Nestor PJ, Fryer TD, Hodges JR. Behavioural variant
frontotemporal dementia: not all it seems? Neurocase 2007b; 13:
237–47.
Knopman DS, Boeve BF, Parisi JE, Dickson DW, Smith GE, Ivnik RJ, et al.Antemortem diagnosis of frontotemporal lobar degeneration. Ann
Neurol 2005; 57: 480–8.
Kraeppelin E. Manic-depressive insanity and paranoia. Edinburgh: E. & S.Livingstone; 1921.
Kril JJ, Halliday GM. Clinicopathological staging of frontotemporal
dementia severity: correlation with regional atrophy. Dement Geriatr
Cogn Disord 2004; 17: 311–5.Kril JJ, Macdonald V, Patel S, Png F, Halliday GM. Distribution of brain
atrophy in behavioral variant frontotemporal dementia. J Neurol Sci
2005; 232: 83–90.
Malhi GS, Mitchell PB, Parker GB. Rediscovering chronic mania. ActaPsychiatr Scand 2001; 104: 153–6.
Masdeu JC, Zubieta JL, Arbizu J. Neuroimaging as a marker of the onset
and progression of Alzheimer’s disease. J Neurol Sci 2005; 236: 55–64.
Mathuranath PS, Nestor PJ, Berrios GE, Rakowicz W, Hodges JR. A briefcognitive test battery to differentiate Alzheimer’s disease and
frontotemporal dementia. Neurology 2000; 55: 1613–20.
McKhann GM, Albert MS, Grossman M, Miller B, Dickson D,Trojanowski JQ. Clinical and pathological diagnosis of frontotemporal
dementia: report of the Work Group on Frontotemporal Dementia and
Pick’s Disease. Arch Neurol 2001; 58: 1803–9.
McMurtray AM, Chen AK, Shapira JS, Chow TW, Mishkin F, Miller BL,et al. Variations in regional SPECT hypoperfusion and clinical features
in frontotemporal dementia. Neurology 2006; 66: 517–22.
McNeill R, Sare GM, Manoharan M, Testa HJ, Mann DM, Neary D, et al.
Accuracy of single-photon emission computed tomography indifferentiating frontotemporal dementia from Alzheimer’s disease.
J Neurol Neurosurg Psychiatry 2007; 78: 350–5.
Meltzer CC, Kinahan PE, Greer PJ, Nichols TE, Comtat C, Cantwell MN,et al. Comparative evaluation of MR-based partial-volume
correction schemes for PET. J Nucl Med 1999; 40: 2053–65.
Mendhekar DN, Srivastav PK, Jiloha RC, Awana S. Chronic but not
resistant mania: a case report. Acta Psychiatr Scand 2004; 109: 147–9.Minoshima S, Giordani B, Berent S, Frey KA, Foster NL, Kuhl DE.
Metabolic reduction in the posterior cingulate cortex in very early
Alzheimer’s disease. Ann Neurol 1997; 42: 85–94.
Morris JC. Clinical dementia rating: a reliable and valid diagnostic andstaging measure for dementia of the Alzheimer type. Int Psychogeriatr
1997; 9 (Suppl 1): 173–6.
Nagahama Y, Okina T, Suzuki N, Matsuda M. The Cambridge BehavioralInventory: validation and application in a memory clinic. J Geriatr
Psychiatry Neurol 2006; 19: 220–5.
Neary D, Snowden JS, Gustafson L, Passant U, Stuss D, Black S, et al.
Frontotemporal lobar degeneration: a consensus on clinical diagnosticcriteria. Neurology 1998; 51: 1546–54.
Nestor PJ, Caine D, Fryer TD, Clarke J, Hodges JR. The topography of
metabolic deficits in posterior cortical atrophy (the visual variant of
Alzheimer’s disease) with FDG-PET. J Neurol Neurosurg Psychiatry2003a; 74: 1521–9.
Nestor PJ, Fryer TD, Hodges JR. Declarative memory impairments in
Alzheimer’s disease and semantic dementia. Neuroimage 2006; 30:1010–20.
Nestor PJ, Fryer TD, Smielewski P, Hodges JR. Limbic hypometabolism in
Alzheimer’s disease and mild cognitive impairment. Ann Neurol 2003b;
54: 343–51.Nestor PJ, Scheltens P, Hodges JR. Advances in the early detection of
Alzheimer’s disease. Nat Med 2004; 10 (Suppl): S34–41.
Peters F, Perani D, Herholz K, Holthoff V, Beuthien-Baumann B, Sorbi S,
et al. Orbitofrontal dysfunction related to both apathy anddisinhibition in frontotemporal dementia. Dement Geriatr Cogn
Disord 2006; 21: 373–9.
Phelps ME, Huang SC, Hoffman EJ, Selin C, Sokoloff L, Kuhl DE.
Tomographic measurement of local cerebral glucose metabolic ratein humans with (F-18)2-fluoro-2-deoxy-D-glucose: validation of
method. Ann Neurol 1979; 6: 371–88.
Ravenna H, Jones C, Kwan VS. Personality change over 40 years ofadulthood: hierarchical linear modeling analyses of two longitudinal
samples. J Pers Soc Psychol 2002; 83: 752–66.
Salmon E, Garraux G, Delbeuck X, Collette F, Kalbe E, Zuendorf G, et al.
Predominant ventromedial frontopolar metabolic impairment infrontotemporal dementia. Neuroimage 2003; 20: 435–40.
Salmon E, Kerrouche N, Herholz K, Perani D, Holthoff V, Beuthien-
Baumann B, et al. Decomposition of metabolic brain clusters in the
frontal variant of frontotemporal dementia. Neuroimage 2006; 30:871–8.
Sato T, Bottlender R, Schroter A, Moller HJ. Psychopathology of early-
onset versus late-onset schizophrenia revisited: an observation of 473neuroleptic-naive patients before and after first-admission treatments.
Schizophr Res 2004; 67: 175–83.
Siegler IC, Dawson DV, Welsh KA. Caregiver ratings of personality
change in Alzheimer’s disease patients: a replication. Psychol Aging1994; 9: 464–6.
Strauss ME Pasupathi M. Primary caregivers’ descriptions of Alzheimer
patients’ personality traits: temporal stability and sensitivity to change.
Alzheimer Dis Assoc Disord 1994; 8: 166–76.Terracciano A, Costa PT Jr, McCrae RR. Personality plasticity after age
30. Pers Soc Psychol Bull 2006; 32: 999–1009.
2578 | Brain 2009: 132; 2566–2578 C. M. Kipps et al.
Dow
nloaded from https://academ
ic.oup.com/brain/article/132/9/2566/353681 by guest on 12 D
ecember 2021