Embed Size (px)
Citation preview

Combined Group Management Report
Konzern_Trennseiten.indd 15 05.03.15 10:28

22 Group Management Report Structure and Management of the Group
Group Legal Structure
Sartorius is a globally operating company with subsidiaries in more than 30 countries. The holding company Sartorius AG is the parent corporation of the Sartorius Group. The corporation is headquartered in Göttingen, Germany, and is listed on the German Stock Exchange.
Sartorius manages its bioprocess business as a legally independent subgroup whose parent corporation is Sartorius Stedim Biotech S.A., which is listed on Euronext Paris. As of December 31, 2017, Sartorius AG held around 74% of the shares of Sartorius Stedim Biotech S.A. The Group’s lab business is legally com-bined in a further subgroup whose parent company is Sartorius Lab Holding GmbH, in which Sartorius AG holds a 100% stake.
The consolidated financial statements include Sartorius AG and all major affiliates in which Sartorius AG has a controlling interest pursuant to IFRS 10.
Organization and Management of the Group
The Sartorius Group conducts its operating business in two divisions: Bioprocess Solutions and Lab Products & Services. The divisions each combine their respective businesses for the same fields of application and user groups, and share part of the infrastructure and cen-tral services.
The Group’s central management entity is the Sartorius Group Executive Committee (GEC), which currently has six members. These are the Executive Board members of Sartorius AG and further senior managers with global responsibility.
The Sartorius Group is largely organized by function worldwide. Accordingly, the respective managerial responsibilities for the individual functions at the top management levels are performed across all sites and regions. Implementing the Group’s various strategies and projects at the local level is the responsibility of the national affiliates. The management bodies of the local companies run their organizations in accordance with the applicable statutory provisions, articles of association and rules of procedure and in keeping with the principles of corporate governance that apply throughout the Sartorius Group worldwide.
Structure and Management of the Group
Sartorius Stedim Biotech S.A. Sartorius Lab Holding GmbH
Service and infrastructure companies
Sartorius Stedim Biotech subgroup Laboratory subgroup
Sales and manufacturing companies
Sales and manufacturing companies
~ 74% 100%
Sartorius AG
100%
Group Management Report Structure and Management of the Group 23
Changes in the Group Portfolio
In the reporting year, Sartorius acquired three companies.
The portfolio of the Lab Products & Services Division was expanded in the area of bioanalytics in March 2017 by the acquisition of Essen BioScience Inc. Head-quartered in Ann Arbor, Michigan, USA, this company develops and markets innovative real-time live-cell imaging and analysis systems for drug research.
Sartorius through its subgroup Sartorius Stedim Bio-tech additionally acquired MKS Instruments AB (Umet-rics) based in Umeå, Sweden. This company, a leading specialist in data analytics software for modeling and optimizing biopharmaceutical development and manu-facturing processes, had already been cooperating with Sartorius for around five years before the take-over. Umetrics was initially consolidated upon comple-tion of the acquisition in April 2017.
Financial Controlling and Key Performance Indicators
The Sartorius Group is managed using a number of key performance indicators, which are also decisive for the determination of the variable remuneration compo-nent for the Executive Board and managers.
A key management parameter that Sartorius uses to measure the development of its size is currency-adjusted growth of sales revenue. The key profitability measure is EBITDA adjusted for extraordinary items, i.e. underlying EBITDA, and the corresponding margin.
Regarding the debt financing potential of the Sartorius Group, the key indicator is the ratio of net debt to underlying EBITDA for the last twelve months. Furthermore, the capex ratio, i.e., capital expenditures in proportion to sales revenue, represents a key control parameter.
In addition, the following financial and non-financial indicators are reported on a regular basis:
– Order intake – Relevant net profit | Earnings per share – Annual net profit | Earnings per share – Equity ratio – Net working capital – Net cash flow from operating activities – Number of employees
As a rule, the annual financial forecast that is pub-lished at the beginning of a fiscal year for the Group and the divisions refers to the development of sales revenue and of the underlying EBITDA margin. The expected capex ratio, as well as a directional forecast for the ratio of net debt to underlying EBITDA, is addi-tionally indicated for the Group.

24 Group Management Report Strategy and Goals
The Sartorius Group is a leading international supplier of products and services covering a range from re-search and development to safe and efficient produc-tion of medications and vaccines using biotech methods.
Sartorius is increasingly focusing on the attractive biopharma market that is characterized by long-term and stable trends. For years, the global pharmaceutical market has been showing positive development pri-marily driven by the so-called pharmerging markets such as China, India and Russia in which access to medications was fueled by the expansion of national healthcare as well as higher private-sector spending. Additional significant trends are the demographic development in the Western industrialized countries and increasing life expectancy, which entail a greater need for medications.
The market for biotechnologically produced medica-tions and vaccines has been expanding overpropor-tionately for many years within the growing pharmaceutical market as a result of the introduction of new biopharmaceuticals and their further market penetration, among others. Biosimilars, or biological medications highly similar to already approved refer-ence medicines, are considered factors for continued positive development in the future.
As part of its strategy as a total solutions provider, Sartorius has built up a broad and innovative portfolio of products and technologies across the entire value-added chain of its biopharmaceutical customers, both through the company's proprietary research and ac-quisitions. With this range, Sartorius aims to make complex, lengthy and expensive development of bio-pharmaceuticals and their production more efficient and less expensive for its customers. Moreover, Sartorius addresses the needs of laboratories of public research, defined as "academia."
The Sartorius Group conducts its operating business in two divisions: Bioprocess Solutions and Lab Products & Services. The divisions' market positioning and strategy are outlined as follows:
Strategy and Goals

Group Management Report Strategy and Goals 25
Bioprocess Solutions
In the Bioprocess Solutions Division, Sartorius offers its customers innovative and efficient technologies and products extending from the development of cell lines and processes to manufacturing. These essentially cover cell culture media, cell line technologies, biore-actors, a wide range of products for separation, purifi-cation and concentration, as well as solutions for storage and transportation of intermediate and final biological products.
The division generates around three-quarters of its sales revenue with single-use products. Due to their cost advantages and higher flexibility compared with reusable technologies, such single-use products are increasingly being employed by the pharmaceutical industry. Through the acquisition of Umetrics, Sartorius is now a globally leading specialist in data analytics software for modeling and optimizing biopharmaceuti-cal development and manufacturing processes.
With its global, specialized sales force, Bioprocess Solutions addresses an attractive market with above-average growth rates. As our customers' manufactur-ing processes are validated by the respective health authorities, product quality and assurance of supply are essential. We see the leading international market positions of this division as good stepping stones for sustained dynamic and profitable growth in the future. Beyond realizing our organic growth potential coupled with a continuous increase in profitability, we also aim to further expand the division's portfolio through complementary acquisitions and alliances.
Details on this division are provided in the chapter on Business Development of Bioprocess Solutions.
Strategic Focus on Biopharma Applications from Molecule Development to Production of Biopharmaceuticals
Bioprocess Solutions Division
Lab Products & Services Division
Quality and Testing
Molecule DevelopmentCell Line and Process Development
Production Upstream & Downstream
26 Group Management Report Strategy and Goals
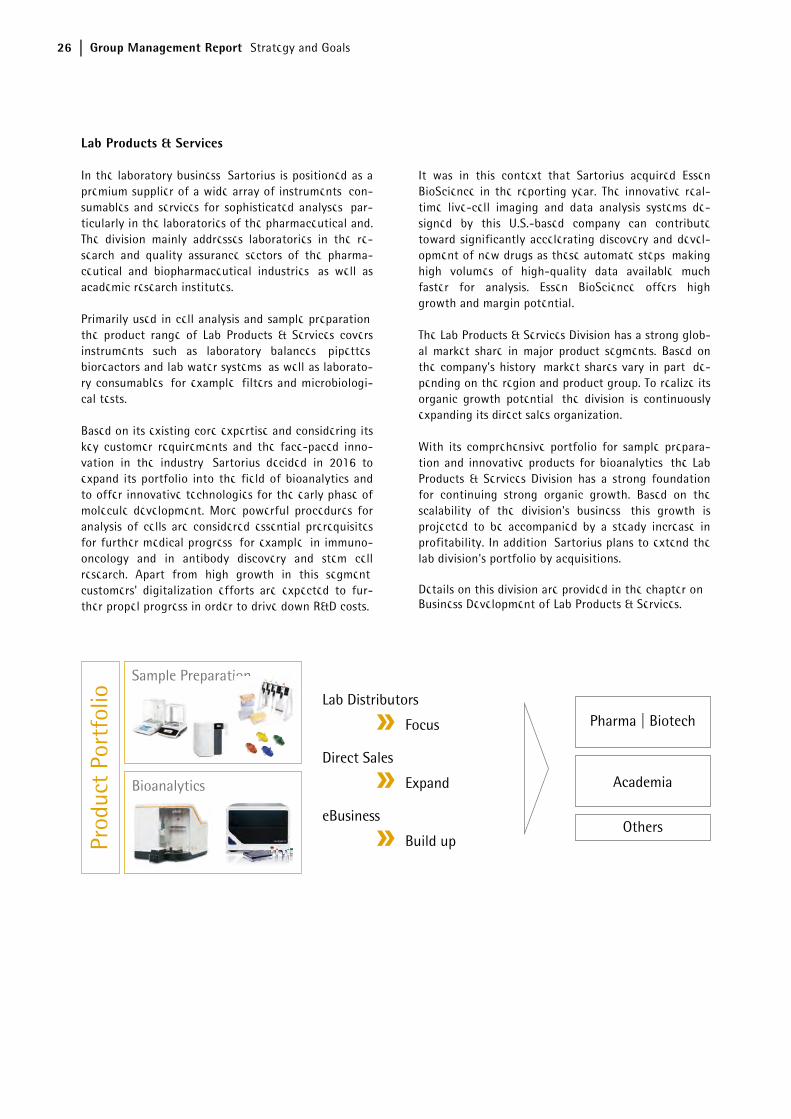
Lab Products & Services
In the laboratory business, Sartorius is positioned as a premium supplier of a wide array of instruments, con-sumables and services for sophisticated analyses, par-ticularly in the laboratories of the pharmaceutical and. The division mainly addresses laboratories in the re-search and quality assurance sectors of the pharma-ceutical and biopharmaceutical industries, as well as academic research institutes.
Primarily used in cell analysis and sample preparation, the product range of Lab Products & Services covers instruments such as laboratory balances, pipettes, bioreactors and lab water systems, as well as laborato-ry consumables, for example, filters and microbiologi-cal tests.
Based on its existing core expertise and considering its key customer requirements and the face-paced inno-vation in the industry, Sartorius decided in 2016 to expand its portfolio into the field of bioanalytics and to offer innovative technologies for the early phase of molecule development. More powerful procedures for analysis of cells are considered essential prerequisites for further medical progress, for example, in immuno-oncology and in antibody discovery and stem cell research. Apart from high growth in this segment, customers' digitalization efforts are expected to fur-ther propel progress in order to drive down R&D costs.
It was in this context that Sartorius acquired Essen BioScience in the reporting year. The innovative real-time live-cell imaging and data analysis systems de-signed by this U.S.-based company can contribute toward significantly accelerating discovery and devel-opment of new drugs as these automate steps, making high volumes of high-quality data available much faster for analysis. Essen BioScience offers high growth and margin potential.
The Lab Products & Services Division has a strong glob-al market share in major product segments. Based on the company's history, market shares vary in part, de-pending on the region and product group. To realize its organic growth potential, the division is continuously expanding its direct sales organization.
With its comprehensive portfolio for sample prepara-tion and innovative products for bioanalytics, the Lab Products & Services Division has a strong foundation for continuing strong organic growth. Based on the scalability of the division's business, this growth is projected to be accompanied by a steady increase in profitability. In addition, Sartorius plans to extend the lab division's portfolio by acquisitions.
Details on this division are provided in the chapter on Business Development of Lab Products & Services.
Sample Preparation
Bioanalytics
Prod
uct
Port
folio
Pharma | Biotech
Academia
Others
Lab Distributors
Focus
Direct Sales
Expand
eBusiness
Build up

Group Management Report Strategy and Goals 27
Sartorius 2020 Strategy
In 2011, Sartorius defined its strategy and long-term targets for 2020 to achieve profitable growth. At the beginning of 2016, close to the mid-point of this timeline, this 2020 plan was reviewed and updated.
The company's sales target of around €2 billion has been maintained despite the divestiture of the Indus-trial Technology Division in the interim. Growth is predominantly expected to be generated by Sartorius' existing portfolio, i.e., organically, and supplemented by acquisitions. In view of its profitability, Sartorius upgraded its margin target related to underlying EBITDA from around 23% to about 26% to 27% for 2020. This is assuming that the profitability of any future acquisitions would be at a level comparable to that of the existing business and that no significant changes in key exchange rates would occur.
Sartorius' 2020 targets are being implemented by various growth initiatives with the following areas of focus:
Regional Growth Initiatives
Regionally, North America and selected countries in Asia are at the focus of Sartorius' growth strategy.
North America is the world’s largest market for the manufacture of biopharmaceuticals and laboratory products. Because North America is home to the main competitors for both company divisions, Sartorius has historically lower market shares in this region than in Europe and Asia. Accordingly, the company is striving to further gain market share, primarily by strengthen-ing its sales and service capacities. Our second regional focus is on Asia, especially on China, South Korea and India. These markets have tremendous growth poten-tial due to their expanding healthcare systems and increased spending by private households. Moreover, major production facilities for biosimilars are being set up in these countries, and contract manufacturers are strengthening their presence in this region. To partici-pate in the momentum of the Asian markets in the best possible way, Sartorius already invested substan-tially in its sales infrastructure in this region.
Expansion of Product Portfolio
Regarding the further development of our portfolio, the 2020 strategy also provides for making acquisi-tions for both Group divisions. Such acquisitions will be primarily focused on adding complementary tech-nologies and products that enhance the attractiveness of the company's portfolio even more from a customer perspective.
Infrastructure
The foundation for future profitable growth is consti-tuted by efficient business processes, a powerful IT infrastructure and sufficient production capacities. Based on standardized business processes worldwide, Sartorius will be rolling out a new ERP system up to 2019 and is additionally investing continuously in the digitalization of its processes. Moreover, the company is considerably extending its production capacities at various locations, especially for filter and bag products. At the end of 2017, the two sites located in separate areas were combined for the most part into one loca-tion at the company's headquarters in Göttingen, Germany. This consolidation is expected to be com-pleted by the end of 2018.

28 Group Management Report Macroeconomic Environment and Conditions in the Sectors
The sectors in which the Sartorius Group is active differ in their dependence on the economy. The Bio-process Solutions Division, for instance, operates in an environment that is largely independent of economic fluctuations. The Lab Products & Services Division, in contrast, is active in sectors whose development is more strongly affected by economic factors.
Macroeconomic Environment
According to the International Monetary Fund (IMF), growth of the global economy accelerated in 2017. Gross domestic product rose by 3.6% worldwide, an increase of approximately 0.4 percentage points over the prior year figure representing the most significant growth of the past five years. Whereas the industrial-ized countries reported a gain of 2.2%, growth in the emerging markets was at 4.6%.
Nearly all regions participated in the global economic upturn. In the European Union, the increase amounted to 2.3%, a rise of around 0.3 percentage points on the previous year’s figure. Growth in the reporting period was driven by the general revival in global trade and sustained strong domestic demand. France benefited in particular from the positive effects with growth of 1.6% in 2017 – significantly above the prior-year figure of 1.2%. In Germany, which is Sartorius’ most important European market in terms of revenue, growth rose slightly to 2.0%. In the United Kingdom, consumer spending suffered from the depreciation of
the British pound. Thus, the increase of 1.7% fell just below the prior-year level of 1.8%.
The United States experienced an upturn in growth after the prior year’s weak performance. Economic output rose approximately 2.2%, up from 1.5% in 2016. Growth was fueled by favorable financing conditions and rising business investments.
The Asia-Pacific economic area likewise registered an upward trend with an overall increase of 5.6% (previ-ous year: 5.4%). Growth in the region received a boost from the revival in import demand in China. The world’s biggest economy proved once again to be driving global growth with a rise of approximately 6.8% in total economic output. Sartorius also achieved significant revenue in South Korea, India and Japan. While economic output in South Korea grew by 3.0% (previous year: 2.8%), India posted a decline of 0.4 percentage points to 6.7%. In Japan, fiscal stimulus programs pushed up growth to 1.5% (previous year: 1.0%).
Macroeconomic Environment and Conditions in the Sectors

Group Management Report Macroeconomic Environment and Conditions in the Sectors 29
Exchange Rate Trends
In addition to the euro, the currencies relevant to the Sartorius Group include the U.S. dollar in particular as well as the South Korean won, the Chinese renminbi, the Swiss franc and the British pound.
The U.S. dollar lost considerable ground against the euro in the year under review. The exchange rate for the currency pair rose sharply in the second and third quarters of 2017 to reach a multi-year high of U.S. $ 1.20 in September. The EUR/USD exchange rate fell back slightly after the U.S. Federal Reserve an-nounced, as expected, plans to reduce its bond buying program, thus taking the first concrete steps towards initiating a reversal in monetary policy. Over the course of December the temporary drop was fully recovered. The exchange rate for the currency pair ended the year at U.S. $ 1.20 as of December 31, 2017 compared with U.S. $ 1.06 at the end of 2016.
The euro also made headway during the reporting year against the other currencies of relevance for Sartorius. For instance, it gained 1.2% on the South Korean won year-on-year. Compared with the Chinese renminbi and the Swiss franc, the euro rose 7.3% and 9.0%, respectively. The British pound fell 4.3% against the euro in 2017.
Interest Rate Trends
Interest rates remained at a very low level on average throughout the reporting year. The European Central Bank kept its key interest rate at 0.00%. The 3 -month EURIBOR – i.e., the rate of interest on fixed-term de-posits denominated in euros in interbank business – stood at - 0.33% on December 31, 2017 (Decem-ber 31, 2016: - 0.32%).
Sources: International Monetary Fund: World Economic Outlook
October 2017; Bloomberg.
Conditions in the Sectors
Sartorius’ key customer groups include the biopharma-ceutical and pharmaceutical industries as well as pub-lic research institutions. In addition, the company counts quality assurance laboratories in the chemicals and food industries among its customers. The progress of the Group's business accordingly depends on devel-opments in these industries.
Continued Growth in the World’s Pharmaceutical Markets
According to estimates from several market observers, the global pharmaceutical showed a positive develop-ment once again in 2017, with growth of approxi-mately 4% to 5%. The market was again fueled by better access to health services in emerging markets and rising median ages in industrial countries, which led to an increasing demand for medications. By con-trast, growth of the pharmaceutical market was damp-ened by government initiatives directed at reducing health spending as well as expiring patents for high-margin pharmaceutical products.
All the regions contributed to sector growth in the year under review. The United States continues to represent the biggest single market, followed by China, Japan and Germany. The strongest growth, though with a slower tempo, took place as in previous years in the “pharmerging markets”, which include China, India, Brazil and Russia, among others. Performance of the European pharmaceutical market was impacted by increased efforts to control costs in the health sector. In the United States, expiring patents and tough com-petition among pharmaceutical manufacturers led to a moderate slowdown in market growth. Rising expendi-tures for newly launched medications had a positive impact.
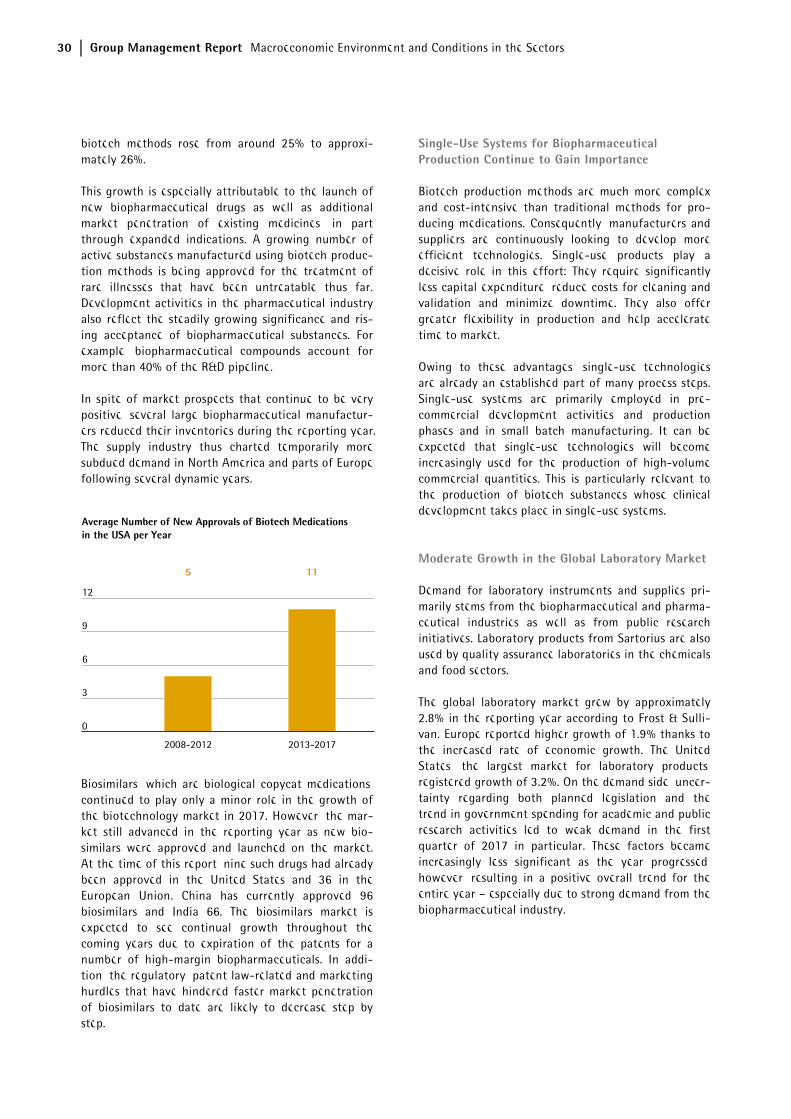
Above-Average Growth in the Biopharmaceutical Market
Given the company’s highly specialized product port-folio, the trend in the biopharmaceutical market is especially relevant for Sartorius. The market for medi-cations and vaccinations manufactured using biotech methods has grown faster than the rest of the phar-maceutical market for many years now. In 2017, the biopharmaceutical market was estimated by industry observers to have a volume of €214 billion, an increase of approximately 6% over the previous year. Overall, the proportion of sales revenue of the world's pharma-ceutical market from medications manufactured using
30 Group Management Report Macroeconomic Environment and Conditions in the Sectors
biotech methods rose from around 25% to approxi-mately 26%.
This growth is especially attributable to the launch of new biopharmaceutical drugs as well as additional market penetration of existing medicines, in part through expanded indications. A growing number of active substances manufactured using biotech produc-tion methods is being approved for the treatment of rare illnesses that have been untreatable thus far. Development activities in the pharmaceutical industry also reflect the steadily growing significance and ris-ing acceptance of biopharmaceutical substances. For example, biopharmaceutical compounds account for more than 40% of the R&D pipeline.
In spite of market prospects that continue to be very positive, several large biopharmaceutical manufactur-ers reduced their inventories during the reporting year. The supply industry thus charted temporarily more subdued demand in North America and parts of Europe following several dynamic years.
Biosimilars, which are biological copycat medications, continued to play only a minor role in the growth of the biotechnology market in 2017. However, the mar-ket still advanced in the reporting year as new bio-similars were approved and launched on the market. At the time of this report, nine such drugs had already been approved in the United States and 36 in the European Union. China has currently approved 96 biosimilars and India 66. The biosimilars market is expected to see continual growth throughout the coming years due to expiration of the patents for a number of high-margin biopharmaceuticals. In addi-tion, the regulatory, patent law-related and marketing hurdles that have hindered faster market penetration of biosimilars to date are likely to decrease step by step.
Single-Use Systems for Biopharmaceutical Production Continue to Gain Importance
Biotech production methods are much more complex and cost-intensive than traditional methods for pro-ducing medications. Consequently, manufacturers and suppliers are continuously looking to develop more efficient technologies. Single-use products play a decisive role in this effort: They require significantly less capital expenditure, reduce costs for cleaning and validation and minimize downtime. They also offer greater flexibility in production and help accelerate time to market.
Owing to these advantages, single-use technologies are already an established part of many process steps. Single-use systems are primarily employed in pre-commercial development activities and production phases and in small batch manufacturing. It can be expected that single-use technologies will become increasingly used for the production of high-volume commercial quantities. This is particularly relevant to the production of biotech substances whose clinical development takes place in single-use systems.
Moderate Growth in the Global Laboratory Market
Demand for laboratory instruments and supplies pri-marily stems from the biopharmaceutical and pharma-ceutical industries as well as from public research initiatives. Laboratory products from Sartorius are also used by quality assurance laboratories in the chemicals and food sectors.
The global laboratory market grew by approximately 2.8% in the reporting year according to Frost & Sulli-van. Europe reported higher growth of 1.9% thanks to the increased rate of economic growth. The United States, the largest market for laboratory products, registered growth of 3.2%. On the demand side, uncer-tainty regarding both planned legislation and the trend in government spending for academic and public research activities led to weak demand in the first quarter of 2017 in particular. These factors became increasingly less significant as the year progressed, however, resulting in a positive overall trend for the entire year – especially due to strong demand from the biopharmaceutical industry.

Group Management Report Macroeconomic Environment and Conditions in the Sectors 31
Significant growth was once again reported in Asian countries such as China and India, in which the la-boratory market enjoyed an above-average expansion of 7.6% (China) and 8.6% (India).
Competitive Position
The competitive environment in each of our two divi-sions is as follows:
The Bioprocess Solutions Division operates as a total solution provider, covering the core process steps in biopharmaceutical production and upstream process development. It holds a leading global position in key technological fields, and offers the sector’s most ex-tensive portfolio of single-use technologies. The Bio-process Solutions Division's principal competitors include Merck KGaA, Danaher, General Electric and Thermo Fisher.
The Lab Products & Services Division is positioned as a premium provider of laboratory instruments along with excellent services, and serves both R&D laborato-ries and quality assurance laboratories, with a focus on the biopharmaceutical industry. The product range includes laboratory balances, pipettes, and instruments for bioanalytics as well as a wide range of consuma-bles. The division ranks among the leading providers worldwide in most of these areas. Principal competi-tors include Mettler Toledo Intl. Inc., Thermo Fisher Inc., Merck KGaA, Danaher Corp. and Eppendorf AG.
Sources: QuintilesIMS Institute: Outlook for Global Medicines through 2021, December 2016; Evaluate Pharma: World Preview 2017, Outlook to 2022, June 2017; BioPlan: 14th Annual Report and Survey of Biopharmaceutical Manufacturing Capacity and Production, April 2017; Deloitte: 2017 Global Life Science Outlook, October 2016; Frost & Sullivan: 2017 Mid-year Report: Forecast and Analysis of the Global Market for Laboratory Products, October 2017; www.fda.gov; FDA-Approves-Fifth-Biosimilar-in-US-First-for-Amgens-Blockbuster-Enbrel, www.raps.org
.

32 Group Management Report Group Business Development
Sales Revenue and Order Intake
In the reporting year, the Sartorius Group continued to show positive development. Sales revenue thus rose 9.3% in constant currencies to €1,404.6 million, with the amounts contributed by organic growth and by acquisitions being approximately equal. On a reported basis, i.e., including currency effects, sales grew by 8.0%. Sartorius therefore reached its adjusted forecast for the third quarter of 2017.
Order intake also showed positive development in the reporting period, considerably exceeding sales. In 2017, orders increased 13.7% in constant currencies to €1,501.4 million. On a reported basis, this gain was 12.5%.
For a full comparison of the Group’s business devel-opment with its forecast, see page 50.
Sales Revenue and Order Intake
€ in millions 2017 2016 in %
reportedin % wb1)
Sales revenue 1,404.6 1,300.3 8.0 9.3
Order intake 1,501.4 1,334.7 12.5 13.7
1) In constant currencies
Sales Driven by Both Divisions
After two years of exceptionally high growth in 2015 and 2016, sales revenue for the Bioprocess Solutions Division increased in the reporting year at a slightly more moderate rate of 4.9% to €1,010.3 million. The division's business performance was impacted by sev-eral simultaneous, temporary effects, primarily in the Americas region. Therefore, transient bottlenecks in the business for cell culture media, inventory destock-ing by a few relatively large customers and interrup-tion of production at the plant in Puerto Rico in the wake of Hurricane Maria all had a dampening effect. As a result of these impacts, the division's growth was lower than originally expected. Acquisitions of the two companies kSep and Umetrics contributed around one percentage point to the division's growth.
The Lab Products & Services Division also saw excep-tionally dynamic growth due to strong development of organic sales and the expansion of its portfolio into bioanalytics. Sales revenue rose year over year by 22.0% to €394.2 million, with around 14 percentage points attributable to the consolidation of IntelliCyt and ViroCyt acquired in 2016, as well as of Essen BioScience taken over in 2017. Growth was driven by all regions and all product areas.
Sales by Division
€ in millions 2017 2016 in %
reportedin %
cc
Bioprocess Solutions 1,010.3 975.0 3.6 4.9
Lab Products & Services 394.2 325.3 21.2 22.0
Further information on the business development of the Group divisions is given on pages 42 et seq. for the Bioprocess Solutions Division and on pages 46 et seq. for the Lab Products & Services Division.
Group Business Development

Group Management Report Group Business Development 33
Significant Gains in All Regions
In the reporting year, Sartorius recorded gains in all regions. In EMEA, the region contributing the highest share of revenue of around 43%, sales rose 6.8% to €604.5 million. While the Bioprocess Solutions Division achieved a gain of 2.5%, sales revenue for the Lab Products & Services Division was up 17.7% year over year.
The Americas region, in which sales grew at an espe-cially strong rate over the past years, accounted for around 32% of consolidated revenue in 2017. Sales were up 3.5% to €455.5 million. Development of the Bioprocess Solutions Division was especially impacted by the temporary effects mentioned above; as a result, the division reported that sales decreased by 3.3% to €357.1 million. By contrast, the Lab Products & Ser-vices Division showed exceptionally dynamic develop-ment. Fueled by strong organic growth and by the acquisition of Essen BioScience, the division's sales were up 39.5%.
Business development for the Asia | Pacific region, which accounted for around 25% of Group revenue, showed the highest dynamics in the reporting year, with sales growing by 22.5% to €344.6 million. Sales revenue for the Bioprocess Solutions Division rose sharply by 25.3%, partly due to equipment shipments to fill relatively large orders. The Lab Products & Ser-vices Division also reported a double-digit gain of 16.6%. All growth rates are in constant currencies unless otherwise stated.
Sales by Region
€ in millions 2017 2016in %
reportedin %
cc
EMEA 604.5 569.1 6.2 6.8
Americas 455.5 445.4 2.3 3.5
Asia | Pacific 344.6 285.8 20.6 22.5
Development of Costs and Earnings
In the reporting year, the cost of sales stood at €697.7 million. In comparison with sales revenue growth of 8.0%, the cost of sales increased underpro-portionately by 4.4%, which was due to product mix effects and economies of scale. The cost of sales ratio was 49.7% relative to 51.4% a year ago.
Selling and distribution costs rose overproportionately relative to sales revenue, by 15.7% to €296.8 million. Accordingly, the ratio of selling and distribution costs to sales revenue increased from 19.7% in the previous year to 21.1%.
Expenses for research and development rose year over year by 15.8% to €68.8 million. The ratio of R&D ex-penses to sales revenue was 4.9%, slightly above the prior-year level of 4.6%.
Concerning general administrative expenses, Sartorius reported an 11.5% increase to €83.3 million, which can be primarily attributed to the expansion of the IT functional area. In relation to sales revenue, general administrative expenses rose from 5.7% in the previous year to 5.9% in the reporting year.
In fiscal 2017, the balance of other operating income and expenses was - €38.6 million relative to -€20.6 million a year earlier. This year-on-year change was driven, inter alia, by extraordinary items that totaled -€35.5 million in the reporting year (2016: -€30.7 million). These items were essentially incurred due to various cross-divisional projects, ex-penses related to the most recent acquisitions and to the consequences of Hurricane Maria.
In the year under review, the Group’s EBIT edged down slightly by 0.5% to €219.4 million, especially due to higher PPA amortization in connection with the acqui-sition of Essen BioScience. The Group's EBIT margin was 15.6% because of higher depreciation as well as extraordinary items (2016: 17.0%).
34 Group Management Report Group Business Development
The financial result was -€20.8 million in 2017 relative to -€16.4 million in 2016. This was essentially attribut-able to increased interest expenses.
In the reporting year, tax expenses of €39.3 million were substantially lower than the prior-year total of €59.1 million. This can essentially be attributed to the U.S. tax reform recently approved, which in the Sartorius Group resulted in positive extraordinary items due to reclassification of deferred tax liabilities of around €16 million in the USA. Because of this effect, the company's tax rate was just below 19.8%, down from 29.0% in the year before.
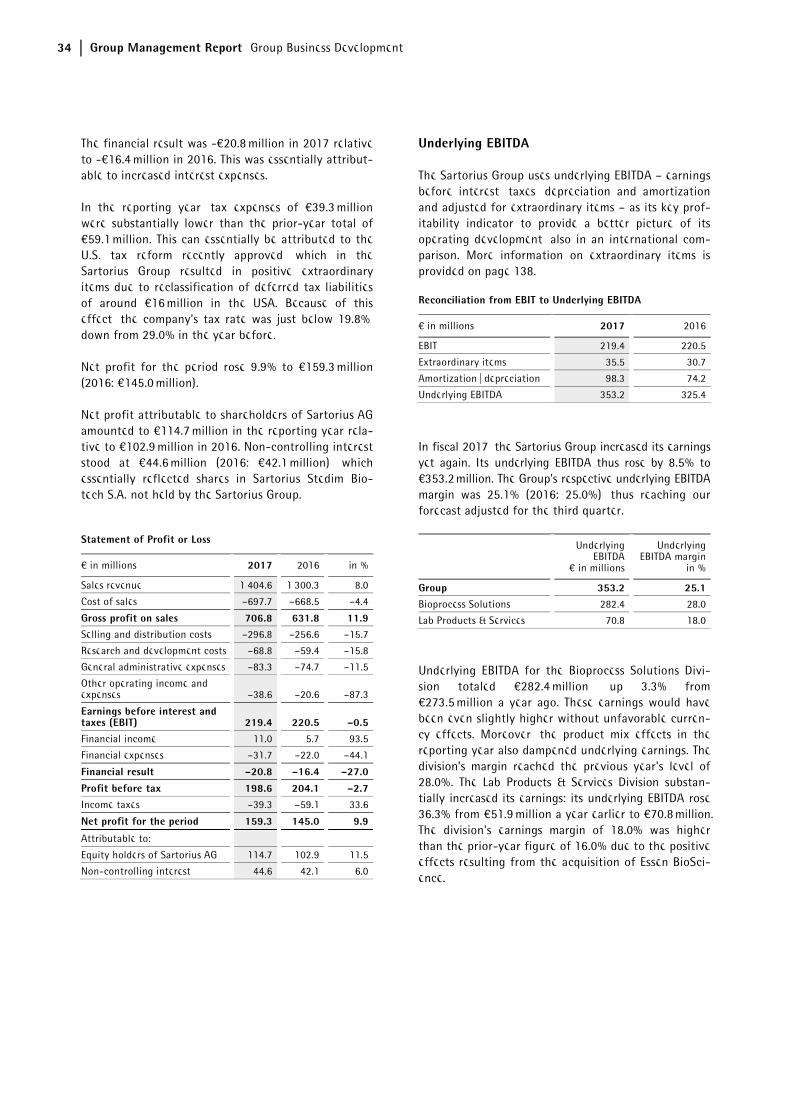
Net profit for the period rose 9.9% to €159.3 million (2016: €145.0 million).
Net profit attributable to shareholders of Sartorius AG amounted to €114.7 million in the reporting year rela-tive to €102.9 million in 2016. Non-controlling interest stood at €44.6 million (2016: €42.1 million), which essentially reflected shares in Sartorius Stedim Bio-tech S.A. not held by the Sartorius Group.
Statement of Profit or Loss
€ in millions 2017 2016 in %
Sales revenue 1,404.6 1,300.3 8.0
Cost of sales –697.7 –668.5 –4.4
Gross profit on sales 706.8 631.8 11.9Selling and distribution costs –296.8 –256.6 –15.7
Research and development costs –68.8 –59.4 –15.8
General administrative expenses –83.3 –74.7 –11.5
Other operating income and expenses –38.6 –20.6 –87.3
Earnings before interest and taxes (EBIT) 219.4 220.5 –0.5Financial income 11.0 5.7 93.5
Financial expenses –31.7 –22.0 –44.1
Financial result –20.8 –16.4 –27.0
Profit before tax 198.6 204.1 –2.7Income taxes –39.3 –59.1 33.6
Net profit for the period 159.3 145.0 9.9
Attributable to:
Equity holders of Sartorius AG 114.7 102.9 11.5
Non-controlling interest 44.6 42.1 6.0
Underlying EBITDA
The Sartorius Group uses underlying EBITDA – earnings before interest, taxes, depreciation and amortization and adjusted for extraordinary items – as its key prof-itability indicator to provide a better picture of its operating development, also in an international com-parison. More information on extraordinary items is provided on page 138.
Reconciliation from EBIT to Underlying EBITDA
€ in millions 2017 2016
EBIT 219.4 220.5
Extraordinary items 35.5 30.7
Amortization | depreciation 98.3 74.2
Underlying EBITDA 353.2 325.4
In fiscal 2017, the Sartorius Group increased its earnings yet again. Its underlying EBITDA thus rose by 8.5% to €353.2 million. The Group's respective underlying EBITDA margin was 25.1% (2016: 25.0%), thus reaching our forecast adjusted for the third quarter.
UnderlyingEBITDA
€ in millions
Underlying EBITDA margin
in %
Group 353.2 25.1Bioprocess Solutions 282.4 28.0
Lab Products & Services 70.8 18.0
Underlying EBITDA for the Bioprocess Solutions Divi-sion totaled €282.4 million, up 3.3% from €273.5 million a year ago. These earnings would have been even slightly higher without unfavorable curren-cy effects. Moreover, the product mix effects in the reporting year also dampened underlying earnings. The division’s margin reached the previous year's level of 28.0%. The Lab Products & Services Division substan-tially increased its earnings: its underlying EBITDA rose 36.3% from €51.9 million a year earlier to €70.8 million. The division's earnings margin of 18.0% was higher than the prior-year figure of 16.0% due to the positive effects resulting from the acquisition of Essen BioSci-ence.

Group Management Report Group Business Development 35
Relevant Net Profit
The relevant net profit attributable to the shareholders of Sartorius AG rose 8.6% from €132.6 million in 2016 to €144.0 million in 2017. This figure is the basis for determining the profit to be appropriated and is cal-culated by adjusting for extraordinary items and elim-inating non-cash amortization, and is based on the normalized financial result as well as the correspond-ing tax effects for each of these items. The underlying earnings per ordinary share climbed by 8.6% to €2.10, up from €1.93 a year earlier, and by 8.6% per prefer-ence share to €2.11 euros, up from €1.94 euros a year ago.
€ in millions 2017 2016
EBIT 219.4 220.5
Extraordinary items 35.5 30.7
Amortization 34.8 19.9
Normalized financial result1) –17.7 –13.6
Normalized income tax (2016: 30%, 2015: 30%)2) –78.9 –77.3
Underlying earnings 193.1 180.3
Non-controlling interest –49.1 –47.7
Underlying earnings after taxes and non-controlling interest 144.0 132.6
Underlying earnings per share
per ordinary share (in €) 2.10 1.93
per preference share (in €) 2.11 1.94
1) Financial result excluding fair value adjustments of hedging instruments and non-periodic expenses and income
2) Underlying income tax, based on the underlying profit before taxes and non-cash amortization
Further information on earnings development and extraordinary items for the Group divisions is given on pages 42 et seq. and 46 et seq.

36 Group Management Report Group Business Development
Research and Development
Sartorius continually invests in both new and further development of its products as well as the integration of new products through alliances. In 2017, the Sartorius Group spent €68.8 million on R&D, corre-sponding to an increase of 15.8% over the previous year's investment of €59.4 million. Owing to signifi-cantly higher sales, the ratio of R&D costs to sales revenue stood at 4.9%, slightly above last year’s 4.6%.
The IFRS require that certain development costs be capitalized on the balance sheet and then amortized over subsequent years. During the reporting year, these development investments amounted to €27.4 million compared with €18.3 million the year before. This equates to a share of 28.5% (previous year: 23.5%) of the Group’s total R&D expenses. Amortiza-tion related to capitalized development costs totaled €8.4 million during the reporting period (previous year: €9.4 million). These expenses are disclosed in the cost of sales.
We pursue a strategic intellectual and industrial prop-erty rights policy across our divisions to protect our expertise. Sartorius systematically monitors compli-ance with these rights on a cost | benefit basis to de-termine which specific individual rights are to be maintained.
In 2017, we filed a total of 161 applications for intel-lectual and industrial property rights (2016: 158). As a result of these applications, including those of prior years, we were issued 263 patents and trademarks during the reporting year (2016: 257). As of the bal-ance sheet date, we had a total of 3,699 patents and trademarks in our portfolio (2016: 3,416).
Further information is provided in the sections cover-ing the individual divisions on pages 42 et seq. and 46 et seq.
Capital Expenditures
Against a backdrop of strong organic growth in recent years, Sartorius is currently making above-average investments in the development of new capacity. In the reporting year, these development investments amounted to €209.4 million compared with €152.1 million the year before. At 14.9% (previous year: 11.7%), the ratio of investment to sales revenue was at the upper end of the forecast.
Our largest investment project is the expansion of our Group headquarters in Göttingen. As part of the con-solidation of two formerly separate sites, our capaci-ties for the production of filters and laboratory instruments will be extended there. New administra-tion buildings were also opened during the reporting year.
And at our location in Yauco, Sartorius is investing in the expansion of its production capacities for filters and single-use bags. (Further information is provided in the sections covering the individual divisions on page 45.)
To extend the capacities in cell line development that we gained when Cellca was acquired in 2015, we be-gan construction during the reporting year on a new building in Ulm.
Sartorius also made progress on the implementation of a new ERP system: in 2017 it was introduced at further sites in German, Switzerland and India and implemen-tation is scheduled to be completed in 2019.

Group Management Report Group Business Development 37
Employees
The numbers of employees reported include all staff members of the Sartorius Group, except for vocational trainees, interns, employees on extended leaves of absence and those participating in an early retirement plan. Numbers are reported as head counts.
On December 31, 2017, the Sartorius Group employed 7,501 people in 29 countries – 590 or 8.5% more than in the previous year. These figures include 214 em-ployees who joined the Group in the reporting year through the acquisitions of the two companies Essen BioScience and Umetrics.
Employees
20172016
Growthin %
Group 7,501 6,911 8.5Bioprocess Solutions 4,980 4,584 8.6
Lab Products & Services 2,521 2,327 8.3
In the Bioprocess Solutions Division, 4,980 people were employed as of the end of the reporting year, 386 or 8.6% more than at year-end 2016. The acquisition of Umetrics resulted in a gain of 36 new staff.
The Lab Products & Services Division employed 2,521 people as of the year ended December 31, 2017; this was an increase of 194 or 8.3% compared with the year-earlier period. The acquisition of Essen BioScience contributed significantly to this growth of the work-force, with 178 new people joining Group staff.
Employees in central administrative functions were allocated to the divisions in proportion to cost of the services they performed during the year.
Regionally, EMEA with the highest number of employ-ees added 6.8% or 328 new people. As of the end of the reporting year, Sartorius employed 2,807 people in Germany, or 37.4% of the total Group workforce, of which most staff members work at the Göttingen-based headquarters.
The Americas region charted an increase of 19.3% or 191 new people, again reporting the highest percent-age of staff hired in the year under review.
The number of employees in the Asia | Pacific region grew by 6.6% or 71 people.
38 Group Management Report Group Business Development
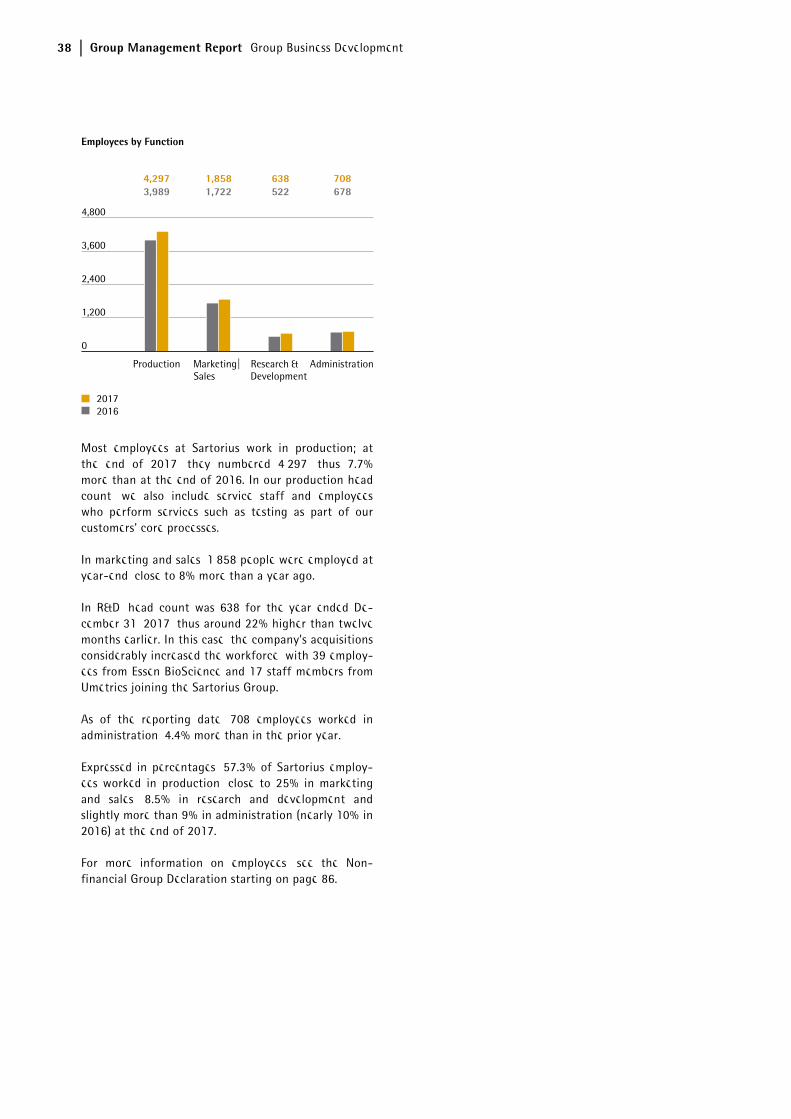
Most employees at Sartorius work in production; at the end of 2017, they numbered 4,297, thus 7.7% more than at the end of 2016. In our production head count, we also include service staff and employees who perform services such as testing as part of our customers' core processes.
In marketing and sales, 1,858 people were employed at year-end, close to 8% more than a year ago.
In R&D, head count was 638 for the year ended De-cember 31, 2017, thus around 22% higher than twelve months earlier. In this case, the company's acquisitions considerably increased the workforce, with 39 employ-ees from Essen BioScience and 17 staff members from Umetrics joining the Sartorius Group.
As of the reporting date, 708 employees worked in administration, 4.4% more than in the prior year.
Expressed in percentages, 57.3% of Sartorius employ-ees worked in production, close to 25% in marketing and sales, 8.5% in research and development and slightly more than 9% in administration (nearly 10% in 2016) at the end of 2017.
For more information on employees, see the Non-financial Group Declaration starting on page 86.
Group Management Report Net Worth and Financial Position 39
Cash Flow
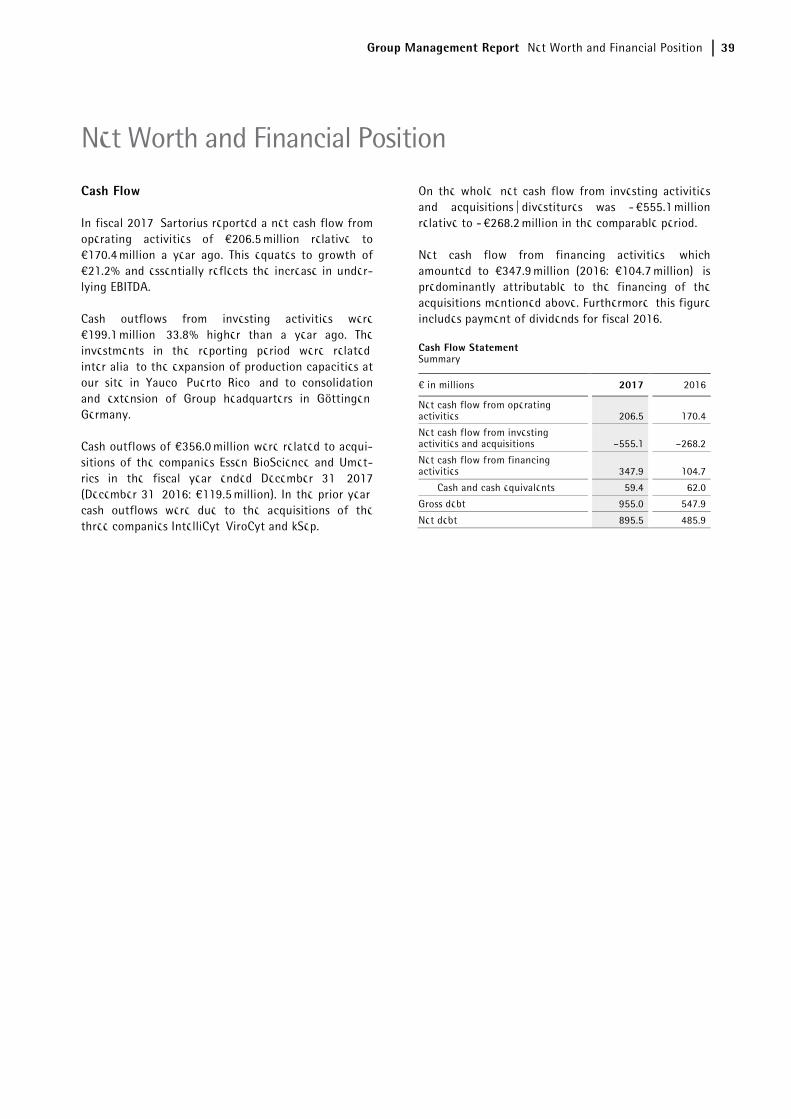
In fiscal 2017, Sartorius reported a net cash flow from operating activities of €206.5 million relative to €170.4 million a year ago. This equates to growth of €21.2% and essentially reflects the increase in under-lying EBITDA.
Cash outflows from investing activities were €199.1 million, 33.8% higher than a year ago. The investments in the reporting period were related, inter alia, to the expansion of production capacities at our site in Yauco, Puerto Rico, and to consolidation and extension of Group headquarters in Göttingen, Germany.
Cash outflows of €356.0 million were related to acqui-sitions of the companies Essen BioScience and Umet-rics in the fiscal year ended December 31, 2017 (December 31, 2016: €119.5 million). In the prior year, cash outflows were due to the acquisitions of the three companies IntelliCyt, ViroCyt and kSep.
On the whole, net cash flow from investing activities and acquisitions | divestitures was - €555.1 million relative to - €268.2 million in the comparable period.
Net cash flow from financing activities, which amounted to €347.9 million (2016: €104.7 million), is predominantly attributable to the financing of the acquisitions mentioned above. Furthermore, this figure includes payment of dividends for fiscal 2016.
Cash Flow StatementSummary
€ in millions 2017 2016
Net cash flow from operating activities 206.5 170.4
Net cash flow from investing activities and acquisitions –555.1 –268.2
Net cash flow from financing activities 347.9 104.7
Cash and cash equivalents 59.4 62.0
Gross debt 955.0 547.9
Net debt 895.5 485.9
Net Worth and Financial Position

40 Group Management Report Net Worth and Financial Position
Consolidated Statement of Financial Position
The balance sheet total of the Sartorius Group was €2,297.7 million as of the end of fiscal 2017 or €544.7 million above the previous year's figure of €1,753.0 million. This increase is predominantly at-tributable to the acquisitions of Essen BioScience and Umetrics.
Non-current assets rose €460.3 million to €1,625.7 million due to investments and acquisitions made in the re-porting year.
Current assets at €672.0 million were €84.4 million higher than in the previous year, particularly because of the buildup in working capital.
Key Figures for Working Capital
in days 2017 2016
Days inventory outstanding
Inventories | Sales revenue x 360 63 61
Days sales outstanding Trade receivables | Sales revenue x 360 72 66
Days payables outstanding Trade payables | Sales revenue x 360 35 33
Net working capital days
Net working capital1) | Sales revenue x 360 99 94
1) Sum of inventories and trade receivables less the trade payables
Equity increased, driven by earnings, from €736.8 million to €806.6 million. The equity ratio for the Sartorius Group of 35.1% (2016: 42.0%) continued to remain at a comfortable level.
Current and non-current liabilities for the Sartorius Group rose from €1,016.2 million a year ago to €1,491.2 million in the reporting year. Above all, the acquisitions previously mentioned, as well as the mainly growth-induced increase in working capital, contributed to this figure.
At the end of fiscal 2017, gross debt stood at €955.0 million relative to €547.9 million in fiscal 2016 and is comprised of liabilities to banks, including note loans (“Schuldscheindarlehen”), as well as liabilities from finance leases. The year-over-year increase is essentially attributable to the acquisitions of Umetrics and Essen BioScience, which were refinanced by placement of a note loan. Net debt, defined as gross debt less cash and cash equivalents, rose from €485.9 million a year ago to €895.5 million.

Group Management Report Net Worth and Financial Position 41
Ratio of Net Debt to Underlying EBITDA
Regarding the Sartorius Group's debt financing ca-pacity, the ratio of net debt to underlying EBITDA is a key financial ratio that is calculated as the quotient of net debt and underlying EBITDA. As of December 31, 2018, it was 2.5 relative to 1.5 a year earlier and thus within the range of our forecast adjusted to allow for acquisitions.
Financing | Treasury
The Sartorius Group is financed on a well-diversified basis, which covers both its short-term cash require-ments and its long-term strategy.
A major pillar of this financing is the syndicated credit line of €400 million, whose maturity date will run until December 2021.
In addition to note loans ("Schuldscheindarlehen") that were placed in 2012 and 2016 and had a 2017 year-end volume of around €230 million, the company extended its financing in 2017 by a further €350 million note loan with maturities of 5, 7 and 10 years. In addition, several long-term loans totaling around €300 million are available to expand the com-pany's production capacities, among other projects. Beyond these loans, Sartorius has diverse working capital and guaranteed credit lines totaling around €70 million.
The financing instruments mentioned above for the Sartorius Group comprise those with both fixed and variable interest rates. We pursue the strategy of using floating rate bank liabilities to hedge in part against an increase in the general interest rate level.
As a consequence of its global business activities, the Sartorius Group is exposed to fluctuations in foreign exchange rates. The Group’s main currencies include the U.S. dollar as well as several others, such as the South Korean won, the Chinese renminbi, the Swiss franc and the British pound. Using its global manufac-turing network with production facilities in North America, the U.K., China and India, among other places, Sartorius can compensate for the majority of currency fluctuations by natural hedging.
We generally hedge around two-thirds of our remain-ing net currency exposure over a time horizon of up to about 1.5 years through suitable currency transactions.

Filters for sterilization of biopharmaceutical media
Business Development of Bioprocess Solutions
4.9% sales growth relative to a very high revenue base
Development impacted by temporary effects in America
Portfolio expanded by the acquisition of Umetrics
Sales Revenue and Growth 1) by Region 2)
EMEA 413.8 | +2.5%
Asia | Pacific 239.4 | +25.3%
Americas 357.1 | –3.3%
¤ in millions, unless otherwise specified
¤ in millions 2017 2016 Δ D in %
Sales revenue 1,010.3 975.0 4.9 1)
Order intake 1,091.3 1,006.5 9.7 1)
Underlying EBITDA 282.4 273.5 3.3
as a % of sales 28.0 28.0
Employees as of Dec. 31 4.980 4,584 8.6
Key Figures
Single-use bag for cell cultivation and storage of biopharmaceuticals
Single-use bioreactor systems for cell cultivation processes of up to 2,000 L
Culture media and buffers for cell cultivation
Products for Biopharmaceutical Manufacture
Fully automated single-use centrifuge for cell harvesting
Single-use-based, multi-parallel bioreactor system for process development
€1,010.3 million
1) In constant currencies2) Acc. to customers’ location
e-GB2017-Konzern-Sparteneinstiegsseiten.indd 1 15.02.18 15:50
Group Management Report Business Development of Bioprocess Solutions 43
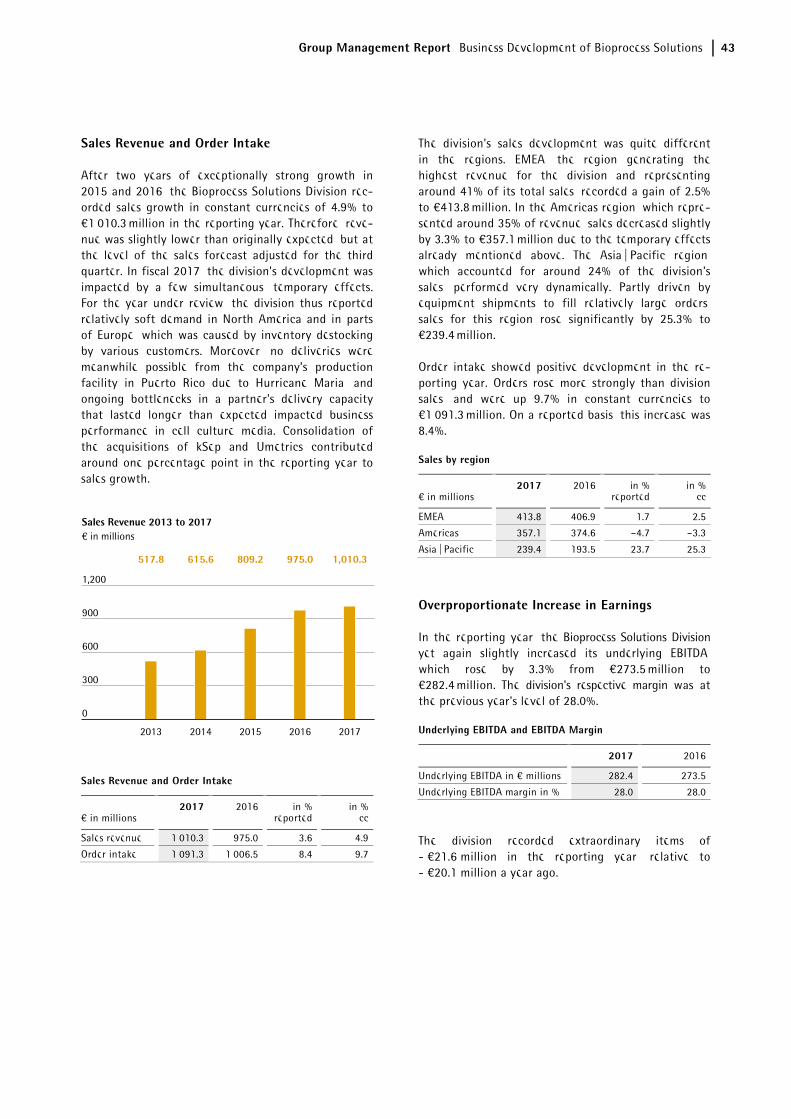
Sales Revenue and Order Intake
After two years of exceptionally strong growth in 2015 and 2016, the Bioprocess Solutions Division rec-orded sales growth in constant currencies of 4.9% to €1,010.3 million in the reporting year. Therefore, reve-nue was slightly lower than originally expected, but at the level of the sales forecast adjusted for the third quarter. In fiscal 2017, the division's development was impacted by a few simultaneous, temporary effects. For the year under review, the division thus reported relatively soft demand in North America and in parts of Europe, which was caused by inventory destocking by various customers. Moreover, no deliveries were meanwhile possible from the company’s production facility in Puerto Rico due to Hurricane Maria, and ongoing bottlenecks in a partner's delivery capacity that lasted longer than expected impacted business performance in cell culture media. Consolidation of the acquisitions of kSep and Umetrics contributed around one percentage point in the reporting year to sales growth.
Sales Revenue and Order Intake
€ in millions 2017 2016 in %
reportedin %
cc
Sales revenue 1,010.3 975.0 3.6 4.9
Order intake 1,091.3 1,006.5 8.4 9.7
The division's sales development was quite different in the regions. EMEA, the region generating the highest revenue for the division and representing around 41% of its total sales, recorded a gain of 2.5% to €413.8 million. In the Americas region, which repre-sented around 35% of revenue, sales decreased slightly by 3.3% to €357.1 million due to the temporary effects already mentioned above. The Asia | Pacific region, which accounted for around 24% of the division's sales, performed very dynamically. Partly driven by equipment shipments to fill relatively large orders, sales for this region rose significantly by 25.3% to €239.4 million.
Order intake showed positive development in the re-porting year. Orders rose more strongly than division sales, and were up 9.7% in constant currencies to €1,091.3 million. On a reported basis, this increase was 8.4%.
Sales by region
€ in millions 2017 2016 in %
reportedin %
cc
EMEA 413.8 406.9 1.7 2.5
Americas 357.1 374.6 –4.7 –3.3
Asia | Pacific 239.4 193.5 23.7 25.3
Overproportionate Increase in Earnings
In the reporting year, the Bioprocess Solutions Division yet again slightly increased its underlying EBITDA, which rose by 3.3% from €273.5 million to €282.4 million. The division's respective margin was at the previous year's level of 28.0%.
Underlying EBITDA and EBITDA Margin
2017 2016
Underlying EBITDA in € millions 282.4 273.5
Underlying EBITDA margin in % 28.0 28.0
The division recorded extraordinary items of - €21.6 million in the reporting year, relative to - €20.1 million a year ago.

44 Group Management Report Business Development of Bioprocess Solutions
Product and Sales
The product portfolio of the Bioprocess Solutions Division covers virtually all steps in biopharmaceutical production process, and increasingly its upstream process development as well. The portfolio includes cell culture media, cell lines, bioreactors, a wide range of products for separation, purification and concen-tration, and systems for the storage and transport of intermediate and finished biological products. We also offer an extensive range of services to support our customers in complying with regulatory requirements.
Well-Developed Portfolio Supports Customers
The Bioprocess Solutions Division expanded its portfo-lio in the reporting year via product upgrades and new generations of existing product lines as well as through the acquisition of Umetrics.
Furthermore, Umetrics provides software solutions that enable biopharmaceutical customers to increase efficiency as well as assisting them in digitalizing their processes, especially during scale-up.
In the product area, Sartorius presented the second generation of its BIOSTAT STR single-use bioreactor series in the year under review. The second generation is designed for the new single-use bags and can han-dle a working volume of 12.5 to 2,000 liters. The scala-ble series saves customers a significant amount of time in developing production processes.
In addition, a newly developed single-use system of-fers users an innovative, comprehensive solution for the filtration of biopharmaceutical media on a large scale. The new system makes filtration processes even easier and less time consuming.
The area of membrane chromatography was expanded as well. Now also available as cassettes, membrane adsorbers can be combined on a large scale to form a production system for the purification of biopharma-ceutical media, thus eliminating the previous limita-tions inherent in the smaller sizes.
Sales Activities Expanded
The Bioprocess Solutions Division markets its product portfolio directly through its own field sales repre-sentatives. Sales activities for key accounts are coordi-nated and supported by global key account management. As part of our regional initiatives for implementing our mid-term strategy, we stepped up our sales activities in North America during the year under review.
Research and Development
The Division’s research and development (R&D) activi-ties encompass both new and advanced in-house product developments in our own core technologies as well as the integration of new products through alli-ances and acquisitions. Sartorius aims to help custom-ers continually optimize their processes and steadily increase their efficiency.
Development activities at Sartorius focus in particular on the following technology areas: membranes, which are the core component of all types of filter products; various base technologies such as single-use contain-ers and sensors; and control technologies, for instance for fermentation.
During the reporting year, one focus of the R&D activ-ities was the development of a new software platform for the control of individual process steps. It enables the generation of consistent data in real time for optimized monitoring and control of both upstream and downstream processes from laboratory scale all the way to commercial production.
Another key task is ongoing integration of the soft-ware portfolio acquired in the takeover of Umetrics. Even prior to the acquisition, Sartorius had already spent several years working with Umetrics data analysis specialists for the purpose of modeling and optimizing biopharmaceutical development and production processes. Additional data-based software analysis tools are planned for the future to enable customers to work more efficiently and cost-effectively.
From a regional perspective, the largest R&D site is located at our headquarters in Göttingen, with other key R&D activities taking place in Aubagne (France) Guxhagen (Germany) and Bangalore (India) as well as Bohemia (USA), Royston (UK) and Umeå (Sweden).

Group Management Report Business Development of Bioprocess Solutions 45
Production and Supply Chain Management
The Bioprocess Solutions Division operates a well de-veloped global production network with plants in Europe, North America and Asia. The largest produc-tion sites are located in Germany, France and Puerto Rico. Moreover, Sartorius has manufacturing opera-tions in the UK, Switzerland, Tunisia, India and the USA.
Expansion of Production Capacity
Against the backdrop of the dynamic growth of the bioprocess business in recent years, Sartorius increased and accelerated the expansion of its production ca-pacities compared to its initial plans. Membrane pro-duction in Göttingen was further expanded.
In September, Hurricane Maria hit Puerto Rico. Thanks to the Yauco site’s high construction standards, both existing buildings and those under construction suf-fered only minor damage. Heavy infrastructure dam-age made deliveries from the plant impossible for around four weeks, however. Even so, Sartorius con-siders the Yauco location to be highly suitable. In the future, however, production will focus more strongly on standard products that can be stored on the U.S. mainland to reduce possible future disruptions in the supply chain.
Process Development
Upstream Processing Downstream Processing
Media Preparation
Seed Fermentation
Production Fermentation
Cell Removal Clarification
Capture Polishing Virus Clearance
y
y
y y
y y
y
y y
y
y y
y y y
y y
Simplified diagram
Cell culture media Cell
y
Antibodies Contaminents such as viruses
Vaccines, monoclonal antibodies, ...

Laboratory balances for reliable and convenient weighing processes
The lightest and smallest electronic pipette on the market
Filter membranes for microbiological testing in the lab
Business Development of Lab Products & Services
Exceptionally dynamic business development
Strong growth in all product areas and regions
Bioanalytics portfolio extended by the acquisition of Essen BioScience
Sales Revenue and Growth 1) by Region 2)
EMEA 190.7 | +17.7%
Asia | Pacific 105.2 | +16.6%
Americas 98.4 | +39.5%
¤ in millions, unless otherwise specified
¤ in millions 2017 2016 Δ D in %
Sales revenue 394.2 325.3 22.0 1)
Order intake 410.1 328.1 25.8 1)
Underlying EBITDA 70.8 51.9 36.3
as a % of sales 18.0 16.0
Employees as of Dec. 31 2,521 2,327 8.3
Key Figures
Products for Laboratories in Quality Assurance and Research
Syringe filters for analytical sample preparation and sterile filtration
Cell screening platform that has already won several awards
Real-time live-cell imaging system for cell analysis
€394.2 million
1) In constant currencies2) Acc. to customers’ location
e-GB2017-Konzern-Sparteneinstiegsseiten.indd 2 15.02.18 15:51

Group Management Report Business Development of Lab Products & Services 47
Sales Revenue and Order Intake
In the reporting year, the Lab Products & Services Division recorded a substantial increase in sales reve-nue by 22.0% to €394.2 million. The division's portfolio expansion into bioanalytics by the acquisition of Essen BioScience at the end of March 2017, as well as of IntelliCyt and ViroCyt in 2016 contributed close to 14 percentage points to this increase. Driven by strong demand in all regions and in all product areas, organic growth for the division was around 8%. Therefore, sales development was within the range of the com-pany's forecast that was adjusted in April 2017 due to its acquisitions.
Sales Revenue and Order Intake
€ in millions 2017 2016 in %
reportedin %
cc
Sales revenue 394.2 325.3 21.2 22.0
Order intake 410.1 328.1 25.0 25.8
In EMEA, the region contributing the highest share of revenue of around 48%, the division achieved a 17.8% increase in sales to €190.7 million. The Americas region, whose share of revenue rose to around 25%, reported the highest growth dynamics due to the acquisition of Essen BioScience, recording an uptick of 39.5% in sales to €98.4 million. Besides the division's excellent organ-ic performance, the acquisitions previously mentioned contributed an above-average proportion to the re-gion's growth. The Asia | Pacific region, which accounts for a good 27% of business for the Lab Products & Services Division, reported a double-digit gain of 16.6% to €105.2 million.
During the reporting period, order intake showed especially encouraging development and grew to €410.1 million at a considerably stronger rate, 25.8%, than did the division's sales revenue. On a reported basis, this growth rate was 25.0%.
Sales by region
€ in millions 2017 2016 in %
reportedin %
cc
EMEA 190.7 162.2 17.6 17.7
Americas 98.4 70.8 39.0 39.5
Asia | Pacific 105.2 92.3 14.0 16.6
Earnings
The Lab Products & Services Division increased its un-derlying EBITDA in the reporting period by 36.3%, from €51.9 million a year ago to €70.8 million, which was due to economies of scale in connection with the division's strong organic growth, as well as to growth contributed by its acquisitions. Despite unfavorable currency effects, the division’s corresponding margin improved from 16.0% in the previous year to 18.0%. This increase was likewise attributable to economies of scale related to strong organic growth as well as growth contributed by acquisitions.
Underlying EBITDA and EBITDA Margin
2017 2016
Underlying EBITDA in € millions 70.8 51.9
Underlying EBITDA margin in % 18.0 16.0
The division recorded extraordinary items of -€13.9 million in the reporting year relative to -€10.6 million a year ago.
48 Group Management Report Business Development of Lab Products & Services
Products and Sales
The Lab Products & Services Division focuses on both research laboratories and quality assurance laborato-ries in the pharmaceutical and biopharmaceutical sectors, as well as on academic research institutes.
Significant additions were made to the division’s port-folio in the area of bioanalytics in the year under review. The remaining product portfolio is used espe-cially for sample preparation and other standard appli-cations, and includes instruments such as laboratory balances, pipettes and bioreactors, in addition to con-sumables like laboratory filters and microbiological tests. Extensive services round out the portfolio.
The division sells its products through three channels: laboratory dealers, direct sales and e-business. The dealer sales channel is already well established; direct sales and the digital channels are being expanded continually.
Expanded Bioanalytics Portfolio
Sartorius significantly extended its expertise in the field of bioanalytics through the acquisition of Essen BioScience, which further improves the company’s positioning among biopharmaceutical customers and life science research institutes in particular. The acqui-sition will lead to growing synergies between the Lab Products & Services and Bioprocess Solutions divisions.
Essen BioScience offers a platform consisting of in-struments, software and reagents for fully automated, real-time analysis and visual depiction of biological processes using high-resolution imaging. The data obtained provides new insight and understanding into the mechanisms of healthy and diseased cells, which helps to significantly accelerate the often time-consuming development process for new substances.
Range of Services and Test Laboratories in All Regions
The Lab Products & Services Division offers a wide range of services covering the entire life cycle of la-boratory products, from device installation and com-missioning to verification, calibration, regular maintenance and repair. Our services are not limited to Sartorius instruments; they are offered for devices from other manufacturers as well. This extensive range enables our customers to minimize the number of service providers they use and to reduce complexity and costs.
Our application laboratories in all regions offer cus-tomers the opportunity to test Sartorius products, even using their own samples, and to take training courses.
Growing Importance of Bioanalytics
Sartorius enjoys a strong presence in the lab market in essential product areas, but for historical reasons, its market share varies by product group and region. This situation offers significant potential for growth. In particular, the company’s products in the area of bio-analytics offer strong unique selling points. We aim to use our global sales platform to accelerate the pene-tration of these technologies across the laboratory market.
However, ongoing improvements in sales efficiency are just as important as expanded sales structures. The Lab Products & Service Division is also benefiting from the customer access established for biopharmaceutical customers by the Bioprocess Solutions Division.
Group Management Report Business Development of Lab Products & Services 49
Research and Development
Within the scope of its laboratory business, Sartorius has extensive technological expertise in the area of laboratory instruments and laboratory consumables. A further technology focus is bioanalytics.
Most of the division’s R&D takes place centrally at the Göttingen site, but additional R&D activities are pur-sued at our facilities in Helsinki, Stonehouse, Ann Arbor and Albuquerque.
Products and services from Sartorius help users make laboratory processes more productive, efficient as well as safer. Compliance with regulatory requirements is critical. Product development priorities for Sartorius therefore include data management, connectivity and process automation.
As part of its increasing focus on the biopharmaceuti-cal sector, Sartorius develops weighing technology and equipment optimized for pharmaceutical applications. In further development stages, its instruments are specially adapted to these applications, for example, by combining a comparatively high weighing capacity and exceptionally high accuracy.
For example, special software routines already guide laboratory employees through work processes and transfer measurement and process data to laboratory management systems. Intuitive user interfaces in la-boratory instruments enable safer and faster work.
Production and Supply Chain Management
The Lab Products & Services Division operates plants in Germany, China, Finland, the U.K. and the U.S. The plants serve as centers of competence and tend to focus on one product group or a small set of product groups. Laboratory balances are manufactured in Göttingen and Beijing, for example, while pipettes are made at our Helsinki and Souzhou sites. Microbio-logical tests kits are produced in Stonehouse, and most membrane-based products are manufactured in Göttingen.

50 Group Management Report Assessment of the Economic Position
The Sartorius Group’s Business Performance
Sartorius made further progress in fiscal 2017 and grew profitably yet again. In line with the ongoing implementation of Sartorius' strategic plan, the com-pany expanded its product portfolio during the year under review through two acquisitions. The business of the Bioprocess Solutions Division was extended in the area of data analysis through the acquisition of Umet-rics, and the Lab Products & Services Division strength-ened its position in the high-growth segment of bioanalytics by the takeover of Essen BioScience. Due to consolidation of these acquisitions, Sartorius raised its forecast in April 2017 for the current fiscal year.
The Lab Products & Services Division saw exceptionally dynamic growth due to its strong organic development and to the expansion of its portfolio into bioanalytics. All regions and product areas contributed to this strong growth.
Business development of the Bioprocess Solutions Division was slightly lower than we had originally expected, especially in the second half, due to several simultaneous and temporary effects. Primarily impact-ing the Americas region, these were temporary bottle-necks in supply for the division's business with cell culture media, inventory destocking by a few large customers and an interruption in production at the plant in Puerto Rico following Hurricane Maria.
Because of the temporary effects previously men-tioned, Sartorius adjusted its annual forecast for the Bioprocess Solutions Division and the Group in Octo-ber 2017. The company's forecast for the Lab Products & Services Division remained unchanged.
Consolidated sales revenue rose during 2017 by 9.3% in constant currencies to €1,404.6 million. The Group's earnings margin, based on underlying EBITDA, in-creased to 25.1%, also meeting our expectations ad-justed in the third quarter.
The ratio of net debt to underlying EBITDA for the last twelve months stood at 2.5 as of December 31, 2017 (2016: 1.5), which was in the range of our adjusted forecast. As a result, the Sartorius Group continues to have significant financing flexibility to further imple-ment its strategy.
In the context of its 2020 strategy, Sartorius is making above-average investments in the expansion of its manufacturing capacities, its IT systems, and in the consolidation and expansion of its Group headquarters in Göttingen, Germany. Capital expenditures accord-ingly rose in the reporting year from €152.1 million to €209.4 million.
Projected | Actual Comparison for the Year 2017
Actual Guidance Guidance Prognose Actual
2016 January 2017 July 2017 October 2017 2017
Sartorius Group
Sales growth1) 18.2% ~8% –12% ~12% –16% ~9% 9.3%
Underlying EBITDA margin in % 25.0% ~+0.5%1) ~+0.5%1) ~25%3) 25.1%
Gearing (underlying) 1.5 < 1.52) ~2.4 ~2.4 2.5
CAPEX ratio 11.7% ~12% –15% ~12% –15% ~12% –15% (upper end) 14.9%
Sartorius Sparten Bioprocess Solutions
Sales growth1) 22.1% ~9% –13% ~9% –13% ~4% 4.9%
Underlying EBITDA margin in % 28.0% ~+0.5%1) ~+0.5%1) ~28%3) 28.0%
Lab Products & Services
Sales growth1) 7.9% ~6% –10% ~20% –24% ~22% 22.0%
Underlying EBITDA margin in % 16.0% ~+1%1) Close to +2pp ~18%3) 18.0%
1) In constant currencies 2) Possible acquisitions are not considered 3) In actual currencies
Assessment of the Economic Position

Group Management Report Annual Financial Statements of Sartorius AG 51
The retained profit of Sartorius AG is the key reference value for the payment of dividends to our shareholders. Whereas the Sartorius Group financial statements are drawn up according to the International Financial Reporting Standards (IFRS), the annual financial statements for Sartorius AG are prepared by applying the rules and regulations of the German Commercial Code (HGB).
The Management Report of Sartorius AG and the Group Management Report for fiscal 2017 are com-bined. The HGB annual financial statements of Sartorius AG and the combined management report are published simultaneously in the German Federal Gazette (Bundesanzeiger).
Business Operations, Corporate Strategy, Corporate Management and Oversight, Overview of Business Development
Sartorius AG has exercised only the functions of the strategic, group-leading management holding entity for the Sartorius Group since the beginning of fiscal 2011, and we refer in this connection to the explanatory reports concerning business operations, corporate strategy, corporate management and oversight, as well as the overview of business development, presented on pages 21 et seq. of the combined management report of Sartorius AG and the Group.
Earnings
Sales revenue of Sartorius AG essentially consists of cost transfers to affiliated companies within the Group for management services rendered as well as of the rental of buildings on Sartorius Campus.
Income from investments of €28.7 million relative to €22.8 million a year ago concern dividends paid out for the French subsidiary Sartorius Stedim Biotech S.A.
The total loss accepted under profit and loss transfer agreements was €40.0 million. Of this amount, €0.1 million was transferred to Sartorius Corporate Administration GmbH (2016: profit of €1.4 million) and €39.9 million to Sartorius Lab Holding GmbH, com-pared with a profit of €4.1 million that the latter had accepted in 2016.
The loss incurred by Sartorius Lab Holding GmbH essentially resulted from the non-cash valuation of a U.S. dollar-denominated loan needed for acquisitions executed in the USA.
Net Worth and Financial Position
The balance sheet total of Sartorius AG rose in the reporting year by €384.1 million to €1,225.3 million. This increase was primarily due to the acquisitions executed in the USA and investments made at the Göttingen site.
The balance sheet structure of Sartorius AG reflects its function as the management holding entity for the Sartorius Group. Fixed assets consist essentially of financial assets and, in the reporting year, stood at €507.4 million (2016: €474.8 million). Accordingly, fixed assets accounted for 41.4% of the balance sheet total (2016: 56.4%). The equity ratio for fiscal 2017 was 22.5% relative to 38.4% in 2016.
Annual Financial Statements of Sartorius AG
52 Group Management Report Annual Financial Statements of Sartorius AG
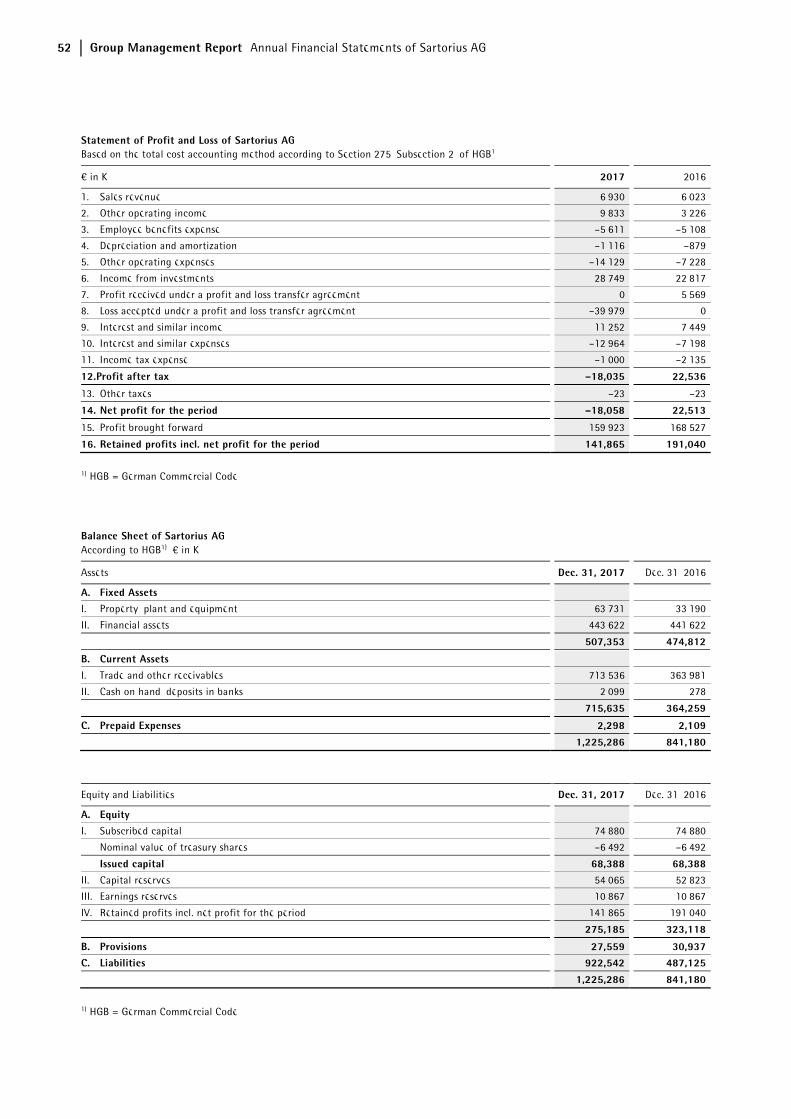
Statement of Profit and Loss of Sartorius AGBased on the total cost accounting method according to Section 275, Subsection 2, of HGB1
€ in K 2017 2016
1. Sales revenue 6,930 6,023
2. Other operating income 9,833 3,226
3. Employee benefits expense –5,611 –5,108
4. Depreciation and amortization –1,116 –879
5. Other operating expenses –14,129 –7,228
6. Income from investments 28,749 22,817
7. Profit received under a profit and loss transfer agreement 0 5,569
8. Loss accepted under a profit and loss transfer agreement –39,979 0
9. Interest and similar income 11,252 7,449
10. Interest and similar expenses –12,964 –7,198
11. Income tax expense –1,000 –2,135
12. Profit after tax –18,035 22,536
13. Other taxes –23 –23
14. Net profit for the period –18,058 22,513
15. Profit brought forward 159,923 168,527
16. Retained profits incl. net profit for the period 141,865 191,040
1) HGB = German Commercial Code
Balance Sheet of Sartorius AGAccording to HGB1), € in K
Assets Dec. 31, 2017 Dec. 31, 2016
A. Fixed Assets I. Property, plant and equipment 63,731 33,190
II. Financial assets 443,622 441,622
507,353 474,812
B. Current Assets
I. Trade and other receivables 713,536 363,981
II. Cash on hand, deposits in banks 2,099 278
715,635 364,259
C. Prepaid Expenses 2,298 2,109
1,225,286 841,180
Equity and Liabilities Dec. 31, 2017 Dec. 31, 2016
A. Equity
I. Subscribed capital 74,880 74,880
Nominal value of treasury shares –6,492 –6,492
Issued capital 68,388 68,388II. Capital reserves 54,065 52,823
III. Earnings reserves 10,867 10,867
IV. Retained profits incl. net profit for the period 141,865 191,040
275,185 323,118
B. Provisions 27,559 30,937C. Liabilities 922,542 487,125
1,225,286 841,180
1) HGB = German Commercial Code

Group Management Report Annual Financial Statements of Sartorius AG 53
Proposal for Appropriation of Profits
The Executive Board will submit a proposal to the Annual Shareholders’ Meeting to appropriate the retained profit of €141,864,793.40 reported by Sartorius AG for the year ended December 31, 2017, as follows:
in €
Payment of a dividend of €0.50 per ordinary share 17,106,112.00
Payment of a dividend of €0.51 per preference share 17,429,794.68
Unappropriated profit carried forward 107,328,886.72
141,864,793.40
Research and Development
Detailed information about the research and develop-ment activities of the Sartorius Group and of its divi-sions is given on pages 42 et seq. and 46 et seq.
Employees
Sartorius AG as a holding company does not employ any staff to be disclosed pursuant to Section 285, No. 7, of HGB.
Risks and Opportunities
The opportunities and risks affecting the business development of Sartorius AG as the management holding entity are essentially equivalent to those of the Sartorius Group. Sartorius AG shares in the risks to which its investments and subsidiaries are exposed in proportion to the extent of its investment. Where expedient and feasible, we adopted countermeasures and | or arranged for balance sheet measures during the reporting year to cover all discernible risks within Sartorius AG that had the potential to negatively im-pact our net worth, financial position and profitability.
A detailed Opportunity and Risk Report for the Sartorius Group is provided on pages 54 to 62; a de-scription of the internal control and risk management system, on pages 67 to 68.
Report on Material Events
Please refer to page 64 to read the Report on Material Events for Sartorius AG and the Sartorius Group.
Forecast Report
Earnings trends for Sartorius AG depend substantially on the progress of its subsidiaries and, hence, on the Sartorius Group.
The development of the Sartorius Group's business is discussed in the Forecast Report on pages 63 to 65.

54 Group Management Report Opportunity and Risk Report
Principles
Every business activity entails opportunities and risks, which have to be managed. The skill with which this is done goes a long way in determining the future devel-opment of a company's shareholder value. The central element of risk management is systematic identifica-tion and realization of opportunities, as well as avoid-ance of risks that could jeopardize the success of the company.
In managing risks and opportunities, Sartorius aims to identify and use business opportunities systematically, as well as to recognize and evaluate risks at an early stage and take measures to counter them where possi-ble. It is not the task of risk management to eliminate all risks: rather, our approach is to intentionally to take a certain measure of risk in our business activities in order to be successful in unlocking opportunities. However, in this endeavor, it is important to keep risks contained within acceptable limits and to control them carefully. Through appropriate guidelines, we ensure that risk assessments are taken into account in the decision-making processes from the very beginning.
Sartorius has no single organizational unit tasked with identifying and managing opportunities and risks. Instead, it prefers to make this a cross-functional component of Group management. To this extent, our risk management organization reflects a global func-tional matrix organization in which individuals head-ing a functional area, so-called "risk owners," are each responsible for their own management of opportuni-ties and risks. The Finance & Controlling department is responsible for the organization of the respective reporting process, including the further development of the Group's risk management system.
Managing Opportunities
Our opportunity management centers on the analysis of target markets and sector environments, as well as the assessment of trends, both of which give strong indications as to future business opportunities. The identification of the potential for development in this context is one of the key roles of the relevant manag-ers and initially takes place at the local rather than the central level. The market-facing functions, such as strategic marketing and product management in the individual divisions, play a leading role in this respect. The central Business Development unit additionally supports these areas with market monitoring, data analysis and the implementation of strategic projects.
As part of strategy reviews, the members of the Group Executive Committee regularly meet with the manag-ers having operational responsibility and with the Business Development unit to discuss short-, medium- and long-term opportunity potential for the various business areas. The subsequent steps of prioritizing the opportunities and evaluating them from a business management perspective, deriving strategic measures and allocating resources proceed in accordance with a standardized decision-making process that applies throughout the Group. If the opportunities are short-term in nature, they are considered in annual budget planning. Medium- and longer-term opportunities are tracked systematically as part of strategic planning. The status of opportunity management as a permanent fixture of the corporate management system means that it also features in the discussions and decision-making processes of top-level management, such as the Executive Board and the Supervisory Board.
Key areas of opportunity are presented below. Where appropriate, reference is made to the relevant section of the Group Management Report in order to avoid repetition. Most of the risks we describe in the section on specific risks represent opportunities, should events develop in the opposite, positive direction. For this reason, we discuss these opportunities in the section on specific risks and opportunities at the end of this chapter.
Areas of Opportunity
As a supplier for the pharmaceutical and laboratory industries, Sartorius operates in future-oriented and high-growth sectors. The significant opportunities generated by the various market and technology trends are described in detail in the sections entitled "Sector Conditions" and "Outlook for the Sectors" on pages 29 and 63, respectively.
Our assessments rank the company as one of the glob-al market leaders in many subsegments and product areas. We believe the high quality of our products, our strong brand recognition and our established customer relationships give us strong opportunities to continue extending our market leadership. The corresponding division strategies and the growth opportunities and initiatives based on them are discussed in the section on the strategy of the Bioprocess Solutions Division, which begins on page 25, and in the section on the strategy of the Lab Products & Services Division, which starts on page 26.
Opportunity and Risk Report

Group Management Report Opportunity and Risk Report 55
Strict management of processes and costs provides opportunities to further increase our profitability. Key target areas in this respect include continued en-hancements of our procurement chain and ongoing efforts to optimize production, which we present on pages 45 and 49.
Other opportunities are discussed in the context of the presentation of specific risks and opportunities begin-ning on page 56.
Risk Management
Just as for opportunity management, overall responsi-bility for the maintenance of an effective risk man-agement system ensuring comprehensive and consistent management of all material risks rests with the Executive Board. Coordinating and developing this system and combined risk reporting are the responsi-bilities of the Finance & Controlling department, while the particular functional areas are responsible for identifying and reporting risks, as well as for assessing their potential impact and for taking the appropriate countermeasures.
The Supervisory Board of Sartorius AG monitors the effectiveness of the risk management system, with the preparatory work necessary for it to do so being per-formed by the Audit Committee of this board. Fur-thermore, while carrying out their statutory audit mandate for the annual financial statements and con-solidated financial statements, the independent audi-tors examine whether the early warning system in place is capable of prompt identification of risks that could jeopardize the future of the company.
Risk Management System and Risk Reporting
At the heart of the risk management system is the Sartorius Group Risk Management Handbook, which applies throughout the entire Group organization. The Handbook, which includes definitions of the frame-work, the structural organization, processes, risk re-porting and monitoring and control of the effectiveness of the risk management system, is based on the internationally recognized COSO standard. There are also a number of other sources that contain stipulations for handling risks, including the articles of association and rules of procedure of the Group com-panies and other internal guidelines.
The Group-wide risk reporting system forms the corner-stone of internal risk communication. The object is to make it possible to address risks in a structured, con-tinuous manner and to document them in accordance
with the relevant statutory and regulatory requirements. The strong growth of the Group over the past years and the rising demands of customers and regulators meanwhile require that we continue to adapt our guidelines and rules.
A key element of our internal communication of risks is Group-wide risk reporting. The objective of this is to enable structured, continuous tracking of risks and to document them in compliance with legal and regula-tory requirements.
The prescribed reporting process in the risk categories subsequently described establishes the rules for the ongoing review of and information on risk situations. Those responsible for functional areas at the Group subsidiaries continually review and assess their respec-tive risk situations. If any specific risks are discernible, these are documented with respect to their assessment, probability of occurrence and measures to be taken to eliminate such risks or to mitigate their impact. In addition, as soon as these risks reach defined size criteria, they are reported to the central risk manage-ment system. Appropriate insurance policies are taken out to reduce any remaining risk situations, where feasible. New organizational units joining the consoli-dated Group companies are successively integrated into our risk reporting process.
We have an urgent reporting procedure in place to ensure that when a new or emerging significant risk to our net worth, financial position and profitability is identified and estimated as involving €2.5 million or higher, the Executive Board of Sartorius AG receives all of the necessary details without undue delay.
Risk Classification
The first level of risk management relates to the four main risk categories defined by Sartorius: external risks, operating risks, financial risks and corporate govern-ance risks.
The second level consists of additional subcategories that we classify within these main categories, such as supply chain risks, sales and distribution risks, and quality risks.
We categorize risks according to the scale of their implications too, and also perform a specific evalua-tion in which all risks are assigned the value of their maximum impact at the time of risk analysis. In other words, we record the maximum risks without consider-ing the probability of occurrence or the effects of risk mitigation measures.

56 Group Management Report Opportunity and Risk Report
For the purposes of this report, we have assessed the probability of the risks as shown below and, in the adjacent columns, classify their particular significance for the entire Group.
Probability of Occurrence
Low < 5%
Medium 5% - 20%
High > 20%
Significance
in thousands of € Impact on Earnings* Impact on Assets*
Of limited significance < 1,000 < 5,000
Significant > 1,000 > 5,000
Explanation of Principal Risks and Opportunities
General and Macroeconomic Risks and Opportunities
General Risks
In principle, our ability to foresee and mitigate the direct and indirect effects of risks entailed by life in general is limited, but we proactively take measures, whenever feasible, to ensure that we can respond appropriately and at short notice or are insured against any damage entailed by such risks that include, for instance, force majeure, natural catastrophes and their associated damage to commercially significant and critical infrastructure. After severe hurricances hit Puerto Rico in the past fiscal year, we deployed a task force that defined the immediate measures to take, thus limiting the economic damage to the Group. At the same time, a project for updating our production network strategy was launched.
Political developments, such as the referendum on the United Kingdom’s leaving the European Union or the change in politics in the USA, can basically have an impact on the Group’s business. To cite such examples, such developments may involve changes to the tax system or customs duties, as well as impacts on the exchange rate of the euro to the British pound or the U.S. dollar (for more on the subject of exchange rates, see the section below on Exchange Rate Risks and Opportunities). These further developments are being closely observed so that measures can be taken to reduce such risks, as necessary.
Business Cycle Risks
The nature of our various business areas means that Sartorius as a whole is insulated to a certain extent from the full force of wider cyclical effects. While macroeconomic effects have very little bearing on the progress of the Bioprocess Solutions Division, they are particularly relevant to the Lab Products & Services Division and can represent a risk to the latter's growth in this context. If economic developments prove more positive than expected, this, in turn, can additionally stimulate stronger growth for Lab Products & Services.
Supply Chain Risks and Opportunities
Our supply chain extends from procurement to pro-duction to sales and distribution. Problems within this workflow can have consequential effects, including delays in deliveries. The global supply chain manage-ment system we have instituted throughout our pro-duction processes to prevent such problems largely minimizes the associated risks by analyzing and con-trolling all of the operations involved. The strongly international alignment of our organization opens up a whole series of opportunities too. The various risks and opportunities encountered within our supply chain are explained in detail below.
Procurement Risks and Opportunities
We purchase a wide range of raw materials, compo-nents, parts and services from suppliers and are conse-quently exposed to the risks of unexpected delivery bottlenecks and | or price increases.
Over the past years, we have implemented powerful tools and robust processes in our Materials Manage-ment unit to manage risks arising from critical materi-als. These means enable us to meet the needs of our customers with respect to assurance of supply and transparency. This represents a significant competitive advantage. Important measures in this respect are to maintain security stock and to define alternative sup-pliers as part of our second supplier policy.
In addition, we conduct regular supplier reviews and also use early warning systems.
Risks arising from raw material prices play a rather subordinate role in our business. On the one hand, the proportion of raw materials in our production costs is comparatively low. On the other hand, we purchase a wide range of materials so that price increases for certain materials do not represent any significant factor.
Group Management Report Opportunity and Risk Report 57
Opportunities can arise in the area of procurement when our growth enables us to increase order quanti-ties and thereby strengthen our position with our suppliers, such as by receiving price discounts or pref-erential treatment as a "preferred customer." In addi-tion, we maintain a list of preferred suppliers in parallel, which permits us to enter into long-term business relationships with key suppliers to our mutual benefit.
Increased globalization of our supplier pool holds the prospect of purchasing on more favorable terms, moreover, and there is also a possibility of our ex-panded purchasing activities in the international mar-kets leading us to identify suppliers with special product and technical expertise that could eventually enhance our own competitive edge.
Production Risks and Opportunities
Based on our core technology expertise, we ourselves manufacture a large proportion of the products that involve a high level of vertical integration. Examples include filters and laboratory balances. Other products, such as reusable fermenters and bioreactors, are man-ufactured in collaboration with suppliers so that some of the production risks are transferred to external third parties. When we manufacture products our-selves, we also bear the associated risks of capacity bottlenecks or overcapacity, production downtimes, excessive reject rates and high levels of tied-up work-ing capital, as well as dependency on individual manu-facturig sites. We contain and reduce these risks by planning production capacities carefully, using versa-tile machines, semi-automated individual workstations and flextime work schedules, and by continuously monitoring production processes. Moreover, our global manufacturing network enables us to compensate for any capacity bottlenecks by shifting production to other regional plants and to minimize our dependency on individual local manufacturing sites.
Furthermore, we have taken out policies for business interruption insurance to compensate for any possible losses due to production downtimes.
Beyond this, we work closely together with our cus-tomers to gain a better understanding of their needs and to schedule our production capacities optimally.
We consider it an opportunity that our investments in infrastructure and production resources, among other things, have given us high flexibility in our manufac-turing operations and that we are capable of meeting our customers' requirements and regulatory standards with respect to business continuity concepts. In addi-
tion, this approach ensures that our individual produc-tion sites can concentrate on specific manufacturing technologies, gaining added efficiency as a result. Our international manufacturing network also makes it possible to capitalize on the cost advantages offered by individual sites. Furthermore, continuous improve-ments in production, such as simplifying processes and increasing levels of automation, help drive manufac-turing efficiency even higher.
Over the past years, we have substantially enhanced our production workflows at our largest production facility at Göttingen corporate headquarters by con-solidating individual manufacturing sites at Sartorius Campus and by optimizing process sequences when operations were started up at the new laboratory production building, thus minimizing the associated risks.
Sales and Distribution Risks and Opportunities
We use a variety of channels to sell and distribute our products around the world. The potential risks entailed are unexpected changes in the demand structure, growing price pressure and non-compliance with sup-ply agreements concluded with customers. We employ targeted market analyses to identify emerging demand trends in individual segments early on so that we have time to respond appropriately. Our technical innova-tions and our focus on less price-sensitive sales mar-kets, such as products for validated production processes in the biopharmaceutical industry, reduce our exposure to the risk of growing price pressure. We have minimized our risk exposure in the area of logis-tics in recent years by setting up and using central warehouses to optimize distribution logistics.
Opportunities arise in the area of sales and distribu-tion when the increasing breadth of our product range – in both bioprocess and lab segments – puts us in a position to sell new products to existing customers. Our business relationships, most of which are estab-lished for the long term, and our global presence pro-vide opportunities, moreover, and our ongoing project to strengthen direct sales, especially in the lab seg-ment, also promises to enhance our sales prospects.
With our acquisitions in cell analytics, we have strengthened the synergies between both divisions and offer our biopharmaceutical customers comprehensive solutions for research laboratories all the way to pro-duction processes.
58 Group Management Report Opportunity and Risk Report
Quality Risks and Opportunities
Our customers use Sartorius products in a wide range of critical production processes, including the manu-facture of pharmaceuticals, foods and chemicals, and in research and development laboratories. The main risk encountered in these areas is non-compliance with agreed quality criteria, which can lead to losses for our customers, or their customers, for which we may be made liable through compensation claims. We employ rigorous quality checks and advanced produc-tion methods and processes, such as cleanroom tech-nology, to ensure that our products satisfy the most stringent quality standards and high regulatory re-quirements. These manufacturing methods and pro-cesses are subject to constant review under our continuous improvement processes, moreover, and are optimized as requirements evolve. Our successful com-pletion of a host of annual audits by customers and our certification under ISO 9001 and ISO 13485 to-gether document the high level of quality achieved in Sartorius products and processes. Irrespective of these measures, we also maintain significant insurance cov-erage against product liability risks. Sartorius has established a traceability system that enables us to recall an entire production batch immediately, if nec-essary, and minimize any adverse consequences in the event of defects being discovered in a product.
We have installed a complaints management system to deal with customer requests and to ensure full docu-mentation.
Quality requirements are growing more and more stringent all the time, not least as a result of increas-ing requirements on protection of medical patients and on product safety by regulatory authorities, so we regard this first and foremost as an opportunity that opens up new market prospects. Also, challenging quality demands represent a considerable barrier to entry for potential new competitors and provide stim-ulus for further technical innovation to which we actively respond.
R&D Risks and Opportunities
We devote a considerable share of our resources to research and development. Potential risks in this area may arise from development results that diverge from market needs and application requirements and from exceeding planned development deadlines. Our ad-vanced project management, intensive R&D controlling and early involvement of our customers in the devel-opment process substantially limit these R&D risks. Patents and continuous tracking of the technologies
and competitors relevant to us secure our technology and marketing position.
On the other hand, the R&D sphere also offers a num-ber of opportunities. Our intensive collaboration with partners that rank among the global market leaders in their own fields opens up the opportunity for us to jointly develop products with an especially high level of innovation. In areas such as membrane technology and plastics technology, sensorics and biopharmaceu-tical process engineering, as well as weighing technol-ogy, in turn, the expertise of our own specialists puts us at the very forefront of global research and devel-opment, presenting us with an opportunity to turn this technical knowledge into potential sales and an even stronger position on the market.
Customer Risks and Opportunities
Sartorius sources its key customers from the pharma-ceutical, chemical and food industries and from re-search and educational institutions of the public sector. These customers are usually relatively large organizations that have been in existence for some time and have strong credit ratings. Most of our busi-ness areas have a highly diversified customer base, so the Group as a whole is not dependent on individual key accounts to any significant degree.
Competitive Risks and Opportunities
Sartorius has a leading competitive position in most of its markets and competes with mainly larger rivals sharing our status as a globally operating company. As we serve a large number of customers from highly regulated sectors like the pharmaceutical and food industries, and the technology barriers to market entry are substantially high, we regard the probability of new competitors emerging within the short term as low. Overall, the competitive environment is therefore very stable.
The fact that many of our products are used in vali-dated processes, especially those in the biopharmaceu-tical industry, ensures a robust revenue stream, reducing the risk of losing significant market share within a short timeframe. At the same time, it is not possible for us to quickly force out the competition that serves customers in this area.

Group Management Report Opportunity and Risk Report 59
Changes in the competitive environment, for example, consolidation in the markets, can pose opportunities. Our sectors find themselves in an ongoing process of change in which Sartorius has been actively partici-pating. We have been continuously making acquisi-tions in recent years to reinforce our market position and open up new potential synergies.
Acquisition Risks and Opportunities
By nature, acquisitions provide many opportunities, such as sales growth, extension of our product portfo-lio and development of new markets. By contrast, the purchase and sale of companies or parts of companies entail a number of typical risks, such as incorrect valu-ation assumptions or insufficient usage of anticipated synergy effects. To prevent these risks, we take various measures, such as performing a standard due diligence review of important areas and carrying out compre-hensive analysis of the market concerned. In addition, we involve external consultants and experts in the purchase or sales process as required. We especially focus on drafting transaction contracts so that they adequately counter such risks, especially by clauses assuring specific characteristics or by contractual warranty or guarantee provisions, as well as agree-ments on mechanisms for adjustment of the purchase price and on liability clauses or by taking out the ap-propriate insurance policies. Immediately after an acquisition has taken place, an integration phase is initiated in which any potential risks can likewise be detected as early as possible and prevented or mini-mized by taking the appropriate counteractions.
Personnel Risks and Opportunities
As an innovative technology group, Sartorius employs a large percentage of highly qualified people. We counter the risks of a possible scarcity of required specialists, especially those in key positions, and of demographic change by offering performance-related remuneration models, targeted continuing professional development options, further attractive social benefits, continuous education and training for junior staff members within our organization and interesting peo-ple development opportunities.
The success of these measures is apparent in the low attrition rates of recent years and the many years of seniority our people accumulate on average. Employ-ment contracts in certain cases contain a clause pro-hibiting any move to a direct competitor.
Opportunities for Sartorius primarily arise in that it can further qualify its staff by offering its own train-ing courses and retain such staff over the long term, thus covering company needs for qualified personnel particularly well.
Financial Risks and Opportunities
The global nature of the Sartorius Group’s operations means that its business activities are inevitably ex-posed to financial risks. The most significant of these, aside from risks associated with Group accounting, are exchange rate risks, interest rate risks and liquidity risks, all of which are described below and addressed in detail in the Notes to the Consolidated Financial Statements. Vice versa, financial risks, most notably exchange rate risks and interest rate risks, are bal-anced by opportunities of approximately equal magni-tude.
Risks Associated with Group Accounting
Except for the general, typical risks inherent in any accounting process, no specific risks concerning Group accounting are discernible. Typical accounting errors in this connection are, for example, incorrect discre-tionary decisions in the measurement of assets and liabilities. The use of various standardized, partially automated control mechanisms largely ensures that such errors are recognized and corrected at an early stage. A highly detailed monthly reporting and analy-sis process, as well as regular legal audits, essentially contributes to these targets.
Exchange Rate Risks and Opportunities
As we generate around half of consolidated sales reve-nue in foreign currencies and two-thirds of this total revenue in U.S. dollars or in currencies pegged to the U.S. dollar, we are positively or negatively impacted by currency effects, especially when converting the cur-rencies of balance sheet items and profit or loss items, respectively. To largely compensate for the general risk resulting from the impact of individual foreign curren-cies, we have taken a number of measures besides hedging currencies. Our global production network thus enables us to offset the lion’s share of sales reve-nues received in foreign currency within the Group against costs likewise incurred in foreign currency. For example, we manufacture many of our products for the North American market locally, and are not disad-vantaged in competition with our U.S. rivals, insofar as this general currency risk is concerned. We continu-ously monitor both exchange rates and our net cur-

60 Group Management Report Opportunity and Risk Report
rency exposure – i.e. that proportion of our foreign currency sales revenue that remains after we have settled our costs, likewise in a foreign currency – and use derivative financial instruments for hedging. These instruments are primarily spot, forward and swap transactions, on the basis of current and anticipated net currency exposure and foreign currency levels. We make it a policy to hedge up to 70% of our exposure in advance for the following 18 months. Hedging transactions are set up by one group of staff and monitored by another, separate group.
Interest Rate Risks and Opportunities
We have concluded fixed interest agreements for ap-proximately two-thirds of our outstanding loans to eliminate the risk posed by variable interest payments. The remaining portion of the financial instruments outstanding on the reporting date is subject to varia-ble interest based on the market rate. Almost one-third of these is currently covered by interest rate swaps. We monitor interest rate trends and our interest rate expo-sure constantly and have the facility to arrange for additional hedging transactions where we consider it necessary and economically advisable to do so for individual loans.
Liquidity Risks and Opportunities
The Sartorius Group actively manages liquidity central-ly in order to check and minimize liquidity risks and optimize liquidity management within the organization. For this purpose, we use various long- and short-term financial instruments. Regarding the maturities of our loans, we make it a policy to take a risk-averse ap-proach.
For short-term liquidity procurement, we also employ various instruments. In addition to the syndicated credit line that can be accessed and repaid at short notice, we have a number of bilateral credit lines in place on a smaller scale for individual Group compa-nies. Furthermore, we use cash pooling agreements between selected Group companies as the primary tool to manage liquidity within the Group.
Under the present loan agreements, the Group is re-quired to comply with standard financial key ratios, or covenants. In this context, the ratio of net debt to underlying EBITDA may not be greater than 3.25 and 4.00, respectively. There is a basic risk in this connec-tion that the Group might not comply with these covenants, which could lead to a termination of the loan agreements. Based on the current information available, this is considered unlikely.
Regulatory Risks
Our role as a supplier to the biopharmaceutical indus-try and health care providers means that Sartorius can also be affected by underlying developments in these areas. The possibility of the regulatory authorities (FDA, EMA) adopting a more restrictive approach to the approval of new medications remains the principal source of risk in this context. Such a move would reduce the number of new pharmaceutical products to be marketed and would consequently downgrade future prospects for Sartorius over the medium term.
Environmental Risks
Sartorius has established an environmental manage-ment system that encompasses, and is integrated into, all divisions and covers a whole series of environmen-tally relevant regulations to minimize environmental risks. This management system has been certified for compliance with ISO 14001 at a number of the com-pany's relatively large manufacturing sites. The respec-tive company organizational units ensure at the particular sites that the laws and regulations relating to environmental protection are observed and that further technical possibilities for limiting environmen-tal risks are identified on an ongoing basis.
The increasing importance of sustainability considera-tions in many industries represents an opportunity. That is why this aspect is a key element in our supplier selection process for assessing the suitability of a particular company as a business partner. For further information on this group of topics, please refer to our Non-Financial Group Declaration.
IT Risks and Opportunities
Besides the risks already described, the Sartorius Group is exposed to potential risks in the area of IT as a re-sult of its pronounced dependence on these systems, since their error-free operation is essential for the smooth functioning of the company's business pro-cesses. We reduce IT security risks by continuously enhancing and implementing IT security guidelines and policies. These rules and measures are based on the requirements of ISO 27001 and the standards of the German Federal Office for Information Security (BSI Standards). Furthermore, our company's existing IT applications and IT systems are checked for potential risks in regular external and internal IT audits, and appropriate measures are taken to minimize any risks identified. Continuous alignment of our IT strategy and business strategy, tracking of new technical developments and the use of advanced hardware and

Group Management Report Opportunity and Risk Report 61
software minimize the risk inherent in the operation of our IT system environment. A new ERP system commissioned by Sartorius at its Göttingen Group headquarters in 2012 has been successively rolled out to the Group sites around the world. Up to the end of 2017, approximately 75% of the Group's global sales transactions have been processed using the new sys-tem. In conducting this IT project, we have continued to focus on controlling the risks involved, such as by maintaining a precautionary backup system. The im-plementation of the new system brings with it a whole series of opportunities, especially in relation to effi-ciency gains and the standardization and harmoniza-tion of business processes worldwide.
Process Risks
Process risks for Sartorius can arise from pending or forthcoming legal disputes or from administrative proceedings. All judicial or extrajudicial disputes are attended to by the company’s own attorneys and legal experts, who engage external lawyers as needed.
At present, there are no pending or discernible legal disputes or proceedings that lack any cost coverage allowances in the statement of financial position or that could have a substantial negative impact on Group.
Insurance
We have taken out insurance policies to cover a wide range of risks where possible and economically advisa-ble. These insurance policies include coverage against liability, property damage, business interruption, transport, material and pecuniary damages and other risks, and provide comprehensive coverage for legal costs. An independent department working in conjunc-tion with an external insurance broker regularly re-views the nature and extent of our insurance protection and makes any adjustments necessary.
When choosing our insurers, we particularly consider the credit rating of these entities as potential contrac-tual partners, as well as aim to achieve a high degree of diversity in order to mitigate the related risks.
Assessment of the Overall Risk Situation and Risk Outlook
Where feasible, we adopted countermeasures and | or arranged for balance sheet measures during the report-ing year to cover all discernible risks within the Sartorius Group, and those of a defined probability of occur-rence, that had the potential to damage our net worth, financial situation and profitability.
For the purposes of this report, we have assessed the probability of occurrence of the risks as shown below and, in the adjacent columns, classify their particular significance for the entire Group.

62 Group Management Report Opportunity and Risk Report
Risk Category Probability of Occurrence Significance
General and macroeconomic risks
Business cycle risks Medium Significant
General risks Low Significant
Supply chain risks
Procurement risks Low Of limited significance
Produktion risks Low Significant
Sales and distribution risks Medium Significant
Quality risks Low Significant
R&D risks Low Significant
Customer risks Low Of limited significance
Competitive risks Low Of limited significance
Acquisition risks Low Significant
Personnel risks Low Of limited significance
Financial risks
Risks associated with Group accounting Low Of limited significance
Exchange rate risks Medium Significant
Interest rate risks Medium Significant
Liquidity risks Low Significant
Regulatory risks Low Of limited significance
Environmental risks Low Of limited significance
IT risks Low Significant
Process risks Low Of limited significance
After thorough analysis of the entire risk situation and according to our current review, there are no discernible risks at present that could jeopardize the continued existence of the Group.
Similarly, based on our current review, there are no discernible risks that could jeopardize the future exist-ence of the Group.

Group Management Report Forecast Report 63
Future Macroeconomic Environment
According to the October 2017 outlook by the Inter-national Monetary Fund (IMF), the global economy is expected to continue expanding at a high level in 2018. Economic growth is projected to reach 3.7%, up from 3.6% a year earlier, with the upswing supported by pickups in investment, global trade and industrial production.
The growth forecast for the European Union is moder-ate this year. Estimates call for growth of 2.1%, down from 2.3% in 2017. Medium-term growth could be negatively impacted by the overall weak productivity trend as well as excess levels of both public and pri-vate debt in some countries. The German economy in particular is expected to see a slight decline in 2018 compared with the historically high growth rates re-cently experienced. The IMF currently predicts growth of 1.8%, a decrease of around 0.2 percentage points on the prior year. Economists are projecting a similar decline for the United Kingdom, with growth forecast to drop to 1.5%. The depreciation of the British pound continues to negatively impact consumer spending.
For the U.S. economy, the IMF forecasts economic expansion of 2.3% in 2018, compared with 2.2% in the previous year. That projection does not account for possible effects resulting from planned corporate tax cuts by the U.S. administration. Economic researchers view the high confidence levels evidenced by both consumers and companies as fundamentally positive.
The Asia-Pacific economic area is likely to grow by around 5.5% in 2018, or approximately at the same level as the prior year. Growth will be fueled by a
revival of China’s import demand. The world’s largest economy is expected to expand by roughly 6.5% on the back of fiscal support programs (previous year: 6.8%). The Japanese economy is forecast to see a sharp decline in growth of around 0.8 percentage points to 0.7%, due to phase-outs of economic stimulus packag-es and decreasing consumer spending.
Future Exchange and Interest Rate Trends
Experts predict that base interest rates will remain at a very low level in 2018, as they did last year.
Market forecasts of the euro-U.S. dollar exchange rate for the course of 2018 range between 1.08 euro | U.S. dollar and 1.30 euro | U.S. dollar.
Sources: International Monetary Fund, World Economic Outlook
October 2017; Reuters Forex Poll, December 2017
Outlook for the Sectors
Pharmaceutical Industry Continues to Grow
Strong, long-term trends are driving growth in the global pharmaceutical industry. Major growth factors include the growing and aging global population, combined with increasing access to healthcare, espe-cially in the emerging and developing countries. How-ever, the expiration of patents and measures aimed at limiting national healthcare expenditures will have a dampening impact. Market observers estimate growth of the world's pharmaceutical market to come in at between 4% and 7% per year during the period up to 2021.
The U.S. pharmaceutical market – the world’s largest – is expected to grow at a rate of 6% to 9% on average during the period between 2017 and 2021. Expansion will be driven principally by new, innovative medica-tions, while moderating effects will result from expir-ing patents for lucrative medications and increased use of biosimilars.
Growth in the European pharmaceutical market is likely to remain moderate over the next few years as continuing austerity measures affect its national healthcare systems. Thus, average growth of between 1% and 4% is projected for the region until 2021.
Forecast Report

64 Group Management Report Forecast Report
It is to be expected that the “pharmerging markets” and especially China will continue to expand at an above-average rate. Market observers estimate growth at around 6% to 9% annually from 2017 to 2021 ow-ing to demographic trends, rising investment in gov-ernment-led healthcare systems and increased private spending.
Biotech Sector Enjoys Above-Average Growth
Market observers forecast that the biopharma segment of the pharmaceutical market, which has been enjoy-ing particularly strong growth for years, will continue to outperform the market. Forecasts call for the global biotechnology market to grow by an average of around 9% annually during the period from 2017 to 2022, which would increase the market volume from the current €214 billion to €326 billion. The share of biological medications and vaccines in the total reve-nue generated by the pharmaceutical market is ex-pected to rise from roughly 26% at present to around 30% in 2022.
This dynamic trend will be driven largely by the in-creasing market penetration of already approved bio-pharmaceuticals and an expanded range of indications. Thanks to technical and medical advances, the field of applications for substances manufactured using bio-tech production methods is growing steadily. For ex-ample, biopharmaceuticals are increasingly being used in yet-to-be fully explored therapeutic areas and in the treatment of rare diseases that have thus far been untreatable. This relatively young market segment is driving sector growth with its high innovate power, as reflected in the strong research and development pipelines. Overall, around 40% of the medications in R&D pipelines are based on biological manufacturing processes. These include more than 800 biosimilars and 500 “biobetters,” i.e. generic versions of biologic agents with better efficacy or fewer side effects than the original compounds.
The high level of innovation and R&D productivity in the biotechnology sector are mirrored by the rising number of new product approvals. In the USA for example, the number of newly approved biological medications during the last five years was approxi-mately 120% higher than the number of approvals from the period 2008 to 2012.
Strong Growth in the Biopharma Market
1) Source: Evaluate Pharma®: World Preview 2017, Outlook to 2022, June 2017; CAGR 2017 to 2022.
■ Growing & aging population
■ Increasing access to healthcare
■ Strong R&D pipelines
■ Emerging biosimilars market
~ 9% CAGR1)
■ Conventional | Unclassified ■ Biotechnology
2017 26 %
2022 30 %

Group Management Report Forecast Report 65
Biosimilars which are biological copycat medications, will continue to increase in importance during the years to come. They are less expensive than the refer-ence compound, while having similar properties in terms of their application, dosage and efficacy. In-creased use of biosimilars thus brings the prospect of lower individual treatment costs and financial relief for national healthcare systems. This is a goal likely to be pursued by the industrialized countries, where aging populations are leading to rising demand for medications and notably higher expenditures. In many developing countries, biosimilars offer the initial ac-cess to biopharmaceutical substances. The develop-ment of national production capacities is receiving political support. Regulatory requirements are general-ly much less strict in developing countries than in the industrialized countries, thus the biosimilars market could experience substantial growth in the emerging economies over the next few years.
Eight of the strongest selling biopharmaceuticals are due to lose their patent protection in the United States and Europe by the year 2020. Various pharma-ceutical manufacturers have therefore announced the market launch of those biosimilars that have already been approved. At present, around 30 compa-nies are actively working on the development of biopharmaceutical copycat products for 16 different molecules. At the same time, the biosimilars market will also see a gradual decline in regulatory and patent-related barriers and challenges to marketing the products – factors that have thus far slowed de-velopment of the market. Against this backdrop, cur-rent estimates call for accelerated growth over the next few years. By 2020, sales of biosimilars could multiply to between U.S. $25 billion and U.S. $35 billion.
Furthermore, some spectacular achievements have been made in the field of cell therapy lately. The goal of cell therapy is to prevent, treat, heal or mitigate human disease or injury through the use of autologous, allogenic or xenogenic cells that have been manipulat-ed ex vivo or otherwise altered. Regardless of the type of cell therapy, the production technologies used for the manufacturing of the respective therapeutic prod-ucts are similar to those used for the manufacturing of biopharmaceuticals. The growing number of cell-based therapies currently in clinical development and the rising number of approved cell therapies already in use could lead to increasing demand for the corresponding production capacities in the future.
Stable Growth Expected in the World's Laboratory Market
According to Frost & Sullivan, global demand for la-boratory products is likely to remain stable, with growth of 2.8% in 2018. The key U.S. market is ex-pected to generate growth of 3.0%, in part due to the sustained strength of the biopharmaceutical industry and the business-friendly climate. In Europe, experts anticipate an increase of just 1.7% owing to the com-paratively moderate economic growth and as a result of uncertainties in the wake of the Brexit referendum. However, the European Union’s increased budget for academic research will likely spur mid-term growth. As before, market observers expect the highest growth rates in Asian countries such as China and India, in which the individual labor markets are likely to grow around 7.5% to 8.8% in 2018.
Sources: QuintilesIMS Institute: Outlook for Global Medicines
through 2021, December 2016; Evaluate Pharma: World Preview
2017, Outlook to 2022, June 2017; BioPlan: 14th Annual Report
and Survey of Biopharmaceutical Manufacturing Capacity and
Production, April 2017; Deloitte: 2017 Global Life Science Out-
look, October 2016; Frost & Sullivan: 2017 Mid-year Report:
Forecast and Analysis of the Global Market for Laboratory
Products, May 2017

66 Group Management Report Forecast Report
Outlook for 2018
The outlook for 2018 considers the sector environment, economic trends and the opportunities and risks out-lined in this Annual Report. The following forecast is provided under the assumption that we have accurate-ly anticipated the relevant trends for Sartorius:
Sartorius Group
Sartorius expects to grow profitably again in 2018. Specifically, management projects that Group sales revenue for the full year will grow by about 9% to 12% in constant currencies. Regarding profitability, management forecasts that the company's underlying EBITDA margin will increase by around half a percent-age point over the prior-year figure of 25.1%.
In view of continued strong organic growth, Sartorius had already started in 2016 to expand its production capacities earlier and to a greater extent than initially planned. Accordingly, the Group projects that it will invest overproportionately in its worldwide infrastruc-ture in 2018 as well, at a ratio of capital expenditures to sales revenue of around 15%. The focal areas of its investments will be to extend the Yauco site for manu-facturing single-use filters and bags, as well as to combine and expand Group headquarters in Göttingen, Germany.
With regard to our financial position, we forecast that our ratio of net debt to underlying EBITDA will be slightly below the previous year's level (Dec. 31, 2017: 2.5) at the end of 2018. This ratio does not take any potential acquisitions into account.
Division Forecasts
For the Bioprocess Solutions Division, management expects significant increases for the full year of 2018 as well. The division's sales revenue is projected to grow by about 8% to 11%. The division's underlying EBITDA margin is anticipated to rise by around 0.5 of a percentage point over the prior-year figure of 28.0%.
The Lab Products & Services Division in some parts of its portfolio depends on general economic cycles. For this division, management projects that, assuming an overall stable economic environment, sales will in-crease by about 12% to 15%. The division's underlying EBITDA margin is forecasted to rise by about one per-centage point from 18.0% in the previous year.
All forecasted figures are given in constant currencies. Due to the latest currency developments, especially in the exchange rate between the U.S. dollar and the euro, our reported figures in actual currencies might differ from our constant currency guidance in which we will provide additional details during the full year of 2018.
Sustained Reduction in Tax Rate
Sartorius' corporate tax rate is expected to be reduced by about 2 percentage points to around 27% from 2018 onwards as a future effect of the U.S. tax reform approved in December 2017, which essentially lowers the U.S. corporate tax rate from 35% to 21%. Since the changes in American tax legislation are very ex-tensive, and further explanations and instructions for application by the U.S. tax authorities are still pending, this estimate is to be considered tentative.

Group Management Report Report on Material Events 67
No material events occurred after the close of fiscal 2017.
Report on Material Events

68 Group Management Report Description of the Key Features of the Internal Control Management System
In relation to the Group Accounting Process (Sec-tion 289, Subsection 4, and Section 315, Subsection 4, of the German Commercial Code [HGB])
Definitions and Elements of the Internal Control Management System at the Sartorius Group
The internal control system of Sartorius AG and the Sartorius Group encompasses all of the principles, procedures and measures adopted to ensure the or-ganizational implementation of management decisions. The main priority of the system as it relates to Sartorius AG’s and the Group’s accounting process is to make sure that accounting is effective, cost-efficient and formally correct and that it complies with the pertinent legal provisions.
The internal control system of the Sartorius AG and the Sartorius Group consists of a combination of pro-cess-integrated and non-process-integrated monitor-ing measures. The process-integrated safeguarding measures are subdivided, in turn, into organizational measures and other control measures. The Supervisory Board, specifically in this case the Audit Committee of Sartorius AG, and the Legal Affairs & Compliance unit with its Group Auditing department are involved in the Sartorius Group’s internal control system through their non-process-integrated audit activities. The Au-dit Committee regularly reviews quarterly reports besides the annual financial statements of the parent corporation and of the consolidated annual financial statements.
Moreover, to ensure systematic, early identification of risks across the entire Group, a “monitoring system for early group-wide detection of risks with the potential to jeopardize the company’s continued existence” as defined in Section 91, Subsection 2, of the German Stock Corporation Law (AktG) is in place at the Sartorius Group. The efficacy of the early risk detec-tion system, which the Sartorius Group adapts promptly in response to any relevant changes in cir-cumstances, is assessed by the independent auditors of Sartorius AG in accordance with Section 317, Subsec-tion 4, of the German Commercial Code (HGB). An integral component of this system is also operational risk management, which involves activities such as the transfer of risk to insurance companies through cover-age for damage and liability risks and the arrangement of suitable hedges to limit currency and interest rate risks.
Organizational Measures
Accounting processes are strictly organized according to the principle of segregation of functions, taking into account the “four-eyes” principle – i.e. review by two individuals. Duties and responsibilities are clearly assigned to different specialized units, companies and regional units. The separation of administrative, ex-ecutive, settlement and approval functions reduces the possibility of fraud. It also continues to play a signifi-cant role in ensuring that any possible errors are dis-covered early and any potential misconduct is prevented.
The IT applications used in the company's accounting processes have access restrictions, which allow only authorized persons to have controlled access to the accounting system and data. Each access right is as-signed specifically according to the tasks to be per-formed and will be subject to annual review in the future. Furthermore, the four-eyes principle is also applied in IT process designing and assignment of access rights.
In addition, defined written local and global operating procedures exist, particularly the Group accounting guidelines, which are regularly updated and communi-cated throughout the Group. The scope of regulation at Group level also extends to the central definition of measurement rules and parameters, among other fac-tors. Additional data for the presentation of external information in the notes to the financial statements and in the Group management report is also prepared and aggregated at Group level.
Continuous coordination of internal accounting during the year for planning and control with external ac-counting significantly contributes to the quality of Group financial reporting. Reporting itself is done through a standardized management reporting system implemented throughout the Group. This system visu-alizes all consolidation processes. Internal controls, on the one hand, and the Group auditors of Sartorius AG, on the other hand, ensure that Group financial reports are accurately generated from the consolidated Group companies' financial statements.
The employees involved in the accounting process meet qualitative standards and receive regular training. The Group Financial Reporting department assists the local units in resolving complex accounting issues, such as measuring fair value, to ensure consistent and
Description of the Key Features of the Internal Control Management System

Group Management Report Description of the Key Features of the Internal Control Management System 69
accurate reporting in the consolidated financial statements. Complex evaluations, such as actuarial reports and company valuations or purchase price allocations, are assigned to specialized service provid-ers who involve the respectively qualified in-house staff.
Control Measures
Comprehensive control activities are performed by managers and staff to ensure effective and reliable accounting. As a result, this ensures compliance with legal requirements and internal guidelines, as well as properly conducted business transactions. Examples of such control activities include the analysis of situa-tions and developments with reference to specific key indicators. Moreover, individual reporting units monthly comment on and explain special characteris-tics or variances using Group-wide standardized ana-lytical tools as the basis. Further specific control activities performed to ensure effective and reliable Group accounting encompass the analysis and, where applicable, correction of the individual financial statements submitted by the Sartorius Group compa-nies. A large number of control mechanisms already incorporated into the consolidated reporting system enable erroneous information to be identified and corrected at Group level. Impairment tests are con-ducted centrally for the specific cash-generating units, known as CGUs, from the Group's perspective to en-sure that consistent, standardized evaluation criteria are applied.
The Legal Affairs & Compliance unit annually draws up a risk-based audit plan and reviews in spot checks whether basic legal requirements and internal group guidelines are complied with for the entire control and risk management system of the Group. This monitoring function covers, in particular, auditing the functional efficiency and effectiveness of defined control measures. The results of these audits are reported directly to the Executive Board and enable any defi-ciencies determined to be corrected and the company’s internal control system (ICS) to be further enhanced.
A manual on the company's internal control system that focuses on the business processes of our company further contributes toward strengthening ICS. As a result, this manual combines all ICS-relevant require-ments that we consider of material importance into one standardized document and will be supplemented by further appropriate rules as necessary.
Qualifying Statements
The internal control and risk management system enables the complete recording, processing and evalu-ation of company-related matters, on the basis of the organizational, control and monitoring structures defined in the Sartorius Group, as well as their accu-rate presentation in Group accounting.
In particular, decisions based personal judgment, erro-neous controls, criminal acts and other circumstances that can impair the efficacy and reliability of the in-ternal control and risk management system in place cannot be ruled out, however, so even the application throughout the Group of the systems adopted cannot provide an absolute assurance as to the accurate, complete and timely recording of matters in Group accounting.
The statements made relate solely to the subsidiaries included in the consolidated financial statements of Sartorius AG, whose financial and business policies Sartorius AG can directly or indirectly determine in order to obtain benefits from their activities.

70 Group Management Report Explanatory Report of the Executive Board
On the Disclosures Pursuant to Section 289a, Subsec-tion 1, and Section 315a, Subsection 1, of the German Commercial Code (HGB)
Composition of the Issued Capital | Limitations to Voting Rights
Sartorius AG’s capital stock totals €74,800,000. It comprises 74,800,000 no par value individual bearer shares, 37,440,000 of which are ordinary shares and 37,440,000 of which are non-voting preference shares. Each share certificate repre-sents a calculated proportion of €1 of the issued capital.
The rights and obligations associated with these shares are governed by the provisions of the German Stock Corporation Law (Aktiengesetz, abbreviated “AktG”). According to the company’s Articles of Association, preference shares are entitled to a dividend payment that is one euro cent higher per share than that for ordinary shares. However, this enti-tlement to receive dividends shall be at least two euro cents per preference share. Apart from the cases provided for in Sections 140 and 141 of AktG, preference shares are non-voting. Beyond this, preference shares grant all other rights to which every shareholder is entitled.
The company holds 3,227,776 ordinary shares and 3,263,932 preference shares; these do not entitle the company to any membership rights.
Direct or Indirect Equity Ownership Exceeding 10% of Voting Rights
The community of heirs consisting of Mrs. U. Baro, resident of Munich, Germany; Mrs. C. Franken, resident of Bovenden, Germany; Mr. A. Franken, resident of Riemerling, Germany; Mr. K.-C. Franken, resident of Göttingen, Germany; and Mrs. K. Sartorius-Herbst, resident of Northeim, Germany, holds a voting percentage of approximately 50.1% in Sartorius AG (18,754,160 votes; source: according to the list of at-tendees at the Annual Shareholders’ Meeting on April 6, 2017). The decedent Horst Sartorius ordered that his will be administered by an executor. Dr. Lothar Kappich, resident of Hamburg, Germany, was appointed execu-tor to succeed Prof. Dr. Dres. h.c. Arnold Picot who unex-pectedly passed away on July 9, 2017. The executor exercises the specified voting rights at his own discretion as defined by Section 22, Subsection 1, sentence 1, item no. 6, of the German Securities Trading Act (Wertpapierhan-delsgesetz, abbreviated “WpHG”).
According to a mandatory announcement dated April 1, 2011, Bio-Rad Laboratories Inc., 1000 Alfred Nobel Drive, Hercules, California 94547, USA, to which the voting rights of Bio-Rad Laboratories GmbH, Heidemannstr. 164,
80939 Munich, Germany, are ascribed according to Sec-tion 22, Subsection 1, sentence 1, item no. 1, of WpHG, holds 30.01% of the voting rights in Sartorius AG (11,237,196 votes, taking into account the share capital increase from retained earnings that went into effect as of June 1, 2016).
Appointment and Dismissal of Executive Board Members | Amendment to the Articles of Association
Executive Board members of Sartorius AG are nominated and|or appointed as well as removed from office in accord-ance with Sections 84 et seq. of the German Stock Corpora-tion Law (AktG) and Sections 31 and 33 of the German Codetermination Law (Mitbestimmungsgesetz, abbreviated “MitBestG”). Amendments to Sartorius AG’s Articles of Association are regulated by Sections 133 and 179 of the German Stock Corporation Law (AktG).
Powers of the Executive Board to Issue Shares
Subject to approval by the Supervisory Board, the Executive Board is authorized to sell treasury shares held by the corpo-ration, including selling them through channels other than the stock exchange or by tendering an offer to all share-holders in proportion to their participation in the company, provided that these shares are transferred to third parties as contribution in kind, particularly in the (indirect) acquisition of companies, in return. Under these circumstances, the preemptive rights of the shareholders are excluded.
Material Agreements with Clauses Regulating the Event of a Change of Control
Sartorius AG has material loan agreements containing customary market clauses regulating the possible event of a change of control and giving the participating lenders the option of extraordinary termination of a particular agreement or to request complete repayment of the re-spective loan:
These are a syndicated loan agreement concluded in 2014 for a current volume of €400 million and a term until December 2021; two note loans (“Schuldschein-darlehen”), for the amount of €200 million placed in 2016 and 2017, respectively; and a €350 million note loan for a maturity term of five to ten years; two pro-motional loans, each for €90 million, concluded in 2015 and 2016 for maturity terms of 8 years; and a note loan originally for €100 and placed in 2012 for a maturity term of five to ten years. The repayment sum outstanding for these material loan agreements stands at approximately €760 million as of December 31, 2017.
Explanatory Report of the Executive Board

Group Management Report Report and Declaration on Corporate Governance 71
Corporate Governance Report
Corporate government aligned with the interests of stakeholders, lawful and responsible conduct, and constructive cooperation between the managerial bodies and within the company in a spirit of mutual trust constitute the essential cornerstones of Sartorius' corporate culture.
The Executive Board and the Supervisory Board report in the following declaration on the key aspects of corporate management and governance pursuant to § 289f of the German Commercial Code ("HGB") and to Article 3.10 of the German Corporate Governance Code.
Declaration of Compliance with Corporate Governance
Declaration of the Executive Board and of the Supervi-sory Board of Sartorius AG Concerning the Recom-mendations of the Government Commission on the German Corporate Governance Code Pursuant to § 161 of the German Stock Corporation Law ("Aktiengesetz"):
The Executive Board and the Supervisory Board declare that full compliance will be achieved with the recommen-dations made by the Government Commission on the German Corporate Governance Code and published by the German Federal Ministry of Justice in the official section of the German Federal Gazette (“Bundesanzeiger”), as amended on February 7, 2017.
Since last year’s Declaration of Compliance was issued, Sartorius AG has complied with the recommendations in the valid version of the Government Commission on the German Corporate Governance Code to the full extent.
Göttingen, December 7, 2017
For the Supervisory Board For the Executive Board
Dr. Lothar Kappich Dr. Joachim Kreuzburg
Further Remarks Concerning Corporate Governance
Sartorius AG is a joint stock corporation founded un-der German law and headquartered in Göttingen, Germany. With the Annual General Shareholders' Meeting, Supervisory Board and Executive Board, it has three corporate managerial bodies whose tasks and powers are essentially derived from the German Stock Corporation Law ("Aktiengesetz") and the company's Articles of Association.
As owners of the company, the shareholders exercise their rights at its Annual General Shareholders' Meet-ing, where they decide, in particular, on the appropria-tion of profits, measures concerning share capital, amendments to the Articles of Association, discharge of the Supervisory Board and the Executive Board and on the appointment of statutory auditors, as well as elect shareholder representatives to the Supervisory Board. The Annual General Shareholders' meeting is held at least once a year within the first eight months of the respective fiscal year. Any shareholder who registers in due time may attend the Annual General Shareholders' Meeting in person or can be represented by a proxy according to the various options provided by law.
In managing the company, the Supervisory Board and the Executive Board perform their tasks in a two-tier board structure, each with separate duties and powers.
The Supervisory Board appoints members to the Execu-tive Board, determines their remuneration and moni-tors and advises the Executive Board in its management of the company. The Supervisory Board is not authorized to take any operational management measures for the business.
The Executive Board is responsible for independently managing the company. In particular, it defines corpo-rate strategy, coordinates and agrees on this approach with the Supervisory Board and implements such cor-porate strategy. In line with established reporting obligations, the Executive Board regularly informs the Supervisory Board promptly and comprehensively, and requests the latter's approval for certain key business transactions.
Composition and Operating Mode of the Supervisory Board and Its Committees
The Supervisory Board has an equal number of share-holder representatives and employee representatives:
Report and Declaration on Corporate Governance

72 Group Management Report Report and Declaration on Corporate Governance
six shareowner representatives elected by the Annual General Shareholders' Meeting and six employee rep-resentatives elected according to the German Code-termination Law ("Mitbestimmungsgesetz"). Details on the members of the Supervisory Board and its commit-tees are provided on pages 180 to 181.
The Supervisory Board Chairman coordinates the work within this board, as well as convokes and conducts Supervisory Board meetings. Furthermore, he is the first individual for the Executive Board to contact and externally represents the matters of the Supervisory Board.
The Supervisory Board holds at least two meetings every six months; as a rule, four or more conferences take place, as required. This board has established four committees: the Executive Task Committee, the Audit Committee, the Conciliation Committee and the Nom-ination Committee. The Executive Task Committee, Audit Committee and Conciliation Committee each have four members and have an equal number of shareholder representatives and employee representa-tives. The Executive Task Committee and Audit Com-mittee hold regular meetings; the Conciliation Committee and the Nomination Committee meet only as necessary.
The Executive Task Committee carries out preparatory work for resolutions and issues to be addressed in the meetings of the Supervisory Board. It also oversees the preparations for appointments, including the remu-neration and employment contract conditions of members of the Executive Board. The Audit Committee supports the Supervisory Board in performing its su-pervisory function. The chairperson of the Audit Com-mittee is an independent member of the Supervisory Board and has detailed knowledge and extensive expe-rience in the application of accounting standards and internal control systems from his or her own profes-sional practice. The Conciliation Committee meets if the majority required in connection with the appoint-ment of members to the bodies authorized to repre-sent the company for legal purposes is not reached. The Nomination Committee comprises representatives of the shareholders only. Its function is to propose suitable candidates to the Supervisory Board for the latter’s election proposals submitted to the Annual Shareholders’ Meeting. More information on the indi-vidual meetings held in the reporting year by the Su-pervisory Board and its committees is given in the Report of the Supervisory Board on pages 12 to 15.
The Supervisory Board regularly reviews the efficiency of its work based on a questionnaire sent in advance and by a discussion of the results of this questionnaire in a plenary session.
Appointment Objectives for the Supervisory Board; Diversity Policy and Competence Profile
Members of the Supervisory Board of Sartorius AG are to be appointed such that they, on the whole, have the knowledge, skills and experience that are necessary to perform the board's duties properly.
For this purpose and based on the recommendations of the German Corporate Governance Code, the Supervi-sory Board decided on the following appointment objectives:
– Independent members shall account for no less than 25% of the Supervisory Board.
– The upper age limit of 70 at the time of election should be taken into consideration, but may be waived in exceptional cases, provided there are no reservations about the suitability of the persons proposed and their election is expedient to the interests of the company in spite of the age limit being exceeded.
– As a matter of principle, no member may serve on the Supervisory Board for longer than five elected terms. This limit can be exceeded in individual cases if the Supervisory Board does not have any reservations about the suitability of an individual for serving longer and election of this person is apparently in the interest of the company.
– Care must be taken to ensure that each Supervisory Board member has sufficient time available to perform his or her mandate.
In addition, the Supervisory Board also defined a com-petence profile for itself. This also covers aspects such as diversity, for example, with regard to professional background and international experience. In view of achieving an appropriate gender balance, the legal quotas of at least 30% women and at least 30% men apply to the Sartorius Supervisory Board. The share-holder representatives and the employee representa-tives decided to fulfill these legal targets separately.
– In its election proposals for membership, the Supervisory Board is required to consider whether candidates have international experience or an international background within the scope of its current members.
– The Supervisory Board must have members with expertise in one or several of the international markets relevant for Sartorius.

Group Management Report Report and Declaration on Corporate Governance 73
– Members of the Supervisory Board need to bring in knowledge of technologies and products relevant to the Group, as well as of digitalization, and experience in research and development, particularly in the biopharmaceutical industry.
– The Supervisory Board must have members who have expertise in setting up and developing innovative business models, as well as knowledge of corporate strategies.
– Members of the Supervisory Board need to have in-depth knowledge of financial business processes and competences in financial controlling and risk management; at least one independent member of the Supervisory Board must have expert knowledge of accounting or auditing (§ 100, Subsection 5, of AktG).
– Members of the Supervisory Board must have expertise in law, corporate governance and compliance.
– The Supervisory Board needs to have in-depth knowledge and a thorough background in issues concerning human resources.
According to the Supervisory's self-assessment, the members on its board meet the diversity and compe-tency requirements. The appointment objectives previ-ously mentioned regarding independence and the age and membership limits are also met:
Concerning the criterion of independence, this is met by all members of the Supervisory Board with one exception in the past and the present: the executor of Horst Sartorius' estate. This individual was Dr. Arnold Picot, Ph.D., until July 9, 2017, who was also the Chairman of the Supervisory Board, and is now Dr. Lothar Kappich, likewise its current Chairman. In the opinion of the Supervisory Board, an appointment as an employee representative to this board or an existing employment contract with the company alone does not preclude the independence of this member because an employee is protected by the laws in force in performing his or her duties on the Supervisory Board.
In one instance, the company diverged from the estab-lished statutory retirement age and the statutory limit of five elected terms when Dr. Arnold Picot was reelected. There were no doubts about his suitability, and his reelection was also in interest of the company in the context of his capacity as executor of Horst Sartorius' estate. Currently, there are no Supervisory Board members over the age of 70 or who have served for more than five elected terms.
In view of achieving an equal balance of gender, the Supervisory Board meets the quota of 30% set for the underrepresented gender. Since the election of mem-bers to the Supervisory Board in April 2017, seven men total (around 58%) are on the board, of whom four are shareholder representatives and three employee repre-sentatives. In addition, five women (around 42%) are members of this board, among them two representa-tives of the share owners and three representatives of the employees. As a result, the gender quota require-ments are met on both sides of Supervisory Board representation and on the full Supervisory Board itself.
The proposal of the Supervisory Board submitted to the Annual General Shareholders' Meeting for election of shareholder representatives to this board was based on the target quotas stated above.
To facilitate comparison of the appointment objectives, brief resumés of the Supervisory Board members are available on the Sartorius website.
Composition and Operating Mode of the Executive Board
The Executive Board of Sartorius AG manages the company under its own responsibility, with the goal of increasing the company's sustainable value. It develops the company's strategy, coordinates it with the Super-visory Board and ensures implementation of this strat-egy. Beyond that, the rules of procedure for the Executive Board define the legal transactions requiring approval by the Supervisory Board in order for such transactions to be effected. The Executive Board is responsible for compliance with all provisions of the law and the company's internal policies, as well as for appropriate risk management.
Decision-making by the Executive Board is done at its regular meetings, which are convoked and conducted by the Chairman. As a rule, the members of the Group Executive Committee attend these meetings, and, if required, further specialists and mangers are invited to provide advice.
The Executive Board members are jointly responsible as a collegiate body for matters of special significance. As for the board's remaining responsibilities, each member independently manages the area assigned to him or her according to the plan for allocation of areas of responsibilities, and is required to notify the Chairman of all material transactions and events.

74 Group Management Report Report and Declaration on Corporate Governance
Composition of the Executive Board, Diversity and Competency Requirements
In the opinion of the Supervisory Board, the basic qualification criteria for appointments to positions on the Executive Board are professional qualifications for heading each particular area of responsibility, a prov-en track record in the individual's career path and convincing managerial skills. In addition, the Supervi-sory Board also considers the aspect of diversity in its appointment decisions. Therefore, the Supervisory Board strives to appoint people with complementary profiles, professional and personal life experiences and in different age brackets to the Executive Board. Moreover, the latter board is required to have broad international experience.
Pursuant to the German Act on Equal Participation of Women and Men in Executive Positions in the Private and the Public Sectors (abbreviated as "German Act on Equal Participation of Women and Men" below), the Supervisory Board defined a target quota for the Ex-ecutive Board that is defined in the following section.
Disclosures Concerning the German Act on Equal Participation of Women and Men
The Sartorius Executive Board is a committee that presently consists of three members and is therefore relatively small so establishment of a rigid gender quota can be problematic. The current members of this board of Sartorius AG are male. Given that the Execu-tive Board contracts are still in force, the Supervisory Board had defined a quota of 0% up to June 30, 2022. For the current target achievement deadline by June 30, 2022, the Supervisory Board decided to ap-point at least one woman to the Executive Board.
Also regarding the appointment of women to the Executive Board of Sartorius AG, the Supervisory Board supports the activities of the Executive Board to further increase the percentage of female executives at the first two management levels in the company. The Executive Task Committee responsible and the full Supervisory Board regularly receive reports on the development of the proportions of women in senior-level management positions.
First and Second Management Levels Below the Executive Board
Disclosures Concerning the German Act on Equal Participation of Women and Men
Over the past years, the percentage of women at the first two management levels below the Executive
Board has considerably increased on the whole and is already at a comparably high level. To achieve the intended communications effect, the Executive Board had deliberately set ambitious targets for the first target achievement deadline by June 30, 2017, despite this short time horizon and the risk that these targets might not be completely met. Thus, this quota for the first management level was set at 25% and for the second level, at around 30%.
Although the percentage of women at these levels increased, both targets were not quite reached. At the end of June 2017, the proportion of women at the first management level was around 19%; that at the second level, around 28%. The reasons these targets were not met were the low fluctuation in the man-agement team and, therefore, a lower number of posi-tions to be filled, on the one hand, and consolidation of the companies acquired slightly diluted the progress achieved, on the other hand.
For the next deadline by June 30, 2022, the Executive Board resolved in the reporting year to increase the proportion of women at both levels of management below this board to around 30%.
Further Corporate Governance Practices
Risk Management
Conscientious management of commercial risks is a key principle of good corporate governance. Sartorius AG and the Group have at their disposal enterprise-wide and company-specific reporting and control systems designed to facilitate the recording, assessment and management of commercial risks. These systems are developed and adapted continuously as conditions evolve. The Executive Board informs the Supervisory Board regularly of existing risks and their development. The Audit Committee is concerned, in particular, with monitoring of the following: the accounting process including reporting; the efficacy of the internal con-trol system; risk management and the internal auditing system; compliance; and the independent statutory audit. Details on risk management are presented in the Opportunity and Risk Report.
Transparency
Sartorius AG places great importance on disclosing consistent and complete information promptly. Infor-mation about the economic position of the Group and new developments is consequently released regularly, without delay, as it becomes known in order to inform

Group Management Report Report and Declaration on Corporate Governance 75
participants in the capital market and interested members of the public at large. The annual report, first-half financial report and quarterly reports are published within the timeframes specified for this purpose. Current developments and material events are publicized as press releases and, where appropriate, ad hoc announcements. This information is usually made available in German and English simultaneously and published via suitable media and on the internet.
The chief recurring events and publications, such as the Annual General Shareholders’ Meeting, the annual report and the interim reports, are listed on a financial calendar that may be viewed at any time on the Group website.
Share Trading Activities of Supervisory and Executive Board Members
We did not receive any reports, under the applicable mandatory disclosure requirements, of any purchases or sales of shares in Sartorius AG or related financial instruments made by the members of the Executive Board and the Supervisory Board or other persons with management responsibilities or their related parties.
Supervisory Board Chairman Dr. Lothar Kappich in his capacity as executor of the estate of Horst Sartorius holds approximately 50.1% of the ordinary shares issued by the company, but otherwise no member of the Executive Board or Supervisory Board has any holding of shares or financial instruments subject to the mandatory reporting requirements that directly or indirectly exceeds 1% of the shares issued by the com-pany.
Considering the share capital increase, by use of re-tained earnings, that became effective June 1, 2016, the CEO and Chairman of the Executive Board Dr. Joachim Kreuzburg holds 100,000 ordinary shares and 100,000 preference shares in the company. These were transferred to him based on a corresponding agreement arising from his employment contract of December 18, 2015, and are subject to a minimum holding period of four years. For further information on this transfer, please see the Remuneration Report on pp. 76 et seq.
Accounting and Independent Statutory Audit
The consolidated financial statements and the Group Management Report, as well as the consolidated inter-im financial statements and reports, are prepared in accordance with the International Financial Reporting Standards (IFRS) as they are to be applied within the
EU, and according to the commercial law regulations to be applied under Section 315a, Subsection 1, of the German Commercial Code, HGB. The annual financial statements of Sartorius AG are prepared in accordance with German commercial law, HGB. The consolidated financial statements and the annual financial state-ments are prepared by the Executive Board, audited by the independent auditors elected by the Annual Gen-eral Shareholders’ Meeting and approved by the Su-pervisory Board.
It has been agreed with the independent auditors that they will notify the Supervisory Board directly of any potential disqualification or bias issues and any mate-rial findings and incidents identified during the audit. This also encompasses the corporate governance re-porting duties pursuant to § 161 of the German Stock Corporation Law (Aktiengesetz).
Basic Principles of Our Compliance Management System | Code of Conduct
With its compliance management system that is valid worldwide, Sartorius ensures that the members of its individual boards, executives and employees comply with all legal regulations and codes, and perform their activities in accordance with the company’s internal rules and guidelines. Targeted training and awareness-raising prevent any misconduct, as well as economic damage and loss of image.
Sartorius makes every effort to ensure optimal risk management by using a combination of approaches: a preventive compliance approach designed to proac-tively stop any potential breaches before they occur and a repressive compliance approach intended to continuously monitor compliance with the company's rules. These processes are closely intermeshed, creating a standardized compliance management system that aims to offer the best possible protection against potential violations of rules and regulations. Sartorius has developed a Code of Conduct as a preventive com-ponent of its compliance management system and has committed to an Anti-Corruption Code. An internal system is available for reporting any suspicious cir-cumstances involving potential compliance violations.
Further information is given in the Sustainability Report on pp. 68 et seq. and on the company’s inter-net website at www.sartorius.com.
The Supervisory Board | The Executive Board

76 Group Management Report Remuneration Report
1. Main Features of the Remuneration Plan for the Executive Board
General Information
The full Supervisory Board is responsible for establish-ing the remuneration paid to members of the Execu-tive Board of Sartorius AG. The total value of the remuneration of an Executive Board member reflects the scope of the responsibilities of the Executive Board member concerned, the Executive Board member’s personal performance, the company’s economic situa-tion and sustainable progress. In addition, the extent to which this amount of remuneration is typical is considered, taking into account peer companies and the remuneration structure in place in other areas of the company and in similar companies.
Remuneration is comprised of both fixed non-performance-based components and of variable per-formance-based components, and is reviewed annually to ensure that it remains appropriate. The variable performance-based remuneration components consist of those to be paid annually and of multi-year compo-nents intended to have a long-term incentive. Fixed non-performance-based remuneration is paid in the year in which it is granted. For 100% target achieve-ment, the variable annual and long-term performance-based components generally represent half of total remuneration, which excludes pension commitments under a defined benefit plan as well as fringe benefits.
Variable Performance-Based Remuneration
The portion of the variable performance-based remu-neration that is paid annually is based on the follow-ing weighted components: sales revenue | order intake, underlying EBITDA and the ratio of net debt to EBITDA. Minimum target achievement is required for these components. The amount to be paid out depends on the degree to which the target is achieved, which the Supervisory Board defines by setting each individual subordinate target. A cap is provided for each variable component to be paid out. Variable performance-based remuneration is calculated upon approval of the company’s annual financial statements for the respec-tive fiscal year and not settled and paid out until the following fiscal year.
Multi-year Components as Long-term Incentives
Weighted components determined by multi-year as-sessment depend on the development of consolidated net profit in a multi-year period, on the one hand, and on the development of the company’s share prices, on the other hand. Multi-year components providing a long-term incentive are based on a three-year average of consolidated net profit and on a four-year average of share prices, respectively. These components are paid out after two fiscal years for net profit and at the earliest after three fiscal years for share prices.
a) Consolidated Net Profit
For this subordinate target, the basis for assessment is the consolidated net profit after non-controlling in-terest excluding amortization (impairment of the value of intangible assets due to business combinations pursuant to IFRS 3). Target achievement for assessing annual variable remuneration in the particular year under review is based on the average taken over a period of three fiscal years, beginning with the partic-ular year under review. To smooth the amounts to be paid out, a partial payment amounting to 50% of the target achievement for the first fiscal year of each respective average period will be effected. Any over-payments as a result of these partial payments will be offset against other remuneration components once the total target achievement has been determined after the third fiscal year of an average period. A cap for this component is provided as well.
b) Phantom Stock Plan
Through the issue of shadow shares, called phantom stock, Executive Board members are treated as if they were owners of a certain number of shares in Sartori-us AG, without, however, being entitled to receive dividends. The development of the value of this phan-tom stock is linked with the development of the Sartorius share; both increases and decreases in the share price are taken into account. Later, the value of this phantom stock is assessed based on the share price at the time, and its equivalent is paid out, pro-vided that the associated conditions are met. Phantom stock cannot be traded and does not entail any share subscription rights.
According to the Sartorius phantom stock plan, each Executive Board member is credited at the beginning of every year with phantom stock units valued at an
Remuneration Report
Group Management Report Remuneration Report 77
agreed monetary sum. The value of this phantom stock can be paid out only as an entire annual tranche. Payment can be requested, at the earliest, after a period of four years and no later than after eight years.
An Executive Board member is entitled to receive payment for phantom stock units only if the share price at the time of such payment request has appre-ciated at least 7.5% per year relative to the time the phantom stock was assigned or if the share price out-performed the TecDAX as a comparative index. The phantom stock plan rules out subsequent changes to the parameters used for comparative stock valuation. The amount to be paid is capped at a maximum of 2.5 times the share price at the time the phantom stock was assigned, based in each case on the actual annual tranche concerned.
Assignment of this phantom stock and later payment of its monetary equivalent depend on the mean value calculated from the average prices of both classes of Sartorius AG share, up to the year 2015, and as of the year 2016, on the mean value calculated from the average prices of the preference share, with said prices quoted in the closing auction of Xetra trading on the Frankfurt Stock Exchange over the last 20 days of trading of the previous year or over the last 20 days of trading prior to submission of a payment request. This serves to compensate for any short-term fluctua-tions in the share prices.
Payment for phantom stock is blocked for the four weeks preceding the scheduled publication date of quarterly and preliminary year-end results and for 20 days of trading on the stock exchange following the actual publication of quarterly and preliminary year-end results. These blackout periods are intended to prevent Executive Board members' profiting from their insider knowledge.
Pension Commitments
According to the company’s remuneration policy, Executive Board members of Sartorius AG receive performance-related benefit commitments under a defined benefit plan when reappointed for the first time. In addition to including a basic pension, these commitments provide for the Executive Board member to make his own contribution from his variable earn-ings and for the company to match this contribution by a bonus amount. An Executive Board member may choose to receive such defined benefits in the form of a retirement pension for old age or as a one-time payment to cover the member’s retirement pension for old age and invalidity as well as in the form of survi-
vor’s benefits for the surviving spouse and children of the decedent.
Beyond such commitments, an Executive Board member is additionally entitled under a former company pen-sion scheme to receive performance-based retirement benefits based on the salary of a German federal civil servant classified as grade 10 of salary class B for ministry officials according to the Federal Civil Service Remuneration Act (Bundesbesoldungsgesetz). Such bene-fits are paid in the form of a retirement pension or old age and invalidity as well as in the form of survivors' benefits for the surviving spouse and children of the decedent.
After a member has turned 65, this shall be considered the regular age limit at which this member shall auto-matically be entitled to receive all such benefits.
Other Remuneration Components
The remuneration system provides that the Supervisory Board of Sartorius AG at its discretion may grant an Executive Board member special compensation based on that member's exceptional performance.
Early Termination of Executive Board Duties
In the event of any early termination of Executive Board duties, the employment contracts of Executive Board members provide for severance to be capped to a maximum of two annual salaries.
Non-competition Clause
The employment contracts provide for a post-contractual non-competition clause for a duration of two years upon termination of employment with the company. In the event that this non-competition clause is not waived or is nullified, half of the remu-neration last paid shall be granted for the duration of the non-competition period.
Fringe Benefits
Beyond the remuneration components stated above, the members of the Executive Board are each entitled to use a company car, reclaim expenses incurred on business travel and to be covered by accident insur-ance and D&O insurance as fringe benefits. D&O insurance provides for the application of a de-ductible or excess in the amount required by law.

78 Group Management Report Remuneration Report
Share-based Payment
As a rule, the remuneration policy for Executive Board members does not provide for the transfer of Sartori-us AG shares as compensation for members. An excep-tion to this policy rule was made in December 2014 for Dr. Kreuzburg, who was granted entitlement to receive share-based remuneration due to the third extension of his appointment as a member of the Executive Board and as its Chairman and CEO; please refer to Section 3 in this chapter.
2. Remuneration of the Executive Board Members in the Reporting Year
In 2017, the total remuneration for active service provided by all Executive Board members totaled €3,492 K relative to €3,299 K in 2016. Of this aggre-gate total, €1,892 K accounted for non-performance-based components as “fixed remuneration” (2016: €1,672 K) and €1,600 K for variable performance-based components and multi-year components with a long-term incentive (2016: €1,627 K). Furthermore, as part of the pension commitments to the Executive Board members, the pension service cost totaling €430 K in the reporting year was expensed, following on €393 K in the prior year.
Total Remuneration of the Executive Board Pursuant to § 314, Subsec. 1, No. 6, of the German Commercial Code (HGB)
Executive Board (total)
Dr. Joachim Kreuzburg
Rainer Lehmann(as of
March 1, 2017)
Jörg Pfirrmann(until
Feb. 28, 2017)
Reinhard Vogt
€ in K 2017 2016 2017 2016 2017 2016 2017 2016 2017 2016
Fixed remuneration 1,739 1,625 832 800 333 0 54 325 520 500
Fringe benefits1) 153 47 15 15 117 0 2 13 19 19
Fixed remuneration 1,892 1,672 847 815 450 0 56 338 539 519Variable performance-based remuneration (1 year)2) 759 850
363 418145 0 24 170 227 262
Variable multi-year components w/ long-term incentive
Consolidated net profit (3 years)3) 375 371 184 182 0 0 79 78 112 111
Phantom stock plan (4 - 8 years)4) 466 406 208 200 83 0 45 81 130 125
1,600 1,627 755 800 228 0 148 329 469 498
Total remuneration 3,492 3,299 1,602 1,615 678 0 204 667 1,008 1,017
1) The amounts contributed to D&O insurance totaling €161 K (2016: €171 K) are not included as these refer to the executive bodies of all companies of the Sartorius Group and are not allocated to the individual insurees.
2) Amount corresponds to actual target achievement 3) Amount corresponds to actual target achievement of the plan in which a fiscal year ended; i.e., for 2017, consolidated net profits for
2015 –2017 (2016: consolidated net profits for 2014–2016) 4) Fair value at the time granted
As part of the remuneration component based on the consolidated net profit of three consecutive fiscal years, each Executive Board member receives a partial compensation payment of 50% of his respective target achievement for the first fiscal year under review. Once the total target achievement has been deter-mined after the third fiscal year, final payment is then effected by deducting the particular partial payment already made. The amounts of the partial payments made in total at the end of the reporting year are shown as follows:
2017¤ in K
2016€ in K
Balance as of Jan. 1 of a fiscal year 387 311
Partial payments deducted –165 –146
Partial payments effected 169 222
Balance as of Dec. 31 of a fiscal year 391 387
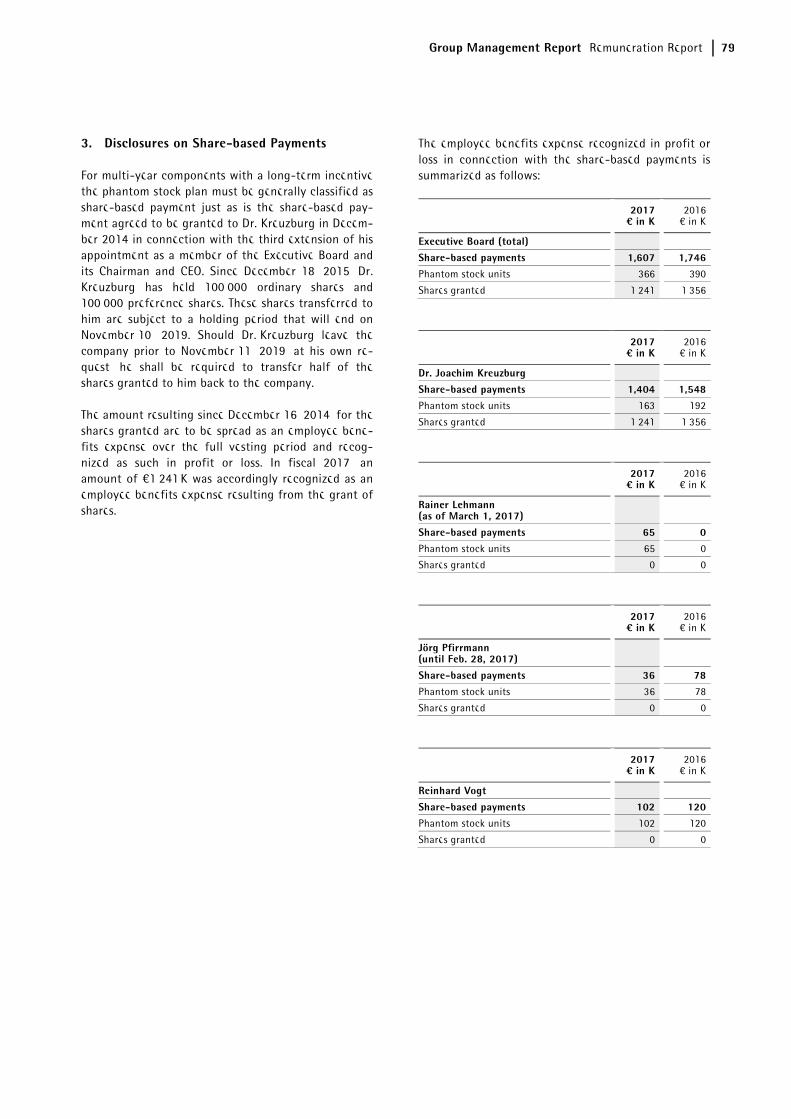
Group Management Report Remuneration Report 79
3. Disclosures on Share-based Payments
For multi-year components with a long-term incentive, the phantom stock plan must be generally classified as share-based payment just as is the share-based pay-ment agreed to be granted to Dr. Kreuzburg in Decem-ber 2014 in connection with the third extension of his appointment as a member of the Executive Board and its Chairman and CEO. Since December 18, 2015, Dr. Kreuzburg has held 100,000 ordinary shares and 100,000 preference shares. These shares transferred to him are subject to a holding period that will end on November 10, 2019. Should Dr. Kreuzburg leave the company prior to November 11, 2019, at his own re-quest, he shall be required to transfer half of the shares granted to him back to the company.
The amount resulting since December 16, 2014, for the shares granted are to be spread as an employee bene-fits expense over the full vesting period and recog-nized as such in profit or loss. In fiscal 2017, an amount of €1,241 K was accordingly recognized as an employee benefits expense resulting from the grant of shares.
The employee benefits expense recognized in profit or loss in connection with the share-based payments is summarized as follows:
2017¤ in K
2016€ in K
Executive Board (total) Share-based payments 1,607 1,746Phantom stock units 366 390
Shares granted 1,241 1,356
2017¤ in K
2016€ in K
Dr. Joachim Kreuzburg Share-based payments 1,404 1,548Phantom stock units 163 192
Shares granted 1,241 1,356
2017¤ in K
2016€ in K
Rainer Lehmann (as of March 1, 2017)
Share-based payments 65 0Phantom stock units 65 0
Shares granted 0 0
2017¤ in K
2016€ in K
Jörg Pfirrmann (until Feb. 28, 2017)
Share-based payments 36 78Phantom stock units 36 78
Shares granted 0 0
2017¤ in K
2016€ in K
Reinhard Vogt
Share-based payments 102 120Phantom stock units 102 120
Shares granted 0 0

80 Group Management Report Remuneration Report
Disclosure of Phantom Stock Units
Number of phantom
stock unitsPrice on
assignmentin €
Fair value when
granted on Jan. 1 of
the particular
year€ in K
Fair value at year-end on
Dec. 31, 2016
€ in K
Fair value at year-endon Dec. 31,
2017¤ in K
Paid in fiscal 2017
€ in K
Change in value in
fiscal 2017€ in K
Status
Dr. Joachim Kreuzburg
Tranche for fiscal 2013 9,156 17.34 159 397 0 397 0Paid out in
2017
Tranche for fiscal 2014 8,032 21.01 169 422 422 0 0 Not exercisable
Tranche for fiscal 2015 7,360 24.70 182 454 454 0 0 Not exercisable
Tranche for fiscal 2016 3,484 57.41 200 192 225 0 33 Not exercisable
Sum of the tranches from the previous years 28,032 710 1,465 1,101 397 33Tranche for fiscal 2017 2,950 70.51 208 0 163 0 –45 Not exercisable
Total sum of tranches 30,982 918 1,465 1,264 397 –12
Rainer Lehmann Tranche for fiscal 2017 1,182 70.51 83 0 65 0 –18 Not exercisable
Total sum of tranches 1,182 83 0 65 0 –18
Jörg Pfirrmann
Tranche for fiscal 2013 3,960 17.34 69 172 0 172 0Paid out in
2017
Tranche for fiscal 2014 3,452 21.01 73 181 181 0 0 Not exercisable
Tranche for fiscal 2015 3,140 24.70 78 194 194 0 0 Not exercisable
Tranche for fiscal 2016 1,416 57.41 81 78 91 0 13 Not exercisable
Sum of the tranches from the previous years 11,968 301 625 466 172 13
Tranche for fiscal 2017 644 70.51 45 0 36 0 –9 Not exercisable
Total sum of tranches 12,612 346 625 502 172 4
Reinhard Vogt
Tranche for fiscal 2013 5,588 17.34 97 242 0 242 0Paid out in
2017
Tranche for fiscal 2014 4,880 21.01 103 256 256 0 0 Not exercisable
Tranche for fiscal 2015 4,456 24.70 110 275 275 0 0 Not exercisable
Tranche for fiscal 2016 2,176 57.41 125 120 140 0 20 Not exercisable
Sum of the tranches from the previous years 17,100 435 893 671 242 20
Tranche for fiscal 2017 1,844 70.51 130 0 102 0 –28 Not exercisable
Total sum of tranches 18,944 565 893 773 242 –8
The number of phantom stock units granted as well as the particular grant prices were adjusted to the proportions following the stock split executed in 2016.
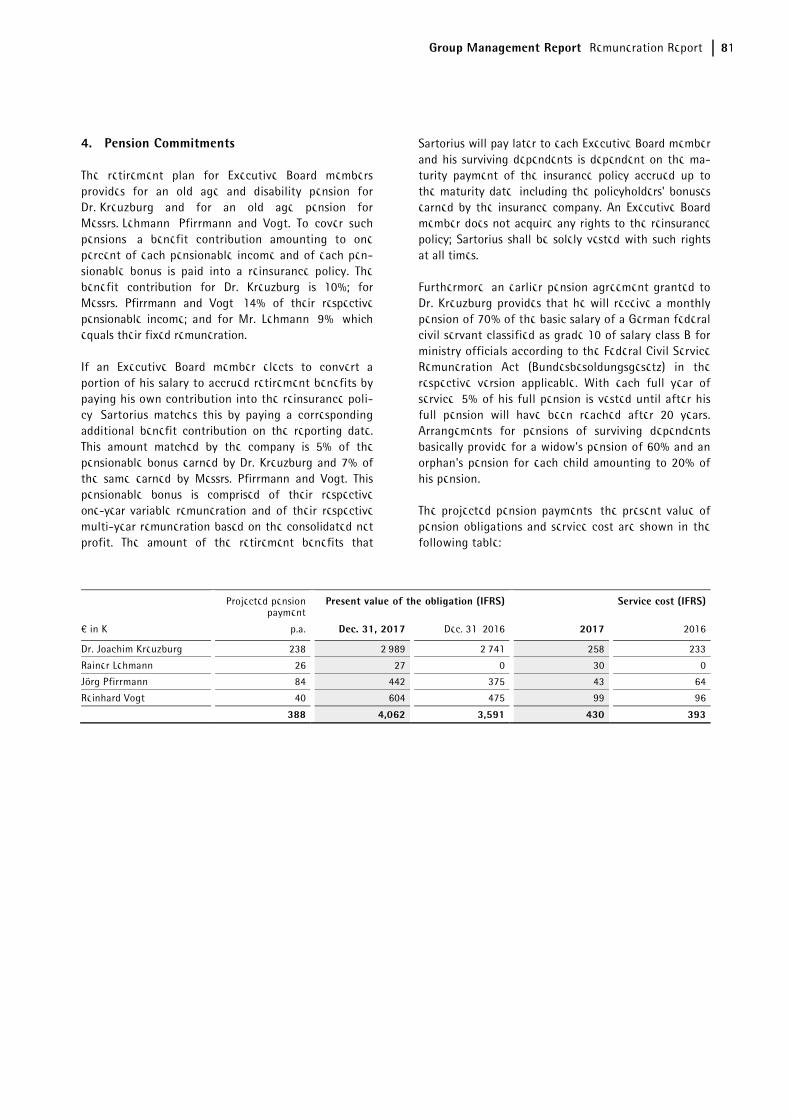
Group Management Report Remuneration Report 81
4. Pension Commitments
The retirement plan for Executive Board members provides for an old age and disability pension for Dr. Kreuzburg and for an old age pension for Messrs. Lehmann, Pfirrmann and Vogt. To cover such pensions, a benefit contribution amounting to one percent of each pensionable income and of each pen-sionable bonus is paid into a reinsurance policy. The benefit contribution for Dr. Kreuzburg is 10%; for Messrs. Pfirrmann and Vogt, 14% of their respective pensionable income; and for Mr. Lehmann, 9%, which equals their fixed remuneration.
If an Executive Board member elects to convert a portion of his salary to accrued retirement benefits by paying his own contribution into the reinsurance poli-cy, Sartorius matches this by paying a corresponding additional benefit contribution on the reporting date. This amount matched by the company is 5% of the pensionable bonus earned by Dr. Kreuzburg and 7% of the same earned by Messrs. Pfirrmann and Vogt. This pensionable bonus is comprised of their respective one-year variable remuneration and of their respective multi-year remuneration based on the consolidated net profit. The amount of the retirement benefits that
Sartorius will pay later to each Executive Board member and his surviving dependents is dependent on the ma-turity payment of the insurance policy accrued up to the maturity date, including the policyholders' bonuses earned by the insurance company. An Executive Board member does not acquire any rights to the reinsurance policy; Sartorius shall be solely vested with such rights at all times.
Furthermore, an earlier pension agreement granted to Dr. Kreuzburg provides that he will receive a monthly pension of 70% of the basic salary of a German federal civil servant classified as grade 10 of salary class B for ministry officials according to the Federal Civil Service Remuneration Act (Bundesbesoldungsgesetz) in the respective version applicable. With each full year of service, 5% of his full pension is vested until after his full pension will have been reached after 20 years. Arrangements for pensions of surviving dependents basically provide for a widow's pension of 60% and an orphan's pension for each child amounting to 20% of his pension.
The projected pension payments, the present value of pension obligations and service cost are shown in the following table:
Projected pension payment
Present value of the obligation (IFRS) Service cost (IFRS)
€ in K p.a. Dec. 31, 2017 Dec. 31, 2016 2017 2016
Dr. Joachim Kreuzburg 238 2,989 2,741 258 233
Rainer Lehmann 26 27 0 30 0
Jörg Pfirrmann 84 442 375 43 64
Reinhard Vogt 40 604 475 99 96
388 4,062 3,591 430 393

82 Group Management Report Remuneration Report
5. Disclosures Required by the German Corporate Governance Code (DCGK)
The following table shows the benefits granted for the year 2017, including the fringe benefits and the at-tainable maximum and minimum remuneration for the variable remuneration components in line with the requirements of the DCGK of lit. 4.2.5 of February 2017:
Dr. Joachim Kreuzburg Rainer Lehmann(as of March 1, 2017)
Jörg Pfirrmann(until Feb. 28, 2017)
Reinhard Vogt
Benefits granted € in K
2017 (min)
2017 (max) 2017 2016
2017 (min)
2017 (max) 2017 2016
2017 (min)
2017 (max) 2017 2016
2017 (min)
2017 (max) 2017 2016
Fixed remuneration 832 832 832 800 333 333 333 0 54 54 54 325 520 520 520 500
Fringe benefits 15 15 15 15 117 117 117 0 2 2 2 13 19 19 19 19
Total non-performance-based remuneration 847 847 847 815 450 450 450 0 56 56 56 338 539 539 539 519Variable performance-based remuneration (1 year) 0 499 416 400 0 200 167 0 0 32 27 163 0 312 260 250
Variable multi-year components w/ long-term incentive
Consolidated net profit (2017 - 2019) 0 250 208 0 100 83 0 54 45 0 156 130
Consolidated net profit (2016 - 2018) 200 0 81 125
Phantom stock plan 2017 (holding period 2017 - 2020) 0 520 208 0 208 83 0 113 45 0 325 130
Phantom stock plan 2016 (holding period 2016 - 2019) 200 0 81 125
847 2,116 1,679 1,615 450 958 783 0 56 255 173 663 539 1,332 1,059 1,019Post-employment benefits 258 258 258 233 30 30 30 0 43 43 43 64 99 99 99 96
Total remuneration 1,105 2,374 1,937 1,848 480 988 813 0 99 298 216 727 638 1,431 1,158 1,115

Group Management Report Remuneration Report 83
The inflows of the various remuneration components in the reporting year are shown in the following table:
Dr. Joachim Kreuzburg Rainer Lehmann(as of March 1, 2017)
Jörg Pfirrmann(until Feb. 28, 2017)
Reinhard Vogt
Benefits received € in K
2017 2016 2017 2016 2017 2016 2017 2016
Fixed remuneration 832 800 333 0 54 325 520 500
Fringe benefits 1) 15 15 117 0 2 13 19 19
Total non-performance-based remuneration 847 815 450 0 56 338 539 519
Variable performance-based remuneration (1 year)1) 363 418 145 0 24 170 227 262
Variable multi-year components w/ long-term incentive
Consolidated net profit (2015 - 2017)1) 184 0 79 112
Consolidated net profit (2014 - 2016)1) 182 0 78 111
Phantom stock plan 20132) 397 0 172 242
Phantom stock plan 20122) 365 0 160 223
1,791 1,780 595 0 331 746 1,120 1,115Post-employment benefits 258 233 30 0 43 64 99 96
Total remuneration 2,049 2,013 625 0 374 810 1,219 1,211
1) Amount equal to actual target achievement 2) Paid out in the fiscal year
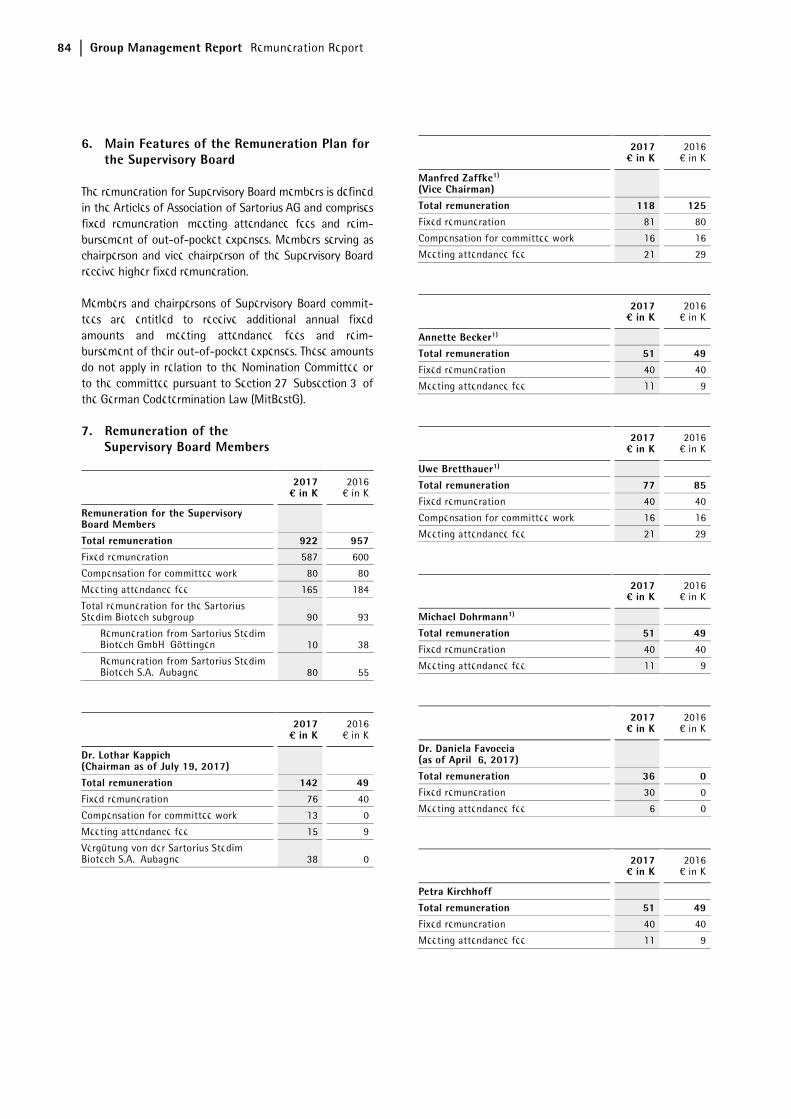
84 Group Management Report Remuneration Report
6. Main Features of the Remuneration Plan for the Supervisory Board
The remuneration for Supervisory Board members is defined in the Articles of Association of Sartorius AG and comprises fixed remuneration, meeting attendance fees and reim-bursement of out-of-pocket expenses. Members serving as chairperson and vice chairperson of the Supervisory Board receive higher fixed remuneration.
Members and chairpersons of Supervisory Board commit-tees are entitled to receive additional annual fixed amounts and meeting attendance fees and reim-bursement of their out-of-pocket expenses. These amounts do not apply in relation to the Nomination Committee or to the committee pursuant to Section 27, Subsection 3, of the German Codetermination Law (MitBestG).
7. Remuneration of the Supervisory Board Members
2017¤ in K
2016€ in K
Remuneration for the Supervisory Board Members
Total remuneration 922 957Fixed remuneration 587 600
Compensation for committee work 80 80
Meeting attendance fee 165 184
Total remuneration for the Sartorius Stedim Biotech subgroup 90 93
Remuneration from Sartorius Stedim Biotech GmbH, Göttingen 10 38
Remuneration from Sartorius Stedim Biotech S.A., Aubagne 80 55
2017¤ in K
2016€ in K
Dr. Lothar Kappich (Chairman as of July 19, 2017)
Total remuneration 142 49Fixed remuneration 76 40
Compensation for committee work 13 0
Meeting attendance fee 15 9
Vergütung von der Sartorius Stedim Biotech S.A., Aubagne 38 0
2017¤ in K
2016€ in K
Manfred Zaffke1)
(Vice Chairman)
Total remuneration 118 125Fixed remuneration 81 80
Compensation for committee work 16 16
Meeting attendance fee 21 29
2017¤ in K
2016€ in K
Annette Becker1)
Total remuneration 51 49Fixed remuneration 40 40
Meeting attendance fee 11 9
2017¤ in K
2016€ in K
Uwe Bretthauer1)
Total remuneration 77 85Fixed remuneration 40 40
Compensation for committee work 16 16
Meeting attendance fee 21 29
2017¤ in K
2016€ in K
Michael Dohrmann1)
Total remuneration 51 49Fixed remuneration 40 40
Meeting attendance fee 11 9
2017¤ in K
2016€ in K
Dr. Daniela Favoccia (as of April 6, 2017)
Total remuneration 36 0Fixed remuneration 30 0
Meeting attendance fee 6 0
2017¤ in K
2016€ in K
Petra Kirchhoff Total remuneration 51 49Fixed remuneration 40 40
Meeting attendance fee 11 9
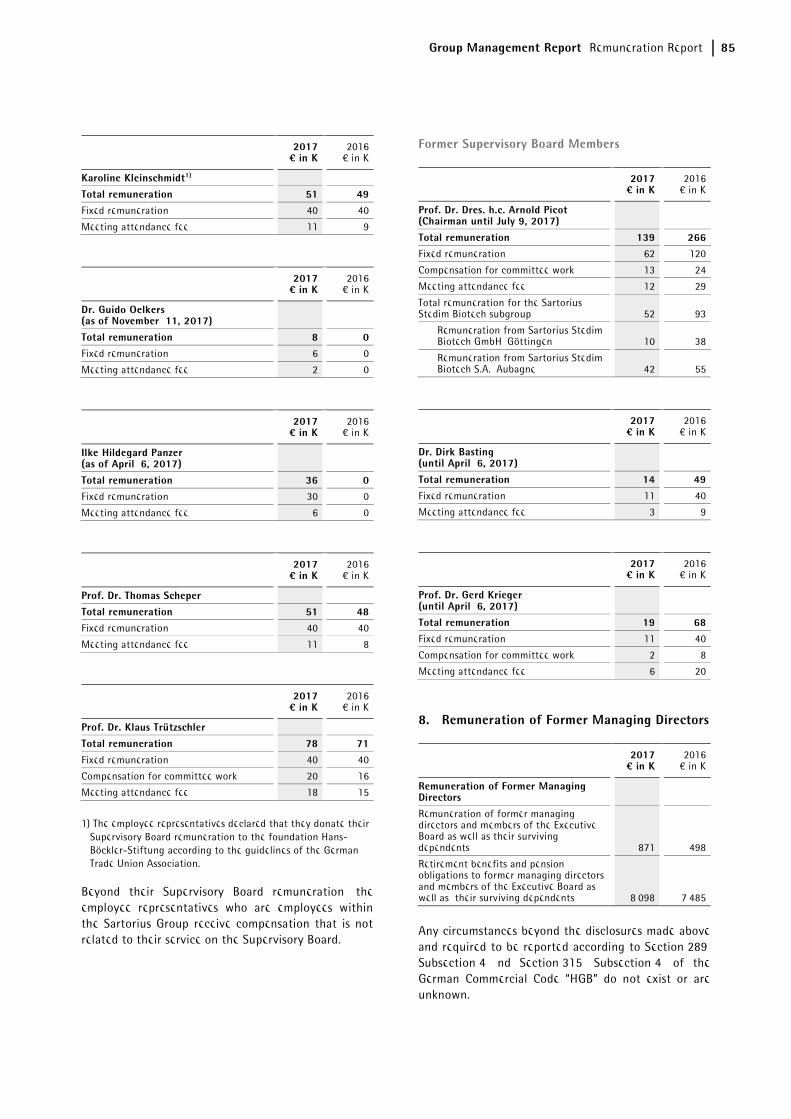
Group Management Report Remuneration Report 85
2017¤ in K
2016€ in K
Karoline Kleinschmidt1)
Total remuneration 51 49Fixed remuneration 40 40
Meeting attendance fee 11 9
2017¤ in K
2016€ in K
Dr. Guido Oelkers (as of November 11, 2017)
Total remuneration 8 0Fixed remuneration 6 0
Meeting attendance fee 2 0
2017¤ in K
2016€ in K
Ilke Hildegard Panzer (as of April 6, 2017)
Total remuneration 36 0Fixed remuneration 30 0
Meeting attendance fee 6 0
2017¤ in K
2016€ in K
Prof. Dr. Thomas Scheper Total remuneration 51 48Fixed remuneration 40 40
Meeting attendance fee 11 8
2017¤ in K
2016€ in K
Prof. Dr. Klaus Trützschler
Total remuneration 78 71Fixed remuneration 40 40
Compensation for committee work 20 16
Meeting attendance fee 18 15
1) The employee representatives declared that they donate their Supervisory Board remuneration to the foundation Hans-Böckler-Stiftung according to the guidelines of the German Trade Union Association.
Beyond their Supervisory Board remuneration, the employee representatives who are employees within the Sartorius Group receive compensation that is not related to their service on the Supervisory Board.
Former Supervisory Board Members
2017¤ in K
2016€ in K
Prof. Dr. Dres. h.c. Arnold Picot (Chairman until July 9, 2017)
Total remuneration 139 266Fixed remuneration 62 120
Compensation for committee work 13 24
Meeting attendance fee 12 29
Total remuneration for the Sartorius Stedim Biotech subgroup 52 93
Remuneration from Sartorius Stedim Biotech GmbH, Göttingen 10 38
Remuneration from Sartorius Stedim Biotech S.A., Aubagne 42 55
2017¤ in K
2016€ in K
Dr. Dirk Basting (until April 6, 2017)
Total remuneration 14 49Fixed remuneration 11 40
Meeting attendance fee 3 9
2017¤ in K
2016€ in K
Prof. Dr. Gerd Krieger (until April 6, 2017)
Total remuneration 19 68Fixed remuneration 11 40
Compensation for committee work 2 8
Meeting attendance fee 6 20
8. Remuneration of Former Managing Directors
2017¤ in K
2016€ in K
Remuneration of Former Managing Directors
Remuneration of former managing directors and members of the Executive Board as well as their surviving dependents 871 498
Retirement benefits and pension obligations to former managing directors and members of the Executive Board as well as their surviving dependents 8,098 7,485
Any circumstances beyond the disclosures made above and required to be reported according to Section 289, Subsection 4, nd Section 315, Subsection 4, of the German Commercial Code “HGB” do not exist or are unknown.