Embed Size (px)
Citation preview

1
Combined atomic force microscopy and optical
tweezers (AFM/OT): a hybrid double-probe
technique
F. Pierini*, K. Zembrzycki, P. Nakielski, S. Pawłowska and T. A. Kowalewski Department of Mechanics and Physics of Fluids, Institute of Fundamental Technological Research,
Polish Academy of Sciences, 02-106 Warsaw, ul. Pawinskiego 5B, Poland
* e-mail: [email protected]
Keywords: atomic force microscopy/optical tweezers, optical trap stiffness calibration, force
measurments, trap force, nanomanipulation
Abstract. The role of mechanical properties is essential to understand molecular, biological materials and
nanostructures dynamics and interaction processes. Atomic force microscopy (AFM) is the most commonly used
method of direct force evaluation, but due to its technical limitations this single probe technique is unable to
detect forces with femtonewton resolution. In this paper, we present the development of a combined atomic force
microscopy and optical tweezers (AFM/OT) instrument. The focused laser beam, on which optical tweezers is
based, provides us with the ability to manipulate small dielectric objects and to use it as a high spatial and
temporal resolution displacement and force sensor in the same AFM scanning zone. We demonstrate the
possibility to improve the AFM force resolution and to build a hybrid double probe technique with high potential
in nanomechanics, molecules manipulation and biological studies. AFM/OT equipment is fully described and
characterized by studying the ability to trap dielectric objects and quantifying the detectable and applicable
forces. The setting and sensitivity of the particle position detector has been shown. Finally, a comparison
between different optical tweezers calibration methods is presented.

2
1. Introduction
Force has a crucial role in physical, chemical and biological processes. The knowledge of
mechanical forces involved in single molecules, nanomaterials and biological objects
activities is fundamental in understanding their structure, function and behavior. The study of
forces involved in molecular and nanomaterial interactions represents one of the most
interesting contemporary challenges. Several techniques have been recently used to measure
directly the forces required to unbind molecules, the surface forces responsible for
nanoparticle stability, and to quantify mechanical properties of biological tissues and cells.
Over the last few decades atomic force microscopy (AFM) has been the technique most
frequently used to measure interaction forces of molecules and nanomaterials [1]. AFM is an
evolution of scanning tunneling microscope (STM) that immediately gained popularity thanks
to its ability to analyze soft and electrically non-conductive material [2]. Initially, AFM was
developed for nanoscale imaging purposes, where a topographical reconstruction is obtained
by scanning the sample surface using a tip fixed on a flexible cantilever Thanks to the
technical development of AFM instrumentation, such as the introduction of the piezoelectric
stage and microfabricated cantilevers, remarkable improvements in force measurements have
been achieved [3,4]. On the other hand, atomic force microscopy has limited use for
examining small forces because its sensitivity is strictly dependent on the laser beam
properties and the mechanical property of the probe [5]. If a soft cantilever with small spring
constants in the range of 0.1–0.01 N/m is used, the typical detectable force range is between
10 piconewton (pN) and 104 pN, with a spatial and temporal resolution and stiffness from 0.5
nanometer (nm) to 1 nm, 10-3 s and 10 - 105 pN/nm, respectively [6]. Due to these technical
limitations, AFM is of limited usefulness in the study of the dynamic of processes in which

3
very low forces are involved (typically on the order of few femtonewtons). Few techniques
have successfully been developed to measure the force under the lower limit of detection
(LOD) of AFM in the last few years. Among them, optical tweezers stand out for their high
resolution and flexibility [6]. Optical tweezers are a technique capable of trapping small
particles using the forces generated by laser radiation pressure. The concept of pressure from
the propagation of light is at the core of optical tweezers technology and was hypothesized
several centuries ago. Arthur Ashkin is the developer of ‘single-beam gradient force trap’, the
technique that we now call optical tweezers [7]. He was able to demonstrate that it is possible
to apply forces in the piconewton scale on small dielectric microspheres by focused laser
beams using a high numerical aperture microscope objective [8].
One of the fundamental requirements of this system is the use of particles having a higher
index of refraction than their neighboring medium. The index of refraction ratios should be
higher than 1.1. According to Snell`s law, when the light coming from a medium passes into a
dielectric material with low refractive index the rays are deflected.
The typical optical tweezers configuration where a focused laser beam passes through a
polystyrene microparticle with higher diameter than the incident light wavelength (d > λ) is
schematized in Figure 1.

4
Figure 1. Schematic diagram showing the optical tweezers ray optics model. A transparent polystyrene
microparticle is illuminated by a focused Gaussian laser beam. The forces on the dielectric spherical bead due to
scattering and refraction of light rays are balanced. Inset is a graphical representation of the influence of the
index of refraction in the deflection of rays at the water-particle interface and the splitting of incident ray in two
component: scattered ray and refracted ray.
The force due to the scattering pushes the bead in the same direction as the light propagation,
the gradient forces due to the refraction pull the bead in the opposite direction. Because of the
refraction and the scattering of the rays the polystyrene bead is attracted to the point where the
light is focused. If an external force pushes the particle away from the centre of the trap, the
refracted light path changes and the gradient force, due to the change of the momentum,

5
replaces the sphere into the initial position [9]. Optical tweezers are a highly sensitive system,
using this instrument it is possible to detect subnanometer displacements and femtonewton
forces [10].
The trap force applied by the optical tweezers to the trapped particle behaves as a harmonic
spring and can be described by the following equation (1)
F= k x (1)
where F is the applied force, x is the particle displacement from the centre of the trap and k is
the spring constant. In order to use optical tweezers as a quantitative force sensor it is
necessary to calibrate the trap stiffness measuring the displacement of a sphere in the trap
when known external forces are applied to the particle [11].
The ability to manipulate single molecules, attached to trapped micro or nanoparticles, with
high resolution and to measure forces with femtonewton accuracy opened the way to the
study of several important new topics [12 -14]. Biologists were able to take immediate
advantage of optical tweezers using this apparatus as a tool to study several biological
systems and single molecules [15, 16]. Optical tweezers have been used for single molecule
studies of biopolymers, where a single molecules of DNA, RNA or protein has been twisted,
stretched [17] and unfolded to measure its mechanical properties [18]. Furthermore, the
growing interest in biophysics and the need to study DNA properties in greater details have
prompted the researchers to develop advanced experiments in which OT has been coupled
with scanning probe microscopy [19, 20]. Optical tweezers have been used in studying
intracellular organelles movement [21], in cell sorting [22] and flow virometry [23].

6
Over the years the use of optical tweezers has been opening new perspectives in several
branches of physics. Optical tweezers have been used to study the movement of micro and
nanoparticles in colloidal systems at different timescales starting from Brownian to ballistic
motion [24] and the rotation of non-symmetric objects [25]. Optical trap can also be used to
calculate the impact of surface modification on surface forces and drag coefficients of
nanoparticles [26], to study rheology and the forces involved in single particle collisions and
aggregation [27 - 30].
The aim of the present work is to demonstrate the possibility of extending the capability of a
commercial AFM system by combining it with optical tweezers. It permits to obtain a high-
quality imaging instrument able to trap and modify nanometric materials and to measure force
in the subpiconewton scale. In this perspective, we have designed, built and calibrated an
integrated AFM-optical tweezers apparatus. An exhaustive description of the AFM-optical
tweezers setup is given in this article. We proved the instrument performance that allows us to
manipulate single polystyrene particles. We analysed the quadrant photodiode detector noise
and its response to the displacement of a particle from the centre of the trap. The movement of
the piezo stage was used to measure the optical tweezers behaviour and to calculate trapping
force using the drag-force calibration method. The calibration procedure was confirmed by
comparing the previously obtained results, from the external force calibration, with those
achieved using the equipartition method. The knowledge of optical trap stiffness is
fundamental in single molecules, biological and single colloidal object studies to provide a
comprehensive quantitative value of the forces involved in molecules and nanomaterials
interactions.
An experiment in which the OT/AFM system was used to create a multi-particles structure,
allowed us to prove the proposed instrument capability of acting as a nanomanipulator and to

7
scan the produced structure with the AFM probe at the same time, generating a high
resolution image of the manipulated sample. Finally, the instrument capability to detect forces
with femtonewton accuracy using AFM and OT probes simultaneously was proved by
analysing the interaction forces acting between single polystyrene particles in different
environmental conditions.
2. Experimental setup and Materials
2.1 Optical Tweezers setup
A hybrid AFM-optical tweezers apparatus capable of trapping a single micrometric object and
to measure forces with femtonewton resolution was built. Our optical tweezers instrument is
based on the inverted microscope (IX71, Olympus Optical Co. Ltd, Tokyo, Japan) of an AFM
system (Ntegra Spectra, NT-MDT, Limerick, Ireland). A Nd:YAG 2W diode pumped laser
(Cobolt Rumba CW 1064 nm DPSSL, Cobolt, Solna, Sweden) combined with a series of
dichroic mirrors, filters, beam expanders is employed to create an optical trap that could
confine single objects in colloidal systems. Several factors contributed to the choice of
trapping laser wavelength. Usually, biological matter like living cells has relative transparency
in the near infrared region. Studies on cells have shown that the interaction with a laser beam
in the range of wavelengths of 800 nm to 1100 nm does not affect cell growth [31]. A
Nd:YAG laser source, able to generate a 1064 nm wavelength Gaussian beam, was chosen
because it provides the suitable power, wavelength and profile to trap colloidal particles and
biological material avoiding heat-related damage.
Three lasers are employed in these studies. These are 532 nm (laser source 1), 1064 nm (laser
source 2), and 633 nm (laser source 3) in wavelengths (Figure 2). The infrared laser path uses

8
several mirrors to direct the beam into the objective aperture. A series of elements including
half-wave plate 1, polarizer and a photodiode are used as a power regulator in order to
generate a suitable beam to trap the object. The laser beam passes through a beam expander to
form its appropriate diameter. The oil-immersion objective used (UPlanFl, Olympus Optical
Co. Ltd, Tokyo, Japan) has a 100X magnification and a numerical aperture of 1.30. The back
aperture of the microscope objective is overfilled by the Gaussian laser beam in order to
generate a stable trap. A piezo stage is placed over the objective. Here the sample can be
located in a suitable position to trap a single particle in three dimensional space near the focal
point. Between the beam expander and the back aperture of the objective lens are five mirrors
which provide necessary beam adjustments. There are, in addition, two other laser sources.
The green 532 nm wavelength laser (Laser Source 1, NL202, Ekspla, Vilnius, Lithuania) is
used to excite fluorescent materials for imaging purposes. Beam expander 1 is used to
optimize the laser beam diameter and a series of mirrors to direct the beam to the sample
using the same pathway as the trapping beam after the dichroic mirror 4. The images obtained
using white light as well as those generated from the interaction between the fluorescent
samples and the 532 nm laser beam are captured by the CMOS camera (HiCAM
500; Lambert Instruments, Leutingewolde, The Netherlands). An additional filter 1 is placed
between the sample and the CMOS camera in order to filter out the scattered laser light
interference from the resulting image.
The 633 nm red laser (Laser source 3, 25 LHP 991, Melles Griot, Irvine, California, USA) is
the core of our most sensitive detection system. A series of mirrors guide the red laser beam to
the back aperture of the objective and to the trapped particle, partly sharing pathway of the
532 nm and 1064 nm lasers. The backscattered light travels along the same optical path as the
incident beam. Dichroic mirror 1 and mirror 3 allow the transmission of all the components
9
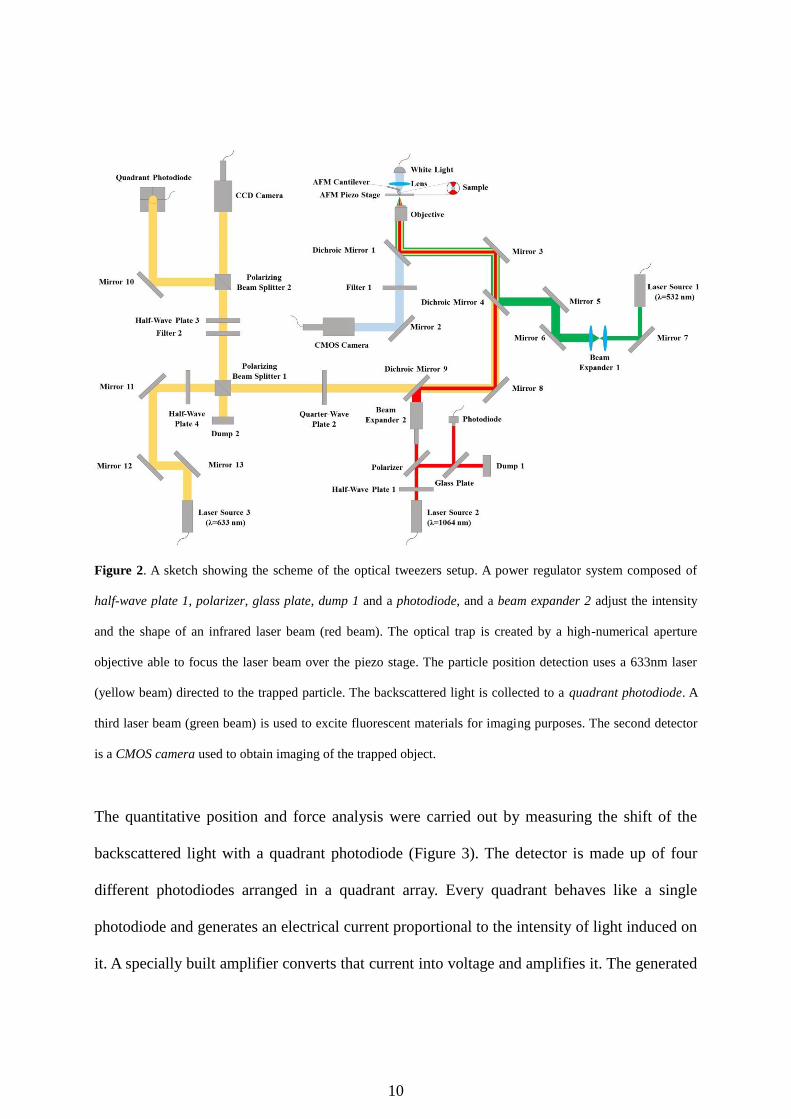
of the rays in the opposite direction of the incident beam but dichroic mirror 4 filters out the
green light. The backscattered beam arrives to the filter 2 passing through a mirror 8, dichroic
mirror 9, quarter-wave plate 2 and polarizing beam splitter 1, where the infrared radiation is
filtered out. The CCD camera (CV-M10 RS, JAI, Yokohama, Japan) is used to get particle
scattering images. The backscattered 633 nm laser light from the trapped particle is imaged
onto a quadrant photodiode (QPD, S4349, Hamamatsu Photonics Inc., Hamamatsu, Japan) to
evaluate position of the trapped object. For a particle perfectly centred in the trap, the
resulting backscattered beam is directed to the middle of the quadrant photodiode. If the bead
is displaced, the retracted beam points far from the centre of the detector. The quarter- and
half-wave plates are used to generate a circularly polarized Gaussian beam and to control the
detection laser power.
The base of our optical tweezers is an inverted microscope which is part of an atomic force
microscope. This set-up allows us to combine optical tweezers with AFM. The AFM piezo
stage controlled by a computer gives the opportunity to displace the trapped particle and to
control sample position with subnanometer accuracy. In order to decrease mechanical
perturbations the instrument is mounted on an optical table with active vibration isolation. A
computer is used to control the piezo stage movements, the light power and to collect and
analyse numerical data.
10
Figure 2. A sketch showing the scheme of the optical tweezers setup. A power regulator system composed of
half-wave plate 1, polarizer, glass plate, dump 1 and a photodiode, and a beam expander 2 adjust the intensity
and the shape of an infrared laser beam (red beam). The optical trap is created by a high-numerical aperture
objective able to focus the laser beam over the piezo stage. The particle position detection uses a 633nm laser
(yellow beam) directed to the trapped particle. The backscattered light is collected to a quadrant photodiode. A
third laser beam (green beam) is used to excite fluorescent materials for imaging purposes. The second detector
is a CMOS camera used to obtain imaging of the trapped object.
The quantitative position and force analysis were carried out by measuring the shift of the
backscattered light with a quadrant photodiode (Figure 3). The detector is made up of four
different photodiodes arranged in a quadrant array. Every quadrant behaves like a single
photodiode and generates an electrical current proportional to the intensity of light induced on
it. A specially built amplifier converts that current into voltage and amplifies it. The generated
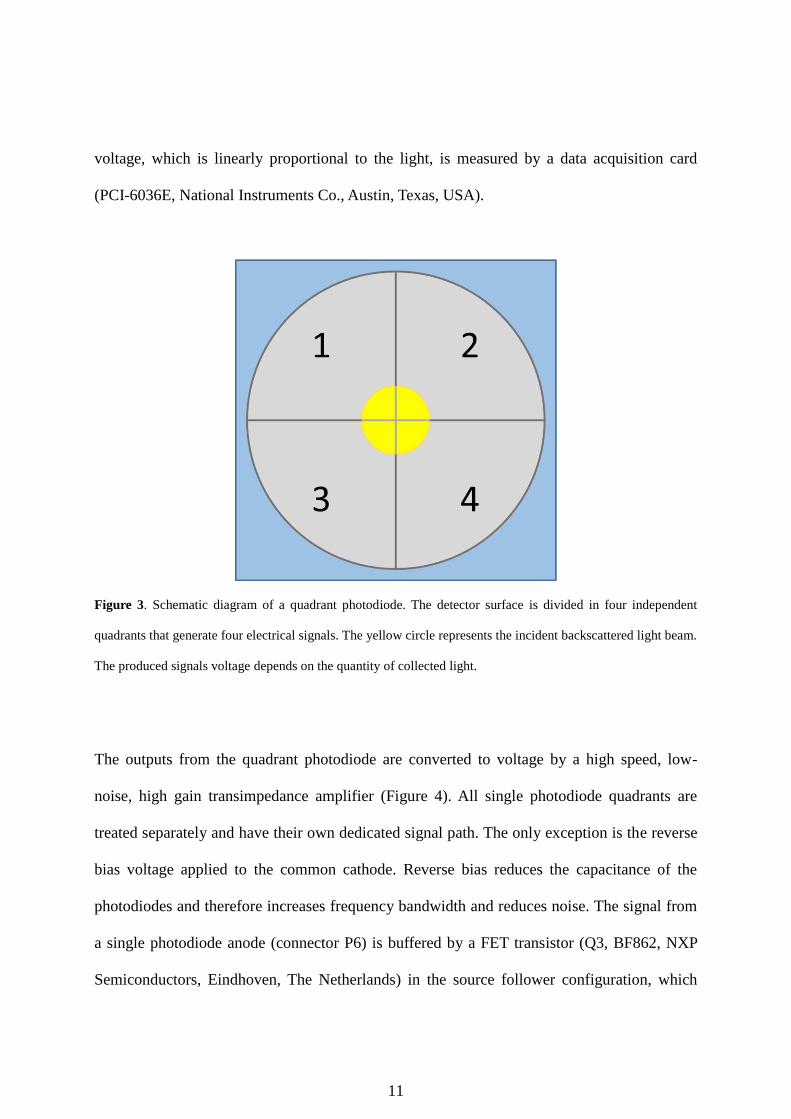
11
voltage, which is linearly proportional to the light, is measured by a data acquisition card
(PCI-6036E, National Instruments Co., Austin, Texas, USA).
Figure 3. Schematic diagram of a quadrant photodiode. The detector surface is divided in four independent
quadrants that generate four electrical signals. The yellow circle represents the incident backscattered light beam.
The produced signals voltage depends on the quantity of collected light.
The outputs from the quadrant photodiode are converted to voltage by a high speed, low-
noise, high gain transimpedance amplifier (Figure 4). All single photodiode quadrants are
treated separately and have their own dedicated signal path. The only exception is the reverse
bias voltage applied to the common cathode. Reverse bias reduces the capacitance of the
photodiodes and therefore increases frequency bandwidth and reduces noise. The signal from
a single photodiode anode (connector P6) is buffered by a FET transistor (Q3, BF862, NXP
Semiconductors, Eindhoven, The Netherlands) in the source follower configuration, which

12
provides high input impedance which is essential in measuring low current signals. The high
speed, low noise operational amplifier (U10, AD817, Analog Devices Inc., Norwood,
Massachusetts, USA), in an inverting configuration, along with a negative feedback loop
formed by resistor R41, amplifies and converts the photodiode current into voltage that is
proportional to the light intensity. The capacitor C64 along with the resistor divider formed by
R42 and R39 compensate for the photodiode capacitance and provide stability to the feedback
loop. Direct current accuracy of the system is achieved by an additional low noise, high
accuracy, operational amplifier (U8, OP177, Analog Devices Inc., Norwood, Massachusetts,
USA), which drives the non-inverting input of U10, and therefore compensates its error. The
offset voltage of the whole amplifier is adjusted to zero by means of the RV3 multi-turn
potentiometer. The bandwidth of this circuit is set to 50 KHz to match the bandwidth of the
acquisition card.

13
Figure 4. A diagram showing the optical signal detecting circuit for one single quadrant of QPD. The signal
from the diode is modified by a transimpedance amplifier to calculate the relative position of the backscattered
incident light beam in the QPD sensor. The whole optical signal detecting circuit consists of four photodiodes.
The detector produces two different output signals (Sx and Sy) made by combining the current
generated by the four photodiodes (V1, V2, V3, V4). The Sx and Sy output signals are obtained
from equations (2), (3), (4) and (5) as

14
Vx= (V2+V4) – (V1+V3) (2)
Vy= (V1+V2) – (V3+V4) (3)
Sx= Vx / (V1+V2+V3+V4) (4)
Sy= Vy / (V1+V2+V3+V4) (5)
Sx and Sy are proportional to the X and Y position of the incident beam. If the particle is
perfectly centred in the optical trap the laser beam is reflected on the centre of the quadrant
photodiode and the output signals values are zero.
The instrumental parameters control and data acquisitions are performed by LabVIEW
(LabVIEW Professional Development System 2013 Version 13.0f2 32bit,
National Instruments Co., Austin, Texas, USA), Nova (Nova, NT-MDT, Limerick, Ireland)
and the supplied camera software. The collected data are exported to Matlab (Matlab 8.3
R2014a, The MathWorks Inc., Natick, Massachusetts, USA) and Origin (Origin 9.0,
OriginLab Corp., Northampton, Massachusetts, USA) software for further processing and
statistical treatments.
2.2 Materials
All chemicals were of analytical grade, purchased from commercial suppliers. The
experiments were performed using fluorescent polystyrene particles with diameter of 1.0 µm
dispersed in aqueous solution (Fluoro-Max Dyed Red Aqueous Fluorescent Particles, Thermo

15
Scientific Inc., Fremont, California, USA). The AFM topography was recorded using a
conical tip shape cantilever (HA_NC, NT-MDT, Limerick, Ireland). The colloidal probe
cantilever was built using a fluorescent polystyrene microsphere with diameters of 5.5 µm
(Red Fluorescent Polymer Microspheres Duke Scientific Corporation, Palo Alto, California,
USA), epoxy glue (Poxipol, Bripox, Warsaw, Poland) and a rectangular tipless cantilever
(CSG 11/tipless, NT-MDT, Limerick, Ireland). The microfluidic channels were fabricated out
of polydimethylsiloxane (PDMS, Sylgard 184, Dow Corning Corp., Midland, Michigan,
USA) by soft lithography. Surface-oxidized cover glass, obtained by exposing cover slips (24
x 24 mm, Carl Roth GmbH, Karlsruhe, Germany) to oxygen plasma (Zepto B, Diener
Electronics GmbH, Ebhausen, Germany), was used to seal the PDMS channels. Acrylamide
(AAm, Sigma Aldrich, Poznan, Poland), N,N’-methylene bisacrylamide (BIS-AAm, 99.5%,
Sigma Aldrich, Poznan, Poland), ammonium persulfate (APS, 98%, Sigma Aldrich, Poznan,
Poland), N,N,N’,N’-tetramethylethylenediamine (TEMED, 99%, Sigma Aldrich, Poznan,
Poland), 3-aminopropyltriethoxysilane (APTES, 98%, Sigma Aldrich, Poznan, Poland),
potassium chloride (KCl, 99%, Sigma Aldrich, Poznan, Poland) and hexane (99%, Sigma
Aldrich, Poznan, Poland) were used without further purification during the experiments. All
solutions were prepared using ultra-pure water with conductivity of 0.056 µS cm−1. Water was
deionized using a Hydrolab HLP purification system (HLP 5UV, Hydrolab, Wiślina, Poland).

16
3. Experiments and discussions
3.1 Calibration
The calibration of optical tweezes is crucial in using this hybrid equipment as a quantitative
sensor of forces. Even though the stiffness of optical tweezers is predictable by theoretical
calculation, it nevertheless must be experimentally determined, because it is difficult to
measure all the experimental parameters that should be included in the calculation. There are
several methods to calibrate an optical tweezers apparatus.
In this section we show the methods used and discuss the results of the calibration of QPD
looking at the output signals – particle displacement relationship and the force calibration of
the instrument.
The optical tweezers stiffness was evaluated over the widest possible range of trapping laser
power level, because we are aware of the importance of this technique to study also non-
biological materials where the material damage due to the irradiation is negligible. Although
the low cell damage induced by Nd:YAG 1064 nm laser [32] as well as the possibility to use
high infrared laser power in biomolecules experiments [33] and the introduction of
temperature controlled system have already been proven [34], a special attention was paid to
explore the optical tweezers properties under 10 mW laser power level.
Before that, the detection system and optical trap calibration were performed, an electric
optical power meter (Nova II with PD300-3W sensor, Ophir Optronics, Jerusalem, Israel) was
placed perpendicularly in front of the microscope objective in order to determine the power of
the beam that irradiate the sample at the trapped object plane. The power reaching the sample
was calculated for all the lasers setups used in the described experiments.
17
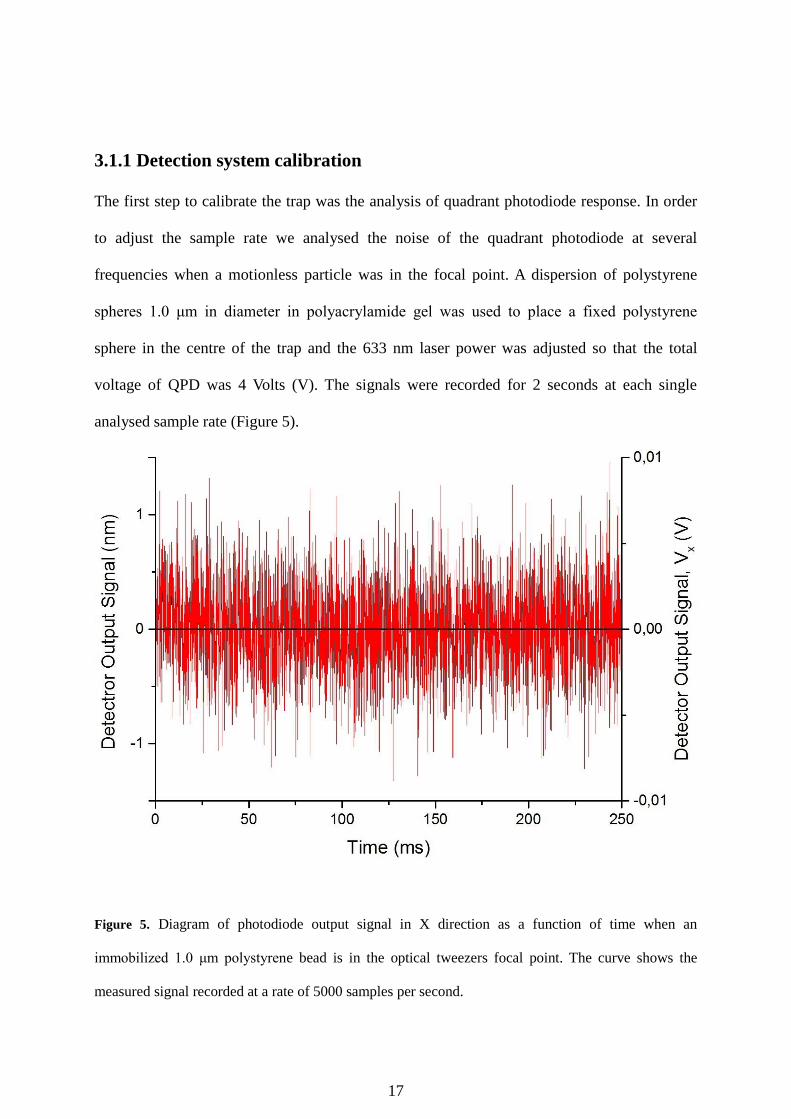
3.1.1 Detection system calibration
The first step to calibrate the trap was the analysis of quadrant photodiode response. In order
to adjust the sample rate we analysed the noise of the quadrant photodiode at several
frequencies when a motionless particle was in the focal point. A dispersion of polystyrene
spheres 1.0 μm in diameter in polyacrylamide gel was used to place a fixed polystyrene
sphere in the centre of the trap and the 633 nm laser power was adjusted so that the total
voltage of QPD was 4 Volts (V). The signals were recorded for 2 seconds at each single
analysed sample rate (Figure 5).
Figure 5. Diagram of photodiode output signal in X direction as a function of time when an
immobilized 1.0 μm polystyrene bead is in the optical tweezers focal point. The curve shows the
measured signal recorded at a rate of 5000 samples per second.

18
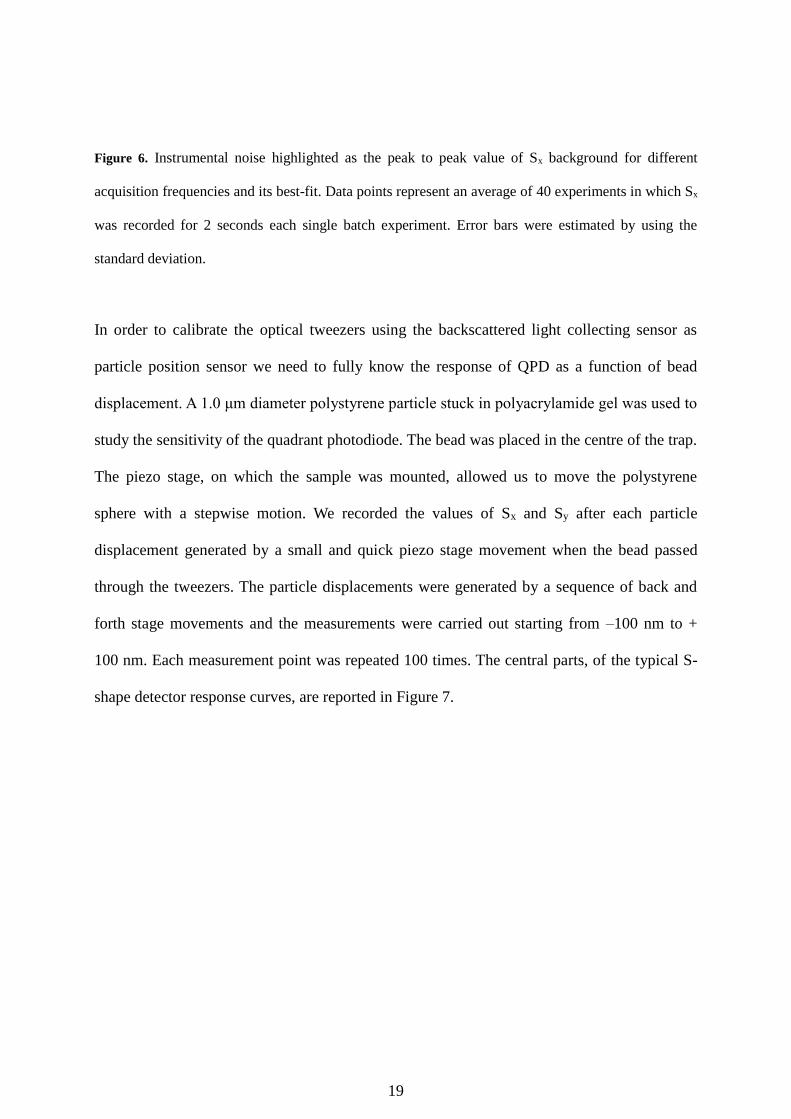
The recorded signals were analysed expressing the instrumental noise as peak-to-peak value.
The lower the acquisition rate, the less noisy the output signal is (Figure 6). At high
acquisition frequencies the analyses were affected by the noise. At low frequency the QPD
was not able to detect fast and small particle displacement, therefore the selected sample rate
of the detection system was set up at a maximum of 10.0 kHz in order to reach the optimum
signal-to-noise ratio and speed. The peak-to-peak values obtained for Sx are comparable with
those calculated for Sy. The output signals of the quadrant photodiode are clearly exposed to
several sources of noise. Electronic noise, mechanical, acoustic vibrations and laser
instabilities can be minimized by applying some experimental precautions but it cannot be
removed completely. However, a much higher peak-to-peak signal value is generated by the
Brownian motion of trapped object.
19
Figure 6. Instrumental noise highlighted as the peak to peak value of Sx background for different
acquisition frequencies and its best-fit. Data points represent an average of 40 experiments in which Sx
was recorded for 2 seconds each single batch experiment. Error bars were estimated by using the
standard deviation.
In order to calibrate the optical tweezers using the backscattered light collecting sensor as
particle position sensor we need to fully know the response of QPD as a function of bead
displacement. A 1.0 μm diameter polystyrene particle stuck in polyacrylamide gel was used to
study the sensitivity of the quadrant photodiode. The bead was placed in the centre of the trap.
The piezo stage, on which the sample was mounted, allowed us to move the polystyrene
sphere with a stepwise motion. We recorded the values of Sx and Sy after each particle
displacement generated by a small and quick piezo stage movement when the bead passed
through the tweezers. The particle displacements were generated by a sequence of back and
forth stage movements and the measurements were carried out starting from –100 nm to +
100 nm. Each measurement point was repeated 100 times. The central parts, of the typical S-
shape detector response curves, are reported in Figure 7.

20
Figure 7. Quadrant photodiode output signals (Sx and Sy) versus particle displacement curves recorded
by moving the bead through the optical trap. The displacement is relative to the centre position of the
trapped bead. The output signals are zero when the object is in the trap centre. The curves were
obtained using 1.0 μm polystyrene particles in water.
Only the central zone of the graph (± 100 nm) was used to calibrate the quadrant photodiode
sensitivity and trap stiffness, by calculating the slope of the best linear fit. The slope of the fit
lines (αx ,αy) for Sx and Sy are respectively 0.0026 and 0.0031 in arbitrary units.
The particle displacements (X, Y) can be calculated with equations (6) and (7)
X= Sx / αx (6)
21
Y= Sy / αy (7)
The presence of backscattered light pattern asymmetry is responsible for the difference in
sensitivity between X and Y direction as well as the non-linear response for bead
displacements higher than 100 nm from the centre of the trap. The sensitivity of the quadrant
photodiode is also affected by the ratio of light spot radius and QPD radius to the distance
between the centre of the detector and the reflected beam.
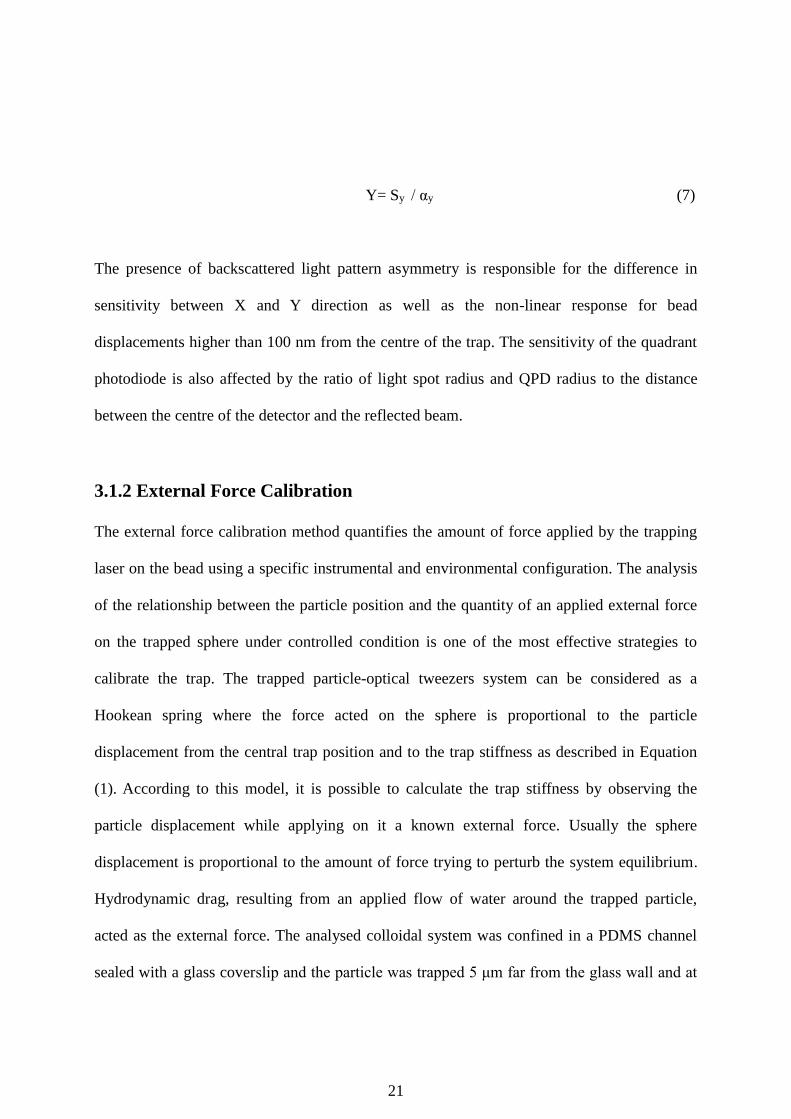
3.1.2 External Force Calibration
The external force calibration method quantifies the amount of force applied by the trapping
laser on the bead using a specific instrumental and environmental configuration. The analysis
of the relationship between the particle position and the quantity of an applied external force
on the trapped sphere under controlled condition is one of the most effective strategies to
calibrate the trap. The trapped particle-optical tweezers system can be considered as a
Hookean spring where the force acted on the sphere is proportional to the particle
displacement from the central trap position and to the trap stiffness as described in Equation
(1). According to this model, it is possible to calculate the trap stiffness by observing the
particle displacement while applying on it a known external force. Usually the sphere
displacement is proportional to the amount of force trying to perturb the system equilibrium.
Hydrodynamic drag, resulting from an applied flow of water around the trapped particle,
acted as the external force. The analysed colloidal system was confined in a PDMS channel
sealed with a glass coverslip and the particle was trapped 5 μm far from the glass wall and at

22
least 50 μm away from any surface. The experiment was performed at the system equilibrium
in order to avoid any unexpected convective flow. The flow Reynolds number based on the
particle diameter was below 10-3. In the low Reynolds number regime the external drag force
(Fext) acting on a bead can be easily quantified using Stokes’ law (8)
Fext= 6 π η ν R (8)
where η is the dynamic viscosity of the water, ν is the fluid velocity and R is the trapped
sphere radius.
The results were corrected according to Faxen’s law in order to take in consideration the
effect of the wall proximity to the particles in the applied experimental conditions [26].
The flow of the fluid around the trapped sphere was applied by moving the piezo stage on
which the channel was mounted. The external force was quantified using the method
proposed by Mills et al. [35], where the AFM piezo stage was moved at different constant
velocities translating the chamber by steps of 100 µm in the X and Y direction. The system
was analysed at several values of external force maintaining the step displacement constant
and changing the stage velocity; at least 100 events were taken into account in the stiffness
calculation in each analysed experimental condition. The optical tweezers stiffness was
calculated at 15 different trapping laser power levels by analysing the recorded output signals
of the QPD particle position detector (Figure 8). The results shown in Figure 9 were averaged
over few experiments repeated using the same experimental parameters.

23
Figure 8. Bead position along the X axis vs time during the external force calibration. A 1.0 μm
diameter polystyrene bead is trapped using the infrared laser (40 mW) and the sample is moved
transversally back and forth at constant velocities (1300 μm/s). The piezo stage is set up to make one
100 µm movement each way with a 100 ms delay between every single stage translation.
The trap stiffness increases linearly with the trapping laser intensity. The optical tweezers
calibrations show the stiffness asymmetry caused by the polarization of the laser beam. These
results are in agreement with theoretical and previous experimental results achieved by
Rohrbach [36], where the relationship between the asymmetry coefficient and several
experimental parameters (e.g. power and wavelength of laser and particle dimension) was
proven.

24
When the piezo stage speed was increased above a certain threshold, the external force
overcame the trapping laser force and the bead escaped from the optical tweezers. The escape
force is defined as the highest force applicable to the trapped objects therefore it defines the
upper force limits of optical tweezers. The higher the trapping laser power, the higher the
escape force (Table 1). We found that our optical tweezers system has a maximum escape
force of 11.17 pN using a 4.24 mW trapping laser.
Trapping laser
power (mW)
Axes direction Escape force (pN) Escape force standard
deviation (pN)
1.74 X 4.91 0.35
2.62 X 7.22 0.22
4.24 X 11.17 0.74
1.74 Y 4.89 0.11
2.62 Y 7.26 0.13
4.24 Y 10.89 0.18
Table 1. Traversal escape force measured from 1.74 mW to 4.24 mW of trapping laser power.
3.1.3 Equipartition Calibration
The trapped bead oscillates randomly near the focal point of the laser beam when it is in
thermal equilibrium. Therefore, the system can be considered a sphere in a harmonic
potential. The particle fluctuations are due to the Brownian motion which tends to displace the
bead stochastically. The bead spatial position is well-described by a Gaussian function centred
in the focal laser point where the width of the Gaussian curve is associated with the trap
stiffness, and the probability to find the particle near the centre is higher in stiffer optical
tweezers systems. The particle is stable when the force applied by the laser to the trapped
object overcomes the forces generate by collisions of the environmental molecules to the
beads, confining the Brownian motion in the trap region. The Brownian motion of a particle is

25
directly proportional to temperature. Consequently, it is possible to estimate the trap stiffness
by tracking the particle position and calculating the displacements from the average position
point in a well-known thermal condition. The equipartition theorem defines the average
translational kinetic energy of a particle for each translational degree of freedom as ½ kBT
where kB is the Boltzmann constant and T is the absolute temperature. According to this
theorem it is possible to evaluate the trap stiffness (k) by solving the equation (9)
k= kBT / <Δx2> (9)
where <Δx2> is the statistical variance in the particle position.
The displacements of a 1.0 μm polystyrene particle in water were recorded for 20 seconds
with a fixed acquisition frequency (10.0 kHz) at several trapping laser power levels. The trap
stiffness was calculated averaging 30 series of data acquisitions for each laser power settings
(Figure 9). The temperature of the fluid was evaluated using a pre-calibrated thermocouple
sensor located few micrometres far from the analysed bead and assuming that the temperature
in this point was similar to the trap temperature [37]. In this experiment the power of 1064 nm
laser was set starting from 0.50 mW and then was gradually increased to 50.0 mW. We
noticed that due to the temperature rising at high laser power level, the difference between the
focal point where the particle is confined and the surrounding liquid created large convective
instabilities in the system, forcing us to extend equilibration time. The temperature estimation
has a crucial role in the equipartition calibration. The measured stiffness standard deviation
rose in proportion to the laser power.

26
Figure 9. Dependence of trap stiffness on trapping laser power for a 1.0 μm polystyrene bead obtained
by equipartition and external force calibration method in the range from 0.50 mW to 50.0 mW of laser
power (A). Optical tweezers stiffness as a function of laser power (0.5 mW – 8.0 mW) and its best fit-

27
line: equipartition along X axis (B), equipartition along Y axis (C), external force along X axis (D) and
external force along Y axis (E). Every point in the graph is the average of 30 measurements.
The results obtained for laser power below 10 mW using the equipartition method confirm the
previous calibration data highlighting the strong dependence between the laser power and the
optical tweezers stiffness.
3.1.4 Calibration discussion
A comprehensive characterization of the QPD-based sensor has been provided and the high
sensitivity and resolution of the detector has been confirmed by the experimental calibration
(Figure 5 – 6 – 7). Nevertheless, it is possible to further increase the sensitivity and the
resolution by improving the acquisition data system.
The optical tweezers stiffness usually depends on several experimental parameters such as the
shape, refractive index and position of the trapped object, profile and intensity of the trapping
laser and the sample medium refractive index. That is the reason why the optical tweezers
stiffness was calculated by two different methods in the same experimental condition and the
relationship between trapping laser power and applied force was investigated. The basic
calibration presented in this paper was the external force method. The results demonstrate that
the minimum applicable and detectable force of the proposed optical tweezers is at least one
order of magnitude better than the best result achieved by AFM. The external force method
has allowed us to measure the highest applicable and detectable force by calculating the force
necessary to escape the trapped particle from the optical tweezers focus spot. The escape force
is proportional to the trapping laser beam power (Table 1) and this confirms the possibility to
analyse forces up to 11.17 pN using a 4.24 mW laser power and to use optical tweezers in a

28
force range below the limit of detection of AFM. An alternative calibration method based on
equipartition was carried out and the results obtained confirm the high sensitivity and
resolution of the instrument (Figure 9). The equipartition method is easy enough to
implement, it is very fast and does not require any additional equipment. After proper
calibration it can be used to evaluate local temperature or/and to extend evaluation of
Brownian motion into inertial ballistic regime [24].
We found that the calibration methods using external force and equipartition performed
equally well in the reported experimental conditions. The reproducibility of calibration
methods is expressed as the standard deviation of trap stiffness. The standard deviations
obtained using external force are greater than the values calculated by the equipartition
method for lower laser power (0.5 mW and 8.0 mW).
As it is possible to notice in Figure 9 B and Figure 9 C, also the fitting straight lines
calculated using the equipartition method have a non-zero intercept. The obtained fitted lines
were not forced to pass through the origin point, even though they intersect the Y axis very
close to the zero value, because this discrepancy from the theory highlights the small
contribution from the detection laser during the particle trapping process to the final result.
This effect is unavoidable in the proposed hybrid configuration because the presence of the
AFM cantilever in the optical tweezers focal point area forces us to use a configuration based
on a backscatter light detection system in which the 633 nm red laser beam is focused by the
objective with minimal impact on the particle confinement. Furthermore, although the plots of
trap stiffness as a function of beam power prove the linear relationship under 8 mW for the
external force method results, the fit lines do not intersect the origin. This is not due to the
presence of a trapping force in absence of the laser beam but to the inaccuracy of this method
when it comes to extremely low laser power. In the external force approach zero stiffness is

29
achieved if extremely small forces provoke the infinitely large Brownian movements. This is
not reached, when we study the behaviour of a particle in flow, even in the absence of the
trapping laser because there are frictional forces counter the free diffusion of the particle in
the environmental liquid [38]. It evidences the advantage of the method based on of the
trapped particles Brownian motion study when the trap weakness disturbs accuracy of the
external force calibration technique. Indeed, when the laser is set on a lower power than 0.5
mW the force applied by the laser beam was frequently overcome by the drag force resulting
from the slowest possible applied stage movement. Moreover, when the laser power is lower
than 3 mW the fluctuations around the centre of the trap is comparable with the displacement
of the particle due to the external drag force, affecting the precision of the result reached by
the external force method (Figure 9 D and Figure 9 E). Our study pointed out that the trap
stiffness values obtained using equipartition calibration have a directly proportional
relationship with the trapping laser power and that the results are very precise and accurate in
the region in which the force of the trap is weak. The curves obtained between 0.5 mW and
8.0 mW are well fitted by a line and the relative standard deviations rarely exceed 3% of the
calculated trap stiffness. On the other hand this method appears to be less useful to measure
the properties of the trap when trapping laser is set up at higher trapping power than 20 mW
and this is quite evident considering that the stiffness-laser power correlation became non-
linear at this point. The deviation of the equipartition method curves from the drag force
curves at high values of trapping laser power (Figure 9 A) is probably due to the sample
heating [39], and possible deviations of the equipartition model from the diffusive regime into
the ballistic interactions. We can therefore say that the use of few calibration techniques is
crucial for measuring the optical tweezers stiffness in a wide range of applied trap power.

30
External force and equipartition calibration methods provide us only with information
regarding the stiffness of the trap in the plane perpendicular to the incident lasers direction.
Therefore a further three dimensional calibration has to be performed in order to fully
understand the forces involved in particle confinement.
3.2 Optical tweezers atomic force microscopy double probing
The developed hybrid atomic force microscope-optical tweezers allows us to manipulate
micro and nanoscale systems and to analyse their material properties and behaviour from a
different point of view. The proposed equipment is extremely versatile and it can be used in
different configurations as required. The combination of atomic force microscopy and optical
tweezers in one single piece of equipment enabled us to obtain images, manipulate and
quantify motion and forces directly, during a single measurement.
In this paragraph we focus on two specific applications showing the methods used in these
distinct experiments. In the first case, the trapping laser was used as a high precision
nanomanipulator while the AFM cantilever guarantees the ability to visualize the treated
sample zone with high resolution. The second experiment proved the possibility to lower the
force limit of detection of AFM, by using a colloidal cantilever as a manipulator and the
optical tweezers system as a force and spatial sensor.
3.2.1 Nanomanipulation and high resolution imaging by AFM/OT
One of the most interesting applications is to use tweezers in order to manipulate single
objects (e.g. nanomaterials and cells). The main achievement of the optical trapping
nanomanipulation was to develop a selective cell sorting process with the aim to purify
31
samples and to study the biological behaviour of single selected cells. Nanomanipulation can
also be useful to organize, assemble and locate complex hierarchical structures composed
through optical tweezers manipulation. The proposed study is based on the capabilities of
sorting single nano-objects using optical tweezers. In order to demonstrate the capabilities of
the OT/AFM system we prepared a particle nanostructure using the dragging force of the
trapping laser and we simultaneously scanned the sample using AFM.
First of all, the surface of the glass slide used in this experiment was functionalized with 3-
aminopropyltriethoxysilane (APTES) using the method proposed by Labit et al. [40]. The
chemically functionalized glass coverslip was used in this experiment in order to increase the
interface interaction between the 1.0 μm polystyrene bead and the substrate. During this
experiment, the trapping laser power was set to 10 mW in order to reach a high trapping
efficiency and avoiding convective flow or other undesirable phenomena which can affect the
nanomanipulation. First, five polystyrene particles were manoeuvred and isolated from the
colloidal system, than the selected particles were individually confined in a clean water well
and dragged to the glassy bottom of the channel in order to form a perfectly aligned straight
line structure. The force exerted by the trapping laser is strong enough to push the particles to
the glass wall and the adhesion effects allow to immobilize the particles to the substrate. The
glass surface modification plays a crucial role in the proposed experiments. The attractive
force between the positive charged surface and the negative charged polystyrene has an
extremely beneficial influence on the stability of the produced structure. The AFM/OT system
was used to collect AFM topographies of the area selected for conducting the experiment
before and after the particle deposition as well as the surface of the single dragged particles.
Topography images of immobilizates were acquired in water using the tapping mode of AFM
at a scan frequency of 0.2 Hz. Figure 10 shows a 5.0 µm x 5.0 µm AFM image of the ordered

32
layer of polystyrene particles developed using the dragging force of the optical tweezer
system.
Figure 10. Topography image of polystyrene particles immobilized onto a special functionalized glass
substrate obtained in tapping mode AFM using a HA_NC B cantilever.
This experiment allows to study the surface properties of the particles and substrates taking
into consideration one single particle-surface interaction and studying single events to
characterize locally the studied materials.
3.2.2 Combined atomic force microscopy and optical tweezers force sensor
Materials containing suspended microparticles or nanoparticles serve a wide variety of
purposes and they are used in several applications. In all colloid system applications it is
essential to maintain the colloid well dispersed and to avoid the formation of aggregates,
therefore the knowledge, of the forces that regulate stability of particles in liquid, is
fundamental. The equilibrium state and the hydrodynamic properties of colloid systems in an
33
aqueous medium are affected by several environmental parameters (e.g. the addition of salt
influences the stability of colloids). An explanation for this fact was given by the Derjaguin-
Landau-Verwey-Overbeek (DLVO) theory studying the surface charges at interfaces and the
factors that affect the electrostatic double-layer force [41].
The possibility to detect extremely small forces (more than one order of magnitude lower than
AFM) is certainly one of the most compelling strong points of the developed hybrid
instrument.
In the following experiment, we demonstrate the possibility to use our hybrid instrument to
quantify force in the femtonewton scale. As the research on the interaction forces acting
between colloidal particles is very topical, the proposed configuration will be helpful to
elucidate the details of the phenomena that regulate the colloids stability as well as the
properties of molecules attached to their surface. Furthermore, the high number of scientific
publications in this field gives us the possibility to highlight the advantages provided by the
developed instrument in comparison to the most recent results obtained by using AFM only
[42, 43].
Our colloidal probe cantilever was built following the “Cantilever-moving technique”
developed by Gan [44] in which a single fluorescent 5.5 μm particle was glued to the end of a
tip-less AFM cantilever using a small amount of epoxy glue and the AFM head as a
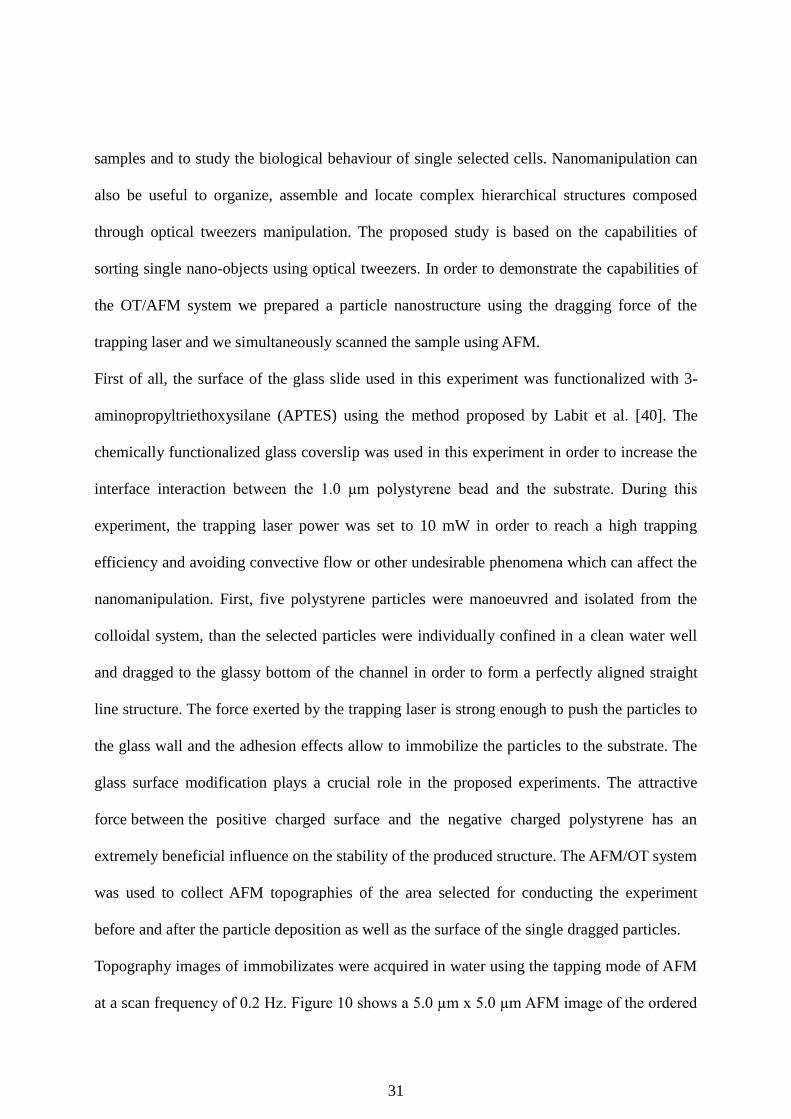
micromanipulator (Figure 11 A).
The experiments were performed inside a tailored PDMS microfluidic chip filled with water
solutions at temperature 295 K. The single fluorescent colloid sphere fixed at the end of the
tipless cantilever and a 1.0 μm fluorescent polystyrene sphere confined in the optical trap
using 6.5 mW laser power, (Figure 11 B – C – D).
34
Figure 11. Overview of the applied setup and procedure for the single particles interaction study. A
SEM micrograph of the 5.5 polystyrene particle mounted on the tipless AFM cantilever using AFM as
a manipulator (A). A 1.0 µm polystyrene particle was trapped a few micrometers from the cantilever
(B), then the probe was translated in the trapped particle direction (C) and finally the particle glued to
the cantilever approached the surface of the trapped particle (D). Picture B was collected using a white
light while pictures C and D were recorded using fluorescent particles excited by the green 532 nm
wavelength laser. The red arrows indicate the position of the optically trapped 1 µm particle and the
green arrows denote the location of the 5.5 µm particle attached to the AFM probe.
Before being used, all the materials were accurately cleaned rinsing carefully with acetone,
isopropanol and water in order to remove any contaminate traces. The experiments were
carried out by approaching the trapped particle with the AFM particle probe at a constant
velocity (200 nm/s) in pure water and recording the optical tweezers output signals with a
resolution of ±100 fN. The same experiment was repeated in 10-5 M and 10-3 M KCl solutions
in that order. The particle approaches were performed after 30 minutes from the liquid
introduction into the channel to reach the thermal equilibrium that was monitored by using a
thermocouple inserted into the microchip channel. More than 30 approaches were performed
35
per each analysed environmental condition in order to have statistically significant results.
The acidity of the solutions was adjusted with small amounts of diluted KOH in order to reach
pH 7. The force vs relative distance was obtained during the post-experiment data analysis,
calculating the particle-particle distance with both optical microscope images and quadrant
photodiode signals.
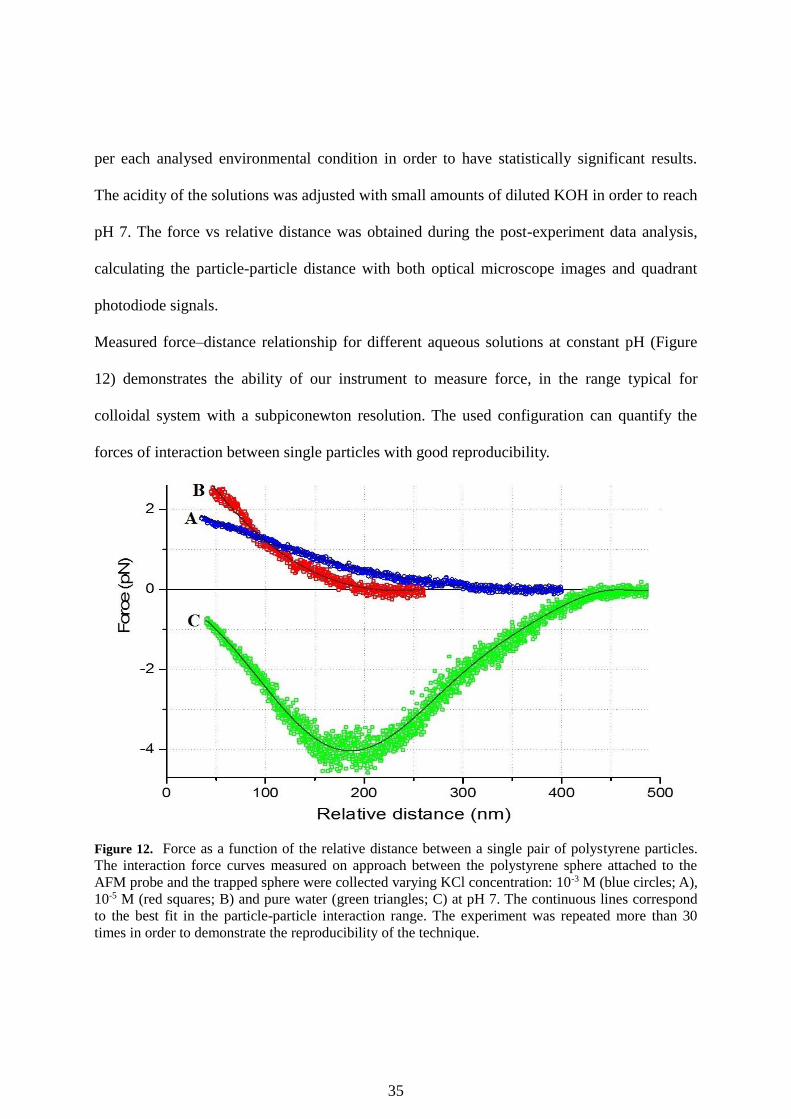
Measured force–distance relationship for different aqueous solutions at constant pH (Figure
12) demonstrates the ability of our instrument to measure force, in the range typical for
colloidal system with a subpiconewton resolution. The used configuration can quantify the
forces of interaction between single particles with good reproducibility.
Figure 12. Force as a function of the relative distance between a single pair of polystyrene particles.
The interaction force curves measured on approach between the polystyrene sphere attached to the
AFM probe and the trapped sphere were collected varying KCl concentration: 10-3 M (blue circles; A),
10-5 M (red squares; B) and pure water (green triangles; C) at pH 7. The continuous lines correspond
to the best fit in the particle-particle interaction range. The experiment was repeated more than 30
times in order to demonstrate the reproducibility of the technique.

36
The developed combined atomic force microscopy and optical tweezers do not only have
higher resolution and reproducibility than AFM during the analysis of the particles interaction
forces [42] but the hybrid instrument also gives considerable advantages in relation to the
experiment utility. Usually in the AFM investigations, the colloidal cantilever is used as
external probe and force sensor to perturb and to study a layer of spheres deposited onto a
solid surface [43]. The analysed particle is physically confined by other particles located in
the analysed layer and by the surface in which it is placed producing a significant variation of
the double layer compared to the theoretical situation where the single particle is dispersed in
the surrounding liquid. On the other hand, the experiment performed using the AFM/OT
system allows miming the natural colloidal system condition in which the studied single
particle is completely bordered by the liquid through the use of the optical trap, giving us a
more reliable result.
Moreover, the obtained data (Figure 12) confirm that the behaviour of colloidal systems
observed experimentally agrees with the theoretical predictions. The DLVO theory assumed
that the interaction between two particles is due to the sum of the electrostatic double-layer
repulsion and the van der Waals attraction. At low salt concentration the double-layer
repulsions are stronger than in pure water and the single polystyrene particles are stable. The
particle stability increases with the KCl concentration in the micromolar scale.
The AFM/OT instrument was optimized to study extremely low forces, by increasing the
sensitivity and limiting the detectable forces up to a maximum of a few pN. This
configuration does not allow the detection of the, already well-known, interaction forces
acting at very short particle-particle distances, but opens the way to study the long range
interaction forces that are undetectable by using AFM only [42, 43]. As it is shown in Figure
12, the attractive forces have a dominant effect for the particle-particle interaction

37
experiments in pure water at pH=7. In pure water, long range attraction is clearly measured,
instead small short range repulsions that are still not strong enough to overcome the attractive
component in the analysed range. A completely different behaviour is observed in presence of
KCl, where no final attractive forces act in the analysed range, while repulsive forces that
grow exponentially with decreasing particle-particle distance are visible. In our experimental
results, in all the studied systems, no interaction forces between the polystyrene particles
could be observed at distances exceeding 450 nm.
The obtained experimental results confirm that the polystyrene particles colloid systems are
more stable in a 10-3 M KCl solution, than a 10-5 M KCl solution and that is, in turn, more
stable than the same system in water.
4. Conclusions and outlook
Atomic force microscopy is a versatile technique capable of covering a broad range of
applications, but it is not able to detect small forces on the femtonewton scale due to technical
limitations and restrictions. Based on this consideration, we have designed and developed a
combined type of AFM-optical tweezers apparatus in order to build a high resolution imaging
instrument capable to confine micro- and nanomaterial and to lower the force limit of
detection of AFM. The successful development of the equipment has been described in detail
and the calibration of the instrument has been presented in this study.
We have shown how important the optics and electronic arrangement and settings are to
achieve the high temporal and spatial resolution required during the force measurements. In
this article we proposed an improvement of the trapped particle position detection system. We

38
also showed an integrated system based on the collection of backscattered light by a quadrant
photodiode.
The setup presented in this article opens up the possibility to construct the hybrid atomic force
microscope-optical tweezers which allows to manipulate biological systems of greater
complexity and to analyse their material properties and behaviour from a different point of
view, for example trapping and manipulating intracellular objects and probing the cell surface
by AFM cantilever, simultaneously. This double probe instrument will be useful for studying
the mechanical properties of single long chain molecules, fibres and rods as it allows to
analyse the effect of the twisting. By attaching a molecule (or a one-dimensional
nanomaterial) to the AFM cantilever on one side and to a paramagnetic bead on the other it is
possible to twist it using a rotating magnetic field to torque the bead. In this experiment the
optical tweezers will act as a manipulator and the atomic force microscope as a force and
spatial sensor.
The combination of atomic force microscopy and optical tweezers in one single piece of
equipment has already given us the ability to obtain images, to manipulate and quantify the
motion and the forces directly in the same sample. In the present study a few capabilities of
the instrument has already been proved performing two detailed experiments, but it is
expected that several applications will be found soon for the developed instrument thanks to
his versatility and possibility to tackle challenge studies in extremely fascinating and crucial
scientific topics including biophysics and nanosciences.

39
5. Acknowledgements
This work was supported by NCN grant no. 2011/03/B/ST8/05481. The authors gratefully
acknowledge NT-MDT for technical support. The authors would also like to thank Patryk
Hejduk for his assistance with this work.
6. References
[1] Janshoff A, Neitzert M, Oberdorfer Y and Fuchs H 2000 Force spectroscopy of molecular
systems - Single molecule spectroscopy of polymers and biomolecules Angew. Chem. Int. Ed.
39 3213–18
[2] Binnig G, Quate C F and Gerber C 1986 Atomic force microscope Phys. Rev. Lett. 9 930–
56
[3] Sevim S, Tolunay S and Torun H 2015 Micromachined sample stages to reduce thermal
drift in atomic force microscopy Microsyst. Technol. 21 1559-1566
[4] Beyder A, Spagnoli C and Sachs F 2006 Reducing probe dependent drift in atomic force
microscope with symmetrically supported torsion levers Rev. Sci. Instrum. 77 056105
[5] Voulgarakis N K, Redondo A, Bishop A R and Rasmussen K Ø 2006 Sequencing DNA by
Dynamic Force Spectroscopy: Limitations and Prospects Nano Lett. 6 1483–7
[6] Neuman K C and Nagy A 2008 Single-molecule force spectroscopy: optical tweezers,
magnetic tweezers and atomic force microscopy Nat. Methods 5 491–6
[7] Ashkin A 1970 Acceleration and trapping of particles by radiation pressure Phys. Rev.
Lett. 24 156

40
[8] Ashkin A, Dziedzic J M, Bjorkholm J E and Chu S 1986 Observation of a single-beam
gradient force optical trap for dielectric particles Opt. Lett. 11 288–5
[9] Ashkin A 1992 Forces of a single-beam gradient laser trap on a dielectric sphere in the ray
optics regime Biophys. J. 61 569–2
[10] Moffitt J R, Chemla Y R, Smith S B and Bustamante C 2008 Recent Advances in Optical
Tweezers Annu. Rev. Biochem. 77 205–28
[11] Malagnino N, Pesce G, Sasso A and Arimondo E 2002 Measurements of trapping
efficiency and stiffness in optical tweezers Opt. Commun. 214 15–24
[12] Grier D G 1997 Optical tweezers in colloid and interface science Curr. Opin. Colloid
Interface Sci. 2 264–3
[13] Meiners J –C and Quake S R 2000 Femtonewton Force Spectroscopy of Single Extended
DNA Molecules Phys. Rev. Lett. 84, 5014
[14] Berthelot J, Acimovic S S, Juan M L, Kreuzer M P, Renger J and Quidant R 2014 Three-
dimensional manipulation with scanning near-field optical nanotweezers Nature Nanotech. 9
295–299
[15] Visscher K, Schnitzer M J and Block S M 1999 Single kinesin molecules studied with a
molecular force clamp Nature 400 184
[16] Comstock M J, Ha T and Chemla Y R 2011 Ultrahigh-resolution optical trap with
single-fluorophore sensitivity Nat. Methods 8 335–340
[17] Lipfert J, Skinner G M, Keegstra J M, Hensgens T, Jager T, Dulin D, Köber M, Yu Z,
Donkers S P, Chouc F –C, Das R, and Dekker N H 2014 Double-stranded RNA under force
and torque: Similarities to and striking differences from double-stranded DNA Proc. Natl.
Acad. Sci. U. S. A. 111 15408–15413

41
[18] Bennink M L, Leuba S H, Leno G H, Zlatanova J, de Grooth B G and Greve J 2001
Unfolding individual nucleosomes by stretching single chromatin fibers with optical tweezers
Nat. Struct. Biol. 8 606-7
[19] Shivashankara G V and Libchaber A 1997 Single DNA molecule grafting and
manipulation using a combined atomic force microscope and an optical tweezer Appl. Phys.
Lett. 71 3727
[20] Huisstede J H, Subramaniam Vand Bennink M L 2007 Combining optical tweezers and
scanning probe microscopy to study DNA-protein interactions Microsc. Res. Tech. 70 26-33
[21] Jeffries G D M, Edgar J S, Zhao J, Shelby J P, Fong C and Chiu D T 2007 Using
Polarization Shaped Optical Vortex Traps for Single-Cell Nanosurgery Nano Lett. 7 415–2
[22] Wang X, Chen S, Kong M, Wang Z, Costa K D, Li R A and Sun D 2011 Enhanced cell
sorting and manipulation with combined optical tweezer and microfluidic chip technologies
Lab Chip 11 3656
[23] Pang Y, Song H, Kim J H, Hou X and Cheng W 2014 Optical trapping of individual
human immunodeficiency viruses in culture fluid reveals heterogeneity with single-molecule
resolution Nature Nanotech. 9 624–630
[24] Huang R, Chavez I, Taute K M, Lukić B, Jeney S, Raizen M G and Florin E –L 2011
Direct observation of the full transition from ballistic to diffusive Brownian motion in a liquid
Nature Phys. 7 576–580
[25] Yogesha, Bhattacharya S and Ananthamurthy S 2012 Characterizing the rotation of non
symmetric objects in an optical tweezer Opt. Commun. 285 2530–2535
[26] Schäffer E, Nørrelykke S F and Howard J 2007 Surface Forces and Drag Coefficients of
Microspheres near a Plane Surface Measured with Optical Tweezers Langmuir 23 3654–3665

42
[27] Yao A, Tassieri M, Padgett M and Cooper J 2009 Microrheology with optical tweezers
Lab Chip 9 2568–2575
[28] Nève N, Lingwood J K, Zimmerman J, Kohles S S and Tretheway D C 2008 The
μPIVOT: an integrated particle image velocimeter and optical tweezers instrument for
microenvironment investigations Meas. Sci. Technol. 24 095403
[29] Cardinaels R and Stone H A 2015 Lubrication analysis of interacting rigid cylindrical
particles in confined shear flow Phys. Fluids 27 072001–072022
[30] Xu S, Lou L, Li Y and Sun Z 2005 On the aggregation kinetics of two particles trapped
in an optical tweezers Colloids Surf. A 255 159–163
[31] Probst C, Grünberger A, Wiechert W and Kohlheyer D 2013 Microfluidic growth
chambers with optical tweezers for full spatial single-cell control and analysis of evolving
microbes J. Microbiol. Methods 95 470–476
[32] Schneckenburger H, Hendinger A, Sailer R, Gschwend MH, Strauss WS, Bauer M,
Schütze K. 2000 Cell viability in optical tweezers: high power red laser diode versus
Nd:YAG laser J. Biomed. Opt. 5 40–44
[33] Abbondanzieri E A, Shaevitz J W, and Block S M 2005 Picocalorimetry of Transcription
by RNA Polymerase Biophys. J. 89 L61–L63
[34] Mahamdeh M and Schäffer E. 2009 Optical tweezers with millikelvin precision of
temperature-controlled objectives and base-pair resolution Opt. Express 17 17190-17199
[35] Mills J P, Qie L, Dao M, Lim C T and Suresh S. 2004 Nonlinear elastic and viscoelastic
deformation of the human red blood cell with optical tweezers Mech. Chem. Biosyst. 1 169-80
[36] Rohrbach A 2005 Stiffness of Optical Traps: Quantitative Agreement between
Experiment and Electromagnetic Theory Phys. Rev. Lett. 95 168102

43
[37] Tolić-Nørrelykke S F., Schäffer E, Howard J, Pavone F S, Jülicher F and Flyvbjerg H
2006 Calibration of optical tweezers with positional detection in the back focal plane Rev. Sci.
Instrum. 77 103101
[38] Sarshar M, Wong W T and Anvari B 2014 Comparative study of methods to calibrate the
stiffness of a single-beam gradient-force optical tweezers over various laser trapping powers
J. Biomed. Opt. 19 115001-115013
[39] Mao H, Ricardo Arias Gonzalez J R, Smith S B, Tinoco Jr I and Bustamante C 2005
Temperature Control Methods in a Laser Tweezers System Biophys. J. 89 1208-1316
[40] Labit H, Goldar A, Guilbaud G, Douarche C, Hyrien O and Marheineke K 2008 A
simple and optimized method of producing silanized surfaces for FISH and replication
mapping on combed DNA fibers Biotechniques 45 469-458
[41] Maroto J A and de las Nieves F J 1998 Theoretical and experimental comparison of the
colloid stability of two polystyrene latexes with different sign and value of the surface charge
Colloid. Polym. Sci. 276 453-458
[42] Lüderitz L A C and v Klitzing R 2013 Interaction forces between silica surfaces in
cationic surfactant solutions: An atomic force microscopy study J. Colloid. Interface Sci. 402
19-26
[43] Singh G, Bremmell K E, Griesserd H J and Peter Kingshott 2015 Colloid-probe AFM
studies of the interaction forces of proteins adsorbed on colloidal crystals Soft Matter 11 3188
[44] Gan Y 2007 Invited Review Article: A review of techniques for attaching micro- and
nanoparticles to a probe’s tip for surface force and near-field optical measurements Rev. Sci.
Instrum. 78 081101-081108