Embed Size (px)
Citation preview
Title: Reducing energy consumption by alternative processing routes to produce ferrochromium
alloys from chromite ore
Authors: Arthur Barnes (corresponding)(1); Mika Muinonen(1) and M. J. Lavigne(2)
(1) XPS Testwork and Consulting Services 6 Edison Rd, Falconbridge, ON, P0M 1S0
(2) KWG Resources Inc. 1158 Russell St Thunder Bay, ON P7B 5N2
E-mail: [email protected] [email protected] [email protected]
ABSTRACT:
The carbothermic reduction of chromite ore to produce high carbon ferrochromium is among the most energy intensive metal extraction processes performed, due not only to the highly endothermic nature of the reduction reactions but also the very high operating temperatures required for the smelting operation to separate the chrome-containing alloy from the discard slag. KWG Resources and XPS have collaborated over the last 3 years in developing a patented (Winter) processing alternative to the traditional smelting operation in which all processing takes place in the solid state at temperatures many hundreds of degrees lower than those required for liquid processing. Amongst the attractions of the process are much lower capital costs, as well as reduced operating costs, particularly of energy. A techno-economic study on the new process identifies a reduction in overall energy consumption of 70% against conventional processing and approximately 40% lower than the current best practice. By utilising more natural gas than coal based energy sources, the KWG process is able to show an overall 50% reduction in greenhouse gas emissions compared with the most energy efficient current practice. The impact of the new process on future processing is therefore regarded as highly significant, with global energy reductions equivalent to the effect of completely eliminating energy demand from a country the size of Italy. The study concluded that the potential for this process to completely revolutionise the global ferrochrome industry should not be underestimated. Its impact reaches far beyond exploitation of a regional natural resource.
COM 2015 | THE CONFERENCE OF METALLURGISTS hosting AMCAA | America's Conference on Aluminum Alloys ISBN: 978-1-926872-32-2
Page 1 of 22 Published by the Canadian Institute of Mining, Metallurgy and Petroleum | www.metsoc.org

Introduction The discovery of large reserves of high grade chromite ore in Northern Ontario in the last decade has given rise to a number of projects related to exploiting the reserves by converting them into value added products within Ontario to the extent that it is economically feasible. While the reserves are massive and of excellent quality, the remote location and lack of infrastructure have proved to be a substantial hurdle to unlocking the potential of the region. The US–based Cliffs Natural Resources is an early casualty, having spent considerable funds acquiring the mineral rights and conducting detailed engineering studies and testwork but found themselves thwarted by the magnitude of the infrastructural issues. KWG Resources Inc.(KWG), another of the active parties, and one of the pioneers of chromite exploration in the Ring of Fire region of Northern Ontario, noting these realities engaged on an innovative approach to the problem and recognised that an alternative to conventional energy-intensive , capital-intensive process routes will be required if the region’s potential is to be unlocked. KWG’s desire to see the vast resources of chromite ores in the Ring of Fire (RoF) region effectively and efficiently exploited, to the benefit of all stakeholders led them to engage the Extractive Metallurgy Group at XPS Consulting and Testwork Services (XPS) and a private metallurgical consultant to provide these innovative alternatives for converting the chromite ores into saleable products. The most important aspect of the concept is that the process route must be economically viable over the long term. The chromite reserves already discovered in the Ring of Fire region indicate that the tonnage of ore is sufficient to sustain production over many decades, and well into the next century. A process which is sufficiently advanced to retain a competitive advantage far into the future is essential, and will remain competitive long after the logistical and infrastructural issues are resolved. To further frame the context some background into the chrome market is provided: Background Market-Related Information
The ferro-chrome market in general Chromium is an irreplaceable ingredient in all grades of stainless steels. It is the ingredient that renders stainless “stainless”. It is present in alloys in amounts from 12% to about 35% Cr, with generally the more Cr, the more corrosion resistant. It is also a key ingredient in high end superalloys used for turbines and jet engines. Chromite ores are the only source of chromium. The majority of chromite ores are processed into an intermediate product called high carbon ferro-chrome, or charge chrome, an alloy containing >50% Cr, about 6-8% C, varying amounts of Si (0-4%, depending on the process used), with the balance Fe. This material is the feedstock for the Argon Oxygen Decarburiser (AOD) process, which is a modified steel converter and the first step in producing a low carbon melt of Cr and Fe to which
COM 2015 | THE CONFERENCE OF METALLURGISTS hosting AMCAA | America's Conference on Aluminum Alloys ISBN: 978-1-926872-32-2
Page 2 of 22 Published by the Canadian Institute of Mining, Metallurgy and Petroleum | www.metsoc.org

other alloying elements like Ni are added before the liquid steel is cast into plates and then rolled into sheet which is the bulk of the stainless steel market, and the feed for the myriad of stainless products- pipes, tanks, containers, flanges, valves etc. required for industry and domestic consumers
Figure 1: The general market for chrome ore (Chrome Development Association) Prior to the development of the AOD process (and its various derivatives and hybrids), stainless steel was very expensive to produce because the intermediate low carbon ferroalloy product required a tricky and time-consuming decarburisation step using chromite ores. The market for low carbon ferrochrome has decreased, but a small, high value niche remains for those products where carbon and nitrogen levels have to be maintained at low levels (jet engine alloys being a prime example). This niche market is prepared to pay a premium of around 300% per unit of contained Cr based largely on the traditional method of making LC FeCr.
Figure 2: The chrome market in recent years
COM 2015 | THE CONFERENCE OF METALLURGISTS hosting AMCAA | America's Conference on Aluminum Alloys ISBN: 978-1-926872-32-2
Page 3 of 22 Published by the Canadian Institute of Mining, Metallurgy and Petroleum | www.metsoc.org

Cr metal is also used in certain applications where the presence of Fe is unacceptable. Cr for plating is generally provided in the form of chromate and dichromate chemicals or chromic acid, all of which contain Cr in the highly oxidized +6 state, known to be carcinogenic. A small amount of metallic Cr is produced by reacting chemical grade chromic oxide with metallic aluminium, analogous to the common thermite reaction between iron oxide and aluminium to produce molten iron. Production of low carbon FeCr alloy by aluminothermic reduction directly from chromite ores has not generally been practised because of a generally unfavourable energy requirement, especially with low grade ores. The production of stainless and low alloy steels containing chromium has rapidly expanded, particularly in Asia. The source of the chromium in the stainless steel is partly from the recycling of scrap but this is limited by the availability of such materials, particularly in developing countries. Chromium in stainless steels is not open to substitution by other metals. It is essential for the corrosion and heat resistance of the material. The shortfall in the chromium additions required during the steelmaking process is met by the addition of alloys of chromium and iron, collectively known as "ferro chrome". These alloys are produced by the smelting of chromite ores, using solid carbonaceous reductants in a Submerged Electric Arc Furnace (SAF). This process is extremely energy and carbon intensive. Existing plants using "best world practices" consume between 3 and 4 megawatt hours (MWh) of electricity and 200 to 300 kilograms of carbon per tonne of ferro chrome alloy produced. Comprehensive gas cleaning systems are required to meet clean air standards. Large quantities of slag are produced and placed in long term storage in above ground dumps. The development of huge deposits of natural shale gas in the USA and Canada has led to a fall in the long term cost of natural gas and the prospect of stable pricing for many years to come. In terms of its use as an energy source, natural gas is approximately ¼ of the price of the equivalent energy supplied as electricity. In order to progress the project, certain initial assumptions related to the general logistical implications needed to be made. While some factors are fixed by geography (the mine location and ports, for instance), others were selected purely for initial evaluation purposes (The location of the reduction plant and the rail route, for example), and can be altered following appropriate trade-off studies. Figure 1 and the associated table 1 below show the high-level perspective relating to the significant issue of transportation and were used to obtain the preliminary approximate distances relevant to the processes, summarised in the table below. These selections do not preclude alternative routes Table 1: Approximate Relevant Rail Distances. Rail description Distance (km) Mine site (A) to Nakina region (B) 330 Nakina region (B)to Timmins (C) 570 Timmins (C) to Montreal harbour (D) 850
COM 2015 | THE CONFERENCE OF METALLURGISTS hosting AMCAA | America's Conference on Aluminum Alloys ISBN: 978-1-926872-32-2
Page 4 of 22 Published by the Canadian Institute of Mining, Metallurgy and Petroleum | www.metsoc.org

Figure 3: Geography relevant to transport logistics.
Price trends related to product grade. A key aspect of the viability of the various process concepts proposed in this project is that they should be sustainable over the long term, and not dependent on short term market price spikes, nor should they be dependent for their success on a temporary oversupply of a particular raw material or commodity. While daily prices may be of some interest in establishing approximate revenues, the longer term trends are more important. Various sources of pricing data were used, including the LME, Metal Bulletin, American Metals Market, Kitco and InvestmentMine. Another important consideration is the basis on which the prices are quoted, and in this respect, not only the units, but also the grade, market location and settlement terms influence the price. While many of the macro-economic indicators (such as exchange rates, interest rates tax rates and relative inflation rates) play a role in the long term assessment of the project, at the conceptual level, the margin between revenue and cost should be maintained. The figure below shows 10 year trends based on monthly average prices for a number of metal products and raw materials relevant to the project.
COM 2015 | THE CONFERENCE OF METALLURGISTS hosting AMCAA | America's Conference on Aluminum Alloys ISBN: 978-1-926872-32-2
Page 5 of 22 Published by the Canadian Institute of Mining, Metallurgy and Petroleum | www.metsoc.org

Figure 4: 10-year price trends. With the exception of metallic chromium, for which data is only available from MB since July 2009, it can be seen that there is a strong relationship between the scrap prices and the prime commodities, as would be expected. This chart does show two important general trends though, both of which are favourable indicators for the project. Firstly, the price of Natural Gas shows a distinct drop from a price trending in the 700 cents per MBtu range prior to 2009 and a price closer to 400 cents per MBtu post 2009. While this may be related to changed practices such as large scale fracking operations, the reality is that Natural Gas, as a source of energy will likely stay in the lower price range over time. The commodities, products and price ranges of interest in this study include those tabled below: Table 2: Relevant Commodity Prices Commodity Grade Price Basis Units Range Median Location Natural Gas Bulk Nymex Cents per Mil Btu 200-570 400 East Coast NA Electricity Industrial Ontario Hydro $ per MWh 35-80 60 N. Ontario High C FeCr 65% Cr Del Warehouse, Cents/lb contained Cr 50-500 130 Pittsburgh Chromite ore 40-42%
Cr2O3 CIF China port, $/t contained Cr2O3 145-265 185 China port
Engineering Aspects of the innovation with relevance to equipment sizing.
a)Ore quality: For the purposes of estimating the relative amounts of material to be shipped and the amount of feed required for various process options, the following analysis of chromite ore from the Black Hor se deposit in the Ring of fire area was used. It differs little from other chromite ores in the region.
COM 2015 | THE CONFERENCE OF METALLURGISTS hosting AMCAA | America's Conference on Aluminum Alloys ISBN: 978-1-926872-32-2
Page 6 of 22 Published by the Canadian Institute of Mining, Metallurgy and Petroleum | www.metsoc.org
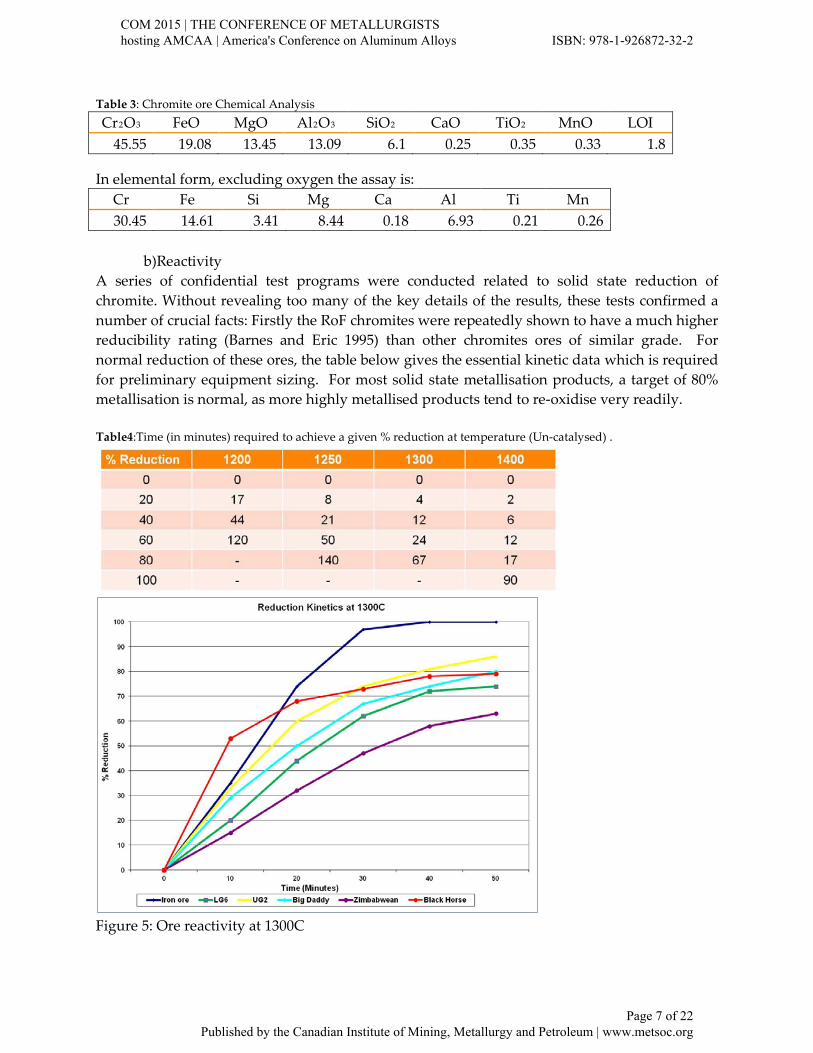
Table 3: Chromite ore Chemical Analysis Cr2O3 FeO MgO Al2O3 SiO2 CaO TiO2 MnO LOI
45.55 19.08 13.45 13.09 6.1 0.25 0.35 0.33 1.8
In elemental form, excluding oxygen the assay is: Cr Fe Si Mg Ca Al Ti Mn 30.45 14.61 3.41 8.44 0.18 6.93 0.21 0.26
b)Reactivity
A series of confidential test programs were conducted related to solid state reduction of chromite. Without revealing too many of the key details of the results, these tests confirmed a number of crucial facts: Firstly the RoF chromites were repeatedly shown to have a much higher reducibility rating (Barnes and Eric 1995) than other chromites ores of similar grade. For normal reduction of these ores, the table below gives the essential kinetic data which is required for preliminary equipment sizing. For most solid state metallisation products, a target of 80% metallisation is normal, as more highly metallised products tend to re-oxidise very readily. Table4:Time (in minutes) required to achieve a given % reduction at temperature (Un-catalysed) .
Figure 5: Ore reactivity at 1300C
COM 2015 | THE CONFERENCE OF METALLURGISTS hosting AMCAA | America's Conference on Aluminum Alloys ISBN: 978-1-926872-32-2
Page 7 of 22 Published by the Canadian Institute of Mining, Metallurgy and Petroleum | www.metsoc.org

In addition to the conventional carbonaceous reduction, XPS conducted numerous tests on reduction behaviour using a patented accelerator. The details of the patent application are provided (Winter). A significant feature of the patented process is that the conversion of the chromite ore to ferro-chrome occurs via a two-step catalysed reaction with a much lower free energy of formation than the equivalent uncatalysed conventional carbothermic reduction using carbon alone. For the reactions occurring with the use of the accelerator, the following results are obtained: Note the much lower temperatures and the higher degrees of metallisation achieved. Table5:Time (in minutes) required to achieve a given % reduction at temperature (Catalysed) .
% Reduction 1000 1150 1200 1250 0 0 0 0 0 20 15 12 10 3 40 23 18 15 7 60 40 30 22 12 80 - 60 30 23 100 - - 110 60 The very substantially reduced reaction times mean very large increases in specific throughput for a given temperature, (for an operating temperature of 1200oC for example), the catalysed system has 6x higher throughput than a similar sized reactor without catalysis. As the reactor size gets smaller, however, the challenges relating to specific energy input increase, and the overall energy input will become the size limiting factor. Lower operating temperatures, though also imply lower total energy consumption given the fixed specific heats of the materials involved, and the enthalpies required for the various reactions occurring. For comparative purposes however, the specific throughput of the reduction kilns used in the Premus process, on lower reactivity ores is used for primary unit sizing. Operating temperatures of 1200oC are assumed for the purposes of this comparative study. In- house operating data is used to size the major equipment items.
Mass Balances and reagent estimates. In order to assess the quantities of the various reagents, binders and fluxes, Metsim balances for a number of scenarios were set up. For the benchmark SDR process, as well as the conventional semi-closed smelting furnace, consumption data extracted from (the Mintek “Handbook on the estimation of metallurgical process costs” (Ref Ruhmer pages 160 and 161) was used while for the other processes, relevant minor adjustments were made to take into account the specifics of the respective process. Table 6: Direct Operating cost data for semi-closed furnace operation
COM 2015 | THE CONFERENCE OF METALLURGISTS hosting AMCAA | America's Conference on Aluminum Alloys ISBN: 978-1-926872-32-2
Page 8 of 22 Published by the Canadian Institute of Mining, Metallurgy and Petroleum | www.metsoc.org

Item Unit Price($) Unit Consumption Rate /t FeCr
Cost $/t FeCr
Ore (lumpy) 100 T 2.8 280 Char/ Coke 200 T 0.68 136 Limestone 60 T 0.11 6.6 Dolomite 40 T 0.05 2 Quartzite 30 T 0.2 6 Electrode Paste 450 T 0.0095 4.4 Casings 400 T 0.002 0.8 Electrical power 80 MWh 3.8 304 Operating labour 40 Man hours 0.8 32 Maintenance Percent 5% 40 TOTAL 812 Table 7: Operating Cost estimate for DC Furnace Item Unit Price ($) Unit Consumption Rate
/t FeCr Cost $/t FeCr
Ore (lumpy) 100 T 2.2 226 Char/ Coke 200 T 0.07 14 Limestone 60 T 0.11 6.6 Dolomite 40 T 0.05 2 Quartzite 30 T 0.2 6 Graphite Electrode 800 T 0.0035 2.8 Anthracite 60 T 0.6 36 Electrical power 80 MWh 4.0 320 Operating labour 40 Man hours 0.8 32 Maintenance Percent 5% 40 TOTAL 685 Table 8:Operating Cost for Premus Process using natural gas A: Prereduction Item Unit Price ($) Unit Consumption Rate
/t FeCr Cost $/t FeCr
Ore (lumpy) 100 T 2.0 200 Anthracite 60 T 0.250 15 bentonite 200 T 0.04 8 Natural Gas 400 c/MMBtu 9.75 MBtu/t 39 Electrical power 80 MWh 0.07 5.6 Operating labour 40 Man hours 0.8 32 Maintenance Percent 7% 56 TOTAL 356 Note: The operating cost of pellet production in A above is taken as the pellet price in B below. This value is significant in terms of estimating the value of the intermediate metallised (reduced) ore as feedstock to an existing furnace. B: Closed Furnace Smelting Item Unit Price ($) Unit Consumption Rate
/t FeCr Cost $/t FeCr
Pellets 356 T 1.05 426 Char/ Coke 200 T 0.1 20 Limestone 60 T 0.1 6
COM 2015 | THE CONFERENCE OF METALLURGISTS hosting AMCAA | America's Conference on Aluminum Alloys ISBN: 978-1-926872-32-2
Page 9 of 22 Published by the Canadian Institute of Mining, Metallurgy and Petroleum | www.metsoc.org

Quartzite 30 T 0.1 3 Electrode Paste 450 T 0.005 2.3 Casings 400 T 0.001 0.4 Electrical power 80 MWh 2 160 Operating labour 40 Man hours 0.8 32 Maintenance Percent 5% 40 TOTAL 640 As publicised by Glencore Alloys, (Ref here) owners of the Premus process, the two stage prereduction process is clearly the cheapest process of the 3 current commercial processes above, especially if natural gas is used to provide thermal energy for the reduction kiln.. Based on the Premus concept, but utilising the kinetic and thermal benefits of the patented KWG process, the new process has a compelling operating cost advantage. A Metsim heat and mass balance model of the process was constructed to determine unit consumptions as illustrated below
Figure 6: Simplified Kiln-based reduction using solid reductant and natural gas heating. Since the feasibility of the natural gas reduction concept has to meet basic economic criteria, the Metsim consumption rates are used to estimate unit consumption figures for the various cost items. The Metsim figures are compared to Premus operating data as well as a Mintek evaluation of the process (Ref Ruhmer), which provided suitable consumption rates. These consumptions, multiplied by the assumed unit cost of each item result in a cost, expressed either in annual terms or on a “per ton of product” basis.
214 kg Gas478 °C
16 kg Coal20 °C 0 kg Air
100 kg Ore 20 °C20 °C
4 kg Binder20 °C
214 kg Kiln Gas1109 °C
120 kg Preheated Ore 10 kg NG (20°C)1180 °C 170 kg Air
487 °C86.4 kg Product1200 °C
46.8 kg Alloy 170 kg Air39.6 kg Gangue 20 °C100 °C
Ore Preheater
Reduction Kiln
Cooler
COM 2015 | THE CONFERENCE OF METALLURGISTS hosting AMCAA | America's Conference on Aluminum Alloys ISBN: 978-1-926872-32-2
Page 10 of 22 Published by the Canadian Institute of Mining, Metallurgy and Petroleum | www.metsoc.org

As will be evident, the operating cost is preliminary, as much of the data is uncertain at this stage. The overall ranges are however sufficiently accurate to provide an initial assessment of the overall financial feasibility of the concept and a simple payback estimate based on the order-of-magnitude capital cost estimates available at the current level of study. This results in the data in table 7: Table 9: High Level Comparative Economic Assessment
This information, in isolation, merely indicates that the production of an intermediate metallised chromite appears economically attractive. It cannot be considered in isolation, but requires benchmarking against existing commercial technologies. This is especially important because such an intermediate material is not currently available on the open market, and the only metallised pellets currently produced are completely consumed in-house. Current purchasers (typically SAF furnace operators) of chromite ore would have to be convinced of the economic benefits of using the metallised product in their furnaces in place of ore, and the price would have to be sufficiently attractive as an incentive. In order to establish the business model the overall economics have to be considered including mine capital, ore mining costs and the cost of shipping the ore to the process facility and the metallised product to market. Preliminary Techno-Economic Evaluation The basic information gathered to date needs to be evaluated in terms of the economic factors that will determine whether a commercially viable, sustainable business can be developed on the basis of what is currently known about the ore with respect to the production of a solid-state metallised intermediate product, presented to the market at a price suitably positioned between that of raw ore and high carbon ferrochrome alloy.
Scenario Comparison Units
Innovative Prereduce DC Smelt
2 stage XPS Process
Complete Premus Outotec
Mining cost $/t 55 55 55 55 55Ore to plant rail $/t 20 20 20 20 20beneficiation cost $/t 4 0 4 4 4Rail to plant 0 0 0 0 0process Cost 100 408 110 300 360Rail to port $/t 32 20 22 20 20Ship to market $/t 12 7.5 8 7.5 7.5
Total Cost 223 510 219 407 467Nett margin $/t ore 166 115 235 186 93Cr Grade % Cr 60 65 60 60 60Cr units kg 299 299 299 299 299Price per Cr unit $/kg Cr 1.3 2.2 1.6 2.2 2.2metal Recovery % Cr 100 95 95 90 85
Target Tonnage t/annum 2400000 2400000 2400000 2400000 2400000
Nett Revenue $/annum 397680000 275376000 565152000 445248000 222312000
Capex $ 1500000000 3000000000 1600000000 3600000000 3200000000
Simple Payback Years 3.8 10.9 2.8 8.1 14.4
COM 2015 | THE CONFERENCE OF METALLURGISTS hosting AMCAA | America's Conference on Aluminum Alloys ISBN: 978-1-926872-32-2
Page 11 of 22 Published by the Canadian Institute of Mining, Metallurgy and Petroleum | www.metsoc.org
While the large size of the reserves suggest that a low operating cost will be more important in the long term than a low capital cost, capital is currently in short supply, and any capex –reducing options which do not negatively impact the opex should be considered. Capex is a function of throughput, but the relationship is not linear. The size of the reactors required to achieve a particular throughput is a function of the specific unit capacity and practical maximum equipment size. This is in turn mainly a function of reaction rates- the faster a reaction occurs the smaller the reactor can be for a given output. The rate of reduction is known to be affected by a number of variables, including:
1 Particle size of ore 2 Particle size of reductant 3 Reactivity of solid reductant 4 Temperature 5 Presence of catalyst or accelerators
Final, and even preliminary, equipment sizing is impossible at this stage, but certain high level estimates can be made, such as those shown in the previous section, which enable an indicative capital cost estimate to be performed. Operating Cost Comparison
Factors influencing operating cost In studies such as these, exact costs and exact consumption rates are rarely known with a high degree of accuracy, but the application of Monte Carlo-type statistical risk assessment tools is an appropriate tool to use at this stage as it highlights the sensitivity of the overall economics to the variables and the ranges estimated Where unit consumptions can be extracted from operating plants the variability is reduced. In the case of the current study operating data from the best operating practice relevant to the study is used as a benchmark. By way of example, the specific power consumption for the conventional smelting plant is known and providing the same electrical power cost ranges are used for both the benchmark and the competitor the comparison results are valid. Uncertainty ranges for each item of price and consumption rate are applied to the various assumptions in the operating and capital cost portions of the data tables and the range of outcomes evaluated in terms of the major sensitivities, identifying which cost items have the biggest influence on the overall cost. This in turn suggests where the focus of the next stage of work should be placed and avoids time wasting on extraction of accurate values for minor or insignificant influences. For the Operating Cost Comparison Analysis, the following parameters were regarded as variables in the simulation:
COM 2015 | THE CONFERENCE OF METALLURGISTS hosting AMCAA | America's Conference on Aluminum Alloys ISBN: 978-1-926872-32-2
Page 12 of 22 Published by the Canadian Institute of Mining, Metallurgy and Petroleum | www.metsoc.org

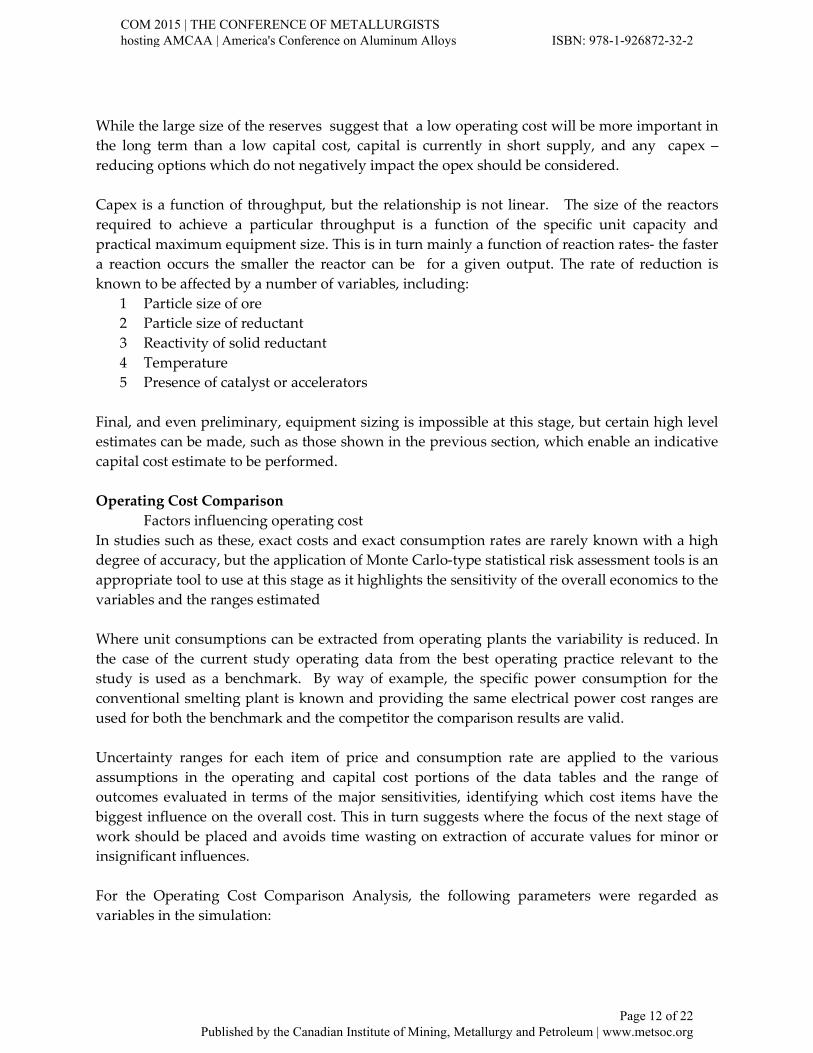
Table 10. Variables used Variable Variable Electrical Power Flux Natural Gas Anthracite Operating Labour Accelerant Electrodes Maintenance spares Refractories Electrode Paste Binders Coal An example of the variable setup is shown in table 10 below, for the conventional semi closed arc furnace. Items highlighted in green are varied in the simulation using the stated ranges randomly applied over 10000 iterations to obtain a statistical range of the possible direct operating costs (the blue cell) which are displayed as a histogram as shown in figure 5. Table 11: Example of cost input table
The program then analyses the sensitivity of the results to the variables and presents them in the form of a “tornado” graph ranking the variables from most sensitive to least. Not unexpectedly the cost of electrical power was the single most important variable, and 80% of the total cost variation is related to power costs. A simple overlay of the histogram outlines is produced in figure 6 to show that the differences in operating costs are statistically significantly different. If the cost of ore is taken into account the differences become even more significant, as the conventional process requires considerably more ore than the other processes because of its inherently poorer metal recovery. The kiln-only process has theoretically a 100% recovery of Cr units as the metallised and oxide Cr units
Conventional Operating Cost ($/t FeCr)Rate Price
Item min max median min max median Totalore Coke 0.15 0.25 0.2 100 300 220 44Anthracite 0.15 0.25 0.2 80 200 120 24 Coal 0.2 0.3 0.2 30 80 60 12Nat Gas 0 0 0 0Furnace Power 3.4 4.4 3.8 35 80 60 228 Kiln Power 0 0 0 0Other Plant Power 0.05 1 0.07 35 80 60 4.2 Flux 0.2 0.4 0.3 30 80 50 15Refractories 10 20 15 1 1 1 15 Electrodes 0 0 Paste 0.009 0.012 0.01 350 500 450 4.5Binders 0 0mechanical Parts 30 40 35 1 1 1 35Pelletising 0 0 0 0Grinding 0 0 0 0 Pelletising Labour 0 0 0 0 Kiln Labour 0 0 0 0 Furnace labour 0.7 0.9 0.8 30 50 40 32
413.7
COM 2015 | THE CONFERENCE OF METALLURGISTS hosting AMCAA | America's Conference on Aluminum Alloys ISBN: 978-1-926872-32-2
Page 13 of 22 Published by the Canadian Institute of Mining, Metallurgy and Petroleum | www.metsoc.org
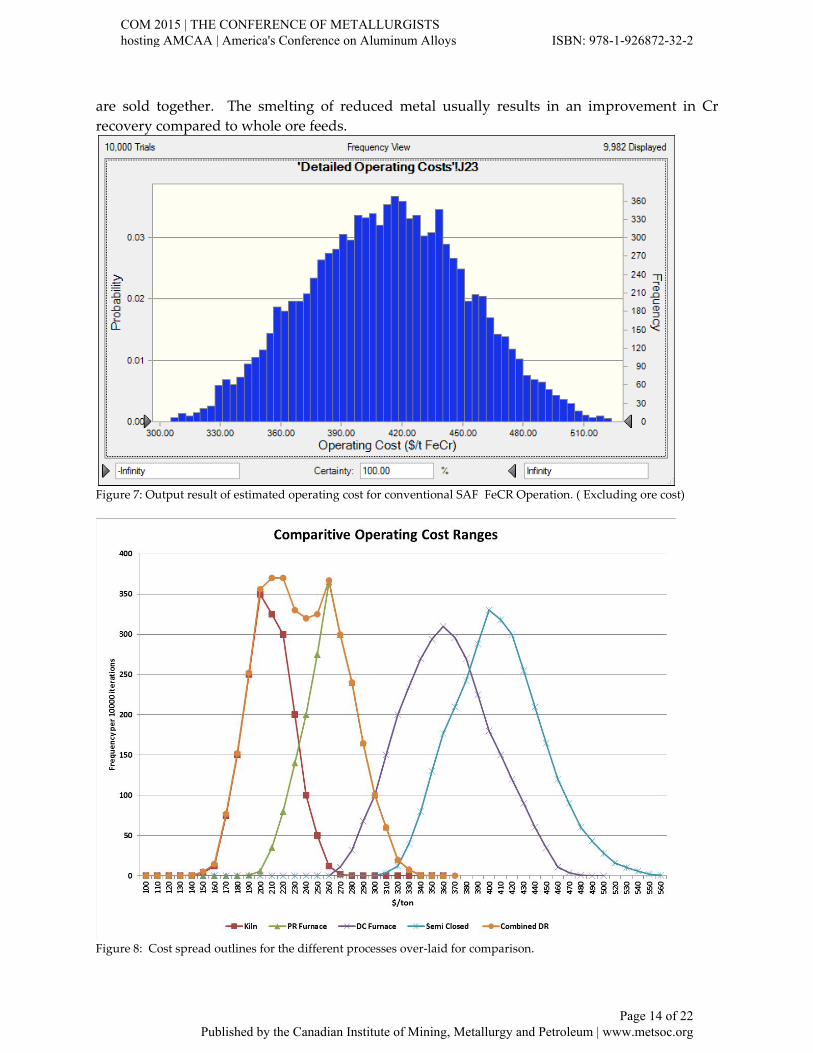
are sold together. The smelting of reduced metal usually results in an improvement in Cr recovery compared to whole ore feeds.
Figure 7: Output result of estimated operating cost for conventional SAF FeCR Operation. ( Excluding ore cost)
Figure 8: Cost spread outlines for the different processes over-laid for comparison.
COM 2015 | THE CONFERENCE OF METALLURGISTS hosting AMCAA | America's Conference on Aluminum Alloys ISBN: 978-1-926872-32-2
Page 14 of 22 Published by the Canadian Institute of Mining, Metallurgy and Petroleum | www.metsoc.org

Comparative Capital Cost Estimates Factors influencing capital cost It is common in projects where the capital cost of the process facilities required to convert the ore to saleable grade is possibly much larger than the cost of establishing the mine itself, to conduct early scoping studies at the commonly described “plus/ minus 50% accuracy” level. Such studies are themselves flawed as they do not explain how the uncertainties are estimated, nor what level of detail is required to bring the estimate to the +/- 35%; +/- 15% and +/- 10% levels and indeed, recent project execution has shown that even the so-called definitive final cost estimate is still incorrect by far more than the allocated contingency, and often as a result of delays and the cumulative cost of financing. Use of statistical estimation tools like Crystal Ball are better able to evaluate the probability of the costs being within a certain range , and predict the probability of the final cost being over the original estimate by a certain percentage. As far as the general accuracy of the capital cost estimate is concerned the number improves if an identical facility has recently been constructed. Next best is costs based on detailed engineering drawings, with material take offs and based on written vendor quotes. The less detailed the project definition and the plant specification the more variability in the capital cost. At the detail level, issues like support infrastructure, distance from service and repair centres, level of automation and control, weather and locality all have an influence on the cost. Finally the type of project management contract in place for the project has a perhaps larger than expected influence on the price. In the case of the current study, the capital cost for a conventional plant can be estimated with a much tighter range, as it can be based on actual recent projects, but the hypothetical plant can only be broadly estimated as many of the details remain very vague at this early stage. XPS has access to a broad database of capital costs for many metallurgical unit operations which can be escalated based on time or scaled according to capacity. Input variables such as the cost of borrowing capital, the construction time and production ramp–up are then added. This allows a measure of technical risk to be evaluated, which is especially important when a new technology is compared to an established process route. The results can then be reviewed in terms of the impact of construction delays, commissioning problems or cost over-runs to perform plant modifications can be assessed. A confidential study of a number of recently installed FeCr smelting facilities revealed the following broad patterns where capital cost (represented by the relative size of the coloured balloon) is divided by the annual plant capacity (the x-axis) to produce a capital cost per annual ton (the y-axis) for various types of chromite smelting technologies and levels of complexity or sophistication, illustrating the wide range of costs possible. A major influence on costs from this analysis is the type of project. Comparison of the projects showed that turnkey EPCM contracts resulted in the highest cost per unit capacity, while owner-managed projects produced a distinctly lower unit cost.
COM 2015 | THE CONFERENCE OF METALLURGISTS hosting AMCAA | America's Conference on Aluminum Alloys ISBN: 978-1-926872-32-2
Page 15 of 22 Published by the Canadian Institute of Mining, Metallurgy and Petroleum | www.metsoc.org

Since KWG was not an experienced operator, nor did it have the technical depth to manage projects of this nature , the unit capital cost was expected to tend toward the higher values. The location of the plant also influences the cost, and a plant situated in Northern Ontario would be significantly more expensive than one in a more benign climate. Other data from trade off studies on plant location indicate that the overall cost of a plant located in Northern Ontario would be around 20% higher than one in a temperate climate.
Figure 9: Capital Intensity of Recent FeCr smelter projects A detailed analysis of the commercial two stage reduction-smelting process (Premus or SCR) indicates that the capital is split 50:50 between the reduction and the smelting unit operations, and that the overall capital cost for a two-stage operation is about 50% higher than for a single stage smelting operation only, based on identical annual metal production capacity. In other words a reduction facility based on rotary kiln technology, capable of providing sufficient metallised product to feed a smelter of a given capacity (x thousand tpa alloy), and having a capital cost of $1200 dollars per annual ton) would cost 0.75x or $900 per annual ton. More significantly from a valuation perspective, smelters purchasing the metallised product would however obtain a smelter capacity increase of 50% without any additional capital expenditure, reducing their effective capital cost from $1200 per annual ton to $800. The above relationships hold for kiln based reduction processes, for which reliable cost data exists, based on reduction kinetics and unit throughputs for South African ores. Testwork performed on Ring of Fire ores confirm firstly that the Ring of Fire ores are generally more reducible, resulting in a 15-20% increase in unit capacity compared to currently processed ores. Testwork on the use of select accelerants has shown, in addition, that kinetics can be further improved and operating temperatures lowered considerably, likely resulting in an even greater increase in unit capacity, to approximately double that considered in the techno-economic comparison.
COM 2015 | THE CONFERENCE OF METALLURGISTS hosting AMCAA | America's Conference on Aluminum Alloys ISBN: 978-1-926872-32-2
Page 16 of 22 Published by the Canadian Institute of Mining, Metallurgy and Petroleum | www.metsoc.org

Operation of the reduction plant using natural gas as the major heat source simplifies operation and reduces capital cost slightly compared to coal based heating. Temperatures used in the most recent testwork suggest that alternative technologies with a significantly lower unit capital cost could be viable, but since this work is still ongoing, the full benefits cannot be incorporated into this study. Greenhouse gas emission comparison Since carbonaceous reduction is very energy intensive, and uses fossil fuels to provide heat either directly from combustion or via electrical energy (electric arc furnaces), and carbon dioxide is the major greenhouse gas produced by these processes, conversion to natural gas, for the provision of a portion of the overall energy reduces the CO2 emissions. . In order to provide some comparison of the relative greenhouse gas emissions, the following general assumptions are made: 1 All current FeCr production is performed in countries where the electrical energy is
produced largely by coal-fired power stations. Assume 70% of electrical power in these countries is from coal
2 Notwithstanding statements about energy efficiency of coal fired electrical generation, and assuming a well-operated station using high grade coal, having a calorific value of 28 MJ/kg, 1MWh of power (3600MJ) requires 128 kg of coal.
3 An arc furnace consuming 4MWh of power to produce 1 ton of FeCr will therefore require 514 kg of coal (at 100% of power from coal
4 A conventional arc furnace process for FeCr is then assigned an electrical equivalent of 0.7x 514= 360 kg of coal. This relationship is carried forward for the other processes.
This results in figure 10.
Figure 10: Comparison of Fossil Fuel demand.
COM 2015 | THE CONFERENCE OF METALLURGISTS hosting AMCAA | America's Conference on Aluminum Alloys ISBN: 978-1-926872-32-2
Page 17 of 22 Published by the Canadian Institute of Mining, Metallurgy and Petroleum | www.metsoc.org

The balance of the energy requirement in the KWG process developed at XPS is provided by natural gas, which has a higher calorific value than coal, Consumption is very conservatively estimated at 80% of that of the overall premus process, an estimated 136 kg gas per ton FeCr. This is based on: 1 The lower operating temperature of the KWG process 2 The higher CV of gas (37 MJ/m3 )
From a greenhouse gas emission perspective, the burning of 1 ton of coal (80% C) produces 2.9 tons of CO2. Combustion of natural gas produces 2.75 tons of CO2 per ton of gas. Using this relationship, the carbon footprint can be produced as shown in figure 9.
Figure 11: Comparative Carbon Dioxide Emissions General Environmental Considerations The production of high carbon ferrochrome is a reductive process, and as such changes the oxidation state of the chromium in natural chromite from the plus 3 (Cr3+) oxidation state to zero. Unreduced chromium in the slag is in the 3+ state, which is chemically very stable. With the older semi-closed processes, some hot dust can be subjected to oxidation and under certain circumstances small quantities of the more hazardous hexavalent (Cr6+) chrome can be detected in the dust, necessitating care in handling. The modern closed furnace processes do not have a tendency to create oxidised dusts, and are generally accepted as being environmentally acceptable. There is no reason to suspect that the prereduction process would change this in any way. The production of molten metallurgical slag may be reduced, but since this is not hazardous the conclusion is that from a general environmental perspective, process selection is not influenced by environmental issues.
COM 2015 | THE CONFERENCE OF METALLURGISTS hosting AMCAA | America's Conference on Aluminum Alloys ISBN: 978-1-926872-32-2
Page 18 of 22 Published by the Canadian Institute of Mining, Metallurgy and Petroleum | www.metsoc.org

Discussion Since testwork on the development of this innovative process is still ongoing, much of the comparison has been conservative, and based on previously established parameters for already commercialized operations. Nevertheless, the substantial benefits and the very clear competitive advantage of the solid state reduction process in terms of reduced capital cost, reduced operating cost, and reduced greenhouse gas emissions already make a compelling case. On top of this the potential to further reduce operating costs by improved kinetics remains. Added to this is the potential to reduce or even eliminate the need for a distinct smelting step and replace it partially or completely with a mineral beneficiation process or a low temperature melt consolidation. Since the product produced by the reduction process should be highly desirable to existing smelters, the potential to increase output is not limited by the need to process only sufficient ore to satisfy the economics of rail transport from the mine site to the process plant (currently estimated at somewhere between 2.4 and 3 million tons per annum) but may become limited by that very rail capacity to a tonnage closer to 20 million tons per annum. The full significance of this on a global scale has yet to be grasped. Conclusions Based on the methodology employed, the innovative process meets all the criteria initially set: 1. The need for the installation of a capital intensive smelting step is eliminated 2. An intermediate process which upgrades the ore to a saleable intermediate product is viable 3. This process has lower capital requirements than that of conventional charge chrome
smelting 4. The process effectively utilises the substantial cost and environmental benefits of natural gas
for energy. 5. The need for subsidised electrical energy is eliminated 6. The operating costs for the process are significantly lower than those involving smelting as
the primary method of upgrading.
COM 2015 | THE CONFERENCE OF METALLURGISTS hosting AMCAA | America's Conference on Aluminum Alloys ISBN: 978-1-926872-32-2
Page 19 of 22 Published by the Canadian Institute of Mining, Metallurgy and Petroleum | www.metsoc.org

Figure 12: Comparative energy consumption for various chrome conversion processes The “proof of the pudding” of course is that the process actually works, and many sceptics have commented that it is thermodynamically impossible to produce metallic chrome by routes other than direct reduction using solid carbon. The image below is one of the early beneficiation products – a gravity concentrate produced from material reduced using the KWG process described in this paper, and demonstrates that not only does the reduction process work, but that under certain conditions, an intermediate product is generated that is amenable to upgrading by purely physical means (such as gravity separation) and results in a saleable product without any need for molten material generation.
1) Conventional Smelting
Electricity Gas @ 1700°CCoke 6.7 MWh/t Cr in ElectricityOre 8.6 MWh/t Cr in Fuel
10.5 t CO2/t Cr
SlagFeCr
2) OutokumpuElectricity
CokeOre
5.8 MWh/t Cr in ElectricitySlag 8.6 GJ/t Cr in FuelFeCr 8.8 t CO2/t Cr
3) Premus
Electricity 4.0 MWh/t Cr in ElectricityCoal 9.0 MWh/t Cr in FuelOre 8.6 t CO2/t Cr
SlagFeCr
4) XPS
NG GangueOre 0.3 MWh/t Cr in Electricity
9.0 MWh/t Cr in Fuel2.4 t CO2/t Cr
FeCrSeparation
* CO2 emissions include CO2 from coal-fired electricity at 1029 kg CO2/MWh Source: EPA (http://www.epa.gov/cleanenergy/energy-and-you/affect/coal.html)
Pre-heat Pre-reduce
Pre-heat
Pre-heat Pre-reduce
0.02.04.06.08.0
10.012.0
Conv Smelting
Elec Fuel CO2
0.02.04.06.08.0
10.012.0
Premus
Elec Fuel CO2
0.02.04.06.08.0
10.012.0
Outokumpu
Elec Fuel CO2
0.02.04.06.08.0
10.012.0
XPS
Elec Fuel CO2
MWh/t Cr MWh/t Cr t CO2/t CrCO2*
COM 2015 | THE CONFERENCE OF METALLURGISTS hosting AMCAA | America's Conference on Aluminum Alloys ISBN: 978-1-926872-32-2
Page 20 of 22 Published by the Canadian Institute of Mining, Metallurgy and Petroleum | www.metsoc.org

Figure 13: SEM image of some beneficiated product alloy. The potential for this process to completely revolutionise the world’s ferrochrome industry should not be underestimated. Its impact reaches far beyond exploitation of a regional natural resource. The economic benefits of adopting the technology are so compelling that additional resources should be expended on accelerating the conversion of the process from the small scale exploratory work currently under way to pilot scale testing both of kiln based as well as fluid bed based operations as quickly as possible. From a global perspective, testing of the amenability of other chromite ores to respond to the accelerants used in the current testwork should be pursued. Acknowledgements The authors thank XPS Testwork and Consulting Services and KWG Resources Inc. for permission to publish this paper. We are also indebted to many experts whose opinions and guidance have helped shaped the direction of this innovative project, including Mr. Frank
COM 2015 | THE CONFERENCE OF METALLURGISTS hosting AMCAA | America's Conference on Aluminum Alloys ISBN: 978-1-926872-32-2
Page 21 of 22 Published by the Canadian Institute of Mining, Metallurgy and Petroleum | www.metsoc.org

Winter of American Metal Sales, Jay Turner of Pope and Company, Matt Cramer (Hatch Associates) and Dr. Nick Dawson of Glencore Alloys. References Ruhmer, W.T Handbook on the estimation of metallurgical process costs. Mintek Special Publication #14.
Barnes, A R and Muinonen, M. KWG Gaseous Options Report. Confidential XPS report 3 Jan 2014. Ruhmer, W.T. Handbook on the Estimation of Metallurgical Process Costs. Mintek Special Publication #14. 1991. Barnes, A.R The Prereduction and Smelting of UG2 Chromite Concentrates. M.Sc Eng. Thesis University of the Witwatersrand, 1980. Barnes, A.R; Finn, C.W.P and Algie, S.H. The Prereduction and smelting of chromite concentrates of low chromium-to-iron ratio. JSAIMM March 1983. Barnes, A.R and Eric, R.H. The Relative Reducibilities of Chromite Ores and Relative Reactivity of Carbonaceous Reductants. Infacon 7. Trondheim 1995 Naicker, O and Riley, T. Xstrata Alloys in profile. South African Pyrometallurgy 2006. Ed R. T Jones, SAIMM March 2006. Rankin, W. J. The Composition and structure of chromite during reduction with carbon. Arch. Eisenhuttenwes. Vol. 50 No 9 1979, pp 373-378. Rankin, W. J and Finn, C.W.P. Solid State reduction by graphite and carbon monoxide of chromite from the Bushveld Complex. Randburg, Mintek Report 1957 May 1978. EMJ, The Ring of Fire's slow burn - Making progress in the mineral-rich region despite setbacks, July 2014 Pope and Co: A New Technology for a New Chromite District: The New King of the Ring? July10 2014. Winter, Frank (Inventor), KWG Resources Inc. (Assignee) Provisional Patent: Production of chrome alloys directly from chromite ores. US 61/893,400 International 4562PCT, 21October 2013
COM 2015 | THE CONFERENCE OF METALLURGISTS hosting AMCAA | America's Conference on Aluminum Alloys ISBN: 978-1-926872-32-2
Page 22 of 22 Published by the Canadian Institute of Mining, Metallurgy and Petroleum | www.metsoc.org