Embed Size (px)
Citation preview

Colours
Cholamandalam Investment and Finance Company Limited
Corporate Presentation – December 2017

Colours
Table of Contents
Corporate Overview
Business Overview
Funding Profile
Business Enablers
Financial Performance
Subsidiaries
2

Colours
CORPORATE OVERVIEW
3

Colours
Company Highlights
Positioning
Established in 1978, one of India’s
leading NBFC’s, focused in the rural
and semi-urban sector with a
market capitalisation of ₹ 202bn1
Exceptional Lineage
A part of the ₹ 300 bn Murugappa
Group – founded in 1900, one of
India's leading business conglomerates
with 28 businesses including 8 listed
companies and workforce of 40,000
employees
Robust Sector Growth
Presence across vehicle finance,
business finance, home equity
loans, stock broking and
distribution of financial products
Diversified Footprint
Operates from 858 branches across 27
states and 87.5% presence across Tier
III IV, V, and VI towns
One of the leading NBFCs in Asset
Financing Business
Robust Operating Profile
Total AUM of ₹ 419 bn as of Dec 2017
with Net NPA of *2.33% and a healthy
RoA of 4.6 %
Operating income CAGR of 13% over FY13
to FY17
Management
Highly experienced management team
with unrivaled industry expertise
Significant synergies with the
Murugappa group, deriving operational
and financial benefits
1. Market data as on 31st Dec 2017. Source: BSE
* At 3 months overdue
1 2
3
45
6
4

Colours
5
FY 2018
• India Rating and CARE upgraded Long term rating to AA+
• Total AUM crossed ₹ 390 bn
1. Except 2009, average dividend payout for the last 10 years is 30% on capital.
2. Total AUM – Assets under Management
Journey So Far …Consistently profit making and dividend paying1 company since 1979 with a strong track record of dividends to shareholders
FY 1979-90
• Commenced EquipmentFinancing
FY 2011
• Obtained AFC Status
• Terminated JV with DBS
• Infused Capital of ₹ 2500 mn
FY 2013
• Total AUM crossed ₹ 200 bn
• Infused Capital of ₹ 3,000 mn
• Commenced HL Business
• Increased VF Branch network to 473
FY 2015
• Infused Capital of ₹ 5,000 mn through CCPS
• India Ratings upgraded to AA
• Adopted GNPA Recognition at 150 days
• Increased Branch network to 534
FY 2017
• Total AUM crossed ₹ 369 bn
• Brickworks upgraded to AA+
• Adopted GNPA Recognition at 90 days
• Increased branch network to 703
FY 1990-2000
• Commenced Vehicle Finance Business
• Started Chola Securities
FY 2006-10
2006• JV with DBS Bank
Singapore• Commenced
Consumer Finance & Home Equity
2009• Exited Consumer
Finance Business
FY 2012
• Total AUM crossed ₹ 130 bn
• Infused Capital of₹ 2,120 mn
• Rating Upgraded to AA from ICRA
• Commenced Tractor Business
FY 2014
• Total AUM have crossed ₹ 250 bn
• CARE Rating upgraded to AA
• Commenced CE Business
FY 2016
• Invested in White Data Systems India Ltd with 63% stake
• CCPS got converted to Equity Shares
• Adopted GNPA Recognition at 120 days
• Total AUM crossed ₹ 300 bn
FY 2000-05
• Started Chola Distribution

Colours
Major Companies – Murugappa Group
Company NameMarket
CapitalisationDescription
₹ 2,02,278 mn(US$ 3,164 mn)
Cholamandalam Investment and Finance Company Limited is a Non BankingFinance Company and one of the leading financial provider for vehicle finance,business finance, home equity loans, home loans, stock broking & distribution offinancial products
₹ 168,450 mn(US$ 2,635mn)
Coromandel International Limited is the leading phosphatic fertilizer company inIndia, with a production capacity 3.2 mn tonnes of phosphatic fertilizer.
₹ 70,982 mn(US$ 1,110 mn)
Carborundum Universal Limited is a pioneer in coated and bonded abrasives,super refractories, electro minerals and industrial ceramics. The Companycurrently has presence in Australia, South Africa, Russia, Canada and Middle East.
₹ 65,470 mn(US$ 1,024mn)
EID Parry (India) Limited offers wide range of agro products such as sugar,microalgal health supplements and bio products, with a capacity to crush 34,750tones of cane per day (TCD)
₹ 49,297mn (US$ 771mn)
Tube Investments of India Limited offers wide range of engineering products suchas Steel tubes, chains, car door frames, etc. apart from e-scooters, fitnessequipment and cycles
Unlisted
Cholamandalam MS General Insurance Company Limited is a JV of MurugappaGroup with Mitsui Sumitomo Insurance Group of Japan, (5
thlargest insurance
group across the globe)
Note: Market data as on 31st Dec 2017. Source: BSE and Conversion Rate of 1USD = Rs.63.9273 as on 31st Dec 2017 Source: RBI
6

Colours
SPIRIT OF CHOLA
“The fundamental principle of economic activity is that no man you transact with will lose, then you shall not."
7

Colours
Corporate Overview
Promoters53%FII
21%
Public6%
Institutions20%
Promoters share holding of 53.07% includes TI Financial Holdings Ltd – 46.21%, Ambadi Holdings Private Ltd – 4.62% Others - 2.24%
Shareholding Pattern
8
Dec 16 Mar 17 Jun 17 Sep 17 Dec 17
Chola Finance (₹ / share) 945 964 1,119 1,092 1,294
BSE Sensex 26,626 29,621 30,922 31,284 34,057
Investor Ratios FY15 FY16 FY17 YTD Dec'16 YTD Dec'17
Earnings Per share (₹) 30 38 46 42 58
Book value per share (₹) 203 234 276 266 315
Market price per share (₹) 588 713 964 945 1,294
Market capitalisation (₹ mn) 84,420 111,402 150,722 147,725 202,278
Price to Earnings (P/E) Ratio 19.5 19.0 21.0 22.3 22.3
Price to Book Value (P/BV) 2.9 3.0 3.5 3.6 4.1
* EPS is annualised• Market price and Market Capitalisation based on share price as on 31st Dec 2017
-20%
0%
20%
40%
Dec-16 Mar-17 Jun-17 Sep-17 Dec-17
Chola Finance - Share Price Growth
Chola Finance Sensex

Colours
Market Overview
9
30.09 37.50
46.01 42.42 58.00
*19.5*19.0
*21.0*22.3
*22.3
FY15 FY16 FY17 Dec '16 Dec '17
(Rs. Per Share)EPS
EPS * Price - Earnings Ratio
31,72736,574
42,849 41,58849,282
15.80 16.64 18.04
16.96
19.78
FY15 FY16 FY17 Dec '16 Dec '17
ROE (%)
Networth (Rs mn) ROE (%)
203 234 276 266315
*2.9*3.0
*3.5 *3.6*4.1
FY15 FY16 FY17 Dec '16 Dec '17
(Rs. Per Share)Book Value
Book Value/Share * Price/Book Value
84,226 111,402150,722 147,725
202,278
FY15 FY16 FY17 Dec '16 Dec '17
(₹ mn)Market Capitalisation
Market Cap
Colours
Corporate Overview
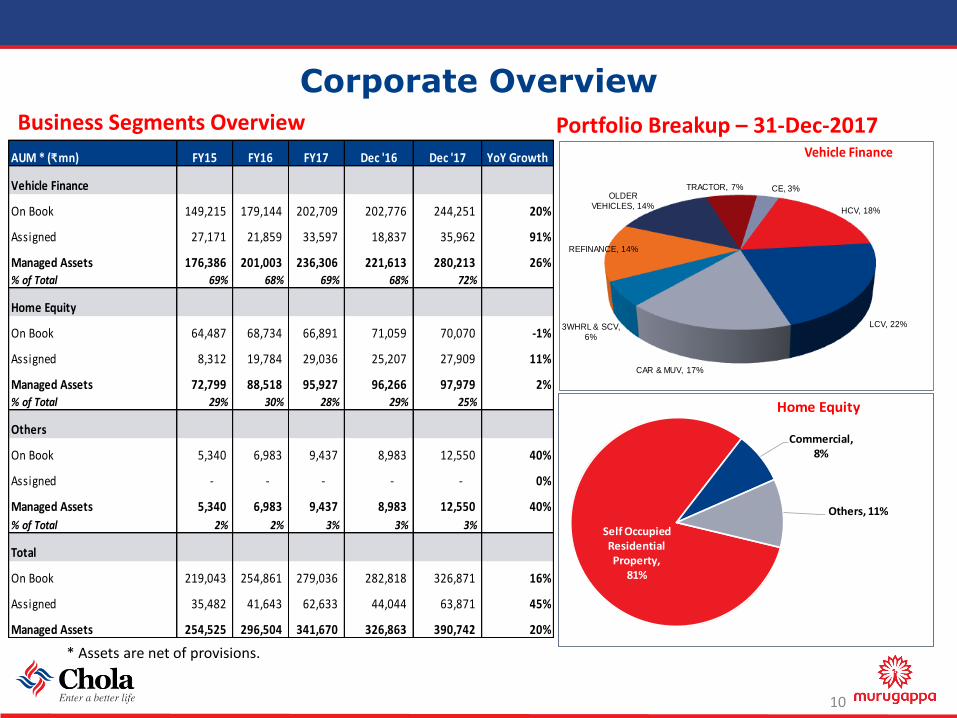
* Assets are net of provisions.
Business Segments Overview
10
HCV, 18%
LCV, 22%
CAR & MUV, 17%
3WHRL & SCV, 6%
REFINANCE, 14%
OLDER VEHICLES, 14%
TRACTOR, 7% CE, 3%
Vehicle Finance
Self Occupied Residential Property,
81%
Commercial, 8%
Others, 11%
Home Equity
Portfolio Breakup – 31-Dec-2017AUM * (₹ mn) FY15 FY16 FY17 Dec '16 Dec '17 YoY Growth
Vehicle Finance
On Book 149,215 179,144 202,709 202,776 244,251 20%
Assigned 27,171 21,859 33,597 18,837 35,962 91%
Managed Assets 176,386 201,003 236,306 221,613 280,213 26%% of Total 69% 68% 69% 68% 72%
Home Equity
On Book 64,487 68,734 66,891 71,059 70,070 -1%
Assigned 8,312 19,784 29,036 25,207 27,909 11%
Managed Assets 72,799 88,518 95,927 96,266 97,979 2%% of Total 29% 30% 28% 29% 25%
Others
On Book 5,340 6,983 9,437 8,983 12,550 40%
Assigned - - - - - 0%
Managed Assets 5,340 6,983 9,437 8,983 12,550 40%
% of Total 2% 2% 3% 3% 3%
Total
On Book 219,043 254,861 279,036 282,818 326,871 16%
Assigned 35,482 41,643 62,633 44,044 63,871 45%
Managed Assets 254,525 296,504 341,670 326,863 390,742 20%
Colours
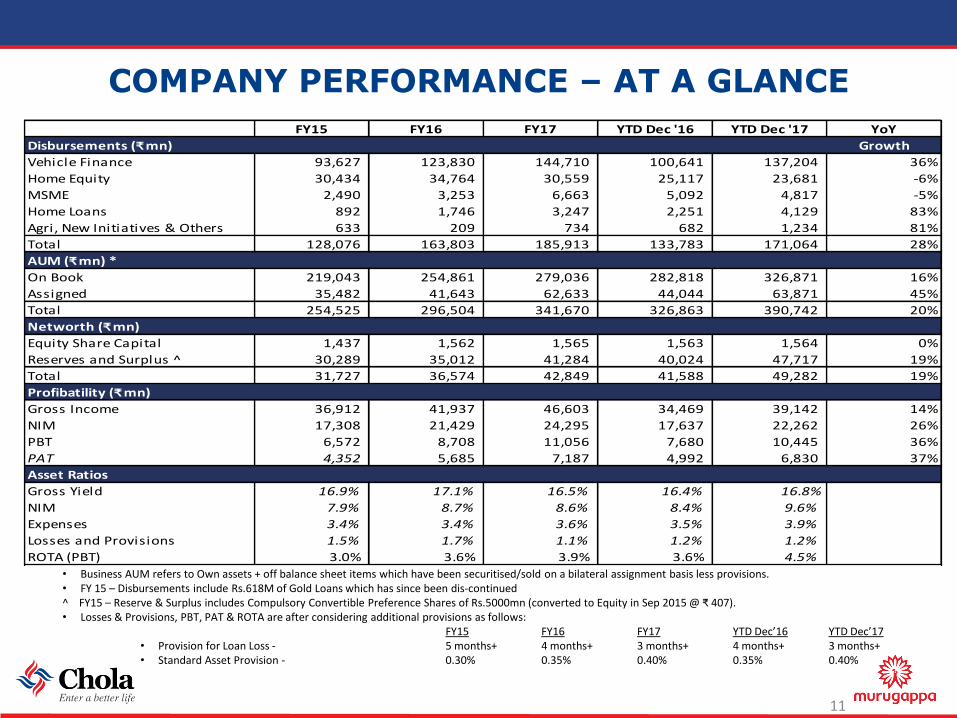
COMPANY PERFORMANCE – AT A GLANCE
• Business AUM refers to Own assets + off balance sheet items which have been securitised/sold on a bilateral assignment basis less provisions.• FY 15 – Disbursements include Rs.618M of Gold Loans which has since been dis-continued^ FY15 – Reserve & Surplus includes Compulsory Convertible Preference Shares of Rs.5000mn (converted to Equity in Sep 2015 @ ₹ 407).• Losses & Provisions, PBT, PAT & ROTA are after considering additional provisions as follows:
FY15 FY16 FY17 YTD Dec’16 YTD Dec’17• Provision for Loan Loss - 5 months+ 4 months+ 3 months+ 4 months+ 3 months+• Standard Asset Provision - 0.30% 0.35% 0.40% 0.35% 0.40%
11
FY15 FY16 FY17 YTD Dec '16 YTD Dec '17 YoY
Disbursements (₹ mn) Growth
Vehicle Finance 93,627 123,830 144,710 100,641 137,204 36%
Home Equity 30,434 34,764 30,559 25,117 23,681 -6%
MSME 2,490 3,253 6,663 5,092 4,817 -5%
Home Loans 892 1,746 3,247 2,251 4,129 83%
Agri, New Initiatives & Others 633 209 734 682 1,234 81%
Total 128,076 163,803 185,913 133,783 171,064 28%
AUM (₹ mn) *
On Book 219,043 254,861 279,036 282,818 326,871 16%
Assigned 35,482 41,643 62,633 44,044 63,871 45%
Total 254,525 296,504 341,670 326,863 390,742 20%
Networth (₹ mn)
Equity Share Capital 1,437 1,562 1,565 1,563 1,564 0%
Reserves and Surplus ^ 30,289 35,012 41,284 40,024 47,717 19%
Total 31,727 36,574 42,849 41,588 49,282 19%
Profibatility (₹ mn)
Gross Income 36,912 41,937 46,603 34,469 39,142 14%
NIM 17,308 21,429 24,295 17,637 22,262 26%
PBT 6,572 8,708 11,056 7,680 10,445 36%
PAT 4,352 5,685 7,187 4,992 6,830 37%
Asset Ratios
Gross Yield 16.9% 17.1% 16.5% 16.4% 16.8%
NIM 7.9% 8.7% 8.6% 8.4% 9.6%
Expenses 3.4% 3.4% 3.6% 3.5% 3.9%
Losses and Provisions 1.5% 1.7% 1.1% 1.2% 1.2%
ROTA (PBT) 3.0% 3.6% 3.9% 3.6% 4.5%

Colours
32 49 36 4653 83 103 149102144 162
204180164
199
231167
94
203
228
534 534
703
858
FY15 FY16 FY17 YTD Dec'17
A B C D E (Category wise)
Strong Geographical Presence
12
Note: Figures in brackets represents no. of branches as on 31st Dec, 2017.
858 branches across 27 states/Union territories: 853 VF, 139 HE (134 co-located with VF) and 94 HL (co-located with VF).
87.5% locations are in Tier-III, Tier-IV, Tier V and Tier-VI towns
Strong Pan India presence
Branch Network
27% 27% 29% 27%
26% 26% 24% 24%
26% 26% 24% 24%
21% 21% 23% 25%
FY15 FY16 FY17 YTD Dec'17
South North West East
71% 70% 76% 78%
19% 20% 16% 15%10% 10% 8% 7%
FY15 FY16 FY17 YTD Dec'17Rural Semi-Urban Urban
Bihar (32)
Chattisgarh (45)
Jharkand (21)
Odisha (42)
West Bengal (43)
Delhi (5)
Punjab (21)
Rajasthan (69) UP (60)
Uttarakhand (14)
Karnataka (48)
Kerala (42)Tamil Nadu (73)
Maharashtra (87)
Pondicherry (1)
Gujarat
(53)
Goa (2)
Madhya Pradesh(61)
Andhra Pradesh (39)
Assam (23)
Harayana (27)
Himachal Pradesh (11)
Telangana (28)
Jammu & Kashmir (3)
Tripura (4)
Meghalaya (3)
Mizoram (1)

Colours
Chola - Financial Summary
13
Note: PAT is after considering additional provisions as follows:FY1 FY16 FY17 YTD Dec’16 YTD Dec’17
• Provision for Loan Loss - 5 months+ 4 months+ 3 months 4 months 3 months• Standard Asset Provision - 0.30% 0.35% 0.40% 0.35% 0.40%
93,627 123,830 144,710 100,641 137,204
30,434 34,764
30,559
25,117 23,681 4,015
5,208 10,644
8,025
10,180 *128,076*163,803
*185,913
*133,783*171,064
FY15 FY16 FY17 YTD Dec '16 YTD Dec '17
(₹ mn)Disbursements
VF HE Others * Total Disbursements
219,043 254,861 279,036 282,818 326,871
35,48241,643
62,633 44,04463,871*254,525
*296,504*341,670 *326,863
*390,742
FY15 FY16 FY17 YTD Dec '16 YTD Dec '17
(₹ mn)Assets Under Management
On Book Assigned * Total AUM
30,289 35,012 41,284 40,024 47,717
1,4371,562
1,565 1,563
1,564
*31,727*36,574
*42,849 *41,588
*49,282
FY15 FY16 FY17 YTD Dec '16 YTD Dec '17
(₹ mn)Networth
Reserves and Surplus Equity Share Capital * Total Networth
4,3525,685
7,187
4,992
6,830
FY15 FY16 FY17 YTD Dec '16 YTD Dec '17
(₹ mn)Profit After Tax
PAT

Colours
Chola - Financial Summary (Cont’d)
14
Note: ROTA (PBT) is after considering additional provisions as follows:FY15 FY16 FY17 YTD Dec’16 YTD Dec’17
• Provision for Loan Loss - 5 months+ 4 months+ 3 months+ 4months+ 3months+• Standard Asset Provision - 0.30% 0.35% 0.40% 0.35% 0.40%
7.9%8.7% 8.6% 8.4%
9.6%
FY15 FY16 FY17 YTD Dec '16 YTD Dec '17
(Operating Income - Finance Charges)Net Income Margin (A)
3.4% 3.4% 3.6% 3.5%3.9%
FY15 FY16 FY17 YTD Dec '16 YTD Dec '17
Expense Ratio (B)
1.8% 1.7%
1.1%1.2% 1.2%
FY15 FY16 FY17 YTD Dec '16 YTD Dec '17
Losses and Provisions (C)
3.0%
3.6%3.9%
3.6%
4.5%
FY15 FY16 FY17 YTD Dec '16 YTD Dec '17
ROTA (PBT) (D) = (A) - (B) - (C)

Colours
Performance Highlights – Q3FY18 & YTD Dec’17
15* Annualised
Disbursements Profit after Tax ROTA (PBT) Book Value EPS* ROE*
Q3-FY18
Q3-FY17
₹ 67,611 mn ₹ 2,492 mn 4.60% ₹ 315.3 ₹ 63.24 20.62%
₹ 43,734 mn ₹ 1,625 mn 3.45% ₹ 266.1 ₹ 41.26 15.82%
53% 19%55% 53%33% 30%
Disbursements Profit after Tax ROTA (PBT) Book Value EPS* ROE*
YTD Dec’16
₹ 171,064 mn ₹ 6,830 mn 4.48% ₹ 315.3 ₹ 58 19.78%
₹ 133,783 mn ₹ 4,992 mn 3.65% ₹ 266.1 ₹ 42.42 16.96%
37% 19%28% 37% 16%
YTD Dec’17
23%

Colours
ASSET QUALITY
16
3.1%3.5%
4.7% 4.7% 4.5%3.7%
1.1%1.4% 1.5% 1.6% 1.6% 1.4%
2.0% 2.1%
3.2% 3.2% 2.9%2.3%
34.8%
39.7%
31.6%33.1%
35.1%36.8%
0
0.05
0.1
0.15
0.2
0.25
0.3
0.35
0.4
0.45
0.0%
0.5%
1.0%
1.5%
2.0%
2.5%
3.0%
3.5%
4.0%
4.5%
5.0%
2014-15(5 months+)
2015-16(4 months+)
2016-17(3 months+)
Q1 FY18(3 months+)
Q2 FY18(3 months+)
Q3 FY18(3 months+)
GNPA Provision NNPA Provision Coverage
Note: Provision coverage is calculated on provision created towards GNPA assets only and does not include provision created towardsincome reversals.

Colours
17
Highlights – YTD Dec’17
Disbursements Disbursement for YTD Dec’17 stood at Rs. 171,064 mn, a growth of 28% YoY.
PAT PAT for YTD Dec’17 stood at Rs. 6,830 mn, a growth of 37% YoY.
RoE Return on equity at 19.7% in YTD Dec’17, a growth of 16% YoY.
AUM Total assets under management has crossed Rs 390bn
Rating Upgrade India Ratings and CARE have upgraded long-term debt rating from AA to AA+
NPA recognition
GNPA recognition at 3 months is ahead of RBI regulation
Awards and Recognitions
CII award for “Top 26 Innovative Organizations”
Company with Great Managers – 2017 by People Business and Times Group
The Golden Tigers Award for Excellence in CSR by World CSR Congress
National award for Excellence in CSR by World Federation of CSR Professionals
Featured in ASSOCHAM 9th Global and CSR Sustainability Compendium-16-17
Colours
BUSINESS OVERVIEW
18

Colours
Vehicle Finance
19

Colours
Vehicle Finance - Industry
20
43,67753,980
52,716
76,156
96,145
Q3 FY-15 Q3 FY-16 Q3 FY-17 Q3 FY-18 Q3 FY-22 (E)
(in Units)Trend in Domestic M & HCV Sales
Chola @88%CAGR @6%
6,34,7837,29,168 7,44,433 7,88,862
11,54,973
Q3 FY-15 Q3 FY-16 Q3 FY-17 Q3 FY-18 Q3 FY-22 (E)
(in Units)Trend in Domestic Car & MUV Sales
Chola @18%
CAGR @10%
Healthy Industry growth to aid revival over the next 5 years
Replacement demand continues to remain low currently and is expected to increase with improved industrial activity and agricultural output.
Improvement in road infrastructure is expected to increase the daily running of trucks and will lead to higher fleet utilization, leading to lower demand for MHCVs.
Higher Income, stable ownership cost to boost long term demand
Improved vehicle penetration by 35% in the next 5 years (20 vehicles per 1000 to 27 vehicles per 1000 population)
Replacement demand will increase due to launch of new models and affordability
Source: FY 15 to FY 18 numbers are from SIAM FY 22 numbers are from CRISIL Research (proportionately adjusted for Quarter)

Colours
Vehicle Finance - Industry
21
70,917 71,759 76,39993,205
1,46,660
Q3 FY-15 Q3 FY-16 Q3 FY-17 Q3 FY-18 Q3 FY-22 (E)
(in Units)Trend in Domestic LCV Sales
Chola @64%
CAGR @12%
46,271 44,129 41,038
57,741
97,522
CAGR @14%
Q3 FY-15 Q3 FY-16 Q3 FY-17 Q3 FY-18 Q3 FY-22 (E)
(in Units)Trend in Domestic SCV Sales
Chola @48%
Increase in private final consumption expenditure(PFCE) is expected to boost demand.
Rise in consumption of consumer durables and FMCG Products is expected to drive LCV sales.
Increasing adoption of hub and spoke model, will enable increased use of LCVs and SCVs to distribute freight over last mile.
Substitution of three-wheelers to SCVs, which enables higher carrying capacity and lower TAT and make it more cost efficient.
Bus Sales to be supported by growing urban population, demand from schools and corporates and increased inter-city travel.
Source: FY 15 to FY 18 numbers are from SIAM FY 22 numbers are from CRISIL Research (proportionately adjusted for Quarter)

Colours
Vehicle Finance – Business Model & Positioning
22
Principal Operator
> 50 Vehicles
Large Operators 26- 50 vehicles HCV
SRTOs – HCV & LCV
First Time Users & Small Ticket Operators, older vehicles HCV, LCV & SCV
HighHigh
LowLow
RETURNS
RISK
HCV : Heavy commercial vehicle, LCV : Light commercial vehicle, SCV : Small commercial vehicle, SRTO : Small Road Transport Operators
Industry
Chola Position
Medium Operators 10 -25 –HCV & LCV vehicles
HighHigh
LowLow
RETURNS
RISK
Industry
Chola Position
PV: Passenger Vehicle, MUV :Multi UtilityVehicle
Self Employed with Financials
Salaried
Agri, Asset & Commercial, Used
Taxi and Tour Operator
~65% of disbursements are to micro & small enterprises and agri -based customer segment
Chola positioning-
Middle of the pyramid through New CVs, Used CVs
Top of the Bottom of the pyramid through SCV & older CVs Shubh
~ 66% of disbursements are to Chola Existing, Agri & Commercial usage customers
~ 34% disbursements are to Self Employed with financials
Chola positioning-
Middle of the pyramid is into Agri, Asset & Commercial.
CV PV

Colours
Vehicle Finance – Business Model & Positioning
23
HighHigh
LowLow
RETURNS
RISK
LargeFarmer
Captive Users / Prior Vehicles
Medium Farmers
Small & Marginal Farmers
First Time Buyers
Tractors only .In exceptional cases considering implements like power tillers & combine harvesters
First Time Users / Tenant Farmer
Industry
Chola Position
~65% of disbursements are to agri -based customer segment
Application - Agri usage Commercial usage Agri and Commercial usage
New & Used
HighHigh
LowLow
RETURNS
RISK
Industry
Chola Position
Medium Retail Operator
First Time Users
Small Retail Operator
First Time Buyers
Focus on Backhoe Loaders, Excavators and Cranes
Captive Users / Prior Vehicles
Super Strategic
Strategic Customer
~ 69% of disbursements are to retail customer segment
Application – Captive Hiring
New & Used
Tractor CE

Colours
Vehicle Finance - Key Differentiators
24
Quicker Turn Around Time – (TAT)
Reputation as a long term and stable player in the market
Strong dealer and manufacturer relationship
Good penetration in Tier II and Tier III towns
In house sales and collection team which is highly experienced and stable
Low employee turnover
Good internal control processes
Customised products offered for our target customers
Strong collection management

Colours
Vehicle Finance - Disbursement / Portfolio Mix – YTD Dec’17
25
HCV, 18%
LCV, 22%
CAR & MUV, 17%
3WHRL & SCV, 6%
REFINANCE, 14%
OLDER VEHICLES, 14%
TRACTOR, 7%
CE, 3%
Portfolio – Product wise
HCV16%
LCV20%
CAR & MUV15%
3WHRL & SCV, 6%
REFINANCE17%
OLDER VEHICLES15%
TRACTOR7%
CE4%
Disbursements - Product wise
Well diversified across geography & product segments
AP 5%
KARNATAKA 5%
KERALA 4%
Pondicherry 0%
TELANGANA 4%
TN 8%
DELHI 1%
HARYANA 4%
HP 1%
J&K 0%PUNJAB 2%
RAJASTHAN 9%
UP 7%Uttarakhand 1%ASSAM 2%
BIHAR 4%
CHATTISGARH7%
JHARKHAND 3%
ODISHA 5%
TRIPURA 0%
WB 5%
GOA 0%
GUJARAT 4%
MAHARASHTRA13%
MP 5%
SOUTH27%
NORTH24%
EAST27%
WEST22%
Disbursements - State wiseAP 5%
KARNATAKA 5%
KERALA 4%
Pondicherry 0%
TELANGANA 4%
TN 8%
DELHI 1%
HARAYANA 5%
HP 1%
J&K 0%
PUNJAB 2%
RAJASTHAN 9%
UP 6%Uttarakhand 1%
ASSAM 2%
BIHAR 4%
CHATTISGARH7%
JHARKHAND 3%
ODISHA 5%
TRIPURA 0%
WB 5%
GOA 0%
GUJARAT 5%
MAHARASHTRA13%
MP5%
SOUTH26%
NORTH26%
EAST26%
WEST22%
Portfolio – State wise

Colours
Vehicle Finance - Financial Summary
26
Note: PBT is after considering additional provisions as follows:FY15 FY16 FY17 YTD Dec’16 YTD Dec’17
• Provision for Loan Loss - 5 months+ 4 months+ 3 months+ 4 months+ 3 months+• Standard Asset Provision - 0.30% 0.35% 0.40% 0.35% 0.40%
AUM is Net of provisions.
93,627
123,830144,710
100,641
137,204
FY15 FY16 FY17 YTD Dec 16 YTD Dec 17
(₹ mn)
Disbursements
149,215 179,144 202,709 202,776 244,251
27,171 21,859
33,597 18,837
35,962
*176,386*201,003
*236,306 *221,613
*280,213
FY15 FY16 FY17 YTD Dec '16 YTD Dec '17
(₹ mn)
Assets Under Management
On Book Assigned * Total AUM
29,09531,591
36,094
26,539
31,687
FY15 FY16 FY17 YTD Dec '16 YTD Dec '17
(₹ mn)
Income
3,459
5,550
6,819
4,890
7,100
FY15 FY16 FY17 YTD Dec '16 YTD Dec '17
(₹ mn)
Profit Before Tax

Colours
Vehicle Finance - Financial Summary (Cont’d)
27
7.5%8.5% 8.4% 8.2%
8.9%
FY15 FY16 FY17 YTD Dec '16 YTD Dec '17
(Operating Income - Finance Charges)
Net Income Margin (A)
3.6%3.8% 3.8% 3.7%
4.1%
FY15 FY16 FY17 YTD Dec '16 YTD Dec '17
Expense Ratio (B)
2.0%1.7%
1.4% 1.4%1.0%
FY15 FY16 FY17 YTD Dec '16 YTD Dec '17
Losses and Provisions (C)
2.0%
3.0%3.2% 3.1%
3.7%
FY15 FY16 FY17 YTD Dec '16 YTD Dec '17
ROTA (PBT) (D) = (A) - (B) - (C)
Note: Losses & Provisions & ROTA are after considering additional provisions as follows:FY15 FY16 FY17 YTD Dec’16 YTD Dec’17
• Provision for Loan Loss - 5 months+ 4 months+ 3 months+ 4 months+ 3 months+• Standard Asset Provision - 0.30% 0.35% 0.40% 0.35% 0.40%
Colours
Home Equity
28

Colours
Home Equity - Industry outlook
29
Net interest Margin (NIMs) have fallen across the industry due to high competition from Banks and HFCs and aggressive rates
Yields have fallen 200 bps in the last 18 months due to high competition
Home Equity Loan book growth for the industry has slowed down. The loan books of the market entities registered a 17% growth in FY 2017 which
is lower than 30-40% levels few years back due to large base Potential for HE is significant, largely driven by demand from MSMEs CRISIL report pegs the growth for FY 2018 at 13-15%
Industry reports suggests that the delinquency levels in the home equity market is likely to increase marginally
Chola home equity business has already witnessed spike and seeing it stabilizing now. The business is focused on recoveries through SARFAESI and Arbitration
On the back of stiff competition lenders have continuously reduced lending rates in the LAP segment over the past few years
As the interest rates harden the lending rates are likely stabilize over next 2 years
Source : ICRA reports, CRISIL Reports and Team Analysis

Colours
Home Equity - Key Differentiators
30
Process Differentiator
One of the best turnaround times in the industry
Personalised service to customers through direct interaction with each customer
Pricing
Fee Income adequate to cover origination & credit cost
Leverage cross sell opportunities for additional income
Effective cost management
Underwriting Strategy
Personal visit by credit manager on every case
Assess both collateral and repayment capacity to ensure credit quality
Structure
Separate verticals for sales, credit & collections to drive focus
Convergence of verticals at very senior levels
Each vertical has independent targets vis-à-vis their functions

Colours
Home Equity – Q3 Performance
31
On YTD Dec’17 basis, there has been drop of 6% on YOY basis. However the business has grown by 29% over Q3 FY17.
Disbursements
Asset under management
On YTD Dec’17 basis, the business has grown by 2%. Pre-closures continue to a pain point for the business due to dropping lending rates in the market
Loss and provisions
The business has started witnessing results in implementation of SARFAESI and other legal pursuits
The business has reported a drop in losses and provisions in Q3 FY’17 against Q3 FY’16
Profit before tax Lesser loan losses over last year has helped the business report better profit in YTD Dec’17 against YTD Dec’16.

Colours
Home Equity - Financial Summary
Note: PBT is after considering additional provisions as follows:FY15 FY16 FY17 YTD Dec’16 YTD Dec’17
• Provision for Loan Loss - 5 months+ 4 months+ 3 months+ 4 months+ 3 months+• Standard Asset Provision - 0.30% 0.35% 0.40% 0.35% 0.40%
AUM is Net of provisions.32
30,434
34,764
30,559
25,117 23,681
FY15 FY16 FY17 YTD Dec 16 YTD Dec 17
(₹ mn)Disbursements
64,487 68,734 66,891 71,059 70,070
8,312 19,784 29,036 25,207 27,909
*72,799*88,518
*95,927 *96,266 *97,979
FY15 FY16 FY17 YTD Dec 16 YTD Dec 17
(₹ mn)Assets Under Management
On Book Assigned * Total AUM
9,409 11,242
12,166
9,135 9,031
(1%)
FY15 FY16 FY17 YTD Dec 16 YTD Dec 17
(₹ mn)Income
2,399 2,609
2,065
1,606 1,756
FY15 FY16 FY17 YTD Dec 16 YTD Dec 17
(₹ mn)Profit Before Tax
Colours
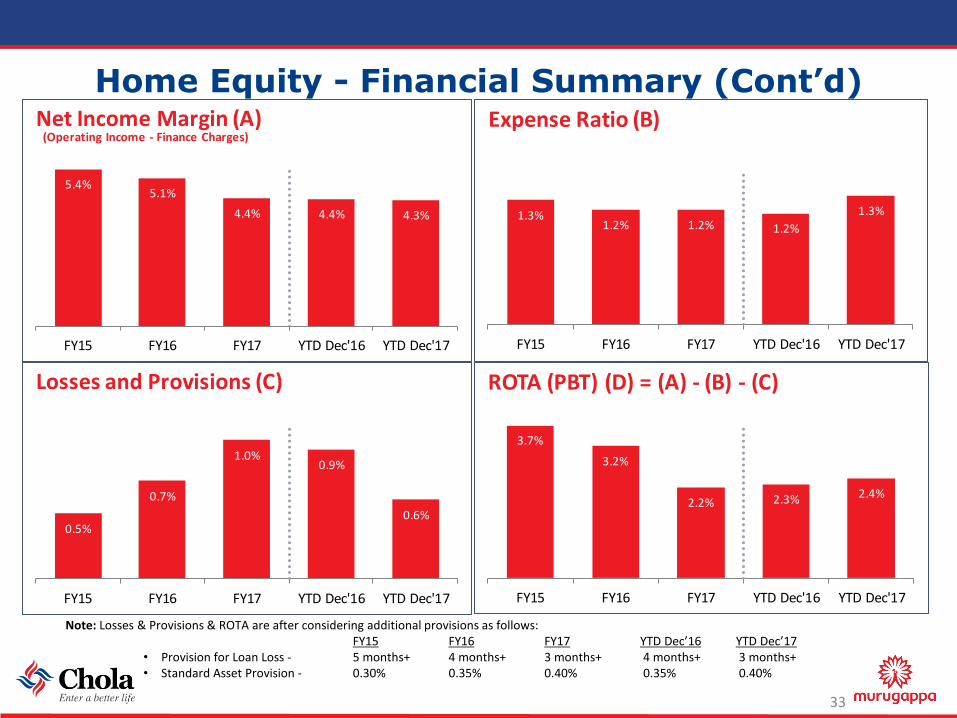
Home Equity - Financial Summary (Cont’d)
Note: Losses & Provisions & ROTA are after considering additional provisions as follows:FY15 FY16 FY17 YTD Dec’16 YTD Dec’17
• Provision for Loan Loss - 5 months+ 4 months+ 3 months+ 4 months+ 3 months+• Standard Asset Provision - 0.30% 0.35% 0.40% 0.35% 0.40%
33
5.4%5.1%
4.4% 4.4% 4.3%
FY15 FY16 FY17 YTD Dec'16 YTD Dec'17
(Operating Income - Finance Charges)Net Income Margin (A)
1.3%1.2% 1.2% 1.2%
1.3%
FY15 FY16 FY17 YTD Dec'16 YTD Dec'17
Expense Ratio (B)
0.5%
0.7%
1.0%0.9%
0.6%
FY15 FY16 FY17 YTD Dec'16 YTD Dec'17
Losses and Provisions (C)
3.7%
3.2%
2.2% 2.3% 2.4%
FY15 FY16 FY17 YTD Dec'16 YTD Dec'17
ROTA (PBT) (D) = (A) - (B) - (C)

Colours
Funding Profile
34

Colours
CAR, Credit Rating and ALM Statement
13.02 13.26 13.61 13.72 13.81
8.22 6.42 5.03 5.50 4.72
21.2419.68
18.64 19.22 18.53
2014–2015 2015–2016 2016–2017 Dec '16 Dec '17
Minimum CAR Stipulated by RBI is 15%
Capital Adequacy RatioTier I Tier I I Time Buckets Outflows Inflows Mismatch Cum Mismatch
1–14 Days 18,352 20,248 1,896 1,896
15–30/31 Days 5,672 5,732 60 1,956
Over 1–2 Months 17,298 18,560 1,262 3,218
Over 2–3 Months 16,013 16,197 185 3,403
Over 3–6 Months 28,582 35,517 6,935 10,338
Over 6 Months to 1 Year 53,668 60,558 6,890 17,228
Over 1–3 Years 131,619 147,189 15,570 32,798
Over 3–5 Years 15,837 16,437 600 33,397
Over 5 Years 13,159 27,887 14,728 48,125
Over 20 Years 49,305 1,180 (48,125) -
Total 349,505 349,505 - -
Cumulative mismatch is significantly lower than the RBI stipulated levels of
15% and positive cumulative mismatch in all buckets
Credit Ratings
– The Company carries a credit rating of [ICRA ] A1+ and [CRISIL] A1+ for Short Term Instruments
– For long term instruments – (NCD’s) rated as AA+ by India Ratings, CARE, Brickwork Ratings and AA/Positive by ICRA
– For Subordinated debt, the Company is rated with [ICRA] AA / Positive, IND AA+ Stable ,CARE AA+ and CRISIL AA/ Stable
– For Perpetual Debt, the Company is rated with IND AA , CARE AA and [ICRA] AA - / Positive
ALM Statement as on Dec 2017 ₹ mn
35

Colours
Diversified Borrowings Profile
Particulars Mar-15 Mar-16 Mar-17 Dec ’16 Dec’17
Bank Term Loans 52% 49% 32% 33% 28%
Commercial papers/ ICD 3% 12% 11% 16% 13%
CC/WCDL 11% 6% 3% 3% 5%
Debentures 21% 21% 42% 37% 43%
Tier II Capital 13% 12% 12% 12% 11%
Debt instruments rating has improved by one notch
Long term relationships with banks ensured continued lending
A consortium of 15 banks with tied-up limits of ₹ 32,500 mn
26,087 26,087 28,337 28,837 31,587
39,687 48,466
1,02,992 92,0921,21,380
22,038 12,449
6,6316,533
15,306
4,975 27,560
27,035 39,120
35,910
1,01,965
1,11,200
77,072 82,373
78,800*1,94,752
*2,25,762*2,42,068 *2,48,955
*2,82,983
Mar-15 Mar-16 Mar-17 Dec-16 Dec-17Tier II Capital Debentures CC / WCDL Commercial Papers / ICD Bank Term loans * Total Borrowings
₹ mn
36

Colours
Business Enablers
37

Colours
Technology Updates
Storage enhancements to improve End-of-Month batch performance
Core Network infrastructure upgraded to support higher bandwidth, improve resilience and be future ready
Self-service capability provided for user management
Improved compute and storage infrastructure to support high core lending platforms
Customer Faced Apps- Upgraded with additional payment options and new IOS version for improved customer engagement
Field Sales/Collection Mobility solutions – New functionalities to enhance business capabilities and technical upgrade to support new platform versions
Gaadi Bazaar – System improvement to enhance the sale of repo vehicles and functionalities for conducting UTTAM MELA
Hyperion branch level planning & Profitability dashboard with drill-down capability
NPA & ALM report automation
Centralized GST ASP solution rolled out; subsystems also enhanced to support the same
IT staff trained on Agile & DevOps
SIEM - Deliver Improved Security with infrastructure monitoring and management
Internal gap analysis and ongoing remediation on RBI guidelines for NBFCs
Weekly round-table for knowledge sharing & employee engagement
Risk based Data and Application protection solutions being implemented
Technology Infrastructure
Delivering resilient & scalable environment
Systems of Record
Stable foundation for core products & services
Compliance, Innovation & People
Balance innovation & technology risk
Systems of Engagement
Digitally connect employees, partners, & customers
38

Colours
Risk Management
Risk Management Committee (RMC):
RMC comprises Chairman, three Independent Directors andthe Managing Director besides the senior management asmembers.
Risk Management (contd..)
Post sanction monitoring helps to identify portfolio trends and implement necessary policy changes
Meets at least 4 times in a year and oversees the overall risk management frame work, the annual charter and implementation of various risk management initiatives.
RMC minutes and risk management processes are shared with the Board on periodic basis
Risk Management:
Established Risk Management Framework
Comprehensive Risk registers have beenprepared for all units identifying risks withmitigants and KRI triggers
Robust Disaster Recovery Plan in place and is periodically tested.
Implemented a Business Continuity Framework to ensure the maintenance on recovery of operations when confronted with adverse events
• SOPs for all business and functions are inplace, Strong IT security system and Auditto ensure Information security
• Institutionalized formal Risk Reporting framework –Chola Composite Risk index highlights the top riskswhich is reviewed by RMC (quarterly) and Sr.Management (monthly) to understand the level ofrisk and act upon suitably.
• Robust automated credit underwriting process includesdetailed risk assessment of the borrowers.
• In-house and independent internal audit teamcarry out comprehensive audit of HO &
branches with a pre-approved plan and audit scheduleto evaluate the extent of SOP compliance to locate gaps
• Independent fraud control unit ensures robust mechanism offraud control & detection supported by a disciplinarycommittee reporting to Audit Committee and Board
• Monthly ALCO meeting to discuss treasury related riskexposures within the financial risk management framework ofthe Company
Internal Control Systems
• Operational risk is managed through comprehensive internal control and systems.
39

Colours
Financial Performance
40

Colours
Profit and Loss Statement – Quarterly
Note: Losses & Provisions, PBT, PAT & ROTA are after considering additional provisions as follows:Q3FY18 Q2FY18 Q3FY17
• Provision for Loan Loss - 3 months+ 3 months+ 4 months+• Standard Asset Provision - 0.40% 0.40% 0.35%
41
₹ mn
Particulars Q3FY18 Q2FY18 Q3FY17Growth %
Q-o-Q
Growth %
Y-o-Y
Disbursements 67,611 54,923 43,734 23% 55%
Closing Assets (Managed) 400,549 374,502 333,807 7% 20%
Closing Assets (Balance Sheet) 336,678 317,506 289,763 6% 16%
Operating Income 13,833 12,960 11,758 7% 18%
Finance Charges 5,903 5,567 5,658 6% 4%
Net Income 7,931 7,392 6,100 7% 30%
Expenses 3,237 3,089 2,588 5% 25%
Loan Losses and Std Assets Prov 902 832 1,003 8% -10%
Profit Before Tax 3,792 3,472 2,509 9% 51%
Taxes 1,300 1,199 884 8% 47%
Profit After Tax 2,492 2,272 1,625 10% 53%
Key Asset Ratios
Net Income to Avg. Assets 9.6% 9.6% 8.4%
Operating exp. to Avg. Assets 3.9% 4.0% 3.6%
NCL to Avg. Assets 1.1% 1.1% 1.4%
ROTA–PBT 4.6% 4.5% 3.5%
Colours
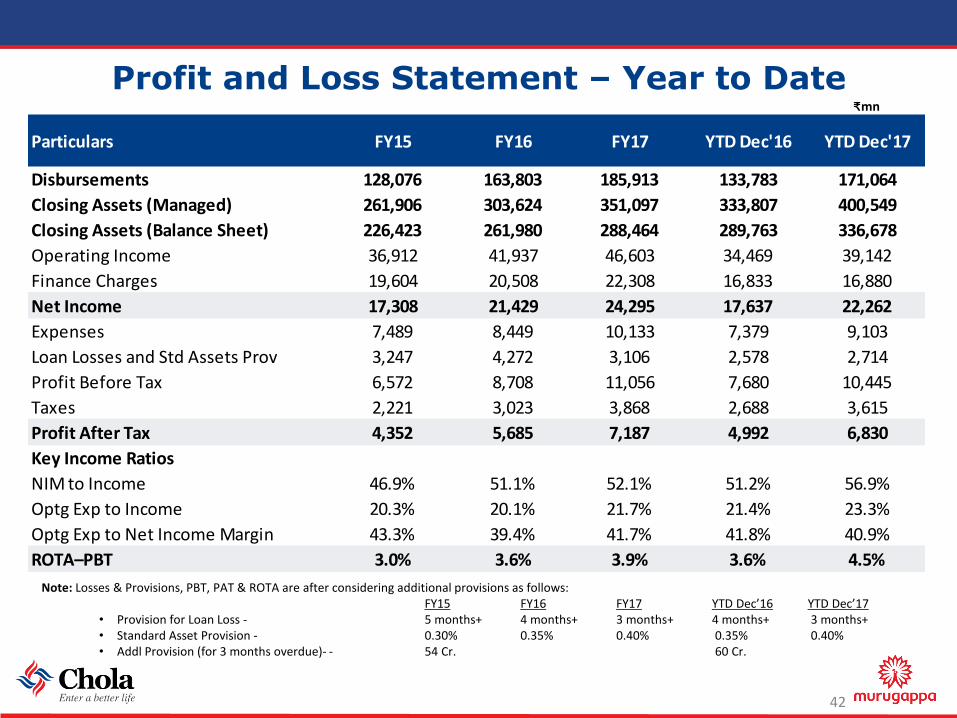
Profit and Loss Statement – Year to Date
Note: Losses & Provisions, PBT, PAT & ROTA are after considering additional provisions as follows:FY15 FY16 FY17 YTD Dec’16 YTD Dec’17
• Provision for Loan Loss - 5 months+ 4 months+ 3 months+ 4 months+ 3 months+• Standard Asset Provision - 0.30% 0.35% 0.40% 0.35% 0.40%• Addl Provision (for 3 months overdue)- - 54 Cr. 60 Cr.
42
₹ mn
Particulars FY15 FY16 FY17 YTD Dec'16 YTD Dec'17
Disbursements 128,076 163,803 185,913 133,783 171,064
Closing Assets (Managed) 261,906 303,624 351,097 333,807 400,549
Closing Assets (Balance Sheet) 226,423 261,980 288,464 289,763 336,678
Operating Income 36,912 41,937 46,603 34,469 39,142
Finance Charges 19,604 20,508 22,308 16,833 16,880
Net Income 17,308 21,429 24,295 17,637 22,262
Expenses 7,489 8,449 10,133 7,379 9,103
Loan Losses and Std Assets Prov 3,247 4,272 3,106 2,578 2,714
Profit Before Tax 6,572 8,708 11,056 7,680 10,445
Taxes 2,221 3,023 3,868 2,688 3,615
Profit After Tax 4,352 5,685 7,187 4,992 6,830
Key Income Ratios
NIM to Income 46.9% 51.1% 52.1% 51.2% 56.9%
Optg Exp to Income 20.3% 20.1% 21.7% 21.4% 23.3%
Optg Exp to Net Income Margin 43.3% 39.4% 41.7% 41.8% 40.9%
ROTA–PBT 3.0% 3.6% 3.9% 3.6% 4.5%

Colours
Balance Sheet₹ mn
Particulars Mar-15 Mar-16 Mar-17 Dec-16 Dec-17
Equity and Liabilities
Shareholders’ Funds 31,733 36,574 42,849 41,588 49,282
Current Liabilities 78,892 127,214 105,206 109,344 141,563
Non-current Liabilities 128,106 115,095 158,877 157,447 164,822
Total 238,732 278,883 306,932 308,379 355,667
Assets
Non-current Assets
Fixed Assets 683 1,113 1,401 1,298 1,467
Non-current Investments 602 647 1,924 1,203 2,354
Deferred Tax Asset (Net) 1,836 2,815 3,152 3,078 3,622
Receivable under Financing Activity 154,680 181,877 199,362 201,590 231,192
Other Non-current Assets & Loans and Advances 6,678 5,157 6,309 5,706 6,215
164,479 191,608 212,147 212,876 244,849
Current Assets
Current Investments 73 19 461 130 750
Cash and Bank Balances 3,407 4,905 4,870 4,598 3,734
Receivable under Financing Activity 67,156 77,225 84,790 86,416 101,082
Other Current Assets & Loans and Advances 3,618 5,126 4,664 4,358 5,252
74,253 87,275 94,785 95,503 110,818
Total 238,732 278,883 306,932 308,379 355,667
De-recognised Assets 35,482 41,643 62,633 44,044 63,871
Total Assets Under Management 274,215 320,526 369,566 352,423 419,539
43
Colours
Subsidiaries
44

Colours
Subsidiaries
Wealth management services for mass affluent and affluentcustomer segments.
Retail Distribution of a wide range of financial products –Investments, Life Insurance, General Insurance , Home loan &mortgage products.
Broking services to HNIs and Institutional Investors
Presence across 15 metros and mini metros
Freight aggregating business
45
131 126 134
9374
57 47
61 38 29
FY15 FY16 FY17 YTD Dec'16 YTD Dec'17
Cholamandalam Distribution Services Ltd
Income PAT
₹ mn
144128
153
116141
32 16 22
17 17
FY15 FY16 FY17 YTD Dec'16 YTD Dec'17
Cholamandalam Securities Ltd
Income PAT
₹ mn
0.4
110 70
321
(5)(41) (23) (29)
FY16 FY17 YTD Dec'16 YTD Dec'17
White Data Systems India Pvt Ltd
Income PAT
₹ mn

Colours
NPA Provisioning Standards
RBI Norms
3 to 14.99 Months – 10%
15 to 26.99 Months – 20%
27 to 50.99 Months – 30%
Above 51 Months – 50%
Vehicle Finance
VF Prime, CE
3 to 5.99 Months – 10%
6 to 23.99 Months – 25%
Above 24 Months – 100%
Older Vehicles
3 to 5.99 Months – 10%
6 to 11.99 Months – 40%
Above 12 Months – 100%
Tractor
3 to 5.99 Months – 10%
6 to 11.99 Months – 25%
12 to 23.99 Months – 40%
Above 24 Months – 100%
Two Wheelers
3 to 4.99 Months – 50%
5 to 5.99 Months – 70%
Above 6 Months – 100%
Home Equity
Home Equity &
Home Loan
3 to 5.99 Months – 10%
6 to 23.99 Months – 25%
24 to 59.99 Months – 50%
Above 60 Months – 100%
Other Products
Rural Finance &
Unsecured Loans
3 to 5.99 Months – 10%
6 to 8.99 Months – 33.33%
9 to 11.99 Months – 66.67%
Above 12 Months – 100%
Business Finance
3 to 5.99 Months – 10%
6 to 23.99 Months – 25%
24 to 35.99 Months – 50%
Above 36 Months – 100%
46

Colours
Contact Us
Our Registered Office:
Cholamandalam Investment and Finance Company Limited (Chola),
Dare House 1st Floor, No. 2, NSC Bose Road, Parrys,
Chennai 600001.
Toll free number : 1800-200-4565 (9 AM to 7 PM)
Land Line: 044 – 3000 7172
http://www.cholamandalam.com
Email-ID :
Sujatha P-Sr. Vice President & Company Secretary – [email protected]
Arulselvan D-Executive Vice President & CFO – [email protected]
47

Colours
Disclaimer• Certain statements included in this presentation may be forward looking statements made based on management’s current
expectations and beliefs concerning future developments and their potential effects upon Cholamandalam Investment and
Finance Company Ltd and its subsidiaries. There can be no assurance that future developments affecting Cholamandalam
Investment and Finance Company Ltd and its subsidiaries will be those anticipated by management. These forward-looking
statements are not a guarantee of future performance and involve risks and uncertainties, and there are important factors that
could cause actual results to differ, possibly materially, from expectations reflected in such forward-looking statements.
Cholamandalam Investment and Finance Company Ltd does not intend and is under no obligation, to update any particular
forward-looking statement included in this presentation.
• The facts and figures mentioned in this presentation is for informational purposes only and does not constitute or form part of,
and should not be construed as, an offer or invitation to sell securities of the Company, or the solicitation of any bid from you or
any investor or an offer to subscribe for or purchase securities of the Company, and nothing contained herein shall form the basis
of or be relied on in connection with any contract or commitment whatsoever. Nothing in the foregoing shall constitute and/or
deem to constitute an offer or an invitation to an offer, to be made to the Indian public or any section thereof or any other
jurisdiction through this presentation, and this presentation and its contents should not be construed to be a prospectus in India
or elsewhere. This document has not been and will not be reviewed or approved by any statutory or regulatory authority in India
or any other jurisdiction or by any stock exchanges in India or elsewhere. This document and the contents hereof are restricted for
only the intended recipient(s). This document and the contents hereof should not be (i) forwarded or delivered or transmitted in
any manner whatsoever, to any other person other than the intended recipient(s); or (ii) reproduced in any manner whatsoever.
Any forwarding, distribution or reproduction of this document in whole or in part is unauthorised.
• The information in this document is being provided by the Company and is subject to change without notice. The information in
this presentation has not been independently verified. No representation or warranty, express or implied, is made to the accuracy,
completeness or fairness of the presentation and the information contained herein and no reliance should be placed on such
information. The Company or any other parties whose names appear herein shall not be liable for any statements made herein or
any event or circumstance arising therefrom.
48

Colours
Thank You