Embed Size (px)
Citation preview

COLOUR REMOVAL FROM
SUGAR CANE JUICE
Danny M. T. Nguyen
Submitted in fulfilment of the requirements for the degree of
Doctor of Philosophy
School of Chemistry, Physics and Mechanical Engineering
Science and Engineering Faculty
Queensland University of Technology, Brisbane, Australia
June 2013

ii
Supervisor: Professor William O. S. Doherty
Sugar Research and Innovation
Centre for Tropical Crops and Biocommodities
Queensland University of Technology, Brisbane,
Australia
Associate Supervisor: Adjunct Associate Professor John P. Bartley
School of Chemistry, Physics and Mechanical
Engineering
Science and Engineering Faculty
Queensland University of Technology, Brisbane,
Australia
The research was carried out within the Centre for Tropical Crops and Biocommodities at the
Queensland University of Technology.

iii
IMPORTANT NOTICE
The information in this thesis is confidential and should not be disclosed for any
reason or relied on for a particular use or application. Any invention or other
intellectual property described in this document remains the property of the
Queensland University of Technology.

iv
DECLARATION OF AUTHORSHIP
The work contained in this thesis has not been submitted for assessment for any other
award. Wherever contributions of others are involved, every effort is made to
indicate this clearly with proper reference to the literature and acknowledgement of
collaborative research and discussions. Some parts of the research work in this thesis
have been published and a list of publications arising from this research has been
provided.
.. ...
Danny M. T. Nguyen, BSc (Hons)
Date: ..........................................................
QUT Verified Signature

v
Abstract
One of the most important parameters in raw sugar quality is colour.
Australian raw sugars are considered to be of high quality with respect to this
parameter. However, some raw sugars produced in both Australia and overseas are
relatively difficult to decolourise by sugar refiners, and tend to develop colour during
storage. A new approach that has the potential to efficiently and cost-effectively
decolourise sugar process streams is through the use of the Fenton oxidation and
related processes. The Fenton oxidation process involves the catalytic production of
hydroxyl radicals from the decomposition of hydrogen peroxide (H2O2) using iron(II),
which has the potential to effectively degrade colour and colour precursors present in
aqueous systems.
As a first step towards developing this technology, this study determined the
colour content and the composition of colour precursors (i.e., phenolic acids), present
in sugar cane juices processed by Australian sugar factories. The results showed that
caffeic, p–coumaric and ferulic acids (classed as hydroxycinnamic acids) are the main
phenolic acids present in sugar cane juice. The study was able to identify flavonoids
(e.g., chrysin, morin, quercetin and rutin) because of modifications of the methods
used in the evaluation of colourants in sugar cane juice.
The results also show that juice expressed partly or solely from whole crop
harvested cane, has significantly higher colour (11,400–20,000 IU) than juices
expressed from burnt harvested cane (10,400–12,700 IU). However, the
concentrations of phenolic acids in burnt cane were twice as much as those obtained
in whole crop cane. This is probably due to the thermal decomposition of HMW
phenolics (viz., lignin, polyphenols) during cane burning.
The Fenton oxidation process was used to study the degradation of these
hydroxycinnamic acids (i.e., caffeic, p–coumaric and ferulic) in water and sucrose
solutions. Central composite design and response surface methodologies were used to
evaluate and optimise the interactive effects of the process parameters. Quadratic
polynomial models were developed for the degradation of each of the individual

vi
acids, and the total hydroxycinnamic acid mixtures. The optimum degradation
efficiency (77%) in an aqueous solution containing the hydroxycinnamic acids
(200 mg/L) was optimum at pH 4.7 and at 25 °C. The efficiency dropped in the
presence of sucrose to 57% at pH 5.4 and at 36 °C.
In a mixture of these hydroxycinnamic acids, the degradation behaviour of
caffeic acid differed from those of p–coumaric and ferulic acids, because unlike the
other acids, it forms a complex with iron(III). Iron(III) is produced in situ during the
oxidation process.
Analysis of the Fenton degradation products showed the presence of low
molecular weight phenolics, aliphatic carboxylic acids as well as several oligomer
products. The tentative mechanisms of formation of these compounds have been
proposed.
To improve the effectiveness of the Fenton process, aluminium chloride was
added to act as a pro-oxidant. This process was evaluated on a synthetic juice
solution consisting of sucrose (15% (w/w)), the hydroxycinnamic acids (200 mg/L)
and a synthetic glucose-glycine melanoidin (2,000 mg/L). The modified Fenton
process degraded the melanoidin and the hydroxycinnamic acid mixture by
approximately 69% and 53% respectively. In the absence of aluminium chloride, the
Fenton process on its own resulted in 63% and 47% degradation, respectively but only
achieved 24% decolourisation. However, the addition of aluminium chloride played a
significant role in the removal of colour with up to 43% decolourisation achieved.
The modified Fenton process was then evaluated for the decolourisation of
authentic factory juices. There were increases in colour measured at pH 4.0 (≤ 45%)
and pH 7.0 (≤ 21%). However, there was decrease for the colour measured at pH 9.0
(≤ 42%). Colour is usually measured at pH 7.0 but additional information about the
nature of colourants is obtained at pH 4.0 and pH 9.0. Colour measured at pH 4.0
suggests the presence the presence of high molecular weight colourants, while colour
measured at pH 9.0 is due to the presence of natural colourants such as flavonoids and
phenolics. The colour at pH 9.0 is more likely to be transferred to the crystal, so there
may well be colour reduction if the treated juice is further processed to raw sugar.

vii
The key contribution contained in this thesis is an understanding of the
degradation of colour precursors in sugar solutions. A new direction of research for
the removal of colour and colour precursors in sugar process streams has been
identified.

viii
Keywords
Colour
Colourants
Colour precursors
Sugar
Sugar cane juice
Sugar quality
Sucrose
Decolourisation
Degradation
Fenton
Advanced oxidation process
Hydroxycinnamic acids
Caffeic acid
p–Coumaric acid
Ferulic acid
Response surface methodology
Experimental design
UV/Visible spectroscopy
High-performance liquid chromatography
Reaction pathways
Clarification
Aluminium chloride
Melanoidin
Reducing sugars

ix
Acknowledgements
A PhD candidature, by its very own nature, is a very unique endeavour. There
is no right way to undertake a PhD project. However, there are many wrong ways
that one could take throughout their candidature. I am for one, a very glad person,
who has taken the best path possible in order to complete my candidature and
hopefully graduate with a doctoral degree. I could have not taken this path without
the consistent guidance and advice given from the very kind people that I have met
throughout my entire candidature to whom I give thanks to.
First and foremost, I would like to sincerely thank my primary supervisor,
Prof. William (Bill) Doherty, for his constant patience, guidance, encouragement and
commitment to this work. Bill, you have been a great mentor. I have learnt and
gained so much from you. Despite our differences and heated discussions on several
aspects of this thesis, you have always seen the best in me. Towards the end of
writing this thesis, I was asked by many for an inspirational and memorable quote
from you. In response to that, that would definitely be, “Danny, could you please
come to my office? I need to see you.” I am very glad because every time I walked
into your office with the heater running on a warm Brisbane day, I would learn
something new, no matter how irrelevant it is to my own work. Thank you.
I would also like to thank my associate supervisor, Adj. A/Prof. John Bartley.
You have always been prompt whenever I needed you most and you have been a great
mentor. I appreciate all the times, especially at the very early stages of my
candidature, assisting me with certain aspects of organic chemistry. I always gained
something useful each time we met. Up to today, I still have a strong passion for
organic chemistry and to me, drawing chemical structures for reaction mechanisms is
genuinely a form of art.
This project would have not happened, if it was not for the financial support
from my scholarship sponsors. To the three main sponsors, the Queensland
University of Technology (QUT), the Sugar Research and Development Corporation
and Sugar Research Limited, a very big thank you for your generosity. My exposure

x
to the Australian sugar industry has been very worthwhile. This was a very rare
opportunity and I am grateful that each sponsor accepted me to undertake this project.
In addition, I would also like to thank the production staff of Condong Sugar Mill,
Tully Sugar Mill and Isis Central Sugar Mill who gave me access to their facilities
during the crushing seasons.
Many thanks must go to all the academic and technical staff who have
contributed to this project throughout my candidature. Prof. Robert (Bob) Gilbert
(University of Queensland, UQ) for his expertise on food polymers; Dr. Peter Sopade
(UQ) and A/Prof. Geoff Kent (QUT) for introducing me into the world of multivariate
statistics; Mr. Hakan Bakir (QUT) for his assistance at the mills during the factory
trials; Mr. Tony Raftery (QUT) for his assistance on XRD analysis; Dr. Chris
Carvalho and Mrs. Leonora Newby for analytical instrument training; and Ms. Wanda
Stolz (QUT) for her endless hospitality in the lab.
To my fellow colleagues who work closely with me, thank you for your
ongoing support. Chris East, you have been a great mate throughout my candidature
and thanks for changing my life that day (you know what happened). William
Gilfillan, thanks for keeping a lookout for Bill every time he approaches into our
office. Travelling with you to the conferences has been great. You always take the
best photos! Josh Howard, thanks for your feedback during our research meetings.
All the best with your PhD mate. Darryn Rackemann, massive thanks for your
hospitality in general as well as your advice on various aspects of the sugar industry.
It has been great to work alongside you. Caroline Thai for her patience and
generosity throughout our university lives since the days back at RMIT University. I
am sorry, if I ever convinced you to do a PhD but in the end we know it was worth it.
Thank you for the seven years of memories. A final message to the whole group, I
am very glad to have met all of you and I wish you all the best throughout your
careers.
There are far too many people to list all of them individually, but I am
indebted to all of them at one time or another, for their support and giving me the
motivation to complete my candidature. These people are all the staff and students
from the Centre of Tropical Crops and Biocommodities (QUT), the School of
Chemistry, Physics and Mechanical Engineering (QUT) and the administrative and

xi
HDR support staff (QUT). Also, to the SEF HDR Student Society at QUT, thank you
for giving me the opportunity to be the founding chairman of the society. It has been
a pleasure during the inaugural year and I wish all the best for the team in the future.
There is one more group of people that I am very fond and close to that I need
to recognise for their long-distance support and love, that is my family. Leaving
home and family for a long period of time (once again… sorry mum!) was not so
easy. I cannot remember how long since I left home but the words “Không có văn
bằng học là big trouble! Okay?” (Vietnamese: No (PhD) degree means big trouble
(for you)! Okay?) are still ringing in my ear. Maybe that has been a driving force for
me to finish my candidature. To my family back in Melbourne, thank you and I will
always make the both of you, mum and dad, proud! To my brother, Steven, good luck
with Year 12 exams. Considering taking chemistry in university next year? You
should!

xii
I dedicate this thesis to my family and friends for
nursing me with affections and love and for their
dedication for success in my life.
“The surest way not to fail is to determine to
succeed.”
Rt. Hon. Richard Brinsley Sheridan

xiii
Publications and Awards
Refereed Journal Papers
Nguyen, D. M. T., & Doherty, W. O. S. (2013). Optimisation of process parameters
for the removal of hydroxycinnamic acids in sugar solutions. International
Sugar Journal, accepted for publication.
Nguyen, D. M. T., & Doherty, W. O. S. (2012). Optimisation of process parameters
for the degradation of caffeic acid in sugar solutions. International Journal of
Food Science and Technology, 47(12), 2477-2486.
Nguyen, D. M. T., & Doherty, W. O. S. (2012). Phenolics in sugar cane juice:
Potential degradation by hydrogen peroxide and Fenton's reagent.
International Sugar Journal, 114(1361), 309-315.
Conference Proceedings
Nguyen, D. M. T., & Doherty, W. O. S. (2012) Process optimisation for the
degradation of phenolic compounds in water and sugar solutions. Proceedings
of the Second International Conference on Advanced Oxidation Processes, 72-
73.
Nguyen, D. M. T., & Doherty, W. O. S. (2012) Optimisation of process parameters
for the removal of hydroxycinnamic acids in sugar solutions. Proceedings of
the Australian Society of Sugar Cane Technologists, 34, (electronic format).
Nguyen, D. M. T., & Doherty, W. O. S. (2011) Phenolics in sugar cane juice:
Potential degradation by hydrogen peroxide and Fenton’s reagent.
Proceedings of the Australian Society of Sugar Cane Technologists, 33,
(electronic format).

xiv
Conference Posters
Nguyen, D. M. T., & Doherty, W. O. S. (2012) Combined Fenton oxidation and
chemical coagulation for the treatment of melanoidin/phenolic acid mixtures.
Presented at the Second International Conference on Advanced Oxidation
Processes, Kottayam, Kerala, India.
Conference Lectures
Nguyen, D. M. T., & Doherty, W. O. S. (2012) Process optimisation for the
degradation of phenolic compounds in water and sugar solutions. Presented at
the Second International Conference on Advanced Oxidation Processes,
Kottayam, Kerala, India.
Nguyen, D. M. T., & Doherty, W. O. S. (2012) Optimisation of process parameters
for the removal of hydroxycinnamic acids in sugar solutions. Presented at the
34th Australian Society of Sugar Cane Technologists, Palm Cove,
Queensland, Australia.
Nguyen, D. M. T., & Doherty, W. O. S. (2011) Phenolics in sugar cane juice:
Potential degradation by hydrogen peroxide and Fenton’s reagent. Presented
at the 33rd Australian Society of Sugar Cane Technologists, Mackay,
Queensland, Australia.
Awards
Presenting Science Award (2013) for the best presentation presented at the Sugar
Research and Development Corporation Scholarship Forum, Townsville,
Queensland, Australia.
Young Investigators Award (2012) for the best paper presented at the Second
International Conference on Advanced Oxidation Processes, Kottayam,
Kerala, India.
Denis Foster Chemistry/Chemical Engineering Award (2012) for the best paper
presented by a chemistry/chemical engineering tertiary student at the 34th
Australian Society of Sugar Cane Technologists Conference, Palm Cove,
Queensland, Australia.

xv
Table of Contents
Abstract............................................................................................................................ v
Keywords......................................................................................................................... viii
Acknowledgements......................................................................................................... ix
Publications and Awards................................................................................................. xiii
List of Figures.................................................................................................................. xx
List of Tables................................................................................................................... xxvii
List of Abbreviations and Nomenclature........................................................................ xxxi
1. GENERAL INTRODUCTION........................................................................... 1
1.1 Background and Motivation.................................................................... 2
1.2 Research Problem..................................................................................... 3
1.3 Aims and Objectives................................................................................. 4
1.4 Scope of this Thesis................................................................................... 5
2. LITERATURE REVIEW.................................................................................... 9
2.1 Introduction............................................................................................... 10
2.2 Colourants in Sugar Process Streams..................................................... 10
2.2.1 Naturally Occurring Colourants.................................................. 12
2.2.2 Factory Produced Colourants...................................................... 16
2.3 Reactivity of Colourants during Sugar Manufacturing........................ 18
2.3.1 Enzymatic Browning..................................................................... 18
2.3.2 Non-enzymatic Oxidation............................................................. 20
2.3.3 Maillard Reaction......................................................................... 21
2.3.4 Caramelisation............................................................................. 24
2.3.5 Hexose Alkaline Degradation....................................................... 27
2.3.6 Conversion of Anthocyanins to Chalcones................................... 29
2.3.7 Biochemical Precursors of Flavonoids........................................ 30
2.4 Colour in Sugar Process Streams............................................................ 31
2.4.1 Effects of Temperature on Colour Formation.............................. 35
2.5 Sugar Decolourisation Technologies....................................................... 37
2.5.1 Current Technologies................................................................... 37

xvi
2.5.2 Decolourisation using Chemical Additives.................................. 38
2.5.3 Novel and Potential Technologies................................................ 42
3. DETERMINATION OF PHENOLIC COMPOUNDS IN FACTORY
SUGAR CANE JUICES.......................................................................................
57
3.1 Introduction................................................................................................. 58
3.2 Materials and Methods............................................................................... 58
3.2.1 Reagents and Solvents.................................................................. 58
3.2.2 Specification of Samples............................................................... 59
3.2.3 Sample Preparation...................................................................... 60
3.2.4 Instrumental Procedures and Analyses........................................ 60
3.2.5 Colour, Refractive Index and Total Soluble Solids
Measurements...............................................................................
62
3.3 Results and Discussion................................................................................ 62
3.3.1 Colour Analyses of Juices............................................................. 62
3.3.2 Phenolic Content in Juices........................................................... 63
3.4 Summary...................................................................................................... 70
4. DEGRADATION OF HYDROXYCINNAMIC ACIDS................................... 73
4.1 Introduction................................................................................................. 74
4.2 Materials and Methods............................................................................... 75
4.2.1 Reagents and Solvents.................................................................. 75
4.2.2 Catalytic and Non-catalytic Oxidation of Caffeic Acid................ 75
4.2.3 Fenton Oxidation Reactions for Caffeic Acid Degradation......... 76
4.2.4 Fenton Oxidation Reactions for the Degradation of
Hydroxycinnamic Acid Mixtures..................................................
78
4.2.5 Instrumental Procedures and Analyses........................................ 78
4.2.6 Performance Assessment of the Fenton Oxidation Process......... 79
4.2.7 Design of Experiments.................................................................. 80
4.2.8 Statistical Analysis........................................................................ 82
4.2.9 Evaluation of the Interactions between Fe(II) and
Hydroxycinnamic Acids................................................................
82
4.3 Results and Discussion................................................................................ 83
4.3.1 Catalytic and Non-catalytic Oxidation of Caffeic Acid in
Aqueous Systems...........................................................................
83
xvii
4.3.2 Optimisation of Process Parameters for the Degradation of
Caffeic Acid in Sugar Solutions....................................................
87
4.3.3 Degradation of Hydroxycinnamic Acid Mixtures......................... 100
4.4 Summary...................................................................................................... 130
5. SEPARATION AND IDENTIFICATION OF FENTON OXIDATION
PRODUCTS DERIVED FROM HYDROXYCINNAMIC ACIDS.................
137
5.1 Introduction................................................................................................. 138
5.2 Materials and Methods............................................................................... 138
5.2.1 Reagents and Solvents.................................................................. 138
5.2.2 Fenton Oxidation Reactions for the Degradation of
Hydroxycinnamic Acid Mixtures..................................................
138
5.2.3 Sample Preparation...................................................................... 139
5.2.4 Instrumental Procedures and Analyses........................................ 140
5.2.5 Fenton Oxidation Reactions for the Degradation of Sucrose
Mixtures........................................................................................
142
5.2.6 Computational Methods............................................................... 142
5.3 Results and Discussion................................................................................ 143
5.3.1 Identification of Oxidation Products............................................ 143
5.3.2 Proposed Degradation Pathways of Selected Hydroxycinnamic
Acids.............................................................................................
153
5.3.3 Oligomerisation of Hydroxycinnamic Acids................................. 166
5.4 Summary...................................................................................................... 171
6. DEGRADATION OF MELANOIDIN AND HYDROXYCINNAMIC
ACID MIXTURES...............................................................................................
177
6.1 Introduction................................................................................................. 178
6.2 Materials and Methods............................................................................... 178
6.2.1 Reagents and Solvents.................................................................. 178
6.2.2 Preparation of Synthetic Melanoidin........................................... 179
6.2.3 Modified Fenton Oxidation Process............................................. 179
6.2.4 Instrumental Procedures and Analyses........................................ 179
6.2.5 Performance Assessment of the Modified Fenton Oxidation
Process..........................................................................................
180
6.2.6 Design of Experiments.................................................................. 181

xviii
6.2.7 Statistical Analysis........................................................................ 182
6.3 Results and Discussion................................................................................ 182
6.3.1 Monitoring Melanoidin and Hydroxycinnamic Acid
Degradation..................................................................................
182
6.3.2 Transformation of Data, Regression Modelling and Statistical
Analysis.........................................................................................
184
6.3.3 Oxidation Performance of Melanoidins....................................... 190
6.3.4 Oxidation Performance of Hydroxycinnamic Acids..................... 194
6.3.5 Response Surface Analyses for the Decolourisation of Mixtures. 198
6.3.6 Process Optimisation and Validation........................................... 200
6.4 Summary...................................................................................................... 203
7. EVALUATION OF FENTON AND FENTON-LIKE PROCESSES FOR
THE REMOVAL OF COLOUR FROM FACTORY SUGAR CANE
JUICE....................................................................................................................
205
7.1 Introduction................................................................................................. 206
7.2 Materials and Methods............................................................................... 206
7.2.1 Reagents and Solvents.................................................................. 206
7.2.2 Specification of Samples............................................................... 207
7.2.3 Decolourisation Procedure.......................................................... 207
7.2.4 Preparation of Flocculants........................................................... 207
7.2.5 Preparation of Lime Saccharate................................................... 208
7.2.6 Clarification Procedure................................................................ 208
7.2.7 Turbidity Measurements............................................................... 209
7.2.8 Sucrose, Dry Substance and Purity Measurements...................... 210
7.2.9 Reducing Sugars Composition Analyses...................................... 210
7.2.10 Colour, Refractive Index and Total Soluble Solids
Measurements...............................................................................
210
7.2.11 Inorganic Ion Composition Analyses........................................... 211
7.3 Results and Discussion................................................................................ 211
7.3.1 First Decolourisation Trials......................................................... 211
7.3.2 Second Decolourisation Trials..................................................... 215
7.3.3 Economic Considerations............................................................. 222
7.4 Summary...................................................................................................... 222

xix
8. CONCLUSIONS AND FUTURE ASPECTS..................................................... 227
8.1 Findings of the Thesis................................................................................. 228
8.2 Recommendations for Future Work......................................................... 231
Appendices............................................................................................................ 235

xx
List of Figures
Figure 2.1 Schematic flowchart of the sugar manufacturing process in
Australia…………………………………………………………
11
Figure 2.2 Flavonoid structures found in sugar process streams and
products. Examples are given under the general chemical
structures (Ververidis et al., 2007)...............................................
13
Figure 2.3 Structures of phenolics found in sugar process streams and
products. Examples are given under the general chemical
structures (Harborne, 1989; Vermerris and Nicholson, 2006).....
14
Figure 2.4 Polymerisation of monomeric gallic acid to polyphenols ellagic
acid and ellagitannin (Ross et al., 2007)......................................
15
Figure 2.5 Redox chemistry of phenolics under copper and iron to produce
colour forming products as proposed by Danilewicz et al.
(2008)............................................................................................
20
Figure 2.6 An example of a basic melanoidin structure formed from
3–deoxyhexosuloses (Cämmerer et al., 2002)..............................
26
Figure 2.7 An example of a melanoidin polymer formed from
3–deoxyhexosuloses and amino acids proposed by Cämmerer
and Kroh (1995)............................................................................
27
Figure 2.8 Condensation product formed from the reaction of HMF and a
ketone; followed by an additional condensation reaction with a
second equivalent of HMF (Chheda and Dumesic, 2007)…........
27
Figure 2.9
Formation of colour among three clarification processes; mixed
juice (MJ), heated juice (HJ), incubated juice (IJ), limed juice
(LJ), flocculated heated limed juice (FHLJ), evaporator supply
juice (ESJ), final evaporator syrup (FES) and raw sugar (RS)
(Eggleston et al., 2003).................................................................
34

xxi
Figure 3.1 Separation of a typical mixture of compounds in the FEJ extract
of burnt harvested cane by HPLC-DAD (Method A, UV/Vis
detection at 280 nm). 1 = gallic acid (tentative), 2 = HMF,
3 = 4–hydroxybenzoic acid, 4 = chlorogenic acid, 5 = vanillic
acid, 6 = caffeic acid, 7 = 2,3–dihydroxybenozic acid,
8 = protocatechuic acid (tentative), 9 = p–coumaric acid,
10 = ferulic acid............................................................................
64
Figure 3.2 Separation of a standard mixture of compounds by HPLC-DAD
(Method B, UV/Vis detection at 280 nm). 1 = gallic acid,
2 = HMF, 3 = protocatechuic acid, 4 = furfural,
5 = 4–hydroxybenzoic acid, 6 = (±)–catechin, 7 = vanillic acid,
8 = caffeic acid, 9 = chlorogenic acid, 10 = vanillin,
11 = p–coumaric acid, 12 = syringaldehyde, 13 = ferulic acid,
14 = sinapinic acid, 15 = coumarin, 16 = o–coumaric acid,
17 = 3,4,5–trimethoxybenzoic acid, 18 = rutin, 19 = diosmin,
20 = chrysin, 21 = morin, 22 = quercetin.....................................
67
Figure 3.3 Separation of a typical mixture of compounds in the PJ extract
of burnt harvested cane by HPLC-DAD (Method B, UV/Vis
detection at 280 nm). 1 = gallic acid, 2 = HMF,
3 = protocatechuic acid, 4 = furfural, 5 = 4–hydroxybenzoic
acid, 6 = vanillic acid, 7 = caffeic acid, 8 = p–coumaric acid,
9 = syringaldehyde, 10 = ferulic acid, 11 = sinapinic acid,
12 = coumarin, 13 = rutin, 14 = diosmin, 15 = chrysin,
16 = morin, 17 = quercetin...........................................................
68
Figure 4.1 Schematic representation of heating block used for the Fenton
oxidation process..........................................................................
77
Figure 4.2 Absorption spectra of CaA after the addition of 2.94 mM H2O2
at pH 3.0 at 25 °C.........................................................................
84
Figure 4.3
Degradation of CaA (measured at 320 nm) using Fenton’s
reagent at different initial pH at 25 °C. Concentrations of
H2O2: (a) 11.8 mM and (b) 2.94 mM...........................................
86
Figure 4.4 Plot of predicted and experimental (actual) values for the
degradation (%) of CaA................................................................
91

xxii
Figure 4.5 Normal probability plot of residuals for fitted model using CaA
degradation data............................................................................
91
Figure 4.6 Three-dimensional surface plots of CaA degradation (%) as a
function of (a) CaA and Fe(II); (b) sucrose and H2O2; (c)
sucrose and temperature; and (d) pH and Fe(II). Variables:
CaA (1.11 mM); sucrose (0% (w/w)); pH (5.0); Fe(II) (0.45
mM); H2O2 (6.62 mM); temperature (35 °C) and time (120 s)....
93
Figure 4.7 Three-dimensional surface plots of CaA degradation (%) as a
function of (a) pH and H2O2; (b) Fe(II) and H2O2; (c) H2O2 and
temperature; and (d) H2O2 and time. Variables: CaA
(1.11 mM); sucrose (0% (w/w)); pH (5.0); Fe(II) (0.45 mM);
H2O2 (6.62 mM); temperature (35 °C) and time (120 s)..............
95
Figure 4.8 Normal probability plot of residuals for fitted model using CaA
degradation data before power transformation.............................
101
Figure 4.9 Box-Cox plots of (a) CaA and (b) pCoA degradation data for
the determination of the optimised power transformed response
surface models..............................................................................
103
Figure 4.10 Box-Cox plots of (a) FeA and (b) total HCA degradation data
for the determination of the optimised power transformed
response surface models...............................................................
104
Figure 4.11 Normal probability plots of residuals for fitted model using
(a) CaA and (b) pCoA degradation data after power
transformation...............................................................................
105
Figure 4.12 Normal probability plots of residuals for fitted model using
(a) FeA and (b) total HCA degradation data after power
transformation...............................................................................
106
Figure 4.13 Plots of predicted response and experimental (actual) values for
the degradation (%) of (a) CaA and (b) pCoA.............................
114
Figure 4.14
Plots of predicted response and experimental (actual) values for
the degradation (%) of (a) FeA and (b) total HCA.......................
115

xxiii
Figure 4.15 Perturbation plots for the degradation (%) of (a) CaA; (b) pCoA
and (c) FeA. Coded values are shown for each factor: total
HCA (A); sucrose (B); pH (C) and temperature (D); and refer
to actual values listed in Table 4.3...............................................
117
Figure 4.16 Effect of pH (pH 4.0–6.0) on the absorption spectra of CaA
(0.055 mM) at 25 °C: (a) in the absence and (b) in the presence
of Fe(II) (0.04 mM)......................................................................
119
Figure 4.17 Normalised ATR-FTIR spectra of CaA solutions at 25 °C after
subtraction of acetate buffer (pH 5.5): (a) in the absence and
(b) in the presence of Fe(II)..........................................................
122
Figure 4.18 Normalised ATR-FTIR spectra of CaA solutions containing
sucrose at 25 °C after subtraction of acetate buffer (pH 5.5): (a)
in the absence and (b) in the presence of Fe(II)...........................
123
Figure 4.19 Three-dimensional surface plots of total HCA degradation (%)
as a function of (a) total HCA and sucrose; (b) sucrose and pH;
and (c) pH and temperature. Variables: total HCA (155 mg/L);
sucrose (7.5% (w/w)); pH (5.0) and temperature (35 °C)............
124
Figure 5.1 High-performance LC-DAD chromatograms (UV/Vis detection
at 280 nm) of (a) CaA; (b) pCoA and (c) FeA; subjected to
Fenton oxidation at 2 min (pH 4.7, 25 °C)...................................
145
Figure 5.2 Total ion chromatograms (negative ion mode ESI-MS) of
(a) CaA; (b) pCoA and (c) FeA; subjected to Fenton oxidation
at 2 min (pH 4.7, 25 °C)...............................................................
148
Figure 5.3 Gas chromatograms of SPE extracts of (a) CaA; (b) pCoA and
(c) FeA solutions; subjected to Fenton oxidation at 2 min
(pH 4.7, 25 °C).............................................................................
152
Figure 5.4 Electrostatic potential maps and equilibrium geometries of
(a) CaA; (b) pCoA and (c) FeA as derived from B3LYP/
6-31+G* calculations....................................................................
154
Figure 5.5
Proposed structure of a tetramer of caffeic acid (m/z 715) by
Agha et al., (2009)........................................................................
171

xxiv
Figure 6.1 Typical HPLC-FLD chromatogram (fluorescence detection at
λex = 350 nm and λem = 445 nm) of the melanoidin/HCA
mixture in sucrose solution (15% (w/w)) before and after
modified Fenton oxidation (t = 2 min) at pH 5.6 and 35 °C........
183
Figure 6.2 Typical HPLC-DAD chromatogram (UV/Vis detection at 280
nm) of the melanoidin/phenolic acid mixture in sucrose solution
(15% (w/w)) before and after modified Fenton oxidation
(t = 2 min) at pH 5.6 and 35 °C. 1 = CaA, 2 = pCoA, 3 = FeA.
184
Figure 6.3 Perturbation plot for (%) melanoidin degradation. Coded
values are shown for each factor: melanoidin (A); total HCA
(B); pH (C); FeSO4·7H2O dose (D) and AlCl3·6H2O dose (E);
and refer to actual values listed in Table 6.1................................
191
Figure 6.4 Contour plots of melanoidin degradation (%) as a function of
(a) melanoidin and AlCl3·6H2O dosage; (b) pH and
FeSO4·7H2O dosage. Variables: melanoidin (1,500 mg/L);
total HCA (150 mg/L); pH (5.25); FeSO4·7H2O dosage (389
mg/L) and AlCl3·6H2O dosage (200 mg/L).................................
192
Figure 6.5 Contour plots of melanoidin degradation (%) as a function of
(a) pH and AlCl3·6H2O dosage; (b) FeSO4·7H2O dosage and
AlCl3·6H2O dosage. Variables: melanoidin (1,500 mg/L); total
HCA (150 mg/L); pH (5.25); FeSO4·7H2O dosage (389 mg/L)
and AlCl3·6H2O dosage (200 mg/L)............................................
193
Figure 6.6 Perturbation plot for (%) total HCA degradation. Coded values
are shown for each factor: melanoidin (A); total HCA (B); pH
(C); FeSO4·7H2O dose (D) and AlCl3·6H2O dose (E); and refer
to actual values listed in Table 6.1...............................................
195
Figure 6.7
Contour plots of total HCA degradation (%) as a function of
(a) melanoidin and pH; (b) melanoidin and FeSO4·7H2O
dosage. Variables: melanoidin (1,500 mg/L); total HCA
(150 mg/L); pH (5.25); FeSO4·7H2O dosage (389 mg/L) and
AlCl3·6H2O dosage (200 mg/L)...................................................
196

xxv
Figure 6.8 Contour plots of total HCA degradation (%) as a function of
(a) total HCA and FeSO4·7H2O dosage; (b) total HCA and
AlCl3·6H2O dosage. Variables: melanoidin (1,500 mg/L); total
HCA (150 mg/L); pH (5.25); FeSO4·7H2O dosage (389 mg/L)
and AlCl3·6H2O dosage (200 mg/L)............................................
197
Figure 6.9 Three-dimensional surface plots of decolourisation (%) as a
function of (a) melanoidin and AlCl3·6H2O dosage; (b) total
HCA and FeSO4·7H2O; (c) total HCA and AlCl3·6H2O dosage;
and (d) FeSO4·7H2O and AlCl3·6H2O. Variables: melanoidin
(1,500 mg/L); total HCA (150 mg/L); pH (5.25); FeSO4·7H2O
dosage (389 mg/L) and AlCl3·6H2O dosage (200 mg/L).............
199
Figure 7.1 Sugar Research Institute designed batch settling kit.................... 209
Figure A2.1 High-performance LC-DAD chromatograms (UV/Vis detection
at 280 nm) of the HCA mixture subjected to Fenton oxidation
at 2 min (pH 4.7, 25 °C)…………...……………………………
259
Figure A2.2 Total ion chromatogram (negative ion mode ESI-MS) of the
HCA mixture subjected to Fenton oxidation at 2 min
(pH 4.7, 25 °C).….……………....………………...……………
260
Figure A2.3 Gas chromatogram of a SPE extract of the HCA mixture
subjected to Fenton oxidation at 2 min (pH 4.7, 25 °C).……......
260
Figure A2.4 Negative ion mode ESI-MS full-scan spectrum relevant to the
dimer product arising from the Fenton oxidation of FeA,
[M]– = 385.1 Da …...........…...……………….…………………
261
Figure A2.5 Negative ion mode ESI-MS full-scan spectrum relevant to the
tetramer product arising from the Fenton oxidation of CaA,
[M]– = 715.2 Da ……………………….……..…………………
261
Figure A3.1 Normal probability plots of residuals for fitted model using
(a) melanoidin and (b) total HCA degradation data after power
transformation.….………………………………….……………
266
Figure A3.2
Box-Cox plots of (a) melanoidin and (b) total HCA degradation
data for the determination of the optimised power transformed
response surface models.………….….…………………………
267
xxvi
Figure A3.3 Plots of predicted response and experimental (actual) values for
the degradation (%) of (a) melanoidin and (b) total HCA.……...
268
Figure A3.4 Plot of predicted response and experimental (actual) values for
the decolourisation (%).…………………………………….…...
269

xxvii
List of Tables
Table 2.1 Properties of colourants in cane juice (Davis, 2001a).................... 32
Table 2.2 Colour analyses of milled juice at pH 7.0 (Smith et al., 1981)....... 33
Table 2.3 Comparison of colour at pH 7.0 and 9.0 from process streams of
a typical sugar mill (Smith et al., 1981)..........................................
34
Table 2.4 Decolourisation processes on colourants types existing in juice as
adapted from Davis (2001b)...........................................................
37
Table 3.1 Colour of factory cane juices recorded at pH 7.0........................... 63
Table 3.2 Phenolic acids and HMF (mM on dry content) by HPLC-DAD of
sugar cane juices using Method A..................................................
65
Table 3.3 Phenolic acids (mM on juice) and HMF by HPLC-DAD of PJs
using Method A...............................................................................
66
Table 3.4 Phenolic acids and HMF (mM on dry content) by HPLC-DAD of
sugar cane juices using Method B..................................................
69
Table 4.1 Volumes of reagents (mM) used for the degradation of CaA......... 76
Table 4.2 Coded and actual values of the experimental design for Design 1. 81
Table 4.3 Coded and actual values of the experimental design for Design 2. 82
Table 4.4 Analysis of variance (ANOVA) results for response surface
quadratic model terms for CaA degradation...................................
89
Table 4.5 Regression diagnostics for the response surface quadratic model
for CaA degradation........................................................................
90
Table 4.6 Optimised conditions under specified constraints for the
degradation of CaA and model verification....................................
97
Table 4.7 Model verification of optimised conditions under randomly
specified constraints for CaA degradation......................................
98
Table 4.8 Model verification of optimised conditions in synthetic sugar
solutions under specified constraints of selected various sugar
process streams for CaA degradation.............................................
99
Table 4.9 Results of ANOVA for model terms of the response surface
reduced quadratic model for CaA degradation...............................
109

xxviii
Table 4.10 Results of ANOVA for model terms of the response surface
reduced quadratic model for pCoA degradation.............................
110
Table 4.11 Results of ANOVA for model terms of the response surface
reduced quadratic model for FeA degradation................................
111
Table 4.12 Results of ANOVA for model terms of the response surface
reduced quadratic model for total HCA degradation......................
112
Table 4.13 Wavenumbers (cm–1) of selected bands from ATR-FTIR spectra
of CaA solution and CaA mixtures containing Fe(II) and/or
sucrose at pH 5.5 and 25 °C............................................................
121
Table 4.14 X-ray diffraction data of the precipitate formed between CaA and
Fe(II) at pH 5.5 and 25 °C..............................................................
126
Table 4.15 Optimised conditions under specified constraints for the
degradation of total HCA (200 mg/L) and model verification.......
128
Table 5.1 Reaction products formed from the Fenton oxidation of HCAs
detected by LC/MS.........................................................................
146
Table 5.2 Contents of organic acids (mM) by HPIEC of individual and
combined HCA mixtures................................................................
149
Table 5.3 Reaction products formed from the Fenton oxidation of HCAs
detected by GC/MS.........................................................................
151
Table 5.4 Electron density distribution of carbon atoms in HCA molecules. 155
Table 6.1 Coded and actual values of the experimental design...................... 182
Table 6.2 Results of ANOVA for model terms of the response surface
reduced two-factor interaction model for melanoidin degradation.
187
Table 6.3 Results of ANOVA for model terms of the response surface
reduced two-factor interaction model for total HCA degradation..
188
Table 6.4 Results of ANOVA for model terms of the response surface
reduced quadratic model for decolourisation..................................
189
Table 6.5 Optimised conditions under specified constraints for the
degradation of melanoidin (2,000 mg/L) and total HCA (200
mg/L) in sucrose solution (15% (w/w)) at 35 °C; and model
verification......................................................................................
201

xxix
Table 6.6 Optimised conditions under specified constraints for the
decolourisation of synthetic juice mixtures containing
melanoidin (2,000 mg/L), HCA (200 mg/L) and sucrose
(15% (w/w)) at 35 °C; and model verification................................
202
Table 7.1 Operating parameters for ICP-OES analyses.................................. 211
Table 7.2 Clarification performance results on clarified No. 2 mill juices
from the Tully Sugar Mill trials......................................................
212
Table 7.3 Inorganic ion composition results on clarified No. 2 mill juices
from the Tully Sugar Mill trials......................................................
213
Table 7.4 Colour results on clarified No. 2 mill juices from the Tully Sugar
Mill trials.........................................................................................
214
Table 7.5 Clarification performance results on clarified factory juices from
the Isis Central Sugar Mill trials.....................................................
216
Table 7.6 Inorganic ion composition results clarified factory juices from
the Isis Central Sugar Mill trials.....................................................
217
Table 7.7 Purity and reducing sugar results on clarified factory juices from
the Isis Central Sugar Mill trials............................................
219
Table 7.8 Colour results on clarified factory juices from the Isis Central
Sugar Mill trials..............................................................................
220
Table 7.9 Prices of additives in bulk quantities used for the modified
Fenton process................................................................................
222
Table A1.1 Experimental design and results for % CaA degradation
(i.e., Design 1)…………………………………………………….
236
Table A1.2 Sucrose and reducing sugar results on selected tests at t = 2 min
(i.e., Design 1)…………………………………………………….
241
Table A1.3 Experimental design and results for % CaA, % pCoA, % FeA
and % total HCA degradation (i.e., Design 2)……………………
243
Table A1.4 Sucrose and reducing sugar results at t = 2 min (i.e., Design 2)…. 245
Table A2.1 Geometry optimisation, charges and bond order computational
calculations of CaA……………………………………………….
247
Table A2.2
Geometry optimisation, charges and bond order computational
calculations of pCoA……………………………………………...
251

xxx
Table A2.3 Geometry optimisation, charges and bond order computational
calculations of pCoA……………………………………………...
255
Table A2.4 Sucrose and reducing sugar results of Fenton-mediated reactions
of sucrose at t = 2 min…………………………………………….
259
Table A3.1 Experimental design for % total HCA, % melanoidin degradation
and decolourisation…….………………………………………....
262
Table A3.2 Results for % total HCA, % melanoidin degradation and
decolourisation…………………………………………………....
264

xxxi
List of Abbreviations and Nomenclature
Acronyms
BSES Bureau of Sugar Experiment Stations
CA California, USA
CO Colorado, USA
CT Connecticut, USA
ICDD International Centre for Diffraction Data
IL Illinois, USA
MA Massachusetts, USA
MD Maryland, USA
MN Minnesota, USA
MO Missouri, USA
NSW New South Wales, Australia
QLD Queensland, Australia
QSL Queensland Sugar Limited
QUT Queensland University of Technology
SRI Sugar Research Institute
UK United Kingdom
UQ University of Queensland
USA United States of America
VIC Victoria, Australia
WI Wisconsin, USA
Scientific Acronyms
2EJ Second Expressed Juice
2FI Two-Factor Interaction
3D Three-Dimensional
3EJ Third Expressed Juice
4EJ Fourth Expressed Juice

xxxii
ALS Automatic Liquid Sampler
ANOVA Analysis of Variance
AR Analytical Research
AOP Advanced Oxidation Process
ATR Attenuated Total Reflectance
B3 Becke’s Three Parameters (Functional)
CaA Caffeic Acid
CCD Central Composite Design
CV Coefficient of Variance
DAD Diode-Array Detection
DFT Density Functional Theory
DH Degree of Hydrolysis
DOE Design of Experiments
DS Dry Substance
EI Electron Impact
ESI Electrospray Ionisation
ESJ Evaporator Supply Juice
FeA Ferulic Acid
FEJ First Expressed Juice
FES Final Evaporator Syrup
FHLJ Flocculated Heated Limed Juice
FLD Fluorescence Detection
FTIR Fourier Transform Infrared
GC Gas Chromatography
HADP Hexose Alkaline Degradation Product
HCA Hydroxycinnamic Acid
HF Hartree-Fock
HJ Heated Juice
HMF Hydroxymethylfurfural
HMW High Molecular Weight
HPAEC High-Performance Anion Exchange Chromatography
HPIEC High-Performance Ion Exclusion Chromatography
HPLC High-Performance Liquid Chromatography
xxxiii
ICUMSA International Commission for Uniform Methods of Sugar Analysis
IJ Incubated Juice
IV Indicator Value
LC Liquid Chromatography
LJ Limed Juice
LMW Low Molecular Weight
LYP Lee-Yang-Parr (Functional)
MJ Mixed Juice
MRP Maillard Reaction Product
MRSM Multi-Response Surface Methodology
MS Mass Spectrometry
MS/MS Tandem Mass Spectrometry
MW Molecular Weight
PAD Pulse Amperometric Detection
pCoA p–Coumaric Acid
PJ Primary Juice
PPO Polyphenol Oxidase
PRESS Predicted Residual Sum of Squares
Q Quadrupole
RI Refractive Index
RS Raw Sugar
RSD Relative Standard Deviation
RSM Response Surface Methodology
SPE Solid Phase Extraction
SS Sum of Squares
TIC Total Ion Chromatography
TOF Time-of-Flight
TSS Total Soluble Solids
UV Ultraviolet
UV/Vis Ultraviolet/Visible
VWD Variable Wavelength Detector
XRD X-ray Powder Diffraction

xxxiv
Nomenclature
2° secondary
3° tertiary
A absorbance
df degrees of freedom
E1 early-time waveform
E2 intermediate-time waveform
E3 late-time waveform
e exponential
ε random error term
i.d. internal diameter
k number of factors
L luminescence
ln natural logarithm
λ wavelength
λem emission wavelength
λex excitation wavelength
m– prefix (meta–) for substituents on 1,3-positions of aromatic compounds
m/z mass-to-charge ratio
n number of experiments
o– prefix (ortho–) for substituents on 1,2-positions of aromatic compounds
p p-value for the probability of obtaining a test statistic
p– prefix (para–) for substituents on 1,4-positions of aromatic compounds
π– prefix (pi–) for representing covalent chemical bonds
pKa acid dissociation constant
R2 coefficient of determination
T temperature
t time
tR retention time

xxxv
Units
Å Ångström
AU absorbance units
°Bx degree Brix
°C degree Celsius
cc cubic centimetre
cm centimetre
Da dalton
eV electron volt
g gram
h hour
hp horsepower
IU ICUMSA units
K Kelvin
kg kilogram
kPa kilopascals
kV kilovoltage
kW kilowatt
LU luminescence units
M molarity
mA milliampere
mAU milliabsorbance units
mg milligram
min minute
mL millilitre
mM millimolarity
mm millimetre
MΩ megaohm
μA microampere
μL microlitre
μm micrometre
nm nanometre
ppm parts per million

xxxvi
psig pound-force per square inch gauge
rpm revolutions per minute
s second
t tonne
TU turbidity units
V voltage
% (v/v) volume/volume percent
% (w/w) weight/weight percent
1
CHAPTER 1
General Introduction
1.1 Background and Motivation........................................................... 2
1.2 Research Problem............................................................................ 3
1.3 Aims and Objectives........................................................................ 4
1.4 Scope of this Thesis.......................................................................... 5

2
1.1 Background and Motivation
Sugar is an important commodity in world agricultural trade. It is mainly
sucrose, a disaccharide made up of glucose and fructose, and is sourced from either
sugar cane (Saccharum officinarum L.) or sugar beet (Beta vulgaris L.). Commonly
referred to as table or granulated sugar, its use in the food and beverage industries is
widespread. Sugar obtained from sugar cane contributes to 70% of the world’s sugar
production. However, unlike sugar beet, which is primarily sold as white sugar, a
plethora of sugar products are produced from sugar cane (e.g., raw sugar, syrup and
molasses).
Australia produces approximately 4.5 million tonnes of raw sugar per year, of
which 85% is exported (Canegrowers, 2012). This contributes around $A1.7 billion
to Australia’s export earnings (QSL, 2011). The ongoing fluctuating international
value of sugar continues to stress the viability of Australian sugar mills and threaten
the reliance of regional communities on the industry. A consequence of the increased
competition amongst sugar producers in world trade is an increased focus on the
delivery of high quality sugar. In Australia, high quality raw sugar attracts a premium
value of about $A7 per tonne of sugar (QSL, 2011).
One of the most important parameters in sugar quality is colour. Australian
raw sugars are considered to be of high quality with respect to this parameter, but
there is room for improvement. However, some raw sugars produced in both
Australia and overseas are relatively difficult to decolourise by sugar refiners and tend
to develop colour during storage.
The costs of sugar refining increase with the amount of colouring matter in the
raw sugar feedstock. Therefore, given a choice, sugar refineries select low colour raw
sugar from the markets at a price premium. Sugar refineries are not wanting to affine
low quality raw sugars, as affination is expensive due to the high use of fossil fuels
for energy to operate the fugals. A reduction of colour in raw sugar or a cheap and
effective method of removal in processing would lead to lower refining costs.

3
1.2 Research Problem
Numerous technologies have been developed over the decades to achieve
efficient and effective decolourisation of sugar cane process streams at a reasonable
cost, in order to produce low coloured raw sugar. Apart from the crystallisation
process, there are very few technologies and modifications to current processes that
can significantly and economically reduce colour, except for the use of sulfur dioxide
(SO2) (Paton, 1992; Bento, 1999; Godshall, 1999). The use of SO2 via the sulfitation
process for the production of plantation white sugar is discouraged in many countries
because of the health risks surrounding the consumption of contaminated sugar
containing residual sulfur (6–30 mg/kg) (Steindl and Doherty, 2005). The options
that are in current use in Australian sugar factories for colour removal in raw sugar
include double purging (i.e., washing) of sugar crystals and modification of
crystallisation boiling schemes. These treatment options are not so effective with
high molecular weight (HMW) colourants and require refining in order to obtain
white sugar (Lindeman and O'Shea, 2001).
Different methods that have been trialled to treat sugar cane process streams
for colour removal include clarification techniques (Eggleston et al., 2003), air
flotation (Echeverri and Rein, 2006), membrane filtration (Farmani et al., 2008),
chemical precipitation (Doherty et al., 2003), ion exchange resins (Broadhurst and
Rein, 2003) and activated carbon adsorption (Mudoga et al., 2008). A major
disadvantage that sugar manufacturers face is that most of the aforementioned
processes are colour selective and are not effective in removing certain types of
colourants. To overcome this, combinations of two or more processes are usually
required to produce the best low colour raw sugar (Olivério et al., 2010). However,
the option of using combinations of technologies is expensive and not viable for raw
sugar manufacturers. In addition, sugar manufacturers have also reduced the amount
of extraneous matter entering into the factory in an attempt to reduce the amount of
colour in the final raw sugar product.
In the last decade or so, there has been an increasing trend towards the
evaluation of chemical additives as alternatives to reduce or inhibit colour formation
during sugar processing. These include the use of sulfurated and chlorinated
compounds (Saska et al., 2010), ozone (Moodley et al., 1999), hydrogen peroxide

4
(H2O2) (Mane et al., 2000) and ferric ion (Fe(III)) in conjunction with endogenous
proteins (Madsen and Day, 2010). Advanced oxidation processes (AOPs) are gaining
focus as alternatives to conventional methods for the treatment of organic dyes
(Koprivanac et al., 2005) and industrial wastewaters (Pera-Titus et al., 2004).
However, these technologies have received limited attention to not only decolourise
sugar process streams, but also remove impurities that may affect processing. An
example of this is the activation of H2O2 using ferrous iron (Fe(II)), typically referred
to as the Fenton oxidation process. It is an attractive process for its low capital costs,
low toxicity of reagents and ease of application.
In this context, this present study builds on this line of research by examining
the potential decolourisation and oxidative degradation of colourants and colour
precursor compounds in water, synthetic juice solutions and sugar cane factory juices
using the Fenton oxidation and related processes.
1.3 Aims and Objectives
The overarching aim of the project was to develop a cost-effective
decolourisation process for effective removal of colourants and colour precursors
from sugar cane process streams using the Fenton oxidation process.
The specific objectives of the project were to:
Determine the colour and composition of phenolic acid compounds (i.e.,
colour precursors) present in different juice types.
Optimise process parameters and develop models for the removal of colour
precursors (e.g., hydroxycinnamic acids) and synthetic colourants using the
Fenton process.
Propose mechanisms for the degradation of hydroxycinnamic acids by the
Fenton process.
Evaluate the decolourisation efficiency of the Fenton process on factory juice.
A preliminary cost benefit analysis was also conducted to assess the benefits
of the developed Fenton technologies to remove colour during raw sugar manufacture.

5
1.4 Scope of this Thesis
There are limited reports in the literature with respect to the use of the Fenton
process to treat sugar process streams. There are also gaps in the literature with
regards to the degradation mechanisms of colour precursor compounds using the
Fenton process. Therefore, this thesis examined the use of the Fenton oxidation
process and variants of this process as potential technologies for the removal of
colourants and colour precursors in aqueous and sugar solutions. This thesis is thus
arranged in the following manner.
Chapter 1 provides the background and motivation for the work, the research
problem and the specific objectives of the project.
Chapter 2 covers a comprehensive literature review on the types, origins and
reactions of colourants in the processing of sugar cane; the formation of colour during
processing of sugar cane to produce raw sugar; and discusses known and potential
sugar decolourisation technologies.
Chapter 3 provides a study on the colour and phenolic acid composition of
sugar cane juices processed in Australian sugar factories. Colour content does not
only differ from region to region but also because of differences in cane variety, soil
type, climate and harvesting methods. The standard method used for the
determination of colour precursors is compared to a modified method developed in
the project.
Chapter 4 presents an exhaustive and comprehensive analysis on the effects of
the Fenton oxidation process on a selected group of colour precursor compounds
(viz., caffeic, p–coumaric and ferulic acids). The use of experimental design coupled
with regression modelling through multivariate statistics were used for the
optimisation of the operating parameters.
The Fenton oxidation process is capable of mineralising organic compounds
(i.e., decomposition to carbon dioxide (CO2) and water (H2O)) through reactions
involving free radicals. However, depending on the operating conditions, this may
not imply complete mineralisation. Chapter 5 evaluates the oxidation products
obtained from the Fenton process using several chromatographic and spectroscopic

6
techniques. Attempts were made to determine the degradation pathways of selected
colour precursors.
Complex synthetic juice solutions involving more than one type of colourant
group have been investigated. Mixtures containing a synthetically-made factory
produced colourant (i.e., melanoidin) and hydroxycinnamic acids were degraded and
decolourised using the Fenton and modified Fenton processes. The results from this
work are presented in Chapter 6.
On the basis of the results obtained from Chapters 3 to 6, the developed
technologies and their optimised constraints were then trialled on factory sugar cane
process streams, as shown in Chapter 7. A selected number of juice streams from
Australian sugar factories were tested under laboratory scale conditions. A
preliminary financial analysis based on the indicated benefits and costs of additives on
factory process streams was conducted and discussed in this chapter.
Chapter 8 summarises the overall findings of the works carried out throughout
this project and provides recommendations for future work.
7
References
Bento, L. S. M. (1999). Study of colour formation during carbonation in cane sugar
refining using GPC with a ELS detector. Proceedings of the AVH Association
(pp. 23-27). Reims, France.
Broadhurst, H. A., & Rein, P. W. (2003). Modeling adsorption of cane-sugar solution
colorant in packed-bed ion exchangers. AIChE Journal, 49(10), 2519-2532.
Canegrowers (2012). Canegrowers Australia Annual Report 2011/2012. Tingalpa,
QLD, Australia: Harding Colour.
Doherty, W. O. S., Fellows, C. M., Gorijan, S., Senogles, E., & Cheung, W. H.
(2003). Flocculation and sedimentation of cane sugar juice particles with
cationic homo- and copolymers. Journal of Applied Polymer Science, 90(1),
316-325.
Echeverri, L. F., & Rein, P. W. (2006). Numerical study of the flow in air flotation
syrup clarifiers. Proceedings of the South African Sugar Technologists'
Association, 80, 378-390.
Eggleston, G., Monge, A., & Ogier, B. E. (2003). Sugarcane factory performance of
cold, intermediate, and hot lime clarification processes. Journal of Food
Processing and Preservation, 26, 433-454.
Farmani, B., Haddadekhodaparast, M. H., Hesari, J., & Aharizad, S. (2008).
Determining optimum conditions for sugarcane juice refinement by pilot plant
dead-end ceramic micro-filtration. Journal of Agriculture, Science and
Technology, 10, 351-357.
Godshall, M. A. (1999). Removal of colorants and polysaccharides and the quality of
white sugar. Proceedings of the AVH Association (pp. 28-35). Reims, France.
Koprivanac, N., Kušić, H., Vujević, D., Peternel, I., & Locke, B. R. (2005). Influence
of iron on degradation of organic dyes in corona. Journal of Hazardous
Materials, B117, 113-119.
Lindeman, P. F., & O'Shea, M. G. (2001). High molecualr weight (HMW) colorants
and their impact on the refinability of raw sugar. A study of Australian and
overseas raw sugars. Proceedings of the Australian Society of Sugar Cane
Technologists, 23, 322-329.
Madsen, L. R., II, & Day, D. F. (2010). Iron mediated clarification and
decolourisation of sugarcane juice. Proceedings of the International Society of
Sugar Cane Technologists, 27, 1-13.
Mane, J. D., Phadnis, S. P., Jambhale, D. B., & Yewale, A. V. (2000). Mill scale
evaluation of hydrogen peroxide as a processing aid: quality improvement in
plantation white sugar. International Sugar Journal, 102(1222), 530-533.

8
Moodley, M., Davis, S. B., & Adendorff, M. W. (1999). Full scale decolourisation
trials with ozone. International Sugar Journal, 101, 165-171.
Mudoga, H. L., Yucel, H., & Kincal, N. S. (2008). Decolorization of sugar syrups
using commercial and sugar beet pulp based activated carbons. Bioresource
Technology, 99, 3528-3533.
Olivério, J. L., Boscariol, F. C., Mantelatto, P. E., Ciambelli, J. R., Gabardo, H., &
Oliveira, A. A. (2010). DRD–Dedini Refinado Direto (Dedini Direct Refined)
improvements in refined and crystal white sugar production. Proceedings of
the International Society of Sugar Cane Technologists, 27, 1-13.
Paton, N. H. (1992). The origin of colour in raw sugar. Proceedings of the Australian
Society of Sugar Cane Technologists, 14, 8-17.
Pera-Titus, M., García-Molina, V., Baños, M. A., Giménez, J., & Esplugas, S. (2004).
Degradation of chlorophenols by means of advanced oxidation processes: a
general review. Applied Catalysis, B: Environmental, 47, 219-256.
QSL (2011). Key Facts | Queensland Sugar. Retrieved March 14, 2013, from
http://www.qsl.com.au/about-qsl/key-facts
Saska, M., Zossi, S., & Liu, H. (2010). Colour behaviour in cane juice clarification by
defecation, sulfitation and carbonation. Proceedings of the International
Society of Sugar Cane Technologists, 27, 1-14.
Steindl, R. J., & Doherty, W. O. S. (2005). Syrup clarification for plantation white
sugar to meet new quality standards. International Sugar Journal, 107(1282),
581-589.

9
CHAPTER 2
Literature Review
2.1 Introduction..................................................................................... 10
2.2 Colourants in Sugar Process Streams............................................ 10
2.2.1 Naturally Occurring Colourants......................................... 12
2.2.2 Factory Produced Colourants............................................. 16
2.3 Reactivity of Colourants during Sugar Manufacturing............... 18
2.3.1 Enzymatic Browning............................................................ 18
2.3.2 Non-enzymatic Oxidation.................................................... 20
2.3.3 Maillard Reaction................................................................ 21
2.3.4 Caramelisation.................................................................... 24
2.3.5 Hexose Alkaline Degradation............................................. 27
2.3.6 Conversion of Anthocyanins to Chalcones.......................... 27
2.3.7 Biochemical Precursors of Flavonoids............................... 30
2.4 Colour in Sugar Process Streams................................................... 31
2.4.1 Effects of Temperature on Colour Formation..................... 35
2.5 Sugar Decolourisation Technologies.............................................. 37
2.5.1 Current Technologies.......................................................... 37
2.5.2 Decolourisation using Chemical Additives......................... 38
2.5.3 Novel and Potential Technologies....................................... 42

10
2.1 Introduction
The development of colour during sugar processing is a common problem for
the sugar manufacturing industry. Juices and syrups produced as a result of
processing contain compounds that end up in the sugar crystal. This chapter presents
an overview of the previous work on sugar colour and provides the essential
background for the current research. A review of the literature on the properties of
colourants, their behaviour during processing and evaluation of decolourisation
technologies is described in this chapter. The review provides one understanding of
the fundamental mechanisms of colour formation in sugar cane processing.
2.2 Colourants in Sugar Process Streams
A representation of the typical sugar manufacturing process in Australia is
shown in Figure 2.1. Sugar cane is harvested and cut on a seasonal basis. Harvested
sugar cane is transported in large containers or bins to the sugar mill. The cane is then
shredded and crushed (i.e., milled) to extract the juice. The juice is incubated and
limed to remove impurities (e.g., starch) that affect subsequent processes and
minimise sucrose inversion. The limed juice is then boiled (≥ 100 °C) and flashed
before a flocculant is added to enhance the bridging of impurity aggregates. The
treated juice is then clarified to separate and remove flocculated impurities, fibre and
soil. Clarified juice then passes to the evaporation stage, where water is removed to
form syrup. In the crystallisation process, the syrup is seeded and the crystals grow in
vacuum pans, followed by separation of crystals by centrifugation. The separated
crystals are washed and then dried to produce raw sugar ready for export or
transferred to a sugar refinery for the production of white sugar.

11
Figure 2.1 Schematic flowchart of the sugar manufacturing process in
Australia.
Colour in sugar process streams consist of a complex mixture of compounds.
They are introduced naturally from the cane plant or produced during processing in
the factory. The compounds formed have different molecular weights, chemical
structures and properties as a result of degradation and polymerisation reactions
caused by changes in process parameters such as pH and temperature. The colourants
that are difficult to remove are mainly hydrophobic in nature and persist throughout
the sugar manufacturing process occluding within the sugar crystals. Moreover, their
behaviour and reactivity at various stages of the sugar manufacturing process is
extremely complex. Therefore, it is important to understand the process parameters
that contribute to the formation of colour in order to develop technologies suitable for
the subsequent removal of colour during processing.
Sugar CaneCane
HarvestingMilling Incubation
ClarificationEvaporationCrystallisationRaw Sugar
Exported to Consumers
Transferred to Refinery

12
2.2.1 Naturally Occurring Colourants
Chlorophylls and Carotenoids
Sugar cane pigments are predominantly made up of chlorophylls, carotenoids
(carotenes and xanthophylls) and flavonoids. These colourants are present in
expressed juices after the milling of cane. Extraneous matter such as the tops and
leaves of the sugar cane plant contribute significantly to colour in juice (Mersad et al.,
2003). Colloidal in nature, chlorophylls and carotenoids are insoluble in water.
Therefore, they do not contribute to the colouring of the final product as they are
easily removed during clarification.
Flavonoids
Flavonoids are soluble and weakly acidic in nature and persist throughout the
milling and refining processes. These compounds are essential for the growth of the
sugar cane plant. However, their presence in processing significantly impacts on the
colouring of raw sugar. Flavonoids contribute up to a third of the colouring in raw
sugar according to Smith and Paton (1985). This amount can considerably rise with
juices expressed from whole green cane crop that contain tops and leaves. The
colouring of raw sugar from flavonoids is attributable to the occlusion of flavonoid
glycosides in the sugar crystals during crystallisation. These naturally occurring
compounds are divided into various subgroups such as flavones, flavanols and
anthocyanins and only differ in the numbering and positioning of hydroxyl groups on
the C6–C3–C6 flavonoid backbone structure. A summary of these structures is
presented in Figure 2.2 (Ververidis et al., 2007).

13
Figure 2.2 Flavonoid structures found in sugar process streams and products.
Examples are given under the general chemical structures
(Ververidis et al., 2007).
Phenolic Compounds
The term phenolic comprises a wide range of compounds which possess an
aromatic ring with one or more hydroxyl groups. Their presence is widespread
throughout the plant kingdom. Phenolics in nature can exist in their free and bound
forms, as esters or glycosides (e.g., flavonoids). Mainly colourless, phenolics are
endogenous to the cane and are introduced into the sugar process streams after the
crushing of cane. Subsequently, these phenolics may participate in enzymatic,
complexation or polymerisation reactions yielding coloured compounds which
survive throughout the milling process. A summary of the phenolic compounds is
described in Figure 2.3 (Harborne, 1989; Vermerris and Nicholson, 2006).
O
3
5
6
7
82'
3'
4'
5'
6'
O
O
35
6
7
82'
3'
4'
5'
6'
O
O
OH35
6
7
82'
3'
4'
5'
6'
35
6
7
8
2'
3'
4'
5'
6'
O
O
O
OH35
6
7
82'
3'
4'
5'
6'
O
O
35
6
7
82'
3'
4'
5'
6'
Anthocyanidins (Flavylium ion)
3,5,7,3’,5’–OH: Cyanidin
3,5,7,4’–OH, 3’–OCH3: Peonidin
3,5,7,4’–OH, 3’,5’–OCH3: Malvidin
3–O–sugar: Anthocyanidin Glycosides
Flavones (2–phenylchromen–4–one)
5,7,4’–OH: Apigenin
5,7,3’,4’–OH: Luteolin
5,7,4’–OH, 3’,5’–OCH3: Tricin
5,7 or 6,8–sugar: Flavones Glycosides
5,7,4’–OH: Kaempferol
5,7,3’,4’–OH: Quercetin
5,7,3’,4’,5’–OH: Myricetin
3,7–O–sugar: Flavonol Glycosides
Flavonols (2–phenylchromen–4–one)
Isoflavones (3–phenylchromen–4–one)
7,4’–OH: Daidzein
5,7,4’–OH: Genistein
7,4’–OH, 6–OCH3: Glycitein
7–O–sugar: Isof lavone Glycosides
Flavanols or Flavan-3-ols
(2–phenyl–3,4–dihydro–2H–chromen–3–ol)
5,7,4’,5’–OH: Catechin
5,7,3’,4’,5’–OH: Gallocatechin
6,8–sugar: Flavanol Glycosides
5,7,4’–OH: Narnigenin
5,7,3’–OH, 4’–OCH3: Hesperetin
3,5,7,4’,5’–OH: Taxifolin (also a flavanonol)
7–O–sugar: Flavanone Glycosides
Flavanone (2,3–dihydro–2–phenylchromen–4–one)
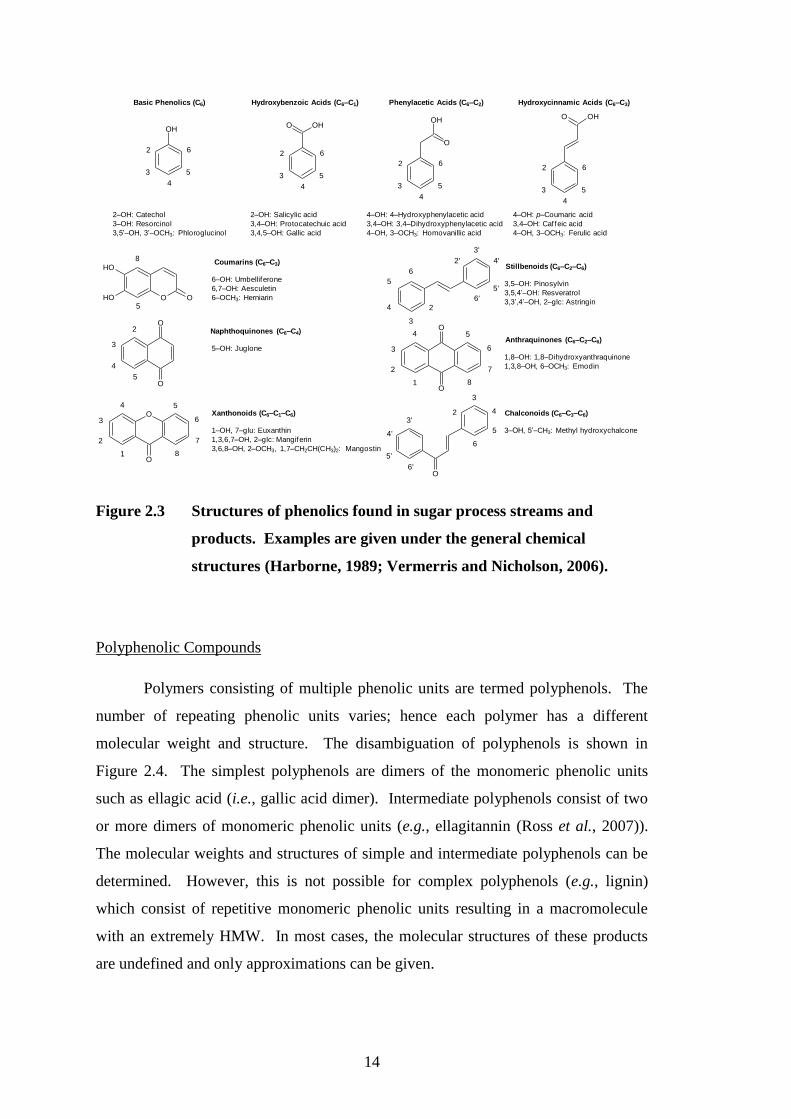
14
Figure 2.3 Structures of phenolics found in sugar process streams and
products. Examples are given under the general chemical
structures (Harborne, 1989; Vermerris and Nicholson, 2006).
Polyphenolic Compounds
Polymers consisting of multiple phenolic units are termed polyphenols. The
number of repeating phenolic units varies; hence each polymer has a different
molecular weight and structure. The disambiguation of polyphenols is shown in
Figure 2.4. The simplest polyphenols are dimers of the monomeric phenolic units
such as ellagic acid (i.e., gallic acid dimer). Intermediate polyphenols consist of two
or more dimers of monomeric phenolic units (e.g., ellagitannin (Ross et al., 2007)).
The molecular weights and structures of simple and intermediate polyphenols can be
determined. However, this is not possible for complex polyphenols (e.g., lignin)
which consist of repetitive monomeric phenolic units resulting in a macromolecule
with an extremely HMW. In most cases, the molecular structures of these products
are undefined and only approximations can be given.
Basic Phenolics (C6)
2–OH: Catechol
3–OH: Resorcinol
3,5’–OH, 3’–OCH3: Phloroglucinol
Hydroxybenzoic Acids (C6–C1)
2–OH: Salicylic acid
3,4–OH: Protocatechuic acid
3,4,5–OH: Gallic acid
4–OH: p–Coumaric acid
3,4–OH: Caf feic acid
4–OH, 3–OCH3: Ferulic acid
Hydroxycinnamic Acids (C6–C3)
4
3
2
OH
5
6
4
3
2
OHO
5
6
4
3
2
OHO
5
6
4–OH: 4–Hydroxyphenylacetic acid
3,4–OH: 3,4–Dihydroxyphenylacetic acid
4–OH, 3–OCH3: Homovanillic acid
Phenylacetic Acids (C6–C2)
4
3
2
OH
O
5
6
Coumarins (C6–C3)
6–OH: Umbelliferone
6,7–OH: Aesculetin
6–OCH3: Herniarin
Xanthonoids (C6–C1–C6)
1–OH, 7–glu: Euxanthin
1,3,6,7–OH, 2–glc: Mangiferin
3,6,8–OH, 2–OCH3, 1,7–CH2CH(CH3)2: Mangostin
5
8
O O
OH
OH
O
O1
4 5
8
3 6
2 7
Stillbenoids (C6–C2–C6)
3,5–OH: Pinosylvin
3,5,4’–OH: Resveratrol
3,3’,4’–OH, 2–glc: Astringin
3
5
4 2
6
2'
3'
4'
5'
6'
5
4
2O
O
3
Naphthoquinones (C6–C4)
5–OH: Juglone
O
O
1
4 5
8
3 6
2 7
Anthraquinones (C6–C2–C6)
1,8–OH: 1,8–Dihydroxyanthraquinone
1,3,8–OH, 6–OCH3: Emodin
O6'
5'
4'
3'2
3
4
5
6
Chalconoids (C6–C3–C6)
3–OH, 5’–CH3: Methyl hydroxychalcone

15
Figure 2.4 Polymerisation of monomeric gallic acid to polyphenols ellagic
acid and ellagitannin (Ross et al., 2007).
Sugar cane polyphenols include lignins and tannins. Lignin is a complex
macromolecule present in the cell wall of plants. The rigidity of plant stems is
attributable to the presence of lignin with cellulose. Lignin comprises of three
different phenolic units (viz., p–hydroxyphenyl, guaiacyl and syringyl); the
proportions vary according to the type of cane plant and the extraction conditions
(Alves et al., 2012). Tannins are polymeric products of phenolic compounds. They
have the ability to form strongly coloured complexes with proteins to form stable,
hydrophobic co-polymers.
Ellagitannin
Polymer containing 8 gallic acid units
OH
OH
OH
OH
OH OH
O
O
O
O
O
OH
OH
O
OH
OH
OH
OH
OH
OH
OH OH
O
O
O
O
OH OH
OH
OH
OH
OH
O
OO
O
O
O
O
OH
OH
OH
O
O
O
O
OH
OH OH
OH
Ellagic acid
Dimer containing 2 gallic acid units
OH
O
OH
OH
OH
Gallic acid
Phenolic acid monomer

16
Nitrogenous Compounds
The main group of nitrogen-containing compounds present in cane juice are
amino acids and proteins. Proteins are complex HMW compounds made up of amino
acids. The amount of proteins in juice is dependent on the cane variety, soil type and
harvesting conditions. Moreover, the levels of proteins in juice are relatively lower in
sugar cane than in sugar beet. Proteins are of different isoelectric points some of
which are removed during clarification while the remainder persist in the later stages
of processing. Proteins denature and degrade to individual amino acid units as a
result of heat and changes in pH. Amino acids produced from protein denaturation
coupled with those endogenous to the cane plant are not removed during clarification
and can react with reducing sugars via the Maillard reaction to form HMW dark
coloured compounds.
2.2.2 Factory Produced Colourants
Melanins
Polyphenolic products formed by the enzymatic oxidation of phenolic
compounds during processing are called melanins. A typical structure is shown in
Section 2.3.1. The enzymatic browning is catalysed by the polyphenol oxidase (PPO)
enzyme responsible for the conversion of phenols into quinones (Bucheli and
Robinson, 1994). The quinones can then bind to proteins to form coloured polymers
or undergo condensation to form dark colourants.
Melanoidins
Melanoidins by definition are the coloured end products of the Maillard
reaction between an amine (e.g., amino acid) and a carbonyl compound (e.g., reducing
sugar). Also known as the non-enzymatic browning reaction, the reaction
mechanisms are complex, consisting of repetitive condensation, dehydration and
polymerisation reactions resulting in dark brown coloured substances (Rizzi, 1997).
The coloured Maillard reaction products (MRPs) formed are of varying molecular

17
weights, which are dependent on temperature and reaction time. A description on
how a melanoidin is formed is presented in Section 2.3.3.
Aroma Compounds
Aroma compounds are reaction intermediates formed as a result of sucrose
degradation, sucrose fragmentation and amino acid degradation. Some of these
products are similar to those obtained from Maillard and caramelisation reactions.
Intermediate products are capable of further reacting amongst each other to yield
volatile products such as pyrazines, imidazoles and thiophenes. These products act as
precursors of melanoidins since they either possess amino nitrogen or carbonyl
groups, initiating the Maillard reaction.
Caramels
Caramels are produced by the polymerisation of thermally degraded products
of sucrose at high temperatures (Baunsgaard et al., 2001). The products contain
mixtures of oligosaccharides, polysaccharides and coloured matter (Lindeman and
O'Shea, 2001). These colloidal compounds formed have a tendency to remain on the
outer surface of the sugar crystals, which affect the quality of the final raw sugar
product. A description on the formation of caramels is shown in Section 2.3.4.
Hexose Alkaline Degradation Products (HADPs)
Alkaline degradation products of hexose sugars are coloured products formed
as a result of the thermal decomposition of reducing sugars. The end products mainly
consist of carboxylic acids, carbonyl compounds and lower molecular weight (LMW)
polymers, which can lead to inversion of sucrose and further colour formation. The
degradation rate and composition are heavily dependent on temperature, juice pH and
the presence of divalent cations (Coca et al., 2004). The alkaline degradation rate of
hexose sugars is much faster than under acidic conditions. Typical structures of
HADPs are presented in Section 2.3.5.

18
2.3 Reactivity of Colourants during Sugar Manufacturing
2.3.1 Enzymatic Browning
Enzymatic browning is a colour forming reaction involving a phenolic and a
nitrogenous compound, occurring prior to the heating of sugar cane juice to form
melanins. The reaction is likely to take place after crushing and milling of sugar cane
when the juice makes contact with atmospheric air. In general, the reaction involves
an enzyme that acts as a catalyst to oxidise o–diphenolic substrates to
o–benzoquinones (Li et al., 2008). The o–benzoquinone can further react with a
phenolic compound or an amino acid to produce a highly dark coloured condensation
product (i.e., melanins) (Kort, 1979; Riffer, 2000).
The presence of PPO catalyses two reactions: the production of a diphenol
(Singleton, 1987) and the oxidation of the diphenol to an o–benzoquinone (Li et al.,
2008). The first reaction is described in Scheme 2.1, where the monophenol is
oxidised (1) to a diphenol (2). The following reaction (Scheme 2.2) involves the
oxidation of the diphenol (2) to yield o–benzoquinone (3) and water.
OH
(Monophenol)
Phenol
(1)
+O
OH
OH
(Diphenol)
Catechol
(2)
Scheme 2.1
OH
OH O2
O
O
(Quinone)
(3)
2 2 + 2 OH2
(Diphenol)
Catechol
(2)
oBenzoquinone
Scheme 2.2

19
In a separate example, tyrosine, an amino acid present in cane juice, readily
participates in this reaction using the PPO catalyst described in Scheme 2.3 (Wiggins,
1953; Cleary, 1988). Tyrosine (4) undergoes oxidation to dihydroxyphenylalanine
(5). Subsequent catalytic oxidation yields dopaquinone (6). Dopaquinone is
converted to a leuco compound (7) and then oxidised to give dopachrome (8).
Decarboxylation of (8) yields 5,6–dihydroxyindole (9). Further oxidation of (9)
yields indole–5,6–quinone (10) and slower oxidation over time will eventually
produce a melanin (11).
OHNH2
OH
O
(4)
Tyrosine
+O
slow
OHNH2
OH
O
OH
(5)
Dihydroxyphenylalanine
+O
fast
ONH2
OH
O
O
(6)
Dopaquinone
OH
OH
NH
OH
O
(7)
(Leuco Compound)
OH NH
OH
(9)
5,6-Dihydroxyindole
slow
(8)
Dopachrome
+O
fast
O
O
NH
OH
O+ CO2
+O fast
O
O NH
(10)
Indole-5,6-quinone
+O
slow
(11)
(Melanin)
CH NH
CH O
O
Scheme 2.3

20
2.3.2 Non-Enzymatic Oxidation
Non-enzymatic (i.e., chemical) oxidation can occur throughout the sugar
manufacturing process via several reaction pathways with phenolic compounds.
Phenolics that have two or more hydroxyl functional groups on the aromatic ring such
as caffeic acid and its esters (hydroxycinnamic compounds), gallic (hydroxybenzoic
compounds), catechin (flavanols) and malvidin (anthocyanidins) are considered to be
vulnerable to oxidation and produce colour during the manufacturing process of sugar
(Fernandez-Zurbano et al., 1995; Fernández-Zurbano et al., 1998; Kilmartin et al.,
2001). The primary reaction pathway is through the oxidation of phenolics by
reactive oxygen species, catalytically produced from O2 under the presence of
transistion metal ions (viz., copper (Cu) and iron). As shown in Figure 2.5, the
oxidised products are semiquinone radicals and benzoquinones, while the reduction
product of O2, mediated by the redox cycle of Fe(II)/Fe(III) and Cu(I)/Cu(II), is H2O2
(Danilewicz et al., 2008). The quinones formed as a result of oxidation are unstable
and due to their highly electrophilic nature, they can spontaneously react with other
phenolics and amine compounds present in juice to produce coloured polymeric
substances (Oliveira et al., 2011).
R
OH
OH
R
O
OH
Fe(III)
Fe(II)
Cu(I)
Cu(II)
O2
HO2
H2O2
R
O
OH
R
OH
OH
R
O
O
R
O
O
(Diphenol)
(Semiquinone Radical)
(Benzoquinone)
(Benzoquinone)
(Semiquinone Radical)
(Diphenol)
Figure 2.5 Redox chemistry of phenolics under copper and iron to produce
colour forming products as proposed by Danilewicz et al. (2008)

21
Other reaction pathways that may occur during the manufacturing process of
raw sugar include condensation reactions of phenolics with aldehydes
(viz., acetaldehyde) and organic compounds with an aldehyde functional group
(viz., glyoxylic acid). These condensation reactions are common in the wine industry
and are mainly responsible for the colouring and flavouring of wines (Ferreira et al.,
1997; Silva Ferreira et al., 2003). These reactions involve the protonation of an
aldehyde to give a carbocation under acidic conditions, followed by the nucleophilic
addition of the C8 position of the C6-C3 moiety of a flavonoid compound (cf. Figure
2.2) (Li et al., 2008). The intermediate produced is then protonated and can react
with another phenolic compound of any type producing coloured polymers (Fulcrand
et al., 2006).
2.3.3 Maillard Reaction
The Maillard reaction is a non-enzymatic browning process that involves the
reaction of an amino compound with a reducing sugar to produce to a melanoidin. A
common example of the Maillard reaction is described by Cleary (1988) between
glucose and glycine. In this reaction, the formation of a Schiff’s base (or commonly
known as an imine) occurs followed by an Amadori rearrangement to yield an enol.
Scheme 2.4 shows that initial nucleophilic addition occurs where the active
lone pair of electrons on the amine nitrogen atom of glycine (13) attacks the
electrophilic carbonyl carbon of glucose (12) to form a zwitterion (14) (Carey and
Sundberg, 2007). The zwitterion is then converted to an unstable carbinolamine (15).

22
(12)
Glucose
OHH
O
OH
OH
OH
OH
NH2
O
OH+
(13)
Glycine
OH
O
OH
OH
OH
OH
H
NH
OH
O
(14)
(Zwitterion)
OH
OH
OH
OH
OH
H
N
OH
OH
H
O
(15)
(Unstable Carbinolamine)
Scheme 2.4
Nucleophilic addition with a base to (15) and removal of water yields an imine
(16) (Scheme 2.5). The imine (16) undergoes an Amadori rearrangement where the
hydrogen atom bonded to the carbon atom adjacent to the carbon-nitrogen double
bond (C=N) relocates to bond with the nitrogen atom forming an enol (17), as shown
in Scheme 2.6. The Amadori product could also participate in a keto-enol
tautomerism rearrangement to its keto-form (18) (Scheme 2.7). It is also possible for
these products to take part in further colour forming reactions (Belitz et al., 2009).

23
(15)
(Unstable Carbinolamine)
- H2O
+ H2O
(16)
(Imine/Schiff's Base)
OH
OH
OH
OH
OH
N
H
OH
O
OH
OH
OH
OH
OH
H
N
OH
OH
H
O
B
Scheme 2.5
(16)
(Imine/Schiff's Base)
OH
OH
OH
OH
OH
N
H
OH
O
H
(17)
(Enol/Amadori Product)
OH
OH
OH
OH
OH
NH
OH
O
H
Scheme 2.6
(17)
(Enol/Amadori Product)
OH
OH
OH
OH
OH
NH
OH
O
H
(18)
OH
O
OH
OH
OH
NH
OH
O
Scheme 2.7

24
2.3.4 Caramelisation
Under the harsh operating conditions in sugar factories (e.g., elevated
temperatures, acidic pH), caramelisation takes place. The chemistry of caramelisation
is poorly understood due to the complexity of the reactions taken place. Various
general mechanisms have been proposed in the literature and are shown in Scheme
2.8 (Riffer, 1988; Suárez-Pereira et al., 2010).
Heating sucrose syrup at elevated temperatures can form levoglucosan or
decompose to glucose and fructose. These simple sugars form hydroxyl-
methylfurfural (HMF) which is cleaved to yield one equivalent of formic acid and
levulinic acid or react with other volatile compounds to yield melanoidins or
polymeric colourants (Figures 2.6–2.8). Under increasing acidic conditions and
subsequent losses of water (i.e., evaporation) formation of polymers with difructose
dianhydride units can also occur (Madsen, 2006; Suárez-Pereira et al., 2010). Oxygen
does not influence or contribute to further colouring of the caramel formed but could
possibly affect the solubility of the caramel in water or acidic solution (Belitz et al.,
2009).
Scheme 2.8a is an older proposed mechanism of the caramelisation reaction by
Riffer (1988). Thermal degradation of sucrose yields levoglucosan. Dehydration of
levoglucosan yields levoglucoseone. The precursor of HMF, 3,4–dideoxy-
glucosulose–3–ene can be obtained from levoglucosenone. (Daniels and Lohneis,
1997). The latter product can undergo cleavage to yield one equivalent of levulinic
acid and formic acid or react with other volatiles to form melanoidins, coloured
polymers and condensation products (Scheme 2.8d).

25
Sucrose
Heat
H+/H2O
Glucose
Glucooligosaccharides
Fructose
+O
OH
H
OH
OH
H
H
OH OH
HMF
O
OH H
OOther
Volatiles
Fructopyranose
O
H
H
OH
OH
H
H
OH OH
Fructosyl Oxocarbenium CationO
OH
OH
O
- H2O
3,4-Dideoxyglucosulose-3-ene
O
O
O
Levoglucosenone
+ H2O
O
OH
OH
O
OH
Levoglucosan
- H2O
HMF
O
OH H
O
Fructosyl Oxacarbenium Cation
Fructose Disaccharides
Difructose Dianhydride Compounds
(a)
(b)
(d)
(c) (e) (f)
Heat
- H2O
Other
Volatiles
OO
OH
OH O
O
O
O
O
OHCH3
O
O
Levulinic acid
H OH
O
Formic acid
OHCH3
O
O
Levulinic acid
H OH
O
Formic acid
Melanoidins (cf., Figures 2.6-2.7)
Condensation Products (cf., Figure 2.8)
Melanoidins (cf., Figures 2.6-2.7)
Condensation Products (cf., Figure 2.8)
O
OH
HH
H
OH
OH
H OH
H
OH
O
OH
HH
H
OOH
H OH
H
OH
O
H
OH
OH
H
H
OH OH
O
OH
OHH
H
OH
H
OH H
HOH
O
OHOH
OH
OH
Scheme 2.8

26
A more recent proposed mechanism of the caramelisation reaction is shown in
Scheme 2.8b (Suárez-Pereira et al., 2010). Sucrose is hydrolysed and thermally
degraded to glucose and fructose. Glucose is in equilibrium with the
glucooligosaccharides (Scheme 2.8c). On the other hand, fructose may take part in
several different reaction pathways.
In Scheme 2.8d, dehydration of fructose yields HMF which can then further
participate in colour-forming reactions. In both Schemes 8e and 8f, fructose can form
5-membered or 6-membered fructosyl oxacarbenium cations and subsequently to
fructose disaccharides and other difructose dianhydride compounds.
OHOglc
RO
CH3
O
CH3
NR
OR
OH
OH
O glc
O
OH
OR
OH
O glc
R = H, glc or (glc)n
Figure 2.6 An example of a basic melanoidin structure formed from
3–deoxyhexosuloses (Cämmerer et al., 2002).

27
C C C1
N
H
CHOH
CHOH
CH2OH
OH H CHR1
C1
COO
H
C
CH2
CHOR
CHOH
CH2OH
C C
CHOR
CHOH
CH2OH
OH
C1
H
N+
CR1
COOH
C1
C
CH2
CHOR
CHOH
CH2OH
N
H
H HR1 = Amino acid side chain
R = H or sugars
(e.g., amide, ester)
Figure 2.7 An example of a melanoidin polymer formed from
3–deoxyhexosuloses and amino acids proposed by Cämmerer and
Kroh (1995).
O
H
O
OH
O
H
OH
CH3
OO
H
OHO
OOH
H
Aldol Condensation Aldol Condensation
Figure 2.8 Condensation product formed from the reaction of HMF and a
ketone; followed by an additional condensation reaction with a
second equivalent of HMF (Chheda and Dumesic, 2007).
2.3.5 Hexose Alkaline Degradation
Degradation of fructose and glucose under hot alkaline conditions show both
reducing sugars undergo similar reaction pathways and form similar end products
(Yang and Montgomery, 1996; Knill and Kennedy, 2003; Sinnott, 2007). In one
study, over 50 products (including lactic acid, oxalic acid, saccharinic acids, short and
long-chain carboxylic acids) were identified from the degradation of fructose and
glucose in calcium hydroxide solutions (Yang and Montgomery, 1996).

28
The reaction mechanisms are often referred to as the Nef-Isbell-Richards
mechanisms for the degradation of reducing sugars (Sinnott, 2007). There are at least
six reaction steps in this mechanism:
Step 1: Keto-enol tautomerism of a reducing sugar (e.g., glucose, fructose).
Step 2: Enediol deprotonation.
Step 3: Anion isomerisation.
Step 4: Elimination of β–hydroxycarbonyl group.
Step 5: Keto-enol tautomerism.
Step 6: Benzilic acid rearrangement.
Scheme 2.9 illustrates the initial enolisation of fructose (or glucose) (Reaction
Steps 1 and 2) to form a 1,2–enediolate. Elimination of the hydroxyl group (Reaction
Step 4) yields a 1–aldehydo–3–deoxy–2,3–enol. The product undergoes further
tautomerisation (Reaction Step 5) to yield an α–ketoaldehyde followed by addition of
a hydroxide anion. The product then undergoes the final step, a benzilic acid
rearrangement (Reaction Step 6) to yield metasaccharinic acid.
Alternatively, subsequent anion isomerisation of the 1,2–enediolate may also
occur (Reaction Step 3). The two other isomers then participate in the same reactions
(Reaction Steps 4–6) forming isosaccharinic and saccharinic acids respectively.
There are other numerous reactions that may take place under alkaline
conditions such as the Lobry de Bruyn-van Ekenstein transformation, which is the
interconversion between an aldose sugar and a ketose sugar (Hajek et al., 2013). The
reaction steps involved in these reactions are similar to the aforementioned pathways.

29
OH
O
OH
OH
OH
OH
O-
OH
OH
OH
OH
OH
O
OH
OH
OH
OH
O
OH
OH
OH
O-
H OH
OH
OH
OH
OH
O-
O
Metsaccharinic
Acid
Fructose
(Step 1, 2)
O
O
OH
OH
OH
(Step 4) (Step 5) (Step 6)OH+
(Step 3)
OH
O-
OH
OH
OH
OH
O
O
OH
OH
OH
OH
O-
OH
OH
O
OH
Isosaccharinic
Acid
OH
O
OH
OH
O
(Step 4) (Step 5) (Step 6)+
OH
OH
O-
O
OH
OH
(Step 3)
OH
OH
OH
OH
OH
O-
CH2
OH
OH
OH
O
OH
OH
O-
OH
OH
O
CH3
OH
Saccharinic
Acid
CH3
O
OH
OH
O
OH
(Step 4) (Step 5) (Step 6)+
OH
OH
O-
O
OHCH3
CH3
OH
OH
Scheme 2.9
2.3.6 Conversion of Anthocyanins to Chalcones
When sugar cane juice is heated at pH 7.0, anthocyanins are decomposed to
yield one equivalent of a chalconoid and a coumain-glucoside (Smith and Paton,
1985). An example of this is depicted in Scheme 2.10 as the glycoside of malvidin
(19) is degraded by heat to its corresponding chalcone (20) and a coumarin-glucoside
(21) is formed.

30
O+
O
Sugar
OCH3
OH
OCH3
OH
OH
O
Sugar
OCH3
OH
OCH3
OH
OH
OOHO
O
Sugar
OOH
OH
+
(19)
Heat
Malvidin
(20)
Chalcone
(21)
Coumarin-Glucoside
Scheme 2.10
2.3.7 Biochemical Precursors of Flavonoids
There is a relation between phenolic compounds and flavonoids. Cinnamic
acid derivatives are biochemical precursors of flavonoids (Smith and Paton, 1985).
For example, in Scheme 2.11, a tricin aglycone molecule (22) is decomposed to yield
two products, phloroglucinol (23) and sinapic acid (24). Further oxidation of (24)
yields syringic acid (25). Other phenolic acid derivatives such as caffeic and
p–hydroxybenzoic acids are related to luteolin and apigenin aglycones respectively as
they undergo similar reaction mechanisms.
O
OCH3
OH
OCH3
O
OH
OH
OH
OH
OHOCH3
OH
OCH3O
OH+
OCH3
OH
OCH3
OH
O
(22)
(25)
Tricin Aglycone
(23)
Phloroglucinol
(24)
Sinapinic Acid
Syringic Acid
+O
Scheme 2.11
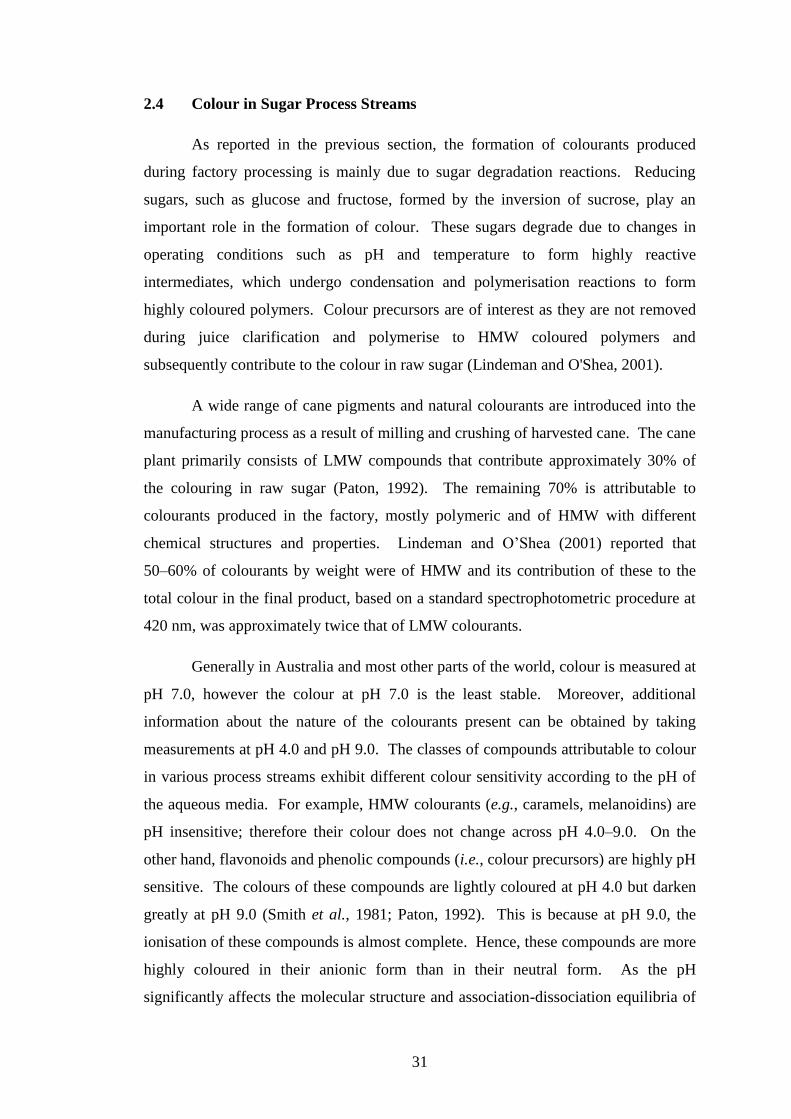
31
2.4 Colour in Sugar Process Streams
As reported in the previous section, the formation of colourants produced
during factory processing is mainly due to sugar degradation reactions. Reducing
sugars, such as glucose and fructose, formed by the inversion of sucrose, play an
important role in the formation of colour. These sugars degrade due to changes in
operating conditions such as pH and temperature to form highly reactive
intermediates, which undergo condensation and polymerisation reactions to form
highly coloured polymers. Colour precursors are of interest as they are not removed
during juice clarification and polymerise to HMW coloured polymers and
subsequently contribute to the colour in raw sugar (Lindeman and O'Shea, 2001).
A wide range of cane pigments and natural colourants are introduced into the
manufacturing process as a result of milling and crushing of harvested cane. The cane
plant primarily consists of LMW compounds that contribute approximately 30% of
the colouring in raw sugar (Paton, 1992). The remaining 70% is attributable to
colourants produced in the factory, mostly polymeric and of HMW with different
chemical structures and properties. Lindeman and O’Shea (2001) reported that
50–60% of colourants by weight were of HMW and its contribution of these to the
total colour in the final product, based on a standard spectrophotometric procedure at
420 nm, was approximately twice that of LMW colourants.
Generally in Australia and most other parts of the world, colour is measured at
pH 7.0, however the colour at pH 7.0 is the least stable. Moreover, additional
information about the nature of the colourants present can be obtained by taking
measurements at pH 4.0 and pH 9.0. The classes of compounds attributable to colour
in various process streams exhibit different colour sensitivity according to the pH of
the aqueous media. For example, HMW colourants (e.g., caramels, melanoidins) are
pH insensitive; therefore their colour does not change across pH 4.0–9.0. On the
other hand, flavonoids and phenolic compounds (i.e., colour precursors) are highly pH
sensitive. The colours of these compounds are lightly coloured at pH 4.0 but darken
greatly at pH 9.0 (Smith et al., 1981; Paton, 1992). This is because at pH 9.0, the
ionisation of these compounds is almost complete. Hence, these compounds are more
highly coloured in their anionic form than in their neutral form. As the pH
significantly affects the molecular structure and association-dissociation equilibria of
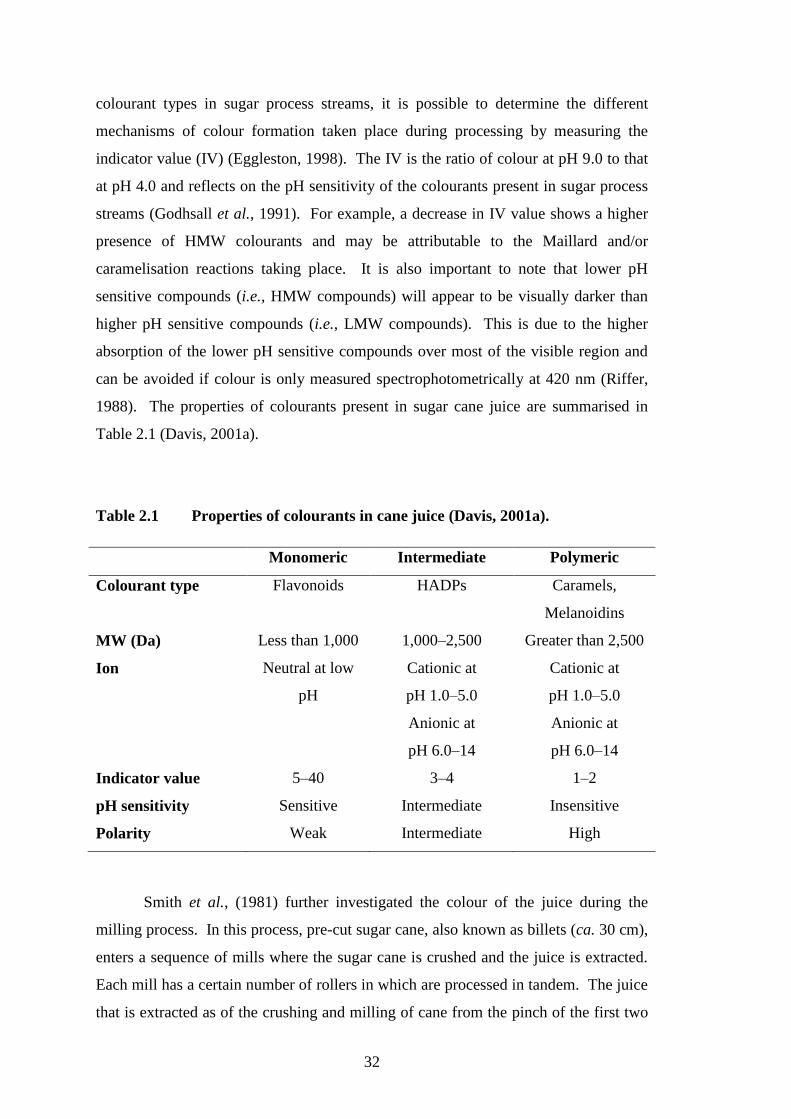
32
colourant types in sugar process streams, it is possible to determine the different
mechanisms of colour formation taken place during processing by measuring the
indicator value (IV) (Eggleston, 1998). The IV is the ratio of colour at pH 9.0 to that
at pH 4.0 and reflects on the pH sensitivity of the colourants present in sugar process
streams (Godhsall et al., 1991). For example, a decrease in IV value shows a higher
presence of HMW colourants and may be attributable to the Maillard and/or
caramelisation reactions taking place. It is also important to note that lower pH
sensitive compounds (i.e., HMW compounds) will appear to be visually darker than
higher pH sensitive compounds (i.e., LMW compounds). This is due to the higher
absorption of the lower pH sensitive compounds over most of the visible region and
can be avoided if colour is only measured spectrophotometrically at 420 nm (Riffer,
1988). The properties of colourants present in sugar cane juice are summarised in
Table 2.1 (Davis, 2001a).
Table 2.1 Properties of colourants in cane juice (Davis, 2001a).
Monomeric Intermediate Polymeric
Colourant type Flavonoids HADPs Caramels,
Melanoidins
MW (Da) Less than 1,000 1,000–2,500 Greater than 2,500
Ion Neutral at low
pH
Cationic at
pH 1.0–5.0
Anionic at
pH 6.0–14
Cationic at
pH 1.0–5.0
Anionic at
pH 6.0–14
Indicator value 5–40 3–4 1–2
pH sensitivity Sensitive Intermediate Insensitive
Polarity Weak Intermediate High
Smith et al., (1981) further investigated the colour of the juice during the
milling process. In this process, pre-cut sugar cane, also known as billets (ca. 30 cm),
enters a sequence of mills where the sugar cane is crushed and the juice is extracted.
Each mill has a certain number of rollers in which are processed in tandem. The juice
that is extracted as of the crushing and milling of cane from the pinch of the first two
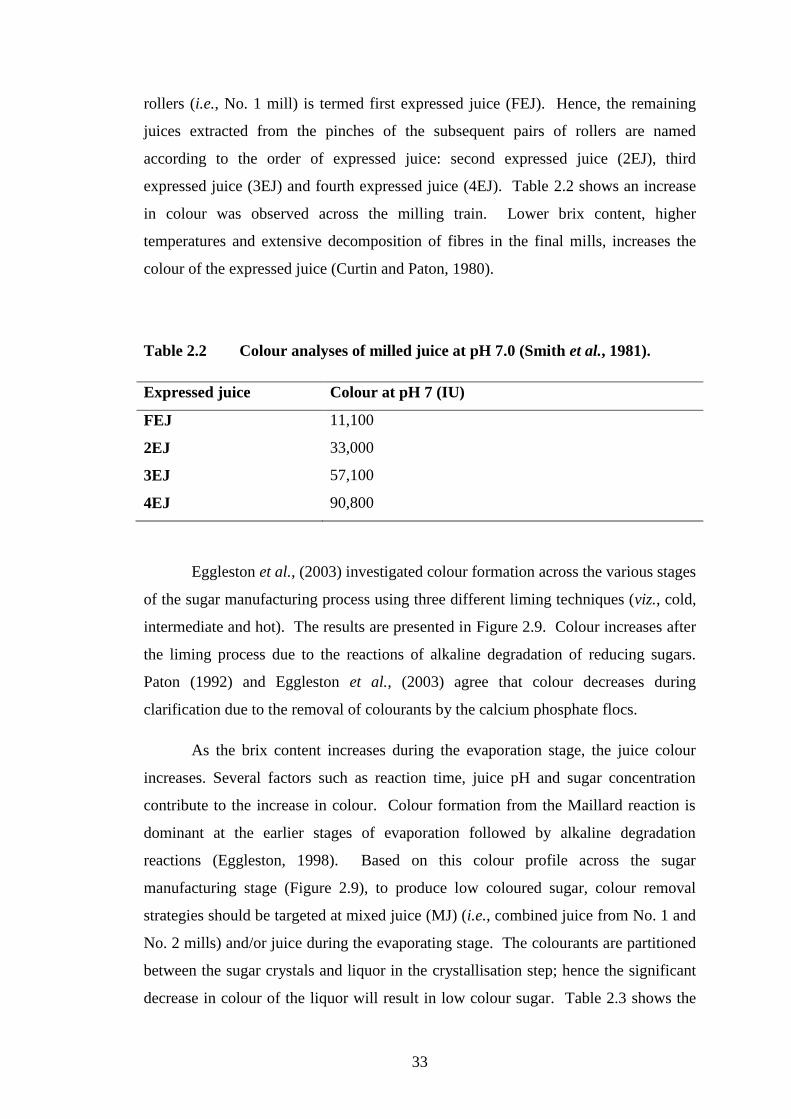
33
rollers (i.e., No. 1 mill) is termed first expressed juice (FEJ). Hence, the remaining
juices extracted from the pinches of the subsequent pairs of rollers are named
according to the order of expressed juice: second expressed juice (2EJ), third
expressed juice (3EJ) and fourth expressed juice (4EJ). Table 2.2 shows an increase
in colour was observed across the milling train. Lower brix content, higher
temperatures and extensive decomposition of fibres in the final mills, increases the
colour of the expressed juice (Curtin and Paton, 1980).
Table 2.2 Colour analyses of milled juice at pH 7.0 (Smith et al., 1981).
Expressed juice Colour at pH 7 (IU)
FEJ 11,100
2EJ 33,000
3EJ 57,100
4EJ 90,800
Eggleston et al., (2003) investigated colour formation across the various stages
of the sugar manufacturing process using three different liming techniques (viz., cold,
intermediate and hot). The results are presented in Figure 2.9. Colour increases after
the liming process due to the reactions of alkaline degradation of reducing sugars.
Paton (1992) and Eggleston et al., (2003) agree that colour decreases during
clarification due to the removal of colourants by the calcium phosphate flocs.
As the brix content increases during the evaporation stage, the juice colour
increases. Several factors such as reaction time, juice pH and sugar concentration
contribute to the increase in colour. Colour formation from the Maillard reaction is
dominant at the earlier stages of evaporation followed by alkaline degradation
reactions (Eggleston, 1998). Based on this colour profile across the sugar
manufacturing stage (Figure 2.9), to produce low coloured sugar, colour removal
strategies should be targeted at mixed juice (MJ) (i.e., combined juice from No. 1 and
No. 2 mills) and/or juice during the evaporating stage. The colourants are partitioned
between the sugar crystals and liquor in the crystallisation step; hence the significant
decrease in colour of the liquor will result in low colour sugar. Table 2.3 shows the

34
extent of colour formed in various sugar process streams in a typical sugar mill and
the partition of colour between liquor and sugar is 6:1 (Smith et al., 1981).
Figure 2.9 Formation of colour among three clarification processes; mixed
juice (MJ), heated juice (HJ), incubated juice (IJ), limed juice (LJ),
flocculated heated limed juice (FHLJ), evaporator supply juice
(ESJ), final evaporator syrup (FES) and raw sugar (RS)
(Eggleston et al., 2003).
Table 2.3 Comparison of colour at pH 7.0 and 9.0 from process streams of a
typical sugar mill (Smith et al., 1981).
Processing stage Colour at pH 7.0 (IU) Colour at pH 9.0 (IU)
FEJ 10,700 23,300
Mixed juice 19,200 37,100
Liquor 15,400 44,500
Magma 27,800 57,400
Massecuite (A-grade) 25,500 63,900
Raw sugar (A-grade) 2,600 5,700
0
2
4
6
8
10
12
14
MJ HJ IJ LJ FHLJ ESJ FES RS
Co
lou
r (
IU)
(x1
03)
Processing Stage of Sample
Hot
Intermediate
Cold

35
2.4.1 Effects of Temperature on Colour Formation
Paton and McCowage (1987) investigated colour formation in factory and
synthetic evaporator supply juice (ESJ) when heated (up to 100 °C) for 5 h. In one of
their studies, the authors compared samples of factory ESJ and deaminated factory
ESJ. The colour in the factory ESJ sample at pH 7.0 increased by about 20% of the
original colour. The colour of the deaminated factory ESJ at pH 7.0 was similar to the
aminated sample despite the latter having 25% less colour than mill ESJ prior to
heating. The authors further investigated this result using a synthetic ESJ consisting
of reducing sugars (equimolar quantities of glucose and fructose), four amino acids
(alanine, aspartic acid, leucine and valine), sucrose and other organic materials
(e.g., dimethyl formamide). The use of synthetic ESJ allowed better understanding on
the mechanisms of colour formation. A summary of their study is as follows:
The formation of colour in the model ESJ after 5 h was of the same order as
the mill ESJ.
The model compounds appeared to have an induction period (0–1.5 h) and a
rapid increase in colour formation was observed over time.
The contribution of caramel colourants was small with or without an amino
acid.
Consistency in the behaviour of amino acid (i.e., did not affect colour greatly)
in both synthetic and factory ESJ samples.
Lower levels of reducing sugars showed slower colour formation.
Lower pH retarded colour formation, however higher pH levels rapidly
produced more colour.
Colour formation was prominent at 100 °C and negligible at 65 °C.
Higher brix content in synthetic ESJ samples resulted in an increase of
melanoidins and a decrease in HADP.
Paton and McCowage (1987) concluded that temperature was the largest
factor that contributed to the formation of colour in ESJ and the formation of colour in
synthetic ESJ (with or without amino acids) was primarily due to HADPs. The rate of
colour formation in synthetic ESJ was slower compared to factory ESJ and this may
be due to the absence of intermediate products of HADPs, MRPs and other impurities
(e.g., phenolic compounds, iron and copper) in the factory ESJ.

36
However, the authors only investigated colour formation for temperatures of
100 ºC and below. The range of interest for temperatures during clarification and
evaporation in a typical sugar mill is considered to be between 65 ºC and 125 ºC. De
Ambrosis (1964) studied the effect of clarified juices at temperatures above 100 °C on
clarified juices. The juices were held in a closed stainless steel vessel (with a mild
steel cap) and heated to the required temperatures.
Comparing the juice colour formation data from De Ambrosis’s (1964) work
and those obtained from Paton and McCowage’s (1987), it can be seen that Paton and
McCowage’s (1987) work showed reduced colour formation rates, while the opposite
was observed in De Ambrosis’s (1964) work. The high colour formation rates in De
Ambrosis’s (1964) work may be due to the vessel’s material of construction
(e.g., iron) having a catalytic effect. Further laboratory analyses on the formation of
colour from three different sugar mills were conducted by Wright and Jegaraj (1992).
The analyses were designed to obtain additional experimental data on colour
formation in juice at higher temperatures (80–125 °C) to complement De Ambrosis’s
(1964) work. The authors examined the colouration rate as functions of temperature,
time, juice (sucrose concentration) and pH, which may impact on the colouring of raw
sugar during the clarification and evaporation stages. An Arrhenius expression for the
rate of colour formation in sugar manufacture was proposed as described in Equation
2.1.
8502
90.8930 10 Ty e
(2.1)
where y is the colour formation rate (% of the initial colour per min)
T is the absolute temperature (K).
Wright and Jegaraj (1992) concluded that the extent of colour in raw sugar can
be minimised by reducing the residence time of process streams at high temperatures
(i.e., lower residence times during clarification, evaporation and crystallisation
processes), lowering the ESJ pH and reducing the content of nitrogenous compounds
(i.e., proteins and amino acids) present in sugar cane plants.

37
2.5 Sugar Decolourisation Technologies
2.5.1 Current Technologies
Methods used to treat sugar process streams to reduce impurity and colour
loadings prior to crystallisation include modified clarification techniques (Eggleston
et al., 2003; Lindeman and O'Shea, 2004); dissolved air floatation (Smith et al., 2000;
Echeverri and Rein, 2006); membrane filtration (Hamachi et al., 2003; Farmani et al.,
2008); chemical precipitation (Moodley, 1993; Doherty et al., 2003); ion exchange
(Broadhurst and Rein, 2003; Bento, 2004); activated carbon adsorption (Mudoga et
al., 2008; Simaratanamongkol and Thiravetyan, 2010) and chemical oxidation via
ozonolysis (Moodley et al., 1999). A summary of the effectiveness of a
decolourisation technique mentioned according to the corresponding types of
colourants, adapted from Davis (2001b) is shown in Table 2.4. The tick symbols ()
represent effective removal of the colourant and cross symbols () for poor colour
removal. Some cells have been left blank due to insufficient data in the literature.
Table 2.4 Decolourisation processes on colourants types existing in juice as
adapted from Davis (2001b).
Fla
von
oid
s
Ph
enoli
cs
Am
ino a
cid
s
Mel
an
oid
ins
Cara
mel
s
HA
DP
s
Defecation
Carbonatation
Sulfitation
Phosphatation
Filtration
Precipitation
Oxidation
Activated carbon
Ion exchange

38
Conventional processes such as defecation, carbonatation, sulfitation and
phosphatation performed during clarification are colour selective and are not so
effective in removing certain types of colourants. To overcome this, combinations of
two or more processes are usually required to produce the best low coloured raw
sugar. Amongst these techniques to produce white or low coloured raw sugar,
activated carbons or ion exchange resins are used. However, there are common
problems with the use of adsorbents and resins such as fouling and exhaustion. These
adsorbents and resins can be regenerated to minimise costs, but there are also
problems associated with the management of waste produced from regeneration.
Therefore to further minimise costs, many sugar manufacturers use SO2 as a pre-
treatment step, thereby reducing the amount of adsorbent or resin used for
decolourisation (Olivério et al., 2007). In some cases, SO2 is further used in syrup
clarification to produce plantation white sugar (Kulkarni, 2010).
2.5.2 Decolourisation using Chemical Additives
Chemical additives in the form of oxidants, precipitants, coagulants and
inhibitors have been used to assist in the colour removal of sugar process streams.
Arguably, SO2 is one of the best performing decolourising agents. The use of SO2 as
a bleaching gas, during sulfitation for plantation white sugar production, is known to
produce very low coloured sugar with a lustre appearance (Saska et al., 2010). It is
widely used in less developed countries but discouraged in developed countries
because of the residual sulfur contamination that is hazardous to human health. In
addition, the low colour in these treated sugars are only temporary, with residual iron
compounds, not removed during the sulfitation process, oxidise and colourise sugar
crystals within a few months of storage (Kulkarni, 2010).
Organic polymers, such as polyacrylamides and polyamines, are commonly
used for coagulation, flocculation and sedimentation processes during the clarification
of juice (Thai et al., 2012). However, the amounts of polymeric material added are
limited due to cost and the possible presence of toxic residual monomers at higher
dosages (Bae et al., 2007); hence these are usually dosed at lower concentrations with
an additional process for optimum colour removal (Moodley, 1993).

39
There has been an increasing trend towards the evaluation of oxidative
chemical additives as an alternative to reduce or inhibit colour formation during sugar
processing. These include the use of chlorinated compounds (Riffer, 1980), ozone
(Moodley et al., 1999), H2O2 (Mane et al., 2000) and Fe(III) in conjunction with
endogenous proteins (Madsen and Day, 2010). The use of chlorinated compounds is
not recommended because of toxicological concerns surrounding the production of
unwanted by-products and residual sulfite/sulfate or chloride/chlorite present in the
final raw sugar product (Davis, 2001a). On the other hand, oxidative decolourants
such as ozone and H2O2 are non-toxic and have shown good decolourisation on sugar
factory process streams.
The reason for the difference between the action of oxidative chemicals and
other colour removal technologies lies in the decolourisation mechanism. Oxidants
destroy colourants rapidly by cleaving unsaturated bonds (i.e., conjugated species),
converting them to non-reactive intermediates which are unable to form colour (Shore
et al., 1984; Riffer, 2000). Examples of these are shown in Schemes 12 and 13 for
ozone and wet peroxide oxidation, respectively (Davis et al., 1998; Neyens and
Baeyens, 2003).
In Scheme 2.12, electrophilic ozone reacts with a nucleophilic alkene (26) to
form an unstable 5-membered ring (i.e., ozonide) (27). The unstable ozonide
decomposes to a carbonyl compound and a zwitterion. Cycloaddition of the two
decomposition products form a stable ozonoide intermediate (28). The ozonoide (28)
is then oxidised in the presence of H2O2 to yield one equivalent of a carboxylic acid
(29) and an aldehyde (30) or ketone.

40
(Alkene)
(26)
R
H R
H
OO
O
OO
O
H
R
R
HO
RH
O
RH
O O
OO
R
H
H
R
R OH
O
R H
O
+
H2O2
(Unstable Ozonide)
(27)
(Carboxylic Acid)
(29)
(Aldehyde)
(30)
(Stable Ozonide)
(28)
Scheme 2.12
Highly reactive •OH radicals produced from the decomposition of H2O2 are
mainly responsible for the oxidation of colourants. Under mild alkaline conditions,
H2O2 dissociates to give water and the perhydroxyl anion (HOO–), a strong
nucleophile (Equation 2.2). The HOO– anion can decompose H2O2 to give water,
oxygen and the •OH radical (Equation 2.3).
H2O2 + OH– H2O + HOO– (2.2)
HOO– + H2O2 H2O + O2 + •OH (2.3)
In Scheme 2.13, hydroxyl radicals generated from the decomposition of H2O2
attach to the aromatic ring of benzene (31) causing the ring to open and yield muconic
acid (32). The product (32) can possibly undergo further oxidative degradation to
produce harmless reaction products such as CO2 and water.

41
H OH H OHOH
O
OH
O
OH
Benzene Muconoic acid
OH OH OH
(31) (32)
Scheme 2.13
Studies showing the destruction of flavonoids and colour precursors in sugar
cane juice using H2O2 as the oxidant have been conducted previously (Mane et al.,
1992; Mane et al., 1998; Mane et al., 2000; Saska, 2007). Saska (2007) reported up
to 30% reduction in colour by using H2O2 on Colombian plantation white sugar at
dosages of 100–500 ppm, which is also in agreement with the findings from Mane et
al., (2000). Also, in their most recent study, Mane et al., (2000) reported more than
20% reduction in both colour precursor compounds and SO2 content in Indian
plantation white sugars. They observed a decrease in phenolic content (40–50%) in
H2O2 treated raw syrup, therefore minimising the chance for these compounds to take
part in further colour forming reactions. There were also reductions in raw sugar
colour (12–35%), amino acids (15–25%) and starch (12–13%). Furthermore, the
authors reported lower colour development upon stored raw sugars treated directly
with H2O2.
Ozone, on the other hand, is a stronger oxidant than H2O2. A decrease by
about one third of the initial syrup colour was achieved with 250 ppm ozone (Davis et
al., 1998). However, unlike H2O2, ozone is very expensive to produce and is not cost
effective for juice or syrup decolourisation (Moodley et al., 1999). Therefore, a
technology based on H2O2 has the potential to produce low coloured raw sugar at a
reasonable cost.

42
2.5.3 Novel and Potential Technologies
Advanced Oxidation Processes (AOPs)
In recent years, AOPs have become increasingly attractive to treat a wide
range of azo dyes (Joseph et al., 2000), contaminated soils (Kong et al., 1998),
polluted oceans and streams (Trovó et al., 2009) and industrial wastewaters (Lucas
and Peres, 2009). These processes involve the in situ generation of highly reactive
•OH radicals by chemical (e.g., acids, inorganic salts), photocatalytic (e.g., solar,
ultraviolet (UV) light), electrochemical (e.g., cathode electrodes), radiolytic
(γ–radiolysis) and physical (e.g., ultrasound) methods. The oxidation potential of
•OH radicals is stronger (2.80 V) than ozone (2.07 V) and H2O2 (1.80 V) and can
completely degrade and mineralise organic compounds and impurities.
Fenton Oxidation Process
An example of an established and commercialised AOP is the catalytic
activation of H2O2 using Fe(II), typically referred to as the Fenton oxidation process.
The conventional homogenous Fenton oxidation process is already in use for the
treatment of industrial wastewaters (Guedes et al., 2003; Cañizares et al., 2007; Lu et
al., 2009). It is an attractive process for its low capital costs, low toxicity of reagents
and ease of application. The Fenton process involves the production of •OH radicals
through the homogenous catalytic decomposition of H2O2 using Fe(II). The generally
accepted free radical chain mechanism for the oxidation of organic compounds (RH)
via the Fenton process is shown in Equations 2.4–2.10 (Walling, 1975; Pignatello,
1992; Kang and Hwang, 2000; Sun et al., 2007).

43
Fe2+ + H2O2 Fe3+ + OH– + •OH (2.4)
RH + •OH R• + H2O (2.5)
H2O2 + •OH H2O + •O2H (2.6)
Fe2+ + •OH Fe3+ + OH– (2.7)
•OH + •OH H2O2 (2.8)
H2O2 + Fe3+ Fe2+ + H+ + •O2H (2.9)
Fe3+ + HO2• Fe2+ + H+ O2 (2.10)
As depicted in Equation 2.5, a radical chain oxidation reaction is initiated
through the formation of organic radicals (R•) by hydrogen atom abstraction, electron
transfer or electrophilic addition (Neyens and Baeyens, 2003; Pignatello et al., 2006).
These organic radicals are highly reactive, which form peroxyl radicals (Equation
2.11) (Lipczynska-Kochany et al., 1995), and further oxidation through the addition
of •OH or molecular oxygen, in turn would oxidise and mineralise to harmless
products such as CO2 and H2O (Equation 2.12) (Sun et al., 2009; Oturan et al., 2011).
R• + O2 ROO• (2.11)
ROO• + •OH/O2 CO2 + H2O (2.12)
The two important factors to consider in the Fenton process are the dosage
levels of H2O2 and Fe(II) (Chamarro et al., 2001). The H2O2 dose improves the
decolourisation whilst the reaction kinetics is dependent on the amount of Fe(II)
added.
In the last few years, much attention has been paid to the variations and
development of advanced Fenton processes to improve the oxidation performance and
alleviate one of the major drawbacks of the Fenton process, which is the production of
iron sludge. These include photo-Fenton (e.g., solar and UV light) (Kuo et al., 2012;
Lucas et al., 2012), electro-Fenton (Wang et al., 2012), sono-Fenton (Babuponnusami
and Muthukumar, 2011), Fenton-like (e.g., Fe(III), chelated iron) (Li et al., 2007;
Nichela et al., 2010) and heterogeneous Fenton (e.g., Fe-pillared clays, zero valent
iron) (Catrinescu et al., 2012; Segura et al., 2012). However, most of these
technologies have not yet been commercialised. Therefore, the conventional Fenton
process, which is simple and requires no specialised equipment, is still the only cost
effective process to treat a wide range of compounds and convert them into less

44
harmful compounds that are easier to be removed through other purification
techniques (i.e., filtration, coagulation, ion exchange) (Üstün et al., 2007; Arsene et
al., 2011; Elías-Maxil et al., 2011).
In previous studies, Fenton oxidation has been employed to target individual
model phenolic acids in synthetic industrial process streams. Rivas et al. (2001)
evaluated the degradation of p–hydroxybenzoic acid (10 mM) and found under
optimum conditions of 5.0 mM Fe(II), 2.7 M H2O2 and pH 3.2; 95% of the phenolic
acid was degraded after 30 min at 20 °C. In a later study, Rivas et al. (2005) reported
98% removal of protocatechuic acid (0.65 mM), under similar operating conditions to
those of p–hydroxybenzoic acid. Benitez et al. (2005) reported 79% degradation of
gallic acid (0.59 mM) after 40 min at 25 °C using 2.5 × 10⁻² mM Fe(II), 2.5 mM H2O2
and at pH 3.0.
Even though, the Fenton process or AOPs in general are non-selective
processes, the degradation efficiency of phenolic compounds via •OH radical attack
differs from one type to another, as it depends on many factors including number of
substituents (e.g., hydroxyl and methoxyl groups) attached on the aromatic ring; •OH
radical positioning and bonding sites on the aromatic ring; and preference for •OH
radical attack on additional functional groups (e.g., vinyl groups) than the aromatic
ring (Rice-Evans et al., 1996; Sroka and Cisowski, 2003). Also, the degradation of
phenolic compounds in mixtures is expected to be different due to competing
reactions between the phenolics, the •OH radicals and the intermediates formed
during the course of the oxidation reaction.
The degradation of mixtures of phenolic compounds has been studied using
Fenton oxidation (Heredia et al., 2001), Fenton-like oxidation (Du et al., 2006), ozone
(Amat et al., 2003) and other AOPs, mainly photocatalysis processes (Gernjak et al.,
2003; Kusvuran et al., 2005; Azabou et al., 2007; Monteagudo et al., 2011). Heredia
et al. (2001) developed a kinetic model for the oxidation of phenolic compounds
(viz., caffeic, p–coumaric and ferulic acids) by the Fenton process. These compounds
are the main colour precursors present in sugar cane juice and are known to
participate in reactions producing colour that results in the final raw sugar product.
The rate constants for the degradation of the individual phenolic acids in a mixture of
acids, were deduced from the developed model and it was found that the degradation

45
process at a constant Fe(II) concentration at 30 °C proceeded in the following order;
ferulic acid > p–coumaric acid > caffeic acid. No reason was given for the
differences in the rate of degradation among these phenolic acid mixtures. The
ozonisation of solutions containing a mixture of cinnamic, caffeic, p–coumaric and
ferulic acids was studied by Amat et al. (2003). These workers found that the
behaviour of caffeic acid though followed a similar mechanism as that of cinnamic
acid had a different reaction rate due to a greater number of intermediates. None of
these studies optimised the degradation process of the individual acids within a
mixture of phenolic acids by the Fenton process, nor examined the interactive effects
of various operating parameters on the degradation of each acid. Also, none of the
aforementioned studies were conducted in sucrose solutions, and the reaction times
were generally an order of magnitude higher than that required in the various stages of
the sugar manufacturing process. The role of sucrose (apart from its free radical
scavenging ability) in the degradation process of these acids in a mixture has not been
reported (Morelli et al., 2003). As such, the focus in this present study was to provide
further insight into the degradation of these phenolic acids by the Fenton process.
The decolourisation of a baker’s yeast waste product, which primarily consists
of cane molasses, using Fenton oxidation was investigated by Pala and Erden (2005).
The colourants present in molasses include caramels, melanoidins, colour precursors,
iron-phenol complexes and some cane pigments. Neyens and Baeyens (2003) stated
that acidic pH levels (about pH 3.0) are usually optimum for Fenton oxidation.
However, Pala and Erden (2005) established the optimum pH for colour removal via
the Fenton process was at pH 4.0. The best colour removal efficiency of 99% at
25 °C and pH 4.0 was achieved with dosages of 22 mM Fe(II) and 24 mM H2O2 for
20 min. Under the optimum pH and treatment times, dosages of 11 mM Fe(II) and
18 mM H2O2 were enough to remove colour with an efficiency of 97%.
Madsen and Day (2010), though not using the Fenton oxidation process,
demonstrated the removal of phenolic and other colourants from raw juice using
endogenous proteins as well as Fe(III) as an oxidative catalyst. The treatment
produced clarified juice with up to 70% lower colour in cold liming clarification
(i.e., addition of lime before juice incubation) than juice produced by hot liming
clarification. However, clarification via cold liming results in less precipitation of
calcium phosphate precipitates and impurities due to the higher solubility of calcium

46
ions at lower temperatures (35–40 °C) (Doherty et al., 2002). This would result in
more turbid clarified juices and higher sucrose losses. Hence, the presence of high
calcium levels in clarified juice will heavily impact on the downstream processes,
particularly during evaporation where the formation of scale takes place in the
evaporators.
On the basis of the information obtained from the literature, the aim of this
present project was to develop, optimise and evaluate the Fenton oxidation process for
the degradation and decolourisation of selected colour precursors and colourants
present in sugar process streams.
47
References
Alves, E. F., Bose, S. K., Francis, R. C., & El Moussaouiti, M. (2012). Trapping of p-
coumaryl and coniferyl alcohol during soda–anthraquinone treatment: A
means of estimating uncondensed β-O-4 structures in native lignin. Journal of
Agricultural and Food Chemistry, 60(36), 9202-9210.
Amat, A. M., Arques, A., Beneyto, H., García, A., Miranda, M. A., & Seguí, S.
(2003). Ozonisation coupled with biological degradation for treatment of
phenolic pollutants: A mechanistically based study. Chemosphere, 53, 79-86.
Arsene, D., Musteret, C. P., Catrinescu, C., Apopei, P., Barjoveanu, G., & Teodosiu,
C. (2011). Combined oxidation and ultrafiltration processes for the removal of
priority organic pollutants from wastewaters. Environmental Engineering and
Management Journal, 10(12), 1967-1976.
Azabou, S., Najjar, W., Gargoubi, A., Ghorbel, A., & Sayadi, S. (2007). Catalytic wet
peroxide photo-oxidation of phenolic olive oil mill wastewater contaminants
Part II. Degradation and detoxification of low-molecular mass phenolic
compounds in model and real effluent. Applied Catalysis, B: Environmental,
77, 166-174.
Babuponnusami, A., & Muthukumar, K. (2011). Degradation of phenol in aqueous
solution by Fenton, sono-Fenton and sono-photo-Fenton methods. Clean: Soil,
Air, Water, 39(2), 142-147.
Bae, Y.-H., Kim, H.-J., Lee, E.-J., Sung, N.-C., Lee, S.-S., & Kim, Y.-H. (2007).
Potable water treatment by polyacrylamide base flocculants, coupled with an
inorganic coagulant. Environmental Engineering Research, 12(1), 21-29.
Baunsgaard, D., Nørgaard, L., & Godshall, M. A. (2001). Specific screening for color
precursors and colorants in beet and cane sugar liquors in relation to model
colorants using spectrofluorometry evaluated by HPLC and multiway data
analysis. Journal of Agricultural and Food Chemistry, 49, 1687-1694.
Belitz, H. D., Grosch, W., & Schieberle, P. (2009). Food Chemistry. Berlin: Springer-
Verlag.
Benitez, F. J., Real, F. J., Acero, J. L., Leal, A. I., & Garcia, C. (2005). Gallic acid
degradation in aqueous solutions by UV/H2O2 treatment, Fenton’s reagent and
the photo-Fenton system. Journal of Hazardous Materials, B126, 31-39.
Bento, L. S. M. (2004). Decolorization of sugar solutions with oxidants and ion
exchange resins. Proceedings of the Sugar Industry Technologists, 63, 265-
269.
Broadhurst, H. A., & Rein, P. W. (2003). Modeling adsorption of cane-sugar solution
colorant in packed-bed ion exchangers. AIChE Journal, 49(10), 2519-2532.

48
Bucheli, C. S., & Robinson, S. P. (1994). Contribution of enzymic browning to color
in sugarcane juice. Journal of Agricultural and Food Chemistry, 42(2), 257-
261.
Cämmerer, B., Jalyschkov, V., & Kroh, L. W. (2002). Carbohydrate structures as part
of the melanoidin skeleton. International Congress Series, 1245, 269-273.
Cämmerer, B., & Kroh, L. W. (1995). Investigation of the influence of reaction
conditions on the elementary composition of melanoidins. Food Chemistry,
53, 55-59.
Cañizares, P., Lobato, J., Paz, R., Rodrigo, M. A., & Sáez, C. (2007). Advanced
oxidation processes for the treatment of olive-oil mills wastewater.
Chemosphere, 67(4), 832-838.
Carey, F. A., & Sundberg, R. J. (2007). Advanced Organic Chemistry - Part A:
Structure and Mechanisms (5th ed.). New York: Springer.
Catrinescu, C., Arsene, D., Apopei, P., & Teodosiu, C. (2012). Degradation of 4-
chlorophenol from wastewater through heterogeneous Fenton and photo-
Fenton process, catalyzed by Al–Fe PILC. Applied Clay Science, 58(0), 96-
101.
Chamarro, E., Marco, A., & Esplugas, S. (2001). Use of Fenton reagent to improve
organic chemical biodegradability. Water Research, 35(4), 1047-1051.
Chheda, J. N., & Dumesic, J. A. (2007). An overview of dehydration, aldol-
condensation and hydrogenation processes for production of liquid alkanes
from biomass-derived carbohydrates. Catalysis Today, 123, 59-70.
Cleary, M. (1988). Carbonatation Process in Beet Sugar Manufacture. In M. A. Clarke
& M. A. Godshall (Eds.), Chemistry and Processing of Sugarbeet and
Sugarcane (pp. 20-34). Amsterdam: Elsevier.
Coca, M., Teresa García, M., González, G., Peña, M., & García, J. A. (2004). Study
of coloured components formed in sugar beet processing. Food Chemistry, 86,
421-433.
Curtin, J. H., & Paton, N. H. (1980). The quantitative analysis of phenolic acids from
sugar liquors by high performance liquid chromatography. Proceedings of the
International Society of Sugar Cane Technologists, 17, 2361-2371.
Daniels, V., & Lohneis, G. (1997). Deterioration of sugar artifacts. Studies in
Conservation, 42(1), 17-26.
Danilewicz, J. C., Seccombe, J. T., & Whelan, J. (2008). Mechanism of interaction of
polyphenols, oxygen, and sulfur dioxide in model wine and wine. American
Journal of Enology and Viticulture, 59(2), 128-136.
Davis, S. B. (2001a). The chemistry of colour removal: a processing perspective.
Proceedings of the South African Sugar Technologists' Association, 75, 328-
336.

49
Davis, S. B. (2001b). A review of colour removal mechanisms in sugar refining
processes. Communications from the Sugar Millling Research Institute, 169,
1-25.
Davis, S. B., Moodley, M., Singh, I., & Adendorff, M. W. (1998). The use of ozone
for colour removal at the Malelane refinery. Proceedings of the South African
Sugar Technologists' Association, 72, 255-260.
De Ambrosis, J. L. (1964). The effect of temperature and time on colour formation in
clarified juice, Unpublished Sugar Research Institute Internal Report.
Doherty, W. O. S., Fellows, C. M., Gorijan, S., Senogles, E., & Cheung, W. H.
(2003). Flocculation and sedimentation of cane sugar juice particles with
cationic homo- and copolymers. Journal of Applied Polymer Science, 90(1),
316-325.
Doherty, W. O. S., Greenwood, J., Pilaski, D., & Wright, P. G. (2002). The effect of
liming conditions in juice clarification. Proceedings of the Australian Society
of Sugar Cane Technologists, 24, 443-451.
Du, Y., Zhou, M., & Lei, L. (2006). Role of the intermediates in the degradation of
phenolic compounds by Fenton-like process. Journal of Hazardous Materials,
136(3), 859-865.
Echeverri, L. F., & Rein, P. W. (2006). Numerical study of the flow in air flotation
syrup clarifiers. Proceedings of the South African Sugar Technologists'
Association, 80, 378-390.
Eggleston, G. (1998). Changes in chemistry across evaporators. International Sugar
Journal, 100, 49-95.
Eggleston, G., Monge, A., & Ogier, B. E. (2003). Sugarcane factory performance of
cold, intermediate, and hot lime clarification processes. Journal of Food
Processing and Preservation, 26, 433-454.
Elías-Maxil, J. A., Rigas, F., Orta de Velásquez, M. T., & Ramírez-Zamora, R.-M.
(2011). Optimization of Fenton's reagent coupled to Dissolved Air Flotation to
remove cyanobacterial odorous metabolites and suspended solids from raw
surface water. Water Science and Technology, 64(8), 1668-1674.
Farmani, B., Haddadekhodaparast, M. H., Hesari, J., & Aharizad, S. (2008).
Determining optimum conditions for sugarcane juice refinement by pilot plant
dead-end ceramic micro-filtration. Journal of Agriculture, Science and
Technology, 10, 351-357.
Fernández-Zurbano, P., Ferreira, V., Escudero, A., & Cacho, J. (1998). Role of
hydroxycinnamic acids and flavanols in the oxidation and browning of white
wines. Journal of Agricultural and Food Chemistry, 46(12), 4937-4944.
Fernandez-Zurbano, P., Ferreira, V., Pena, C., Escudero, A., Serrano, F., & Cacho, J.
(1995). Prediction of oxidative browning in white wines as a function of their

50
chemical composition. Journal of Agricultural and Food Chemistry, 43(11),
2813-2817.
Ferreira, V., Escudero, A., Fernández, P., & Cacho, J. F. (1997). Changes in the
profile of volatile compounds in wines stored under oxygen and their
relationship with the browning process. Zeitschrift für
Lebensmitteluntersuchung und -Forschung A, 205(5), 392-396.
Fulcrand, H., Dueñas, M., Salas, E., & Cheynier, V. (2006). Phenolic reactions during
winemaking and aging. American Journal of Enology and Viticulture, 57(3),
289-297.
Gernjak, W., Krutzler, T., Glaser, A., Malato, S., Caceres, J., Bauer, R., & Fernández-
Alba, A. R. (2003). Photo-Fenton treatment of water containing natural
phenolic pollutants. Chemosphere, 50, 71-78.
Godhsall, M. A., Clarke, M. A., Dooley, C. D., & Blanco, R. S. (1991). Progress in
Beet Sugar Colorant Research. Journal of Sugar Beet Research, 28(3/4), 155-
165.
Guedes, A. M. F. M., Madeira, L. M., Boaventura, R. A. R., & Costa, C. A. V.
(2003). Fenton oxidation of cork cooking wastewater—overall kinetic
analysis. Water Research, 37, 3061-3069.
Hajek, J., Murzin, D. Y., Salmi, T., & Mikkola, J.-P. (2013). Interconversion of
lactose to lactulose in alkaline environment: Comparison of different catalysis
concepts. Topics in Catalysis, 56(9-10), 839-845.
Hamachi, M., Gupta, B. B., & Ben Aim, R. (2003). Ultrafiltration: a means for
decolorization of cane sugar solution. Separation and Purification
Technology, 30, 229-239.
Harborne, J. B. (1989). Methods in Plant Biochemistry, 1: Plant Phenolics. London:
Academic Press.
Heredia, J. B. D., Torregrosa, J., Dominguez, J. R., & Peres, J. A. (2001). Kinetic
model for phenolic compound oxidation by Fenton's reagent. Chemosphere,
45, 85-90.
Joseph, J. M., Destaillats, H., Hung, H.-M., & Hoffman, M. R. (2000). The
sonochemical degradation of azobenzene and related azo dyes: rate
enhancements via Fenton's reactions. Journal of Physical Chemistry A, 104(2),
301-307.
Kang, Y. W., & Hwang, K.-Y. (2000). Effects of reaction conditions on the oxidation
efficiency in the Fenton process. Water Research, 34(10), 2786-2790.
Kilmartin, P. A., Zou, H., & Waterhouse, A. L. (2001). A cyclic voltammetry method
suitable for characterizing antioxidant properties of wine and wine phenolics.
Journal of Agricultural and Food Chemistry, 49(4), 1957-1965.

51
Knill, C. J., & Kennedy, J. F. (2003). Degradation of cellulose under alkaline
conditions. Carbohydrate Polymers, 51, 281-300.
Kong, S.-H., Watts, R. J., & Choi, J.-H. (1998). Treatment of petroleum-contaminated
soils using iron mineral catalyzed hydrogen peroxide. Chemosphere, 37(8),
1473-1482.
Kort, M. J. (1979). Colour in the Sugar Industry. In G. G. Birch & K. J. Parker (Eds.),
Sugar: Science and Technology (pp. 97-130). London: Applied Science
Publishers Ltd.
Kulkarni, V. M. (2010). Modified single sulfitation process for producing better
quality plantation white sugar. Proceedings of the International Society of
Sugar Cane Technologists, 27, 1-8.
Kuo, C. Y., Pai, C. Y., Wu, C. H., & Jian, M. Y. (2012). Effects of oxidant
concentration and temperature on decolorization of azo dye: comparisons of
UV/Fenton and UV/Fenton-like systems. Water Science and Technology,
65(11), 1970-1974.
Kusvuran, E., Samil, A., Atanur, O. M., & Erbatur, O. (2005). Photocatalytic
degradation kinetics of di- and tri-substituted phenolic compounds in aqueous
solution by TiO₂/UV. Applied Catalysis, B: Environmental, 58, 211-216.
Li, H., Guo, A., & Wang, H. (2008). Mechanisms of oxidative browning of wine.
Food Chemistry, 108(1), 1-13.
Li, Y., Bachas, L. G., & Bhattacharyya, D. (2007). Selected chloro-organic
detoxifications by polychelate (poly(acrylic acid)) and citrate-based Fenton
reaction at neutral pH environment. Industrial & Engineering Chemistry
Research, 46(24), 7984-7992.
Lindeman, P. F., & O'Shea, M. G. (2001). High molecualr weight (HMW) colorants
and their impact on the refinability of raw sugar. A study of Australian and
overseas raw sugars. Proceedings of the Australian Society of Sugar Cane
Technologists, 23, 322-329.
Lindeman, P. F., & O'Shea, M. G. (2004). Colorant removal during clarification and
decolourisation processes. Proceedings of the Australian Society of Sugar
Cane Technologists, 26, 51-64.
Lipczynska-Kochany, E., Sprah, G., & Harms, S. (1995). Influence of some
groundwater and surface waters constituents on the degradation of 4-
chlorophenol by the Fenton reaction. Chemosphere, 30(1), 9-20.
Lu, L.-l., Li, Y.-h., & Lu, X.-y. (2009). Kinetic study of the complexation of gallic
acid with Fe(II). Spectrochimica Acta, Part A: Molecular and Biomolecular
Spectroscopy, 74, 829-834.
Lucas, M. S., & Peres, J. A. (2009). Treatment of olive mill wastewater by a
combined process: Fenton’s reagent and chemical coagulation. Journal of
Environmental Science and Health Part A, 44, 198-205.
52
Lucas, M. S., Peres, J. A., Amor, C., Prieto-Rodríguez, L., Maldonado, M. I., &
Malato, S. (2012). Tertiary treatment of pulp mill wastewater by solar photo-
Fenton. Journal of Hazardous Materials, 225–226(0), 173-181.
Madsen, L. R., II (2006). Simulated Multiple Effect Evaporation of Clarified and
Decolorized Sugarcane Juices and Accelerated Storage Tests of the Syrups:
Evolution of Color and the Behavior of Carbohydrates and Related
Compounds. Paper presented at the SPRI Conference on Sugar Processing:
Sugar Processing Research Institute.
Madsen, L. R., II, & Day, D. F. (2010). Iron mediated clarification and
decolourisation of sugarcane juice. Proceedings of the International Society of
Sugar Cane Technologists, 27, 1-13.
Mane, J. D., Pachpute, S. P., & Phadnis, S. P. (1998). Effects of hydrogen peroxide
treatment on cane syrup. International Sugar Journal, 100(1193), 210-212.
Mane, J. D., Phadnis, S. P., & Jadhav, S. J. (1992). Effects of hydrogen peroxide on
cane juice constituents. International Sugar Journal, 94(1128), 322-324.
Mane, J. D., Phadnis, S. P., Jambhale, D. B., & Yewale, A. V. (2000). Mill scale
evaluation of hydrogen peroxide as a processing aid: quality improvement in
plantation white sugar. International Sugar Journal, 102(1222), 530-533.
Mersad, A., Lewandowski, R., Heyd, B., & Decloux, M. (2003). Colorants in the
sugar industry: laboratory preparation and spectrometric analysis.
International Sugar Journal, 105(1254), 269-281.
Monteagudo, J. M., Durán, A., Aguirre, M., & San Martín, I. (2011). Optimization of
the mineralization of a mixture of phenolic pollutants under a ferrioxalate-
induced solar photo-Fenton process. Journal of Hazardous Materials, 185,
131-139.
Moodley, M. (1993). The application of cationic flocculants as decolourising agents
in the sugar industry. Proceedings of the South African Sugar Technologists'
Association, 67, 155-159.
Moodley, M., Davis, S. B., & Adendorff, M. W. (1999). Full scale decolourisation
trials with ozone. International Sugar Journal, 101, 165-171.
Morelli, R., Russo-Volpe, S., Bruno, N., & Lo Scalzo, R. (2003). Fenton-dependent
damage to carbohydrates: free radical scavenging activity of some simple
sugars. Journal of Agricultural and Food Chemistry, 51(25), 7418-7425.
Mudoga, H. L., Yucel, H., & Kincal, N. S. (2008). Decolorization of sugar syrups
using commercial and sugar beet pulp based activated carbons. Bioresource
Technology, 99, 3528-3533.
Neyens, E., & Baeyens, J. (2003). A review of classic Fenton’s peroxidation as an
advanced oxidation technique. Journal of Hazardous Materials, B98, 33-50.

53
Nichela, D., Haddou, M., Benoit-Marquié, F., Maurette, M.-T., Oliveros, E., & García
Einschlag, F. S. (2010). Degradation kinetics of hydroxy and hydroxynitro
derivatives of benzoic acid by fenton-like and photo-fenton techniques: A
comparative study. Applied Catalysis, B: Environmental, 98, 171-179.
Oliveira, C. M., Ferreira, A. C. S., De Freitas, V., & Silva, A. M. S. (2011). Oxidation
mechanisms occurring in wines. Food Research International, 44, 1115-1126.
Olivério, J. L., Boscariol, F. C., & Gabardo Filho, H. (2007). DRD – Dedini Refinado
Direto (Dedini Direct Refined): Refined sugar without refinery. Proceedings
of the International Society of Sugar Cane Technologists, 26, 1612-1621.
Oturan, M. A., Oturan, N., Edelahi, M. C., Podvorica, F. I., & El Kacemi, K. (2011).
Oxidative degradation of herbicide diuron in aqueous medium by Fenton’s
reaction based advanced oxidation processes. Chemical Engineering Journal,
171, 127-135.
Pala, A., & Erden, G. (2005). Decolorization of a baker's yeast industry effluent by
Fenton oxidation. Journal of Hazardous Materials, B127, 141-148.
Paton, N. H. (1992). The origin of colour in raw sugar. Proceedings of the Australian
Society of Sugar Cane Technologists, 14, 8-17.
Paton, N. H., & McCowage, R. J. (1987). Colour forming mechanisms during mill
processing. Proceedings of the Australian Society of Sugar Cane
Technologists, 11-20.
Pignatello, J. J. (1992). Dark and photoassisted Fe3+-catalyzed degradation of
chlorophenoxy herbicides by hydrogen peroxide. Environmental Science and
Technology, 26(5), 944-951.
Pignatello, J. J., Oliveros, E., & MacKay, A. (2006). Advanced oxidation processes
for organic contaminant destruction based on the Fenton reaction and related
chemistry. Critical Reviews in Environmental Science and Technology, 36, 1-
84.
Rice-Evans, C. A., Miller, N. J., & Paganga, G. (1996). Structure-antioxidant activity
relationships of flavonoids and phenolic acids. Free Radical Biology and
Medicine, 20(7), 933-956.
Riffer, R. (1980). A study of chemical additives for use in sugar refining. Proceedings
of the Technical Session on Cane Sugar Refining Research, 84-102.
Riffer, R. (2000). Nonsugars and Sugar Refining. In C. C. Chou (Ed.), Handbook of
Sugar Refining: A Manual for the Design and Operation of Sugar Refining
Facilities (pp. 627-660). New York: John Wiley & Sons.
Riffer, R. (Ed.). (1988). The Nature of Colorants in Sugarcane and Cane Sugar
Manufacture. Amsterdam: Elsevier.
Rivas, F. J., Beltrán, F. J., Frades, J., & Buxeda, P. (2001). Oxidation of p-
hydroxybenzoic acid by Fenton's reagent. Water Research, 35(2), 387-396.

54
Rivas, F. J., Frades, J., Alonso, M. A., Montoya, C., & Monteagudo, J. M. (2005).
Fenton's oxidation of food processing wastewater components. Kinetic
modeling of protocatechuic acid degradation. Journal of Agricultural and
Food Chemistry, 53, 10097-10104.
Rizzi, G. P. (1997). Chemical structure of colored Maillard reaction products. Food
Reviews International, 13(1), 1-28.
Ross, H. A., McDougall, G. J., & Stewart, D. (2007). Antiproliferative activity is
predominantly associated with ellagitannins in raspberry extracts.
Phytochemistry, 68, 218-228.
Saska, M. (2007). Reducing sugar color by washing and bleaching with dilute
hydrogen peroxide. International Sugar Journal, 109(1306), 616-622.
Saska, M., Zossi, S., & Liu, H. (2010). Colour behaviour in cane juice clarification by
defecation, sulfitation and carbonation. Proceedings of the International
Society of Sugar Cane Technologists, 27, 1-14.
Segura, Y., Martínez, F., Melero, J. A., Molina, R., Chand, R., & Bremner, D. H.
(2012). Enhancement of the advanced Fenton process (Fe0/H2O2) by
ultrasound for the mineralization of phenol. Applied Catalysis, B:
Environmental, 113–114(0), 100-106.
Shore, M., Broughton, N. W., Dutton, J. V., & Sissons, A. (1984). Factors affecting
white sugar colour. Sugar Technology Reviews, 12, 1-99.
Silva Ferreira, A. C., Oliveira, C., Hogg, T., & Guedes de Pinho, P. (2003).
Relationship between potentiometric measurements, sensorial analysis, and
some substances responsible for aroma degradation of white wines. Journal of
Agricultural and Food Chemistry, 51(16), 4668-4672.
Simaratanamongkol, A., & Thiravetyan, P. (2010). Decolorization of melanoidin by
activated carbon obtained from bagasse bottom ash. Journal of Food
Engineering, 96, 14-17.
Singleton, V. L. (1987). Oxygen with phenols and related reactions in musts, wines,
and model systems: Observations and practical implications. American
Journal of Enology and Viticulture, 38(1), 69-77.
Sinnott, M. L. (2007). Carbohydrate Chemistry and Biochemistry. Cambridge: RSC
Publishing.
Smith, I. A., Schumann, G. T., & Walthew, D. C. (2000). Some developments in
flotation clarification. Proceedings of the South African Sugar Technologists'
Association, 74, 263-266.
Smith, P., & Paton, N. H. (1985). Sugarcane Flavonoids. In R. A. McGinnis & E. G.
Muller (Eds.), Sugar Technology Reviews (Vol. 12, pp. 117-141). Amsterdam:
Elsevier.

55
Smith, P., Paton, N. H., Delaney, H. R., & Ames, R. (1981). Colour studies in milling.
Proceedings of the Australian Society of Sugar Cane Technologists, 4, 71-80.
Sroka, Z., & Cisowski, W. (2003). Hydrogen peroxide scavenging, antioxidant and
anti-radical activity of some phenolic acids. Food and Chemical Toxicology,
41, 753-758.
Suárez-Pereira, E., Rubio, E. M., Pilard, S., Mellet, C. O., & García Fernández, J. M.
(2010). Di-D-fructose dianhydride-enriched products by acid ion-exchange
resin-promoted caramelization of D-fructose: chemical analyses. Journal of
Agricultural and Food Chemistry, 58(3), 1777-1787.
Sun, J.-H., Shi, S.-H., Lee, Y.-F., & Sun, S.-P. (2009). Fenton oxidative
decolorization of the azo dye Direct Blue 15 in aqueous solution. Chemical
Engineering Journal, 155, 680-683.
Sun, J.-H., Sun, S.-P., Fan, M.-H., Guo, H.-Q., Qiao, L.-P., & Sun, R.-X. (2007). A
kinetic study on the degradation of p-nitroaniline by Fenton oxidation process.
Journal of Hazardous Materials, 148, 172-177.
Thai, C. C. D., Bakir, H., & Doherty, W. O. S. (2012). Insights to the clarification of
sugar cane juice expressed from sugar cane stalk and trash. Journal of
Agricultural and Food Chemistry, 60, 2916-2923.
Trovó, A. G., Nogueira, R. F. P., Agüera, A., Fernandez-Alba, A. R., Sirtori, C., &
Malato, S. (2009). Degradation of sulfamethoxazole in water by solar photo-
Fenton. Chemical and toxicological evaluation. Water Research, 43, 3922-
3931.
Üstün, G. E., Solmaz, S. K. A., & Birgül, A. (2007). Regeneration of industrial
district wastewater using a combination of Fenton process and ion exchange—
A case study. Resources, Conservation and Recycling, 52(2), 425-440.
Vermerris, W., & Nicholson, R. (2006). Phenolic Compound Biochemistry.
Doetinchem, Netherlands: Springer.
Ververidis, F., Trantas, E., Douglas, C., Vollmer, G., Kretzschmar, G., & Panopoulos,
N. (2007). Biotechnology of flavonoids and other phenylpropanoid-derived
natural products. Part I: Chemical diversity, impacts on plant biology and
human health. Biotechnology Journal, 2(10), 1214-1234.
Walling, C. (1975). Fenton's reagent revisited. Accounts of Chemical Research, 8,
125-131.
Wang, Y., Li, X., Zhen, L., Zhang, H., Zhang, Y., & Wang, C. (2012). Electro-Fenton
treatment of concentrates generated in nanofiltration of biologically pretreated
landfill leachate. Journal of Hazardous Materials, 229–230, 115-121.
Wiggins, L. F. (1953). The Nitrogen-Containing Nonsugars (The Amino Acids and
Proteins). In P. Honig (Ed.), Principles of Sugar Technology. Amsterdam:
Elsevier.

56
Wright, P. G., & Jegaraj, T. J. (1992). A study of colour formation in the processing
of cane juice, Sugar Research and Development Corporation.
Yang, B. Y., & Montgomery, R. (1996). Alkaline degradation of fructofuranosides.
Carbohydrate Research, 280, 47-57.

57
CHAPTER 3
Determination of Phenolic Compounds
in Factory Sugar Cane Juices
3.1 Introduction..................................................................................... 58
3.2 Materials and Methods................................................................... 58
3.2.1 Reagents and Solvents......................................................... 58
3.2.2 Specification of Samples...................................................... 59
3.2.3 Sample Preparation............................................................. 60
3.2.4 Instrumental Procedures and Analysis................................ 60
3.2.5 Colour, Refractive Index and Total Soluble Solids
Measurements......................................................................
62
3.3 Results and Discussion.................................................................... 62
3.3.1 Colour Analyses of Juices................................................... 62
3.3.2 Phenolic Content in Juices.................................................. 63
3.4 Summary.......................................................................................... 70

58
3.1 Introduction
A new approach that has the potential for efficient and cost-effective
decolourisation of sugar process streams during the manufacture of raw sugar is
through the use of the Fenton oxidation process. As a first step towards developing
this technology, the colour and composition of phenolic acids (i.e., colour precursors)
present in sugar cane juices obtained from three different harvesting methods were
determined. These methods include burnt cane harvesting with all trash (i.e., tops and
leaves) extracted; green cane harvesting with a proportion of the trash extracted and
whole crop cane harvesting with no trash extracted.
The colour content of each juice sample at pH 7.0 was measured
spectrophotometrically at a wavelength of 420 nm according to the international
(ICUMSA) method. The phenolic content in the juices was determined using
reversed-phase high-performance liquid chromatography (HPLC). Juice samples
were hydrolysed based in the standard method and extracted based on the procedures
reported by Paton (1978) and Schieber et al. (2001) respectively, prior to HPLC
analysis. This procedure was modified by changing the sample preparation method
and HPLC operating conditions in order to improve the response of the phenolic
compounds for accurate quantification. The most concentrated phenolic compounds
were selected for oxidative degradation by the Fenton process in subsequent chapters.
3.2 Materials and Methods
3.2.1 Reagents and Solvents
All chemicals purchased were of analytical reagent (AR) grade and used as
supplied without further purification. Solvents for chromatographic analyses were of
super gradient HPLC grade from Scharlau (Sentmenat, Spain). Solutions were
prepared using ultrapure (Milli-Q) water from a Millipore system (Bedford, MA,
USA) with a resistivity of 18.2 MΩ.cm.
Caffeic acid, (±)–catechin, chlorogenic acid, chrysin, m–coumaric acid,
o–coumaric acid, p–coumaric acid, coumarin, 2,3–dihydroxybenzoic acid,
5,7–dihydroxy–4–methoxyisoflavone, diosmin, ferulic acid, gallic acid, hesperidin,

59
hesperetin, HMF, homogentisic acid, 4–hydroxybenzoic acid, kojic acid, morin,
quercetin, α–resorcylic acid, β–resorcylic acid, rutin, syringaldehyde,
3,4,5–trimethoxybenzoic acid and vanillic acid were purchased from Sigma-Aldrich
(St. Louis, MO, USA). Ammonium chloride, ammonium hydroxide, glacial acetic
acid, lead acetate and sodium hydroxide were obtained from Ajax Finechem (Seven
Hills, NSW, Australia). Methyl orange indicator and vanillin were supplied from
Merck (Darmstadt, Germany) and furfural was from Fluka (Buchs, Switzerland).
Protocatechuic acid and sinapinic acid were purchased from Acros Organics (Geel,
Belgium). Celite 577 (diatomaceous earth) was obtained from World Minerals (Santa
Barbara, CA, USA).
3.2.2 Specification of Samples
First expressed juice from burnt harvested sugar cane was obtained from the
processing lines at Condong Sugar Mill (Condong, NSW, Australia). Whole crop
harvested cane FEJ was obtained by harvesting sugar cane located around Condong
Sugar Mill in the field and expressing the juice with a laboratory hammer mill
designed by the Sugar Research Institute (SRI) (Brisbane, QLD, Australia). The
specification of the mill was as follows: 430 × 220 mm roll; 12.8 mm groove pitch;
12.0 mm groove depth; 4 rpm operating speed; and a 10 hp powered motor running at
7.5 kW. The juice was collected by pressing through a 1 mm mesh sieve.
Both FEJs were obtained during the crushing season in 2009. Samples of
primary juice (PJ) (i.e., incubated MJ prior to lime addition) from burnt cane and
green cane were obtained at ca. 76 °C and pH 5.15 from Condong Sugar Mill during
the crushing season in 2010. All juices were stored at –22 °C. In total, four juices (2
× FEJs and 2 × PJs) were analysed. The following analyses of the four juice samples
are unrelated and not comparable. The results obtained provide an insight on the
levels of colour and phenolic content present in each juice type.

60
3.2.3 Sample Preparation
The mill juices were analysed as phenolic extracts after alkaline hydrolysis.
Hydrolysis was carried out under ambient temperature using 2.0 M NaOH on
centrifuged juice (50% (v/v)) for 30 min at ambient temperature with magnetic
stirring (280 rpm).
Two different liquid-liquid extraction procedures were carried out for the
determination of phenolic acid content in the juices collected as follows:
Method A. The hydrolysed juice was neutralised by adjusting the pH to 3.0
with 6.0 M HCl and extracted three times with diethyl ether (20 mL). The combined
extracts were dried over anhydrous sodium sulfate followed by evaporation to dryness
in vacuo to constant weight. The individual residues were weighed, dissolved in
water (10 mL) and membrane filtered (0.45 µm) prior to analysis by HPLC. The
procedure is that developed by Paton (1978).
Method B. Hydrolysed juices were treated in the same manner as described in
Method A but instead were extracted three times with ethyl acetate (50 mL). The
dried individual residues were dissolved in HPLC grade methanol (10 mL) prior to
membrane filtration followed by HPLC analysis.
3.2.4 Instrumental Procedures and Analyses
The organic extracts were analysed using reversed-phase HPLC with
UV/Visible (UV/Vis) diode-array detection (DAD). The method was adapted from a
previously reported method for the determination of phenolic acids in apple and pear
juices (Schieber et al., 2001). Analyses were performed on a Hewlett Packard
HP/Agilent 1100 Series HPLC system (G1379A micro-degasser, Japan; G1311A
quaternary pump, Germany; G1313A automatic liquid sampler (ALS), Germany;
G1315B diode-array detector, Germany) using a Waters Symmetry C18 column
(150 × 3.9 mm i.d.) with a Waters Guard-Pak guard holder containing a Waters
Guard-Pak Resolve C18 guard insert (10 µm) (Milford, MA, USA). The mobile
phase consisted of 2.0% (v/v) glacial acetic acid in water (as eluent A) and methanol

61
(as eluent B). The gradient programs for extracts produced from each method were as
follows:
Method A. 10% B to 17% B (18 min), 17% B to 23% B (12 min), isocratic
(10 min), 23% B to 31% B (13 min), 31% B to 46% B (12 min), 46% B to 55% B
(5 min), 55% B to 100% B (5 min), isocratic (8 min), 100% B to 10% B (2 min) and
isocratic (5 min).
Method B. 2% B to 5% B (10 min), 5% B to 20% B (50 min), 20% B to 50%
B (20 min), isocratic (5 min) and 50% B to 2% B (5 min).
Simultaneous detection at specific wavelengths (280 nm, 320 nm, 370 nm and
420 nm) was subtracted against a reference wavelength (600 nm). The wavelengths
were chosen for identification and quantification of the various types of phenolic
compounds. Data on hydroxybenzoic acids can be collected at 280 nm;
hydroxycinnamic acids at 320 nm; flavanols and chalcones at 370 nm; and other
flavonoid derivatives at 420 nm (Cai et al., 2004; Stalikas, 2007).
Aliquots of samples were membrane filtered (0.45 μm) prior to injection into
the HPLC system. Injection volumes for all samples were 10 μL and 8.0 μL for
extracts produced from Methods A and B respectively. Column temperature was
25 °C; flow rate was 1.0 mL and run time was 90 min. After each run, the
chromatographic system was equilibrated for 10 min. Data acquisition was performed
using the Agilent ChemStation (Rev. A.09.03) software package. Analyses of
samples were carried out in triplicate.
Identification of peaks was based on the conformance of UV/Vis spectra and
retention times with the corresponding authentic standards. Calibration curves for 18
compounds were constructed using five different standard concentrations over the
concentration ranges expected in sugar process streams (Curtin and Paton, 1980;
Payet et al., 2006). The calibration curves were linear (R2 = 1.00). The peak heights
of the target compounds were within the linear range of the calibration curve.
Analyses of standards were carried out in triplicate.
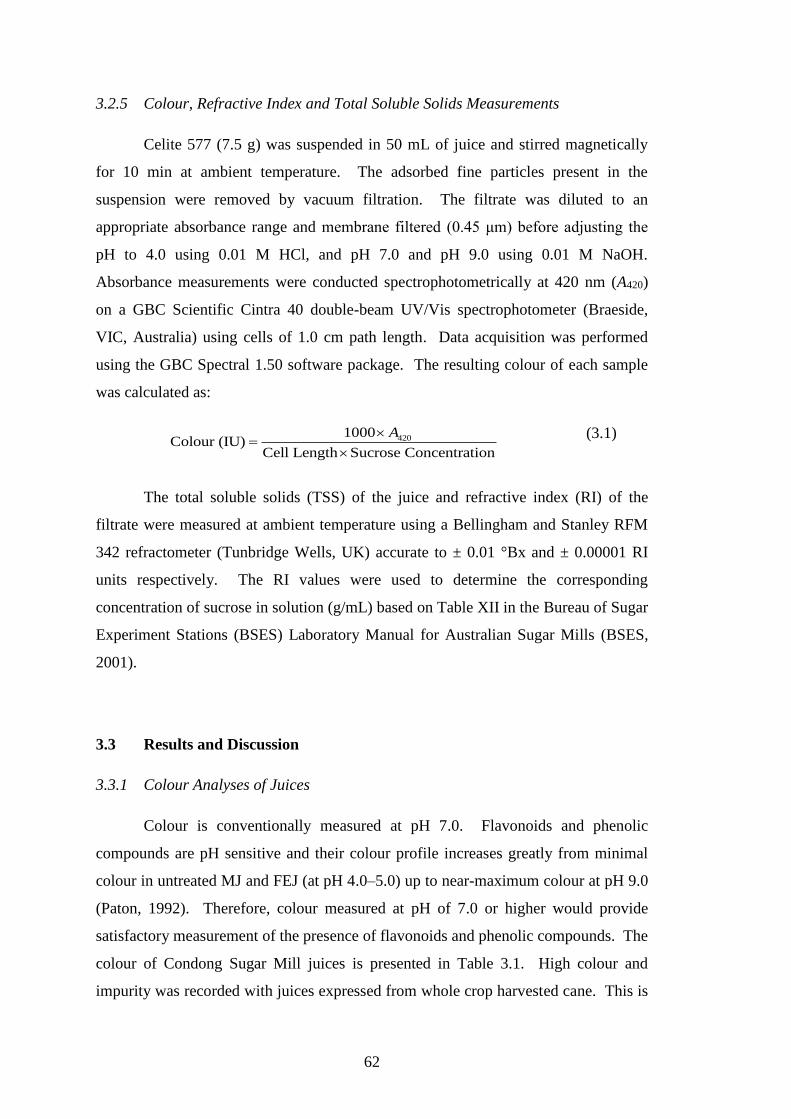
62
3.2.5 Colour, Refractive Index and Total Soluble Solids Measurements
Celite 577 (7.5 g) was suspended in 50 mL of juice and stirred magnetically
for 10 min at ambient temperature. The adsorbed fine particles present in the
suspension were removed by vacuum filtration. The filtrate was diluted to an
appropriate absorbance range and membrane filtered (0.45 μm) before adjusting the
pH to 4.0 using 0.01 M HCl, and pH 7.0 and pH 9.0 using 0.01 M NaOH.
Absorbance measurements were conducted spectrophotometrically at 420 nm (A420)
on a GBC Scientific Cintra 40 double-beam UV/Vis spectrophotometer (Braeside,
VIC, Australia) using cells of 1.0 cm path length. Data acquisition was performed
using the GBC Spectral 1.50 software package. The resulting colour of each sample
was calculated as:
4201000Colour (IU)
Cell Length Sucrose Concentration
A
(3.1)
The total soluble solids (TSS) of the juice and refractive index (RI) of the
filtrate were measured at ambient temperature using a Bellingham and Stanley RFM
342 refractometer (Tunbridge Wells, UK) accurate to ± 0.01 °Bx and ± 0.00001 RI
units respectively. The RI values were used to determine the corresponding
concentration of sucrose in solution (g/mL) based on Table XII in the Bureau of Sugar
Experiment Stations (BSES) Laboratory Manual for Australian Sugar Mills (BSES,
2001).
3.3 Results and Discussion
3.3.1 Colour Analyses of Juices
Colour is conventionally measured at pH 7.0. Flavonoids and phenolic
compounds are pH sensitive and their colour profile increases greatly from minimal
colour in untreated MJ and FEJ (at pH 4.0–5.0) up to near-maximum colour at pH 9.0
(Paton, 1992). Therefore, colour measured at pH of 7.0 or higher would provide
satisfactory measurement of the presence of flavonoids and phenolic compounds. The
colour of Condong Sugar Mill juices is presented in Table 3.1. High colour and
impurity was recorded with juices expressed from whole crop harvested cane. This is

63
primarily due to green cane harvesting where green tops and brown leafy trash are
processed (Eggleston et al., 2010).
Table 3.1 Colour of factory sugar cane juices recorded at pH 7.
PJ FEJ
Green cane Burnt cane Whole crop Burnt cane
TSS (°Bx) 13.19 14.97 16.39 19.43
RI 1.3537 1.3601 1.3579 1.3690
Colour (IU) 20,000 12,700 11,400 10,400
*Mean values (n = 3). % Relative standard deviation (RSD) was ≤ 0.7%.
3.3.2 Phenolic Content in Juices
The phenolic compounds separated from the cane juice extracts using Method
A are shown in Figure 3.1. Baseline separation was achieved for all identified
components. The m– and o–isomers of coumaric acid were not detected in any of the
extracts analysed. The elution order of the phenolic compounds was consistent with
previous studies under different chromatographic conditions with the exception of
2,3–dihydroxybenzoic acid and chlorogenic acid (Curtin and Paton, 1980).

64
Figure 3.1 Separation of a typical mixture of compounds in the FEJ extract of
burnt harvested cane by HPLC-DAD (Method A, UV/Vis detection
at 280 nm). 1 = gallic acid (tentative), 2 = HMF,
3 = 4–hydroxybenzoic acid, 4 = chlorogenic acid, 5 = vanillic acid,
6 = caffeic acid, 7 = 2,3–dihydroxybenozic acid, 8 = protocatechuic
acid (tentative), 9 = p–coumaric acid, 10 = ferulic acid.
The concentrations of each compound varied with the juice type. These are
tabulated in terms of mM on dry content as shown in Table 3.2. The concentrations
of phenolic compounds in whole crop and green harvested cane juices are
substantially lower than burnt harvested cane juices. This is probably due to the
valorisation of lignin, a component of bagasse, during cane burning.
Table 3.2 shows that higher amounts of HMF were identified in both FEJ and
PJ extracts of burnt cane compared to the extracts of green cane and whole crop. This
is due to the dehydration of sugars, particularly reducing sugars, to HMF as a result of
high temperatures generated during the burning of cane prior to harvesting
(Huber et al., 2006). Prior to this work, the quantification of HMF in Australian FEJ
and PJ extracts using this method has not been reported in the literature. Also, the
concentration of caffeic acid (Table 3.2) was relatively lower than other phenolic
acids in comparison to previous work on Australian factory cane juice (Curtin and
Paton, 1980).
-10
0
10
20
30
40
50
0 5 10 15 20 25 30 35
Ab
sorb
na
ce (
mA
U)
Retention Time (min)
34
5 6
7
8 9
10
1
2

65
Table 3.2 Phenolic acids and HMF (mM on dry content) by HPLC-DAD of
sugar cane juices using Method A.*
PJ FEJ
Green cane Burnt cane Whole crop Burnt cane
Caffeic 10 20 0.68 6.9
Chlorogenic 2.2 19 0.20 8.6
p–Coumaric 14 87 1.2 19
2,3–Dihydroxybenzoic 12 24 0.80 7.7
Ferulic 6.0 11 0.48 5.0
4–Hydroxybenzoic 8.3 20 0.45 5.0
Vanillic 14 25 0.68 7.3
HMF 0.43 7.8 0.40 1.4
*Mean values (n = 3). % RSD was < 5.0%.
Higher concentrations of phenolic compounds are present in PJs compared to
FEJs (Table 3.2). This is probably due to the decomposition of flavonoids followed
by oxidation of the intermediate products and further degradation of lignin products at
the relatively higher processing temperatures of PJ.
Table 3.3 shows a comparison of the phenolic acid and HMF composition
based on the PJs from Table 3.2 in terms of mM on juice, to those reported by Curtin
and Paton (1980). The total amount of phenolic compounds are considerably higher
than those previously reported by Curtin and Paton (1980). The differences between
the two sets of data may be related to differences in the cane varieties or the
differences in the analytical procedures used for phenolic composition analysis.
Evident from Table 3.1, the juices expressed from green cane and whole crop
contain higher colour but lower amounts of phenolic compounds than the juices
expressed from burnt cane (Table 3.2). It is therefore deduced that the juices
expressed from green cane and whole crop cane harvesting contain a higher
proportion of cane pigments (e.g., flavonoids).

66
Table 3.3 Phenolic acids (mM on juice) and HMF by HPLC-DAD of PJs
using Method A.*
Green cane Burnt cane Burnt cane†
Caffeic 0.044 0.055 0.083
Chlorogenic 0.009 0.051 0.000
p–Coumaric 0.060 0.240 0.002
2,3–Dihydroxybenzoic 0.053 0.065 0.001
Ferulic 0.026 0.028 0.002
4–Hydroxybenzoic 0.036 0.055 0.001
Vanillic 0.058 0.067 0.002
*Mean values (n = 3). % RSD was < 5.0%.
†Cane juice data based from Curtin and Paton (1980).
The reversed-phase HPLC method (Method B) was then optimised for
separation and identification of phenolic compounds. Different solvents for the
liquid-liquid extraction of phenolics and dissolution of the dried residues as well as
modifications of the gradient program were conducted to obtain chromatograms with
good resolution of peaks with an acceptable analysis time. Changes in the injection
volume and gradient program significantly affected the resolution and separation of
peaks.
Ethyl acetate was chosen as the solvent for liquid-liquid extraction in place of
diethyl ether as it has a better extraction efficiency and higher recovery yields for
phenolic acids but not phenolic aldehydes (Simón et al., 1990). The improved
solubility of the dried residues in methanol resulted in better detector response
(Robbins, 2003). The separation of a standard mixture of 20 phenolic compounds
(viz., hydroxybenzoic and hydroxycinnamic acids), HMF and furfural monitored at
280 nm using Method B is shown in Figure 3.2.

67
Figure 3.2 Separation of a standard mixture of compounds by HPLC-DAD
(Method B, UV/Vis detection at 280 nm). 1 = gallic acid, 2 = HMF,
3 = protocatechuic acid, 4 = furfural, 5 = 4–hydroxybenzoic acid,
6 = (±)–catechin, 7 = vanillic acid, 8 = caffeic acid, 9 = chlorogenic
acid, 10 = vanillin, 11 = p–coumaric acid, 12 = syringaldehyde,
13 = ferulic acid, 14 = sinapinic acid, 15 = coumarin,
16 = o–coumaric acid, 17 = 3,4,5–trimethoxybenzoic acid,
18 = rutin, 19 = diosmin, 20 = chrysin, 21 = morin,
22 = quercetin.
As shown in Figure 3.2 the baseline separation was achieved for virtually all
components evenly across the whole chromatogram except for chlorogenic acid and
sinapinic acid which are overlapped by caffeic acid and coumarin respectively. For
these four compounds, chlorogenic acid was not quantified as it was superimposed by
caffeic acid.
The HPLC chromatogram of burnt cane PJ using Method B is shown in Figure
3.3. The concentration of phenolic components of the cane juice extracts are shown
in Table 3.4. The phenolic acid content detected in the sugar cane extracts in this
study were similar to the values obtained by Payet et al., (2006) for various sugar
process streams and products after juice clarification. The concentrations of the
phenolic compounds detected are consistent to those found in orange juice (Rapisarda
-10
0
10
20
30
40
50
60
0 10 20 30 40 50 60 70 80 90
Ab
sorb
an
ce (
mA
U)
Retention Time (min)
1
2
3
4
5
67
8
9
1011
12 1314
1516
17 1819 20
2122

68
et al., 1998), mandarin juice (Kelebek and Selli, 2011) and commercial fruit juices
(viz., apple, grape strawberry) (Díaz-García et al., 2013).
As shown in Figure 3.3 and Table 3.4, the juice extracts mainly consisted of
hydroxybenzoic and hydroxycinnamic acids, with the latter having the highest total
concentration. Caffeic, p–coumaric and ferulic acids are the most concentrated
hydroxycinnamic acids, while 4–hydroxybenzoic and vanillic acids are the most
concentrated hydroxybenzoic acids.
Figure 3.3 Separation of a typical mixture of compounds in the PJ extract of
burnt harvested cane by HPLC-DAD (Method B, UV/Vis detection
at 280 nm). 1 = gallic acid, 2 = HMF, 3 = protocatechuic acid,
4 = furfural, 5 = 4–hydroxybenzoic acid, 6 = vanillic acid,
7 = caffeic acid, 8 = p–coumaric acid, 9 = syringaldehyde,
10 = ferulic acid, 11 = sinapinic acid, 12 = coumarin, 13 = rutin,
14 = diosmin, 15 = chrysin, 16 = morin, 17 = quercetin.
-10
0
10
20
30
40
50
60
0 10 20 30 40 50 60 70 80 90
Ab
sorb
an
ce (
mA
U)
Retention Time (min)
1112
1
23
4
56
7
8
9
10
1314
15 16 17
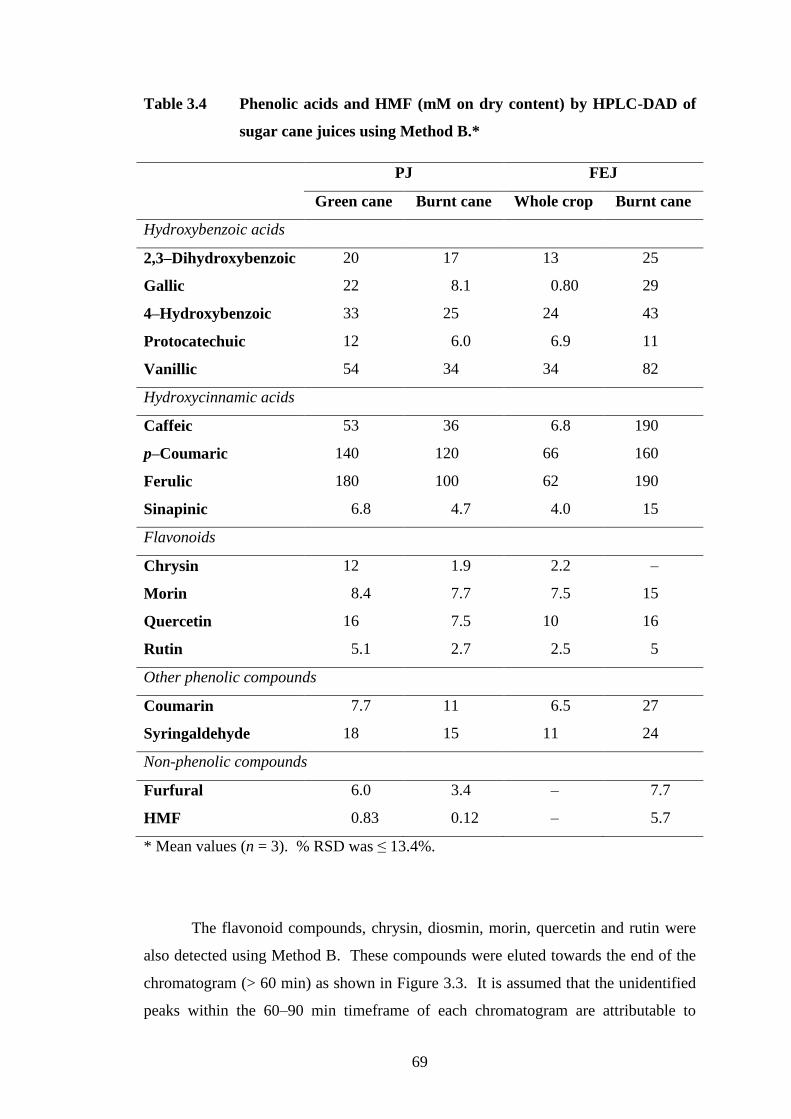
69
Table 3.4 Phenolic acids and HMF (mM on dry content) by HPLC-DAD of
sugar cane juices using Method B.*
PJ FEJ
Green cane Burnt cane Whole crop Burnt cane
Hydroxybenzoic acids
2,3–Dihydroxybenzoic 20 17 13 25
Gallic 22 8.1 0.80 29
4–Hydroxybenzoic 33 25 24 43
Protocatechuic 12 6.0 6.9 11
Vanillic 54 34 34 82
Hydroxycinnamic acids
Caffeic 53 36 6.8 190
p–Coumaric 140 120 66 160
Ferulic 180 100 62 190
Sinapinic 6.8 4.7 4.0 15
Flavonoids
Chrysin 12 1.9 2.2 –
Morin 8.4 7.7 7.5 15
Quercetin 16 7.5 10 16
Rutin 5.1 2.7 2.5 5
Other phenolic compounds
Coumarin 7.7 11 6.5 27
Syringaldehyde 18 15 11 24
Non-phenolic compounds
Furfural 6.0 3.4 – 7.7
HMF 0.83 0.12 – 5.7
* Mean values (n = 3). % RSD was ≤ 13.4%.
The flavonoid compounds, chrysin, diosmin, morin, quercetin and rutin were
also detected using Method B. These compounds were eluted towards the end of the
chromatogram (> 60 min) as shown in Figure 3.3. It is assumed that the unidentified
peaks within the 60–90 min timeframe of each chromatogram are attributable to

70
flavonoid compounds. The m– and o– isomers of coumaric acid were not found. The
components (±)–catechin, 5,7–dihydroxy–4–methoxyisoflavone, hesperidin,
hesperetin, homogentisic acid, kojic acid, α–resorcylic acid, β–resorcylic acid and
3,4,5–trimethoxybenzoic acid were also not identified in any of the four juice extracts.
These compounds are typically found in commercial products such as honeys
(Gómez-Caravaca et al., 2006) and fruit juices (Díaz-García et al., 2013).
3.4 Summary
Fifteen phenolic compounds, HMF and furfural were quantified in juice
extracts of FEJ and PJ process streams expressed from burnt, green and whole crop
harvested cane. The results show that juice expressed from whole crop cane has
significantly higher colour but lower concentrations of phenolic acids than juices
expressed from burnt cane. It was deduced that the juices expressed from green cane
and whole crop cane harvesting contain a higher proportion of cane pigments.
Changes to the extraction procedure, sample preparation and chromatographic
conditions as outlined in the modified method (Method B), gave more definitive peak
separation and showed an overall improved response to phenolic acids and revealed
the presence of flavonoid compounds. Interestingly, the concentrations of phenolic
acids separated using Method A showed a higher proportion of hydroxybenzoic acids
than hydroxycinnamic acids, possibly due to the solubility effect of the dried extracts.
However, the opposite was observed when the extracts were separated using Method
B. Using the modified method, the HPLC results reveal that caffeic, p–coumaric and
ferulic acids were the three main phenolic acids present in FEJ and PJ extracts
sourced from burnt cane, green cane and/or whole crop harvested cane.

71
References
BSES (2001). Table XII, Laboratory Manual for Australian Sugar Mills (Vol. 2, pp.
1-7). Indooroopilly, QLD, Australia: Bureau of Sugar Experiment Stations.
Cai, Y., Luo, Q., Sun, M., & Corke, H. (2004). Antioxidant activity and phenolic
compounds of 112 traditional Chinese medicinal plants associated with
anticancer. Life Sciences, 74(17), 2157-2184.
Curtin, J. H., & Paton, N. H. (1980). The quantitative analysis of phenolic acids from
sugar liquors by high performance liquid chromatography. Proceedings of the
International Society of Sugar Cane Technologists, 17, 2361-2371.
Díaz-García, M. C., Obón, J. M., Castellar, M. R., Collado, J., & Alacid, M. (2013).
Quantification by UHPLC of total individual polyphenols in fruit juices. Food
Chemistry, 138(2–3), 938-949.
Eggleston, G., Grisham, M., & Antoine, A. (2010). Clarification properties of trash
and stalk tissues from sugar cane. Journal of Agricultural and Food
Chemistry, 58(1), 366-373.
Gómez-Caravaca, A. M., Gómez-Romero, M., Arráez-Román, D., Segura-Carretero,
A., & Fernández-Gutiérrez, A. (2006). Advances in the analysis of phenolic
compounds in products derived from bees. Journal of Pharmaceutical and
Biomedical Analysis, 41(4), 1220-1234.
Huber, G. W., Iborra, S., & Corma, A. (2006). Synthesis of transportation fuels from
biomass: chemistry, catalysts and engineering. Chemical Reviews, 106(9),
4044-4098.
Kelebek, H., & Selli, S. (2011). Identification of phenolic compositions and the
antioxidant capacity of mandarin juices and wines. Journal of Food Science
and Technology, 1-8.
Paton, N. H. (1978). A method for the separation and identification of phenolic acids
in sugar products. Proceedings of the International Society of Sugar Cane
Technologists, 16, 2633-2643.
Paton, N. H. (1992). The origin of colour in raw sugar. Proceedings of the Australian
Society of Sugar Cane Technologists, 14, 8-17.
Payet, B., Shum Cheong Sing, A., & Smadja, J. (2006). Comparison of the
concentrations of phenolic constituents in cane sugar manufacturing products
with their antioxidant activities. Journal of Agricultural and Food Chemistry,
54, 7270-7276.
Rapisarda, P., Carollo, G., Fallico, B., Tomaselli, F., & Maccarone, E. (1998).
Hydroxycinnamic acids as markers of Italian blood orange juices. Journal of
Agricultural and Food Chemistry, 46(2), 464-470.

72
Robbins, R. J. (2003). Phenolic acids in foods: an overview of analytical
methodology. Journal of Agricultural and Food Chemistry, 51(10), 2866-
2887.
Schieber, A., Keller, P., & Carle, R. (2001). Determination of phenolic acids and
flavonoids of apple and pear by high-performance liquid chromatography.
Journal of Chromatography A, 910, 265-273.
Simón, B. F., Pérez-Ilzarbe, J., Hernández, T., Gómez-Cordovés, C., & Estrella, I.
(1990). HPLC study of the efficiency of extraction of phenolic compounds.
Chromatographia, 30(1-2), 35-37.
Stalikas, C. D. (2007). Extraction, separation, and detection methods for phenolic
acids and flavonoids. Journal of Separation Science, 30, 3268-3295.

73
CHAPTER 4
Degradation of
Hydroxycinnamic Acids
4.1 Introduction..................................................................................... 74
4.2 Materials and Methods................................................................... 75
4.2.1 Reagents and Solvents......................................................... 75
4.2.2 Catalytic and Non-catalytic Oxidation of Caffeic Acid....... 75
4.2.3 Fenton Oxidation Reactions for Caffeic Acid Degradation 76
4.2.4 Fenton Oxidation Reactions for the Degradation of
Hydroxycinnamic Acid Mixtures.........................................
78
4.2.5 Instrumental Procedures and Analyses............................... 78
4.2.6 Performance Assessment of the Fenton Oxidation Process 79
4.2.7 Design of Experiments......................................................... 80
4.2.8 Statistical Analysis.............................................................. 82
4.2.9 Evaluation of the Interactions between Fe(II) and
Hydroxycinnamic Acids.......................................................
82
4.3 Results and Discussion.................................................................... 83
4.3.1 Catalytic and Non-catalytic Oxidation of Caffeic Acid in
Aqueous Systems..................................................................
83
4.3.2 Optimisation of Process Parameters for the Degradation
of Caffeic Acid in Sugar Solutions......................................
87
4.3.3 Degradation of Hydroxycinnamic Acid Mixtures............... 100
4.4 Summary.......................................................................................... 130

74
4.1 Introduction
As reported in Chapter 3, the main phenolic acids present in sugar cane juice
are caffeic acid (CaA), p–coumaric acid (pCoA) and ferulic acid (FeA), which are
classed as hydroxycinnamic acids (HCAs). Thus, the aim of this chapter was to
determine the optimum conditions and develop models for the rapid degradation of
these colour precursors by the Fenton oxidation process.
In the first section, Section 4.3.1, a preliminary investigation compared the
performance of the Fenton process on the degradation of caffeic acid in aqueous
solution to that of H2O2 alone.
The outputs from the study were then used to identify the necessary process
parameters and their numeric constraints for the development of a mathematical
model (Section 4.3.2). Response surface methodology (RSM) and central composite
experimental design were used to determine the optimum conditions for the
degradation of CaA. Also, the model was used to predict the optimum conditions for
the degradation of caffeic acid at particular stages of the sugar manufacturing process.
In Section 4.3.3, the study builds on the results and observations from the
previous sections by examining the degradation of a mixture of three HCAs; CaA,
pCoA and FeA, using the Fenton oxidation process in the presence and absence of
sucrose. Multi-response surface methodology (MRSM) was used for modelling and
optimisation of process parameters for the degradation process by examining
individual and interactive influences of the parameters. The rigorous optimisation
process undertaken in this study was to accurately determine the exact amounts of
phenolic acids degraded under the chosen Fenton process conditions, as any excess
iron would result in an increase in the amount of iron sludge and colour formed
during processing.

75
4.2 Materials and Methods
4.2.1 Reagents and Solvents
All chemicals purchased were of AR grade and used as supplied without
further purification. Solvents for chromatographic analyses were of super gradient
HPLC grade from Scharlau (Sentmenat, Spain). Solutions were prepared using
Milli-Q water from a Millipore system (Bedford, MA, USA) with a resistivity of 18.2
MΩ.cm.
The phenolic acids (CaA, pCoA and FeA), fructose, glucose, lactose and
sucrose were purchased from Sigma-Aldrich (St. Louis, MO, USA). Ferrous sulfate
heptahydrate (FeSO4·7H2O), glacial acetic acid, H2O2 (30% (w/v)), potassium
permanganate, sodium acetate, sodium hydroxide, sodium oxalate and sulfuric acid
were obtained from Ajax Finechem (Seven Hills, NSW, Australia). Ethanol
(absolute) was supplied from Merck (Darmstadt, Germany). Stock solutions of HCAs
(i.e., CaA, pCoA and FeA) were prepared individually by dissolution in degassed
ethanol solution (50% (v/v)) and stored at 4.0 °C, unless otherwise stated.
4.2.2 Catalytic and Non-catalytic Oxidation of Caffeic Acid
Caffeic acid solution (55.5 mM) was prepared by dissolving CaA in degassed
absolute ethanol solution (50% (v/v)). Aqueous Fe(II) solution (179 mM) was
prepared by dissolving solid FeSO4·7H2O in Milli-Q water. Dilute H2O2 solution
(147 mM) was prepared from stock H2O2 with Milli-Q water and standardised
iodometrically. The materials were used to prepare a series of solutions with a final
concentration of CaA (1.11 mM), Fe(II) (0 or 0.72 mM) and H2O2 (2.94 or 11.8 mM)
according to the sample matrix given in Table 4.1.

76
Table 4.1 Volumes of reagents (mM) used for the degradation of CaA.
Sample Water
(μL)
CaA
(μL)
Fe(II)
(μL)
H2O2
(μL)
Total
(μL)
Final [H2O2]
(mM)
Non-catalytic oxidation
Control 49,000 1,000 0 0 50,000 0
Test 1 48,000 1,000 0 1,000 50,000 2.94
Test 2 45,000 1,000 0 4,000 50,000 11.8
Catalytic oxidation
Control 48,880 1,000 200 0 50,000 0
Test 3 47,800 1,000 200 1,000 50,000 2.94
Test 4 44,800 1,000 200 4,000 50,000 11.8
Reactions were carried out in 50 mL Erlenmeyer flasks at ambient
temperature. The procedure for the catalytic oxidation can be described as follows:
(i) adjusting the pH to 3.0, 4.0 or 5.0 of the CaA solution using 0.01 M H2SO4 or
0.1 M NaOH; (ii) addition of Fe(II); (iii) addition of H2O2; and (iv) the reaction
allowed to run for up to 30 min with continuous magnetic stirring (280 rpm). The
procedure for the non-catalytic oxidation was identical with the exceptions that no
Fe(II) was added and that the reaction was allowed to run for up to 60 min. The pH
was measured using a Radiometer Analytical MeterLab PHM 220 pH meter (Lyon,
France). Aliquots (1 mL) were taken at 5 min intervals, diluted 10-fold and analysed
spectrophotometrically. Spectrophotometric measurements were conducted at
wavelengths ranging between 190 nm and 800 nm on a GBC Cintra 40 double beam
UV/Vis spectrophotometer using cells of 1.0 cm path length. Data acquisition was
performed using the GBC Spectral 1.50 software package.
4.2.3 Fenton Oxidation Reactions for Caffeic Acid Degradation
Reactions were carried out in 10 mL glass scintillated reaction vessels housed
in an 18971 Pierce Reacti-Therm heating/stirring module (Rockford, IL, USA) with
continuous magnetic stirring (280 rpm) (Figure 4.1). In each run, a predetermined
amount of Milli-Q water, sucrose and CaA were added to the reaction vessel and the

77
whole adjusted to the desired pH value with 0.01 M H2SO4 or 0.1 M NaOH. Known
amounts of FeSO4·7H2O and H2O2 solutions were added to achieve a final volume of
10 mL. The reaction was initiated as soon as H2O2 was added. For pH
measurements, a Hach H160 portable pH meter (Loveland, CO, USA) with a Eutech
Instruments glass pH electrode (Singapore) was used. Temperature was monitored
using a Comark C9001 thermometer probe (Sheffield, UK). At the required time of
sampling, 1.0 mL of the solution was taken, diluted 10-fold to quench the reaction and
measured immediately spectrophotometrically at 320 nm on a GBC Cintra 40 double
beam UV/Vis spectrophotometer (Braeside, VIC, Australia) using cells of 1.0 cm path
length. Data acquisition was performed using the GBC Spectral 1.50 software
package.
Figure 4.1 Schematic representation of heating block used for the Fenton
oxidation process.

78
4.2.4 Fenton Oxidation Reactions for the Degradation of Hydroxycinnamic Acid
Mixtures
The procedure for the Fenton oxidative degradation of HCA mixtures is
similar to that described in Section 4.2.3. In each run, a predetermined amount of
Milli-Q water, sucrose and each HCA (equivalent mg/L concentration) were added to
the reaction vessel. Known amounts of FeSO4·7H2O (50 mM, 0.498 mL) and H2O2
(500 mM, 0.150 mL) solutions were added to achieve a final volume of 10 mL and a
final concentration of 2.49 mM and 7.50 mM, respectively. The working molar ratio
of 1:15 (Fe(II)/H2O2) for the Fenton reaction of HCA mixtures was chosen based on
the optimum molar ratio of 1:13 for CaA solutions (cf. Section 4.3.2). The reaction
was initiated as soon as H2O2 was added. At 2 min, 3 mL of the solution was taken,
diluted 10-fold to quench the reaction and kept frozen. Samples were defrosted and
prepared for instrumental analysis.
4.2.5 Instrumental Procedures and Analyses
HPLC-DAD. The proportion of each HCA degraded was monitored by
reversed-phase HPLC-DAD. The analysis was performed on a Hewlett Packard
HP/Agilent 1100 Series HPLC system (G1379A micro-degasser, Japan; G1311A
quaternary pump, Germany; G1313A ALS, Germany; G1315B DAD, Germany)
using a Waters Symmetry C18 column (150 × 3.9 mm i.d.) with a Waters Guard-Pak
guard holder containing a Waters Guard-Pak Resolve C18 guard insert (10 μm)
(Milford, MA, USA). The mobile phase consisted of 1.0% (v/v) acetic acid in water
(as eluent A) and methanol (as eluent B). The gradient program was as follows:
20% B to 25% B (5 min), 25% B to 50% B (15 min) and 50% B to 20% B (5 min).
Simultaneous detection at specific wavelengths (280 nm and 320 nm) subtracted
against a reference wavelength (620 nm). Aliquots of samples were membrane
filtered (0.45 μm) prior to injection into the HPLC system. Injection volume for all
samples was 50 μL; column temperature was ambient; flow rate was 1.0 mL/min and
run time was 25 min. After each run, the chromatographic system was equilibrated
for 5 min. Data acquisition was performed using the Agilent ChemStation (Rev.
A.09.03) software package. Identification of peaks was based on the conformance of
UV/Vis spectra and retention times with the corresponding authentic standards.

79
HPAEC-PAD. Sucrose and reducing sugar contents in the reaction mixtures
were monitored by high-performance anion exchange chromatography with pulsed
amperometric detection (HPAEC-PAD). The analysis was performed on a Waters
HPLC system (Milford, MA, USA) equipped with a 626 pump, a 600S controller, a
717plus autosampler and a 2465 electrochemical detector (fitted with a solid-state
Ag/AgCl reference electrode and a gold working electrode). The waveforms:
E1 = + 0.08 V for 0.4 s; E2 = +0.73 V for 0.4 s and E3 = –0.57 V for 0.2 s were
employed with a PAD intensity of 10 μA. Aliquots of samples were diluted 100-fold,
membrane filtered (0.45 µm) and injected (20 µL) on a Dionex CarboPac PA-1 guard
column (50 × 4 mm i.d.) attached to a Dionex CarboPac PA-1 anion exchange column
(250 × 4 mm i.d.) (Waltham, MA, USA). The columns were equilibrated at 27 °C.
The sugars were eluted isocratically with 150 mM NaOH (sparged with helium at
30 mL/min) at a flow rate of 1.0 mL/min. Data acquisition was performed using the
Waters Empower 2 (Build 2154) software package. Quantification of sugars was
carried out by external calibration using standard solutions of sucrose, glucose and
fructose in combination with lactose (as an internal standard).
4.2.6 Performance Assessment of the Fenton Oxidation Process
The efficiency of the Fenton process on the degradation of CaA, pCoA and
FeA was determined based on the change in absorbance of the corresponding HPLC
chromatographic peak using Equation 4.1:
0
0
% CaA, CoA or FeA degradation = 100tA Ap
A
(4.1)
where, A0 initial absorbance of HCA in mAU (at t = 0 min)
At absorbance of HCA in mAU at time of aliquot taken (at t = 2 min)

80
4.2.7 Design of Experiments
Design of experiments (DOE), mathematical modelling and optimisation of
process parameters were evaluated using the Stat-Ease, Inc. Design-Expert 7.0.0
software package (Minneapolis, MN, USA). Two experimental designs were
developed for the two separate batch Fenton oxidation reaction studies. The first
DOE was developed for the Fenton oxidation of CaA (cf. Section 4.2.3). Meanwhile,
the second DOE was developed for the Fenton oxidation of HCA mixtures (cf. Section
4.2.4).
Fenton Oxidation of Caffeic Acid (Design 1)
A face-centred central composite design (CCD) was used to evaluate the main
effect for each condition and the possible interaction effects on the residual stresses
between two factors. The factors (independent variables) used in this study were CaA
concentration (x1), sucrose concentration (x2), initial solution pH (x3), Fe(II) dosage
(x4), H2O2 dosage (x5), reaction temperature (x6) and reaction time (x7). The selected
response factor (dependent variable) for optimisation was % CaA degradation (y).
The coded and actual values of each factor and their levels for this experimental
design used in this study are shown in Table 4.2. The ranges for each parameter were
determined by preliminary experiments based on previous works published in the
literature (Pala and Erden, 2005; Nguyen and Doherty, 2012). The reaction time was
kept to 2 min in order to minimise sucrose degradation in order to allow treatment of
sugar cane process streams, where the main objective is to preserve the sucrose
content.
The design consisted of a 2k factorial augmented by 2k axial points and a
centre point, where k is the number of factors investigated (k = 7). For this study, a
total of 152 experiments were conducted in random order with 128 factorial points, 14
axial points and 1 centre point (duplicated 9 times for experimental error calculation).

81
Table 4.2 Coded and actual values of the experimental design for Design 1.
Coded levels of parameters
Notation Factor Unit –1 0 +1
A (x1) CaA mM 0.28 0.70 1.11
B (x2) Sucrose % (w/w) 0 17 34
C (x3) Solution pH 3.5 5.0 6.5
D (x4) Fe(II) dosage mM 0.18 0.45 0.72
E (x5) H2O2 dosage mM 2.21 6.62 11.03
F (x6) Temperature °C 35 65 95
G (x7) Time s 10 65 120
Fenton Oxidation of Hydroxycinnamic Acid Mixtures (Design 2)
A rotatable circumscribed CCD was used to evaluate the main effect for each
condition and the possible interactive effects on the residual stresses between two
variables. The process parameters (independent variables) used in this study were the
initial total HCA concentration (x1), the initial sucrose concentration (x2), the solution
pH (x3) and the reaction temperature (x4). The selected response factors (dependent
variables) for optimisation were % CaA degradation (y1), % pCoA degradation (y2),
% FeA degradation (y3) and % total HCA degradation (y4). The coded and actual
values of each variable and their levels for the experimental design used in the study
are shown in Table 4.3. The ranges for each parameter were determined by
preliminary experiments based on the previous experimental design (i.e., Design 1)
and were selected to closely mimic operating parameters during the processing of
sugar cane juice for raw sugar manufacture. Concentrations of HCAs vary depending
on season, region and type of cane and the method of harvesting (e.g., burnt cane,
green cane, whole crop cane), hence, an initial total HCA concentration range of
20–200 mg/L was chosen for this study in order to account for other HCAs and
phenolic compounds present in sugar cane juice.

82
Table 4.3 Coded and actual values of the experimental design for Design 2.
Coded levels of parameters
Notation Factor Unit –2 –1 0 +1 +2
A (x1) Total HCA mg/L 20 65 110 155 200
B (x2) Sucrose % (w/w) 0 3.75 7.50 11.25 15.00
C (x3) pH 4.50 3.75 5.00 5.25 5.50
D (x4) Temperature °C 25.00 31.25 37.50 43.75 50.00
The design consisted of a 2k factorial augmented by 2k axial points and a
centre point, where k is the number of factors investigated (k = 4). For this study, a
total of 54 experiments were conducted in random order with 16 factorial points (in
duplicate), 8 axial points (in duplicate) and 1 centre point (duplicated 5 times).
Duplicate runs were required for experimental error calculation.
4.2.8 Statistical Analysis
Analysis of variance (ANOVA) was used for model adequacy and analysis of
the experimental data. The quality of the fit polynomial model was expressed by the
regression coefficient, R2 and its statistical significance was checked using Fisher’s
F-test. Model terms were determined based on the significance of each term at a
confidence level of 95%.
4.2.9 Evaluation of the Interactions between Fe(II) and Hydroxycinnamic Acids
Studies were conducted to investigate the interaction between Fe(II) and each
of the HCAs in the presence and absence of sucrose using UV/Vis and attenuated total
reflectance-Fourier transform infrared (ATR-FTIR) spectroscopy. Sodium acetate
(100 mM) and acetic acid (100 mM) solutions were used to make buffer solutions
having pH values of 4.0 to 6.0. For each analysis, a predetermined amount of buffer,
sucrose and FeSO4·7H2O were added to achieve a final HCA concentration of
5.5 mM. Samples were diluted to the desired concentration and immediately
membrane filtered (0.45 μm) for analysis. The pH of each solution was checked

83
before and after dilution. The UV/Vis spectra were recorded on a Perkin Elmer
Lambda 35 double-beam UV/Vis spectrophotometer (Shelton, CT, USA) using cells
of 1.0 cm path length and at a wavelength range of 190–450 nm in 1.0 nm increments.
Data acquisition was performed using the Perkin Elmer UV WinLab (Ver. 2.85.04)
software package. Infrared absorbance spectra were obtained using a Thermo
Electron Nicolet Smart Endurance horizontal single bounce, diamond ATR accessory
on a Thermo Electron Nicolet Nexus 870 FTIR instrument fitted with a deuterated
triglycine sulfate detector (Madison, WI, USA). Spectra were recorded over the
4000–650 cm–1 range at 4 cm–1 resolution for 64 scans with an optical path difference
velocity of 0.6329 cm/s. Data acquisition and processing was performed using the
OMNIC 7.3 software package. The FTIR peaks were normalised with respect to the
main peak at 1045 cm–1.
A light brown precipitate was formed at pH ≥ 5.0 for all the acids with iron.
This precipitate was filtered using a polyvinyl chloride membrane filter (5 μm). It
was analysed by X-ray powder diffraction (XRD). Sample analysis was performed on
a PANalytical X’Pert PRO multi-purpose X-ray diffractometer (Almelo, Netherlands)
using Cu Kα radiation (λ = 1.5406 Å) at 40 kV and 40 mA. Patterns were recorded in
the 2θ range from 3.5° to 75° with a scan step size of 0.017° and a count time per step
of 50 s. Data was acquired and processed using the X’Pert Data Collector 2.2 and
MDI Jade 9.0 software packages respectively.
4.3 Results and Discussion
4.3.1 Catalytic and Non-catalytic Oxidation of Caffeic Acid in Aqueous Systems
The average concentration of CaA is approximately 20 mg/L on PJ obtained
from burnt cane, although an initial CaA concentration of 200 mg/L (i.e., 1.11 mM)
was chosen for the degradation studies in order to account for other phenolics and
colour precursors present in cane juice. The degradation of CaA in aqueous solutions
(at pH 3.0, 4.0 and 5.0) at 25 °C was studied with 2.94 or 11.8 mM H2O2.

84
The absorption spectra obtained for the degradation of CaA is shown in Figure
4.2. Two maxima at 320 nm and 292 nm are attributable to the CaA molecule (1) and
the deprotonated caffeate anion (2) respectively as shown in Scheme 4.1 (Cornard et
al., 2006).
Figure 4.2 Absorption spectra of CaA after the addition of 2.94 mM H2O2 at
pH 3.0 at 25 °C.
OH
OH
O
O
H
OH-
OH
OH
O
O
OH2+
Caffeic Acid Caffeate Anion
(1) (2)
Scheme 4.1
0.00
0.10
0.20
0.30
0.40
0.50
0.60
0.70
0.80
200 250 300 350 400
Ab
sorb
an
ce (
AU
)
Wavelength (nm)
t = 0 min
t = 30 min
t = 60 min

85
These two maxima were also present in reaction mixtures containing CaA and
Fenton’s reagent at pH 3.0, 4.0 and 5.0. After 60 min, 17% CaA was degraded at pH
3.0 with 2.94 mM H2O2. Working with solutions at pH 4.0 and 5.0, there was no
observable CaA degradation. At the higher H2O2 dosage of 11.8 mM, no further
reduction in absorbance was noticeable at either maximum even at pH 3.0. However,
there appears to be some degradation occurring at lower wavelengths, but this was not
conclusive. It is speculated that with the addition of 11.8 mM of H2O2 after the initial
reactions between the •OH radicals and CaA, there were subsequent recombination
reactions.
The degradation of CaA with Fenton’s reagent monitored at 320 nm is shown
in Figure 4.3. The reaction was virtually complete within 5 min. Within 30 min, 86%
of CaA was destroyed upon addition of 0.72 mM Fe(II) and 11.8 mM H2O2 at pH 5.0
(Figure 4.3a). At pH 3.0 and 4.0, the degradation of CaA was 62% and 66%
respectively. The degradation of the deprotonated caffeate anion was also observed.
The degradation ratio of the neutral and anionic forms was approximately 1:1; hence
the Fenton’s reagent is capable of attacking both forms of CaA.
The degradation trends were similar for both 2.94 mM and 11.8 mM H2O2
dosages with the latter having a larger decrease in absorbance (Figure 4.3b). At the
lower H2O2 concentration, approximately 70% degradation occurred after 30 min. A
faster degradation rate was observed at pH 5.0 for both H2O2 dosages despite a higher
initial absorbance. The higher initial absorbance is attributable to the chelating ability
of Fe(II)/Fe(III) on CaA to produce coloured complexes (Smith, 1983).
No other prominent peaks were observed across the spectral wavelength range
during the course of both experiments. This suggests that the degradation products
formed from the use of Fenton’s reagent are relatively LMW compounds with weak
chromophores or compounds without a chromophore.
In summary, the Fenton process is significantly more effective than H2O2 to
degrade CaA in aqueous systems. The Fenton process at 25 °C was optimum at pH
5.0 to degrade CaA in water, which better reflects the pH of sugar cane juices
anyway.

86
Figure 4.3 Degradation of CaA (measured at 320 nm) using Fenton’s reagent
at different initial pH at 25 °C. Concentrations of H2O2:
(a) 11.8 mM and (b) 2.94 mM.
0.00
0.25
0.50
0.75
1.00
-5 0 5 10 15 20 25 30 35
Ab
sorb
an
ce (
AU
)
Time (min)
pH 3.0
pH 4.0
pH 5.0
0.00
0.25
0.50
0.75
1.00
-5 0 5 10 15 20 25 30 35
Ab
sorb
an
ce (
AU
)
Time (min)
pH 3.0
pH 4.0
pH 5.0
(a)
(b)

87
4.3.2 Optimisation of Process Parameters for the Degradation of Caffeic Acid in
Sugar Solutions
Section 4.3.1 has shown that CaA can be degraded by the Fenton process.
Therefore, the aim of this work was to determine the optimal conditions and develop a
model for the degradation of CaA, both in aqueous and sucrose solutions using the
Fenton process. Response surface methodology, a powerful statistical tool, was used
for the experimental design and development of the model.
Regression Modelling and Statistical Analysis
Central composite design and RSM were used to evaluate the relationships
between the response (i.e., % CaA degradation) and the process parameters (i.e., H2O2
dosage, temperature and sucrose concentration). To achieve this, the experimental
data obtained from the experimental design using the constraints from Table 4.2, were
modelled by the system described through an empirical second-order polynomial
function (Montgomery, 2008):
2
0
1 1 1 1
k k
i ii i ij i ij
i i i i j
y x x x x
(4.2)
where, y predicted response (i.e., % CaA degradation)
β0 constant coefficient
βi linear coefficient
βii quadratic coefficient (for the independent factor i)
βij interaction effect coefficient (between independent factors i and j)
xij independent factors (i.e., process parameters shown in Table 4.2)
k number of process parameters investigated
ε random error

88
The ANOVA results are presented in Table 4.4. The analysis indicated that all
independent variables and some of their interactions were significant and contributed
to the degradation of CaA by Fenton oxidation. The model F-value of 22.28 implies
that the model is significant. There is only a 0.01% chance that a model F-value this
large could occur due to noise.
The model for % CaA degradation was improved after the exclusion of
insignificant coefficients (Table 4.4) is shown as follows:
CaA degradation (%)
y = 39.84 – 8.47A – 14.13B + 1.75C + 5.83D + 5.15E – 2.90F
+ 5.66G + 5.41AB + 3.20AD + 5.01AE – 2.35BD – 2.62BE
– 4.02BF – 1.81BG + 4.09CD – 2.35CF – 1.96DG – 2.55FG
+ 16.65B2
(4.3)
Based on the coefficients in Equation 4.3, it is evident that % CaA degradation
increases with solution pH (C), Fe(II) dosage (D), H2O2 dosage (E) and reaction time
(G) but decreases with initial CaA concentration (A), sucrose concentration (B) and
reaction temperature (F). Amongst the variables, key interaction effects between
initial CaA and sucrose concentrations (AB), CaA and Fe(II) (AD), CaA and H2O2
(AE), sucrose and Fe(II) (BD), sucrose and H2O2 (BE), sucrose and temperature (BF),
sucrose and time (BG), pH and Fe(II) (CD), pH and temperature (CF), Fe(II) and time
(DG) and temperature and time (FG) are also observed.
The response surface quadratic model diagnostics for % CaA degradation is
summarised in Table 4.5. A satisfactory R2 coefficient of 0.87 meant that the model
explains 87% of the variability in the data. The predicted R2 of 0.75 is in reasonable
agreement with the adjusted R2 of 0.83, and a plot of predicted values of % CaA
degradation against the observed values was degenerated as shown in Figure 4.4. As
a reasonable linear relationship was obtained, Equation 4.3 (i.e., the quadratic model)
is suitable for predicting the % degradation of CaA.

89
Table 4.4 Analysis of variance (ANOVA) results for response surface
quadratic model terms for CaA degradation.*
Source SS df Mean sq. F-value p-value Remarks
Model 67,843.69 35 1,938.39 22.28 < 0.0001 Significant
A 9,319.02 1 9,319.02 107.11 < 0.0001 Significant
B 25,955.48 1 25,955.48 298.33 < 0.0001 Significant
C 399.74 1 399.74 4.59 0.0342 Significant
D 4,414.70 1 4,414.70 50.74 < 0.0001 Significant
E 3,446.42 1 3,446.42 39.61 < 0.0001 Significant
F 1,094.64 1 1,094.64 12.58 0.0006 Significant
G 4,162.00 1 4,162.00 47.84 < 0.0001 Significant
AB 3,642.45 1 3,642.45 43.01 < 0.0001 Significant
AC 85.34 1 85.34 0.98 0.3240
AD 1,310.89 1 1,310.89 15.07 0.0002 Significant
AE 3,213.26 1 3,213.26 36.93 < 0.0001 Significant
AF 153.53 1 153.53 1.76 0.1867
BC 87.00 1 87.00 1.00 0.3194
BD 72.75 1 72.75 0.84 0.3624
BE 707.20 1 707.20 8.13 0.0052 Significant
BF 879.30 1 879.30 10.11 0.0019 Significant
BG 2,070.87 1 2,070.87 23.80 < 0.0001 Significant
BH 419.35 1 419.35 4.82 0.0301 Significant
CD 2,145.37 1 2,145.37 24.66 < 0.0001 Significant
CE 91.71 1 91.71 1.05 0.3067
CF 705.64 1 705.64 8.11 0.0052 Significant
CG 84.64 1 84.64 0.97 0.3260
DE 10.29 1 10.29 0.12 0.7315
DF 15.19 1 15.19 0.17 0.6768
DG 489.94 1 489.94 5.63 0.0193 Significant
EF 289.07 1 289.07 3.32 0.0709
EG 50.24 1 50.24 0.58 0.4489
FG 829.72 1 829.72 9.54 0.0025 Significant
A2 88.84 1 88.84 1.02 0.3143
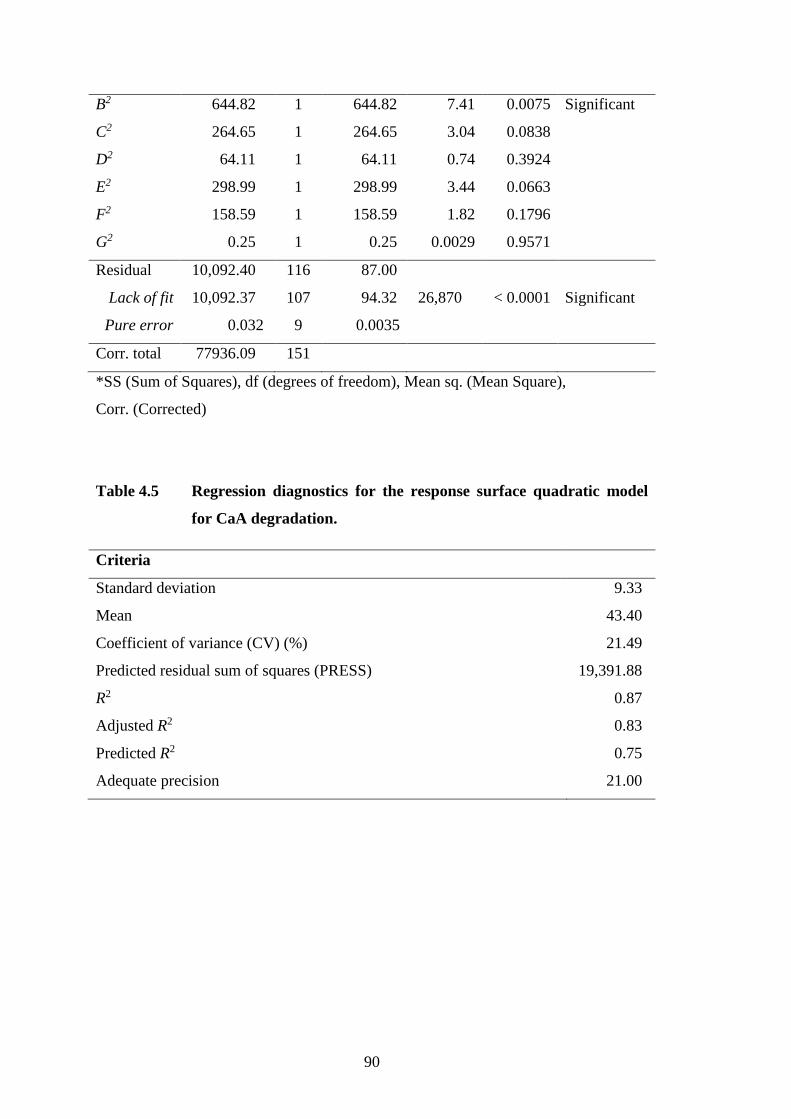
90
B2 644.82 1 644.82 7.41 0.0075 Significant
C2 264.65 1 264.65 3.04 0.0838
D2 64.11 1 64.11 0.74 0.3924
E2 298.99 1 298.99 3.44 0.0663
F2 158.59 1 158.59 1.82 0.1796
G2 0.25 1 0.25 0.0029 0.9571
Residual 10,092.40 116 87.00
Lack of fit 10,092.37 107 94.32 26,870 < 0.0001 Significant
Pure error 0.032 9 0.0035
Corr. total 77936.09 151
*SS (Sum of Squares), df (degrees of freedom), Mean sq. (Mean Square),
Corr. (Corrected)
Table 4.5 Regression diagnostics for the response surface quadratic model
for CaA degradation.
Criteria
Standard deviation 9.33
Mean 43.40
Coefficient of variance (CV) (%) 21.49
Predicted residual sum of squares (PRESS) 19,391.88
R2 0.87
Adjusted R2 0.83
Predicted R2 0.75
Adequate precision 21.00

91
Figure 4.4 Plot of predicted and experimental (actual) values for the
degradation (%) of CaA.
Figure 4.5 Normal probability plot of residuals for fitted model using CaA
degradation data.

92
The residuals from the least squares of fit are important for judging model
adequacy. Through constructing the plot of studentised residuals versus the normal
percentage of probability as shown in Figure 4.5, a check was made for the normality
assumption, which was found to be satisfied for the % CaA degradation as the
residual plots approximated a straight line.
Interaction Effects between Process Parameters
For the graphical interpretation of the interactions between % CaA
degradation and the process parameters, three-dimensional (3D) surface plots of the
regression model (Equation 4.3) were used. These plots are shown in Figures 4.6 and
4.7 and some of the interactions are significant as the curvature of the 3D surfaces
was obvious.
Influence of Initial CaA Concentration
It is observed that, at a given time, a higher initial CaA concentration results in
lower degradation (Figure 4.6a). However, in relation to the reaction rate, a higher
initial CaA concentration will result in a higher degradation rate of CaA. In other
words, increasing the concentration of CaA involves higher uptake of •OH radicals
produced from decomposed H2O2. It is presumed that the degradation efficiency of
CaA in a mixture of other phenolic acids (and other juice components) would
decrease because of competing reactions between •OH radicals and the other phenolic
compounds. This will be further investigated in the next section of this chapter
(cf. Section 4.3.3).
Influence of Sucrose Concentration
The influence of sucrose concentration of the oxidation of CaA was
investigated as shown in Figure 4b and 4c. The addition of sucrose clearly inhibited
the oxidation of CaA. The results show that up to 61% of CaA was degraded at
13% (w/w) sucrose, the concentration typically encountered in factory cane MJs. The
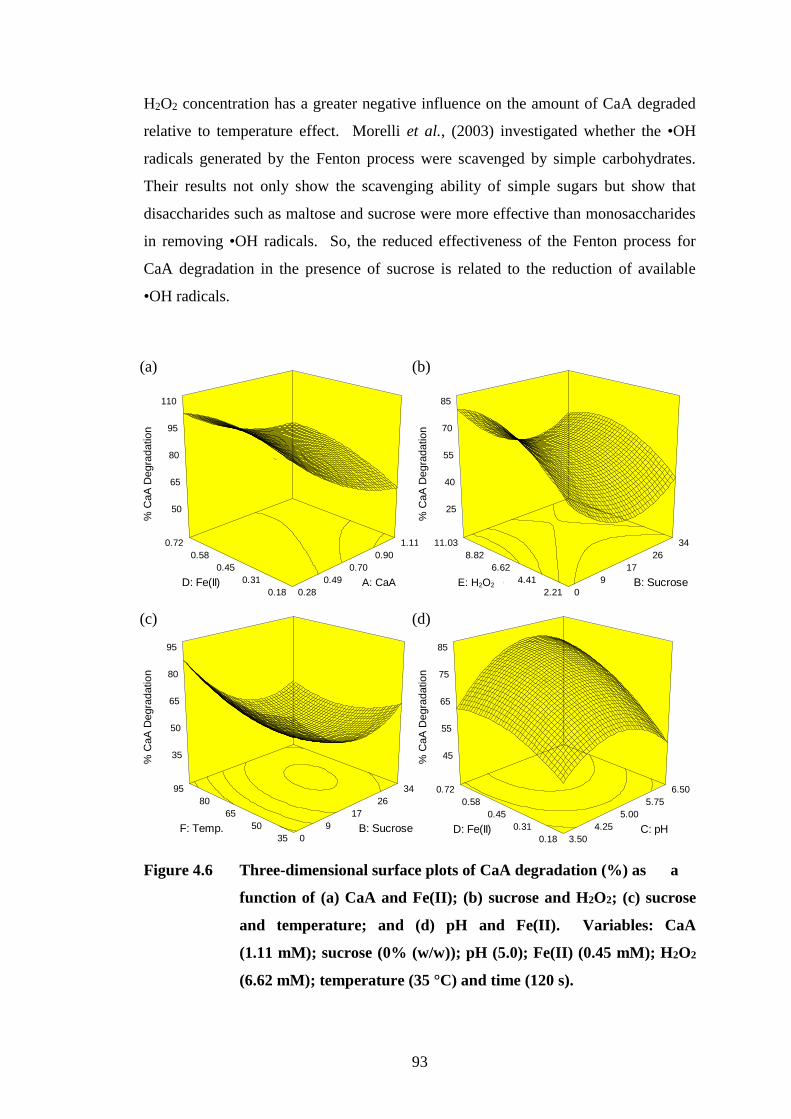
93
H2O2 concentration has a greater negative influence on the amount of CaA degraded
relative to temperature effect. Morelli et al., (2003) investigated whether the •OH
radicals generated by the Fenton process were scavenged by simple carbohydrates.
Their results not only show the scavenging ability of simple sugars but show that
disaccharides such as maltose and sucrose were more effective than monosaccharides
in removing •OH radicals. So, the reduced effectiveness of the Fenton process for
CaA degradation in the presence of sucrose is related to the reduction of available
•OH radicals.
Figure 4.6 Three-dimensional surface plots of CaA degradation (%) as a
function of (a) CaA and Fe(II); (b) sucrose and H2O2; (c) sucrose
and temperature; and (d) pH and Fe(II). Variables: CaA
(1.11 mM); sucrose (0% (w/w)); pH (5.0); Fe(II) (0.45 mM); H2O2
(6.62 mM); temperature (35 °C) and time (120 s).
Design-Expert® Software
% CA Degradation96.8358
0.146016
X1 = A: CAX2 = D: Fe(II)
Actual FactorsB: Sucrose = 0.00C: pH = 5.00E: Peroxide = 6.62F: Temp. = 35.00G: Time = 120.00
0.28
0.49
0.70
0.90
1.11
0.18
0.31
0.45
0.58
0.72
50
65
80
95
110
%
CA
Degra
datio
n
A: CA D: Fe(II)
Design-Expert® Software
% CA Degradation96.8358
0.146016
X1 = B: SucroseX2 = E: Peroxide
Actual FactorsA: CA = 1.11C: pH = 5.00D: Fe(II) = 0.45F: Temp. = 35.00G: Time = 120.00
0
9
17
26
34
2.21
4.41
6.62
8.82
11.03
25
40
55
70
85
%
CA
Degra
datio
n
B: Sucrose E: Peroxide Design-Expert® Software
% CA Degradation96.8358
0.146016
X1 = B: SucroseX2 = F: Temp.
Actual FactorsA: CA = 1.11C: pH = 5.00D: Fe(II) = 0.45E: Peroxide = 6.62G: Time = 120.00
0
9
17
26
34
35
50
65
80
95
35
50
65
80
95
%
CA
Degra
datio
n
B: Sucrose F: Temp.
Design-Expert® Software
% CA Degradation96.8358
0.146016
X1 = C: pHX2 = D: Fe(II)
Actual FactorsA: CA = 1.11B: Sucrose = 0E: Peroxide = 6.62F: Temp. = 35G: Time = 120.00
3.50
4.25
5.00
5.75
6.50
0.18
0.31
0.45
0.58
0.72
45
55
65
75
85
%
CA
Degra
datio
n
C: pH D: Fe(II)
% C
aA
Degra
datio
n
A: CaA
(a)
(c)
(b)
(d)
% C
aA
Degra
datio
n
% C
aA
Degra
datio
n
% C
aA
Degra
datio
n
E: H2O2

94
Influence of Solution pH
Experiments were conducted at initial pH of 3.5, 5.0 and 6.5. Maximum CaA
degradation was observed at pH 4.5–5.5 (Figure 4.6d and 4.7a). This is in line with
the results of Tang and Huang (1996) and Deng (2007). At higher pH values, Fe(III)
produced from Fe(II) oxidation precipitates as oxyhydroxides instead of being
regenerated back to Fe(II). Hence, the total amount of Fe(II) required to catalyse the
decomposition of H2O2 to produce the reactive •OH radicals is reduced (Cortez et al.,
2011). As such, the lower degradation of CaA at pH 6.5 is mainly attributable to the
generation of reduced amounts of •OH radicals in comparison with •OH radicals
generated at pH 3.5–5.5. Also, H2O2 is unstable under alkaline conditions and itself
may rapidly decompose to water and oxygen (Chang et al., 2010).
Influence of Fe(II) and H2O2
The interactive effects of both Fe(II) and H2O2 are shown in the surface plot of
Figure 4.7b. A greater proportion of CaA is degraded with increasing Fe(II) and H2O2
concentrations. The availability of increasing amounts of H2O2 will result in an
increase in the proportion of •OH radicals formed as Fe(II) can readily be generated
by Fe(III). Also, increasing the concentration of Fe(II) will result in an increase in the
amount of H2O2 formed. However, there is an optimum molar ratio of Fe(II) to H2O2
required for the generation of •OH radicals. In this study, the optimum molar ratio of
Fe(II) to H2O2 for the degradation of CaA is 1:13. The value mentioned in the
literature varied from 1:1 to 1:400 as different feed compositions and operating
conditions were examined (Tang and Huang, 1997; Kitis et al., 1999; de Souza et al.,
2006). According to the stoichiometric equation (Equation 4.4), a molar ratio of 1:18
is required for the complete mineralisation of CaA by H2O2.
C9H8O4 + 18H2O2 9CO2 + 22H2O (4.4)
So, the present result confirms the catalytic influence of Fe(II) on CaA
degradation.

95
Figure 4.7 Three-dimensional surface plots of CaA degradation (%) as
function of (a) pH and H2O2; (b) Fe(II) and H2O2; (c) H2O2 and
temperature; and (d) H2O2 and time. Variables: CaA (1.11 mM);
sucrose (0% (w/w)); pH (5.0); Fe(II) (0.45 mM); H2O2 (6.62 mM);
temperature (35 °C) and time (120 s).
Influence of Temperature
The effect of temperature on CaA degradation was studied at 35 °C, 65 °C and
95 °C (Figures 4.6c and 4.7c). Degradation of CaA occurred at a faster rate with
increasing temperature. This is because raising the temperature increased the
decomposition rate of H2O2 and hence the formation of reactive •OH radicals (Sun et
al., 2009). However, the decomposition of H2O2 is not directly linked to the amount
of CaA degraded, because in addition to the formation of •OH radicals, at higher
Design-Expert® Software
% CA Degradation96.8358
0.146016
X1 = C: pHX2 = E: Peroxide
Actual FactorsA: CA = 1.11B: Sucrose = 0D: Fe(II) = 0.45F: Temp. = 35G: Time = 120.00
3.50
4.25
5.00
5.75
6.50
2.21
4.41
6.62
8.82
11.03
30
45
60
75
90 %
CA
Degra
datio
n
C: pH E: Peroxide
Design-Expert® Software
% CA Degradation96.8358
0.146016
X1 = D: Fe(II)X2 = E: Peroxide
Actual FactorsA: CA = 1.11B: Sucrose = 0C: pH = 5.00F: Temp. = 35G: Time = 120.00
0.18
0.31
0.45
0.58
0.72
2.21
4.41
6.62
8.82
11.03
30
45
60
75
90
%
CA
Degra
datio
n
D: Fe(II) E: Peroxide Design-Expert® Software
% CA Degradation96.8358
0.146016
X1 = E: PeroxideX2 = F: Temp.
Actual FactorsA: CA = 1.11B: Sucrose = 0C: pH = 5.00D: Fe(II) = 0.45G: Time = 120.00
2.21
4.41
6.62
8.82
11.03
35
50
65
80
95
30
45
60
75
90
%
CA
Degra
datio
n
E: Peroxide F: Temp.
Design-Expert® Software
% CA Degradation96.8358
0.146016
X1 = E: PeroxideX2 = G: Time
Actual FactorsA: CA = 1.11B: Sucrose = 0C: pH = 5.00D: Fe(II) = 0.45F: Temp. = 35
2.21
4.41
6.62
8.82
11.03
10
38
65
93
120
25
40
55
70
85
%
CA
Degra
datio
n
E: Peroxide G: Time
(a)
(c)
(b)
(d)
% C
aA
Degra
datio
n
% C
aA
Degra
datio
n
% C
aA
Degra
datio
n
% C
aA
Degra
datio
n
E: H2O2
E: H2O2
E: H2O2
E: H2O2

96
temperatures non-reactive species such as H2O and O2 are formed (Rodrigues et al.,
2009a). These counteractive effects are clearly illustrated in Figure 4.6c where
maximum degradation of CaA is obtained at 35 °C. However, the degradation of
CaA at 95 °C is more effective than at 65 °C because of the contributing effect
resulting from the thermal degradation of CaA. It has been reported by Kulik et al.
(2011) that the decarboxylation of CaA and other HCAs (e.g., pCoA and FeA) occurs
at temperatures > 70 °C.
Influence of Time
Figure 4.7d shows that reaction time has a positive effect on the degradation of
CaA. Maximum CaA degradation is achieved within 120 s, as there was no increase
thereafter. The short degradation time obtained in this study implies that the Fenton
oxidation process will be suitably applied in a sugar factory for the degradation of
CaA and other phenolic compounds.
Sugars Analysis
During raw sugar manufacture, sucrose loss through inversion to glucose and
fructose, and degradation to organic acids are minimised to maintain sugar yield by
working at selected pH and temperatures. Sucrose degradation by Fenton oxidation
was evaluated by HPAEC-PAD (cf. Appendices, Table A1.2). The results showed
minimal losses of sucrose (< 0.01%) were present in reactions carried out at 35 °C
after 10 min. Conversion of sucrose to glucose and fructose was observed in
reactions carried out at 65 °C and 95 °C (< 1.0%), the latter showing higher amounts
of reducing sugars. This means that the Fenton process may only find applications in
the sugar manufacturing process at far lower temperatures.

97
Model Validation and Optimisation
Numeric optimisation was used to determine the optimum process parameters
for CaA degradation. The optimum and worst conditions for CaA degradation were
obtained on the basis of the model (Equation 4.3) and the desirability function. The
desirability function is expressed as a numeric value and denotes the degree of
importance in obtaining the desired target response value. To validate the accuracy
and robustness of the predicted model and the reliability of the obtained conditions,
additional experiments were carried out under those conditions, as well as randomly
selected conditions within the ranges investigated. As shown in Table 4.6, the
experimental values of the optimum and worst conditions agree well with the
predicted values.
Table 4.6 Optimised conditions under specified constraints for the
degradation of CaA and model verification.
Experiments*
1 2 3 4
CaA (mM) 1.11 1.11 1.11 1.11
Sucrose (% (w/w)) 0 0 14 34
pH 5.1 5.5 5.1 3.5
Fe(II) (mM) 0.68 0.72 0.64 0.18
H2O2 (mM) 8.88 9.44 8.47 2.21
Temperature (°C) 95 35 95 64
Time (s) 120 120 120 120
Observed degradation (%) 91 80 59 10
Predicted degradation (%) 92 85 62 11
Error 1.00 5.00 3.00 1.00
Standard deviation 0.71 3.53 2.12 0.71
Desirability function 0.95 0.87 0.64 0.89
*Experiments: (1) Optimum; (2) Optimum without thermal degradation; (3) Optimum
with 14% (w/w) sucrose; and (4) worst case.

98
The experimental values of randomly selected conditions are shown in Table
4.7. The low error in the experimental and predicted values indicates good agreement
of the results. The desirability functions obtained with solutions containing sucrose
were comparatively less than the values obtained in the absence of sucrose (Table
4.7).
Table 4.7 Model verification of optimised conditions under randomly
specified constraints for CaA degradation.
Experiments
5 6 7
CaA (mM) 1.11 1.11 1.11
Sucrose (% (w/w)) 0 14 34
pH 5.0 5.0 5.0
Fe(II) (mM) 0.72 0.72 0.36
H2O2 (mM) 4.41 2.21 2.21
Temperature (°C) 35 35 76
Time (s) 120 120 120
Observed degradation (%) 67 31 31
Predicted degradation (%) 69 33 29
Error 2.00 2.00 2.00
Standard deviation 1.41 1.41 1.41
Desirability function 0.84 0.57 0.55
The applicability of the proposed model was also investigated using the raw
sugar processing constraints of a typical Australian sugar cane factory. On the basis
of the colour profile across the sugar manufacturing stage as shown in Figure 2.8
(Eggleston et al., 2003), to reduce colour in raw sugar, colour removal strategies
should be targeted at MJ (i.e., juice prior to incubation), PJ (i.e., prior to liming)
and/or on juices during the evaporation stage. From the information obtained from
the model, sugar process streams operating at temperatures > 95 °C (because of
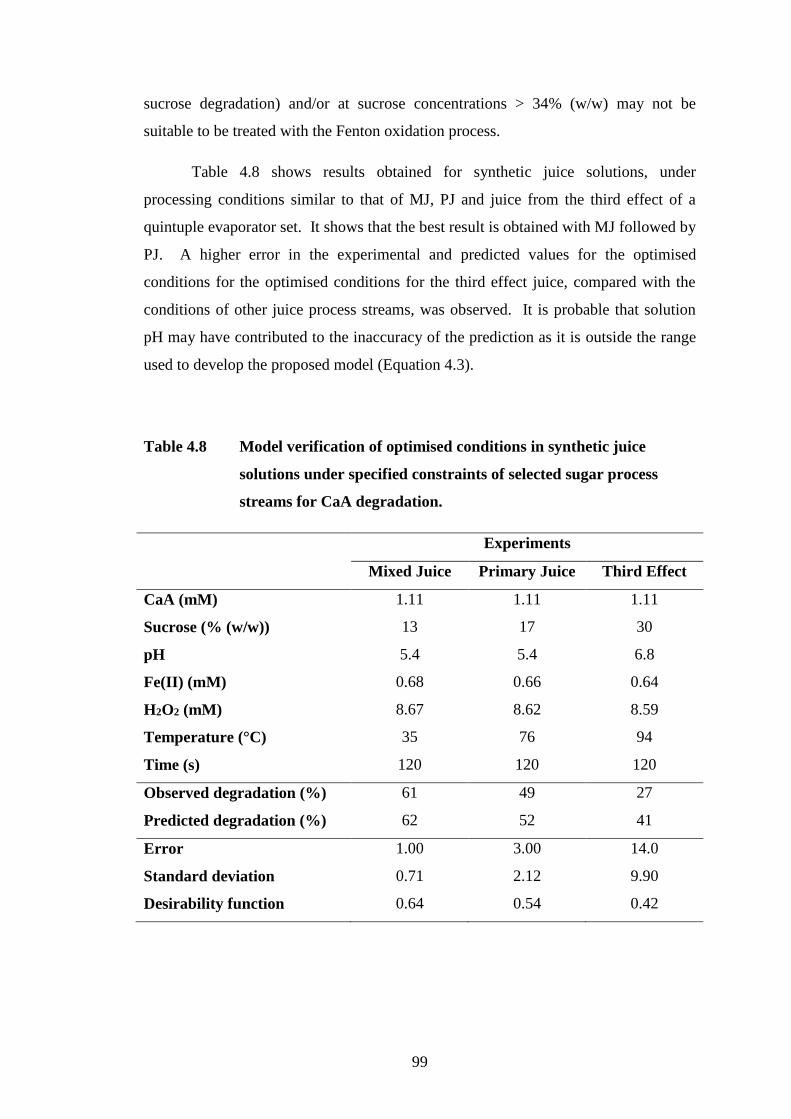
99
sucrose degradation) and/or at sucrose concentrations > 34% (w/w) may not be
suitable to be treated with the Fenton oxidation process.
Table 4.8 shows results obtained for synthetic juice solutions, under
processing conditions similar to that of MJ, PJ and juice from the third effect of a
quintuple evaporator set. It shows that the best result is obtained with MJ followed by
PJ. A higher error in the experimental and predicted values for the optimised
conditions for the optimised conditions for the third effect juice, compared with the
conditions of other juice process streams, was observed. It is probable that solution
pH may have contributed to the inaccuracy of the prediction as it is outside the range
used to develop the proposed model (Equation 4.3).
Table 4.8 Model verification of optimised conditions in synthetic juice
solutions under specified constraints of selected sugar process
streams for CaA degradation.
Experiments
Mixed Juice Primary Juice Third Effect
CaA (mM) 1.11 1.11 1.11
Sucrose (% (w/w)) 13 17 30
pH 5.4 5.4 6.8
Fe(II) (mM) 0.68 0.66 0.64
H2O2 (mM) 8.67 8.62 8.59
Temperature (°C) 35 76 94
Time (s) 120 120 120
Observed degradation (%) 61 49 27
Predicted degradation (%) 62 52 41
Error 1.00 3.00 14.0
Standard deviation 0.71 2.12 9.90
Desirability function 0.64 0.54 0.42

100
The aforementioned results have shown that the Fenton process is reasonably
effective in degrading CaA in sucrose solutions. The reduced effectiveness of the
Fenton process for the degradation of CaA for these systems is related to the reduction
of available •OH radicals by the scavenging action of sucrose (Morelli et al., 2003).
Despite the free radical scavenging ability of sucrose, minimal losses of sucrose
(< 0.01%) were obtained after 2 min of treatment.
4.3.3 Degradation of Hydroxycinnamic Acid Mixtures
The work described in this section builds on the results previously discussed in
Sections 4.3.1 and 4.3.2 by examining the degradation of a mixture of the three main
HCAs present in Australian sugar cane juice (viz., CaA, pCoA and FeA) using the
Fenton process in the presence and absence of sucrose. The results obtained were
used to develop a model for the degradation of each individual HCA within a mixture
as well as a model for total HCA degradation. No previous study has reported on the
optimisation of the degradation process of individual acids within a mixture of other
phenolic acids by the Fenton process, nor examined the interactive effects of various
operating parameters on the degradation of each acid.
Optimal Data Transformation and Test for Normality
Rotatable CCD and RSM were used to investigate the relationships between
the response factors (dependent variables) and the process parameters (independent
variables). In order to achieve this, an empirical second-order polynomial function
identical to Equation 4.2, for each response factor was used to fit the experimental
results obtained.
The assumption used to estimate the response based on the model given in
Equation 4.2 is that the random error terms (ε) for all levels of the independent factors
are distributed normally and independently with a mean zero and a common variance
(Tunali and Batmaz, 2000). Graphical residual analysis was used to verify the
adequacy of different aspects of the model. The residuals from the least squares fit
are important for judging model adequacy. A normal probability plot of residuals

101
based on the experimental data obtained for CaA degradation (Figure 4.8) indicates a
non-linear pattern in the middle of the trend line, and short tails with the first and last
few points showing increasing departure from the trend line.
Figure 4.8 Normal probability plot of residuals for fitted model using CaA
degradation data before power transformation.
To address the non-linearity of these plots, the Box-Cox power transformation
was used to improve linearity. The power transformation on the predicted response
can be described as follows (Box and Cox, 1964):
1 0
ln 0
y
y
y
(4.5)
where λ indicates the power to which all data should be raised. The initial value of λ
in the standard quadratic function (i.e., Equation 4.2) is λ = 1.00.

102
To determine the λ value for each response, a Box-Cox plot was used as a
guide for the selection of the optimised λ value for the power transformation of the
experimental data. Figures 4.9 and 4.10 show the Box-Cox plots for each response
investigated. From the Box-Cox plots for the degradation of pCoA (Figure 4.9b) and
FeA (Figure 4.10a), the recommended λ values ranged from 0.70 to 2.40 and 0.59 to
2.23, respectively at a 95% confidence interval. On the other hand, the λ value range
within the 95% confidence interval were not shown for the degradation data of CaA
(Figure 4.9a) and total HCA (Figure 4.10b), due to the values being outside the
λ = ± 3.00 limits. Hence, the optimum λ values used to transform the CaA and total
HCA degradation were both maximised at λ = 3.00. For pCoA and FeA degradation,
the optimum λ values were determined by observing the minimum of the curve, which
was 1.56 and 1.43 respectively.
Using the optimised λ values, the normal probability plot for each response
surface model shown in Figures 4.11 and 4.12 indicate improved linearity of data
points. There are only a minimal number of data points deviating from the line of fit.
The data for all fitted response surface models show good correspondence to a normal
distribution and validated the normality assumption.

103
Figure 4.9 Box-Cox plots of (a) CaA and (b) pCoA degradation data for the
determination of the optimised power transformed response
surface models.
(a)
(b)

104
Figure 4.10 Box-Cox plots of (a) FeA and (b) total HCA degradation data for
the determination of the optimised power transformed response
surface models.
(a)
(b)

105
Figure 4.11 Normal probability plots of residuals for fitted model using
(a) CaA and (b) pCoA degradation data after power
transformation.
(a)
(b)

106
Figure 4.12 Normal probability plots of residuals for fitted model using
(a) FeA and (b) total HCA degradation data after power
transformation.
(a)
(b)

107
Regression Modelling and Statistical Analysis
On the basis of the sequential model sum of squares (Type I), the power
transformed response surface models for CaA (y1), pCoA (y2), FeA (y3) and total
HCA (y4) degradation were selected based on the highest order polynomial, where the
additional model terms were significant and the models were not aliased. The data
obtained for all four responses fit a quadratic polynomial function.
In each model, there are some unimportant model terms that should be
removed to improve the accuracy of fitting. In this study, the significant coefficients
of the models were identified using ANOVA statistics and stepwise regression.
Stepwise regression involves the selection of the most appropriate independent
variables for a regression model. In this case, a subset of variables from the full set is
determined. The stepwise regression method is a combination of forward selection
and backward elimination (regression) statistical methods. From the full set of
available variables, the stepwise procedure builds or depletes the regression model,
one variable at a time. Sequentially, variables are added (i.e., forward selection) at an
alpha-to-enter significance level of 0.1 and removed (i.e., backward elimination) at an
alpha-to-exit significance level of 0.1 until an added variable does not yield a Student
t–test probability (p–value) of ≤ 0.1. The chosen stepwise alpha range applied to all
four response surface models should result in final models with significant model
terms included at the approximate 95% confidence level.
The ANOVA results for the partial sum of squares (Type III) for the four
response surface reduced quadratic models after stepwise regression are shown in
Tables 4.9–4.12. The analysis indicates that most independent variables and some of
the interactions are significant and contribute to the degradation of the HCAs. The
model F-values of 43.30, 44.14, 88.37 and 19.03 for CaA, pCoA, FeA and total HCA
degradation respectively, imply that the models are significant. There is only a 0.01%
chance that a model F-value this large could occur due to noise. The lack-of-fit
F-values of 1.40 and 1.38 for the pCoA and FeA models in that order imply that the
lack of fit is not significant relative to the pure error. There is a 21% and 23% chance
respectively that the lack-of-fit F-values this large would occur due to noise. Non-
significant lack-of-fit is good as it confirms the predictability of the model. On the
other hand, the lack-of-fit F-values of 34.50 and 2.65 for CaA and total HCA models

108
respectively, imply that the lack-of-fit is significant. A significant lack-of-fit is
undesirable as the proposed models do not fit the data well. This may be because the
experimental data of CaA degradation showed little variation (p < 0.0001) under the
constraints of the experimental design compared to pCoA and FeA degradation data.
Therefore, it also affected the lack-of-fit of the total HCA degradation model
(p = 0.0138). Despite this, further ANOVA statistics (discussed later) demonstrate
that the data is suitable for the modelling and prediction of CaA and total HCA
degradation.
Model terms with a p–value < 0.0500 indicate model terms are significant at
the 95% confidence level. Values > 0.1000 indicate the model terms are insignificant
at the 90% confidence level and are removed from the proposed models via stepwise
regression, with the exception of the first-order temperature model term for all
models. Temperature was regarded as statistically insignificant but was added to all
models to make each model hierarchical. In other words, parent (i.e., first-order)
model terms are added to the model to complete the family of any significant higher-
order (i.e., second-order) model terms.
The independent variables in the models were initial total HCA concentration,
initial sucrose concentration, solution pH and reaction temperature; and were coded A,
B, C and D respectively. The final empirical quadratic equations in terms of coded
factors for each response are as follows:
CaA degradation (%)
(y1)3 = 7.459 × 10⁵ – 22685.04A + 87649.64B –1.893 × 10⁵C
– 2787.88D + 38875.43BC + 25613.66BD – 48866.47B2
– 55229.82C2 + 21771.66D2
(4.6)
pCoA degradation (%)
(y2)1.56 = 452.03 – 25.39A – 112.96B + 56.46C – 9.29D + 25.34AB
+ 24.11CD + 51.51B2 – 13.11C2
(4.7)

109
Table 4.9 Results of ANOVA for model terms of the response surface
reduced quadratic model for CaA degradation.*
Source SS df Mean sq. F-value p-value Remarks
Model 2.49 × 10¹² 9 2.77 × 10¹¹ 43.30 < 0.0001 Significant
A 2.47 × 10¹⁰ 1 2.47 × 10¹⁰ 3.87 0.0556
B 3.69 × 10¹¹ 1 3.69 × 10¹¹ 57.74 < 0.0001 Significant
C 1.72 × 10¹² 1 1.72 × 10¹² 269.21 < 0.0001 Significant
D 3.73 × 1008 1 3.73 × 1008 0.058 0.8101 Insignificant
BC 4.84 × 10¹⁰ 1 4.84 × 10¹⁰ 7.57 0.0086 Significant
BD 2.10 × 10¹⁰ 1 2.10 × 10¹⁰ 3.29 0.0766
B2 1.15 × 10¹¹ 1 1.15 × 10¹¹ 17.95 0.0001 Significant
C2 1.46 × 10¹¹ 1 1.46 × 10¹¹ 22.93 < 0.0001 Significant
D2 2.28 × 10¹⁰ 1 2.28 × 10¹⁰ 3.56 0.0657
Residual 2.81 × 10¹¹ 44 87.00
Lack of fit 2.66 × 10¹¹ 15 94.32 34.50 < 0.0001 Significant
Pure error 1.49 × 10¹⁰ 29 0.0035
Corr. total 2.77 × 10¹² 53
Criteria
Standard deviation 8.00 × 1004
Mean 6.73 × 1005
CV (%) 11.88
PRESS 4.54 × 10¹¹
R2 0.90
Adjusted R2 0.88
Predicted R2 0.84
Adequate precision 23.28
*SS (Sum of Squares), df (degrees of freedom), Mean sq. (Mean Square),
Corr. (Corrected)

110
Table 4.10 Results of ANOVA for model terms of the response surface
reduced quadratic model for pCoA degradation.*
Source SS df Mean sq. F-value p-value Remarks
Model 1.00 × 10⁶ 8 1.25 × 10⁵ 44.14 < 0.0001 Significant
A 3.09 × 10⁴ 1 3.09 × 10⁴ 10.90 0.0019 Significant
B 5.49 × 10⁵ 1 5.49 × 10⁵ 193.36 < 0.0001 Significant
C 1.53 × 10⁵ 1 1.53 × 10⁵ 53.93 < 0.0001 Significant
D 4.14 × 10³ 1 4.14 × 10³ 1.46 0.2333 Insignificant
AB 2.05 × 10⁴ 1 2.05 × 10⁴ 7.24 0.0100 Significant
CD 1.81× 10³ 1 1.81× 10³ 6.56 0.0139 Significant
B2 1.10 × 10⁵ 1 1.10 × 10⁵ 38.77 0.0001 Significant
C2 8.78 × 10³ 1 8.78 × 10³ 3.09 0.0855
Residual 1.25 × 10⁵ 44 87.00
Lack of fit 5.55 × 10⁴ 16 94.32 1.40 0.2121 Insignificant
Pure error 6.94 × 10⁴ 28 2.48 × 10³
Corr. total 1.13E+06 52
Criteria
Standard deviation 53.27
Mean 487.18
CV (%) 10.93
PRESS 1.82 × 10⁵
R2 0.89
Adjusted R2 0.87
Predicted R2 0.84
Adequate precision 27.21
*SS (Sum of Squares), df (degrees of freedom), Mean sq. (Mean Square),
Corr. (Corrected)

111
Table 4.11 Results of ANOVA for model terms of the response surface
reduced quadratic model for FeA degradation.*
Source SS df Mean sq. F-value p-value Remarks
Model 3.30 × 10⁵ 9 3.67 × 10⁴ 88.37 < 0.0001 Significant
A 1.03 × 10⁴ 1 1.03 × 10⁴ 24.74 < 0.0001 Significant
B 2.02 × 10⁵ 1 2.02 × 10⁵ 485.42 < 0.0001 Significant
C 3.16 × 10⁴ 1 3.16 × 10⁴ 76.07 < 0.0001 Significant
D 528.86 1 528.86 1.27 0.2656 Insignificant
AB 1.92 × 10⁴ 1 1.92 × 10⁴ 46.22 < 0.0001 Significant
BD 2.70 × 10³ 1 2.70 × 10³ 6.49 0.0146 Significant
CD 1.24 × 10³ 1 1.24 × 10³ 2.98 0.0915
B2 2.89 × 10⁴ 1 2.89 × 10⁴ 69.46 < 0.0001 Significant
D2 4.57 × 10³ 1 4.57 × 10³ 11.01 0.0019 Significant
Residual 1.74 × 10⁴ 42 415.39
Lack of fit 7.57 × 10³ 15 504.72 1.38 0.2262 Insignificant
Pure error 9.88 × 10³ 27 365.76
Corr. total 3.48 × 10⁵ 51
Criteria
Standard deviation 20.38
Mean 308.78
CV (%) 6.60
PRESS 2.81 × 10⁴
R2 0.95
Adjusted R2 0.94
Predicted R2 0.92
Adequate precision 37.35
*SS (Sum of Squares), df (degrees of freedom), Mean sq. (Mean Square),
Corr. (Corrected)

112
Table 4.12 Results of ANOVA for model terms of the response surface
reduced quadratic model for total HCA degradation.*
Source SS df Mean Sq. F-value p-value Remarks
Model 2.17 × 10¹¹ 10 2.17 × 10¹⁰ 19.03 < 0.0001 Significant
A 2.46 × 10¹⁰ 1 2.46 × 10¹⁰ 21.57 < 0.0001 Significant
B 1.16 × 10¹¹ 1 1.16 × 10¹¹ 102.20 < 0.0001 Significant
C 5.41 × 1009 1 5.41 × 1009 4.75 0.0349 Significant
D 8.13 × 1008 1 8.13 × 1008 0.71 0.4028 Insignificant
AB 1.11 × 10¹⁰ 1 1.11 × 10¹⁰ 9.79 0.0032 Significant
BC 9.27 × 1009 1 9.27 × 1009 8.14 0.0067 Significant
CD 6.14 × 1009 1 6.14 × 1009 5.39 0.0252 Significant
B2 4.20 × 1009 1 4.20 × 1009 3.68 0.0617
C2 1.89 × 10¹⁰ 1 1.89 × 10¹⁰ 16.62 0.0002 Significant
D2 6.11 × 1009 1 6.11 × 1009 5.37 0.0254 Significant
Residual 4.78 × 10¹⁰ 42 415.39
Lack of Fit 2.72 × 10¹⁰ 14 504.72 2.65 0.2262 Significant
Pure Error 2.06 × 10¹⁰ 28 365.76
Corr. total 2.64 × 10¹¹ 52
Criteria
Standard Deviation 3.37 × 1004
Mean 2.68 × 1005
CV (%) 12.58
PRESS 8.04 × 10¹⁰
R2 0.82
Adjusted R2 0.78
Predicted R2 0.70
Adequate Precision 15.61
*SS (Sum of Squares), df (degrees of freedom), Mean sq. (Mean Square),
Corr. (Corrected)

113
FeA degradation (%)
(y3)1.43 = 274.79 – 14.82A – 69.60B + 25.99C – 3.36D + 24.97AB
– 9.36BD + 6.34 CD + 26.42B2 + 9.46D2
(4.8)
Total HCA degradation (%)
(y4)3
= 2.670 × 10⁵ – 22911.69A – 49869.11B – 10752.76C
– 4168.93D + 19018.79AB + 17344.68BC +14113.81CD
+ 9351.73B2 – 19861.54C2 + 11289.82D2
(4.9)
The predicted R2 values of all response surface models are in reasonable
agreement with the adjusted R2 values, which show that the fitted models are
adequate. The accuracy of the models is shown in Figures 4.13 and 4.14, which
compares the predicted responses against the experimental data. As reasonable linear
relationships were obtained, Equations 4.6–4.9 are suitable for predicting the
degradation of CaA, pCoA, FeA and total HCA, respectively.
On the basis of the coefficients of the first-order model terms in Equations
4.6–4.9, it is evident that the degradation efficiency of all HCAs decreases with initial
total HCA concentration (A). Sucrose concentration (B) is the most influential
parameter with the highest coefficient in all equations and shows a negative influence
in pCoA and FeA degradation but a positive influence for CaA degradation. Also, the
degradation efficiency of pCoA and FeA increases with solution pH (C) but the
opposite is observed for CaA. Temperature (D) has a negative effect on all responses
but its minuscule coefficient has little effect on the respective response. Hence, this
model term is statistically insignificant and was only included in all of the equations
to make the models hierarchical.
For the degradation of mixtures (i.e., the acids combined), there are strong
interactions between total HCA concentration and sucrose (AB); sucrose and pH (BC);
and pH and temperature (CD).

114
Figure 4.13 Plots of predicted response and experimental (actual) values for
the degradation (%) of (a) CaA and (b) pCoA.
(a)
(b)

115
Figure 4.14 Plots of predicted response and experimental (actual) values for
the degradation (%) of (a) FeA and (b) total HCA.
(a)
(b)

116
Perturbation Analysis
Perturbation plots were analysed in order to further identify the most
influential variables on the degradation of each HCAs investigated in this study
(Figure 4.15). Sucrose concentration and solution pH appeared to be the most
influential parameters. Temperature showed an insignificant effect as expected,
whilst the initial total HCA concentration exhibited a consistent effect for the
degradation of each HCA.
As shown in Figure 4.15, the higher the initial total HCA concentration, the
lower the amount of each HCA degraded. The reason behind the decrease in
degradation efficiency is simply due to a higher uptake of •OH radicals by the
increased amounts of HCA molecules.
The presence of sucrose significantly affected the degradation efficiency of the
HCAs. The fate of sucrose during the degradation process was evaluated by HPAEC-
PAD (cf. Appendices, Table A1.3). The results showed up to 0.01% sucrose loss due
to complete mineralisation, as no glucose and/or fructose are detected. This is related
to the effective scavenging ability of sucrose in removing •OH radicals (Morelli et al.,
2003), and accounts for the decrease in degradation efficiency with increasing in
sucrose concentration for pCoA and FeA (Figures 4.15b and 4.15c), but not for CaA
(Figure 4.15a). The reason for the increased degradation efficiency of CaA with
increasing sucrose concentration, may be related as will be shown in the next
subsection, to a strong association between CaA and sucrose which increased with
increasing sucrose concentration.
Degradation of CaA decreases with increasing pH whereas the opposite was
observed for pCoA and FeA degradation. The reason for the results obtained with
pCoA and FeA is not known but may be related to the various species that exist in the
acid-base equilibria that influences the logarithmic acid dissociation constants (pKa’s)
of these acids.

117
Figure 4.15 Perturbation plots for the degradation (%) of (a) CaA; (b) pCoA
and (c) FeA. Coded values are shown for each factor: total
HCA (A); sucrose (B); pH (C) and temperature (D); and refer to
actual values listed in Table 4.3.
(a)
(b)
(c)

118
Complex Formation
In order to obtain insights into the apparent differences in the behaviour
among the three HCAs, the UV/Vis spectra of the individual acids, mixtures of each
acid with Fe(II) and mixtures of each acid with Fe(II) and sucrose at pH 4.0 to 6.0
were obtained. The UV/Vis spectra obtained with mixtures of FeA or mixtures of
pCoA were not dissimilar to that of their corresponding acids. However, as Figure
4.16 shows, there is a significant difference between the spectra of CaA with Fe(II)
and those spectra without Fe(II). In these acidic conditions, Fe(II) and Fe(III) will be
present in equilibrium (Morgan and Lahav, 2007). The change in the profile of the
spectra is likely due to complexation between Fe(III) and CaA, as shown in the
spectra; similar to that obtained for aluminium-caffeic acid in aqueous acidic
solutions by Cornard and co-workers (2006). In fact, Hynes and O’Coinceanainn
(2004) have reported the formation of 1:1 complex between Fe(III) and CaA at pH
between 1.0 and 2.5 (Scheme 4.2). Moreover, previous studies have shown the
accelerated decomposition of H2O2 to •OH radicals by Fe(III) complexes of analogous
phenolic acids (Rivas et al., 2002).
OH
OH
OH
O
[Fe(H2O)5(OH)]2+ O
O
OH
O
Fe + H
Scheme 4.2
There is a shape drop in peak intensities at pH ≥ 5.0 for CaA and Fe(III)
mixtures (Figure 4.16b), likely to be associated with increased complex formation due
to increasing amounts of caffeate ions with pH rise. As the pKa1 of CaA is 4.38, there
is an increasing amount of deprotonation with increasing pH (Adams et al., 2002).
The drop in intensity may also be due to the removal of CaA by adsorbing onto the
iron precipitate formed under these pH conditions. The spectra of Figure 4.16b also
show that there was no change in the shape of the curves with increasing pH, so it is
probable that only one type of complex is formed between Fe(III) and CaA under the
conditions investigated.

119
Figure 4.16 Effect of pH (pH 4.0–6.0) on the absorption spectra of CaA
(0.055 mM) at 25 °C: (a) in the absence and (b) in the presence of
Fe(II) (0.04 mM).
0
5
10
15
20
25
200 250 300 350 400
Mo
lar A
bso
rp
tiv
ity
(L
mol–
1cm
–1)
(x 1
03)
Wavelength (nm)
pH 4.0
pH 4.5
pH 5.0
pH 5.5
pH 6.0
0
5
10
15
20
25
200 250 300 350 400
Mo
lar A
bso
rp
tiv
ity
(L
mol–
1cm
–1)
(x 1
03)
Wavelength (nm)
pH 4.0
pH 4.5
pH 5.0
pH 5.5
pH 6.0
(a)
(b)

120
The CaA mixtures were further characterised using ATR-FTIR spectroscopy.
From the FTIR data, a number of bands were used to monitor changes in CaA as a
result of the presence of Fe(II), and the presence of Fe(II) and sucrose. The spectral
bands of CaA and sucrose solutions, and CaA mixtures containing Fe(II) or Fe(II) and
sucrose are given in Table 4.13. Spectral bands were assigned based on literature data
for CaA (Sánchéz-Cortés and García-Ramos, 1999; Dürüst et al., 2001; Machado et
al., 2009; Świsłocka, 2013), similar phenolic acids (Dobson and McQuillan, 2000;
Hanna and Quilès, 2011; Kalinowska et al., 2011; Świsłocka et al., 2012) and sucrose
(Vasko et al., 1971; Huvenne et al., 1981; Kodad et al., 1994; Kačuráková and
Mathlouthi, 1996; Max and Chapados, 2001). Bands attributable to aromatic ring
vibrations are numbered using the Wilson notation adapted by Varsányi (1974). The
main differences between the spectrum of CaA and that of Fe(II)–CaA are shown in
Figure 4.17. The ν(CC)ar aromatic bands (i.e., 8a and 19a) that occur at 1554 cm–1
and 1483 cm–1 (Świsłocka, 2013) are of increased intensity in the Fe(II)–CaA mixture
than that of CaA (Figure 4.17). The peak at ~1386 cm–1 associated with
ν(CC) + β(OH)ar (i.e., 14) (Świsłocka, 2013) is also of higher intensity in the spectrum
containing both Fe(II) and CaA. These increases in intensity may be attributed to
complex formation between the aromatic –OH group in CaA and Fe (III) (Hanna and
Quilès, 2011). The peak at 1275 cm–1 attributable to ν(C–OH) for CaA (Yost et al.,
1990; Machado et al., 2009) has shifted to a lower wavelength of 1265 cm–1 with
increase in intensity. This is a further confirmation of a strong association between
Fe(III) and CaA and that the complex formed is between Fe(III) and the phenolic
hydroxyl group (Rivas et al., 2002; Hynes and O'Coinceanainn, 2004). There was no
change in the band at 1672 cm–1 associated with ν(C=O) implying no evidence of
Fe(III) bonding to the carboxylic acid group of CaA. Previous works have shown that
with other phenolic acids, linkages are formed with their carboxylic acid groups
(Hanna and Quilès, 2011; Kalinowska et al., 2011; Świsłocka et al., 2012).
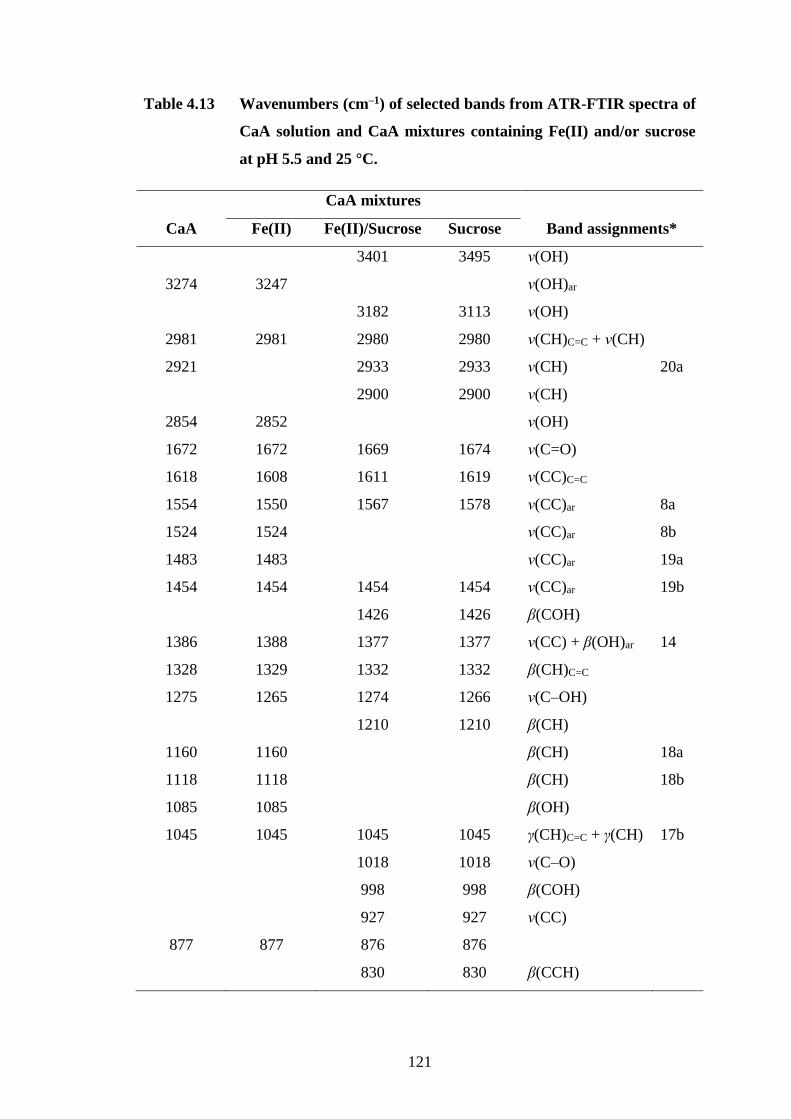
121
Table 4.13 Wavenumbers (cm–1) of selected bands from ATR-FTIR spectra of
CaA solution and CaA mixtures containing Fe(II) and/or sucrose
at pH 5.5 and 25 °C.
CaA mixtures
CaA Fe(II) Fe(II)/Sucrose Sucrose Band assignments*
3401 3495 ν(OH)
3274 3247 ν(OH)ar
3182 3113 ν(OH)
2981 2981 2980 2980 ν(CH)C=C + ν(CH)
2921 2933 2933 ν(CH) 20a
2900 2900 ν(CH)
2854 2852 ν(OH)
1672 1672 1669 1674 ν(C=O)
1618 1608 1611 1619 ν(CC)C=C
1554 1550 1567 1578 ν(CC)ar 8a
1524 1524 ν(CC)ar 8b
1483 1483 ν(CC)ar 19a
1454 1454 1454 1454 ν(CC)ar 19b
1426 1426 β(COH)
1386 1388 1377 1377 ν(CC) + β(OH)ar 14
1328 1329 1332 1332 β(CH)C=C
1275 1265 1274 1266 ν(C–OH)
1210 1210 β(CH)
1160 1160 β(CH) 18a
1118 1118 β(CH) 18b
1085 1085 β(OH)
1045 1045 1045 1045 γ(CH)C=C + γ(CH) 17b
1018 1018 ν(C–O)
998 998 β(COH)
927 927 ν(CC)
877 877 876 876
830 830 β(CCH)

122
Figure 4.17 Normalised ATR-FTIR spectra of CaA solutions at 25 °C after
subtraction of acetate buffer (pH 5.5): (a) in the absence and (b) in
the presence of Fe(II).
The spectrum for CaA, Fe (II) and sucrose (Figure 4.18) show that the broad
band that occurs at 3495 cm–1 ν(OH) (Max and Chapados, 2001) which is associated
with sucrose has shifted by 94 cm–1 to a lower wavenumber of 3401 cm–1. This
implies hydrogen-bonding interactions between CaA, Fe(III) and sucrose and could
well explain why CaA degradation increases with increasing sucrose concentration
(Gilfillan et al., 2012). These interactions provide supporting evidence of the
differences in the degradation behaviour of CaA and the other two HCAs (viz., pCoA
and FeA).
80010001200140016001800
Ab
sorb
an
ce (
Arb
itra
ry U
nit
s)
Wavenumber (cm–1)
1483
cm–
1
1386
cm–
1
15
54
cm–
1
16
72
cm
–1
12
65
cm–
1
(a)
(b)

123
Figure 4.18 Normalised ATR-FTIR spectra of CaA solutions containing
sucrose at 25 °C after subtraction of acetate buffer (pH 5.5): (a) in
the absence and (b) in the presence of Fe(II).
Response Surface Analysis
Graphical representations of the regression model in the form of 3D surface
plots were used to provide a pictorial view of the interactions between the
independent variables on total HCA degradation. These plots are shown in Figure
4.19, where two independent variables were varied within the experimental ranges
investigated while the remaining variables were kept constant. The interactions are
significant as the curvature of the surfaces is obvious.
24002800320036004000
Ab
sorb
an
ce (
Arb
itra
ry U
nit
s)
Wavenumber (cm-1)
34
95
cm
–1
34
01
cm
–1
Δν = 94 cm–1
(a)
(b)

124
Figure 4.19 Three-dimensional surface plots of total HCA degradation (%) as
a function of (a) total HCA and sucrose; (b) sucrose and pH; and
(c) pH and temperature. Variables: total HCA (155 mg/L);
sucrose (7.5% (w/w)); pH (5.0) and temperature (35 °C).
Design-Expert® SoftwareOriginal Scale(% Total HCA Degradation) 3̂
76.7742
49.6923
X1 = A: Total HCAX2 = B: Sucrose
Actual FactorsC: pH = 5.00D: Temperature = 35.00
65
88
110
133
155
4
6
8
9
11
60
63
66
69
72
%
Tota
l HC
A D
egra
datio
n
A: Total HCA B: Sucrose
Design-Expert® SoftwareOriginal Scale(% Total HCA Degradation) 3̂
76.7742
49.6923
X1 = B: SucroseX2 = C: pH
Actual FactorsA: Total HCA = 155D: Temperature = 35.00
4
6
8
9
11 4.75
4.88
5.00
5.13
5.25
59
61
63
65
67
%
Tota
l HC
A D
egra
datio
n
B: Sucrose C: pH
Design-Expert® SoftwareOriginal Scale(% Total HCA Degradation) 3̂
76.7742
49.6923
X1 = C: pHX2 = D: Temp.
Actual FactorsA: Total HCA = 155.00B: Sucrose = 7.50
4.75
4.88
5.00
5.13
5.25 31
34
38
41
44
60
61
62
63
65
%
Tota
l HC
A D
egra
datio
n
C: pH D: Temp.
(a)
(b)
(c)

125
The variables of sucrose concentration and initial total HCA concentration
were varied as shown in Figure 4.19a, whilst the other variables, namely pH and
temperature were kept constant at 5.0 and 35 °C respectively. These fixed values
were chosen as they were similar to that typical of process sugar cane juice (Nguyen
and Doherty, 2012). The total HCA degradation efficiency decreases with increasing
sucrose concentration and the initial total HCA concentration. Increasing the initial
total HCA concentration did not significantly decrease the degradation efficiency of
the HCAs. This can be seen by both the coefficient of the first- and second-order
model term (Equation 4.9) for total HCA concentration (i.e., A) and in Figure 4.19a
where there was only a 5.9% discrepancy between 65 mg/L and 155 mg/L of initial
total HCA at 3.75% (w/w) sucrose. This discrepancy is not noticeable at higher
sucrose concentrations. It can be said from these observations, that the optimal
Fenton dosage is capable of degrading higher concentrations of HCAs and other
components (similar to that of HCAs) than at the highest concentration studied (i.e., >
200 mg/L).
Sucrose concentration showed a significant effect on the degradation of the
HCAs (Figure 4.19b). Degradation increases smoothly with an increase in pH from
4.75 to 5.0 but decreases gradually when the pH exceeds 5.0, at any given
concentration of sucrose. The negative effect on total HCA degradation at lower pH
than the optimal may be attributed to the scavenging effect of H+ or •OH radicals
which can inhibit the reduction of Fe(III) to Fe(II) and prevent the further generation
of •OH radicals (Rivas et al., 2005; Deng, 2007). On the other hand, the negative
effect at pH above the optimal may be attributable to the deactivation of the Fe(II)
catalyst with the formation of Fe(III) oxyhydroxide in lieu of being regenerated back
to Fe(II) (Bigda, 1995). The formation of Fe(III) oxyhydroxides in the present study
was confirmed by analysing the precipitates obtained at pH 5.5 and 25 °C, by XRD
(Table 4.14). The d-spacing values 6.21 Å, 3.28 Å, 2.46 Å and 2.36 Å correspond to
lepidocrocite (i.e., Fe(III) oxide hydroxide), FeO(OH), while the peaks at 5.20 Å and
2.04 Å is associated with CaA (Dong et al., 2012). The formation of oxyhydroxide is
derived from the following reaction equation (Equation 4.10):
Fe2+ + ¼O2 + 2OH– FeOOH + ½H2O (4.10)

126
Table 4.14 X-ray diffraction data of the precipitate formed between CaA and
Fe(II) at pH 5.5 and 25 °C.
d-spacing (Å)
Intensity (counts) Precipitate FeO(OH)*
126.31 6.2164 6.2580
80.550 5.2003
204.48 3.2821 3.2933
161.52 2.4644 2.4737
138.89 2.3609 2.3635
543.59 2.0409
78.600 1.9320 1.9365
36.960 1.7282 1.7350
28.340 1.5252 1.5360
112.57 1.2941 1.2990
*Based on a FeO(OH) reference pattern (ICDD PDF card 04-010-4300).
The reduction in degradation effectiveness at pH above the optimal, in
addition could be because H2O2 is relatively unstable and may rapidly decompose to
H2O and O2 (Kuo, 1992; Chang et al., 2010). Thus at pH below or above the optimal,
the amounts of Fe(II) and/or H2O2 required to catalyse the Fenton oxidation process is
reduced.
Figure 4.19c shows the interaction effects of pH and temperature on HCA
degradation. The non-significance of the temperature variable is evident by the
narrow range on the response axis (i.e., 57–64%). Despite this, the degradation trend
on the HCAs in terms of temperature is still observable. Increasing temperature leads
to less degradation of the HCAs. The decomposition of H2O2 by Fe(II) is not directly
linked to the amount of HCA degraded. In addition to the formation of •OH radicals
by the Fenton process, non-reactive species such as H2O and O2 are also formed at
higher temperatures (> 40 °C) (Rodrigues et al., 2009b). The Fenton process was the
only contributor to the degradation of HCAs as there was no thermal decomposition
of any of the HCAs within the temperature range studied (25–50 °C).

127
Process Optimisation and Validation
Numerical optimisation was performed on the basis of the desirability function
to determine the optimum process parameters for the degradation of the HCAs. The
desirability function is expressed numerically from a scale of 0 to 1 (lowest to highest
desirability) and denotes the degree of importance in obtaining the desired response
value (Harrington, 1965). A desirability function value can be constructed by using
five different goal optimisation constraints: none, maximum, minimum, target and
within range. On the basis of the fitted quadratic models, an optimised response value
can then be predicted by using the chosen goal optimisation criteria that maximises
the desirability function. In order to simultaneously optimise numerous responses
(i.e., multi-response optimisation), the desirability function values for each response
(i.e., CaA, pCoA and FeA) are combined into an overall desirability function by
computing their geometric mean of different desirability values, as shown in Equation
4.11 (Derringer and Suich, 1980).
11
1 2 3 1
1
( ... )n n
nn
i
D d d d d d
(4.11)
where, D overall desirability function
di desirability of the response
n number of responses investigated
In order to confirm the accuracy and robustness of the predicted models and
assess its reliability to predict the (%) degradation of HCAs, additional experiments
were carried out under those conditions, as well as selected conditions of process
streams close to that of a typical Australian sugar mill.
For this study, the desirability functions for the three individual HCA
degradation models were combined into one value and compared to the desirability
function of the total HCA model (Table 4.15). The combined desirability function
values of the three individual HCA models for the experiments were relatively close
to the desirability values produced for the single total HCA degradation model. This

128
indicates that there is little variation between the simultaneously predicted values of
each HCA degraded and the predicted value for the total HCA degraded.
Table 4.15 Optimised conditions under specified constraints for the
degradation of total HCA (200 mg/L) and model verification.*
Experiments
Water Worst
case
Synthetic
juice 1
Synthetic
juice 2
Sucrose (% (w/w)) 0 14.00 13.00 21.00
pH 4.7 4.5 5.4 4.9
Temperature (°C) 25 40 36 30
CaA degradation (%) 92 (90) 87 (90) 73 (72) 78 (68)
pCoA degradation (%) 69 (68) 33 (37) 48 (52) 52 (75)
FeA degradation (%) 70 (64) 40 (46) 51 (56) 54 (84)
Total HCA degradation (%) 77 (73) 53 (49) 57 (58) 61 (67)
Desirability
Combined models 0.720 0.542 0.383 0.655
Total HCA degradation model 0.743 0.632 0.332 0.621
*Values in parentheses indicate model predicted % degradation for each
individual/total HCA model. Measurements were conducted in triplicate.
RSD was < 5.0%.
As shown in Table 4.14 the experimental and predicted values (in parentheses)
for the degradation of each and the total of the HCAs, under specified constraints.
The optimum conditions for maximum degradation of HCAs (200 mg/L) using the
Fenton process (0.5 mM Fe(II) and 7.5 mM H2O2) are 0% (w/w) sucrose
(i.e., aqueous), pH 4.7 and 25 °C. Under these conditions 92% CaA, 69% pCoA and
70% FeA was degraded (i.e., total HCA degradation of 77%). The experimental
values of the optimum conditions agree well with the predicted values deduced from
each of the four models. The low error in the experimental and predicted values
indicates good agreement of the results. The experimental values obtained for the
129
worst conditions were also in good agreement with the predicted values. The good
agreement between values is attributable to the high combined desirability function
value. It is worth mentioning that the sum of the predicted degradation values of the
individual HCA degradation models (i.e., CaA, pCoA and FeA) is not equal to the
predicted total HCA degradation values. Hence, the individual degradation models
should be only used as a guide to predict the degradation of the total HCAs present in
a mixture.
The best results for the synthetic juices are obtained with solutions having
similar sucrose content and operating temperature as factory MJ (synthetic juice 1)
followed by factory No. 1 mill juice (i.e., juice expressed from the first mill of a
quintuple set of mills) (synthetic juice 2). Despite a low desirability function value
predicted under the synthetic juice 1 conditions, the experimental results were in close
agreement with the predicted values for all four models. The lower desirability may
be due to some of the constraints that were not close to any of the design points of the
CCD. On the other hand, a higher error was observed for synthetic juice 2, despite a
reasonable desirability value. In addition, the experimental values obtained for pCoA
and FeA degradation were significantly lower than the predicted values. It is highly
probable therefore, that the presence of sucrose may have contributed to the
inaccuracy of this prediction as its concentration was outside the range used to
develop the proposed models. Therefore, it is not recommended to use constraints
outside the ranges studied for multi-response optimisation, as the responses are all
dependent on each other.
From these results, the Fenton process can successfully be used to degrade
HCAs (i.e., colour precursor compounds) under the operating conditions in a raw
sugar manufacturing factory.

130
4.4 Summary
In this chapter, the experimental procedures and statistical treatment of
experimental results for the degradation of three phenolic acids (CaA, pCoA, and
FeA) is described in great detail. For each selected acid there are up to seven
independent variables considered, with conditions covering the normal ranges
experienced in sugar cane juice processing and about 28 combinations of these are
examined for significance in a quadratic regression to determine an expression for the
% degradation. The statistical manipulations to obtain a meaningful expression for
degradation are given in detail. The effect of variations in individual parameters was
sometimes rationalised by appealing to their effect on the availability of free •OH
radicals for degrading the particular phenolic acid being studied.
The degradation of HCA mixtures by the Fenton process has been studied in
water and sucrose solutions. From the information obtained from the initial model for
the degradation of CaA; four additional quadratic models were developed and showed
the working relationship between the degradation efficiency of each HCA (i.e., CaA,
pCoA and FeA) with four independent variables (i.e., initial HCA mixture
concentration, sucrose concentration, solution pH and reaction temperature). Under
the optimised conditions for a 200 mg/L initial HCA mixture concentration, the
degradation efficiencies of the mixture in water and sugar solutions (i.e., 13% (w/w))
were 77% and 57% respectively.
The behaviour of CaA degradation in the composite system is different from
that of pCoA and FeA possibly because of its ability to form complexes with Fe(III),
as its aromatic ring is highly activated with the presence of two hydroxyl groups. In
addition, CaA has been shown to hydrogen-bond with sucrose – a free radical
scavenger.
The Fenton process has been shown to degrade HCAs in sucrose solutions
with minimum sucrose breakdown. This means that the process may find use in the
raw sugar manufacturing process for the removal of these and other colour precursors
that are significantly prevalent when the juice expressed from the whole sugar cane
biomass (instead of the stalk) is processed. As the sugar cane industry around the
world is looking towards diversification by value-adding with the excess biomass
produced from whole crop processing, the use of the Fenton or similar processes will

131
allow juice expressed from the whole sugarcane plant to be cost-effectively processed.
The advantages of the use of the Fenton process in the sugar manufacturing process
include its simplicity, its non-specific oxidation property and the use of inexpensive
equipment. Also, the sludge that is produced has the potential to remove colourants
and other impurities (including proteins and polysaccharides) improving the quality of
the juice feedstock.

132
References
Adams, M. L., O'Sullivan, B., Downard, A. J., & Powell, K. J. (2002). Stability
constants for aluminum(III) complexes with the 1,2-dihydroxyaryl ligands
caffeic acid, chlorogenic acid, DHB, and DASA in aqueous solution. Journal
of Chemical and Engineering Data, 47(2), 289-296.
Bigda, R. J. (1995). Consider Fenton's chemistry for Fenton wastewater treatment.
Chemical Engineering Progress, 91(12), 62-66.
Box, G. P. E., & Cox, D. R. (1964). An analysis of transformations. Journal of the
Royal Statistical Society, B26, 211-243.
Chang, M.-W., Chung, C.-C., Chern, J.-M., & Chen, T.-S. (2010). Dye decomposition
kinetics by UV/H2O2: Initial rate analysis by effective kinetic modelling
methodology. Chemical Engineering Science, 65, 135-140.
Cornard, J.-P., Caudron, A., & Merlin, J.-C. (2006). UV–visible and synchronous
fluorescence spectroscopic investigations of the complexation of Al(III) with
caffeic acid, in aqueous low acidic medium. Polyhedron, 25, 2215-2222.
Cortez, S., Teixeira, P., Oliveira, R., & Mota, M. (2011). Evaluation of Fenton and
ozone-based advanced oxidation processes as mature landfill leachate pre-
treatments. Journal of Environmental Management, 92, 749-755.
de Souza, D. R., Duarte, E. T. F. M., de Souza Girardi, G., Velani, V., da Hora
Machado, A. E., Sattler, C., de Oliveira, L., & de Miranda, J. A. (2006). Study
of kinetic parameters related to the degradation of an industrial effluent using
Fenton-like reactions. Journal of Photochemistry and Photobiology, A:
Chemistry, 179, 269-275.
Deng, Y. (2007). Physical and oxidative removal of organics during Fenton treatment
of mature municipal landfill leachate. Journal of Hazardous Materials, 146,
334-340.
Derringer, G., & Suich, R. (1980). Simultaneous optimization of several response
variables. Journal of Quality Technology, 12, 214-219.
Dobson, K. D., & McQuillan, A. J. (2000). In situ infrared spectroscopic analysis of
the adsorption of aromatic carboxylic acids to TiO2, ZrO2, Al2O3, and Ta2O5
from aqueous solutions. Spectrochimica Acta, Part A: Molecular and
Biomolecular Spectroscopy, 56(3), 557-565.
Dong, W., Xu, Y., Ren, J., Chu, H., Li, J., Liu, X., & Chen, M. (2012). Synthesis and
characterization of biodegradable polymers composed of 3,4-
dihydroxycinnamic acid and poly(ethylene glycol). Journal of Applied
Polymer Science, 125(3), 1657-1662.
Dürüst, N., Özden, S., Umur, E., Dürüst, Y., & Küçükislamoğlu, M. (2001). The
isolation of carboxylic acids from the flowers of Delphinium formosum.
Turkish Journal of Chemistry, 25(1), 93-97.

133
Eggleston, G., Monge, A., & Ogier, B. E. (2003). Sugarcane factory performance of
cold, intermediate, and hot lime clarification processes. Journal of Food
Processing and Preservation, 26, 433-454.
Gilfillan, W. N., Nguyen, D. M. T., Sopade, P. A., & Doherty, W. O. S. (2012).
Preparation and characterisation of composites from starch and sugar cane
fibre. Industrial Crops and Products, 40(0), 45-54.
Hanna, K., & Quilès, F. (2011). Surface complexation of 2,5-dihydroxybenzoic acid
(gentisic acid) at the nanosized hematite−water interface: An ATR-FTIR study
and modeling approach. Langmuir, 27(6), 2492-2500.
Harrington, E. C. (1965). The desirability function. Industrial Quality Control, 21,
494-498.
Huvenne, J. P., Vergoten, G., Fleury, G., & Legrand, P. (1981). Champ de forces de
symetrie locale de molecules cycliques: III. Interprétation des spectres de
vibration du glucose cristallisé sous les deux formes α et β. Journal of
Molecular Structure, 74(2), 169-180.
Hynes, M. J., & O'Coinceanainn, M. (2004). The kinetics and mechanisms of
reactions of iron(III) with caffeic acid, chlorogenic acid, sinapic acid, ferulic
acid and naringin. Journal of Inorganic Biochemistry, 98, 1457-1464.
Kačuráková, M., & Mathlouthi, M. (1996). FTIR and laser-Raman spectra of
oligosaccharides in water: characterization of the glycosidic bond.
Carbohydrate Research, 284(2), 145-157.
Kalinowska, M., Świsłocka, R., & Lewandowski, W. (2011). Zn(II), Cd(II) and Hg(I)
complexes of cinnamic acid: FT-IR, FT-Raman, 1H and 13C NMR studies.
Journal of Molecular Structure, 993(1–3), 404-409.
Kitis, M., Adams, C. D., & Daigger, G. T. (1999). The effects of Fenton's reagent
pretreatment on the biodegradability of nonionic surfactants. Water Research,
33(11), 2561-2568.
Kodad, H., Mokhlisse, R., Davin, E., & Mille, G. (1994). Étude IRTF par réflexion
totale atténuée (ATR) de sucres en solution aqueuse. Canadian Journal of
Applied Spectroscopy, 39(4), 107-112.
Kulik, T. V., Barvinchenko, V. N., Palyanytsya, B. B., Lipkovska, N. A., & Dudik, O.
O. (2011). Thermal transformations of biologically active derivatives of
cinnamic acid by TPD MS investigation. Journal of Analytical and Applied
Pyrolysis, 90, 219-223.
Kuo, W. G. (1992). Decolorizing dye wastewater with Fenton's reagent. Water
Research, 26(7), 881-886.
Machado, N. F. L., Calheiros, R., Gaspar, A., Garrido, J., Borges, F., & Marques, M.
P. M. (2009). Antioxidant phenolic esters with potential anticancer activity:
Solution equilibria studied by Raman spectroscopy. Journal of Raman
Spectroscopy, 40(1), 80-85.

134
Max, J.-J., & Chapados, C. (2001). Sucrose hydrates in aqueous solution by IR
spectroscopy. Journal of Physical Chemistry A, 105(47), 10681-10688.
Morelli, R., Russo-Volpe, S., Bruno, N., & Lo Scalzo, R. (2003). Fenton-dependent
damage to carbohydrates: free radical scavenging activity of some simple
sugars. Journal of Agricultural and Food Chemistry, 51(25), 7418-7425.
Morgan, B., & Lahav, O. (2007). The effect of pH on the kinetics of spontaneous
Fe(II) oxidation by O2 in aqueous solution – basic principles and a simple
heuristic description. Chemosphere, 68(11), 2080-2084.
Nguyen, D. M. T., & Doherty, W. O. S. (2012). Phenolics in sugar cane juice:
Potential degradation by hydrogen peroxide and Fenton's reagent.
International Sugar Journal, 114(1361), 309-315.
Pala, A., & Erden, G. (2005). Decolorization of a baker's yeast industry effluent by
Fenton oxidation. Journal of Hazardous Materials, B127, 141-148.
Rivas, F. J., Beltrán, F. J., Garcia-araya, J. F., Navarrete, V., & Gimeno, O. (2002).
Co-oxidation of p-hydroxybenzoic acid and atrazine by the Fenton’s like
system Fe(III)/H2O2. Journal of Hazardous Materials, B91, 143-157.
Rivas, F. J., Frades, J., Alonso, M. A., Montoya, C., & Monteagudo, J. M. (2005).
Fenton's oxidation of food processing wastewater components. Kinetic
modeling of protocatechuic acid degradation. Journal of Agricultural and
Food Chemistry, 53, 10097-10104.
Rodrigues, C. S. D., Madeira, L. M., & Boaventura, R. A. R. (2009a). Optimization of
the azo dye Procion Red H-EXL degradation by Fenton’s reagent using
experimental design. Journal of Hazardous Materials, 164, 987-994.
Rodrigues, C. S. D., Madeira, L. M., & Boaventura, R. A. R. (2009b). Treatment of
textile effluent by chemical (Fenton’s Reagent) and biological (sequencing
batch reactor) oxidation. Journal of Hazardous Materials, 172, 1551-1559.
Sánchez-Cortés, S., & García-Ramos, J. V. (1999). Photoinduced coupling and
adsorption of caffeic acid on silver surface studied by surface-enhanced
Raman spectroscopy. Spectrochimica Acta, Part A: Molecular and
Biomolecular Spectroscopy, 55(14), 2935-2941.
Smith, P. (1983). A Review of Raw Sugar Colorant Chemistry and its Relevance to
Storage and Refining Quality. Paper presented at the Discussions on Colour at
the Meeting in Sydney. Sydney, Australia: Sugar Division, CSR Ltd.
Sun, J.-H., Shi, S.-H., Lee, Y.-F., & Sun, S.-P. (2009). Fenton oxidative
decolorization of the azo dye Direct Blue 15 in aqueous solution. Chemical
Engineering Journal, 155, 680-683.
Świsłocka, R. (2013). Spectroscopic (FT-IR, FT-Raman, UV absorption, 1H and 13C
NMR) and theoretical (in B3LYP/6-311++G** level) studies on alkali metal
salts of caffeic acid. Spectrochimica Acta Part A: Molecular and
Biomolecular Spectroscopy, 100(0), 21-30.

135
Świsłocka, R., Kowczyk-Sadowy, M., Kalinowska, M., & Lewandowski, W. (2012).
Spectroscopic (FT-IR, FT-Raman, 1H and 13C NMR) and theoretical studies of
p-coumaric acid and alkali metal p-coumarates. Spectroscopy: An
International Journal, 27(1), 35-48.
Tang, W. Z., & Huang, C. P. (1996). 2,4-Dichlorophenol oxidation kinetics by
Fenton's reagent. Environmental Technology, 17(12), 1371-1378.
Tang, W. Z., & Huang, C. P. (1997). Stoichiometry of Fenton's reagent in the
oxidation of chlorinated aliphatic organic pollutants. Environmental
Technology, 18, 13-23.
Tunali, S., & Batmaz, I. (2000). Dealing with the least squares regression assumptions
in simulation metamodeling. Computers & Industrial Engineering, 38, 307-
320.
Varsányi, G. (1974). Assignments for Vibrational Spectra of Seven Hundred Benzene
Derivatives (Vol. 1). London: Adam Hilger.
Vasko, P. D., Blackwell, J., & Koenig, J. L. (1971). Infrared and raman spectroscopy
of carbohydrates: Part I: Identification of O–H and C–H-related vibrational
modes for D-glucose, maltose, cellobiose, and dextran by deuterium-
substitution methods. Carbohydrate Research, 19(3), 297-310.
Yost, E. C., Tejedor-Tejedor, M. I., & Anderson, M. A. (1990). In situ CIR-FTIR
characterization of salicylate complexes at the goethite/aqueous solution
interface. Environmental Science and Technology, 24(6), 822-828.

136

137
CHAPTER 5
Separation and Identification of
Fenton Oxidation Products
Derived from Hydroxycinnamic Acids
5.1 Introduction..................................................................................... 137
5.2 Materials and Methods................................................................... 138
5.2.1 Reagents and Solvents......................................................... 138
5.2.2 Fenton Oxidation Reactions for the Degradation of
Hydroxycinnamic Acid Mixtures.........................................
138
5.2.3 Sample Preparation............................................................. 139
5.2.4 Instrumental Procedures and Analyses............................... 140
5.2.5 Fenton Oxidation Reactions for the Degradation of
Sucrose Mixtures.................................................................
142
5.2.6 Computational Methods...................................................... 142
5.3 Results and Discussion.................................................................... 143
5.3.1 Identification of Oxidation Products................................... 143
5.3.2 Proposed Degradation Pathways of Selected
Hydroxycinnamic Acids.......................................................
153
5.3.3 Oligomerisation of Hydroxycinnamic Acids....................... 166
5.4 Summary.......................................................................................... 171

138
5.1 Introduction
In this chapter, attempts were made to determine the oxidation products and
the degradation pathways of the HCAs studied (viz., CaA, pCoA and FeA). To date,
inadequate information exists in relation to the oxidation of these compounds using
the Fenton process and other established AOPs. Not all of the oxidation products of
these HCAs have been previously isolated or identified. The identification of these
products will assist in proposing possible mechanistic pathways of the oxidation
process. Therefore, the investigations in this chapter are further attempts to identify
these products and propose probable mechanisms for the degradation of these
phenolic acids.
5.2 Materials and Methods
5.2.1 Reagents and Solvents
All chemicals, solvents and reagents were obtained in their purest form from
the suppliers as described in the previous chapters or as otherwise stated. Acetic acid,
cis–aconitic acid, trans–aconitic acid, butyric acid, citric acid, formic acid, fumaric
acid, glycolic acid, glyoxylic acid, isobutyric acid, lactic acid, malic acid, oxalic acid
and succinic acid were purchased from Sigma-Aldrich (St. Louis, MO, USA).
Potassium chloride was obtained from Ajax Finechem (Seven Hills, NSW, Australia).
Stock solutions of HCAs (i.e., CaA, pCoA and FeA) were prepared by dissolution in
degassed ethanol solution (50% (v/v)) and stored at 4.0 °C.
5.2.2 Fenton Oxidation Reactions for the Degradation of Hydroxycinnamic
Acid Mixtures
The procedure for the Fenton oxidative degradation of HCA mixtures is
similar to that described in Section 4.2.4. Four HCA solutions were investigated
(viz., CaA, pCoA, FeA and their mixture) under the optimised operating conditions in
water, pH 4.7 and 25 °C (cf. Section 4.3.3).

139
In each run, a predetermined amount of Milli-Q water and each HCA were
added to the reaction vessel. To improve the analytical detector response of the
reaction products, the starting materials for the combined HCA mixture were carried
out at two orders of magnitude higher than those studied in Section 4.3.3. The final
concentrations for each HCA component were CaA (37 mM), pCoA (41 mM) and
FeA (34 mM). The total HCA concentration is approximately equivalent to
20,000 mg/L (i.e., 100× more than 200 mg/L used for total HCA concentration in
Chapter 4). For the three individual HCA mixtures, an initial HCA concentration of
100 mM (approximately equivalent to 20,000 mg/L) was added to the reaction vessel.
Known amounts of FeSO4·7H2O (0.5 M, 2.49 mL) and H2O2 (5.0 M, 0.75 mL)
solutions were added to achieve a final volume of 50 mL and a final concentration of
24.9 mM and 75 mM, respectively. The working molar ratio (Fe(II)/H2O2) for the
Fenton reaction was 1:15. The reaction was initiated as soon as H2O2 was added. At
2 min, 3.0 mL of the solution was taken, diluted 10-fold to quench the reaction and
stored at 4.0 °C. The remainder of the mixtures were immediately snap-frozen in
liquid nitrogen and stored at –80 °C. Samples were defrosted and prepared for
instrumental analysis.
5.2.3 Sample Preparation
Undiluted samples were pre-concentrated using solid phase extraction (SPE)
prior to gas chromatography/electron impact-mass spectrometry (GC/EI-MS)
analysis. Undiluted samples for high-performance ion exclusion chromatography
(HPIEC) analysis did not require any sample preparation. Diluted samples for the
analyses on all other analytical techniques required no further sample preparation.
Samples for GC/EI-MS analyses did not require any further adjustment prior
to SPE. Waters Sep-Pak tC18 vacuum cartridges (3 cc, 500 mg, 37-55 µm)
(Wexford, Ireland) were placed in a Waters Sep-Pak 24-port vacuum manifold
(Milford, MA, USA) and first conditioned with 2 × 2.5 mL HPLC grade methanol
followed by 2 × 2.5 mL of Milli-Q water. After the conditioning step, 2 × 1.0 mL
aliquots of the reaction sample were loaded at a flow rate lesser than 2.0 mL/min by
adjusting the vacuum to ca. 15 kPa. The column was washed with 2.5 mL of Milli-Q

140
water. Finally, elution was performed with 2 × 1.0 mL HPLC grade methanol at a
flow rate ≤ 1.0 mL/min by adjusting the vacuum to ca. 10 kPa. The eluates obtained
were concentrated by solvent evaporation under a gentle stream of N2 and
recomposed to a final volume of 1 mL in HPLC grade methanol. The extracts were
membrane filtered (0.45 μm) prior to GC/EI-MS analysis.
5.2.4 Instrumental Procedures and Analyses
HPLC-DAD/ESI-Q-TOF-MS/MS. Identification of organic reaction products
was evaluated using reversed-phase HPLC coupled with UV/Vis DAD and
electrospray ionisation quadrupole time-of-flight tandem mass spectrometry (ESI-Q-
TOF-MS/MS). Analyses were performed on an Agilent 1290 Infinity LC system
(G4220A binary pump, Germany; G4226A ALS, Germany; G1330B ALS thermostat,
Germany; G1316C thermostatted column compartment, Germany; G1314E variable
wavelength detector (VWD), Germany) coupled with an Agilent Accurate-Mass Q-
TOF mass spectrometer (G6520B, USA). The chromatographic conditions were
identical as described in Section 4.2.5 for all samples with the exception of single
wavelength UV/Vis detection (280 nm) and injection volume (20 μL). The column
effluent from the VWD was then introduced into the dual ESI source of the Q-TOF
mass spectrometer without post-column splitting. Mass spectra were acquired in
negative ion mode and the conditions were set as follows: gas temperature: 350 °C;
drying gas flow (N2): 12 L/h; nebuliser (N2): 35 psig; capillary voltage: 3.5 kV;
fragmentor: 170 V; skimmer: 60 V; OCT1 RF Vpp: 250 V. Data acquisition was
performed using the Agilent Masshunter Data Acquisition TOP/Q-TOF B.02.00
software package, scanning from a mass-to-charge ratio (m/z) 100 to 1500 in profile
(continuum) mode with a scan cycle time of 2.242 s and an acquisition time of 714.1
ms/spectrum. Two reference masses (m/z 121.050873 and m/z 922.009798) were
used. Tandem MS product ions were produced by collision-induced dissociation of
selected precursor ions in the collision cell of the Q-TOF mass spectrometer at fixed
collision energy voltage of 50 V. The Agilent Masshunter Qualitative Analysis
(B.02.00) software package was used for data analysis.

141
HPIEC. Identification of carboxylic acids was evaluated using high-
performance ion exclusion chromatography (HPIEC). Analyses were performed on a
Waters HPLC system (Milford, MA, USA) equipped with a 626 pump, a 600S
controller, a 717plus autosampler, a 2487 dual λ absorbance detector and a 410
differential refractometer. The separation was carried out on two Bio-Rad Aminex
HPX-87H ion exclusion columns (300 × 7.8 mm i.d.) (Heracles, CA, USA) connected
in series and protected by a Bio-Rad Cation H+ micro-guard cartridge (30 × 4.6 mm
i.d.). Reaction products were eluted isocratically with 8 mM H2SO4 (sparged with
helium at 10 mL/min). Simultaneous UV/Vis detection at specific wavelengths (190
nm and 210 nm) without reference wavelength subtraction. Refractive index
detection was set to negative polarity and run at an attenuator setting of 20×. Aliquots
of samples were membrane filtered (0.45 μm) prior to injection into the HPLC
system. Injection volume for all samples was 20 μL; first and second column
temperatures were equilibrated at 35 °C and 85 °C respectively; flow rate was 0.4
mL/min and run time was 90 min. Data acquisition was performed using the Waters
Empower 2 (Build 2154) software package. Identification of peaks was based on the
conformance of UV/Vis spectra and retention times with the corresponding authentic
standards.
GC/EI-MS. Identification of volatile reaction products was evaluated using
GC/EI-MS. Analyses were performed on a Hewlett Packard HP/Agilent 6890, 7683
and 5973 Series GC/MS system (G1530A (6890A) gas chromatograph system, USA;
G2614A (7683) ALS Tray, China; G2613A (7683) ALS Injector, China; G1926A
(7683) Bar Code Reader, China; G2589A (5973N) Mass Selective Detector; USA)
using a Phenomenex Zebron ZB-1 GC capillary column (30 m, 0.25 mm i.d. and 0.25
μm thick film) (Torrance, CA, USA). Helium was used as carrier gas at a constant
flow rate of 0.5 mL/min. Sample aliquots (3.0 μL) were injected in splitless mode at
an injector temperature of 250 °C. The oven temperature program was 4 min at 40
°C; 8 °C/min to 180 °C (2 min); and 8 °C/min to 280 °C (9 min). The mass range
scanned was 35 m/z to 500 m/z using EI ionisation at 70 eV. Data acquisition and
analysis was performed using the Agilent MSD ChemStation (G1701EA E.01.00.237)
software package.
142
5.2.5 Fenton Oxidation Reactions for the Degradation of Sucrose Mixtures
Four 50 mL mixtures containing only sucrose at various concentrations
(3.75%, 7.50%, 11.25% and 15.0% (w/w)) were subjected to Fenton oxidation under
the optimum operating conditions described in Section 4.2.4 (i.e., 2.49 mM
FeSO4·7H2O, 7.50 mM H2O2, pH 5.4 and 36 °C). These experiments were carried out
to determine the presence of organic acids and reducing sugars formed from the
Fenton oxidation of sucrose. At 2 min, the mixtures were immediately snap-frozen in
liquid nitrogen and stored at –80 °C. Samples were defrosted and prepared for
HPIEC and HPAEC-PAD analyses for the determination of organic acids and
reducing sugars, respectively.
Prior to HPIEC analysis, samples containing sugars were adjusted to pH 8.5
using 0.1 M NaOH prior to SPE to facilitate the ion exchange in the packed cartridge.
Waters AccellPlus QMA vacuum cartridges (3 cc, 500 mg, 37-55 µm) (Wexford,
Ireland) were placed in a Waters Sep-Pak 24-port vacuum manifold and first
conditioned with 2 × 2.5 mL of 0.5 M potassium chloride solution followed by
2 × 2.5 mL of Milli-Q water. After the conditioning step, 2 × 2.0 mL aliquots of the
reaction sample were loaded at a flow rate ≤ 1.0 mL/min by adjusting the vacuum to
ca. 5 kPa. The column was washed with 8 × 2.5 mL of Milli-Q water. Finally,
elution was performed with 2 × 2.0 mL of 0.1 M sulfuric acid at a flow rate ≤ 0.5
mL/min by adjusting the vacuum to ≤ 5 kPa. The extracts were membrane filtered
(0.45 μm) prior to HPIEC analysis. The operating procedure for the chromatographic
system is identical to that described in Section 5.2.3.
Sucrose and reducing sugar contents in the reaction mixtures were monitored
by HPAEC-PAD. Sample preparation and the operating procedure for the
chromatographic system are identical to that described in Section 4.2.5.
5.2.6 Computational Methods
Geometry optimisations of HCA molecular systems in their ground state were
performed using the density functional theory (DFT) methods implemented using the
Wavefunction, Inc. Spartan ′10 (1.1.0) software package (Irvine, CA, USA). Density
functional theory was chosen as the method for computation as it provides a

143
reasonable description of the electronic correlation of a molecule in a quantum system
within minimal computational time and cost (Fifen et al., 2009). Also, the precision
of the DFT is typically better than that of other methods (e.g., Hartree-Fock (HF),
semi-empirical) where the electron spin is not considered (Nsangou et al., 2008).
Density functional approximations were calculated based on the B3LYP hybrid
functional, which consists of the Becke’s three parameters exact exchange functional
(B3) (Becke, 1988) combined with the non-local gradient corrected correlation
functional of Lee-Yang-Parr (LYP) (Lee et al., 1988). The standard split valence
double-zeta Gaussian basis set 6-31G augmented by a set of d polarisation functions
(Frisch et al., 1984) on heavy atoms was chosen. Solvent effects of water are
computed in the framework of a restricted HF-DFT self-consistent field SM8 model
using the Pulay direct inversion iterative subspace approach (Pulay, 1980) with
geometric direct minimisation (Van Voorhis and Head-Gordon, 2002). The outputs
produced from the theoretical calculations are presented in Appendices, Tables
A2.1–A2.3.
5.3 Results and Discussion
5.3.1 Identification of Oxidation Products
In comparison to other AOPs (e.g., ozonation, UV/H2O2 oxidation), the
mechanism of the Fenton process between Fe(II) and H2O2 is already intricate and is
further complicated when an organic compound is involved in the reaction. So,
mechanistic pathways for the degradation of organic compounds using the Fenton
process have only been proposed for simpler compounds. Structural elucidation and
proposal of reaction schemes is complex in the case of HCAs, since these phenolic
derivatives are molecularly larger and have more available sites for free radical attack.
In turn, they may produce complex intermediates or produce several smaller products
at lower concentrations that are difficult to detect. Identification of these products
will assist in proposing possible mechanistic pathways for the oxidative degradation
of the HCAs investigated.
144
Liquid Chromatography Techniques
The stoichiometry for the complete mineralisation of CaA (C9H8O4), pCoA
(C9H8O3) and FeA (C10H10O4) by H2O2 in the Fenton process is as follows:
C9H8O4 + 18H2O2 9CO2 + 22H2O (5.1)
C9H8O3 + 19H2O2 9CO2 + 23H2O (5.2)
C10H10O4 + 21H2O2 10CO2 + 26H2O (5.3)
It is expected that the optimised working Fenton molar ratio (Fe(II)/H2O2) of
1:15 is insufficient for complete degradation of all acids, individually or combined.
The incomplete depletion of HCA peaks and the presence of new peaks detected as
depicted in the HPLC-DAD profiles of the reaction mixtures (Figure 5.1) suggest that
there are reaction products remaining in solution. The identification of these
compounds is important in order to assess and predict their role in downstream
processes of the sugar manufacturing process. It is presumed that after 2 min, under
the optimum operating conditions in water or sucrose solutions, the reaction had
reached equilibrium as there were no changes in the response of the chromatographic
peaks of the starting compounds after 2 min of the reaction initiated by H2O2.
Figure 5.1 shows numerous chromatographic peaks corresponding to the
starting materials and the reaction products formed at 2 min of Fenton oxidation. The
numbers directly labelled on the peaks of the HPLC-DAD chromatograms (Figure
5.1) are associated with the identified products listed in Table 5.1. Products were
identified based on the comparison of retention time data of the available pure
standards and/or accurate mass measurements. Proposal of chemical structures were
evaluated based on the predicted oxidation mechanism of the Fenton process and
mass spectral fragmentation patterns of similar compounds suggested in the literature
(Fulcrand et al., 1994; Antolovich et al., 2004). Additional information was obtained
from the isotopic distribution in the mass spectra for certain molecules. Table 5.1 also
shows data related to the experimental and calculated masses of the deprotonated ions
and proposed empirical formulae related to the identified compounds. The resulting
accurate masses were found with an error lower than 0.04 Da.

145
Figure 5.1 High-performance LC-DAD chromatograms (UV/Vis detection at
280 nm) of (a) CaA; (b) pCoA and (c) FeA; subjected to Fenton
oxidation at 2 min (pH 4.7, 25 °C). Numbers correspond to
compound numbers in Table 5.1.
-10
30
70
110
150
0 5 10 15 20 25
Ab
sorb
an
ce (
mA
U)
Retention Time (min)
1
2
3
-10
30
70
110
150
0 5 10 15 20 25
Ab
sorb
an
ce (
mA
U)
Retention Time (min)
4 5
-10
30
70
110
150
0 5 10 15 20 25
Ab
sorb
an
ce (
mA
U)
Retention Time (min)
6
7
8
(a)
(b)
(c)

146
Table 5.1 Reaction products formed from the Fenton oxidation of HCAs
detected by LC/MS.
Peak Compound tR
(min)
Molecular ion
(m/z)
Formula Error
(Da)
Caffeic acid
1 protocatechuic aldehyde 4.24 137.048 C7H5O3– –0.02
2 caffeic acid 7.02 179.061 C9H7O4– –0.03
3 caffeic acid tetramer 12.75 715.183
p–Coumaric acid
4 4–hydroxybenzaldehyde 6.83 121.050 C7H5O2– –0.02
5 p–coumaric acid 10.64 163.065 C9H7O3– –0.03
Ferulic acid
6 vanillin 7.12 151.065 C8H7O3– –0.03
7 ferulic acid 11.60 193.079 C10H9O4– –0.03
8 ferulic acid dimer 18.87 385.133 C20H17O8– –0.04
The strong intense peak at the retention time (tR) range of 0.83–0.98 min in the
HPLC-DAD and is attributable to the solvent. Five products were identified by
means of reversed-phase HPLC with UV/Vis DAD and negative ion mode ESI-MS
detection and had retention times of less than 20 min. The chromatogram obtained
for the combined HCA mixture (cf. Appendices, Figure A2.1) revealed no new peaks
than those that already appear in the individual HCA mixtures in Figure 5.1. This
may suggest that there were no side reactions taken place among the HCAs.
It is observed that at 2 min, the Fenton oxidation of CaA produced two main
products observable at a wavelength of 280 nm. Protocatechuic aldehyde
(3,4–dihydroxybenzaldehyde) was assigned to the eluted peak at tR = 4.24 min. This
product is the initial breakdown product of CaA as a result of •OH radical attack to
the vinyl functional group of the phenolic acid. The later oxidation product had a m/z
ion of 715 which was tentatively assigned to the tetramer of CaA (i.e., [M4–H]–). It is
assumed that the tetramer could have possibly been formed by the oxidative coupling
of two dimers of CaA (MW of 358) (i.e., [M2–H]–) (Pati et al., 2006). Unlike
previous reports, the dimers formed by the Fenton oxidation of CaA were not
147
observed in this study (Cilliers and Singleton, 1991; Tazaki et al., 2001; Antolovich et
al., 2004).
The main product observed from the Fenton oxidation of pCoA is
4–hydroxybenzaldehyde (tR = 6.83 min). There were several other unidentified peaks
with intensities lower than 4–hydroxybenzaldehyde. Similar to CaA, only two main
oxidation products were produced from the oxidation of FeA, they are vanillin
(4–hydroxyl–3–methoxybenzaldehyde) at tR = 7.12 min and a dimer of FeA
(i.e., [M2–H]–) at tR = 18.87 min. The dimeric products detected are in consistency
with those found in similar oxidation studies (Antolovich et al., 2004; Šmejkalová et
al., 2006).
In addition to the HPLC-DAD chromatograms shown in Figure 5.1 for the
individual HCA solutions, the total ion chromatograms (TICs) recorded in negative
ion mode ESI-MS for each phenolic acid mixture is shown in Figure 5.2. The mass
spectral fragmentation pattern data extracted from peaks obtained in the TICs were
similar to those extracted from the HPLC-DAD chromatographic peaks. Hence, the
results shown in the TICs are consistent with the results obtained with DAD.
The peak at tR = 6.15 min shown in Figures 5.1b and 5.2b has a m/z of 121 and
the peak at tR = 6.83 min also has the same m/z. The peak at tR = 6.83 min has been
reported previously to be attributable to 4–hydroxybenzaldehyde. Therefore, the peak
at tR = 6.15 min may be an isomer formed as a result of hydroxylation during
(Poerschmann et al., 2010). Three unidentified peaks at tR = 17.7, 19.7 and 21.3 min
observed in each of the TICs shown in Figure 5.2 are possibly due to impurities
present in the chromatographic system and are not associated to the starting materials
and its reaction products.

148
Figure 5.2 Total ion chromatograms (negative ion mode ESI-MS) of (a) CaA;
(b) pCoA and (c) FeA; subjected to Fenton oxidation at 2 min
(pH 4.7, 25 °C). Numbers correspond to compound numbers in
Table 5.1.
0
5
10
15
20
25
0 5 10 15 20 25
Inte
nsi
ty (
x1
06)
Retention Time (min)
12
3
0
5
10
15
20
25
0 5 10 15 20 25
Inte
nsi
ty (
x1
06)
Retention Time (min)
4
5
0
5
10
15
20
25
0 5 10 15 20 25
Inte
nsi
ty (
x 1
06)
Retention Time (min)
67
8
(a)
(b)
(c)
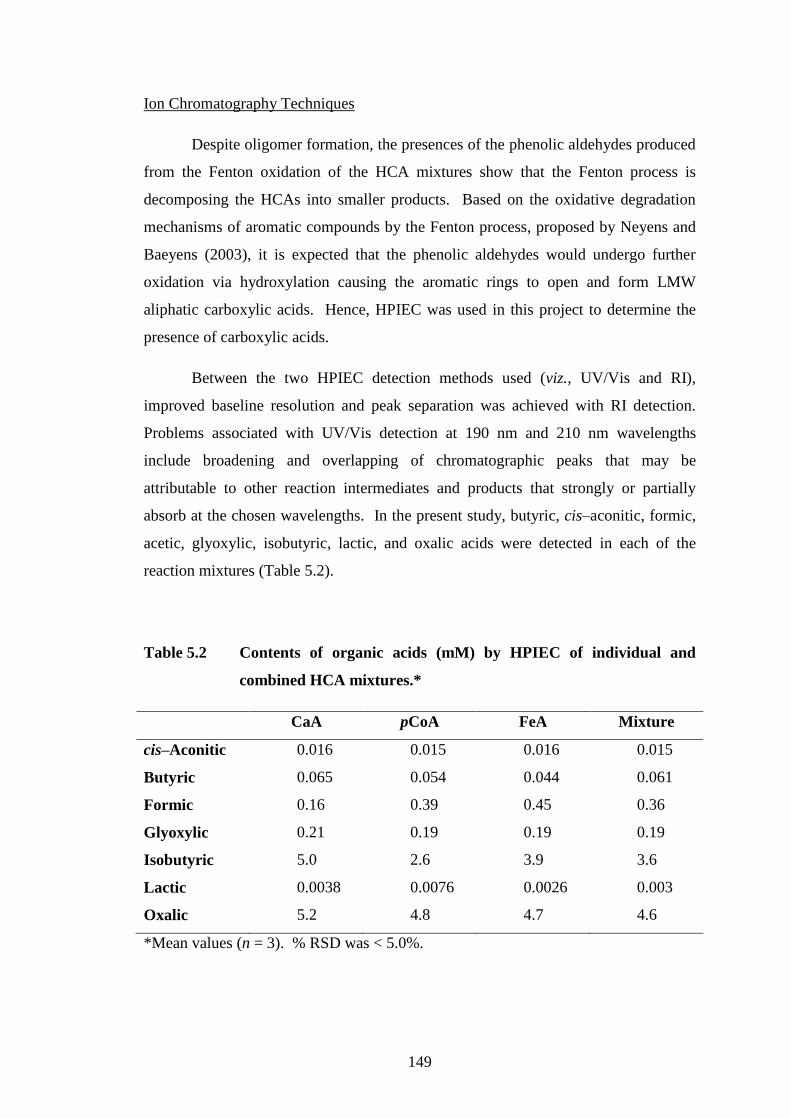
149
Ion Chromatography Techniques
Despite oligomer formation, the presences of the phenolic aldehydes produced
from the Fenton oxidation of the HCA mixtures show that the Fenton process is
decomposing the HCAs into smaller products. Based on the oxidative degradation
mechanisms of aromatic compounds by the Fenton process, proposed by Neyens and
Baeyens (2003), it is expected that the phenolic aldehydes would undergo further
oxidation via hydroxylation causing the aromatic rings to open and form LMW
aliphatic carboxylic acids. Hence, HPIEC was used in this project to determine the
presence of carboxylic acids.
Between the two HPIEC detection methods used (viz., UV/Vis and RI),
improved baseline resolution and peak separation was achieved with RI detection.
Problems associated with UV/Vis detection at 190 nm and 210 nm wavelengths
include broadening and overlapping of chromatographic peaks that may be
attributable to other reaction intermediates and products that strongly or partially
absorb at the chosen wavelengths. In the present study, butyric, cis–aconitic, formic,
acetic, glyoxylic, isobutyric, lactic, and oxalic acids were detected in each of the
reaction mixtures (Table 5.2).
Table 5.2 Contents of organic acids (mM) by HPIEC of individual and
combined HCA mixtures.*
CaA pCoA FeA Mixture
cis–Aconitic 0.016 0.015 0.016 0.015
Butyric 0.065 0.054 0.044 0.061
Formic 0.16 0.39 0.45 0.36
Glyoxylic 0.21 0.19 0.19 0.19
Isobutyric 5.0 2.6 3.9 3.6
Lactic 0.0038 0.0076 0.0026 0.003
Oxalic 5.2 4.8 4.7 4.6
*Mean values (n = 3). % RSD was < 5.0%.

150
However, these compounds except for oxalic and isobutyric acids were found
at low concentrations (≤ 0.45 mM). This may indicate that progressive oxidative
degradation from HCA is minimal under the operating conditions; or that these
carboxylic acids may have decomposed to CO2 and H2O within 2 min of the reaction.
Oxalic acid and isobuytic acid concentrations in each of the three individual acids
ranged from 4.7–5.2 mM and 2.6–5.0 mM, respectively. The highest concentrations
of oxalic, isobutyric and glyoxylic acids were obtained with CaA. However, higher
amounts of butyric and formic acids were produced from pCoA and FeA degradation.
Interestingly, these organic acids are typically organic acids found in sugar cane juice
(Thai and Doherty, 2011).
Mixtures only containing Fenton’s reagent and sucrose at varying
concentrations (3.75%, 7.50%, 11.25% and 15.0% (w/w)) were examined by HPIEC
and HPAEC-PAD for the determination of carboxylic acids and reducing sugars,
respectively. With the HPIEC method, no peaks were observed in both UV/Vis and
RI chromatograms indicating that no carboxylic acids were produced from sucrose
degradation at 2 min of the reaction. However, the HPAEC-PAD analyses in fact
showed sucrose degradation (≤ 0.01%) and the presences of glucose and fructose
(≤ 0.02%) in the 3.75% and 7.50% (w/w) sucrose mixtures (cf. Appendices, Table
A2.4). It should be noted that the amount of sucrose degraded was not significant.
Gas Chromatography Techniques
The products produced from the Fenton oxidation of the individual acids and
their mixture were analysed by GC/EI-MS analysis. Gas chromatographic studies for
the monitoring of HCA degradation products have not been previously reported. This
may be due to the low volatilities of the products.
Figure 5.3 shows the gas chromatograms obtained for SPE extracts of each
HCA solution at 2 min of oxidation. The relatively smaller intensities and fewer
peaks on the GC chromatogram of degraded CaA (Figure 5.3a) show that CaA has
fewer volatile compounds than the other HCAs. The numbers directly labelled on the
peaks of the GC chromatograms shown in Figure 5.3 correspond to the identified
products listed in Table 5.3. These products have been identified based on their

151
molecular ion and mass fragmentation patterns. A compound identification program
of the National Institute of Standards and Technology library (Gaithersburg, MD,
USA) was also used to confirm these compounds with a fit value of ≥ 90% in all
cases.
The identification program matched several compounds with fitting values of
80–90% to peaks found in the extracts of pCoA and FeA reaction mixtures as shown
in Figures 5.3b and 5.3c, respectively. However, the structures of these matching
compounds were not strongly associated with any of the products with fit values of
≥ 90% and products detected by other techniques. Therefore, these compounds were
not considered for the proposal of mechanistic pathways for the degradation of HCAs.
Table 5.3 Reaction products formed from the Fenton oxidation of HCAs
detected by GC/MS.
Peak Compound tR
(min)
Formula EI/MS Spectrum Ions
(m/z)
Caffeic acid
8 p–vinylguaiacol 18.09 C9H10O2 150, 135, 107, 77
p–Coumaric acid
9 chavicol 18.52 C9H10O 134, 107, 91, 77
10 4–hydroxybenzaldehyde 18.66 C7H6O2 121, 93, 65, 39
11 4–hydroxybenzoic acid 20.92 C7H6O3 138, 121, 93, 65, 39
12 p–coumaric acid methyl ester 25.06 C10H10O3 178, 147, 119, 91, 65
13 p–coumaric acid 25.68 C9H8O3 164, 147, 119, 107, 91
Ferulic acid
14 p–vinylguaiacol 18.14 C9H10O2 150, 135, 107, 77
15 vanillin 19.26 C8H8O3 152, 123, 109, 81
16 trans–isoeugenol 20.36 C10H12O2 164, 149, 131, 103, 91, 77
17 ferulic acid 27.08 C10H10O4 194, 179, 133

152
Figure 5.3 Gas chromatograms of SPE extracts of (a) CaA; (b) pCoA and
(c) FeA solutions; subjected to Fenton oxidation at 2 min (pH 4.7,
25 °C). Numbers correspond to compound numbers in Table 5.1.
0.00
0.01
0.02
0.03
0.04
0.05
15 20 25 30 35
Inte
nsi
ty (
10
6)
Retention Time (min)
8
0.00
0.40
0.80
1.20
1.60
2.00
15 20 25 30 35
Inte
nsi
ty (
10
6 )
Retention Time (min)
9
10
1113
12
0.00
0.40
0.80
1.20
1.60
2.00
15 20 25 30 35
Inte
nsi
ty (
10
6 )
Retention Time (min)
14
15
16
17
(a)
(b)
(c)
×
×
×

153
5.3.2 Proposed Degradation Pathways of Selected Hydroxycinnamic Acids
On the basis of the results obtained from LC/MS, HPIEC and GC/MS analyses
of the various products obtained from oxidation of HCAs using the Fenton process,
possible reaction pathways are tentatively proposed in this section with support from
the literature.
Hydroxyl radicals are mainly responsible for the degradation of HCAs. Free
radicals, in general, are unstable and highly reactive due to their unpaired electron.
Hence, it is desirable for an •OH radical to regain a lost electron, misplaced from the
catalytic decomposition of H2O2, to become stable. There are three typical fates of
these radicals as their main purpose is to become stable in the presence of other
molecules: (i) addition to a π-bond; (ii) atom transfer; and (iii) radical combination.
However, when a free radical reacts with another compound, it removes an electron
from that compound and in turn, that compound becomes a free radical. Hence, this
leads to a sequence of reactions until the reaction is terminated when two radicals
react with each other to give a non-radical species.
In this context, it is probable that the oxidative degradation of HCAs begins
with the electrophilic attack of the •OH radical. Therefore, it was suggested that the
position with the highest electron density is the most probable site for the HCAs to be
attacked by •OH (Marusawa et al., 2002). Figure 5.4 shows the electrostatic potential
maps and the equilibrium geometries of each of the three HCAs investigated, where
red indicates a negative charge and blue indicates a positive charge.
Observing the carbon atoms of each HCA molecule, there are various areas
coloured in orange and yellow which show a slightly higher negative charge than
those areas coloured in blue or green (i.e., positive charge). To determine the
intensity of these charges, the electron density distribution was calculated for each
atom of each HCA molecule. Table 5.4 shows the natural electron density
distribution of the carbon atoms of each HCA molecule. It is obvious from both
Figure 5.4 and Table 5.4, that the C8 atom has the highest electron density of –0.371,
–0.374 and –0.370 for CaA, pCoA and FeA, respectively. Hence, this is the most
potential site for the electrophilic attack of the •OH radical.
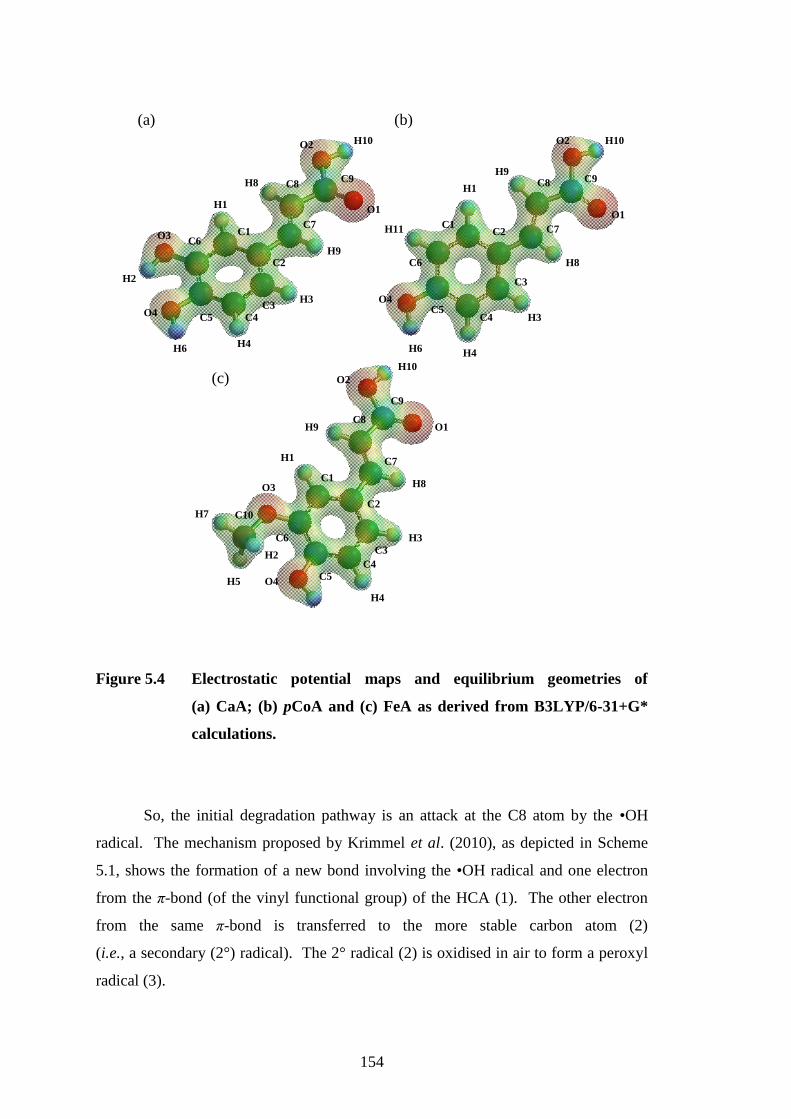
154
Figure 5.4 Electrostatic potential maps and equilibrium geometries of
(a) CaA; (b) pCoA and (c) FeA as derived from B3LYP/6-31+G*
calculations.
So, the initial degradation pathway is an attack at the C8 atom by the •OH
radical. The mechanism proposed by Krimmel et al. (2010), as depicted in Scheme
5.1, shows the formation of a new bond involving the •OH radical and one electron
from the π-bond (of the vinyl functional group) of the HCA (1). The other electron
from the same π-bond is transferred to the more stable carbon atom (2)
(i.e., a secondary (2°) radical). The 2° radical (2) is oxidised in air to form a peroxyl
radical (3).
(a) (b)
(c)
C1
C2
C3
C4 C5
C6
H1
O3
H2
O4
H6 H4
H3
H9
C7
C8 C9 H8
O1
O2 H10
C5 C4
C3
C2 C1
C6
C7
C8 C9
O4
O1
O2 H10
H9
H8
H1
H3
H11
H4 H6
C1
C2
C3
C4
C5
C6
C7
C8
C9
C10
O1
O2
O4
O3
H10
H9
H8
H3
H4
H1
H2
H5
H7

155
Table 5.4 Electron density distribution of carbon atoms in HCA molecules.
Natural atomic charges
Caffeic acid p–Coumaric acid Ferulic acid
C1 –0.248 –0.179 –0.230
C2 –0.112 –0.130 –0.116
C3 –0.203 –0.178 –0.204
C4 –0.302 –0.314 –0.300
C5 +0.291 +0.347 +0.286
C6 +0.277 –0.288 +0.268
C7 –0.120 –0.119 –0.120
C8 –0.371 –0.374 –0.370
C9 +0.785 +0.785 +0.785
C10 – – –0.313
R
OH
OH
OH
H
H
H
HOH
R
OH
OH
O
OH
H
H
H
H
H
O2
R
OH
OH
O
OH
H
H
H
H
H
OO
R = H (pCoumaric acid)
R = OH (Caffeic acid)
R = OCH3 (Ferulic acid)
(1) (2) (3)
6
5
43
21 7
8
9
Scheme 5.1

156
The peroxyl radicals (3) can undergo numerous fragmentation and
rearrangements reactions. However, based on the works presented by von Sonntag
and Schuchmann (1991), it is most probable that a bimolecular reaction occurs
between two equivalents of peroxyl radicals (3), as shown in Scheme 5.2. The
subsequent losses of oxygen atoms from each of the two peroxyl radicals (3) form
oxyl radicals (4). This is then followed by the molecular rearrangement and
subsequent fragmentation of the oxyl radicals (4) to produce two equivalents of an
aldehyde (5) and another 2° radical (6).
R
OH
OH
O
OH
H
H
H
H
H
OO
-O2
2
R
OH
OH
O
OH
H
H
H
H
H
O
2
2
R
OH
H
H
H
O
H
OH
O
OHH
2+
R = H (4Hydroxybenzaldehyde)
R = OH (Protocatechuic aldehyde)
R = OCH3 (Vanillin)
(5)
(3) (4)
(6)
Scheme 5.2

157
A unimolecular reaction between the newly formed 2° radical (6) and O2 gives
an α–hydroxyperoxyl radical (7) as shown in Scheme 5.3. Elimination of the
perhydroxyl radical (HO2•) then occurs by the simultaneous dissociation of the C–O
bond and the intramolecular transfer of the hydrogen atom from one oxygen atom to
another (8–9), which then gives glyoxylic acid (10) (Denisov and Denisova, 2006).
Hence, based on the presences of the phenolic aldehydes produced from the
corresponding HCAs as well as the presence of glyoxylic acid detected by HPIEC
(cf. Table 5.2), it is suggested that the formation of phenolic aldehydes from HCAs
via the Fenton process is likely to occur by the reaction pathways described in
Schemes 5.1–5.3.
OH
O
OHH
+O2
OH
O
OH
O
O
H
HO2 +
OH
O
H
OO
OH
OH
O
H
OO
OH
OH
O
H
O
Glyoxylic acid
(10)
(6) (7) (8) (9)
Scheme 5.3
To date, there has been no work reported on the direct oxidative degradation
of phenolic aldehydes in aqueous systems. However, a majority of work published in
the literature on the degradation of phenolic compounds has been on phenolic acids,
particularly hydroxybenzoic acids (Beltran-Heredia et al., 2001; Heredia et al., 2001;
Peres et al., 2004). Aldehydes can easily be oxidised in air to yield carboxylic acids
because the hydrogen atom from the –CHO functional group can be abstracted during
oxidation (Larkin, 1990). Under the operating conditions of both aqueous and sucrose

158
systems, there are numerous reactions that can take place for the conversion of
aldehydes to carboxylic acids such as oxidation with O2 (Larkin, 1990), radical
formation (McElroy and Waygood, 1991), Dakin oxidation and the Cannizzaro
reaction. However, both the Dakin oxidation and Cannizzaro reactions are optimum
under basic conditions, with the latter only applicable to aldehydes without α–
hydrogen atoms. It is still possible that these two reactions can take place under mild
acidic conditions (e.g., pH 4.0–6.0). However, as an aromatic alcohol was not
detected in the present study, the Cannizzaro reaction may not have taken place.
Moreover, the Dakin oxidation reaction may not have taken place, as no benezediols
or dihydroxybenzenes were detected in the present study.
A more possible oxidation pathway for the conversion of aldehydes to
carboxylic acids is via a combination of hydration, radical formation (i.e., hydrogen
abstraction) and oxidation reactions (McElroy and Waygood, 1991; Chudasama et al.,
2010). The first reaction is a reversible reaction that is in equilibrium between the
aldehyde and the aldehyde hydrate (Scheme 5.4). In this case, the phenolic aldehyde
(11) rapidly undergoes hydration to form an aldehyde hydrate (12).
R
OH
O
H
R = H (4Hydroxybenzaldehyde)
R = OH (Protocatechuic aldehyde)
R = OCH3 (Vanillin)
(5) (11)
HO
H
R
OH
O
HO H
H
(12)
R
OH
OH
HOH
R = H, OH, OCH3 R = H, OH, OCH3
Aldehyde Hydrate
Scheme 5.4
As shown in Scheme 5.5, the •OH radical abstracts a hydrogen atom from the
aldehyde hydrate (12) forming water and a tertiary (3°) radical (13). A peroxyl
radical (14) is formed by the oxygenation of the 3° radical. Dissociation of the C–O
bond and intramolecular transfer of the hydrogen atom between oxygen atoms
(15–16), eliminates HO2• and give a phenolic acid (i.e., hydroxybenzoic acid) (17).

159
(12)
R
OH
H
H
H
OH
HOH
R = H, OH, OCH3
Aldehyde Hydrate
OH
(13)
R
OH
H
H
H
OH
OH
R = H, OH, OCH3
+OH2
O2
(14)
R
OH
H
H
H
OH
OH
O
O
R = H, OH, OCH3
(15)
R
OH
H
H
H
OH
O
O
O
H
R = H, OH, OCH3
(16)
R
OH
H
H
H
OH
O
O
O
H
R = H, OH, OCH3
(17)
R
OH
H
H
H
OH
O
+ HO2
R = H (4Hydroxybenzoic acid)
R = OH (Protocatechuic acid)
R = OCH3 (Vanillic acid)
Scheme 5.5
The oxidative pathway for the degradation of hydroxybenzoic acids via the
Fenton process have been established previously in numerous reports (Rivas et al.,
2002; Rivas et al., 2005; Duesterberg and Waite, 2007). Some of the intermediate
products from these oxidation reactions such as phenols, quinones and hydroquinones
were not detected in the present study. However, several carboxylic acids detected in
the present study (viz., oxalic, glyoxylic, formic and acetic) were reported to be
produced from the degradation of these intermediates. Hence, it is presumed that the
progressive degradation of the HCAs is through the following degradation reaction
pathways (Scheme 5.6).
On the basis of the kinetic models developed by Duesterberg and Waite
(2007), electrophilic attack by •OH on the hydroxybenzoic acid (17), particularly for
4–hydroxybenzoic and protocatechuic acids, leads to the formation of isomeric
hydroxycyclohexadienyl radicals (18) (Scheme 5.6). The isomers (18) are then
oxygenated to form two different peroxyl radicals, an 1,3–cyclohexadienyl (19) and
an 1,4–cyclohexadienyl radical (20) (Fang et al., 1995; Krimmel et al., 2010).
Elimination of HO2• from the 1,3–cyclohexaidenyl radical (19) produces a

160
hydroxylated phenolic acid (21), meanwhile the 1,4–cyclohexadienyl radical (20) is
subjected to further oxidation which may lead to ring-opened products.
(17)
R
OH
H
H
H
OH
O
R = H (4Hydroxybenzoic acid)
R = OH (Protocatechuic acid)
(18)
R
OH
H
H
OH
O
H OHOH
R = H, OH
(19)
R
OH
H
OH
O
H OH
O
H
O
O2
O2
(20)
R
OH H
OH
O
H OH
O HO
R = H, OH
R = H, OH
-HO2
(21)
R
OH
OH
O
OH
H
H
R = H (Protocatehuic acid)
R = OH (Gallic acid)
Ring-Opened Products
End Products
(e.g., Carboxylic Acids)
Scheme 5.6
However, for vanillic acid (22), an oxidation product of FeA, the methoxyl
group of (23) undergoes oxidative demethoxylation by •OH to produce a phenoxyl
radical (24) and methanol, as shown in Scheme 5.7 (O'Neill et al., 1977). The
phenoxyl radical (24) reacts with HO2• to form protocatechuic acid (25) and O2.
Subsequently, the newly formed protocatechuic acid can be subjected to electrophilic
addition by the •OH radical and react in the same manner as described in Scheme 5.6.
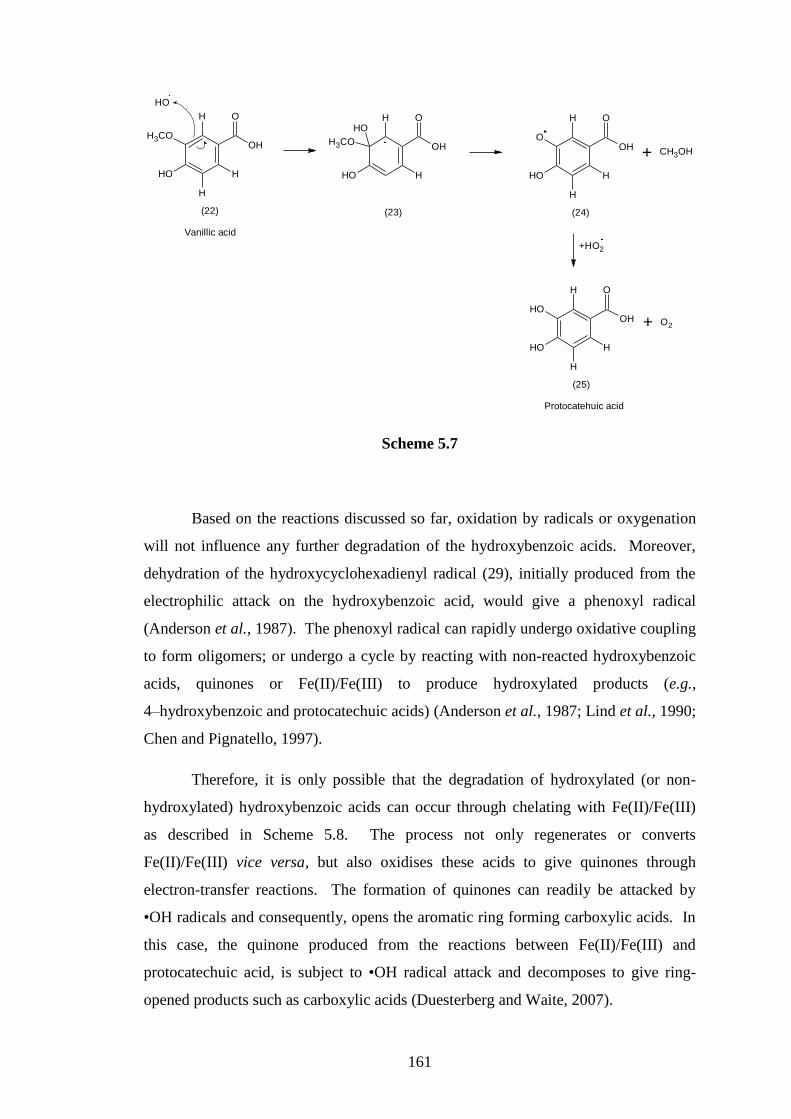
161
(22)
H3CO
OH
H
H
H
OH
O
(23)
OH
H
H
OH
OOH
H3CO
(24)
O
OH
H
OH
O
H
H
+HO2
(25)
OH
OH
OH
OH
H
H
Protocatehuic acid
+ CH3OH
Vanillic acid
HO
+ O2
Scheme 5.7
Based on the reactions discussed so far, oxidation by radicals or oxygenation
will not influence any further degradation of the hydroxybenzoic acids. Moreover,
dehydration of the hydroxycyclohexadienyl radical (29), initially produced from the
electrophilic attack on the hydroxybenzoic acid, would give a phenoxyl radical
(Anderson et al., 1987). The phenoxyl radical can rapidly undergo oxidative coupling
to form oligomers; or undergo a cycle by reacting with non-reacted hydroxybenzoic
acids, quinones or Fe(II)/Fe(III) to produce hydroxylated products (e.g.,
4–hydroxybenzoic and protocatechuic acids) (Anderson et al., 1987; Lind et al., 1990;
Chen and Pignatello, 1997).
Therefore, it is only possible that the degradation of hydroxylated (or non-
hydroxylated) hydroxybenzoic acids can occur through chelating with Fe(II)/Fe(III)
as described in Scheme 5.8. The process not only regenerates or converts
Fe(II)/Fe(III) vice versa, but also oxidises these acids to give quinones through
electron-transfer reactions. The formation of quinones can readily be attacked by
•OH radicals and consequently, opens the aromatic ring forming carboxylic acids. In
this case, the quinone produced from the reactions between Fe(II)/Fe(III) and
protocatechuic acid, is subject to •OH radical attack and decomposes to give ring-
opened products such as carboxylic acids (Duesterberg and Waite, 2007).

162
(17)
R
OH
H
H
OH
OH
O
(26)
R = H (Protocatehuic acid)
R = OH (Gallic acid)
R
OH
H
H
OH
OH
O
Fe
R = H, OH
Fe(III)
(27)
R
OH
H
OH
OH
O
H
-Fe(II)
R = H, OH
(28)
R
O
H
O
OH
O
H
1. Fe(III)
R = H, OH
2. -Fe(II)
Ring-Opened Products
OH
End Products
(e.g., Carboxylic Acids)
Scheme 5.8
An alternate and more probable pathway for the opening of the aromatic ring
than the pathway proposed by Duesterberg and Waite (2007), previously shown in
Scheme 5.8 is through the initial decarboxylation of the hydroxybenzoic acid to give a
phenol. Subsequent •OH radical attack on phenol would result in ring-opening of the
aromatic ring and give a carboxylic acid.
Scheme 5.13 shows the postulated oxidation pathways of protocatechuic acid
and gallic acid leading to the formation of carboxylic acids based on the kinetic
models developed by Rivas et al., (2005) and Chen and Pignatello (1997). Hydroxyl
radical attack on the hydroxybenzoic acid (17) followed by radical abstraction by
Fe(III) gives a stable decarboxylated phenol (30). The phenol (30) can then undergo
two reaction pathways. The first pathway is with Fe(III) to form a quinone (33)
which will then lead to formation of a C6 dicarboxylic acid (34). The other pathway
is through hydrogen abstraction, followed by the elimination of the HO2• radical to
give an intermediate (32). The intermediate (32) is then subjected to subsequent
hydrogen abstraction and HO2• elimination to give a C6 dicarboxylic acid with a
hydroxyl group at the C3 position (35). Alternatively, the intermediate (32) can react
with Fe(III) to produce a phenoxyl radical intermediate (36).

163
(17)
H
OH
H
H
OH
OH
O
(29)
R = H (Protocatehuic acid)
R = OH (Gallic acid)
R
OH
H
H
OH
H
R = H, OH
+ H2O CO2+
1. Fe(III)
2. H
OH
(30)
R
OH
H
H
OH
H
R = H, OH
+Fe(II)
1. Fe(III)
2. H
R
OH
H
H
O
H
1. OH
2. O2
(32)
R
OH
H
OH
H
OH
R = H, OH
+ HO2
1. Fe(III)
2. H
R
OH
H
OH
H
OFe(II) +
(31)
R = H, OH
(36)
R = H, OH
+ Fe(II)
1. Fe(III)
2. H
R
O
H
H
O
H
(33)
R = H, OH
+ Fe(II)
1. OH
2. O2
OHOH
O
OH O
R
(35)
R = H, OH
OH
OHOH
O
R O
(34)
R = H, OH
(cf., Scheme 5.10)
Scheme 5.9

164
Further oxidation of the phenoxyl radical intermediate (36) gives two
equivalents of malonic acid or tartronic acid (38) from protocatechuic acid and gallic
acid, respectively (Scheme 5.14). Oxidation of these carboxylic acids (38) could give
rise to acetic and glycolic acid (39), which in turn decomposes to formic acid (40) and
mineralises to CO2 and H2O (Cui et al., 2012).
(38)
(37)
R
OH
H
OH
H
O
R = H, OH
+ Fe(II)
1. Fe(III)
2. H
R
OH
H
OH
H
O
(36)
R = H, OH
OH
OHOH
O O
R
2
R = H (Malonic acid)
R = OH (Tartronic acid)
OH
OH
O
R
+ H2O + CO2
(39)
R = H (Acetic acid)
R = OH (Glycolic acid)
H2O + CO2
OH
HOH
O
(40)
(Formic acid)
Scheme 5.10

165
The C6 dicarboxylic acids produced from the ring cleavage of (32) and (33)
by the •OH radical can oxidise and break down to smaller products. For example, as
shown in Scheme 5.11, the cleavage of one of the carbon-carbon unsaturated bonds of
muconic acid (34), produced from protocatechuic acid, gives rise to two intermediates
(41) and (42). In the presence of O2, •OH radical attack on the intermediate (41)
gives oxalic acid (43). Oxalic acid (43) under these conditions readily decomposes to
formic acid (40) and mineralises to CO2 and H2O (Rivas et al., 2005; Cui et al.,
2012). Moreover, the aldehyde functional group in glyoxylic acid (10), produced
from the cleavage of the vinyl functional group of the HCAs (Scheme 5.3), can
oxidise in the same manner as described in Scheme 5.4 and 5.5 to give oxalic acid
(43).
OHOH
O
O
(34)
OH
H
O
OH
OOH
O
HOH
OOH
+
(41) (42)
OH
(43)
OHOH
O
O
2
(Oxalic acid)
OH+ H2O + CO2
H2O + CO2
HOH
O
(40)
(Formic acid)
(Muconic acid)
Scheme 5.11

166
The remaining carboxylic acids detected in the HCA mixtures; cis–aconitic
acid, butyric acid, isobutyric acid and lactic acid have not been reported in any of the
proposed mechanisms published in the literature. It is probable that these acids may
not have originated from the aromatic moiety of the HCAs. It is hypothesised that the
formation of butyric, isobutyric and lactic acids may have originated from the
aliphatic substituent of the HCAs after bond cleavage of the vinyl functional group.
On the other hand, the presence of cis–aconitic acid may have also originated from
the aliphatic substituent. Additional carboxylic acid groups on cis–aconitic acid may
have originated from other reaction intermediates and products as a result of radical
combination.
5.3.3 Oligomerisation of Selected Hydroxycinnamic Acids
From the results obtained from the LC/MS analyses, oligomeric products were
formed within 2 min of oxidation via the Fenton process. Oxidative coupling
reactions can lead to the formation of dimer products consisting of two equivalents of
HCAs (Antolovich et al., 2004). Moreover, reactions with organic radicals produced
from HCAs, are susceptible to further polymerisation to form higher oligomers such
as trimers and tetramers (Arakawa et al., 2004). Initial oligomerisation of HCAs can
possibly lead to the formation of two types of products, cyclodimers and
dehydrodimers (Ford and Hartley, 1990; Dobberstein and Bunzel, 2010). However,
cyclodimerisation reactions are photochemical and not dependent on reactions
involving free radicals (i.e., radical coupling) (Ford and Hartley, 1989).
In Scheme 5.1, the electrophilic addition of the •OH radical on a HCA was
shown. However, radicals in general not only partake in addition reactions but can
also go through abstraction and radical combination reactions as well. In Scheme
5.12, hydrogen atom abstraction by the •OH radical from the phenolic functional
group can occur, giving rise to the formation of a cinnamoyl radical (44).

167
R
O
OH
O
H
OH
R
O
OH
O
R = H (pCoumaric acid)
R = OH (Caffeic acid)
R = OCH3 (Ferulic acid)
(1)
OH2 +
R = H, OH, OCH3
(44)
Scheme 5.12
Possible resonance structures of the cinnamoyl radical are shown in Scheme
5.13, where (45) and (48) are the least and most stablilised forms of the radical by
resonance, respectively. Due to electron delocalisation of this radical, the coupling of
two cinnamoyl radicals (i.e., radical combination) can theoretically give rise to the
formation of dimers through 5–5-, 4–O–5-, 8–5-, 8–8-, and 8–O–4-coupling (Bunzel,
2010).
R
O
OHO
R = H, OH, OCH3
(45)
R
O
OHO
R = H, OH, OCH3
(46)
R
O
OHO
R = H, OH, OCH3
(47)
R
O
OHO
R = H, OH, OCH3
(48)
1
6
54
2
3
7 8
9
Scheme 5.13

168
The structure of the FeA dimer was determined on the basis of the MS
fragments obtained from the LC/MS data with confirmation from literature data
(Antolovich et al., 2004). The MS spectrum for the peak at tR = 18.87 min
(cf. Appendices, Figure A2.4), tentatively assigned to the FeA dimer shows fragments
at m/z 385, 341, 297 and 155. Losses of two CO2 molecules suggest that the
formation of the FeA dimer, under the Fenton conditions investigated was due to the
5–5-coupling of feruloyl radicals (Scheme 5.14).
H+
OCH3
OH
OH
O
H3CO
OH
OH
O
CO2
H+
OCH3
OH
CH2
H3CO
OH
OH
O
CO2
OCH3
O
CH2
H3CO
O
CH2
H
H
H+
m/z 385 m/z 341
m/z 297
Scheme 5.14

169
The structure for the tetramer of CaA was not determined due to insufficient
information obtained from the MS data. The MS spectrum of the peak at
tR = 12.75 min tentatively assigned to the tetramer of CaA had fragment ions of
m/z 715, 471, 357, 269 and 145 (cf. Appendices, Figure A2.5).
Caffeic acid, [M]– has a m/z of 179 and its deprotonated dimer from any of the
five suggested radical coupling reaction pathways would give a m/z of 357 (Arakawa
et al., 2004). Hence, further deprotonation between the coupling of two equivalents
of CaA dimers or the subsequent coupling of two caffeoyl radicals in succession to
the CaA dimer would give rise to a tetramer that would have a m/z ratio of 713 (Pati et
al., 2006), not a m/z ratio of 715. Representative structures of other tetramers of CaA
that exist naturally in plants have a m/z ratio of 713 (Bunzel, 2010). So, it is probable
that the m/z 715 ion is an adduct of the CaA dimer.
The fragmentation of m/z 357 proposed by Pati et al. (2006) is given in
Scheme 5.15. Loss of two CO2 molecules from the 5–5-coupled dimer (m/z 357)
gives a structure for the m/z 269 ion. Ring opening of one of the aromatic moieties of
the dimer and subsequent rearrangement reactions lead to the formation of a quinone
fragment ion (m/z 159) and a neutral fragment (M = 110). The m/z ion of 393 is
possibly attributable to the CaA dimer and two H2O molecules [M–2H2O]–.
The m/z ions 471 and 715 could not be elucidated on the basis of the current
information ascertained. Agha et al. (2009) proposed a structure for a tetramer of
CaA with a m/z ratio of 715, showing the coupling of a 8–8-coupled dimer and a 5–5-
coupled dimer, both at the O–4 positions (Figure 5.5). However, it is not possible for
the oxygen atoms to be coupled under these circumstances due to the instability of the
O–O single bond. In addition, it is highly unlikely for a phenolic group in only one of
the CaA moieties to exist in a semiquinone form within the tetramer. From the
foregoing, the structure of the presumed CaA tetramer (or CaA dimer adduct)
assigned to the m/z ion of 715 is not known.

170
OH
O
CH2
O
O
H
CH2
O
O
CH2
O
O
CH2
H
O
O
CH2
CH2
O
O
CH2
+
H+
OH
OH
OH
O
OH
OH
OH
O
2CO2
OH
O
CH2
H
OH
O
CH2
H
H+
m/z 357 m/z 269
H+
m/z 269
H+
m/z 269
H+
m/z 159 M = 110
Scheme 5.15

171
OH
O
OH
O
O
OHOH
O
OH
O
OH
O
OH
OH
OH
O
H+
Figure 5.5 Proposed structure of a tetramer of caffeic acid (m/z 715) by Agha
et al., (2009).
5.4 Summary
This chapter outlines an intense treatise in organic chemistry in an attempt to
determine whether the degradation products of three selected phenolic acids when
subjected to Fenton oxidation were liable to be colour precursors. Attempts were
made to identify and propose the tentative reaction pathways of oxidation products of
CaA, pCoA and FeA via the Fenton process. Eleven aromatic products and eight
aliphatic products were identified. Cleavage of the conjugated vinyl substituent of the
HCAs by electrophilic addition of •OH; and hydrogen abstraction from the phenol
group of the HCAs were the two major mechanisms initiating the degradation of HCA
via the Fenton oxidation process. The initial products undergo a series of successive
oxidation steps which lead to the formation of carboxylic acids.

172
References
Agha, A. E., Abbeddou, S., Makris, D. P., & Kefalas, P. (2009). Biocatalytic
properties of a peroxidase-active cell-free extract from onion solid wastes:
caffeic acid oxidation. Biodegradation, 20(2), 143-153.
Anderson, R. F., Patel, K. B., & Stratford, M. R. L. (1987). Radical spectra and
product distribution following electrophilic attack by the OH[radical dot]
radical on 4-hydroxybenzoic acid and subsequent oxidation. Journal of the
Chemical Society, Faraday Transactions 1: Physical Chemistry in Condensed
Phases, 83(10), 3177-3187.
Antolovich, M., Bedgood, D. R., Jr., Bishop, A. G., Jardine, D., Prenzler, P. D., &
Robards, K. (2004). LC-MS investigation of oxidation products of phenolic
antioxidants. Journal of Agricultural and Food Chemistry, 52(4), 962-971.
Arakawa, R., Yamaguchi, M., Hotta, H., Osakai, T., & Kimoto, T. (2004). Product
analysis of caffeic acid oxidation by on-line electrochemistry/electrospray
ionization mass spectrometry. Journal of the American Society for Mass
Spectrometry, 15, 1228-1236.
Becke, A. D. (1988). Density-functional exchange-energy approximation with correct
asymptotic behavior. Physical Review A, 38(6), 3098-3100.
Beltran-Heredia, J., Torregrosa, J., Dominguez, J. R., & Peres, J. A. (2001).
Comparison of the degradation of p-hydroxybenzoic acid in aqueous solution
by several oxidation processes. Chemosphere, 42, 351-359.
Bunzel, M. (2010). Chemistry and occurrence of hydroxycinnamate oligomers.
Phytochemistry Reviews, 9, 47-64.
Chen, R., & Pignatello, J. J. (1997). Role of quinone intermediates as electron shuttles
in Fenton and photoassisted Fenton oxidations of aromatic compounds.
Environmental Science and Technology, 31, 2399-2406.
Chudasama, V., Fitzmaurice, R. J., & Caddick, S. (2010). Hydroacylation of α,β-
unsaturated esters via aerobic C–H activation. Nature Chemistry, 2(7), 592-
596.
Cilliers, J. J. L., & Singleton, V. L. (1991). Characterization of the products of
nonenzymic autoxidative phenoilc reactions in a caffeic acid model system.
Journal of Agricultural and Food Chemistry, 39(7), 1298-1303.
Cui, Y.-H., Feng, Y.-J., Liu, J., & Ren, N. (2012). Comparison of various organic
compounds destruction on rare earths doped Ti/Sb-SnO2 electrodes. Journal of
Hazardous Materials, 239–240(0), 225-232.
Denisov, E. T., & Denisova, T. G. (2006). Kinetics and thermodynamics of formation
and degradation of α-hydroxyperoxyl radicals. Petroleum Chemistry, 46(6),
373-383.
173
Dobberstein, D., & Bunzel, M. (2010). Identification of ferulate oligomers from corn
stover. Journal of the Science of Food and Agriculture, 90(11), 1802-1810.
Duesterberg, C. K., & Waite, T. D. (2007). Kinetic modeling of the oxidation of p-
hydroxybenzoic acid by Fenton's reagent: Implications of the role of quinones
in the redox cycling of iron. Environmental Science & Technology, 41(11),
4103-4110.
Fang, X., Pan, X., Rahmann, A., Schuchmann, H.-P., & von Sonntag, C. (1995).
Reversibility in the reaction of cyclohexadienyl radicals with oxygen in
aqueous solution. Chemistry – A European Journal, 1(7), 423-429.
Fifen, J. J., Nsangou, M., Dhaouadi, Z., Motapon, O., & Lahmar, S. (2009). Single or
double hydrogen atom transfer in the reaction of metal – associated phenolic
acids with ˙OH radical: DFT study. Journal of Molecular Structure:
THEOCHEM, 901, 49-55.
Ford, C. W., & Hartley, R. D. (1989). GC/MS characterisation of cyclodimers from p-
coumaric and ferulic acids by photodimerisation—a possible factor
influencing cell wall biodegradability. Journal of the Science of Food and
Agriculture, 46(3), 301-310.
Ford, C. W., & Hartley, R. D. (1990). Cyclodimers of p-coumaric and ferulic acids in
the cell walls of tropical grasses. Journal of the Science of Food and
Agriculture, 50(1), 29-43.
Frisch, M. J., Pople, J. A., & Binkley, J. S. (1984). Self-consistent molecular orbital
methods 25. Supplementary functions for Gaussian basis sets. The Journal of
Chemical Physics, 80(7), 3265-3269.
Fulcrand, H., Cheminat, A., Brouillard, R., & Cheynier, V. (1994). Characterization
of compounds obtained by chemical oxidation of caffeic acid in acidic
conditions. Phytochemistry, 35(2), 499-505.
Heredia, J. B. D., Torregrosa, J., Dominguez, J. R., & Peres, J. A. (2001). Kinetic
model for phenolic compound oxidation by Fenton's reagent. Chemosphere,
45, 85-90.
Krimmel, B., Swoboda, F., Solar, S., & Reznicek, G. (2010). OH-radical induced
degradation of hydroxybenzoic- and hydroxycinnamic acids and formation of
aromatic products—A gamma radiolysis study. Radiation Physics and
Chemistry, 79, 1247-1254.
Larkin, D. R. (1990). The role of catalysts in the air oxidation of aliphatic aldehydes.
The Journal of Organic Chemistry, 55(5), 1563-1568.
Lee, C., Yang, W., & Parr, R. G. (1988). Development of the Colle-Salvetti
correlation-energy formula into a functional of the electron density. Physical
Review B, 37(2), 785-789.

174
Lind, J., Shen, X., Eriksen, T. E., & Merenyi, G. (1990). The one-electron reduction
potential of 4-substituted phenoxyl radicals in water. Journal of the American
Chemical Society, 112(2), 479-482.
Marusawa, H., Ichikawa, K., Narita, N., Murakami, H., Ito, K., & Tezuka, T. (2002).
Hydroxyl radical as a strong electrophilic species. Bioorganic & Medicinal
Chemistry, 10(7), 2283-2290.
McElroy, W. J., & Waygood, S. J. (1991). Oxidation of formaldehyde by the
hydroxyl radical in aqueous solution. Journal of the Chemical Society,
Faraday Transactions, 87(10), 1513-1521.
Neyens, E., & Baeyens, J. (2003). A review of classic Fenton’s peroxidation as an
advanced oxidation technique. Journal of Hazardous Materials, B98, 33-50.
Nsangou, M., Fifen, J. J., Dhaouadi, Z., & Lahmar, S. (2008). Hydrogen atom transfer
in the reaction of hydroxycinnamic acids with •OH and •HO2 radicals: DFT
study. Journal of Molecular Structure: THEOCHEM, 862, 53-59.
O'Neill, P., Schulte-Frohlinde, D., & Steenken, S. (1977). Formation of radical
cations and zwitterions versus demethoxylation in the reaction of OH with a
series of methoxylated benzenes and benzoic acids. An example of the
electrophilic nature of the OH radical. Faraday Discussions of the Chemical
Society, 63(0), 141-148.
Pati, S., Losito, I., Palmisano, F., & Zambonin, P. G. (2006). Characterization of
caffeic acid enzymatic oxidation by-products by liquid chromatography
coupled to electrospray ionization tandem mass spectrometry. Journal of
Chromatography A, 1102(1–2), 184-192.
Peres, J. A. S., Melo de Carvalho, L. H., Boaventura, R. A. R., & Costa, C. A. V.
(2004). Characterisitics of p-hydroxybenzoic acid oxidation using Fenton's
reagent. Journal of Environmental Science and Health, Part A:
Toxic/Hazardous Substances & Environmental Engineering, A39(11-12),
2897-2913.
Poerschmann, J., Trommler, U., & Górecki, T. (2010). Aromatic intermediate
formation during oxidative degradation of Bisphenol A by homogeneous sub-
stoichiometric Fenton reaction. Chemosphere, 79, 975-986.
Pulay, P. (1980). Convergence acceleration of iterative sequences. the case of scf
iteration. Chemical Physics Letters, 73(2), 393-398.
Rivas, F. J., Beltrán, F. J., Garcia-araya, J. F., Navarrete, V., & Gimeno, O. (2002).
Co-oxidation of p-hydroxybenzoic acid and atrazine by the Fenton’s like
system Fe(III)/H2O2. Journal of Hazardous Materials, B91, 143-157.
Rivas, F. J., Frades, J., Alonso, M. A., Montoya, C., & Monteagudo, J. M. (2005).
Fenton's oxidation of food processing wastewater components. Kinetic
modeling of protocatechuic acid degradation. Journal of Agricultural and
Food Chemistry, 53, 10097-10104.

175
Šmejkalová, D., Piccolo, A., & Spiteller, M. (2006). Oligomerization of humic
phenolic monomers by oxidative coupling under biomimetic catalysis.
Environmental Science & Technology, 40(22), 6955-6962.
Tazaki, H., Taguchi, D., Hayashida, T., & Nabeta, K. (2001). Stable isotope-labeling
studies on the oxidative coupling of caffeic acid via o-quinone. Bioscience,
Biotechnology, and Biochemistry, 65(12), 2613-2621.
Thai, C. C. D., & Doherty, W. O. S. (2011). The composition of sugarcane juices
derived from burnt cane and whole green cane crop. Proceedings of the
Australian Society of Sugar Cane Technologists, 33
Van Voorhis, T., & Head-Gordon, M. (2002). A geometric approach to direct
minimization. Molecular Physics, 100(11), 1713-1721.
von Sonntag, C., & Schuchmann, H.-P. (1991). The elucidation of peroxyl radical
reactions in aqueous solution with the help of radiation-chemical methods.
Angewandte Chemie International Edition in English, 30(10), 1229-1253.

176

177
CHAPTER 6
Degradation of Melanoidin and
Hydroxycinnamic Acid Mixtures
6.1 Introduction..................................................................................... 177
6.2 Materials and Methods................................................................... 178
6.2.1 Reagents and Solvents......................................................... 178
6.2.2 Preparation of Synthetic Melanoidin.................................. 179
6.2.3 Modified Fenton Oxidation Process.................................... 179
6.2.4 Instrumental Procedures and Analyses............................... 179
6.2.5 Performance Assessment of the Modified Fenton
Oxidation Process...............................................................
180
6.2.6 Design of Experiments......................................................... 181
6.2.7 Statistical Analysis.............................................................. 182
6.3 Results and Discussion.................................................................... 182
6.3.1 Monitoring Melanoidin and Hydroxycinnamic Acid
Degradation.........................................................................
182
6.3.2 Transformation of Data, Regression Modelling and
Statistical Analysis..............................................................
184
6.3.3 Oxidation Performance of Melanoidins.............................. 190
6.3.4 Oxidation Performance of Hydroxycinnamic Acids............ 194
6.3.5 Response Surface Analyses for the Decolourisation of
Mixtures...............................................................................
198
6.3.6 Process Optimisation and Validation.................................. 200
6.4 Summary.......................................................................................... 203

178
6.1 Introduction
The Fenton process has been shown to oxidise and degrade model colour
precursor compounds in water and sucrose solutions. However, the numerous
oxidation products formed and the presence of starting materials (viz., CaA, pCoA
and FeA) indicate that the Fenton process on its own, would not effectively
decolourise factory sugar cane juice.
Dwyer et al., (2009) studied the removal of factory and synthetic melanoidins
(factory produced colourants during sugar manufacture), using hydrated aluminium
sulfate (Al2(SO4)3.xH2O). The results from the study showed that an Al2(SO4)3 dose
of 30 mg/L as aluminium ion (Al(III)) was sufficient to remove 75% of colour from
factory effluents contaminated with melanoidins. Aluminium is known for its
significant pro-oxidant activity, and so can enhance the Fenton process by reducing
Fe(III) to Fe(II) under the presence of superoxide (Exley, 2004; Ruipérez et al.,
2012). This is because Fe(II) is a more effective catalyst for H2O2 decomposition
than Fe(III).
This study builds on these investigations by examining the degradation and
decolourisation of a complex mixture of a synthetic melanoidin and HCAs using a
modified Fenton process consisting of Fe(II), Al(III) and H2O2.
6.2 Materials and Methods
6.2.1 Reagents and Solvents
All chemicals, solvents and reagents were of AR grade and obtained from the
suppliers as described in the previous chapters or as otherwise stated. Aluminium
chloride hexahydrate (AlCl3·6H2O) and glycine were supplied from Merck
(Darmstadt, Germany). Stock solutions of hydroxycinnamic acids, HCAs (i.e., CaA,
pCoA and FeA) were prepared individually by dissolution in degassed ethanol
solution (50% (v/v)) and stored at 4.0 °C.

179
6.2.2 Preparation of Synthetic Melanoidin
The synthesis procedure used for the preparation of a synthetic melanoidin
was adapted from Shore et al., (1984). Glucose (72 g) and glycine (30 g) were
dissolved in water (60 mL) and incubated at 50 °C for 72 h. The resulting co-polymer
was then stored at 4.0 °C.
6.2.3 Modified Fenton Oxidation Process
The procedure for the degradation of the mixtures is similar to that described
in Sections 4.2.4 and 5.2.2. In each run, a predetermined amount of Milli-Q water,
melanoidin, sucrose and each HCA (equivalent mg/L concentration) were added to
the reaction vessel. Known amounts of FeSO4·7H2O, AlCl3·6H2O and H2O2 solutions
were added to achieve a final volume of 50 mL, while maintaining the working
Fenton molar ratio (Fe(II)/H2O2) at 1:15. The final sucrose concentration in each
mixture was 15% (w/w). At 2 min, the reaction was immediately quenched by
neutralising the mixture to a pH of 7.0 with 2.0 M NaOH and stored at –80 °C.
Samples were defrosted and prepared for instrumental analysis.
6.2.4 Instrumental Procedures and Analyses
HPLC-DAD/FLD. The proportion of each HCA and melanoidin degraded
were monitored by reversed-phase HPLC-DAD and fluorescence detection (FLD).
The analysis was performed on a Hewlett Packard HP/Agilent 1100 Series HPLC
system (G1379A micro-degasser, Japan; G1311A quaternary pump, Germany;
G1313A Automatic Liquid Sampler (ALS), Germany; G1315B DAD, Germany;
G1321A FLD, Germany) using a Waters Symmetry C18 column (150 × 3.9 mm i.d.)
with a Waters Guard-Pak guard holder containing a Waters Guard-Pak Resolve C18
guard insert (10 μm) (Milford, MA, USA). The mobile phase consisted of 1.0% (v/v)
acetic acid in water (as eluent A) and methanol (as eluent B). The gradient program
was as follows: 0% B to 10% B (1 min), 10% B to 20% B (1 min), 20% B to 25% B
(3 min), 25% B to 50% B (15 min) and 50% B to 20% B (5 min). Simultaneous
UV/Vis detection at specific wavelengths (280 nm and 320 nm) subtracted against a

180
reference wavelength (620 nm). Fluorescence detection was performed at an
excitation wavelength (λex) of 350 nm and an emission wavelength (λem) of 445 nm.
Aliquots of samples were membrane filtered (0.45 μm) prior to injection into the
HPLC system. Injection volume for all samples was 50 μL; column temperature was
ambient; flow rate was 1.0 mL/min and run time was 25 min. After each run, the
chromatographic system was equilibrated for 5 min. Data acquisition was performed
using the Agilent ChemStation (Rev. A.09.03) software package. Identification of
peaks was based on the conformance of UV/Vis spectra and retention times with the
corresponding authentic standards.
HPAEC-PAD. Sucrose and reducing contents in the reactions were monitored
by HPAEC-PAD. Sample preparation and chromatographic conditions are described
in Section 4.2.5.
6.2.5 Performance Assessment of the Modified Fenton Oxidation Process
The efficiency of the modified Fenton process on the degradation of the CaA,
pCoA and FeA was determined individually based on the change in absorbance of the
corresponding HPLC chromatographic peak using Equation 4.1. The degradation
efficiency of the melanoidin was determined on the basis of the changes in
luminescence of the corresponding HPLC chromatographic peak using Equation 6.1:
0
0
% Melanoidin degradation = 100tL L
L
(6.1)
where, L0 initial luminescence of melanoidin in LU (at t = 0 min)
Lt luminescence of melanoidin in LU at time of aliquot taken
(at t = 2 min)
The decolourisation efficiency of the synthetic mixtures was determined based
on the change in colour of the mixtures prior to oxidation and at 2 min, using
Equation 6.2. Procedures for the measurements of colour, RI and TSS are described
in Section 3.2.6.

181
0
0
% Decolourisation = 100tColour Colour
Colour
(6.2)
where, Colour0 initial colour of the mixture in IU (at t = 0 min)
Colourt colour of the mixture in IU at time of aliquot taken
(at t = 2 min)
6.2.6 Design of Experiments
Design of experiments, mathematical modelling and optimisation of process
parameters were evaluated using the Stat-Ease, Inc. Design-Expert 7.0.0 software
package (Minneapolis, MN, USA).
A rotatable circumscribed CCD with a half-fractional factorial was used to
evaluate the main effect for each condition and the possible interactive effects on the
residual stresses between two variables. The process parameters (independent
variables) used in this study were the melanoidin concentration (x1), the initial total
HCA concentration (x2), the solution pH (x3), FeSO4·7H2O dosage (x4) and the
AlCl3·6H2O (x5). The selected response factors (dependent variable) for optimisation
were % melanoidin degradation (y1), % total HCA degradation (y2) and
% decolourisation (y3). Sucrose concentration and temperature parameters required
no further optimisation and remained constant at 15% (w/w) and 35 °C respectively,
to closely mimic conditions of MJ during the sugar manufacturing process. The
coded and actual values of each variable and their levels for the experimental design
used in the study are shown in Table 6.1.

182
Table 6.1 Coded and actual values of the experimental design.
Coded Levels of Parameters
Notation Factor Unit –2 –1 0 +1 +2
A (x1) Melanoidin mg/L 0 500 1000 1500 2000
B (x2) Total HCA mg/L 0 50 100 150 200
C (x3) pH 4.50 4.88 5.25 5.63 6.00
D (x4) FeSO4·7H2O mg/L 86.0 238 389 541 692
E (x5) AlCl3·6H2O mg/L 0 100 200 300 400
The design consisted of a 2k factorial augmented by 2k axial points and a
centre point, where k is the number of factors investigated (k = 5). For this study,
when the one-half fraction is used in the factorial portion of the CCD, a total of 32
experiments were conducted in random order with 16 factorial points, 10 axial points
and 1 centre point (duplicated 5 times). Duplicate runs were required for
experimental error calculation.
6.2.7 Statistical Analysis
Analysis of variance was used for model adequacy and analysis of the
experimental data. The quality of the fit polynomial model was expressed by the
regression coefficient, R2 and its statistical significance was checked using Fisher’s
F-test. Model terms were determined based on the significance of each term at a
confidence level of 95%.
6.3 Results and Discussion
6.3.1 Monitoring Melanoidin and Hydroxycinnamic Acid Degradation
The reversed-phase HPLC analyses show that the melanoidin components
were eluted between tR = 0.85–5.0 min (Figure 6.1), while the HCAs were eluted
between tR = 8.5–13.5 min (Figure 6.2). The FLD method is a far more superior
detection method than the DAD method for the monitoring of melanoidins and humic-

183
like substance, as evident from the chromatogram of Figures 6.1 and 6.2 (Westerhoff
et al., 2001). Meanwhile, the latter is more sensitive for the detection of HCAs.
Figure 6.1 shows that the synthetic glucose-glycine melanoidin consists of
several products which are relatively polar in comparison to the non-polar HCAs. A
distinctive large peak prior to oxidation (t = 0 min) at tR = 2.11 min was chosen to
monitor the degradation of the melanoidin. At 2 min, the peaks at tR = 1.79 and 2.11
min at tR = 1.79 min are reduced in size. However, the peak at tR = 1.18 min
increased in size. This probably suggests that the components associated with tR =
1.79 and 2.11 min are oxidised to polar compounds at 2 min. On the other hand, a
large response was observed for the peak at tR = 1.18 min after oxidation. This
suggests that the two components of the melanoidin present at t = 0 are being oxidised
to form polar compounds.
Figure 6.1 Typical HPLC-FLD chromatogram (fluorescence detection at
λex = 350 nm and λem = 445 nm) of the melanoidin/HCA mixture in
sucrose solution (15% (w/w)) before and after modified Fenton
oxidation (t = 2 min) at pH 5.6 and 35 °C.
0 2 4 6 8 10
Ab
sorb
an
ce (
Arb
itra
ry U
nit
s)
Retention Time (min)
t = 0 min
t = 2 min

184
Figure 6.2 Typical HPLC-DAD chromatogram (UV/Vis detection at 280 nm)
of the melanoidin/phenolic acid mixture in sucrose solution
(15% (w/w)) before and after modified Fenton oxidation
(t = 2 min) at pH 5.6 and 35 °C. 1 = CaA, 2 = pCoA, 3 = FeA.
6.3.2 Transformation of Data, Regression Modelling and Statistical Analysis
Non-linearity of normal probability plots of residuals for the fitted models of
melanoidin and total HCA degradation were resolved via Box-Cox power
transformation (cf. Appendices, Figure A3.1). The optimum λ values determined by
the minimum of the curve of the Box-Cox plots for the degradation of the melanoidin
and total HCA were –3.00 and –0.35 respectively (cf. Appendices, Figure A3.2). The
fitted model for decolourisation did not require any data transformation (λ = 1.00) as
the internally studentised residual points resembled a linear curve. The data for all
fitted response surface models show good correspondence to a normal distribution
and validated the normality assumption.
On the basis of the sequential model sum of squares (Type I), the power
transformed response surface models for melanoidin degradation (y1) and total HCA
degradation (y2); as well as the response surface model for decolourisation (y3) were
selected based on the highest order polynomial, where the additional model terms
were significant and the models were not aliased. The degradation data obtained for
the melanoidin and total HCA responses fit a two-factor interaction (2FI) function,
4 6 8 10 12 14
Ab
sorb
an
ce (
Arb
itra
ry U
nit
s)
Retention Time (min)
t = 0 min
t = 2 min
1
2
3

185
while the data for the decolourisation of the mixtures fits a quadratic polynomial
function.
Selection of significant coefficients and removal of unimportant model terms
for each model were identified on the basis of ANOVA statistics and stepwise
regression at an alpha-to enter and alpha-to-exit significance level of 0.1. The chosen
stepwise alpha range applied to all three response surface models should result in final
models with significant model terms included at the approximate 95% confidence
level.
The ANOVA results for the partial sum of squares (Type III) for the three
response surface reduced quadratic or 2FI models after stepwise regression are shown
in Tables 6.2–6.4. The analyses indicate that most of the independent variables and
some of the interactions are significant and contribute to the degradation of the
melanoidin and the HCAs, as well as the decolourisation of the mixtures. The model
F-values of 8.09, 8.96 and 18.27 for melanoidin degradation, total HCA degradation
and decolourisation respectively, imply that the models are significant. There is only
a 0.01% chance that a model F-value this large could occur due to noise. The lack of
fit F-values of 0.47, 0.72 and 1.91 for the melanoidin degradation, total HCA
degradation and decolourisation models in that order imply that the lack of fit is not
significant relative to pure error. There is a 87.52%, 70.95% and 27.86% chance
respectively that the lack-of-fit F-values this large would occur due to noise. Non-
significant lack of fit is good as it confirms the predictability of the model.
The independent variables in the models were initial melanoidin
concentration, initial total HCA concentration, solution pH, FeSO4·7H2O dosage and
AlCl3·6H2O dosage; and were coded A, B, C, D and E respectively. The final
empirical quadratic equations in terms of coded factors for each response after the
exclusion of the insignificant model terms (p > 0.1000), unless retained to make the
models hierarchical, are as follows:

186
Melanoidin degradation (%)
(y1)–3 = 3.447 × 10⁻⁶ – 1.614 × 10⁻⁷A + 1.286 × 10⁻⁷B
+1.764 × 10⁻⁷C – 8.041 × 10⁻⁸D – 1.853 × 10⁻⁸E
+ 1.938 × 10⁻⁷AE + 2.606 × 10⁻⁷CD + 1.362 × 10⁻⁷CE
– 4.267 × 10⁻⁷DE
(6.3)
Total HCA degradation (%)
(y2)–0.35 = 0.26 + 1.094 × 10⁻³A – 1.207 × 10⁻⁴B + 1.219 × 10⁻³C
– 2.202 × 10⁻³D + 5.081 × 10⁻⁴E + 1.737 × 10⁻³AC
– 4.064 × 10⁻³AD + 1.926 × 10⁻³BD – 2.491 × 10⁻³BE
(6.4)
Decolourisation (%)
(y3) = 13.78 + 12.06A – 1.49B + 7.11C – 9.66D – 3.34E
+ 14.83AE + 23.60BC – 16.89BD – 12.99BE + 9.12CD
– 13.28DE – 10.78A2 + 3.89E2
(6.5)
The predicted R2 values of all response surface models are in reasonable
agreement with the adjusted R2 values, which show that the fitted models are
adequate. Plots of the predicted response against the experimental values for the three
models show good linearity, indicating that the developed mathematical models are
suitable for predicting melanoidin degradation, total HCA degradation and
decolourisation (cf. Appendices, Figures A3.2–A3.3).

187
Table 6.2 Results of ANOVA for model terms of the response surface
reduced two-factor interaction model for melanoidin
degradation.*
Source SS df Mean Sq. F-value p-value Remarks
Model 5.22 × 10⁻¹² 9 5.80 × 10⁻¹² 8.09 < 0.0001 Significant
A 4.61 × 10⁻¹³ 1 4.61 × 10⁻¹³ 6.43 0.0207 Significant
B 3.65 × 10⁻¹³ 1 3.65 × 10⁻¹³ 5.09 0.0368 Significant
C 5.68 × 10⁻¹³ 1 5.68 × 10⁻¹³ 7.92 0.0115 Significant
D 1.15 × 10⁻¹³ 1 1.15 × 10⁻¹³ 1.60 0.2224 Insignificant
E 7.58 × 10⁻¹⁵ 1 7.58 × 10⁻¹⁵ 0.11 0.7488 Insignificant
AE 5.31 × 10⁻¹³ 1 5.31 × 10⁻¹³ 7.41 0.0140 Significant
CD 9.60 × 10⁻¹³ 1 9.60 × 10⁻¹³ 13.39 0.0018 Significant
CE 2.62 × 10⁻¹³ 1 2.62 × 10⁻¹³ 3.66 0.0719
DE 2.57 × 10⁻¹² 1 2.57 × 10⁻¹² 35.90 < 0.0001 Significant
Residual 1.29 × 10⁻¹² 18 7.17 × 10⁻¹²
Lack of Fit 7.08 × 10⁻¹³ 13 5.44 × 10⁻¹³ 0.47 0.8752 Insignificant
Pure Error 5.83 × 10⁻¹³ 5 1.17 × 10⁻¹³
Corr. Total 6.51 × 10⁻¹² 27
Criteria
Standard Deviation 2.68 × 10–07
Mean 3.41 × 10–06
CV (%) 7.85
PRESS 3.14 × 10⁻¹²
R2 0.80
Adjusted R2 0.70
Predicted R2 0.52
Adequate Precision 11.45
*SS (Sum of Squares), df (degrees of freedom), Mean sq. (Mean Square),
Corr. (Corrected)

188
Table 6.3 Results of ANOVA for model terms of the response surface
reduced two-factor interaction model for total HCA degradation.*
Source SS df Mean Sq. F-value p-value Remarks
Model 6.20 × 10–04 9 6.88 × 10–05 8.96 < 0.0001 Significant
A 2.27 × 10–05 1 2.27 × 10–05 2.95 0.1038 Insignificant
B 2.19 × 10–07 1 2.19 × 10–07 0.028 0.8679 Insignificant
C 3.16 × 10–05 1 3.16 × 10–05 4.11 0.0585 Insignificant
D 8.18 × 10–05 1 8.18 × 10–05 10.64 0.0046 Significant
E 5.49 × 10–06 1 5.49 × 10–06 0.71 0.4098 Insignificant
AC 3.46 × 10–05 1 3.46 × 10–05 4.50 0.0489 Significant
AD 1.89 × 10–04 1 1.89 × 10–04 24.63 0.0001 Significant
BD 4.25 × 10–05 1 4.25 × 10–05 5.53 0.0310 Significant
BE 7.11 × 10–05 1 7.11 × 10–05 9.25 0.0074 Significant
Residual 1.31 × 10–04 17 7.69 × 10–06
Lack of Fit 9.15 × 10–05 13 7.04 × 10–06 0.72 0.7095 Insignificant
Pure Error 3.92 × 10–05 4 9.80 × 10–06
Corr. Total 7.50 × 10–04 26
Criteria
Standard Deviation 2.77 × 10–03
Mean 0.26
CV (%) 1.08
PRESS 3.10 × 10–04
R2 0.83
Adjusted R2 0.73
Predicted R2 0.59
Adequate Precision 13.55
*SS (Sum of Squares), df (degrees of freedom), Mean sq. (Mean Square),
Corr. (Corrected)
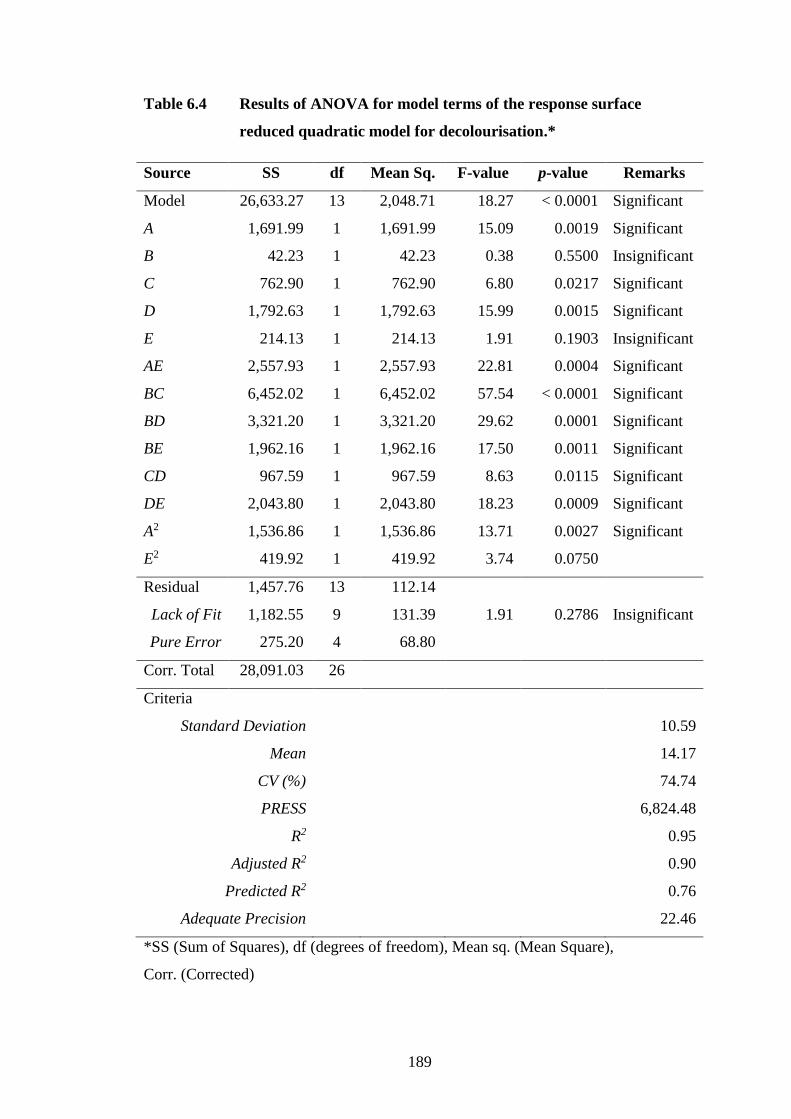
189
Table 6.4 Results of ANOVA for model terms of the response surface
reduced quadratic model for decolourisation.*
Source SS df Mean Sq. F-value p-value Remarks
Model 26,633.27 13 2,048.71 18.27 < 0.0001 Significant
A 1,691.99 1 1,691.99 15.09 0.0019 Significant
B 42.23 1 42.23 0.38 0.5500 Insignificant
C 762.90 1 762.90 6.80 0.0217 Significant
D 1,792.63 1 1,792.63 15.99 0.0015 Significant
E 214.13 1 214.13 1.91 0.1903 Insignificant
AE 2,557.93 1 2,557.93 22.81 0.0004 Significant
BC 6,452.02 1 6,452.02 57.54 < 0.0001 Significant
BD 3,321.20 1 3,321.20 29.62 0.0001 Significant
BE 1,962.16 1 1,962.16 17.50 0.0011 Significant
CD 967.59 1 967.59 8.63 0.0115 Significant
DE 2,043.80 1 2,043.80 18.23 0.0009 Significant
A2 1,536.86 1 1,536.86 13.71 0.0027 Significant
E2 419.92 1 419.92 3.74 0.0750
Residual 1,457.76 13 112.14
Lack of Fit 1,182.55 9 131.39 1.91 0.2786 Insignificant
Pure Error 275.20 4 68.80
Corr. Total 28,091.03 26
Criteria
Standard Deviation 10.59
Mean 14.17
CV (%) 74.74
PRESS 6,824.48
R2 0.95
Adjusted R2 0.90
Predicted R2 0.76
Adequate Precision 22.46
*SS (Sum of Squares), df (degrees of freedom), Mean sq. (Mean Square),
Corr. (Corrected)

190
6.3.3 Oxidation Performance of Melanoidins
On the basis of the coefficients of the first-order model terms in the cubed
inverse model for melanoidin degradation (Equation 6.3), it is obvious that the
degradation efficiency of the melanoidin increases with increasing initial melanoidin
concentration (A). However, it is evident that the degradation efficiency decreases
with increasing initial HCA concentration (B) and at higher initial pH (C). There
were no significant positive effects on the degradation of melanoidins at varying
dosages of FeSO4·7H2O (D) and AlCl3·6H2O (E). This suggests that the ranges of the
working dosages for the Fenton and Al(III) additives used in this study require no
further optimisation and can degrade melanoidins up to 2,000 mg/L in a sugar
solution containing 15% (w/w) sucrose. Hence, it is possible to use lower dosages of
both Fenton and Al(III) additives to effectively degrade melanoidins. However, based
on the perturbation plot for melanoidin degradation (Figure 6.3), the Fenton reagents
are more effective than Al(III) in the degradation of melanoidins. The plot confirms
that the presence of HCAs has a large influence on the degradation of melanoidins as
the •OH radicals produced during the modified Fenton process have a stronger
preference to oxidise HCAs than melanoidins.
The significant two-factor interactive parameters for the degradation of
melanoidins in the mixture via the modified Fenton oxidation process are melanoidin
concentration and AlCl3·6H2O dosage (AE); pH and FeSO4·7H2O dosage (CD); pH
and AlCl3·6H2O dosage (CE); and FeSO4·7H2O dosage and AlCl3·6H2O dosage
(DE). Contour plots (Figures 6.4 and 6.5) were used to investigate the relationships
between the pairs of interactive parameters of the developed model (Equation 6.3).
Amongst the pairs, CD (p = 0.0018) and DE (p < 0.0001) were the most statistically
significant interactions followed by AE (p = 0.0140) then CE (p = 0.0719). Hence,
the corresponding plots for AE and CE shown in Figures 6.4a and 6.5a only show
slight changes in colour associated to the amount of melanoidin degraded (64–67%).
This indicates that Al(III) contributes to the degradation of the melanoidin, only to a
small extent, with changing initial melanoidin concentration or solution pH.
Therefore, it is not necessary to use higher dosages of Al(III) with the Fenton process
to degrade melanoidins. However, there are stronger relationships between CD
(Figure 6.4b) and DE (Figure 6.5b), both showing wider ranges in the amounts of
melanoidin degraded with 65–69% and 63–69% degradation respectively.

191
Figure 6.3 Perturbation plot for (%) melanoidin degradation. Coded values
are shown for each factor: melanoidin (A); total HCA (B); pH (C);
FeSO4·7H2O dose (D) and AlCl3·6H2O dose (E); and refer to
actual values listed in Table 6.1.
Optimal degradation of melanoidin is achieved at increasing FeSO4·7H2O
dosage at lower initial pH (Figure 6.4b). The optimal degradation performance can be
maintained at 69% but gradually decreases with decreasing FeSO4·7H2O dosage and
increasing pH. The oxidative performance is reduced at increasing pH and
FeSO4·7H2O dosage, as it is expected that the deactivation of Fe(II) would occur by
the precipitation of Fe(III) oxyhydroxides in solution (Cortez et al., 2011).

192
Figure 6.4 Contour plots of melanoidin degradation (%) as a function of
(a) melanoidin and AlCl3·6H2O dosage; (b) pH and FeSO4·7H2O
dosage. Variables: melanoidin (1,500 mg/L); total HCA
(150 mg/L); pH (5.25); FeSO4·7H2O dosage (389 mg/L) and
AlCl3·6H2O dosage (200 mg/L).
(a)
(b)

193
Figure 6.5 Contour plots of melanoidin degradation (%) as a function of
(a) pH and AlCl3·6H2O dosage; (b) FeSO4·7H2O dosage and
AlCl3·6H2O dosage. Variables: melanoidin (1,500 mg/L); total
HCA (150 mg/L); pH (5.25); FeSO4·7H2O dosage (389 mg/L) and
AlCl3·6H2O dosage (200 mg/L).
(a)
(b)

194
Interestingly, the modified Fenton oxidation performance depends on both the
dosages of both FeSO4·7H2O and AlCl3·6H2O. As shown in Figure 6.5b, lower or
higher amounts of both reagents used together would result in improved melanoidin
degradation (68–69%). However, the degradation efficiency is reduced slightly to
66%, if Fe(II) and Al(III) were dosed at any other given concentration than the
extremes (e.g., the median values of both dosages, 389 mg/L FeSO4·7H2O and
200 mg/L AlCl3·6H2O). High dosages of FeSO4·7H2O/AlCl3·6H2O and low dosages
of the other vice versa would result in poor oxidation performance on melanoidin
degradation.
6.3.4 Oxidation Performance of Hydroxycinnamic Acids
Similar to Equation 6.3, the model for the degradation of HCAs in a synthetic
mixture containing sucrose and melanoidin via the modified Fenton process is also a
negative exponent function of the independent variables (i.e., xn, where n = 1–5). On
the basis of the coefficients from Equation 6.4, FeSO4·7H2O dosage (D) is the most
influential parameter for the degradation of HCAs, where increasing the dosage of
FeSO4·7H2O for the Fenton oxidation process enhances the degradation of HCAs
within the mixture. This is also noticeable in the perturbation plot shown in Figure
6.6. However, increasing AlCl3·6H2O (E) does not assist in the degradation of HCAs
unlike for the melanoidin component within the same mixture. Hence, it can be
concluded that the removal of HCAs (or other similar phenolic compounds) is
primarily attributable to the Fenton process only.
There were no changes in total HCA degradation at any given HCA
degradation (B) tested. This shows us that the under the various modified Fenton
conditions, a consistent amount of HCA will be degraded (ca. 48%), hence, lower
dosages of the Fe(II) and Al(III) can be reduced in order to minimise costs. A similar
trend in the degradation behaviour of the HCAs to melanoidin degradation for initial
solution pH (C) was also observed. Increasing pH would result in deactivation of the
radicals and ions required to regenerate and maintain the oxidation process.

195
Figure 6.6 Perturbation plot for (%) total HCA degradation. Coded values
are shown for each factor: melanoidin (A); total HCA (B); pH (C);
FeSO4·7H2O dose (D) and AlCl3·6H2O dose (E); and refer to
actual values listed in Table 6.1.
Figure 6.7 and 6.8 show the contour plots for the statistically significant two-
factor interactions of the developed model for total HCA degradation (Equation 6.4)
via the modified Fenton process: melanoidin concentration and solution pH (AC);
melanoidin concentration and FeSO4·7H2O dosage (AD); total HCA concentration
and FeSO4·7H2O dosage (BD); and total HCA concentration and AlCl3·6H2O dosage
(BE). Increasing the initial pH and melanoidin concentration resulted in lower HCA
degradation (46%). However, the amount degraded increases up to 48% when both
the melanoidin concentration and initial pH decrease (Figure 6.7a). Decreasing the
melanoidin concentration and increasing FeSO4·7H2O dosage vice versa reduces the
extent of the modified Fenton process on the degradation of HCAs in solution (Figure
6.7b). However, more HCA is degraded (50%) when lower FeSO4·7H2O dosages are
used with lower concentrations of melanoidins.

196
Figure 6.7 Contour plots of total HCA degradation (%) as a function of
(a) melanoidin and pH; (b) melanoidin and FeSO4·7H2O dosage.
Variables: melanoidin (1,500 mg/L); total HCA (150 mg/L); pH
(5.25); FeSO4·7H2O dosage (389 mg/L) and AlCl3·6H2O dosage
(200 mg/L).
(a)
(b)

197
Figure 6.8 Contour plots of total HCA degradation (%) as a function of
(a) total HCA and FeSO4·7H2O dosage; (b) total HCA and
AlCl3·6H2O dosage. Variables: melanoidin (1,500 mg/L); total
HCA (150 mg/L); pH (5.25); FeSO4·7H2O dosage (389 mg/L) and
AlCl3·6H2O dosage (200 mg/L).
(a)
(b)

198
A strong relationship between the total HCA concentration and FeSO4·7H2O
dosage is shown in Figure 6.8a. Increasing FeSO4·7H2O dosage with lower amounts
of HCAs would result in more degradation because of less uptake of OH radical by
the HCAs. However, unlike Fe(II), adding more Al(III) does not provide any benefit
in the degradation of HCAs. At an initial HCA concentration of 50 mg/L, an
AlCl3·6H2O dosage of 100 mg/L is enough to degrade nearly half of the HCAs
initially present in solution. The degradation extent of HCAs reduces with increasing
initial HCA concentration at 50 mg/L AlCl3·6H2O. However, increasing AlCl3·6H2O
dosage with increasing initial HCA concentration would maintain optimal degradation
of HCA.
6.3.5 Response Surface Analyses for Decolourisation of Mixtures
Graphical representations of the regression model (Equation 6.5) in the form
of 3D surface plots are shown in Figure 6.9. The interactions are significant as the
curvature of the surfaces is obvious.
As shown in Figure 6.9a, the initial melanoidin and Al(III) dosage
concentrations were varied, whilst the other variables, namely pH and temperature
were kept constant. At 100 mg/L of AlCl3·6H2O, the decolourisation of the mixture
reduces at initial melanoidin concentrations of ≥ 1000 mg/L. As shown in Figure
6.9a, additional colouring is obtained at higher dosages of AlCl3·6H2O with an initial
melanoidin concentration of 500 mg/L. This may indicate that residual Al(III) may be
forming complexes with other components in the system (Cornard et al., 2006;
Lapouge and Cornard, 2007). However, with a 300 mg/L dosage of AlCl3·6H2O, the
decolourisation efficiency increases smoothly with an increase in melanoidin
concentration, suggesting that Al(III) is being consumed and contributing to the
removal of melanoidins in the mixture. However, excess dosages of AlCl3·6H2O can
also give the reverse effect where colour is added into the system (e.g., 300 mg/L
AlCl3·6H2O and 500 mg/L melanoidin) (Figure 6.9a).

199
Figure 6.9 Three-dimensional surface plots of decolourisation (%) as a
function of (a) melanoidin and AlCl3·6H2O dosage; (b) total HCA
and FeSO4·7H2O; (c) total HCA and AlCl3·6H2O dosage; and (d)
FeSO4·7H2O and AlCl3·6H2O. Variables: melanoidin
(1,500 mg/L); total HCA (150 mg/L); pH (5.25); FeSO4·7H2O
dosage (389 mg/L) and AlCl3·6H2O dosage (200 mg/L).
Excess Fe(II)/Fe(III) also affects the decolourisation performance of the
modified Fenton process despite degradation of the melanoidin and the HCAs.
Increasing Fe(II) dosage may improve the oxidative degradation of the colour
precursor and colourants in the system. However, excess Fe(II)/Fe(III) can react with
non-reacted HCAs forming coloured complexes (Figure 6.9b). For optimal
decolourisation performance, lower dosages of Fe(II) should be used even if the
degradation efficiencies of the melanoidins and HCAs are reduced. However, as
shown in Figure 6.9c, the effects of Al(III) on the modified Fenton process with initial
Design-Expert® Software
% Decolourisation51.049
-120.544
X1 = A: MelX2 = E: AlCl3.6H2O
Actual FactorsB: Total PA = 100.00C: Initial pH = 5.25D: FeSO4.7H2O = 389.00
500
750
1000
1250
1500
100
150
200
250
300
-24
-10
4
17
31
%
Decolo
urisatio
n
A: Mel E: AlCl3.6H2O
Design-Expert® Software
% Decolourisation51.049
-120.544
X1 = B: Total PAX2 = D: FeSO4.7H2O
Actual FactorsA: Glc/Gly Melanoidin = 1000C: Initial pH = 5.25E: AlCl3.6H2O = 200
50
75
100
125
150
238
313
389
465
541
-15
-2
12
26
39
%
Decolo
urisatio
n
B: Total PA D: FeSO4.7H2O Design-Expert® Software
% Decolourisation51.049
-120.544
X1 = B: Total PAX2 = E: AlCl3.6H2O
Actual FactorsA: Glc/Gly Melanoidin = 1000C: Initial pH = 5.25D: FeSO4.7H2O = 389
50
75
100
125
150
100
150
200
250
300
-1
8
16
25
33
%
Decolo
urisatio
n
B: Total PA E: AlCl3.6H2O
Design-Expert® Software
% Decolourisation51.049
-120.544
X1 = D: FeSO4.7H2OX2 = E: AlCl3.6H2O
Actual FactorsA: Glc/Gly Melanoidin = 1000B: Total PA = 100C: Initial pH = 5.25
238
313
389
465
541
100
150
200
250
300
-9
3
15
26
38
%
Decolo
urisatio
n
D: FeSO4.7H2O E: AlCl3.6H2O
(a)
(c)
(b)
(d)
E: AlCl3·6H2O
E: AlCl3·6H2O E: AlCl3·6H2O D: FeSO4·7H2O B: Total HCA
A: Melanoidin D: FeSO4·7H2O
B: Total HCA
200
HCA concentration indicate that Al(III) decolourises the system. Increasing dosages
of Al(III) significantly improves the decolourisation extent up to 45% at an initial
concentration of 50 mg/L total HCA and up to ca. 15% at an initial HCA
concentration of 150 mg/L. This suggests that there is a combined effect between
Fe(II)/H2O2 and Al(III). The Fenton process alone rapidly oxidises and degrades the
components within the system while the Al(III) acts as an adsorbent/decolourising
agent by removing the coloured products within the system (Dwyer et al., 2009).
To investigate the combined effects of Fe(II) and Al(III), the two key variables
were compared against each other as depicted in Figure 6.9d. It is evident that for
effective decolourisation of the melanoidin/HCA system, lower Fe(II) dosages and
higher Al(III) should be used.
6.3.6 Process Optimisation and Validation
Numerical optimisation was performed on the basis of the desirability function
to determine the optimum process parameters for the models developed for
melanoidin degradation, HCA degradation and decolourisation. Multi-response
optimisation was only used for the responses of melanoidin and HCA degradation
because both models are of the same function, 2FI. Meanwhile, the quadratic model
for decolourisation was optimised and validated separately.
In order to confirm the accuracy and robustness of the predicted models and
assess its reliability to predict the degradation of the melanoidin and the HCAs as well
as decolourisation, additional experiments were carried out under those conditions.
For this study, the desirability functions for the two degradation models were
combined into one value (Table 6.5). The experimental values of the additional
experiments agree well with the predicted values (in parentheses) deduced from each
of the four models. The low error in the experimental and predicted values indicates
good agreement of the results.

201
Table 6.5 Optimised conditions under specified constraints for the
degradation of melanoidin (2,000 mg/L) and total HCA (200 mg/L)
in sucrose solution (15% (w/w)) at 35 °C; and model verification.*
Experiments
Optimum Fenton Only Worst Case
pH 5.1 5.1 6.0
FeSO4·7H2O (mg/L) 626 626 404
AlCl3·6H2O (mg/L) 265 0 151
Melanoidin degradation (%) 69 (71) 63 (65) 62 (66)
Total HCA degradation (%) 53 (56) 47 (49) 40 (42)
Desirability 0.890 0.425 0.765
*Values in parentheses indicate model predicted % degradation for each
individual/total HCA model. Measurements were conducted in triplicate.
RSD was < 5.0%.
It is worth mentioning that the dosages of the Fenton reagents and Al(III) are
dependent on the initial pH (Table 6.5). Under the optimum conditions, higher
dosages of FeSO4·7H2O and AlCl3·6H2O are required in order to degrade the
melanoidin and HCAs. However, there were little differences between the optimum
and worst case experiments in terms of melanoidin degradation with only an extra
7.0% degradation achieved when dosing an additional 222 mg/L FeSO4·7H2O and
114 mg/L AlCl3·6H2O to the system. Under the same operating conditions without
AlCl3·6H2O (i.e., Fenton process), the melanoidin and total HCA degradation
efficiencies were slightly lower, at 63% and 47% respectively.
A predicted HCA degradation of 42% under the worst case experiment at a
higher pH (i.e., pH 6.0) shows that the modified Fenton process is heavily dependent
on pH. Interestingly, lower dosages of the reagents were only required under the
worst case conditions due to deactivation of reagents at higher pH levels (pH ≥ 5.50).

202
Degradation of compounds does not necessarily imply that a mixture is
decolourised. Parameter optimisation and model verification results for the
decolourisation model on melanoidin/HCA mixtures in sugar solutions are shown in
Table 6.6. The experimental values are in consistency with the predicted values based
on the reduced quadratic model. The low error in the experimental and predicted
values and reasonably high desirability values (≥ 0.825) indicate good agreement of
the results.
Table 6.6 Optimised conditions under specified constraints for the
decolourisation of synthetic juice mixtures containing melanoidin
(2,000 mg/L), HCA (200 mg/L) and sucrose (15% (w/w)) at 35 °C;
and model verification.*
Experiments
Optimum Fenton Only Worst Case
pH 5.3 5.3 4.5
FeSO4·7H2O (mg/L) 289 289 400
AlCl3·6H2O (mg/L) 322 0 350
Decolourisation (%) 43 (42) 24 (25) –109 (–113)
Desirability 0.825 0.851 0.936
*Values in parentheses indicate model predicted % degradation for each
individual/total HCA model. Measurements were conducted in triplicate.
RSD was < 5.0%.
It is obvious that in the worst case experiment, higher dosages of FeSO4·7H2O
and AlCl3·6H2O would result in colour formation. At the optimum working pH of
5.3, using 289 mg/L FeSO4·7H2O and 322 mg/L AlCl3·6H2O, 43% decolourisation
was achieved. The predicted melanoidin and total HCA degradation under the
optimum decolourisation experiments were 62% and 47%, respectively. A significant
decrease in decolourisation performance was observed under the same conditions in
the absence of AlCl3·6H2O with only 24% decolourisation achieved. Therefore, the
modified Fenton process shows promise as the Fenton process is essential for the

203
breakdown of colour and colour precursor compounds, while the presence of Al(III)
aids in colour removal.
6.4 Summary
The works presented in this chapter extends the investigations outlined in the
previous chapters to evaluate the effect of the Fenton process on the degradation of
melanoidins, including HCA degradation and colour removal, by modifying the
Fenton process with the addition of Al(III). Changing the independent variables to be
more closely aligned to sugar cane factory processing conditions reduced the
complexity of the statistical analyses required.
A modified Fenton oxidation process where Al(III) is used to promote the
oxidation process is effective in the degradation and decolourisation of synthetic
sugar solutions containing a synthetic melanoidin and HCAs (viz., CaA, pCoA and
FeA). Ferrous iron does not remove colour but it is essential for the breakdown of the
melanoidin and HCAs. Also, Al(III) aids in the removal of the oxidation products and
colour. Decolourisation is best achieved with an increased dosage of Al(III). Despite
degradation of HCA with Fe(II), higher dosages would result in increased colour.
Lower dosages of Fe(II) combined with higher dosages of Al(III) are suitable for the
effective reduction of colour and the degradation of melanoidins and HCAs. Higher
dosages of Fe(II) and Al(III) are much to be avoided as they actually increase the
solution colour. Such addition to factory juices must be tightly controlled otherwise
the process would be counterproductive.

204
References
Cornard, J.-P., Caudron, A., & Merlin, J.-C. (2006). UV–visible and synchronous
fluorescence spectroscopic investigations of the complexation of Al(III) with
caffeic acid, in aqueous low acidic medium. Polyhedron, 25, 2215-2222.
Cortez, S., Teixeira, P., Oliveira, R., & Mota, M. (2011). Evaluation of Fenton and
ozone-based advanced oxidation processes as mature landfill leachate pre-
treatments. Journal of Environmental Management, 92, 749-755.
Dwyer, J., Griffiths, P., & Lant, P. (2009). Simultaneous colour and DON removal
from sewage treatment plant effluent: Alum coagulation of melanoidin. Water
Research, 43, 553-561.
Exley, C. (2004). The pro-oxidant activity of aluminum. Free Radical Biology and
Medicine, 36(3), 380-387.
Lapouge, C., & Cornard, J.-P. (2007). Reaction pathways involved in the mechanism
of AlIII chelation with caffeic acid: Catechol and carboxylic functions
competition. ChemPhysChem, 8(3), 473-479.
Ruipérez, F., Mujika, J. I., Ugalde, J. M., Exley, C., & Lopez, X. (2012). Pro-oxidant
activity of aluminum: Promoting the Fenton reaction by reducing Fe(III) to
Fe(II). Journal of Inorganic Biochemistry, 117(0), 118-123.
Shore, M., Broughton, N. W., Dutton, J. V., & Sissons, A. (1984). Factors affecting
white sugar colour. Sugar Technology Reviews, 12, 1-99.
Westerhoff, P., Chen, W., & Esparza, M. (2001). Fluorescence analysis of a standard
fulvic acid and tertiary treated wastewater. Journal of Environmental Quality,
30(6), 2037-2046.

205
CHAPTER 7
Evaluation of the Fenton and Fenton-like
Processes for the Removal of Colour from
Factory Sugar Cane Juice
7.1 Introduction..................................................................................... 205
7.2 Materials and Methods................................................................... 206
7.2.1 Reagents and Solvents......................................................... 206
7.2.2 Specification of Samples...................................................... 206
7.2.3 Decolourisation Procedure................................................. 207
7.2.4 Preparation of Flocculants................................................. 207
7.2.5 Preparation of Lime Saccharate......................................... 208
7.2.6 Clarification Procedure...................................................... 208
7.2.7 Turbidity Measurements...................................................... 209
7.2.8 Sucrose, Dry Substance and Purity Measurements............. 210
7.2.9 Reducing Sugars Composition Analyses............................. 210
7.2.10 Colour, Refractive Index and Total Soluble Solids
Measurements......................................................................
210
7.2.11 Inorganic Ion Composition Analyses.................................. 211
7.3 Results and Discussion.................................................................... 211
7.3.1 First Decolourisation Trials................................................ 211
7.3.2 Second Decolourisation Trials............................................ 215
7.3.3 Economic Considerations.................................................... 222
7.4 Summary.......................................................................................... 222

206
7.1 Introduction
The works presented in Chapters 4 and 6 showed that the Fenton and modified
Fenton oxidation processes are capable of effectively decolourising and degrading
colourant and colour precursor compounds in aqueous and dilute sucrose solutions
(≤ 15% (w/w)). In this present study, the effects of the Fenton and modified Fenton
processes on the decolourisation of factory sugar cane juice were investigated.
On-site clarification trials were undertaken to investigate the effectiveness of
the Fenton oxidation process and variants of this process to remove colour from sugar
cane juice. Sugar cane juice colour is usually measured at pH 7.0 but additional
information about the nature of the colourants present may be obtained at pH 4.0 and
9.0. As previously stated in Section 2.4, colour measured at pH 4.0 suggests the
presence of HMW colourants, while colour at pH 9.0 is essentially due to the presence
of colour precursor, phenolic and flavonoid compounds. The results obtained from
these tests are reported in this chapter.
7.2 Materials and Methods
7.2.1 Reagents and Solvents
All chemicals, solvents and reagents were obtained in their purest form from
the suppliers as described in the previous chapters or as otherwise stated. Ferric
chloride (anhydrous) was purchased from Sigma-Aldrich (St. Louis, MO, USA).
Magnafloc LT27 flocculant (degree of hydrolysis (DH) of 27%; MW of 18 × 106 Da)
was obtained from Chemiplas Australia (Robina, QLD, Australia). Magnafloc LT340
flocculant (DH of 40%; MW of 18 × 106 Da) was obtained from TD Chemicals (East
Melbourne, VIC, Australia).

207
7.2.2 Specification of Samples
Sugar cane juice from the No. 2 mill was obtained from the processing lines at
Tully Sugar Mill (Tully, QLD, Australia) and Isis Central Sugar Mill (Childers, QLD,
Australia). Juices from the MJ and PJ process streams were also obtained from Isis
Central Sugar Mill. All juices were obtained as composites during the crushing
season in 2012. In total, four juices (2 × No. 2 mill juices, 1 × MJ and 1 × PJ) were
treated. The following analyses of the four juice samples are unrelated and not
comparable. However, the results obtained provide an insight on the levels of colour
present in each juice type before and after treatment with the Fenton and modified
Fenton processes.
7.2.3 Preparation of Flocculants
Solutions of flocculants (0.5% (w/v)) were best prepared by dispersing and
dissolving the flocculant powder in Milli-Q water (adjusted to pH 8.0–8.5 using
0.1 M NaOH) under gentle stirring at a low shear rate (50 rpm) for 3 h. The powders
were added at a rate which allowed good dispersion to ensure each flocculant particle
is hydrated to prevent agglomeration. Flocculant solutions were stored at 4.0 °C.
These solutions were diluted further to 0.1% (w/v) before being added to hot limed
sugar cane juice.
7.2.4 Preparation of Lime Saccharate
Lime saccharate used for juice clarification was obtained directly from the
factory of trial (viz., Tully Sugar Mill or Isis Central Sugar Mill). The mixture of lime
saccharate typically consists of 100 g of 20% (w/w) calcium oxide solution and 100 g
of 68 °Bx factory syrup.

208
7.2.5 Decolourisation Procedure
The procedure for the Fenton oxidation process with Al(III) on sugar cane
juices is similar to that described in Section 6.2.3. In each run, a predetermined
amount of FeSO4·7H2O or FeCl3, AlCl3·6H2O and H2O2 solutions were added to the
reaction vessel containing factory juice to achieve a final volume of ca. 1.0 L, while
maintaining the working Fenton molar ratio (Fe(II)/H2O2) at 1:15. The concentrations
of the reagents were chosen based on the previous research reported in Chapter 6.
After 2 min of oxidative treatment, the treated juice was immediately subject to
clarification.
7.2.6 Clarification Procedure
Clarification experiments were conducted in a heated and illuminated
clarification test kit designed by SRI (Brisbane, QLD, Australia) as shown in Figure
7.1. Each tube is of 1.0 L capacity with dimension of 460 × 55 mm i.d. The method
of clarification was simple defecation and typically involved liming to pH 7.8 at
76 °C, followed by boiling and settling in the settling tubes. A flocculant dosage
equivalent of 3 mg/kg of juice was applied prior to settling in the tubes. The
flocculant used for the Tully Sugar Mill trials was Magnafloc LT27, which is the
flocculant used at Tully Sugar Mill. Magnafloc LT340 was used for the trials at Isis
Central Sugar Mill, because of the experiences at Tully Sugar Mill. The initial
settling rate (cm/min) was obtained from the graphical analysis of the initial linear
slope and can be calculated as:
Settling Rate =
Initial Juice Level´40
100
æ
èçö
ø÷- Mud Level at 0.5min ´
40
100
æ
èçö
ø÷
0.5min
(7.1)
As the floc aggregates were unstirred, the mud heights were not indicative of
values obtained in commercial clarifier.

209
7.2.7 Turbidity Measurements
Absorbance measurements were conducted spectrophotometrically at 900 nm
(A900) on a GBC Scientific Cintra 40 double-beam UV/Vis spectrophotometer using
cells of 1.0 cm path length. The resulting turbidity of each sample was calculated as:
Turbidity (TU) = 100´ A900
(7.2)
Figure 7.1 Sugar Research Institute designed batch settling kit.

210
7.2.8 Sucrose, Dry Substance and Purity Measurements
The apparent sucrose content in juice (i.e., pol) was calculated by double
polarisation measurements performed on a Schmidt Haensch Polartronic Universal
digital polarimeter (Berlin, Germany) according to a standard procedure adapted from
BSES (2001a). Juice samples were clarified with lead acetate, followed by pol
measurements of the filtered clarified solutions (before and after sucrose inversion
with HCl. The pol expressed as % (w/w) is calculated from the change in polarisation
between the plain and inverted sugar solutions.
The dry substance procedure used to determine water and/or total solids in
juice is also adapted from a procedure by the BSES (2001b). Coiled strips of
Whatman No. 4 chromatography paper (600 × 50 mm) were saturated in juice and
dried in vacuo at < 7 kPa for 12 h in an oven at 65 °C. The loss of sample after drying
indicates the amount of water in the juice sample. The purity of juice samples is
expressed as a percentage of pol on DS as shown in Equation 7.3.
polPurity (%) = 100
DS
(7.3)
7.2.9 Reducing Sugars Composition Analyses
Reducing sugar contents in the reaction mixtures were monitored by HPAEC-
PAD. Sample preparation and the operating procedure for the chromatographic
system are identical to that described in Section 4.2.5.
7.2.10 Colour, Refractive Index and Total Soluble Solids Measurements
Sample preparation and the operating procedures for the determination of
colour, RI and TSS in juice samples are identical to those described in Section 3.2.6.

211
7.2.11 Inorganic Ion Composition Analyses
Inorganic ion composition analyses were performed on a Varian Vista-MPX
simultaneous inductively coupled plasma-optical emission spectrometer (ICP-OES)
with megapixel charge coupled device detection (Mulgrave, VIC, Australia). To
reduce the interference of the organic sugar matrix, samples were diluted to a sucrose
concentration of 2.0% (w/w). The measurements were conducted in duplicate. The
operating parameters listed in Table 7.1 were applied for all ICP-OES measurements.
Table 7.1 Operating parameters for ICP-OES analyses.
RF generator 40 MHz
Power 1.25 kW
Plasma flow 13.5 L/min
Auxiliary 0.75 L/min
Nebuliser flow 0.75 L/min
Viewing height 5 mm
Emission lines (nm) Na 589.592 Mg 279.553 Al 396.152
Si 251.611 P 213.618 S 181.972
K 769.897 Ca 317.933 Fe 238.204
7.3 Results and Discussion
7.3.1 First Decolourisation Trials
Clarification Results
The clarification of juice was assessed based on three clarification
performance parameters as shown in Table 7.2; turbidity, settling rate and mud height.
Juice turbidity values for all tests were higher (9.7–18 TU) than the control
(9.2 TU). The settling rate of the flocs for all tests was extremely slow. This may be
due to the presence of high starch levels as no incubation was carried out for the
naturally occurring α–amylase enzymes to break down the starch (Bruijn and
Jennings, 1968). The settling rates of the flocs formed in the juices treated via the
Fenton oxidation process were slightly lower (0.8–6.4 cm/min) than the value

212
obtained with the control (7.2 cm/min). Higher Fe(II) content reduced the settling
rate of the floc particles. In addition, higher dosages of the Fenton’s reagent (Tests 2
and 4) increased mud height levels by up to 58%. This is possibly due to the lower
density of mud particles.
Table 7.2 Clarification performance results on clarified No. 2 mill juices
from the Tully Sugar Mill trials.*
Dosage (mM)
Test Fe(II) H2O2 Al(III) Turbidity
(TU)
Settling rate
(cm/min)
MH†
(%)
Untreated 0 0 0 – – –
Control 0 0 0 9.2 7.2 12
Test 1 0.28 4.22 0 12 4.0 11
Test 2 0.50 7.50 0 18 2.4 14
Test 3 0.28 4.22 0.093 18 6.4 13
Test 4 0.50 7.50 0.093 9.7 0.8 19
*% RSD was < 5.0%. †MH (Mud Height)
Inorganic Ion Composition Results
Inorganic ion analysis was conducted on both untreated and treated juices
(Table 7.3). Higher dosages of Fenton’s reagent carried out in Tests 2 and 4 increased
residual Fe levels in clarified juice. However, the addition of Al(III) to the higher
Fenton dosage (Test 4) reduced the level of Fe by 20%. Despite the same Al(III)
dosage applied to both tests, the higher Fenton dosage (Test 4) showed a lower Al
level by 50% than the lower Fenton dosage (Test 3).
The addition of Fe(II) as FeSO4·7H2O contributed to the increase in S levels in
all tests conducted. Both FeSO4·7H2O and AlCl3·6H2O are acidic in nature and
increased the amount of lime saccharate used to reach the pH set point for
clarification. This resulted in increases with residual soluble Ca levels in the clarified
juices. More soluble Ca implies higher fouling rates in the evaporator vessels, which

213
is highly undesirable. More interestingly though is the reduction in P levels in Test 4.
This may be due to Fe(II)/Fe(III) and Al(III) ions reacting with free phosphate ions in
juice to form a precipitate. This is unlikely and may simply be due to the formation of
calcium phosphate precipitates as these precipitates have a lower solubility than
Fe(II), Fe(III) and Al(III) phosphates.
Table 7.3 Inorganic ion composition results on clarified No. 2 mill juices
from the Tully Sugar Mill trials.*
Concentration (mg/kg on TSS)
Test Na Mg Al Si P S K Ca Fe
Untreated 8 1,040 290 710 1,940 839 7,100 957 108
Control 29 792 19 333 458 875 7,190 1,980 19
Test 1 32 859 23 359 500 1,020 7,830 2,280 62
Test 2 29 888 22 326 494 1,690 7,190 3,030 258
Test 3 33 898 69 352 523 1,020 7,840 2,840 66
Test 4 38 1,040 35 359 346 1,920 8,460 3,970 205
*% RSD was < 5.0%
Colour Results
Table 7.4 shows the colour results obtained from the Tully Sugar Mill trials on
No. 2 mill juice. The results show that in the normal clarification process (i.e., the
control) the juice colour at pH 7.0 reduced by 24%, but little effects were observed at
pH 4.0 (–7.8%) and pH 9.0 (5.3%). The use of the Fenton and modified Fenton
processes reduced juice colour at pH 7.0 to a similar extent as the control. There was
a significant drop in juice colour at pH 9.0 using both Fenton and modified Fenton
processes with Al(III). The higher Fenton dosage (Test 2) achieved a reduction of
37% at pH 9.0 compared to the control. The addition of Al(III) (Test 4) also
significantly decreased the colour content at pH 9.0 by up to 42% and also slightly
decreased colour at pH 4 by ≤ 1.0%. The drop in colour at pH 9.0 is attributable to
the Fenton process degrading phenolic and flavonoid compounds.

214
The IVs of both untreated and treated juices as shown in Table 7.4 were
between 6.0 and 12 which are attributable to monomeric colourants such as natural
cane pigments (viz., flavonoids) (cf. Table 2.1). During normal clarification, a small
decrease in the IV of the control relative to the untreated No. 2 mill juice was
observed. This shows that a small percentage of factory produced colourants such as
polymers from HADPs and browning reactions involving phenolic compounds were
formed, hence an increase in colour at pH 4.0 (Paton, 1992). However, clarification
also removed some of the LMW colourants associated with pH 9.0. The IVs of the
treated juices were lower than the control (IV 6.0–8.4) indicating a lower presence of
LMW colourants. This confirms that the Fenton, Fenton-like and modified Fenton
processes are removing colourants and related compounds associated with pH 9.0.
Table 7.4 Colour results on clarified No. 2 mill juices from the Tully Sugar
Mill trials.*
Colour (IU)
Test pH 4.0 pH 7.0 pH 9.0 IV
Untreated 5,640 21,400 66,500 12
Control 6,080 16,400 63,000 10
Test 1 6,440 17,500 53,800 8.4
Test 2 6,950 17,400 41,700 6.0
Test 3 6,910 16,600 53,300 8.0
Test 4 5,560 16,600 38,500 7.0
*% RSD was < 5.0%
In summary, the Fenton process with Al(III) showed the best result with
respect to colour reduction. However, the observations for the poor settling rate of the
particles (apart from the likely presence of high starch levels) is probably due to the
flocculant (i.e., Magnafloc LT27) being incapable of bridging the flocs closely
together to increase the floc density and subsequently enhance sedimentation. The
lack of light bonds between the floc particles is possibly due to the composition of the
treated juices. The presence of residual Fe(II), Fe(III) and Al(III) cations in the

215
treated juice may have reduced the effectiveness of the flocculant to form tightly
bound floc structures. It was hypothesised that an alternative flocculant with higher
anionicity may improve the clarification performance of the treated juices.
7.3.2 Second Decolourisation Trials
Clarification Results
As previous results in Table 7.2 indicated that treating juices with iron and
aluminium salts would impact on the settling rate of the flocs, hence a flocculant with
high anionicity and high molecular weight was selected (Madsen and Day, 2010).
The flocculant Magnafloc LT340 was chosen for these trials in place of Magnafloc
LT27.
Table 7.5 shows the clarification performance results of No. 2 mill, MJ and PJ
obtained from the trials conducted at Isis Central Sugar Mill. In addition to the
modified Fenton process (Fe(II)/Al(III)/H2O2), Fe(III) was trialled in place of Fe(II)
as it has been previously reported that Fe(III) can be readily used as a chelant and
oxidant to create flocs for effective juice clarification (Madsen and Day, 2010).
Excellent clarified juice turbidity values (3–9 TU) were obtained with primary
juice treated with both modified Fenton and Fenton-like processes, though the
turbidity of the control was more pronouced. For this type of juice, the modified
Fenton process with Fe(II) gave a lower turbidity (4.6 TU) than the modified Fenton-
like process containing Fe(III) (9.4 TU). The reverse trend was observed for the
turbidity values of the clarified juices obtained from No. 2 mill juice and MJ. The
turbidity values obtained with Fe(II) (Tests 5 and 7) in place of Fe(III) were
unacceptably high. The reasons for these observations are not known, although
Fe(III) is known to be a more effective coagulant than Fe(II) (Rivas et al., 2002).
The sizes of the flocs formed by visual assessment with both modified Fenton
and Fenton-like processes were smaller than those formed by the normal clarification
process and the resulting settling rates were extremely slow (≤ 3.2 cm/min).
Reasonable mud heights (except Test 9) were obtained for the different types of juices
with the different Fenton treatments (Table 7.5).

216
Table 7.5 Clarification performance results on clarified factory juices from
the Isis Central Sugar Mill trials.*
Dosage (mM)
Test Fe(II) Fe(III) H2O2 Al(III) Turbidity
(TU)
Settling rate
(cm/min)
MH†
(%)
No. 2 Mill juice
Untreated 0 0 0 0 – – –
Control 0 0 0 0 9.0 33 19
Test 5 0.50 0 7.5 0.093 40 0.8 9.0
Test 6 0 0.92 7.5 0.093 15 8.0 17
Mixed juice
Untreated 0 0 0 0 – – –
Control 0 0 0 0 3.8 18 29
Test 7 0.50 0 7.5 0.093 21 3.2 27
Test 8 0 0.92 7.5 0.093 3.4 20 28
Primary juice
Untreated 0 0 0 0 – – –
Control 0 0 0 0 3.1 42 19
Test 9 0.50 0 7.5 0.093 4.6 0.8 25
Test 10 0 0.92 7.5 0.093 9.4 3.2 21
*% RSD was < 5.0%. †MH (Mud Height)
Inorganic Ion Composition Results
Table 7.6 shows the inorganic ion composition of the clarified juices. The
trends in the proportions of the inorganic ion concentrations were similar for both
modified Fenton and Fenton-like processes on each type of factory juice tested.
Interestingly, the modified Fenton-like process with Fe(III) (Tests 6 and 8)
significantly produced less residual Al and Fe than the modified Fenton process with
Fe(II) (Tests 5 and 7). However, the treatment of PJ with Fe(III) (Test 10) compared
to Fe(II) (Test 9) resulted in improved Fe removal but increased Al content.

217
This may simply be due to the lower turbidity (except Test 10 for Al) obtained
with Fe(III) treated juices, and as a consequence of the type and nature of the calcium
phosphate flocs formed. This is reflected in the lower levels of P (except for Test 10)
and Ca obtained for these treated juices. Therefore, it is presumed that the modified
Fenton-like process with Fe(III) does not interfere in the precipitation of calcium
phosphate to the same extent as the Fe(II) treated juices. Additions of Fe(III) (Tests
6, 8 and 10) appear not to boost the S content, are better with Ca content and have less
residual Fe content than that of Fe(II) additions (Tests 5, 7 and 9).
Table 7.6 Inorganic ion composition results clarified factory juices from
the Isis Central Sugar Mill trials.*
Concentration (mg/kg on TSS)
Test Na Mg Al Si P S K Ca Fe
No.2 Mill juice
Untreated 44 694 38 188 706 1,050 8,000 341 45
Control 75 533 5 130 272 1,090 7,720 663 9
Test 5 92 640 49 128 302 1,740 8,840 1,510 267
Test 6 61 459 36 82 247 929 7,770 1,000 68
Mixed juice
Untreated 18 719 11 79 676 1,370 5,970 568 9
Control 26 676 2 169 115 1,760 6,350 878 2
Test 7 25 659 11 94 152 2,030 6,300 1,230 67
Test 8 43 809 7 125 132 1,990 7,350 1,180 18
Primary juice
Untreated 108 758 8 133 600 1,330 6,920 917 7
Control 133 741 3 170 133 1,560 7,110 1,260 4
Test 9 136 728 8 136 112 2,080 7,120 1,680 70
Test 10 129 694 19 145 194 1,450 7,180 1,530 33
*% RSD was < 5.0%

218
The addition of Fe(II) as FeSO4·7H2O contributed to the increase in S levels in
juices treated with Fe(II) (Table 7.6). The salts FeSO4·7H2O, FeCl3 and AlCl3·6H2O
are acidic in nature and their addition to juice reduced the pH. This resulted in an
increase in the amount of lime saccharate added to reach the pH set point for
clarification. The effect of this is an increase in the soluble Ca content (Table 7.6) of
the juices treated with these reagents compared to the control experiments where these
reagents were not used. The modified Fenton and Fenton-like processes show
reductions in Si content in all juice types compared to the control (Table 7.6). This is
due to the formation of insoluble aluminium-silicate compounds during clarification
(Thai et al., 2012).
Purity and Reducing Sugars Results
During raw sugar manufacture, sucrose loss through inversion to glucose and
fructose, and degradation to organic acids are minimised by working within the
desired pH ranges. The values in Table 7.7 indicate that no significant changes to the
purity levels occurred in the clarified juice due to the treatment using both the Fenton
and modified Fenton processes when compared with the control. However, there
were increases in the levels of glucose (≤ 14%) and fructose (≤ 9.0%) indicating some
sucrose degradation.

219
Table 7.7 Purity and reducing sugar results on clarified factory juices from
the Isis Central Sugar Mill trials.*
Reducing Sugar Content % (w/w)
Test Glucose Fructose Purity (%)
No. 2 Mill juice
Untreated 0.09 0.07 83.8
Control 0.04 0.04 90.5
Test 5 0.27 0.25 89.5
Test 6 0.26 0.23 89.9
Mixed juice
Untreated 0.21 0.35 82.3
Control 0.06 0.05 92.8
Test 7 0.26 0.23 90.9
Test 8 0.27 0.24 92.8
Primary juice
Untreated 0.09 0.09 86.9
Control 0.07 0.09 92.3
Test 9 0.21 0.18 91.5
Test 10 0.18 0.16 91.9
*% RSD was < 5.0%
Colour Results
Table 7.8 shows, significant colour present in the clarified juice of No. 2 mill
juice obtained via the normal clarification process compared to the juices clarified
from MJ and PJ (Curtin and Paton, 1980). There are increases in the colour measured
at pH 4.0 (37–45%) and pH 7.0 (11–21%) for No. 2 mill juice treated by the modified
Fenton and Fenton-like processes relative to the control (Table 7.8). The colours in
clarified MJs and PJs measured at pH 4.0 and pH 7.0 respectively follow similar
trends as the clarified No. 2 mill juice. However, the colour levels measured at pH
9.0 for the clarified No. 2 mill juice decreased significantly for the modified Fenton
process with Fe(II) (Test 5) and with Fe(III) (Test 6) by 42% and 38% respectively

220
relative to the control. There were also decreases for the colour measured at pH 9.0
for clarified PJs (≤ 26%) using the modified Fenton and Fenton-like processes,
however the magnitude of decolourisation was reduced. There was only a marginal
decrease in colour at pH 9.0 with the treated MJs (Tests 7 and 8). It is presumed that
some non-sucrose impurities present in higher proportions in MJ may have interfered
with the oxidation processes thereby preventing the degradation of colourants. The
IVs of all the treated juices were lower (4.6–5.9) when compared with the respective
control sample (6.5–12). This indicates and confirms the significant decreases in
LMW colourants in the treated juices using the modified Fenton and Fenton-like
processes.
Table 7.8 Colour results on clarified factory juices from the Isis Central
Sugar Mill trials.*
Colour (IU)
Test pH 4 pH 7 pH 9 IV
No. 2 Mill Juice
Untreated 9,120 18,400 72,400 8.0
Control 5,250 14,200 63,300 12
Test 5 7,200 15,800 36,600 5.1
Test 6 7,600 17,200 39,100 5.1
Mixed Juice
Untreated 3,560 8,830 22,300 6.3
Control 3,990 9,020 25,900 6.5
Test 7 4,230 10,800 23,800 5.6
Test 8 5,310 11,600 24,200 4.6
Primary Juice
Untreated 4,220 9,660 31,700 7.5
Control 4,000 8,620 33,700 8.4
Test 9 4,710 9,050 24,900 5.3
Test 10 4,490 10,300 26,400 5.9
*% RSD was < 5.0%

221
The modified Fenton-like process with Fe(III) (Tests 6, 8 and 10) show
slightly higher colour than the corresponding process with Fe(II) (Table 7.8). This is
attributable to the slower rate of H2O2 decomposition to the active •OH radical
necessary for the degradation of colourants, when the more stable Fe(III) is used in
place of Fe(II) (Sedlak and Andren, 1991; Pignatello, 1992; Arnold et al., 1995).
Also, as the total amount of iron in juice is approximately 10–20 ppm on juice (van
der Poel et al., 1998) and is present as Fe(III), the optimum working molar ratio of
Fe(III) and H2O2 was not used in these studies.
The modified Fenton and Fenton-like processes resulted in a decrease in
colour at pH 9.0, but this decrease was offset by an increase in colour at pH 4.0 and
pH 7.0. As stated previously, a decrease in colour at pH 9.0 indicates a reduction in
flavonoids and phenolics, and these colourants have a major influence on raw sugar
colour inclusion into the crystals of raw sugar (Smith and Paton, 1985; Clarke et al.,
1986; Riffer, 1988; Davis, 2001). However, the major contributors to the impurities
and colour in the raw sugar lie in the molasses layer of the surface of the crystals.
The crystallisation of raw sugar, if ideal, rejects all impurities from the crystal
structure. In practice, impurities are trapped (layered in) within the crystalline
structure, co-crystallised with sucrose into the crystal lattice. As well, some
impurities are present in gross molasses inclusions within the crystal, and a good deal
are left as the molasses or syrup film around the crystals. Little firm data is available
on these aspects, particularly in relation to the relative magnitude of the layering
effect and the impurity inclusion effect.
The inherent colour in the modified Fenton and Fenton-like processes on its
own has minimal absorbance at 420 nm where colour is measured. However, in the
presence of a colourant or colour precursor compound (e.g., CaA), the colours of the
clarified juices are inflated (Riffer, 1988). It should therefore be noted that although
reduction in colour at pH 7.0 (the usual measurement) of the clarified juice were not
obtained with the modified Fenton and Fenton-like processes, significant colour
reduction may have been realised if clarified juices were furthered processed to raw
sugar, based on the aforementioned observations. Such an investigation should be
undertaken in future research work.

222
7.3.3 Economic Considerations
Bulk quantities of FeSO4·7H2O, AlCl3·6H2O and H2O2 reagents required for
the modified Fenton oxidation process are all available commercially. The pricing of
these additives, exclusive of GST and delivered to the metropolitan area of Brisbane,
Australia are listed in Table 7.9.
Table 7.9 Prices of additives in bulk quantities used for the modified Fenton
process.
Chemical Company Origin Price (AUD $/t)
FeSO4·7H2O Swancorp Australia $350
AlCl3·6H2O Shanghai Smart Chemicals China $450
H2O2, 50% (w/v) Solvay Interox Australia $1,050
The approximate cost of the best treatment, conducted in this study
(i.e., Test 7), for one tonne of factory cane juice at FeSO4·7H2O (2.49 mM),
AlCl3·6H2O (0.83 mM) and H2O2 (7.5 mM) is $A0.24, $A0.06 and $A0.42,
respectively (i.e., total of $A0.72/t of juice). The additional costs for the uses of
increased lime saccharate and the flocculant (i.e., Magnafloc LT340) needed for all
Fenton-mediated processes used as well as possible sucrose losses have not been
taken into account. As approximately eight tonnes of Australian MJ is required to
produce one tonne of raw sugar, it would cost ca. $A5.76/t of sugar. The costs of
reagents can be further reduced if bulk quantities are sourced.
7.4 Summary
This study was aimed at the decolourisation of factory cane juice using
Fenton, Fenton-like and modified Fenton oxidation processes. Results have shown
that the modified Fenton oxidation process (i.e., Fe(II)/Al(III)/H2O2) significantly
reduced colour measured at pH 9.0 (associated with LMW colourants and colour
precursors) for clarified juices of No. 2 Mill and PJs. However, the modified Fenton
process did not reduce colour levels measured at pH 4.0 (associated with HMW

223
colourants) and at pH 7.0. The results obtained from the second decolourisation trials
conducted at Isis Central Sugar Mill also confirm the results obtained from the initial
trials carried out at Tully Sugar Mill. Problems associated with small floc size and
slow settling of flocs should be addressed in future studies. Furthermore, treated
juices should be used to produce sugar, in order to establish whether the Fenton and
modified Fenton processes can produce low colour sugar. If low colour sugar can be
produced, it will be necessary in a future project to investigate ways to minimise
sucrose degradation using Fenton oxidation technologies.

224
References
Arnold, S. M., Hickey, W. J., & Harris, R. F. (1995). Degradation of atrazine by
Fenton's reagent: Condition optimization and product quantification.
Environmental Science and Technology, 29(8), 2083-2089.
Bruijn, J., & Jennings, R. P. (1968). Enzymatic hydrolysis of starch in cane juice.
Proceedings of the South African Sugar Technologists' Association, 45-52.
BSES (2001a). Method 18. Sucrose – Determination in Mill Products by Double
Polarisation, Laboratory Manual for Australian Sugar Mills (Vol. 2, pp. 1-2).
Indooroopilly, QLD, Australia: Bureau of Sugar Experiment Stations.
BSES (2001b). Method 19. Total Solids (Dry Substance) – Determination in Mill
Products, Laboratory Manual for Australian Sugar Mills (Vol. 2, pp. 1-2).
Indooroopilly, QLD, Australia: Bureau of Sugar Experiment Stations.
Clarke, M. A., Blanco, R. S., & Godshall, M. A. (1986). Colorant in raw sugars. Paper
presented at the Proceedings of the International Society of Sugar Cane
Technologists.
Curtin, J. H., & Paton, N. H. (1980). The quantitative analysis of phenolic acids from
sugar liquors by high performance liquid chromatography. Proceedings of the
International Society of Sugar Cane Technologists, 17, 2361-2371.
Davis, S. B. (2001). The chemistry of colour removal: a processing perspective.
Proceedings of the South African Sugar Technologists' Association, 75, 328-
336.
Madsen, L. R., II, & Day, D. F. (2010). Iron mediated clarification and
decolourisation of sugarcane juice. Proceedings of the International Society of
Sugar Cane Technologists, 27, 1-13.
Paton, N. H. (1992). The origin of colour in raw sugar. Proceedings of the Australian
Society of Sugar Cane Technologists, 14, 8-17.
Pignatello, J. J. (1992). Dark and photoassisted Fe3+-catalyzed degradation of
chlorophenoxy herbicides by hydrogen peroxide. Environmental Science and
Technology, 26(5), 944-951.
Riffer, R. (Ed.). (1988). The Nature of Colorants in Sugarcane and Cane Sugar
Manufacture. Amsterdam: Elsevier.
Rivas, F. J., Beltrán, F. J., Garcia-araya, J. F., Navarrete, V., & Gimeno, O. (2002).
Co-oxidation of p-hydroxybenzoic acid and atrazine by the Fenton’s like
system Fe(III)/H2O2. Journal of Hazardous Materials, B91, 143-157.
Sedlak, D. L., & Andren, A. W. (1991). Oxidation of chlorobenzene with Fenton's
reagent. Environmental Science and Technology, 25(4), 777-782.

225
Smith, P., & Paton, N. H. (1985). Sugarcane Flavonoids. In R. A. McGinnis & E. G.
Muller (Eds.), Sugar Technology Reviews (Vol. 12, pp. 117-141). Amsterdam:
Elsevier.
Thai, C. C. D., Bakir, H., & Doherty, W. O. S. (2012). Insights to the clarification of
sugar cane juice expressed from sugar cane stalk and trash. Journal of
Agricultural and Food Chemistry, 60, 2916-2923.
van der Poel, P. W., Schiweek, H., & Schwartz, T. (1998). Sugar Technology: Beet
and Cane Manufacture. Berlin: Verlag Dr. Albert Bartens KG.

226
227
CHAPTER 8
Conclusions and Future Aspects
8.1 Findings of the Thesis...................................................................... 228
8.2 Recommendations for Future Work.............................................. 231

228
8.1 Findings of the Thesis
The sugar industry is constantly looking at ways to cost effectively remove
impurity loadings in sugar process streams as these impurities impact on the colour
formed in raw sugar. Besides, the industry is concerned with progressive colour
formation of raw sugar during storage due to oxidation of phenolic compounds,
present in these impurities. This thesis has presented a detailed study on the
degradation of HCAs and also the decolourisation of sugar cane juice.
The phenolic acid and colour composition of factory cane juices processed by
Australian sugar factories was investigated. Phenolic compounds are of interest, as
they are known to be natural colour precursors. These compounds can react with
other organic and inorganic components in juice through enzymatic and non-
enzymatic reactions to produce highly coloured polymeric compounds that contribute
considerably to raw sugar colour.
Amongst the juice extracts of FEJ and PJ process streams, fifteen phenolic
compounds, HMF and furfural were quantified. Changes to the conventional
procedure by dissolving the dried extracts in methanol in place of water, showed an
overall improved response to phenolic acids and revealed the presence of flavonoids.
The chromatographic results reveal that the phenolic acids; CaA, pCoA and FeA were
of the highest concentrations, which are classed as HCAs, present in juice extracts
from Australian factory FEJ and PJ. Moreover, the concentrations of phenolic acids
in burnt cane were twice as much as those obtained in whole crop cane. This is
probably due to the thermal decomposition of HMW phenolics (viz., lignin,
polyphenols) during cane burning.
The colour analyses showed that juice expressed from whole crop harvested
cane has significantly higher colour than juices (11,400–20,000 IU) expressed from
burnt harvested cane (10,400–12700 IU) attributable to the higher amounts of
impurities and natural colourants entering the manufacturing process.
A detailed investigation on the degradation of CaA was conducted. A
quadratic polynomial model was obtained for CaA degradation through the use of
CCD and RSM, and indicated that initial sucrose and CaA concentration significantly
decreased the amount of CaA degraded. Numeric optimisation based on the

229
desirability function was used to determine the optimum process parameters. It
showed that in water at 35 °C, 80% of CaA was degraded at pH 5.5 using 0.72 mM
Fe(II) and 0.44 mM H2O2. However, for a synthetic sugar solution (13% (w/w)
sucrose), under processing conditions similar to that of MJ, only 61% of CaA was
degraded.
The Fenton process was also used to degrade phenolic compounds in synthetic
juice mixtures containing HCAs (viz., CaA, pCoA and FeA), sucrose and water.
Numerous models were developed and validated to predict the degradation of HCAs
through the use of RSM. The models were not only used to predict the optimum
conditions for the degradation of the HCAs but to also understand and probe the
effects of each significant parameter and their interaction with one another on the
degradation of HCAs. Under the optimised conditions for a 200 mg/L initial HCA
mixture concentration, the degradation efficiencies of the mixture in water and sugar
solutions (i.e., 13% (w/w) sucrose) were 77% and 57% respectively.
Sucrose was the most influential parameter that significantly lowered the
degradation efficiencies of the HCAs in the Fenton process. The behaviour of CaA
degradation in the composite system is different from that of pCoA and FeA, possibly
due to its ability to form complexes with Fe(III), as its aromatic ring is highly
activated with the presence of two hydroxyl groups.
Attempts were made to identify and quantify some of the reaction products
from the Fenton oxidation of HCAs by means of LC/MS, HPAEC-PAD, HPIEC and
GC/MS. Mechanistic oxidation pathways were proposed with support from previous
works in the literature. The presence of phenolic aldehydes and aliphatic carboxylic
acids suggest that the Fenton process is oxidising and breaking down the HCAs.
However, the formation of oligomeric products from the oxidative coupling of
cinnamoyl radicals indicates that the Fenton process is also polymerising some of the
oxidised products.
Modifications to the Fenton process were made by either adding AlCl3·6H2O
to the mixture prior to oxidation and/or replacing Fe(II) with Fe(III) (i.e., Fenton-like
process). The oxidation performance of these additives was evaluated on both
complex synthetic juice systems (containing a synthetic melanoidin, HCAs, sucrose
and water) and factory sugar cane juice.

230
In a synthetic juice solution consisting of sucrose (15% (w/w)), the HCAs
(200 mg/L) and a synthetic glucose-glycine melanoidin (2,000 mg/L), the addition of
AlCl3·6H2O in the modified Fenton process degraded the melanoidin and the HCAs
by approximately 69% and 53% respectively. However, AlCl3·6H2O did not play a
significant role in degradation because the Fenton process on its own (i.e., without
AlCl3·6H2O), under the same conditions resulted in 63% and 47% degradation,
respectively. On the other hand, the addition of AlCl3·6H2O played a significant role
in the removal of colour with up to 43% decolourisation at pH 5.3 using 289 mg/L
FeSO4·7H2O, 107 mg/L H2O2 and 322 mg/L AlCl3·6H2O. The Fenton process on its
own, under the same conditions only gave 24% decolourisation.
In factory sugar cane juice, the modified Fenton oxidation process (i.e.,
Fe(II)/Al(III)/H2O2) showed a decrease in colour at pH 9.0 (≤ 42%) for various
factory juices (No. 2 mill, mixed and primary) with minimal sucrose loss. However,
there were increases in colour at pH 4.0 (≤ 45%) and pH 7.0 (≤ 21%) under the same
conditions. Moreover, it is noted that colour measured at pH 9.0 is readily transferred
to the sugar crystal relative to the colour measured at pH 4.0 and pH 7.0, and so some
colour reduction will be realised if these clarified juices were processed to raw sugar.
Overall, the studies conducted throughout this project have shown that the
Fenton and modified Fenton processes are capable of degrading and decolourising
sugar process streams with minimal losses of sucrose.
A preliminary minimum cost calculation indicated that the modified Fenton
processes were found to be reasonably inexpensive for decolourisation of sugar
process streams. Under the optimum working conditions of the modified Fenton
process (i.e., 0.50 mM Fe(II), 0.093 mM Al(III) and 7.5 mM H2O2), effective
decolourisation of factory cane juice at pH 9.0 can be achieved at a cost of $A0.72/t
of juice.

231
8.2 Recommendations for Future Work
A number of suggestions are proposed for future work, based on the research
findings of this thesis. The advantages of the use of the modified Fenton process in
the sugar manufacturing process include its simplicity, its non-specific oxidation
property and the use of inexpensive equipment. Also, the sludge that is produced has
the potential to remove colourants and other impurities (including proteins and
polysaccharides) improving the quality of sugar process streams.
Clarification of Treated Juice
Problems associated with small size and slow settling of flocs need to be
addressed to achieve optimum decolourisation and prevent any carryover of colour in
downstream processes attributable to the finer particles that are not separable during
sedimentation. A suitable coagulating agent such as an anionic polyacrylamide or
polydiallyldimethylammonium chloride for the binding and precipitating for these
flocs needs to be looked into for the effective clarification of juice using the modified
Fenton process.
The sludge produced during Fenton oxidation means that it must be used
before clarification to remove that sludge. It cannot be used on evaporator syrup
unless the treated syrup then undergoes a flotation-type process in order to completely
remove the residual sludge. Otherwise high turbidity will be carried through into the
product sugar, and this is not acceptable.
Raw Sugar Production
In order to determine the extent of Fenton and modified Fenton oxidation as
viable decolourisation processes in sugar production, treated juices should be used to
produce raw sugar. If low colour sugar can be produced, it will be necessary to
investigate ways to minimise sucrose degradation using Fenton oxidation
technologies.

232
Toxicity Measurements
Apart from the measurement of colour, other measurements such as chemical
oxygen demand, total polyphenolic content, total aromaticity and toxicity. Evaluation
of toxicity is important for assessing the impact of oxidised compounds produced
from the Fenton process of food process streams.
Degradation Products
A thorough investigation in probing the oxidation of HCAs and other phenolic
compounds in solution is still required. It is important to understand the degradation
mechanism of these compounds via the Fenton process in order to propose detailed
mechanistic pathways for the conversion of the starting organic materials to their
mineralisation products (i.e., CO2 and H2O). One solution that could be used to better
determine and quantify the reaction products is to initially isolate and purify them first
via preparative HPLC. The combined use of various spectroscopic techniques
including UV/Vis, NMR and FTIR will assist in the characterisation and structure
elucidation of these compounds, especially oligomeric products which are not
available commercially. Changes to the voltages applied during GC/MS and LC/MS
analyses can also be envisioned, to improve fragmentation and assist in the
determination of unknown reaction products of phenolic compounds via the Fenton
process or any other catalytic oxidation process.
Other Oxidants and Catalysts
It is recommended to investigate the oxidative performance of the Fenton
process by using other oxidants in place of H2O2 such as organic hydroperoxides and
peroxy acids or by using other iron-based materials as catalysts. Recently, significant
attention has been paid to the use of cheap heterogeneous catalysts in place of the
typical homogeneous Fe(II) catalysts to overcome the high amounts of iron-
containing sludge formed after oxidation. Bulk iron-containing materials (e.g., red
mud from alumina processing) and natural iron-containing clay minerals (e.g.,
goethite, hematite or magnetite) should be used as Fenton catalysts as they require

233
minimal catalyst preparation and activation. Another approach is to incorporate
aluminium and/or iron onto activated carbons, clays, polymers and zeolites. These
heterogeneous catalysts would not only assist in the degradation of the target
compounds but provide synergies in assisting in the clarification and removal of
intermediate and by-products.

234

235
APPENDICES

236
Table A1.1 Experimental design and results for % CaA degradation
(i.e., Design 1).
Test CaA
(mM)
Sucrose
% (w/w)
pH [Fe(II)]
(mM)
[H2O2]
(mM)
Temp.
(°C)
Time
(s)
Degradation
(%)
1 0.28 34.00 6.5 0.72 2.21 95 120 48
2 1.11 17.00 5.0 0.45 6.62 65 65 52
3 1.11 34.00 3.5 0.72 11.03 95 120 21
4 0.28 34.00 3.5 0.72 2.21 95 10 33
5 0.695 17.00 5.0 0.45 6.62 65 65 40
6 0.695 17.00 5.0 0.45 6.62 65 65 40
7 1.11 34.00 6.5 0.72 11.03 35 10 42
8 0.28 0.00 6.5 0.18 11.03 95 120 67
9 1.11 0.00 6.5 0.18 11.03 95 10 23
10 0.28 0.00 3.5 0.18 2.21 35 10 33
11 1.11 34.00 3.5 0.18 2.21 95 120 16
12 0.695 0.00 5.0 0.45 6.62 65 65 77
13 0.28 0.00 3.5 0.18 11.03 35 120 76
14 0.28 34.00 3.5 0.72 2.21 35 10 33
15 1.11 0.00 3.5 0.72 2.21 95 120 32
16 1.11 34.00 6.5 0.18 2.21 95 120 18
17 0.28 0.00 6.5 0.72 11.03 35 120 80
18 0.695 17.00 5.0 0.45 6.62 35 65 45
19 1.11 0.00 6.5 0.18 11.03 35 120 38
20 0.28 34.00 6.5 0.18 11.03 35 10 46
21 1.11 34.00 3.5 0.72 11.03 35 120 45
22 1.11 0.00 6.5 0.72 2.21 35 120 64
23 0.695 17.00 5.0 0.45 6.62 65 65 40
24 0.695 17.00 5.0 0.45 6.62 65 10 40
25 0.28 0.00 6.5 0.72 11.03 95 120 87
26 0.28 34.00 6.5 0.72 11.03 35 120 34
27 1.11 0.00 6.5 0.72 11.03 35 120 90
28 1.11 0.00 3.5 0.18 2.21 35 120 24
29 0.28 34.00 6.5 0.72 11.03 35 10 28

237
30 0.28 0.00 3.5 0.18 2.21 35 120 65
31 0.28 34.00 3.5 0.72 11.03 35 10 26
32 0.28 0.00 3.5 0.18 11.03 95 10 75
33 1.11 0.00 3.5 0.18 2.21 35 10 1
34 1.11 34.00 6.5 0.72 2.21 35 120 26
35 0.28 0.00 6.5 0.18 2.21 35 120 81
36 0.28 34.00 3.5 0.18 2.21 95 10 32
37 0.28 0.00 6.5 0.72 2.21 35 120 81
38 0.28 34.00 3.5 0.72 11.03 95 10 7
39 1.11 0.00 6.5 0.72 2.21 35 10 35
40 0.695 17.00 5.0 0.45 11.03 65 65 27
41 0.28 34.00 6.5 0.72 2.21 95 10 43
42 1.11 34.00 3.5 0.72 2.21 35 10 18
43 0.695 17.00 5.0 0.45 6.62 65 65 40
44 0.695 17.00 5.0 0.45 6.62 65 65 40
45 1.11 0.00 6.5 0.18 11.03 35 10 8
46 1.11 0.00 3.5 0.18 11.03 95 120 77
47 0.695 17.00 3.5 0.45 6.62 65 65 19
48 0.28 34.00 6.5 0.72 11.03 95 120 43
49 0.28 34.00 3.5 0.18 2.21 35 10 27
50 1.11 0.00 3.5 0.72 11.03 35 120 67
51 1.11 34.00 6.5 0.18 2.21 35 10 0
52 1.11 0.00 6.5 0.18 2.21 35 120 23
53 0.28 34.00 6.5 0.18 11.03 95 120 19
54 1.11 34.00 6.5 0.18 2.21 35 120 16
55 1.11 0.00 3.5 0.72 11.03 35 10 50
56 1.11 34.00 6.5 0.18 11.03 95 10 14
57 1.11 34.00 6.5 0.72 2.21 95 120 31
58 0.28 0.00 6.5 0.72 11.03 95 10 83
59 1.11 34.00 6.5 0.72 11.03 95 10 48
60 0.695 17.00 6.5 0.45 6.62 65 65 38
61 1.11 34.00 6.5 0.72 11.03 95 120 46
62 1.11 34.00 3.5 0.72 2.21 95 10 33
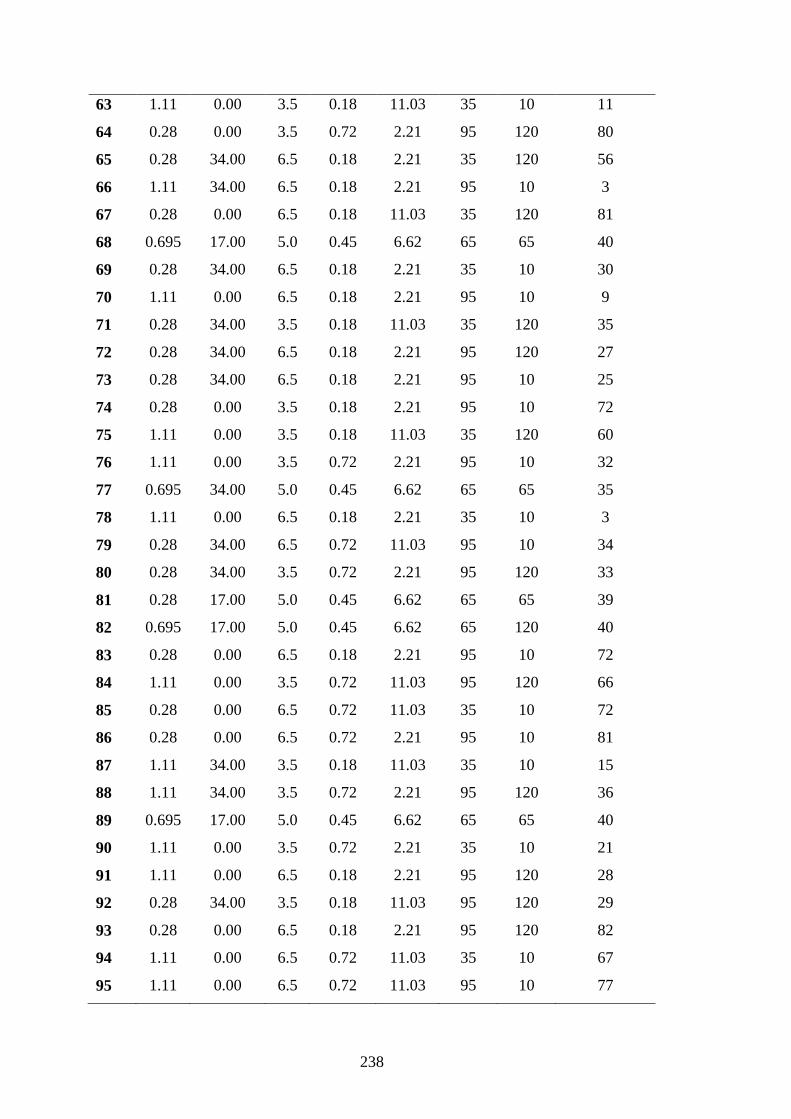
238
63 1.11 0.00 3.5 0.18 11.03 35 10 11
64 0.28 0.00 3.5 0.72 2.21 95 120 80
65 0.28 34.00 6.5 0.18 2.21 35 120 56
66 1.11 34.00 6.5 0.18 2.21 95 10 3
67 0.28 0.00 6.5 0.18 11.03 35 120 81
68 0.695 17.00 5.0 0.45 6.62 65 65 40
69 0.28 34.00 6.5 0.18 2.21 35 10 30
70 1.11 0.00 6.5 0.18 2.21 95 10 9
71 0.28 34.00 3.5 0.18 11.03 35 120 35
72 0.28 34.00 6.5 0.18 2.21 95 120 27
73 0.28 34.00 6.5 0.18 2.21 95 10 25
74 0.28 0.00 3.5 0.18 2.21 95 10 72
75 1.11 0.00 3.5 0.18 11.03 35 120 60
76 1.11 0.00 3.5 0.72 2.21 95 10 32
77 0.695 34.00 5.0 0.45 6.62 65 65 35
78 1.11 0.00 6.5 0.18 2.21 35 10 3
79 0.28 34.00 6.5 0.72 11.03 95 10 34
80 0.28 34.00 3.5 0.72 2.21 95 120 33
81 0.28 17.00 5.0 0.45 6.62 65 65 39
82 0.695 17.00 5.0 0.45 6.62 65 120 40
83 0.28 0.00 6.5 0.18 2.21 95 10 72
84 1.11 0.00 3.5 0.72 11.03 95 120 66
85 0.28 0.00 6.5 0.72 11.03 35 10 72
86 0.28 0.00 6.5 0.72 2.21 95 10 81
87 1.11 34.00 3.5 0.18 11.03 35 10 15
88 1.11 34.00 3.5 0.72 2.21 95 120 36
89 0.695 17.00 5.0 0.45 6.62 65 65 40
90 1.11 0.00 3.5 0.72 2.21 35 10 21
91 1.11 0.00 6.5 0.18 2.21 95 120 28
92 0.28 34.00 3.5 0.18 11.03 95 120 29
93 0.28 0.00 6.5 0.18 2.21 95 120 82
94 1.11 0.00 6.5 0.72 11.03 35 10 67
95 1.11 0.00 6.5 0.72 11.03 95 10 77

239
96 1.11 34.00 3.5 0.72 2.21 35 120 23
97 1.11 34.00 3.5 0.72 11.03 35 10 38
98 0.28 34.00 3.5 0.18 2.21 35 120 33
99 0.28 34.00 3.5 0.18 11.03 95 10 28
100 0.695 17.00 5.0 0.45 6.62 65 65 40
101 0.695 17.00 5.0 0.45 6.62 65 65 40
102 0.28 0.00 6.5 0.72 2.21 35 10 67
103 0.28 0.00 3.5 0.72 2.21 95 10 79
104 1.11 0.00 6.5 0.72 2.21 95 120 57
105 0.695 17.00 5.0 0.45 6.62 95 65 50
106 0.695 17.00 5.0 0.45 6.62 65 65 40
107 0.28 0.00 3.5 0.72 2.21 35 120 67
108 1.11 34.00 3.5 0.18 11.03 95 120 41
109 0.28 0.00 3.5 0.72 11.03 35 120 75
110 0.695 17.00 5.0 0.72 6.62 65 65 24
111 1.11 0.00 6.5 0.72 2.21 95 10 57
112 0.28 34.00 6.5 0.72 2.21 35 10 43
113 0.28 0.00 6.5 0.72 2.21 95 120 85
114 1.11 0.00 6.5 0.18 11.03 95 120 53
115 1.11 34.00 3.5 0.18 11.03 95 10 35
116 0.28 0.00 3.5 0.18 2.21 95 120 77
117 0.28 34.00 3.5 0.72 2.21 35 120 35
118 1.11 34.00 6.5 0.18 11.03 95 120 39
119 1.11 34.00 6.5 0.18 11.03 35 120 32
120 0.28 34.00 3.5 0.72 11.03 95 120 28
121 1.11 34.00 3.5 0.18 2.21 35 120 12
122 0.695 17.00 5.0 0.45 2.21 65 65 30
123 0.28 34.00 6.5 0.72 2.21 35 120 45
124 1.11 34.00 3.5 0.72 11.03 95 10 17
125 1.11 34.00 3.5 0.18 2.21 95 10 15
126 0.28 0.00 3.5 0.18 11.03 35 10 52
127 1.11 0.00 3.5 0.18 11.03 95 10 70
128 0.28 0.00 3.5 0.72 11.03 35 10 59

240
129 0.28 34.00 3.5 0.18 2.21 95 120 32
130 0.28 0.00 6.5 0.18 2.21 35 10 35
131 0.28 0.00 3.5 0.72 11.03 95 10 95
132 0.28 34.00 3.5 0.18 11.03 35 10 31
133 0.28 34.00 3.5 0.72 11.03 35 120 32
134 0.28 0.00 3.5 0.18 11.03 95 120 86
135 1.11 34.00 6.5 0.72 2.21 35 10 19
136 1.11 34.00 6.5 0.72 2.21 95 10 30
137 1.11 0.00 3.5 0.18 2.21 95 120 43
138 1.11 0.00 6.5 0.72 11.03 95 120 81
139 0.695 17.00 5.0 0.18 6.62 65 65 44
140 0.28 0.00 3.5 0.72 2.21 35 10 49
141 0.28 0.00 6.5 0.18 11.03 35 10 72
142 0.28 0.00 6.5 0.18 11.03 95 10 48
143 1.11 34.00 6.5 0.72 11.03 35 120 63
144 1.11 34.00 3.5 0.18 2.21 35 10 5
145 1.11 0.00 3.5 0.72 2.21 35 120 30
146 1.11 34.00 3.5 0.18 11.03 35 120 43
147 1.11 0.00 3.5 0.18 2.21 95 10 42
148 0.28 0.00 3.5 0.72 11.03 95 120 97
149 1.11 0.00 3.5 0.72 11.03 95 10 66
150 1.11 34.00 6.5 0.18 11.03 35 10 16
151 0.28 34.00 6.5 0.18 11.03 95 10 21
152 0.28 34.00 6.5 0.18 11.03 35 120 51

241
Table A1.2 Sucrose and reducing sugar results on selected tests at t = 2 min
(i.e., Design 1).*
Sugar Content % (w/w) Sugar Content % (w/w)
Test Glucose Fructose Sucrose Test Glucose Fructose Sucrose
1 0.01 0.02 33.98 1B 0.00 0.00 33.98
3 0.53 0.25 34.01 3B 0.00 0.00 34.02
11 0.05 0.03 33.99 11B 0.00 0.00 34.00
16 0.00 0.00 34.05 16B 0.00 0.00 34.05
21 0.24 0.21 33.98 21B 0.00 0.00 33.98
26 0.02 0.03 34.00 26B 0.00 0.00 34.00
34 0.01 0.01 34.05 34B 0.00 0.00 34.05
48 0.28 0.24 34.12 48B 0.00 0.00 34.11
53 0.02 0.02 34.07 53B 0.00 0.00 34.08
54 0.00 0.00 34.05 54B 0.00 0.00 34.05
57 0.02 0.03 34.02 57B 0.00 0.00 34.02
61 0.05 0.07 33.96 61B 0.00 0.00 33.96
65 0.02 0.01 33.98 65B 0.00 0.00 33.98
71 0.00 0.01 33.97 71B 0.00 0.00 33.97
72 0.03 0.02 34.02 72B 0.00 0.00 34.02
80 0.02 0.04 34.00 80B 0.00 0.00 34.00
82 0.14 0.12 16.98 82B 0.00 0.00 16.98
88 0.01 0.03 34.02 88B 0.00 0.00 34.02
92 0.10 0.11 34.05 92B 0.00 0.00 34.05
96 0.01 0.00 34.00 96B 0.00 0.00 34.01
98 0.00 0.00 34.02 98B 0.00 0.00 34.02
108 0.03 0.02 34.10 108B 0.00 0.00 34.10
117 0.00 0.00 34.01 117B 0.00 0.00 34.01
118 0.17 0.20 34.02 118B 0.00 0.00 34.02
119 0.00 0.00 34.01 119B 0.00 0.00 34.01
120 0.10 0.11 33.98 120B 0.00 0.00 33.98
121 0.00 0.00 34.00 121B 0.00 0.00 34.00
123 0.05 0.04 34.01 123B 0.00 0.00 34.01
129 0.01 0.02 33.97 129B 0.00 0.00 33.97

242
133 0.01 0.00 33.98 133B 0.00 0.00 33.99
143 0.01 0.01 33.95 143B 0.00 0.00 33.95
146 0.02 0.02 34.01 146B 0.00 0.00 34.01
152 0.00 0.01 34.03 152B 0.00 0.00 34.04
*Tests denoted with B indicate blank tests (i.e., t = 0 min)

243
Table A1.3 Experimental design and results for % CaA, % pCoA, % FeA and
% total HCA degradation (i.e., Design 2).
Degradation (%)
Test Total HCA
(mg/L)
Sucrose
% (w/w)
pH Temp.
(°C)
CaA pCoA FeA Total
HCA
1 200 7.50 5.0 38 85 37 43 55
2 155 11.25 4.8 31 95 42 44 60
3 110 7.50 5.0 38 90 52 53 65
4 65 3.75 5.3 31 71 65 70 69
5 110 15.00 5.0 38 94 46 43 61
6 110 7.50 5.0 25 96 53 55 68
7 155 3.75 5.3 44 74 60 62 65
8 65 11.25 4.8 31 96 45 45 62
9 110 7.50 5.0 38 90 48 50 63
10 155 11.25 4.8 31 95 46 48 63
11 155 11.25 4.8 44 95 40 44 59
12 110 7.50 5.5 38 39 57 56 51
13 65 11.25 4.8 31 96 47 50 64
14 110 0.00 5.0 38 61 77 79 73
15 20 7.50 5.0 38 94 62 57 71
16 110 0.00 5.0 38 60 76 78 72
17 65 3.75 4.8 31 95 66 69 77
18 110 7.50 5.0 38 91 52 50 64
19 155 3.75 4.8 31 93 58 59 70
20 110 15.00 5.0 38 93 – – 52
21 155 11.25 5.3 31 79 48 51 59
22 65 11.25 4.8 44 97 33 37 56
23 155 3.75 4.8 44 94 52 56 67
24 155 11.25 4.8 44 95 41 43 60
25 200 7.50 5.0 38 85 43 47 58
26 65 3.75 5.3 44 70 70 74 71
27 155 3.75 4.8 44 93 56 57 69
28 155 3.75 5.3 31 82 67 66 –

244
29 110 7.50 4.5 38 97 39 43 59
30 65 3.75 4.8 44 96 57 65 72
31 65 3.75 4.8 31 95 58 63 72
32 65 3.75 4.8 44 95 55 64 72
33 155 3.75 4.8 31 93 55 54 67
34 65 11.25 5.3 31 80 49 – 66
35 110 7.50 5.0 25 95 48 53 65
36 65 11.25 4.8 44 96 35 40 57
37 65 11.25 5.3 44 91 46 45 60
38 65 11.25 5.3 44 88 52 49 63
39 155 11.25 5.3 44 87 49 49 62
40 110 7.50 5.0 50 90 51 57 66
41 65 3.75 5.3 31 67 63 68 66
42 110 7.50 5.5 38 45 49 54 50
43 155 3.75 5.3 31 80 60 60 67
44 20 7.50 5.0 38 97 47 53 65
45 65 11.25 5.3 31 81 48 48 59
46 110 7.50 4.5 38 97 34 39 57
47 155 11.25 5.3 31 82 53 57 64
48 110 7.50 5.0 38 90 52 53 65
49 110 7.50 5.0 50 90 50 52 64
50 110 7.50 5.0 38 90 50 50 63
51 155 3.75 5.3 44 72 60 63 65
52 65 3.75 5.3 44 73 72 75 73
53 155 11.25 5.3 44 85 53 52 63
54 110 7.50 5.0 38 90 48 50 63

245
Table A1.4 Sucrose and reducing sugar results at t = 2 min (i.e., Design 2).*
Sugar Content % (w/w) Sugar Content % (w/w)
Test Glucose Fructose Sucrose Test Glucose Fructose Sucrose
1 0.00 0.00 7.47 1B 0.00 0.00 7.47
2 0.00 0.00 11.20 2B 0.00 0.00 11.20
3 0.00 0.00 7.53 3B 0.00 0.00 7.53
4 0.00 0.01 3.81 4B 0.00 0.00 3.82
5 0.00 0.00 15.01 5BB 0.00 0.00 15.01
6 0.00 0.00 7.55 6B 0.00 0.00 7.55
7 0.00 0.01 3.75 7B 0.00 0.00 3.76
8 0.00 0.00 11.30 8B 0.00 0.00 11.30
9 0.00 0.01 7.84 9B 0.00 0.00 7.85
10 0.00 0.00 11.27 10B 0.00 0.00 11.27
11 0.00 0.00 11.22 11B 0.00 0.00 11.22
12 0.01 0.00 7.90 12B 0.00 0.00 7.90
13 0.00 0.00 11.28 13B 0.00 0.00 11.28
14 0.00 0.00 0.00 14B 0.00 0.00 0.00
15 0.01 0.00 7.55 15B 0.00 0.00 7.55
16 0.00 0.00 0.00 16B 0.00 0.00 0.00
17 0.01 0.01 3.75 17B 0.00 0.00 3.76
18 0.00 0.00 7.49 18B 0.00 0.00 7.49
19 0.00 0.01 3.80 19B 0.00 0.00 3.81
20 0.00 0.00 14.99 20B 0.00 0.00 14.99
21 0.00 0.00 11.26 21B 0.00 0.00 11.26
22 0.00 0.00 11.20 22B 0.00 0.00 11.20
23 0.00 0.01 3.82 23B 0.00 0.00 3.82
24 0.00 0.00 11.31 24B 0.00 0.00 11.31
25 0.01 0.00 7.60 25B 0.00 0.00 7.60
26 0.01 0.01 3.78 26B 0.00 0.00 3.79
27 0.01 0.00 3.82 27B 0.00 0.00 3.82
28 0.00 0.01 3.72 28B 0.00 0.00 3.72
29 0.00 0.00 7.52 29B 0.00 0.00 7.52
30 0.01 0.00 3.72 30B 0.00 0.00 3.73

246
31 0.00 0.01 3.73 31B 0.00 0.00 3.74
32 0.02 0.01 3.76 32B 0.00 0.00 3.77
33 0.00 0.00 3.79 33B 0.00 0.00 3.79
34 0.00 0.00 11.20 34B 0.00 0.00 11.20
35 0.00 0.00 7.42 35B 0.00 0.00 7.42
36 0.00 0.00 11.24 36B 0.00 0.00 11.24
37 0.01 0.01 11.20 37B 0.00 0.00 11.20
38 0.00 0.00 11.22 38B 0.00 0.00 11.22
39 0.00 0.00 11.27 39B 0.00 0.00 11.27
40 0.00 0.00 7.52 40B 0.00 0.00 7.52
41 0.00 0.00 3.76 41B 0.00 0.00 3.76
42 0.00 0.00 7.50 42B 0.00 0.00 7.51
43 0.01 0.00 3.74 43B 0.00 0.00 3.76
44 0.00 0.00 7.51 44B 0.00 0.00 7.51
45 0.01 0.00 11.24 45B 0.00 0.00 11.24
46 0.00 0.00 7.47 46B 0.00 0.00 7.47
47 0.00 0.00 11.22 47B 0.00 0.00 11.22
48 0.00 0.00 7.41 48B 0.00 0.00 7.41
49 0.00 0.01 7.50 49B 0.00 0.00 7.50
50 0.00 0.00 7.52 50B 0.00 0.00 7.52
51 0.00 0.01 3.73 51B 0.00 0.00 3.74
52 0.00 0.01 3.74 52B 0.00 0.00 3.74
53 0.00 0.00 11.27 53B 0.00 0.00 11.27
54 0.01 0.00 7.60 54B 0.00 0.00 7.61
*Tests denoted with B indicate blank tests (i.e., t = 0 min)
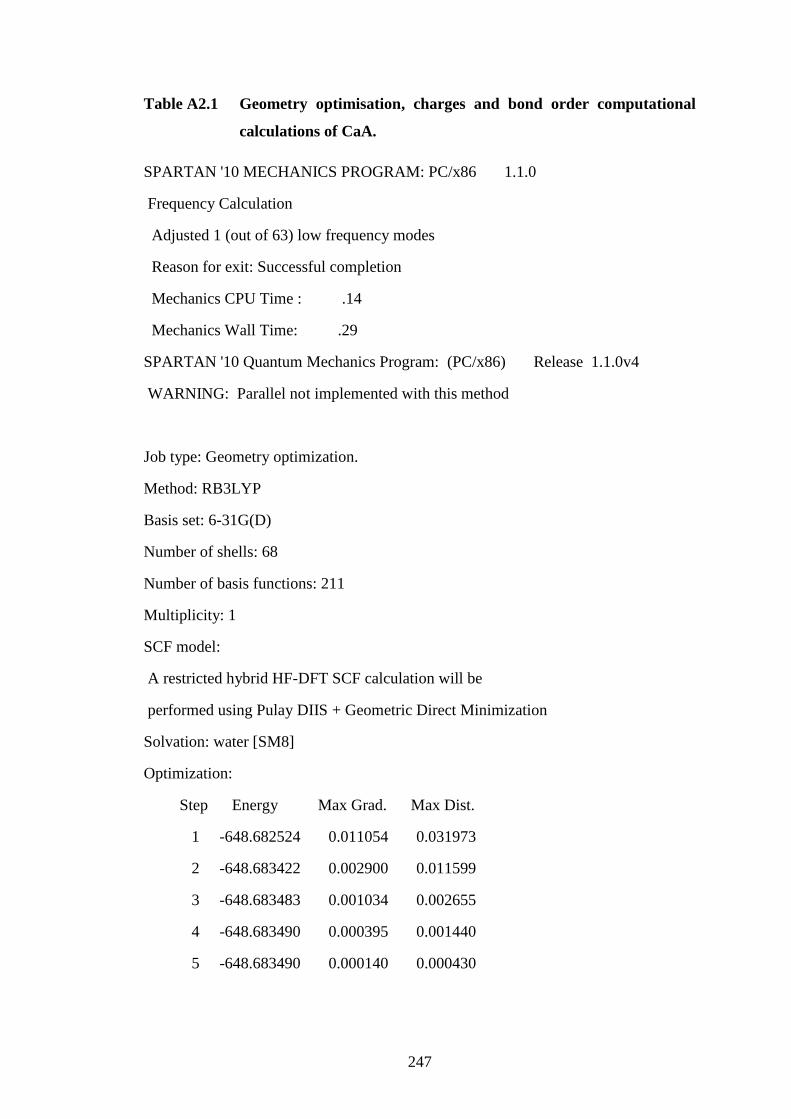
247
Table A2.1 Geometry optimisation, charges and bond order computational
calculations of CaA.
SPARTAN '10 MECHANICS PROGRAM: PC/x86 1.1.0
Frequency Calculation
Adjusted 1 (out of 63) low frequency modes
Reason for exit: Successful completion
Mechanics CPU Time : .14
Mechanics Wall Time: .29
SPARTAN '10 Quantum Mechanics Program: (PC/x86) Release 1.1.0v4
WARNING: Parallel not implemented with this method
Job type: Geometry optimization.
Method: RB3LYP
Basis set: 6-31G(D)
Number of shells: 68
Number of basis functions: 211
Multiplicity: 1
SCF model:
A restricted hybrid HF-DFT SCF calculation will be
performed using Pulay DIIS + Geometric Direct Minimization
Solvation: water [SM8]
Optimization:
Step Energy Max Grad. Max Dist.
1 -648.682524 0.011054 0.031973
2 -648.683422 0.002900 0.011599
3 -648.683483 0.001034 0.002655
4 -648.683490 0.000395 0.001440
5 -648.683490 0.000140 0.000430

248
Reason for exit: Successful completion
Quantum Calculation CPU Time : 13:44.31
Atomic Charges:
Electrostatic Mulliken Natural
1 H1 : +0.212 +0.146 +0.248
2 C1 : -0.374 -0.258 -0.248
3 C4 : -0.243 -0.170 -0.302
4 C2 : +0.208 +0.164 -0.112
5 C6 : +0.308 +0.261 +0.277
6 C5 : +0.200 +0.392 +0.291
7 C3 : -0.244 -0.229 -0.203
8 H3 : +0.167 +0.165 +0.250
9 H4 : +0.176 +0.195 +0.258
10 C7 : -0.143 -0.163 -0.120
11 H8 : +0.150 +0.163 +0.248
12 C8 : -0.310 -0.188 -0.371
13 H9 : +0.174 +0.175 +0.247
14 C9 : +0.663 +0.461 +0.785
15 O1 : -0.575 -0.497 -0.668
16 O2 : -0.588 -0.607 -0.718
17 H10 : +0.439 +0.445 +0.517
18 O3 : -0.567 -0.680 -0.710
19 H2 : +0.453 +0.453 +0.515
20 O4 : -0.582 -0.699 -0.712
21 H6 : +0.476 +0.470 +0.530

249
Bond Orders Mulliken
1 C1 H1 : 0.907
2 C1 C4 : 0.073
3 C1 C2 : 1.338
4 C1 C6 : 1.472
5 C1 C8 : 0.031
6 C1 O3 : 0.045
7 C4 C5 : 1.394
8 C4 C3 : 1.421
9 C4 H4 : 0.901
10 C4 O4 : 0.037
11 C2 C5 : 0.070
12 C2 C3 : 1.374
13 C2 C7 : 1.104
14 C6 C5 : 1.281
15 C6 C3 : 0.066
16 C6 O3 : 0.987
17 C6 O4 : 0.046
18 C5 C8 : 0.028
19 C5 O4 : 0.889
20 C3 H3 : 0.915
21 C3 C7 : 0.034
22 C3 C8 : 0.050
23 C7 H8 : 0.910
24 C7 C8 : 1.704
25 C7 C9 : 0.045
26 C7 O1 : 0.057
27 C8 H9 : 0.906
28 C8 C9 : 1.043

250
29 C9 O1 : 1.945
30 C9 O2 : 1.015
31 O1 O2 : 0.055
32 O1 H10 : 0.026
33 O2 H10 : 0.737
34 O3 H2 : 0.721
35 O4 H2 : 0.041
36 O4 H6 : 0.727
Reason for exit: Successful completion
Properties CPU Time : 1.14
Properties Wall Time: 1.35

251
Table A2.2 Geometry optimisation, charges and bond order computational
calculations of pCoA.
SPARTAN '10 MECHANICS PROGRAM: PC/x86 1.1.0
Frequency Calculation
Adjusted 1 (out of 60) low frequency modes
Reason for exit: Successful completion
Mechanics CPU Time : .13
Mechanics Wall Time: .06
SPARTAN '10 Quantum Mechanics Program: (PC/x86) Release 1.1.0v4
WARNING: Parallel not implemented with this method
Job type: Geometry optimization.
Method: RB3LYP
Basis set: 6-31G(D)
Number of shells: 64
Number of basis functions: 196
Multiplicity: 1
SCF model:
A restricted hybrid HF-DFT SCF calculation will be
performed using Pulay DIIS + Geometric Direct Minimization
Solvation: water [SM8]
Optimization:
Step Energy Max Grad. Max Dist.
1 -573.459367 0.014428 0.082246
2 -573.462031 0.004680 0.029876
3 -573.462253 0.001063 0.003240
4 -573.462261 0.000340 0.001653
5 -573.462262 0.000109 0.000325

252
Reason for exit: Successful completion
Quantum Calculation CPU Time : 11:46.03
Quantum Calculation Wall Time: 11:59.19
Atomic Charges:
Electrostatic Mulliken Natural
1 H1 : +0.161 +0.168 +0.247
2 C1 : -0.212 -0.178 -0.179
3 C4 : -0.335 -0.171 -0.314
4 C2 : +0.211 +0.148 -0.130
5 C6 : -0.234 -0.190 -0.288
6 C5 : +0.410 +0.352 +0.347
7 C3 : -0.161 -0.219 -0.178
8 H3 : +0.152 +0.170 +0.250
9 H4 : +0.180 +0.189 +0.255
10 C7 : -0.191 -0.159 -0.119
11 H8 : +0.158 +0.159 +0.246
12 C8 : -0.302 -0.186 -0.374
13 H9 : +0.182 +0.178 +0.248
14 C9 : +0.670 +0.453 +0.785
15 O1 : -0.576 -0.496 -0.669
16 O2 : -0.598 -0.607 -0.719
17 H10 : +0.441 +0.445 +0.517
18 O4 : -0.569 -0.670 -0.694
19 H6 : +0.440 +0.458 +0.515
20 H11 : +0.173 +0.157 +0.255

253
Bond Orders Mulliken
1 C1 H1 : 0.907
2 C1 C4 : 0.078
3 C1 C2 : 1.361
4 C1 C6 : 1.489
5 C1 C8 : 0.034
6 C4 C5 : 1.369
7 C4 C3 : 1.448
8 C4 H4 : 0.903
9 C4 O4 : 0.044
10 C2 C5 : 0.071
11 C2 C3 : 1.364
12 C2 C7 : 1.108
13 C6 C5 : 1.367
14 C6 C3 : 0.075
15 C6 O4 : 0.032
16 C6 H11 : 0.917
17 C5 C3 : 0.029
18 C5 C8 : 0.026
19 C5 O4 : 0.965
20 C3 H3 : 0.913
21 C3 C7 : 0.031
22 C3 C8 : 0.046
23 C7 H8 : 0.911
24 C7 C8 : 1.701
25 C7 C9 : 0.047
26 C7 O1 : 0.057
27 C8 H9 : 0.905
28 C8 C9 : 1.044

254
29 C9 O1 : 1.950
30 C9 O2 : 1.013
31 O1 O2 : 0.055
32 O1 H10 : 0.026
33 O2 H10 : 0.738
34 O4 H6 : 0.736
Reason for exit: Successful completion
Properties CPU Time : 1.14
Properties Wall Time: 1.19

255
Table A2.3 Geometry optimisation, charges and bond order computational
calculations of pCoA.
SPARTAN '10 MECHANICS PROGRAM: PC/x86 1.1.0
Frequency Calculation
Adjusted 4 (out of 72) low frequency modes
Reason for exit: Successful completion
Mechanics CPU Time : .17
Mechanics Wall Time: .07
SPARTAN '10 Quantum Mechanics Program: (PC/x86) Release 1.1.0v4
WARNING: Parallel not implemented with this method
Job type: Geometry optimization.
Method: RB3LYP
Basis set: 6-31G(D)
Number of shells: 76
Number of basis functions: 230
Multiplicity: 1
SCF model:
A restricted hybrid HF-DFT SCF calculation will be
performed using Pulay DIIS + Geometric Direct Minimization
Solvation: water [SM8]
Optimization:
Step Energy Max Grad. Max Dist.
1 -687.885006 0.782278 0.172563
2 -687.946054 0.309605 0.069009
3 -687.962560 0.152032 0.158684
4 -687.967209 0.046289 0.101182
5 -687.974773 0.023712 0.037747
6 -687.975517 0.011028 0.013128

256
7 -687.975705 0.003954 0.003702
8 -687.975724 0.001689 0.002490
9 -687.975729 0.000477 0.001537
10 -687.975730 0.000136 0.000451
Reason for exit: Successful completion
Quantum Calculation CPU Time : 35:13.30
Quantum Calculation Wall Time: 36:02.80
Atomic Charges:
Electrostatic Mulliken Natural
1 H1 : +0.217 +0.149 +0.248
2 C1 : -0.560 -0.264 -0.230
3 C4 : -0.299 -0.182 -0.300
4 C2 : +0.384 +0.169 -0.116
5 C6 : +0.405 +0.285 +0.268
6 C5 : +0.241 +0.375 +0.286
7 C3 : -0.304 -0.224 -0.204
8 H3 : +0.184 +0.167 +0.250
9 H4 : +0.194 +0.193 +0.255
10 C7 : -0.251 -0.162 -0.120
11 H8 : +0.165 +0.163 +0.247
12 C8 : -0.219 -0.186 -0.370
13 H9 : +0.170 +0.177 +0.248
14 C9 : +0.601 +0.461 +0.785
15 O1 : -0.555 -0.496 -0.668
16 O2 : -0.588 -0.607 -0.718
17 H10 : +0.447 +0.445 +0.517
18 O3 : -0.283 -0.559 -0.549

257
19 O4 : -0.561 -0.678 -0.700
20 H6 : +0.452 +0.463 +0.520
21 C10 : -0.373 -0.216 -0.313
22 H2 : +0.177 +0.174 +0.217
23 H5 : +0.177 +0.174 +0.217
24 H7 : +0.179 +0.178 +0.227
Bond Orders Mulliken
1 C1 H1 : 0.904
2 C1 C4 : 0.074
3 C1 C2 : 1.358
4 C1 C6 : 1.443
5 C1 C8 : 0.033
6 C1 O3 : 0.037
7 C4 C5 : 1.371
8 C4 C3 : 1.447
9 C4 H4 : 0.900
10 C4 O4 : 0.044
11 C2 C5 : 0.068
12 C2 C3 : 1.359
13 C2 C7 : 1.102
14 C6 C5 : 1.287
15 C6 C3 : 0.067
16 C6 O3 : 0.925
17 C6 O4 : 0.032
18 C5 C8 : 0.027
19 C5 O3 : 0.025
20 C5 O4 : 0.917
21 C3 H3 : 0.913

258
22 C3 C7 : 0.031
23 C3 C8 : 0.046
24 C7 H8 : 0.910
25 C7 C8 : 1.705
26 C7 C9 : 0.046
27 C7 O1 : 0.058
28 C8 H9 : 0.905
29 C8 C9 : 1.042
30 C9 O1 : 1.946
31 C9 O2 : 1.014
32 O1 O2 : 0.055
33 O1 H10 : 0.026
34 O2 H10 : 0.738
35 O3 C10 : 0.880
36 O4 H6 : 0.731
37 C10 H2 : 0.930
38 C10 H5 : 0.930
39 C10 H7 : 0.941
Reason for exit: Successful completion
Properties CPU Time : 1.33
Properties Wall Time: 1.46

259
Table A2.4 Sucrose and reducing sugar results of Fenton-mediated reactions
of sucrose at t = 2 min.*
Sugar Content % (w/w) Sugar Content % (w/w)
Test Glucose Fructose Sucrose Test Glucose Fructose Sucrose
1 0.02 0.01 3.75 1B 0.00 0.00 3.76
2 0.01 0.01 7.50 2B 0.00 0.00 7.51
3 0.00 0.00 11.25 3B 0.00 0.00 11.24
4 0.00 0.00 15.01 4B 0.00 0.00 15.01
*Tests denoted with B indicate blank tests (i.e., t = 0 min)
Figure A2.1 High-performance LC-DAD chromatograms (UV/Vis detection at
280 nm) of the HCA mixture subjected to Fenton oxidation at
2 min (pH 4.7, 25 °C).
-10
30
70
110
150
0 5 10 15 20 25
Ab
sorb
an
ce (
mA
U)
Retention Time (min)

260
Figure A2.2 Total ion chromatogram (negative ion mode ESI-MS) of the HCA
mixture subjected to Fenton oxidation at 2 min (pH 4.7, 25 °C).
Figure A2.3 Gas chromatogram of a SPE extract of the HCA mixture
subjected to Fenton oxidation at 2 min (pH 4.7, 25 °C).
0
5
10
15
20
25
0 5 10 15 20 25
Inte
nsi
ty (
10
6 )
Retention Time (min)
0.00
0.40
0.80
1.20
1.60
2.00
15 20 25 30 35
Inte
nsi
ty (
10
6 )
Retention Time (min)
×
×

261
Figure A2.4 Negative ion mode ESI-MS full-scan spectrum relevant to the
dimer product arising from the Fenton oxidation of FeA,
[M]– = 385.1 Da.
Figure A2.5 Negative ion mode ESI-MS full-scan spectrum relevant to the
tetramer product arising from the Fenton oxidation of CaA,
[M]– = 715.2 Da.
0.0
2.0
4.0
6.0
100 300 500 700 900
Inte
nsi
ty (
10
6 )
Mass-to-Charge (m/z) Ratio
715.2
471.1
357.1
393.1
269.1
179.1
0.0
1.0
2.0
3.0
4.0
100 200 300 400
Inte
nsi
ty (
10
6 )
Mass-to-Charge (m/z) Ratio
385.1
341.1
297.1
249.0189.1
155.0
×
×

262
Table A3.1 Experimental design for % total HCA, % melanoidin degradation
and decolourisation.
Test Melanoidin
(mg/L)
Total HCA
(mg/L)
pH FeSO4·7H2O
(mM)
AlCl3·6H2O
(mM)
1 1500 150 5.63 0.85 0.41
2 1000 100 5.25 1.40 0.83
3 1000 100 6.00 1.40 0.83
4 500 50 4.88 1.94 0.41
5 1000 0 5.25 1.40 0.83
6 500 150 5.63 1.94 0.41
7 1500 150 4.88 1.94 0.41
8 1500 50 5.63 1.94 0.41
9 500 150 4.88 0.85 0.41
10 0 100 5.25 1.40 0.83
11 1500 50 4.88 0.85 0.41
12 1000 200 5.25 1.40 0.83
13 1000 100 5.25 1.40 0
14 1000 100 4.50 1.40 0.83
15 500 150 4.88 1.94 1.24
16 500 150 5.63 0.85 1.24
17 1500 50 4.88 1.94 1.24
18 1000 100 5.25 1.40 0.83
19 500 50 4.88 0.85 1.24
20 500 50 5.63 0.85 0.41
21 2000 100 5.25 1.40 0.83
22 1000 100 5.25 1.40 1.66
23 1000 100 5.25 1.40 0.83
24 1000 100 5.25 1.40 0.83
25 1500 50 5.63 0.85 1.24
26 1500 150 4.88 0.85 1.24
27 1000 100 5.25 0.31 0.83
28 1000 100 5.25 1.40 0.83
29 1000 100 5.25 1.40 0.83

263
30 500 50 5.63 1.94 1.24
31 1000 100 5.25 2.49 0.83
32 1500 150 5.63 1.94 1.24

264
Table A3.2 Results for % total HCA, % melanoidin degradation and
decolourisation.
Degradation (%)
Test Melanoidin Total HCA Decolourisation (%)
1 70 43 51
2 65 47 12
3 64 45 23
4 64 51 33
5 67 – 8
6 – 46 47
7 69 50 -42
8 64 51 14
9 63 – 18
10 – 50 –
11 71 – 6
12 66 48 28
13 66 47 34
14 – 49 –
15 74 46 -121
16 62 52 22
17 76 52 45
18 65 51 20
19 65 47 23
20 71 51 –
21 70 48 -3
22 64 46 27
23 66 48 –
24 71 47 8
25 64 40 34
26 63 48 25
27 65 – 42
28 65 49 -3
29 66 – 10

265
30 69 48 –
31 – 49 10
32 64 52 12

266
Figure A3.1 Normal probability plots of residuals for fitted model using
(a) melanoidin and (b) total HCA degradation data after power
transformation.
(a)
(b)

267
Figure A3.2 Box-Cox plots of (a) melanoidin and (b) total HCA degradation
data for the determination of the optimised power transformed
response surface models.
(a)
(b)

268
Figure A3.3 Plots of predicted response and experimental (actual) values for
the degradation (%) of (a) melanoidin and (b) total HCA.
(a)
(b)

269
Figure A3.4 Plot of predicted response and experimental (actual) values for
the decolourisation (%).

270


![biocorrosion of stainless steel grade 304L in sugar cane juice[1]](https://img.dokumen.tips/doc/110x75/551e3b7a4a795993108b49f1/biocorrosion-of-stainless-steel-grade-304l-in-sugar-cane-juice1.jpg)