Embed Size (px)
Citation preview
Kimberley Morrill PhD
Regional Dairy Specialist
Cornell Cooperative Extension
Colostrum: Quality,
Management and Options

Colostrum
Sets the calf up for a lifetime
Calf health
Calf growth rates
Local gut effects
Lifetime health
Future milk production
Longevity

First one there is the winner!
It’s a race between bacteria
OR
The antibodies in colostrum

Colostrum Management
3 Q’s
Quantity – 4 litres
Quality – 50 mg IgG/ litre
Quickness – ASAP
Time to revisit? More to colostrum
management?

Colostrum Management
Pre-partum
Harvest
Storage
Feeding
How do we Evaluate colostrum management program?
Consequences of bacterial
contamination of colostrum
Pathogens may cause disease
E.coli James et al., 1981
Salmonella
Mycoplasma
M.avium subsp. Paratuberculosis
Bacteria counts are associated with
decreased serum IgG concentrations.
James et al., 1981, Johnson et al., 2007
How do bacteria interfere w/passive
transfer of IgG?
Uptake of globulin protein across gut was reduced when bacteria were present.
James et al., 1981, Staley and Bush, 1985
Proposed mechanisms:
Antigen-antibody complex forms in gut lumen.
Damage to villus epithelial cells, reduce permeability
Replacement of fetal type enterocytes by adult type cells (incapable of macromolecule uptake). Corley et al., 1977

Colostrum Composition
Source of: Immunoglobulins
Energy
Protein
Vitamins/minerals
Bioactive peptides
Maternal cells
Hormones
Potential pathogens

Colostrum Composition
Overall sample means for IgG, nutrients & bacterial contamination.
n Mean SD1 Minimum Maximum
IgG (mg/mL) 827 68.8 32.9 <1.8 200.2
Fat (%) 531 5.6 3.2 1.0 21.7
Protein (%) 542 12.7 3.3 2.6 20.5
Lactose (%) 538 2.9 0.5 1.2 4.6
Other Solids (%) 544 4.3 0.5 1.1 8.8
Total Solids (%) 496 22.6 4.7 1.7 33.1
SCC Log10 548 5.9 0.8 3.8 7.3
TPC Log10 548 4.9 0.9 3.0 6.8
Morrill et al., 2012
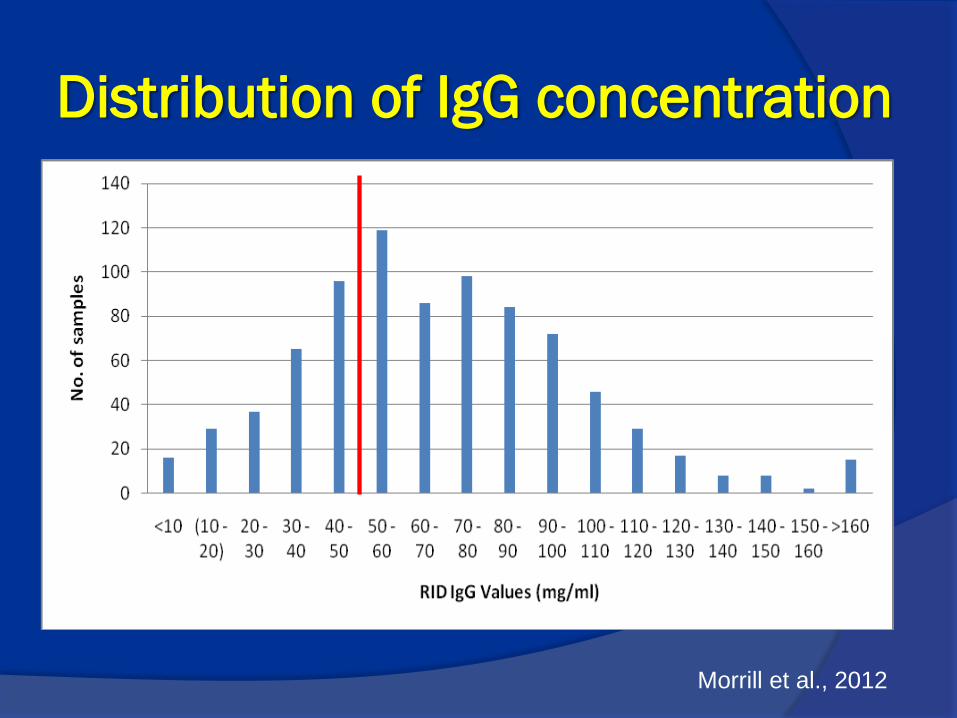
Distribution of IgG concentration
Morrill et al., 2012
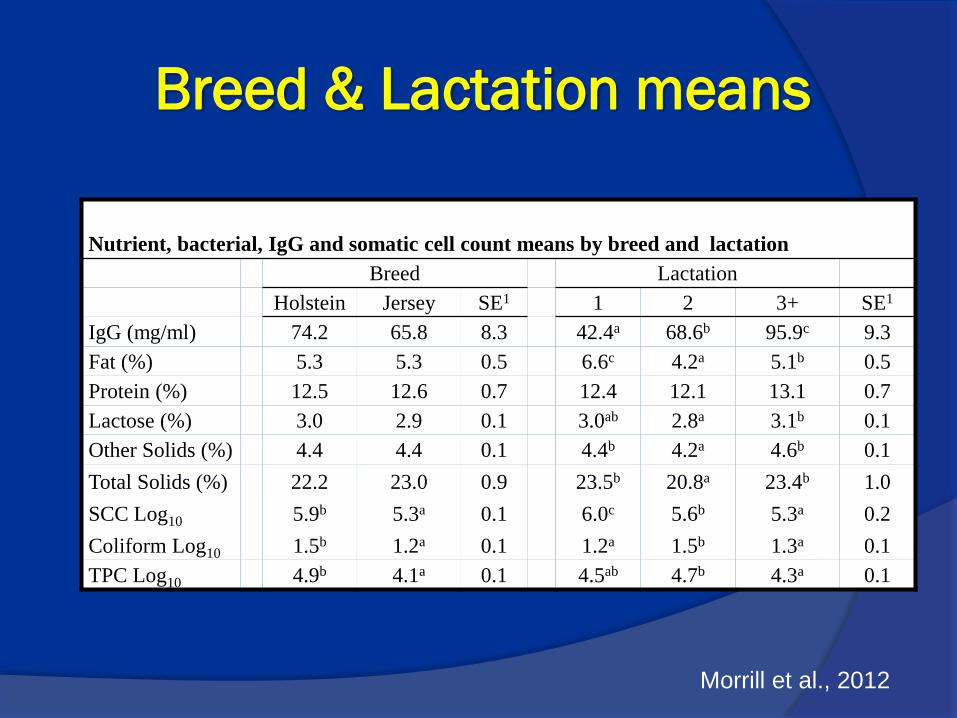
Breed & Lactation means
Nutrient, bacterial, IgG and somatic cell count means by breed and lactation
Breed Lactation
Holstein Jersey SE1 1 2 3+ SE1
IgG (mg/ml) 74.2 65.8 8.3 42.4a 68.6b 95.9c 9.3
Fat (%) 5.3 5.3 0.5 6.6c 4.2a 5.1b 0.5
Protein (%) 12.5 12.6 0.7 12.4 12.1 13.1 0.7
Lactose (%) 3.0 2.9 0.1 3.0ab 2.8a 3.1b 0.1
Other Solids (%) 4.4 4.4 0.1 4.4b 4.2a 4.6b 0.1
Total Solids (%) 22.2 23.0 0.9 23.5b 20.8a 23.4b 1.0
SCC Log10 5.9b 5.3a 0.1 6.0c 5.6b 5.3a 0.2
Coliform Log10 1.5b 1.2a 0.1 1.2a 1.5b 1.3a 0.1
TPC Log10 4.9b 4.1a 0.1 4.5ab 4.7b 4.3a 0.1
Morrill et al., 2012

Pooled vs. Individual samples
Nutrient, bacterial, IgG and somatic cell count means of individual
samples compared to pooled maternal colostrum samples
Pooled p-value
NO YES SE1
n = 734 n = 93
IgG (mg/ml) 69.7b 60.3a 3.6 0.01
Fat (%) 5.7 6.1 0.6 0.50
Protein (%) 13.2b 10.9a 0.6 0.01
Lactose (%) 2.9 2.9 0.1 0.43
Other Solids (%) 4.4 4.6 0.1 0.05
Total Solids (%) 23.2b 21.0a 1.1 0.04
SCC Log10 5.7a 6.2b 0.2 0.01
TPC Log10 4.9a 5.5b 0.1 <0.0001
Coliform Log10 1.3a 2.0b 0.1 <0.0001 ab Means within a row with different superscripts differ (P < 0.05) 1 SE = Standard error
Morrill et al., 2012
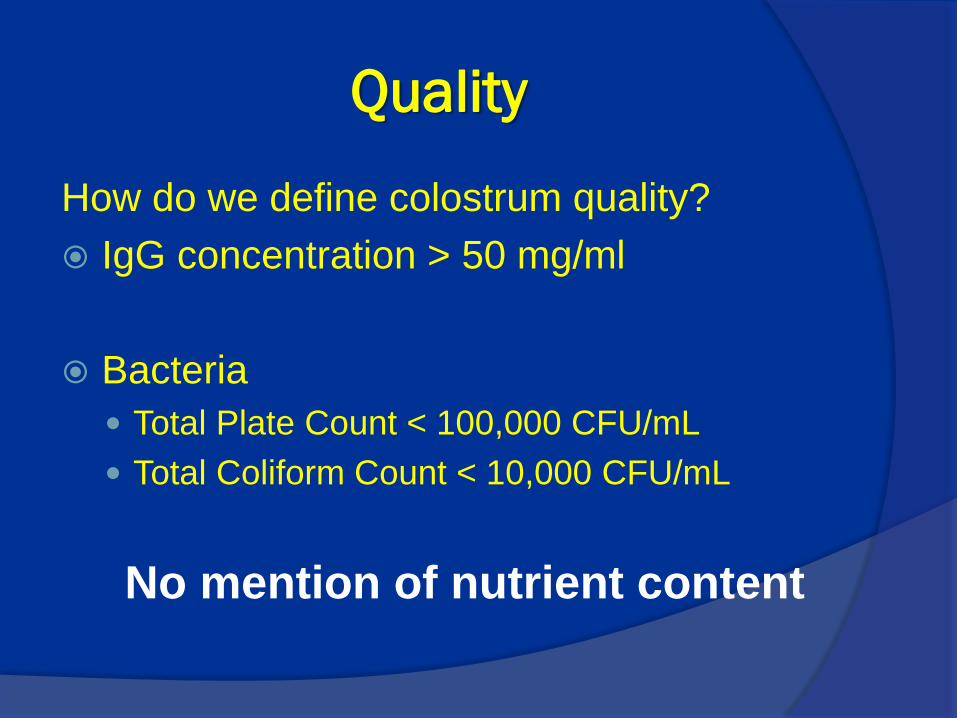
Quality
How do we define colostrum quality?
IgG concentration > 50 mg/ml
Bacteria
Total Plate Count < 100,000 CFU/mL
Total Coliform Count < 10,000 CFU/mL
No mention of nutrient content

Measuring Colostral IgG
63.5% of operations normally hand-feed
colostrum
13% of these farms estimate IgG levels
7.6% of small farms (<100 cows) estimate IgG
19.8% of medium farms (100 – 499 cows)
estimate IgG
45.2% of large farms (>500 cows) estimate IgG
(NAHMS, 2007)
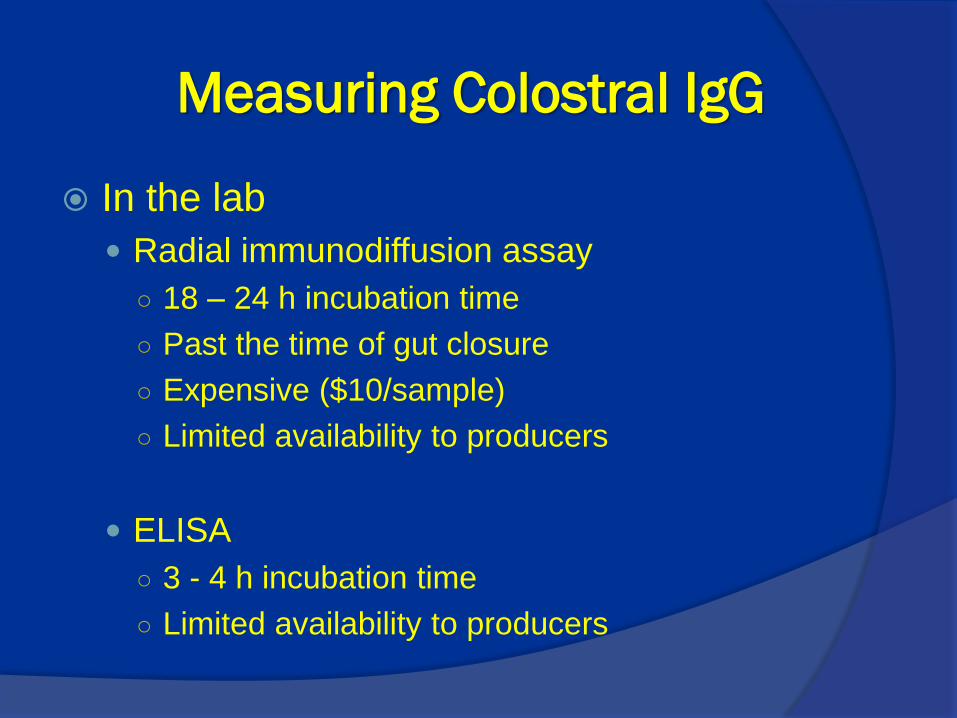
Measuring Colostral IgG
In the lab
Radial immunodiffusion assay
○ 18 – 24 h incubation time
○ Past the time of gut closure
○ Expensive ($10/sample)
○ Limited availability to producers
ELISA
○ 3 - 4 h incubation time
○ Limited availability to producers
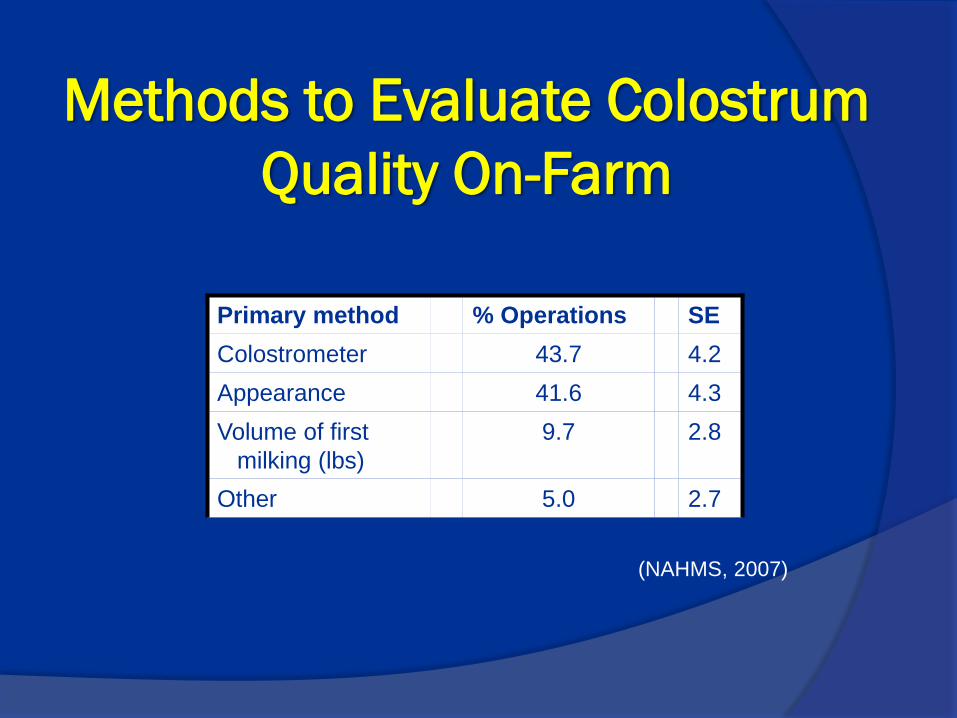
Methods to Evaluate Colostrum
Quality On-Farm
Primary method % Operations SE
Colostrometer 43.7 4.2
Appearance 41.6 4.3
Volume of first
milking (lbs)
9.7 2.8
Other 5.0 2.7
(NAHMS, 2007)

Visual Assessment
Can be subjective to IgG quality
However…
Detect colostrum that should be discarded Mastitis
Bloody
Watery
Contaminated
Visual assessment of the cow

Colostrometer
Based on specific gravity
Provide an estimate of relative quality, not
actual IgG quantity (Fleenor and Stott, 1980)
Often inaccurate or utilized improperly
(Morin et al., 2001, Mechor et al., 1992, 1993)
Inexpensive
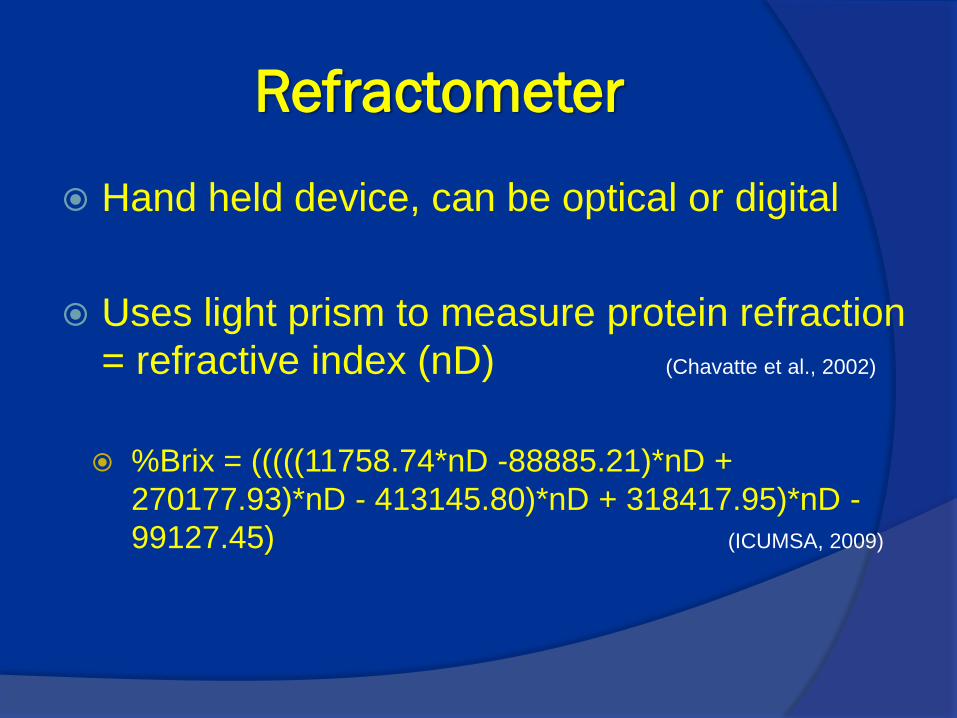
Refractometer
Hand held device, can be optical or digital
Uses light prism to measure protein refraction
= refractive index (nD) (Chavatte et al., 2002)
%Brix = (((((11758.74*nD -88885.21)*nD +
270177.93)*nD - 413145.80)*nD + 318417.95)*nD -
99127.45) (ICUMSA, 2009)
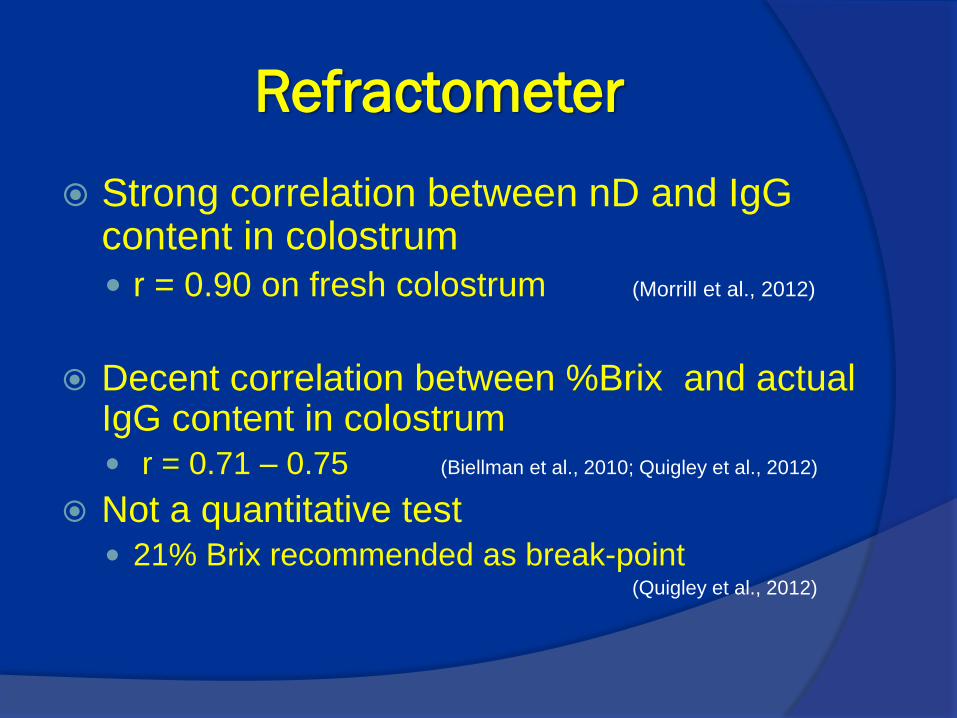
Refractometer
Strong correlation between nD and IgG content in colostrum
r = 0.90 on fresh colostrum (Morrill et al., 2012)
Decent correlation between %Brix and actual IgG content in colostrum r = 0.71 – 0.75 (Biellman et al., 2010; Quigley et al., 2012)
Not a quantitative test 21% Brix recommended as break-point (Quigley et al., 2012)

What about bacteria???

Colostrum Management
Pre-partum
Harvest
Storage
Feeding
How do we Evaluate colostrum management program?
How Do I know If Colostrum Is
Contaminated?
Currently no test available for on-farm
analysis
Producers must be proactive to reduce
potential bacterial contamination

Reducing The Risk Of Contamination
1. Where does the bacteria come from?
2. What can I do to prevent/reduce
bacterial contamination?
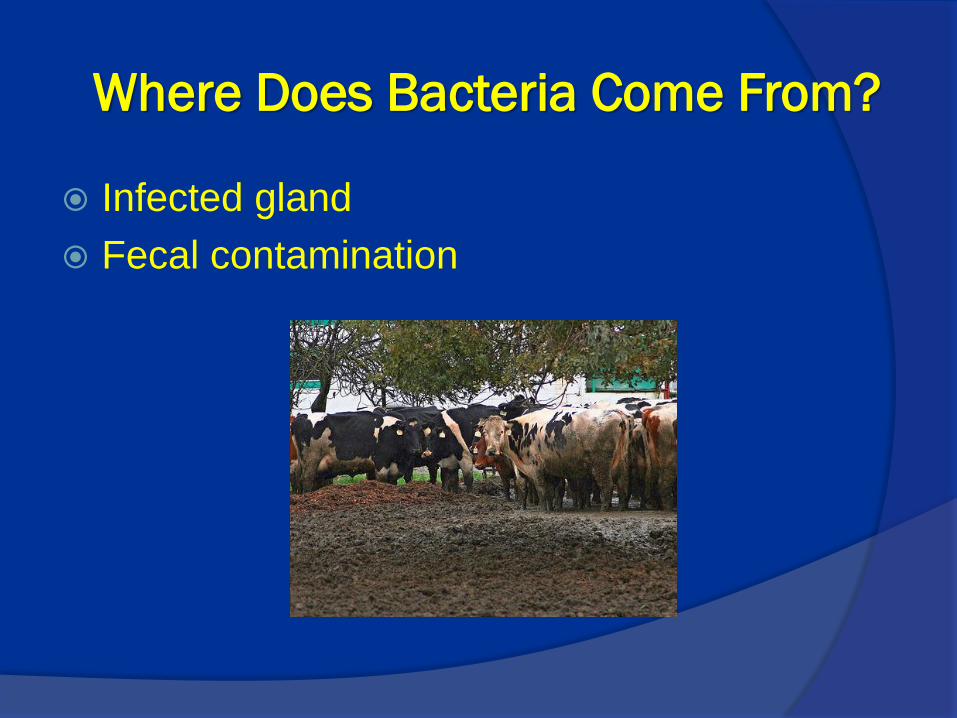
Where Does Bacteria Come From?
Infected gland
Fecal contamination
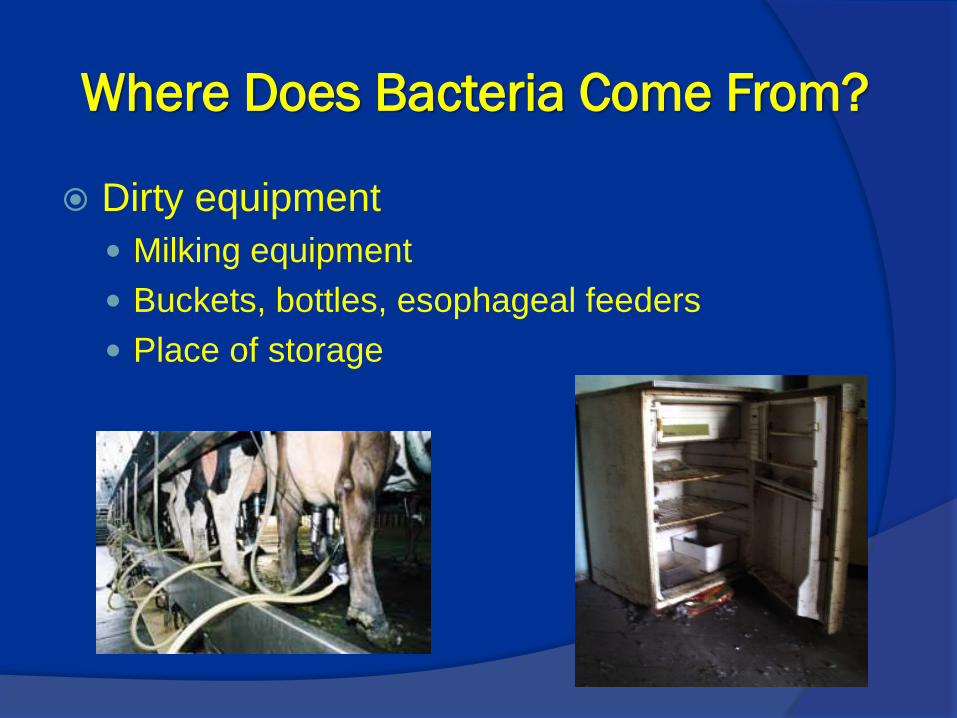
Where Does Bacteria Come From?
Dirty equipment
Milking equipment
Buckets, bottles, esophageal feeders
Place of storage

Where Does Bacteria Come From?
During storage
Additional contamination
Bacterial Growth
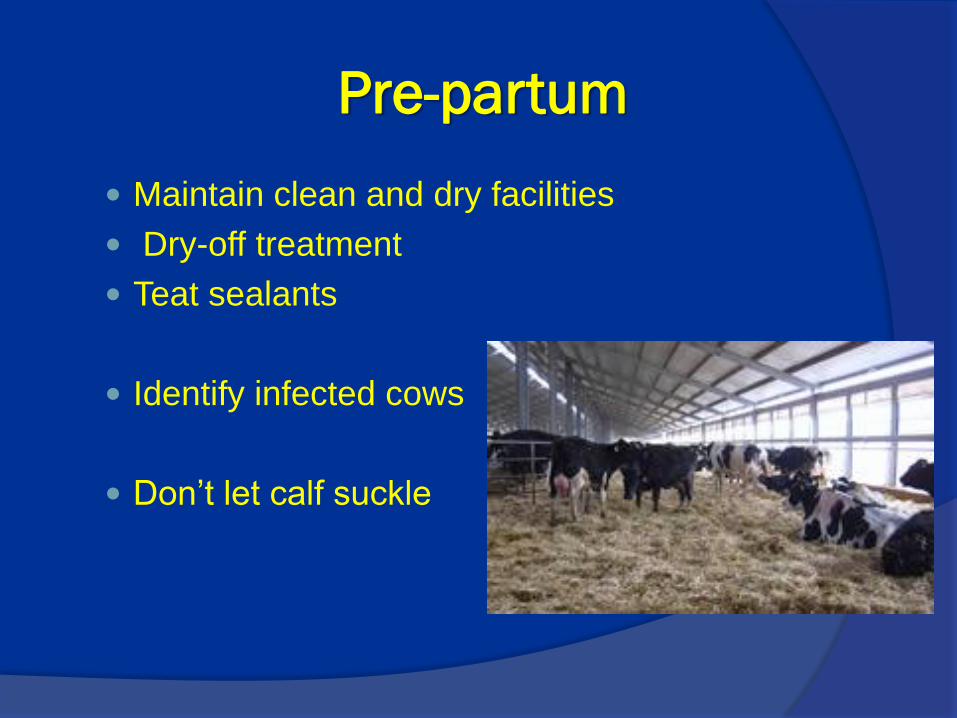
Maintain clean and dry facilities
Dry-off treatment
Teat sealants
Identify infected cows
Don’t let calf suckle
Pre-partum

Harvest
Cow’s teats should be thoroughly
cleaned and dried
First time in 30-60 days
All equipment should be well-
cleaned and sanitized
Milking equipment
Buckets
Don’t pool raw colostrum
Discard colostrum that is bloody,
watery or has fecal contamination

Storage
Storage/ feeding equipment should be well
sanitized
Buckets, bottles, nipples, feeders…
Cover colostrum after collection to prevent
additional contamination
Colostrum should be fed or cooled within 1 h
after collection
Freeze excess colostrum in flat gallon zip lock bags

How are we doing at feeding quality
colostrum?
Percentage of samples with above and
below industry recommended adequate
IgG concentration
IgG (mg/ml) Samples (%)
<50 243 29.4
50 - 80 303 36.6
80 - 100 156 18.9
100 - 120 75 9.1
>120 50 6.0
Total 827 100
Percentage of samples with above and below
industry recommended total plate count
Range (CFU/ml) Samples %
< 100,000 409 54.8
100,000 - 300,000 90 12.1
300,000 - 500,000 47 6.3
500,00 - 1,000,000 74 9.9
>1,000,000 126 16.9
Total 746 100
IgG > 50 mg/ml TPC < 100,000 CFU/ml
Morrill et al., 2012

Percentage of samples meeting one or
both industry recommendations for
colostrum quality
Overall Data
Set
Region
Northeast Southeast Midwest Southwest
Quality n (%) n (%) n (%) n (%) n (%)
> 50 IgG < 100,000 TPC 294 39.4 58 45.3 17 14.9 88 53.7 177 43.2
> 50 IgG > 100,000 TPC 233 31.2 32 25.0 54 47.4 51 31.1 96 23.4
< 50 IgG > 100,000 TPC 104 14.0 28 21.9 14 12.3 14 8.5 83 20.2
< 50 IgG < 100,000 TPC 115 15.4 10 7.8 29 25.4 11 6.7 54 13.2
Total 746 100 128 100 114 100 164 100 410 100
Morrill et al., 2012
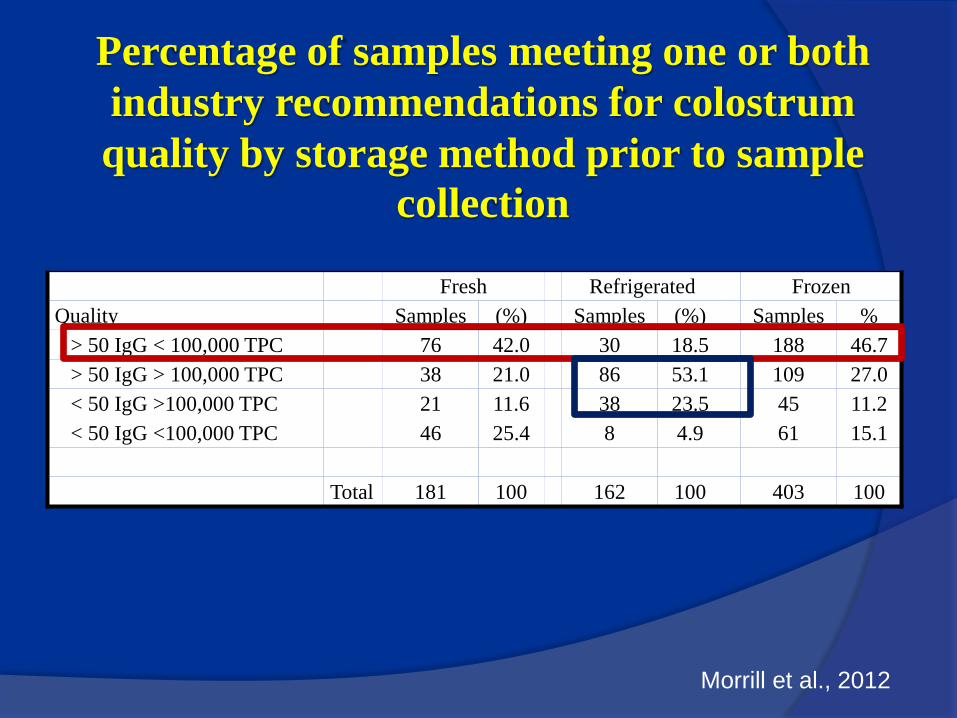
Percentage of samples meeting one or both
industry recommendations for colostrum
quality by storage method prior to sample
collection
Fresh Refrigerated Frozen
Quality Samples (%) Samples (%) Samples %
> 50 IgG < 100,000 TPC 76 42.0 30 18.5 188 46.7
> 50 IgG > 100,000 TPC 38 21.0 86 53.1 109 27.0
< 50 IgG >100,000 TPC 21 11.6 38 23.5 45 11.2
< 50 IgG <100,000 TPC 46 25.4 8 4.9 61 15.1
Total 181 100 162 100 403 100
Morrill et al., 2012

Additional Options Available
Heat Treatment of Colostrum
Colostrum replacement products
Both options have pro’s and con’s and
should be evaluated prior to making a
major management change
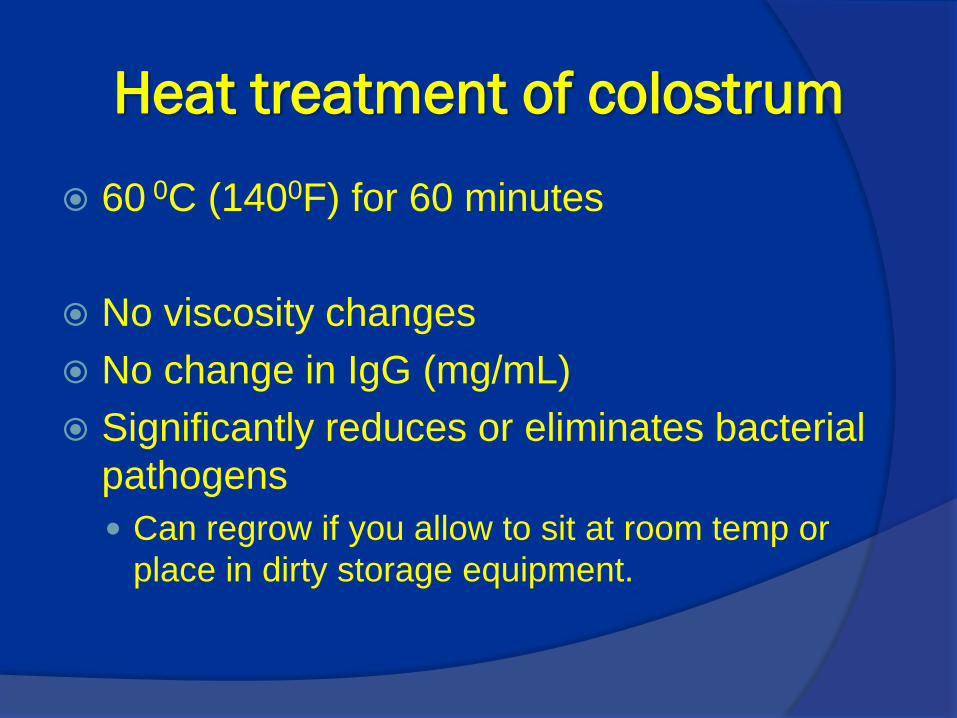
Heat treatment of colostrum
60 0C (1400F) for 60 minutes
No viscosity changes
No change in IgG (mg/mL)
Significantly reduces or eliminates bacterial
pathogens
Can regrow if you allow to sit at room temp or
place in dirty storage equipment.
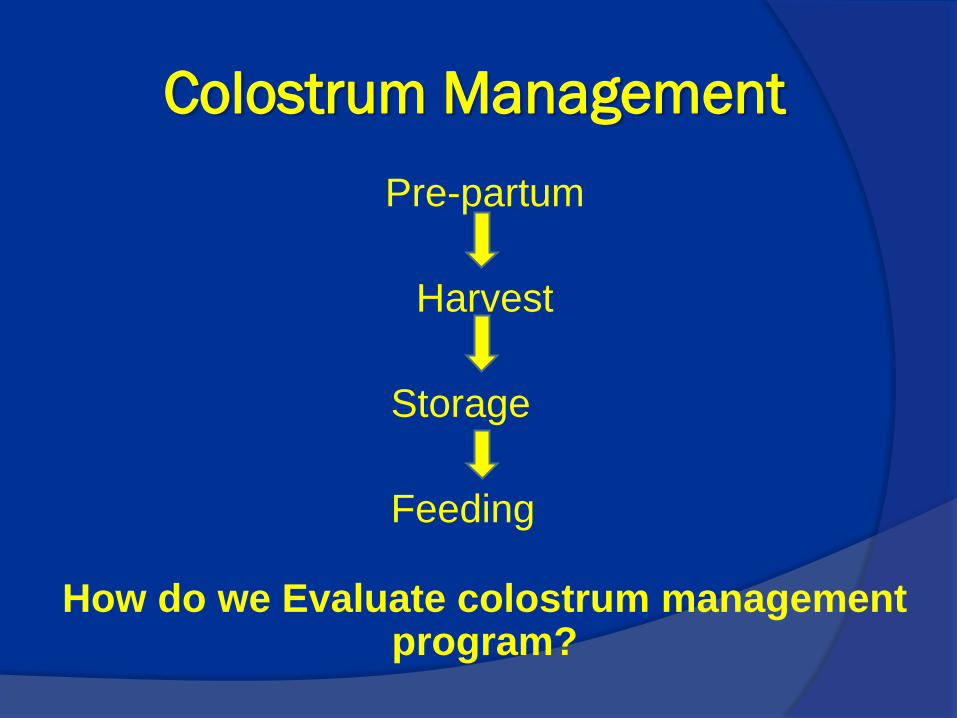
Colostrum Management
Pre-partum
Harvest
Storage
Feeding
How do we Evaluate colostrum management program?
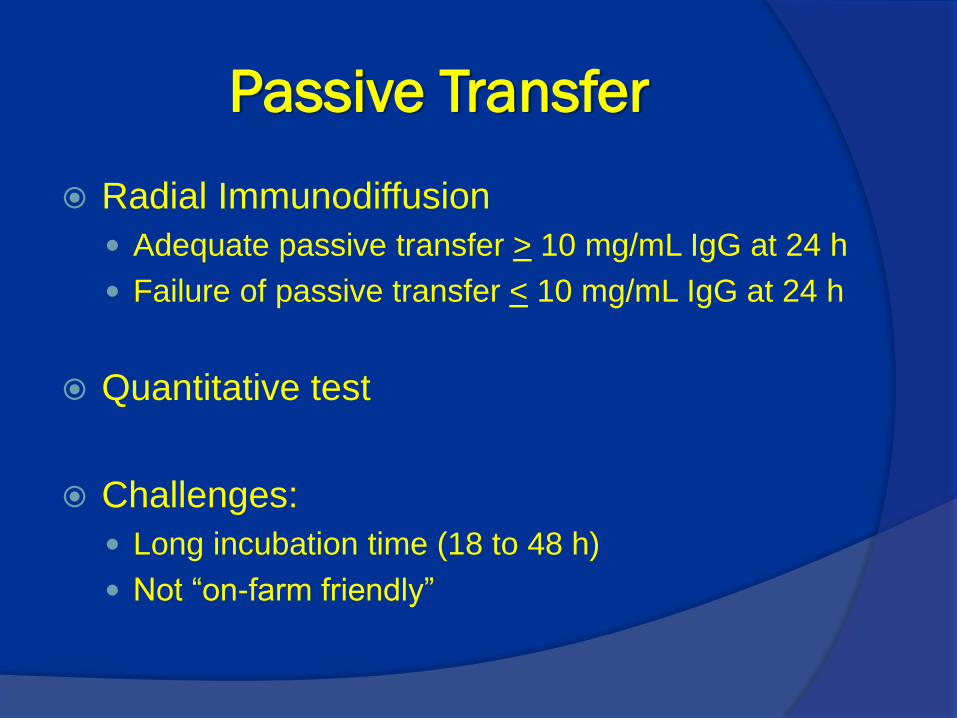
Passive Transfer
Radial Immunodiffusion
Adequate passive transfer > 10 mg/mL IgG at 24 h
Failure of passive transfer < 10 mg/mL IgG at 24 h
Quantitative test
Challenges:
Long incubation time (18 to 48 h)
Not “on-farm friendly”
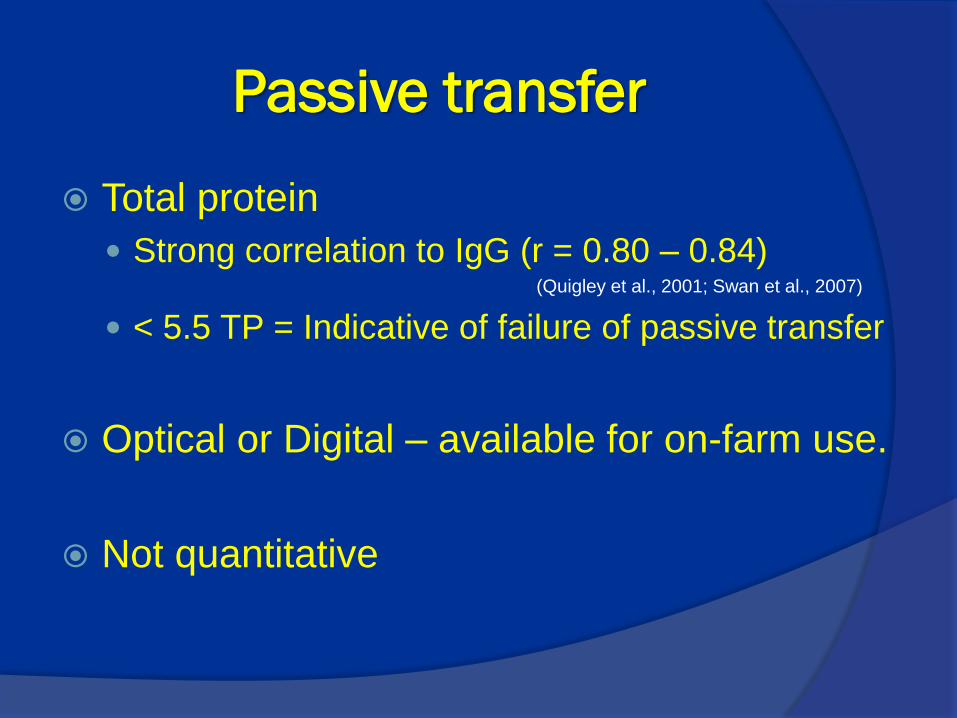
Passive transfer
Total protein
Strong correlation to IgG (r = 0.80 – 0.84) (Quigley et al., 2001; Swan et al., 2007)
< 5.5 TP = Indicative of failure of passive transfer
Optical or Digital – available for on-farm use.
Not quantitative
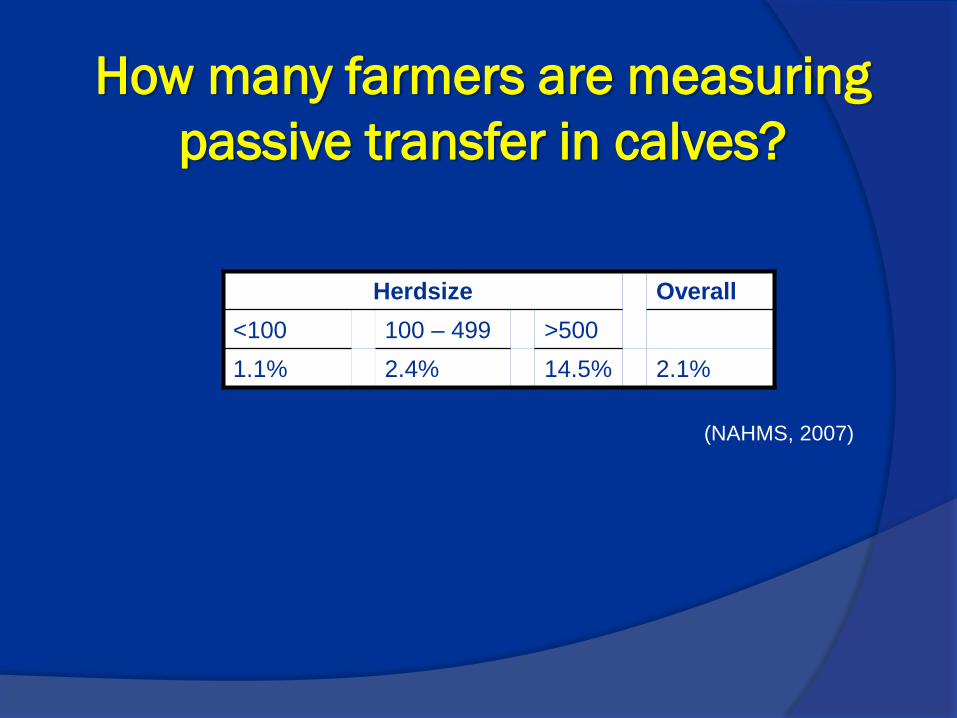
How many farmers are measuring
passive transfer in calves?
Herdsize Overall
<100 100 – 499 >500
1.1% 2.4% 14.5% 2.1%
(NAHMS, 2007)
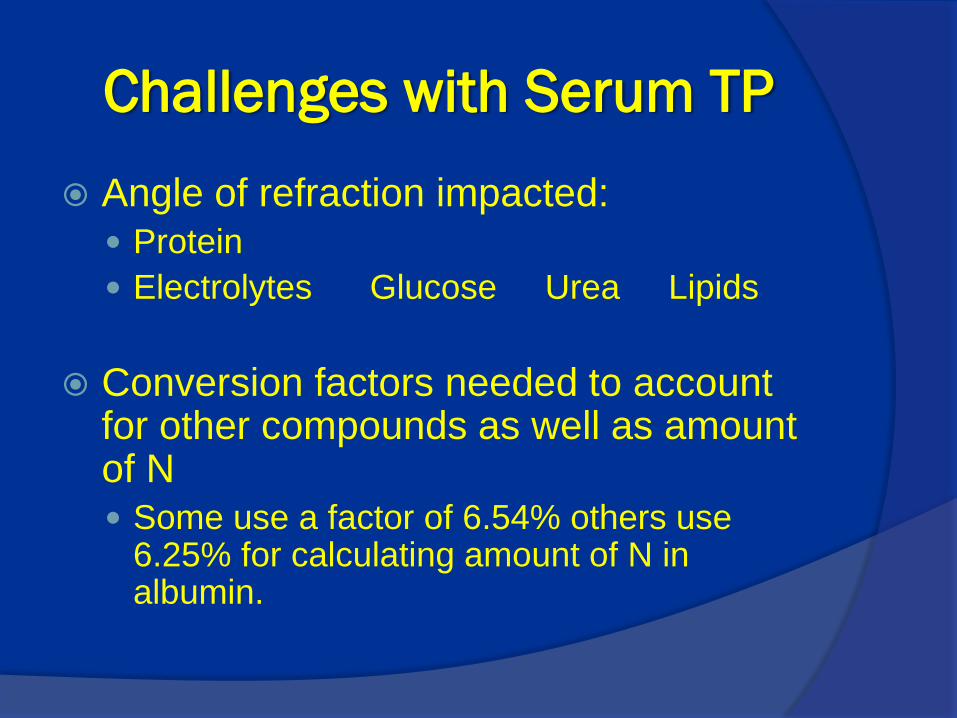
Challenges with Serum TP
Angle of refraction impacted:
Protein
Electrolytes Glucose Urea Lipids
Conversion factors needed to account for other compounds as well as amount of N
Some use a factor of 6.54% others use 6.25% for calculating amount of N in albumin.

Can we use the same refractometer to
evaluate colostrum quality and
determine if the calf has achieved
adequate passive transfer?
YES!!!
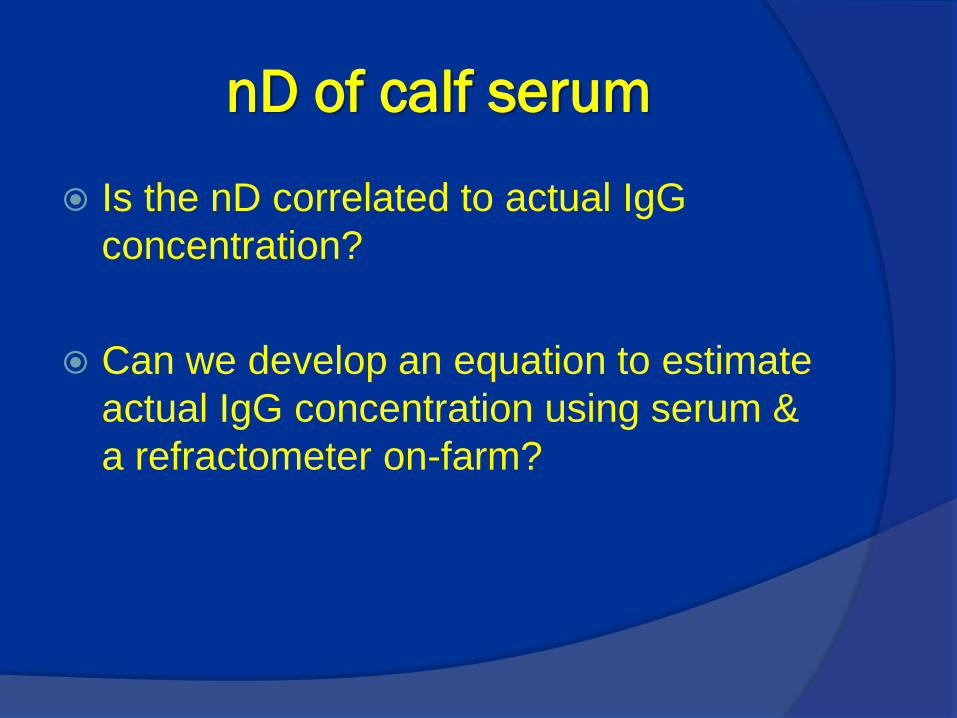
nD of calf serum
Is the nD correlated to actual IgG
concentration?
Can we develop an equation to estimate
actual IgG concentration using serum &
a refractometer on-farm?
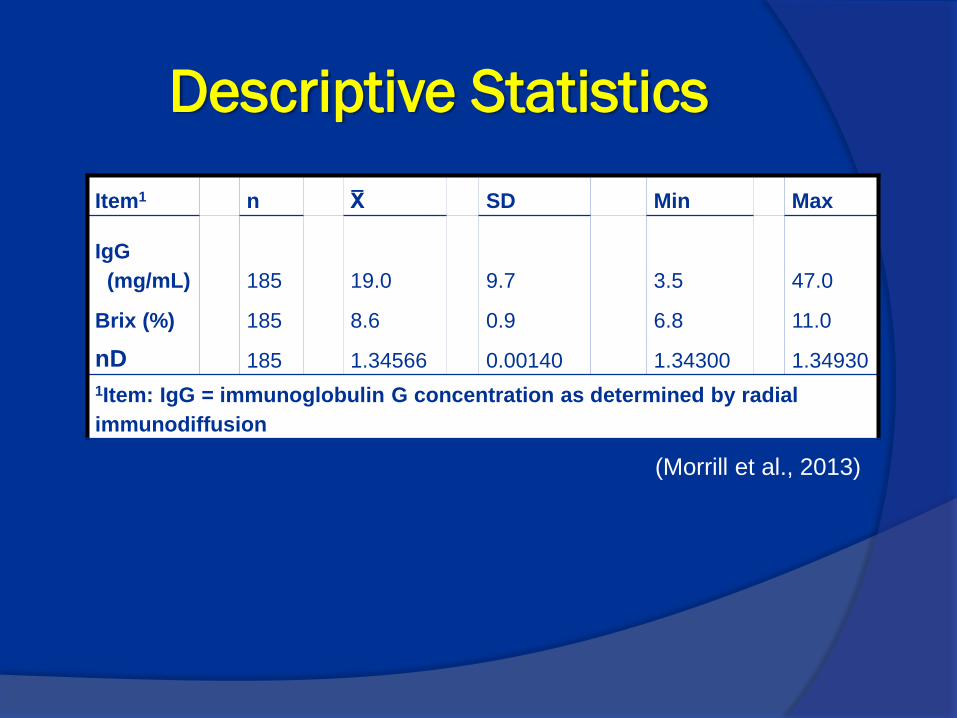
Descriptive Statistics
Item1 n X̅ SD Min Max
IgG
(mg/mL) 185 19.0 9.7 3.5 47.0
Brix (%) 185 8.6 0.9 6.8 11.0
nD 185 1.34566 0.00140 1.34300 1.34930
1Item: IgG = immunoglobulin G concentration as determined by radial
immunodiffusion
(Morrill et al., 2013)
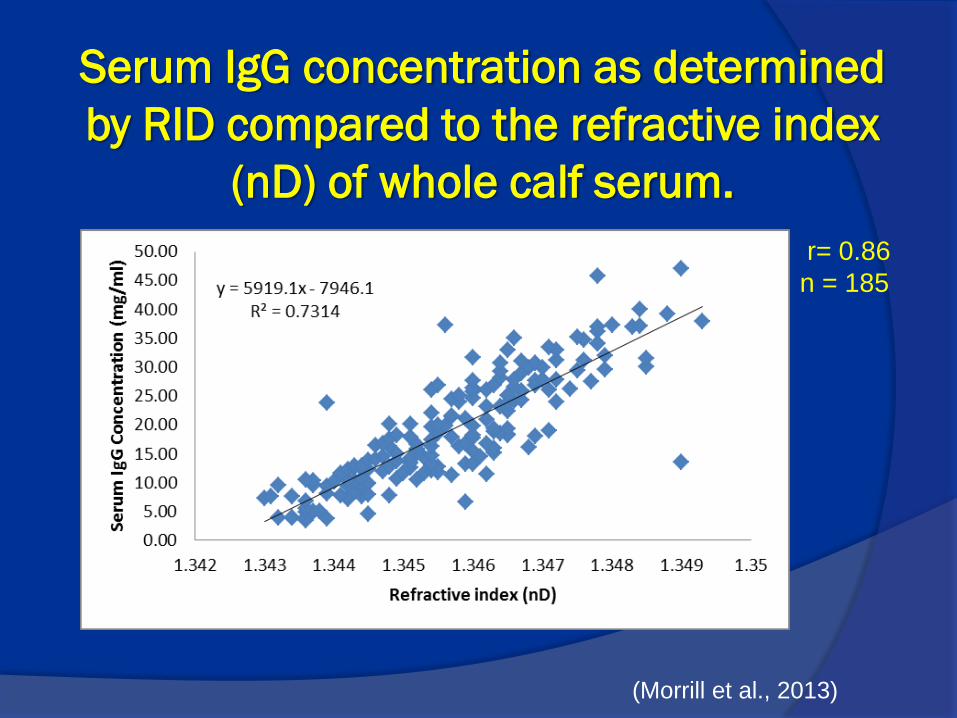
Serum IgG concentration as determined
by RID compared to the refractive index
(nD) of whole calf serum.
r= 0.86
n = 185
(Morrill et al., 2013)
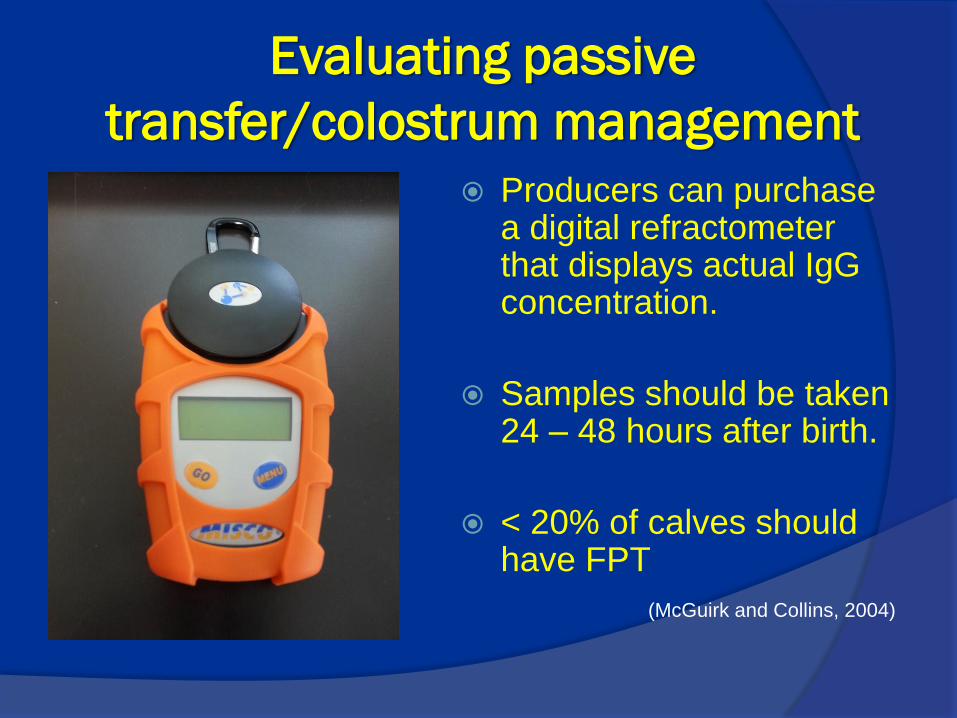
Evaluating passive
transfer/colostrum management
Producers can purchase a digital refractometer that displays actual IgG concentration.
Samples should be taken 24 – 48 hours after birth.
< 20% of calves should have FPT
(McGuirk and Collins, 2004)
Take Home Message
Cleanliness
Pre-partum
Milking
Storage
Throw away colostrum with visible
contamination
Feed or freeze colostrum within 1 hour
of collection
Healthy Calves = Healthy Profits
Conclusions
Colostrum management on U.S. dairies is
poor
Less than 40% of US colostrum meets both
recommendations.
Huge opportunities to improve calf and
heifer management and profitability
Colostrum Management
Feed high quality colostrum ASAP!!! Harvest colostrum in sanitary manner
Test colostrum
Discard poor, dirty, bloody colostrum
Store correctly
Feed fresh or freeze in 1 gallon ziplock bag within 30 min of collection
Evaluate your Colostrum options
Follow-up and evaluate FPT rates in calves
CLEANLINESS