Embed Size (px)
Citation preview

Colorado Population Forecasts
May 2010Elizabeth Garner · State DemographerColorado Department of Local Affairs

State Demography Office• State Agency
– Responsible for population data needed by state agencies.
• Population Estimates – state, county, municipality, title 32 special districts.– County – race/ethnicity, age, gender
• Population forecasts – state, county– Single year to 2040 by age and gender
• Job forecasts by county by industry by single year to 2040.– Labor force by age, race/ethnicity, county
• Public Data Technical Assistance

Population Forecasts
• Population change tied to understandings of both economic and demographic change.
– Demographic cohort-survival model• Fertility, mortality, social migration• = supply of labor provided by existing populations.
– Economic forecast• National, Regional, State, Local conditions• = demand for labor.
– Differences in labor supply vs. labor demand resolved by the net migration of populations and associated household members
Source: State Demography Office
Colorado Population Change
-40,000
-20,000
0
20,000
40,000
60,000
80,000
100,000
120,000
140,000
1970
1973
1976
1979
1982
1985
1988
1991
1994
1997
2000
2003
2006
2009
2012
2015
2018
2021
2024
2027
2030
2033
Net MigrationNatural increase

People follow jobs

Population ForecastsColorado Population Forecast By Region
State Demography Office, 11/2009
0
1,000,000
2,000,000
3,000,000
4,000,000
5,000,000
6,000,000
7,000,000
8,000,000
9,000,000
2000 2005 2010 2015 2020 2025 2030 2035
EASTERN PLAINS SAN LUIS VALLEY
CENTRAL MTNS.
WESTERN SLOPE FRONT RANGE
7.7 million
5.1 million

Source: State Demography Office
Population ForecastsFront Range Population Forecast
State Demography Office, 11/2009
0
1,000,000
2,000,000
3,000,000
4,000,000
5,000,000
6,000,000
7,000,000
2000 2005 2010 2015 2020 2025 2030 2035
Pueblo
Weld
LarimerEl Paso
Denver-Bldr Region
4.2 million
6.1 million

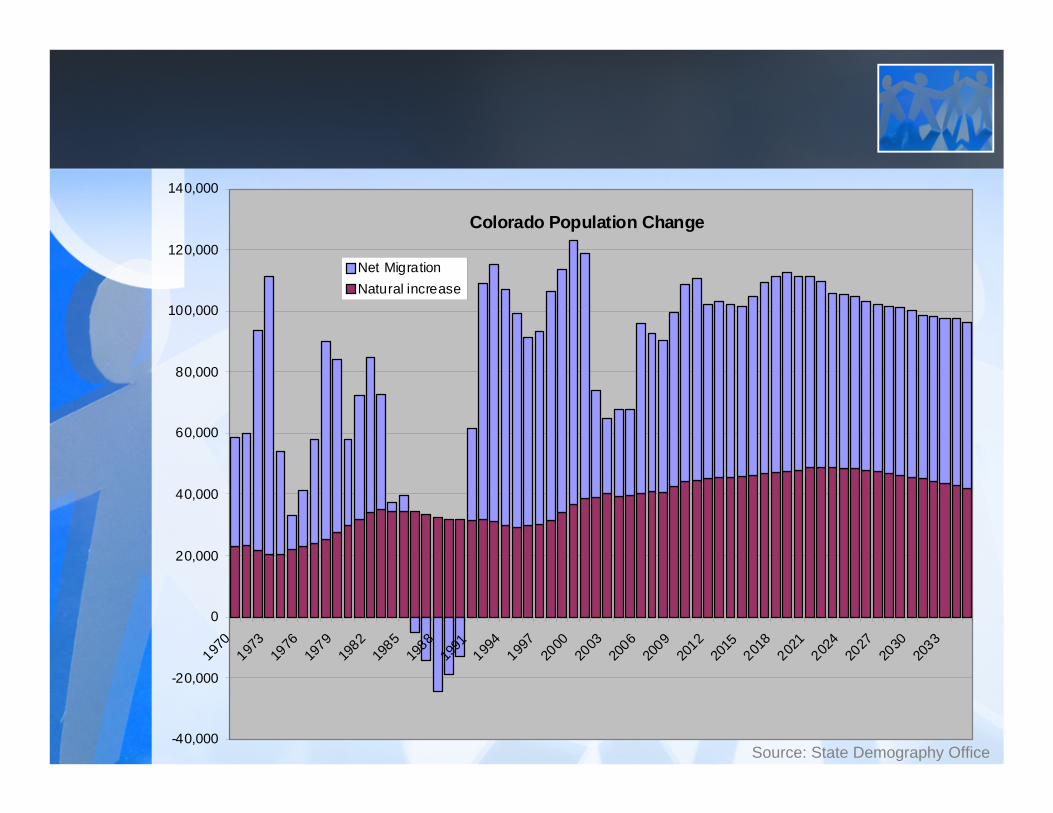
Long Term Demographic Issue: Aging of Baby Boomers
• The Baby Boom: 1946 – 1964• First reach 65 in 2010• By 2030 Colorado’s 65+ population will be
three times its size in 2000, growing from 400,000 to 1.2 million.
• Currently 4th lowest share of people over 65 and 6th largest share of baby boomers.
• 45% of the labor force.• 2020-2025 largest growth in leavers from the
labor force.

010,00020,00030,00040,00050,00060,00070,00080,00090,000
100,000110,000
0 5 10 15 20 25 30 35 40 45 50 55 60 65 70 75 80 85Age
Num
ber o
f Per
sons
1,200,000
419,000
Colorado Population by Age, 2000 and 2030

Employment and Migration
!

Commuting
• American Community Survey– Travel time to work by:– Means of transportation, age, sex, race, leave time,
industry, occupation, earnings, language spoken at home, poverty, tenure
• Local Employment Dynamics (Department of Labor and Census Bureau collaboration)– Wage and salary employment by place of residence
and place of job.– From one place to another

CommutingAggregate Travel Time to Work in Minutes
Denver Metro plus Larimer and WeldAmerican Community Survey 2006-08
0
1,000,000
2,000,000
3,000,000
4,000,000
5,000,000
6,000,000
7,000,000
8,000,000
9,000,000
Less than 10minutes
10 to 14minutes
15 to 19minutes
20 to 24minutes
25 to 29minutes
30 to 34minutes
35 to 44minutes
45 to 59minutes
60 or moreminutes
Thank you!
http://dola.colorado.gov/demog